45
rics.org/guidance RICS Professional Guidance, global 1st edition, guidance note GN 112/2013 Cost analysis and benchmarking Part of the QS & Construction Standards

rics.org/guidance
rics.org
RICS HQ
Parliament Square London SW1P 3ADUnited Kingdom
Worldwide mediaenquiries:
e pressoffi [email protected]
Contact Centre:
e [email protected] +44 (0)870 333 1600f +44 (0)20 7334 3811
Advancing standards in land, property and construction.
RICS is the world’s leading qualifi cation when it comes to professional standards in land, property and construction.
In a world where more and more people, governments, banks and commercial organisations demand greater certainty of professional standards and ethics, attaining RICS status is the recognised mark of property professionalism.
Over 100 000 property professionals working in the major established and emerging economies of the world have already recognised the importance of securing RICS status by becoming members.
RICS is an independent professional body originally established in the UK by Royal Charter. Since 1868, RICS has been committed to setting and upholding the highest standards of excellence and integrity – providing impartial, authoritative advice on key issues affecting businesses and society.
RICS is a regulator of both its individual members and fi rms enabling it to maintain the highest standards and providing the basis for unparalleled client confi dence in the sector.
RICS has a worldwide network. For further information simply contact the relevant RICS offi ce or our Contact Centre.
AsiaRoom 2203Hopewell Centre183 Queen’s Road EastWanchaiHong Kong
t +852 2537 7117f +852 2537 [email protected]
AmericasOne Grand Central Place60 East 42nd StreetSuite 2810New York 10165 – 2811USA
t +1 212 847 7400f +1 212 847 [email protected]
OceaniaSuite 2, Level 161 Castlereagh StreetSydney, NSW 2000Australia
t +61 2 9216 2333f +61 2 9232 [email protected]
Europe (excluding United Kingdom and Ireland)Rue Ducale 671000 BrusselsBelgium
t +32 2 733 10 19f +32 2 742 97 [email protected]
AfricaPO Box 3400Witkoppen 2068South Africa
t +27 11 467 2857 f +27 86 514 0655 [email protected]
Middle EastOffi ce G14, Block 3Knowledge VillageDubaiUnited Arab Emirates
t +971 4 375 3074f +971 4 427 [email protected]
India48 & 49 Centrum Plaza Sector RoadSector 53, Gurgaon – 122002India
t +91 124 459 5400f +91 124 459 [email protected]
United KingdomParliament SquareLondon SW1P 3ADUnited Kingdom
t +44 (0)870 333 1600f +44 (0)207 334 [email protected]
Ireland 38 Merrion SquareDublin 2Ireland
t +353 1 644 5500f +353 1 661 [email protected]
RICS Professional Guidance, global
1st edition, guidance note
GN 112 /2013
Cost analysis and benchmarking
Part of the QS & Construction Standards

Cost analysis and benchmarking
RICS guidance note, global
1st edition

Royal Institution of Chartered Surveyors (RICS)
12 Great George Street
London SW1P 3AD
UK
www.rics.org
No responsibility for loss or damage caused to any person acting or refraining from action as a result of the material included in this publication can be accepted by the authors or RICS.
Produced by the Project Management Professional Group of the Royal Institution of Chartered Surveyors.
ISBN 978 1 84219 921 3
© Royal Institution of Chartered Surveyors (RICS) July 2013. Copyright in all or part of this publication rests with RICS. No part of this work may be reproduced or used in any form or by any means including graphic, electronic, or mechanical, including photocopying, recording, taping or Web distribution, without the written permission of the Royal Institution of Chartered Surveyors or in line with the rules of an existing licence.
COST ANALYSIS AND BENCHMARKING | iii
Contents
Acknowledgments iv
Global ‘Black Book’ guidance v
RICS guidance notes 1
Foreword 2
1 Introduction 6
2 General principles (Level 1: Knowing) 7
2.1 Definitions ..........................................................................................................................................7
2.2 Cost analysis .....................................................................................................................................8
2.3 Benchmarking ..................................................................................................................................13
2.4 The cost analysis/benchmarking relationship: review .....................................................................16
3 Practical application: (Level 2: doing) 17
3.1 Preparing a cost analysis .................................................................................................................17
3.2 Deciding what to benchmark ...........................................................................................................23
4 Practical considerations (Level 3: doing/advising) 29
4.1 Common difficulties .........................................................................................................................29
4.2 Reporting ..........................................................................................................................................30
Appendix A: Commonly used functional units and their associated units of measurement 32
Appendix B: Elements to other elemental classifications 33
Appendix C: Cost planning structure 34
References 39

iv | COST ANALYSIS AND BENCHMARKING
Acknowledgments
This guidance note is adapted from the UK RICS QS & Construction Standards (the ‘Black Book’) guidance note Cost Analysis and Benchmarking.
RICS would like to thank the following for their contributions to this guidance note:
Global adapting author John Atkins MRICS (Arcadis EC Harris) and RICS reviewers based in the world regions.
Author of the UK version
Sarah Davidson BSc (Hons) MSc FRICS (Gleeds) and the ‘Black Book’ Working Group.

COST ANALYSIS AND BENCHMARKING | 1
RICS guidance notes
This is a guidance note. Where recommendations are made for specific professional tasks, these are intended to represent ‘best practice’, i.e. recommendations which in the opinion of RICS meet a high standard of professional competence.
Although members are not required to follow the recommendations contained in the note, they should take into account the following points.
When an allegation of professional negligence is made against a surveyor, a court or tribunal may take account of the contents of any relevant guidance notes published by RICS in deciding whether or not the member had acted with reasonable competence.
In the opinion of RICS, a member conforming to the practices recommended in this note should have at least a partial defence to an allegation of negligence if they have followed those practices. However, members have the responsibility of deciding when it is inappropriate to follow the guidance.
It is for each member to decide on the appropriate procedure to follow in any professional task. However, where members do not comply with the practice recommended in this note, they should do so only for a good reason. In the event of a legal dispute, a court or tribunal may require them to explain why they decided not to adopt the recommended practice. Also, if members have not followed this guidance, and their actions are questioned in an RICS disciplinary case, they will be asked to explain the actions they did take and this may be taken into account by the Panel.
In addition, guidance notes are relevant to professional competence in that each member should be up to date and should have knowledge of guidance notes within a reasonable time of their coming into effect.
This guidance note is believed to reflect case law and legislation applicable at its date of publication. It is the member’s responsibility to establish if any changes in case law or legislation after the publication date have an impact on the guidance or information in this document.
2 | COST ANALYSIS AND BENCHMARKING
Document status defined
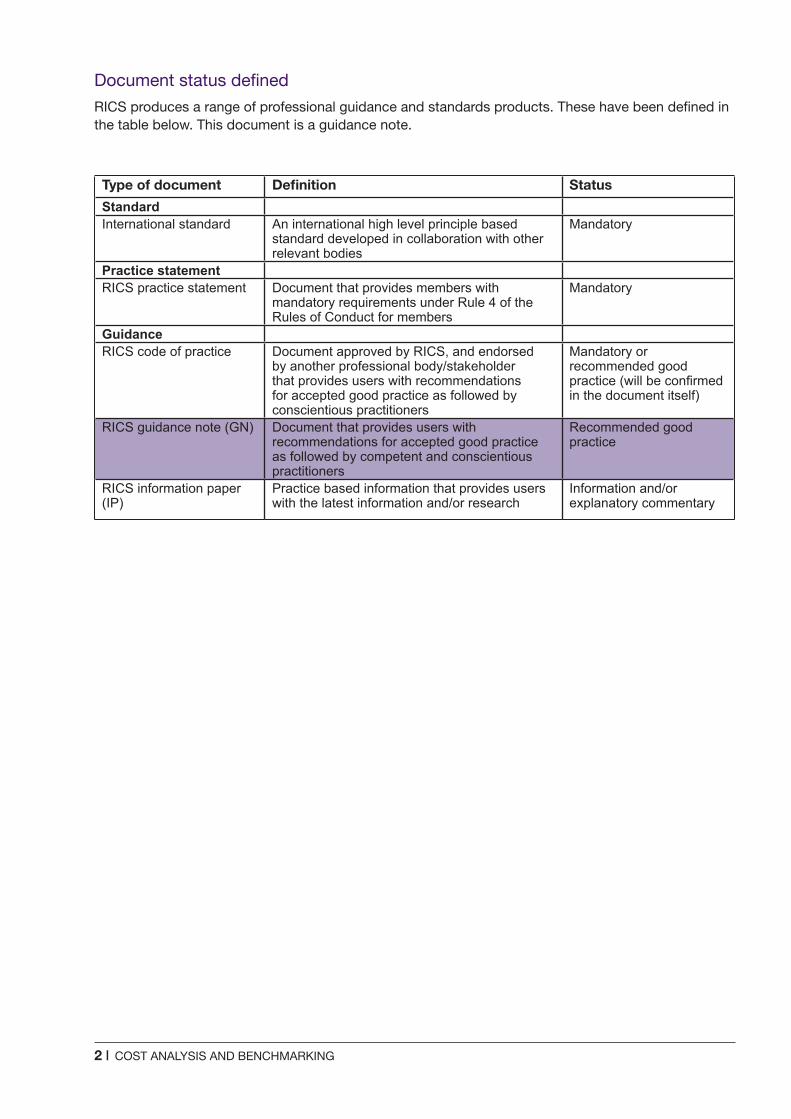
RICS produces a range of professional guidance and standards products. These have been defined in the table below. This document is a guidance note.
Type of document Definition Status
StandardInternational standard An international high level principle based
standard developed in collaboration with other relevant bodies
Mandatory
Practice statementRICS practice statement Document that provides members with
mandatory requirements under Rule 4 of the Rules of Conduct for members
Mandatory
GuidanceRICS code of practice Document approved by RICS, and endorsed
by another professional body/stakeholder that provides users with recommendations for accepted good practice as followed by conscientious practitioners
Mandatory or recommended good practice (will be confirmed in the document itself)
RICS guidance note (GN) Document that provides users with recommendations for accepted good practice as followed by competent and conscientious practitioners
Recommended good practice
RICS information paper (IP)
Practice based information that provides users with the latest information and/or research
Information and/or explanatory commentary

COST ANALYSIS AND BENCHMARKING | 3
This publication provides best practice guidance on cost analysis and benchmarking in all world regions. The purpose of this guidance note is to ensure consistent practice, delivered in a professional manner that is in line with internationally recognised guidance. The guidance sets a framework for best practice, subject to specific local legislative requirements and local market specifics.
Where the legislative requirements differ by jurisdiction, these have been referred to as ‘local legislative requirements’. Where requirements or issues differ by jurisdiction, these have been referred to as ‘local jurisdiction issues’. Taxation issues have been referred to as ‘local taxation issues’.
Third-party certification is defined as a third party or independent consultant (normally appointed by the owner) undertaking the measurement and valuation of the work performed to date, for the purpose of determining payment.
A provisional sum is defined as an estimated sum included in the contract for work, which could not be clearly defined before entering into the contract and which may be amended once the scope of the work becomes clearly defined.
Claim for loss and expense refers to a claim made by the contractor for loss of profit and expenses incurred due to a specific event that has occurred on the project due to no fault of the contractor.
Foreign exchange exposure is defined as the exposure a project may have to increased (or decreased) costs due to the fluctuations in exchange rates when purchases or payments are being undertaken in a different currency to the project’s expressed currency.
Global ‘Black Book’ guidance
4 | COST ANALYSIS AND BENCHMARKING
This guidance note provides best practice guidance on cost analysis and benchmarking for quantity surveyors and cost managers in all world regions. The purpose of this guidance note is to ensure consistent practice, delivered in a professional manner that is in line with internationally recognised standards. The standards set a framework for best practice, subject to specific local legislative requirements and local market specifics. Where the legislative requirements differ by jurisdiction, these have been referred to as ‘local legislative requirements’.
Where requirements or issues differ by jurisdiction, these have been referred to as ‘local jurisdiction issues’.
Taxation issues have been referred to as ‘local taxation issues’.
The best practice guidance has been set to follow systems most commonly recognised by RICS practitioners with guidance as to how to apply and adapt the best practice to local requirements.
A key consideration to note is that when comparing cost analysis benchmarking data between different projects in different regions it is essential that systems of elemental breakdown, rules or method of measurement and stage plan of work are equalised through establishment of a defined baseline and set of assumptions and that these are consistently applied.
It is recommended that where the input data to a study has been prepared on more than one classification system this is clearly identified in the benchmarking study and details of how the costs have been adjusted to a common reporting structure should be stated.
Elemental Cost Breakdown and Analysis
Reference is made to RICS Building Cost Information Service (BCIS) as an internationally
recognised system for construction cost elemental breakdown and analysis but it is acknowledged that BCIS is not used consistently across all world regions. It should be noted that several other systems exist across the various world regions that define costs according to cost elements (also acknowledged in the BCIS publication Principles of Elemental Classification (2012)).
Staged Plans of Work
Reference is also made to the RIBA Outline Plan of Work (see Appendix D) and it is similarly recognised that other staged plan of works are used across other locations across world regions. In these instances the practitioners should clearly set out the assumptions made and adjust the analysis accordingly.
New Rules of Measurement
The guidance note refers to the RICS New rules of measurement (NRM). It is acknowledged that rules of measurement differ between various locations and across world regions and that local rules of measurement are often governed by local legislative requirements.
Gross and Internal Floor Areas
The basis for this guidance note is that costs are based on Gross and Net Internal Areas (see RICS guidance note: Code of measuring practice, 6th edition). It should be noted that in some locations and regions differences as to how this areas are calculated will exist. In these instances the practitioners should clearly set out the assumptions made and adjust the analysis accordingly.
Foreign Exchange Exposure
Foreign exchange exposure is defined as the exposure a project may have to increased (or decreased) costs due to the fluctuations in exchange rates when purchases or payments are being undertaken in a different currency to the project’s expressed currency.
Foreword
COST ANALYSIS AND BENCHMARKING | 5
Further Considerations
The following items are not discussed in detail in this guidance note, but may have an impact and need to be taken into account when preparing cost analyses and benchmarking:
• Advance payments
• Retention guarantees
• Foreign exchange exposure and exchange rate hedging
• Escalation
• The use of cash flows to identify trends and potential change orders
• International use of cash flow forecasts, such as for earned value calculations
• Import duties and taxes
• Acceleration costs
• Claims plus Liquidated and Ascertained Damages
• Site Restrictions, constraints and abnormals
• Procurement methods
• Contingency
• Disposition of risk, and
• Value Added Taxes, sales taxes and other taxes.
It is also noted that a separate guidance note has been published for cash flow forecasting and practitioners should use both guidance notes in conjunction with each other (see www.rics.org/guidance)
6 | COST ANALYSIS AND BENCHMARKING
This guidance note summarises the purpose and process of both elemental cost analysis and construction project benchmarking of complete buildings. The principles apply equally to the analysis and benchmarking of other construction assets and more detailed unit rates for construction work.
It is based on global practice and covers the general principles applying to each operation. It does not seek to cover every approach to cost analysis or benchmarking but looks at the subject areas from a practical aspect.
In addition, while the processes of cost analysis and benchmarking are applicable to the whole life costs associated with the construction and operation of a building, this guidance note considers capital cost only. The principles covered may, however, also be applied to costs in use.
Although each operation is considered individually, the relationship between the process of cost analysis and benchmarking is discussed, as well as looking at how the results from both can help inform the design development and cost planning activities of a planned project.
Guidance is given under the following headings which reflect the Assessment of Professional Competence (APC):
• General principles (Level 1: Knowing)
• Practical application (Level 2: Doing)
• Practical considerations (Level 3: Doing/ Advising).
1 Introduction
COST ANALYSIS AND BENCHMARKING | 7
Most buildings are unique; even if two buildings look identical it is likely that there will be differences between the two. Such differences might, for example, relate to the depth and type of foundations, different types and/or thicknesses of floor construction, different specifications for wall finishes and so on. Differences might also be reflected in the individual construction programmes and the specific locations on a site. A cost analysis is a means of conceptually modelling the construction cost, construction duration and scope of works of a building. If it is comprehensively completed it will assist in highlighting the key design and cost features of a project. As such buildings which appear to be physically very similar may be revealed to be different when considered conceptually.
2.1 Definitions
A cost analysis is an examination of the distribution of cost across the construction elements of a project.
The RICS definition of an elemental cost analysis is:
‘…a full appraisal of costs involved in previously constructed buildings…aimed…at providing reliable information which will assist in accurately estimating (the) cost of future buildings. It provides a product-based cost model, providing data on which initial elemental estimates and elemental cost plans can be based.’ (UK RICS New Rules of Measurement (NRM) 2012, p.12).’
An alternative definition from the RICS Building Cost Information Service (BCIS) is:
‘The purpose of a cost analysis is to provide data that allows comparisons to be made between the costs of achieving various building functions in a project with those of achieving equivalent functions in other projects.’
Construction costs are normally expressed as the cost of a relevant metric of the quantity of the building, most commonly cost per unit of internal floor area or functional unit (see Appendix A). As such the key principles of cost analysis can be applied globally. However, it should be noted that most regions will have defined definitions for measurement of buildings in terms of Gross Internal Areas and Net Internal Areas. It is important that definitions and assumptions are applied consistently when prepared cost analyses across different regions.
A cost analysis will reveal the cost impact of design proposals for each of the construction elements and an analysis may be used for:
• estimating the costs of similar buildings
• estimating the cost of similar construction elements
• comparing the cost of design options at an element level
• cost modelling design solutions.
Benchmarking is the process of collecting and comparing data within an organisation or external to an organisation to identify the ‘best in class’
An elemental cost plan (or cost plan) is ‘…the critical breakdown of the cost limit for the building(s) into cost targets for each element of the building(s)…’ (UK NRM 2012, p.12).
An elemental cost plan also provides a frame of reference from which to develop the design for a project and maintain cost control.
An element (for cost analysis/planning purposes) is a major physical part of a building that fulfils a specific function or functions irrespective of its design, specification or construction.
2 General principles (Level 1: Knowing)
8 | COST ANALYSIS AND BENCHMARKING
2.2 Cost analysis
Construction cost tends to be one of the key drivers for design development, with the employer and in some instances the contractor (i.e. in a pain/gain arrangement under a design and build contract) wanting to understand the calculated price consequence of decisions made in respect of design. The processes of cost estimating and elemental cost planning are used to inform the employer and the design/construction team of the impact on price of such decisions. This information in turn feeds back into the design development process. There is consequently an on-going process of design development and cost planning to ensure that:
• the employer can afford their project, and
• it represents value for money.
This process might be likened to a design to cost approach – a management strategy which sets out to create an affordable product by treating costs as independent design parameters (noting though that construction cost is unlikely to be the only driver of design development).
2.2.1 Construction project data
It may be helpful to feed certain data about a project, such as cost data and construction duration, either during or after the construction phase, into the cost estimating and elemental cost planning processes for future projects.
This data can:
• provide an accurate record of the project as constructed
• create a means of modelling the constructed project in a variety of manageable and efficient ways, and
• help inform the design development and cost planning processes of planned, similar projects.
In addition, project cost data (providing there is sufficient volume) can act as an indicator of construction economy activity which, again, can be used to help inform future projects and pricing levels.
The format in which historic project data is held may be referred to as a ‘cost analysis’ and this might contain information such as:
• contract details (i.e. form of contract used, start and completion dates)
• description of the project
• floor areas including the gross internal floor area (Gross Internal Area) and the net internal floor area (Net Internal Area)
• the contract sum
• the base date for the project, and
• the location of the project.
2.2.2 Project modelling
Creating a physical model of a planned construction project to understand its design, operation and efficiency can be expensive and time consuming. In addition, the model itself may have limited flexibility in adapting to changes as design develops.
Construction projects can also be modelled virtually using Building Information Modelling (BIM) programs which create a database of design information about the project. The database is represented in a 3D view of the proposed project and the model will develop to reflect progression of design. Because the model is a database the output of that database can be manipulated to automatically reflect the quantities associated with the project and (with appropriate software) the construction programme (4D) and costs (5D).
Construction projects can (with or without BIM) be modelled conceptually in terms of:
• build cost
• Gross Internal Areas
• build duration
• design efficiency (e.g. wall to floor ratios, net to gross floor area), and
• energy efficiency.
A conceptual model can be created using data from historic construction projects providing the data has been captured and analysed in a consistent and defined manner. In terms of cost the historical data can be adjusted for external factors (see 2.2.4) to produce a cost plan of the proposed construction. Design options can
COST ANALYSIS AND BENCHMARKING | 9
be costed on this basis and the resultant cost models compared.
Developing a virtual and/or conceptual model can overcome some of the restrictions associated with physical project modelling. It is, however, important to create models at the right time so that design decisions about the project can be made without incurring unnecessary cost and adding time to the programme.
When deciding which projects to model or how the model might be structured, it is important to understand what is to be demonstrated through the model and what the model might ultimately be used for. For example, it may be beneficial to create a register of project contract sums. While this data may prove to be of some use as a record it is not a model of the project. However, if the contract sum is broken down, represented in a meaningful way and attached to a scope of works then it can act as an effective project cost model.
2.2.3 Analysing cost data
A project cost analysis is a systematic breakdown of existing cost data to allow for an extent of examination and comparison with other, similar projects. The detail of the breakdown can be simple through to complex but it is essential that the breakdown is appropriate and will provide data that can be of use.
For a cost analysis to be effective it is important that the cost of a building is not isolated from the key features of that building i.e. procurement route, contract solution, scope of works, outline specification and so on. A cost analysis can therefore be considered as an abridged record of the building project, with the cost section structured in a certain way.
It is also extremely important that proper time and consideration are given to the analysis as poor quality information and/or inaccurate information is likely to negatively impact on any future work which is based on the cost analysis.
In the UK the RICS Building Cost Information Service (BCIS) is accepted Industry wide. This means that data from multiple cost analyses can be extracted and compared with each other to create ranges of likely outcomes and benchmarks.
Across the globe, regions tend to define methods for structuring cost analyses in terms of the specific building elements and sub-elements generally common throughout all building projects. An example outside of the UK would be the DIN 276 standard which is used across Germany and several countries in the Eastern Europe (see Appendix B for information on other elemental classification systems).
Standardising the cost analysis format potentially provides:
• the ability to collect and compare data across a large volume of construction projects
• a definition of cost allocation
• data for trend analysis over time.
It also assists in educating the compiler of the analysis and the user of the resultant data in elemental cost factors.
This returns us to a key consideration in the analysis process: how and in what way is the resulting data going to be used?
If it is to be used as a source of cost data to inform the cost estimating/planning process for a planned project then the analysis structure really needs to fit in with the cost estimating/planning structure. This means that data from one can, without too much difficulty, be used to inform the other.
2.2.4 External factors influencing cost
Before starting out on the analysis and/or cost estimating/planning process, it might be worth considering the nature of construction cost. Cost is influenced by a number of factors and two key factors to be mindful of are:
1 The location of the building project, and
2 The state of the construction economy (and the general economy) at the point in time when the construction cost is established.
In terms of the location of the project, if we consider building two identical projects, for example, one in Europe and one in Asia, the construction cost of the projects when compared is likely to be different because of the differences in:
10 | COST ANALYSIS AND BENCHMARKING
It may also be possible, if there is sufficient information and expertise available, to develop in- house indices within a client organisation or consultancy to do the same job. Similarly, this can be done within industry sectors – for example an index series could specifically deal with public housing as opposed to private housing.
In some cases a tender price index for the project may be available which is an independent measure of the pricing level of that job relative to a standard base. This project index will reflect all the influences on price. In addition to those considerations following on from the location and date of the project, it will also reflect the scale of the project, ease of construction of the design and other factors that can be expected to be shared by similar buildings. When adjusting the pricing level it is therefore normally appropriate to use average location and time indices rather than the project specific tender price index if available. Exceptions to this approach may be where it is considered that the pricing level of the analysed building was not typical for some reason (such as very local effects that cannot be reflected in location indices).
Other factors affecting price level should also be considered such as tender process. While a negotiated contract may offer value for money to the client, the building cost may be higher than if the project were let in competition. In the UK, BCIS provides indices relative to the selection of the contractor within its Tender Price Studies which may be used to support a judgment on the appropriate adjustment.
A further point to note is that construction activity, although influenced by the economic climate does not necessarily reflect the pattern or profile of economic activity. Government measures of inflation such as the Retail Prices Index or the Consumer Prices Index in the UK, i.e. the government’s preferred measure of inflation, might be used as a means of updating construction cost, but neither data set is construction specific and should therefore be used with care and consideration.
• rules of measurement
• transportation cost and routes
• import taxes and duties
• the availability of both local and specialised labour
• ease of access to the sites
• availability of services to the sites
• the vicinity of the sites in relation to amenities
• local labour costs
• travel distances, and existing land conditions.
Similarly, construction prices are not static over time; they are subject to change. While in the long term construction prices tend to rise (commonly referred to as ‘inflation’), there are pockets of time when construction prices, if compared year-on-year, quarter-on-quarter, or sometimes month-on-month, either increase at a slower rate than previous periods, stabilise, or even fall.
2.2.5 Project indexation
If historical data is to be used as a source of cost data for current or future projects then it is likely that it will need to be adjusted in some way to account for the change in location and to bring costs up to date or to project them into the future.
A simple way to address this is to attach indices to the cost data – one to deal with location and the other to consider the time associated with the historical construction cost. Using indices creates a ‘base’ for the project data. This means that it is relatively straight forward to adjust the project data for the change in location and time if required.
Many regions will have established tender price indices and location factors which should be referred to when comparing project cost. They are updated regularly to make sure that the indices are appropriate. These can be used to adjust construction cost analysis data to reflect such an impact of location and time.
COST ANALYSIS AND BENCHMARKING | 11
2.2.6 What to record
Data from cost analyses can:
• act as a useful source of cost, programme and specification information that can be used for cost estimating and elemental cost planning, particularly key projects phases and gateways;
• support benchmarking exercises.
As well as acting as a factual record of a building project as constructed, a cost analysis can generate valuable data which may serve many additional purposes. The following information can prove to be useful in the design development process of planned building projects:
• A record of the Gross Internal Area (GIA) and the Net Internal Area (NIA). It is suggested that these areas are calculated using Regional established and defined standard principles of measurement. European CEN Standard EN 15221-6 and International Standard ISO 9836 both provide measurement of building floor space.
The RICS Code of Measuring Practice provides definition of floor areas as follows:
– Gross Internal Area ‘the area of a building measured to the internal face of the perimeter walls at each floor level’ (RICS 2007, p.12).
– Net Internal Areas ‘the usable area within a building measured to the internal face of the perimeter walls at each floor level’ (RICS 2007, p.16).
• The wall to floor ratio. Recording wall to floor ratios and the Net Internal Areas to Gross Internal Area ratios can provide an indication of how efficient the building design is and may be an important consideration in the future use of the cost analysis. If cost analyses based on inefficient design are used for guidance in respect of future projects then it is possible that the forecast cost of these future projects will be based on an element of inefficient design. This can mean that forecast cost advice may be inaccurate and, in addition, using inefficient information as a base tends not to lead to continuous improvement.
• The number of storeys of the building and whether or not the building has a basement (in which case the number of storeys associated with the basement could also be recorded).
• The number and type of functional units associated with the building (if applicable) (refer to Appendix A).
• The construction ‘start on site’ date, the ‘completion on site’ date, and the duration of the project in weeks.
• The method by which the project was tendered, i.e. based on cost reimbursement; a guaranteed maximum price or a fixed lump sum; through competition or negotiation; in a single stage or two stages.
• The means of procurement and the form of contract used, i.e. the philosophy surrounding design development, design risk and liability plus price certainty. For example, a project based on a ‘design and build’ contract may have a different cost profile to a traditionally designed lump sum project since the employer is, in effect, transferring risk over to the contractor. The cost associated with risk may be distributed over elements of the project, it may be allocated to a risk section or it might be a combination of the two. Similarly, the cost profile for a project procured under a cost reimbursement basis may be different again because a significant amount of risk is retained by the employer but contractor’s resource costs are more transparent. It is worth understanding that cost to the employer and cost to the contractor can be very different depending upon contract arrangement and the robustness of tender pricing documentation both provided on behalf of the employer and submitted by the contractor.
• The location of the project.
• The base date for the project.
• The number of tenderers and the tender spread.
• The sustainability rating attached to the project.
• The cost of the building, broken down as appropriate. It is suggested that using the regionally recognised elemental structure
12 | COST ANALYSIS AND BENCHMARKING
into one analysis or whether it is split (note: BCIS considers that each building within a project should be analysed separately as good practice if the information is to be reused). Where surveyors choose to split it between buildings, they should think carefully about how to address elements which commonly serve the different building types, such as access roads, incoming services, preliminaries, site preparation, and demolition, etc. It may also be prudent to allocate the cost of these pro-rata based on value, the Gross Internal Area for each building and, if the information exists, the quantities for each building. Alternatively, they could be kept as a completely separate cost element.
Whatever the approach to the common elements in the cost analysis for a mixed used project it is recommended that it is clearly noted on the cost analysis so that any future user of the data can understand the methodology. Otherwise the data may be discounted by future users because of uncertainty surrounding this particular aspect.
2.2.7 How can the cost data be used?
Some of the data, such as the construction duration, can be used in its raw format to inform future projects. For example, if the construction duration for a warehouse project was 42 weeks, it is reasonable to suppose that the construction duration of a planned warehouse with similar ground conditions, specification and Gross Internal Area will also have a construction duration of circa 42 weeks.
The cost data itself, providing it can be adjusted accordingly (through indexation), can be used as a source of information to feed into the cost estimating/planning processes for other planned projects.
If multiple projects of a similar nature are analysed, with the analyses structured in a consistent manner, then the data can prove very useful in the process of benchmarking.
such and standard form of cost analysis would be appropriate for most building types and functions.
• The scope of works falling under the remit of the building contract, i.e. whether the project is new build, refurbishment, fit-out, extension, combination, and so on.
• The type of building constructed – consider standardising a list of building types by, for example, setting out a list of sectors and sub-sectors.
• The outline specification for the works, i.e. what is the foundation solution (pile or strip); whether the frame is concrete (pre-cast or cast in-situ), timber or steel, etc.
• The level of detail held in a cost analysis should relate to the level of cost being recorded and detail of information generally available.
*Note: it is also advisable to record whether the analysis represents the contract sum or the agreed final account. In some instances there can be a significant difference between the two; perhaps because the employer has introduced a number of variations impacting on overall cost, or it might be that a claim has arisen on the contract, again, impacting on cost. In many instances it is most straightforward to analyse the contract sum; allocating costs associated with extensions of time and claims can be problematic and may distort the cost profile of the project. However, analysing a project at both stages can help inform future advice given to an employer. If there is an understanding of why a project’s cost profile can change dramatically between the two stages then this may positively affect procurement advice given on future projects.
It is quite common for a number of different buildings to be constructed under one building contract (for example one contract might encompass an apartment block, and an office development as well as a leisure facility). In structuring the cost analysis for the contract works, consideration should also be given to how data is represented for each of the multiple buildings, whether data is grouped
COST ANALYSIS AND BENCHMARKING | 13
The output data can also assist in establishing realistic spread of cost among construction elements which can, in turn, inform value engineering.
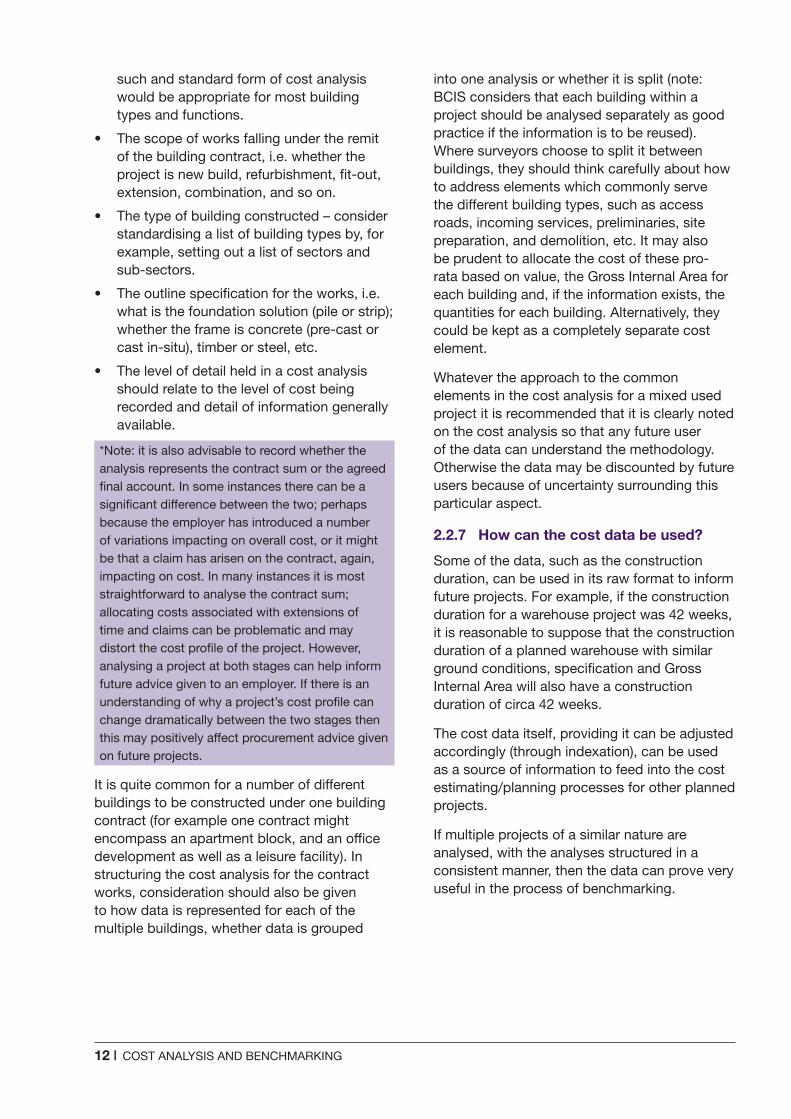
Construction cost benchmarking may well form part of a business process benchmarking study which will include a number of key steps, as illustrated in Figure 1:
• Data collection
• Data comparison
• Data analysis
• Action
• Repeat.
Figure 1.1 The benchmarking process
It is also worth considering the following before starting out on a benchmarking exercise:
• Keep it simple at the beginning.
• Establish a baseline with consistent use of measurement and cost breakdown.
• Prepare thoroughly; make sure you are clear on the process to be followed.
• Measure what is important.
• Manage and clearly define responsibility for data collection.
• Use appropriate technology to collect, manage and model the data; again start simple and develop over time.
• Focus on the results but ensure that they are interrogated and reported accurately.
• Use the results.
2.3 Benchmarking
‘Benchmarking’ is a frequently used term and has been defined as:
‘...the overall process of improvement aimed at providing better value for money for our employers’ (Rossiter 1996); and
‘...a systematic method of comparing the performance of your organisation against others, then using lessons from the best to make targeted improvements’ (Benchmarking Fact Sheet, 2004).
A ‘benchmark’ is the ‘best in class’ performance achieved based on a specific aspect. It is worth noting that the term can, however, be misused and for clarity it does not mean the average performance or the minimum acceptable standard.
Benchmarking tends to be a business-based process used to measure and then improve performance. It can be effective in developing an understanding of the market and generating competitive advantage through increased efficiency.
This guidance note considers benchmarking in terms of construction project performance rather than business performance, and in this respect the data can serve additional purposes to establishing ‘best in class’. To this end benchmarking can also be considered as its literal definition (Longmans Dictionary):
‘A point of reference from which measurements can be made; and
something that serves as standard by which others may be measured’.
Generally, advice given to an employer at pre- contract stage (in respect of construction cost and duration to construct, among other things) is estimated. Consequently, it is likely that the estimate will carry with it an element of risk. A key output of the benchmarking process is that it produces a range of factual outcomes. This range can therefore serve as guidance as to the range of accuracy (the risk) of the advice given. Note it is worth considering the extremities of the range carefully; the benchmark data, i.e. the ‘best in class’ may be an aspiration but one which is only achievable given certain parameters which may or may not exist on other projects.
14 | COST ANALYSIS AND BENCHMARKING
2.3.1 Why can benchmarking be both beneficial and important for construction projects?
The simple answer is that the process identifies what has been achieved in reality. Understanding factual outputs of executed projects and the means by which these outputs were achieved creates realistic targets for similar, planned construction projects. Such targets should be an improvement on what ‘has gone before’.
While construction cost is often a main consideration when benchmarking, it is also worth considering other factors relating to a construction project such as:
• construction cost/m2 Gross Internal Area
• cost per functional unit
• the distribution of construction cost
• carbon dioxide emissions
• Energy Performance Certificate (EPC) ratings
• building efficiency (wall to floor ratio, NIA to GIA ratio)
• building shape, form and size (particularly in relation to high rise buildings
• architectural ratios (facade and glazing ratios)
• floor plates including columns and structural grid sizes
• mechancal and electrical services metrics (KVA/m², smoke and fire protection, refrigeration levels, number of lifts
• sustainability ratings
• construction duration
• import duties and local taxes
• procurement routes and contract selected.
Simplistically, the majority of information recorded on cost analyses (see 2.2.6) could generate a benchmarking output creating a means of analysing relationships between factors (such as the potential impact of the number of tenderers on the ‘competitiveness’ of the cost of a project).
Generally, benchmarking a number of construction factors rather than just one will result in a better, more rounded understanding of how a project performs when compared to others, in addition to what can be realistically achieved (since many outputs of construction are interlinked).
There are a number of factors to consider when thinking about the timing of a benchmarking exercise. At the Feasibility Stages and Business Case/Justification Gateways the employer is likely to be concerned with establishing an affordable cost limit for a project and they may be considering a number of outline design solutions. This is therefore an ideal time for initial benchmarking because the process should reveal achievable targets for the cost limit, building efficiencies and gross internal floors areas, for example, before too much time and cost is spent on the design itself. These results can help support the employer’s business case for the project and can also inform the concept design process (note, research carried out by Mott MacDonald found that there tends to be a high level of optimism in project feasibility stages, referred to as ‘optimism bias’ and in order for projects to be delivered to time and cost the optimism in project estimates has to be reduced. The process of analysing cost and benchmarking can help reduce optimism bias and consequently create a more ‘predictable’ project outcome).
As design development progresses, along with knowledge about the employer’s brief and the site itself, some features of a project may change beyond what was initially envisaged. Repeating benchmarking exercises throughout the design development process should therefore be considered.
COST ANALYSIS AND BENCHMARKING | 15
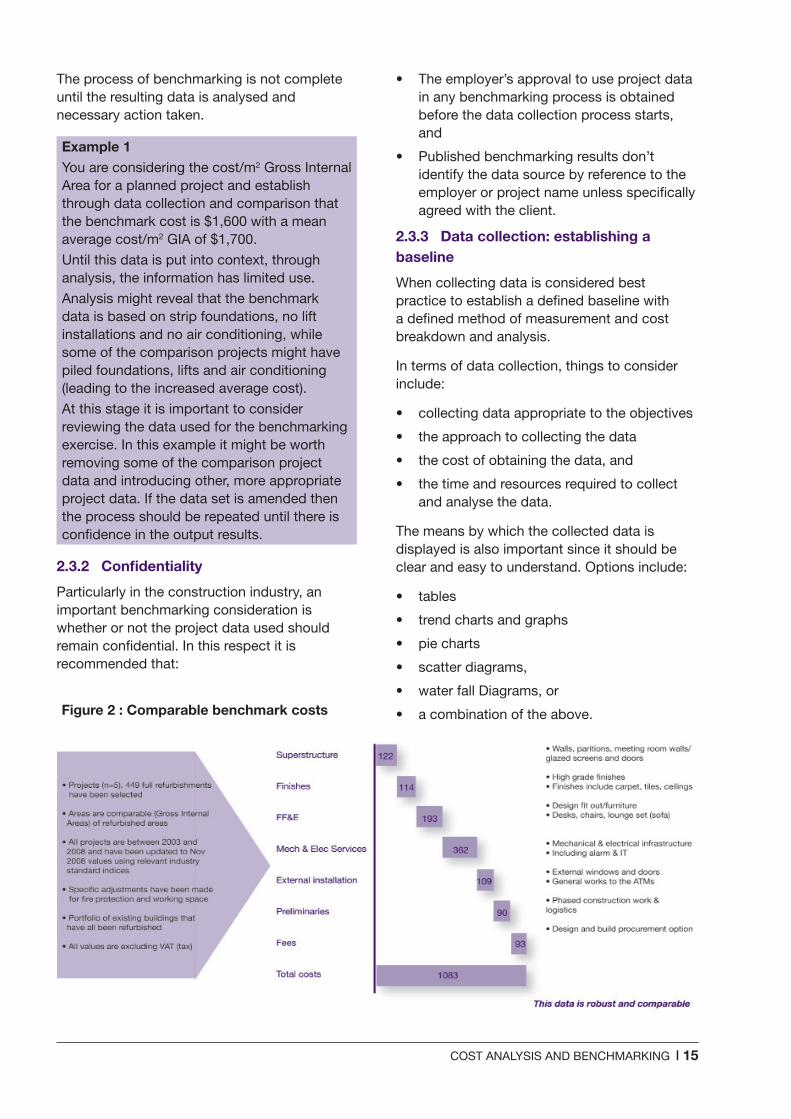
The process of benchmarking is not complete until the resulting data is analysed and necessary action taken.
Example 1You are considering the cost/m2 Gross Internal Area for a planned project and establish through data collection and comparison that the benchmark cost is $1,600 with a mean average cost/m2 GIA of $1,700.
Until this data is put into context, through analysis, the information has limited use.
Analysis might reveal that the benchmark data is based on strip foundations, no lift installations and no air conditioning, while some of the comparison projects might have piled foundations, lifts and air conditioning (leading to the increased average cost).
At this stage it is important to consider reviewing the data used for the benchmarking exercise. In this example it might be worth removing some of the comparison project data and introducing other, more appropriate project data. If the data set is amended then the process should be repeated until there is confidence in the output results.
2.3.2 Confidentiality
Particularly in the construction industry, an important benchmarking consideration is whether or not the project data used should remain confidential. In this respect it is recommended that:
• The employer’s approval to use project data in any benchmarking process is obtained before the data collection process starts, and
• Published benchmarking results don’t identify the data source by reference to the employer or project name unless specifically agreed with the client.
2.3.3 Data collection: establishing a baseline
When collecting data is considered best practice to establish a defined baseline with a defined method of measurement and cost breakdown and analysis.
In terms of data collection, things to consider include:
• collecting data appropriate to the objectives
• the approach to collecting the data
• the cost of obtaining the data, and
• the time and resources required to collect and analyse the data.
The means by which the collected data is displayed is also important since it should be clear and easy to understand. Options include:
• tables
• trend charts and graphs
• pie charts
• scatter diagrams,
• water fall Diagrams, or
• a combination of the above.Figure 2 : Comparable benchmark costs
16 | COST ANALYSIS AND BENCHMARKING
2.3.4 Analysis and report
The resulting comparison data is only part of the benchmarking process and as noted in Example 1 it has little value unless it is analysed and reported on.
It is this analysis and report which will ultimately identify realistic, achievable targets and may well reveal opportunities for improvement.
The process of analysis may also identify project data which has been included in the benchmarking process but is not really appropriate. In this case the benchmarking results may be skewed so it is recommended that this project data should be removed and the benchmarking exercise reviewed and repeated.
While the benchmark is about identifying best performance or best in class it will identify a specific data based on the parameters agreed. This will help communicate the risk range which will inform the employer and project team in the early stages of a project. A skewed range could therefore misinform the risk calculation.
2.4 The cost analysis/benchmarking relationship: review
So what links project cost analyses with benchmarking?
At the start of this guidance note it is noted that construction cost tends to be one of the key drivers of the design development process and achieving value for money is likely to be a requirement of the employer’s brief. It therefore stands to reason that construction cost is a logical factor to benchmark. The process should result in the identification of the benchmark construction cost limit ideally as a function of the gross internal floor area and/or a functional unit.
However, establishing a benchmark total cost limit by itself has restricted use. Ideally it needs to be set in the context of the whole building or construction project and a means of doing this is to benchmark elemental cost. To facilitate this cost data for historical projects therefore needs to be collected on an elemental, or similarly structured, basis.
The benchmarking exercise will then reveal the construction cost (per m2 Gross Internal Area and/or functional unit) broken down into elements. If the cost analysis structure is set up to mirror the cost planning structure, then it is much easier to feed or compare collected cost analysis data into the benchmarking process which can then feed into the estimating/elemental cost planning process.
Finally, another important consideration concerning construction cost and design development in the pursuit of achieving value for money is not just the elemental cost but the percentage distribution of the total cost over the building elements. Benchmarking this factor should identify the most efficient cost distribution. This means that one element is not unnecessarily under-funded or under designed at the expense of another element.
COST ANALYSIS AND BENCHMARKING | 17
3.1 Preparing a cost analysis
Before embarking on a cost analysis, it is worth thinking about the following questions:
1 What is the information from the cost analysis going to be used for?
2 What information will:
– be of use
– not be of particular use but may inform the output
– not be of any beneficial use?
3 What established cost analysis structures already exist?
4 Does the format of the cost data lend itself to analysis in general?
5 Does the format of the cost data lend itself to any of the established cost analysis structures?
6 How much time is available for the analysis process?
7 Is there any information that is sensitive and/or has to remain confidential?
8 What information is required to complete the cost analysis?
9 Is this information readily available?
10 Does the information cover a single building or multiple buildings constructed under one contract? If it is the latter then it is suggested that consideration is given to how aspects of the project which are common to all the buildings (i.e. site preparation, infrastructure, preliminaries, overheads and profit) should be analysed.
The answers to these questions will inform the structure, content and detail of the analysis to be carried out. This is really important because the main benefit of a cost analysis is in its output; if the right data can be collected and recorded in the right way then it should prove to be really useful and worth the time required to carry out the analysis.
3.1.1 Analysis content
In respect of analysis content another key consideration is how the project has been procured; this covers the tendering process, form of contract used and the pricing approach to the project works.
It is important to be aware that the pricing level of a project awarded through negotiation may be different to one secured through competition. This is not to say that one will be any more or less expensive than the other, but the tendering conditions are different and it is recommended that this is recorded in the analysis detail. Likewise, the cost analysis for a design and build project may follow a different profile than a traditionally measured project.
It is also important to establish the base data for the project (i.e. the date to which the costs apply). For example where the analysis is based on:
• Lump sum tenders, the date will be established in the contract
• Target cost contracts, the base date will be the date the cost was agreed
• Two stage tenders, with different tender dates for each package the tender date for each package can be recorded and an ‘average’ based date established if necessary
• Competitive dialogue, it will be the date the cost was agreed, and
• Where the analysis is based on a cost plan, the base date will be the date of the cost plan.
In each case it is important that the treatment of future inflation is recorded. On firm price tenders the contractor’s allowance for inflation will be included but on fluctuating contracts it will not. Target cost contracts tend to identify the allowance for inflation separately.
3 Practical application: (Level 2: doing)
18 | COST ANALYSIS AND BENCHMARKING
Other data you may wish to record on your cost analysis includes:
• The construction duration; not only could this data be used to give guidance on appropriate construction durations for planned projects but it may also influence the construction price for the analysed project. Constructing a project under a time pressure may carry with it a price-premium (because of the need for working out of hours, working out of sequence, having a number of different contractors, a lot of trades on site at any one time, for example). In this instance it is worth recording if a formal acceleration agreement has been arranged with details of that arrangement if known. Similarly, having a lengthy construction duration may increase the cost associated with preliminaries (think about insurances, contractor’s compound, staffing requirements etc.).
• The appropriate sustainability rating for the project (as applicable). This also serves a number of purposes:
– There is a cost associated with achieving a sustainability rating even if it only relates to the assessment fee so it can give an insight into the overall cost of the project analysed.
– The rating may give an indication about low or zero carbon technology incorporated into the project.
– It is another means of defining a project (this is particularly useful if the resulting analysis is going to be used for benchmarking).
– Buildings with an exceptional sustainability rating may carry with them a certain kudos; again this could influence construction price.
• The parties and stakeholders involved in the construction project; this can act as a general record but some employers have certain branding attached to them and again this can be a means of defining the project.
• The performance of the construction industry in the region in terms of contractor’s and sub-consultant performance since this affect quality of construction and the programme both of which may impact outturn costs.
Also some architects and engineers carry a high profile and this too may contribute to the defining aspects of a project. The distribution of fees between architectural, mechanical and electrical services, structural and specialist fees associated with project may be driven by the following:
• What sector the construction works fall into (i.e. residential, leisure, etc.).
• The construction type; whether the construction works relate to new build construction, an extension, a refurbishment, a fit-out or a combination of these.
• The source of cost data used; is it, for example, a bill of quantities, a contract sum analysis, or a selection of work packages?
• A description of the works.
• EPC/Display Energy Certificate (DEC) rating.
• The Gross Internal Area and the Net Internal Area.
• The wall to floor ratio.
• The extent of circulation space.
• Architectural ratios (facade and glazing ratios).
• Floor plates including columns and structural grid sizes.
• Mechancial and Electrical services metrics (KVA/m², smoke and fire protection, refrigeration levels, number of lifts.
• Efficiency ratios – for example the extent of car parking in relation to the external works area and extent of circulation area compared to the overall area of the building/project.
• Typical room sizes (note: this is especially useful for accommodation-based projects such as hotels and student accommodation).
• Number of storeys.
• Whether or not the project includes for basement works.
This list is not exhaustive and it is important to think about each project specifically and the extent and type of data it could generate that might be useful in respect of future similar projects.
COST ANALYSIS AND BENCHMARKING | 19
3.1.2 Cost – analysis and representation
The main focus of the analysis will be on cost, and in order to get the information right it is worth thinking about the analysis from an observer’s view point. It is possible that the analysis will be a point of reference and/or information source for people who have little or no knowledge about the project on which the analysis is based. Ideally, they should be able to form a reasonable picture of the project from the analysis without the need to refer back to detailed design information.
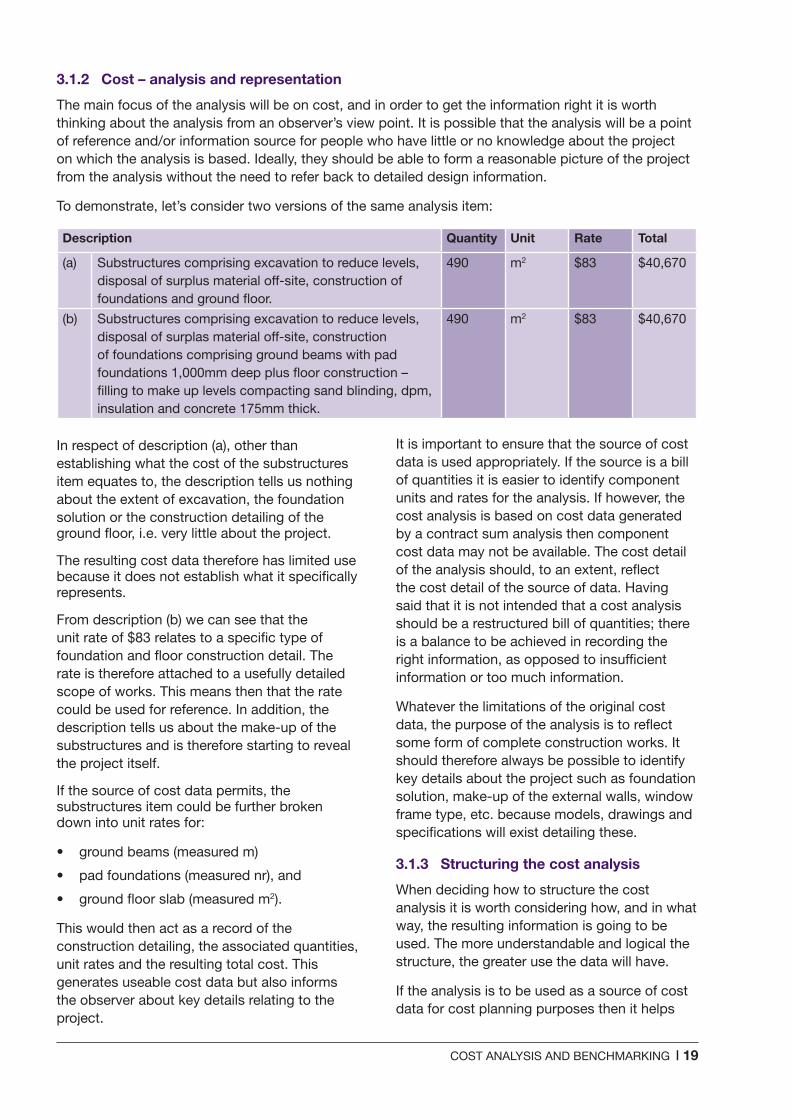
To demonstrate, let’s consider two versions of the same analysis item:
Description Quantity Unit Rate Total
(a) Substructures comprising excavation to reduce levels, disposal of surplus material off-site, construction of foundations and ground floor.
490 m2 $83 $40,670
(b) Substructures comprising excavation to reduce levels, disposal of surplas material off-site, construction of foundations comprising ground beams with pad foundations 1,000mm deep plus floor construction – filling to make up levels compacting sand blinding, dpm, insulation and concrete 175mm thick.
490 m2 $83 $40,670
In respect of description (a), other than establishing what the cost of the substructures item equates to, the description tells us nothing about the extent of excavation, the foundation solution or the construction detailing of the ground floor, i.e. very little about the project.
The resulting cost data therefore has limited use because it does not establish what it specifically represents.
From description (b) we can see that the unit rate of $83 relates to a specific type of foundation and floor construction detail. The rate is therefore attached to a usefully detailed scope of works. This means then that the rate could be used for reference. In addition, the description tells us about the make-up of the substructures and is therefore starting to reveal the project itself.
If the source of cost data permits, the substructures item could be further broken down into unit rates for:
• ground beams (measured m)
• pad foundations (measured nr), and
• ground floor slab (measured m2).
This would then act as a record of the construction detailing, the associated quantities, unit rates and the resulting total cost. This generates useable cost data but also informs the observer about key details relating to the project.
It is important to ensure that the source of cost data is used appropriately. If the source is a bill of quantities it is easier to identify component units and rates for the analysis. If however, the cost analysis is based on cost data generated by a contract sum analysis then component cost data may not be available. The cost detail of the analysis should, to an extent, reflect the cost detail of the source of data. Having said that it is not intended that a cost analysis should be a restructured bill of quantities; there is a balance to be achieved in recording the right information, as opposed to insufficient information or too much information.
Whatever the limitations of the original cost data, the purpose of the analysis is to reflect some form of complete construction works. It should therefore always be possible to identify key details about the project such as foundation solution, make-up of the external walls, window frame type, etc. because models, drawings and specifications will exist detailing these.
3.1.3 Structuring the cost analysis
When deciding how to structure the cost analysis it is worth considering how, and in what way, the resulting information is going to be used. The more understandable and logical the structure, the greater use the data will have.
If the analysis is to be used as a source of cost data for cost planning purposes then it helps
20 | COST ANALYSIS AND BENCHMARKING
if the two (the analysis and the cost plan) are based on the same or a largely similar structure so that one can easily inform the other.
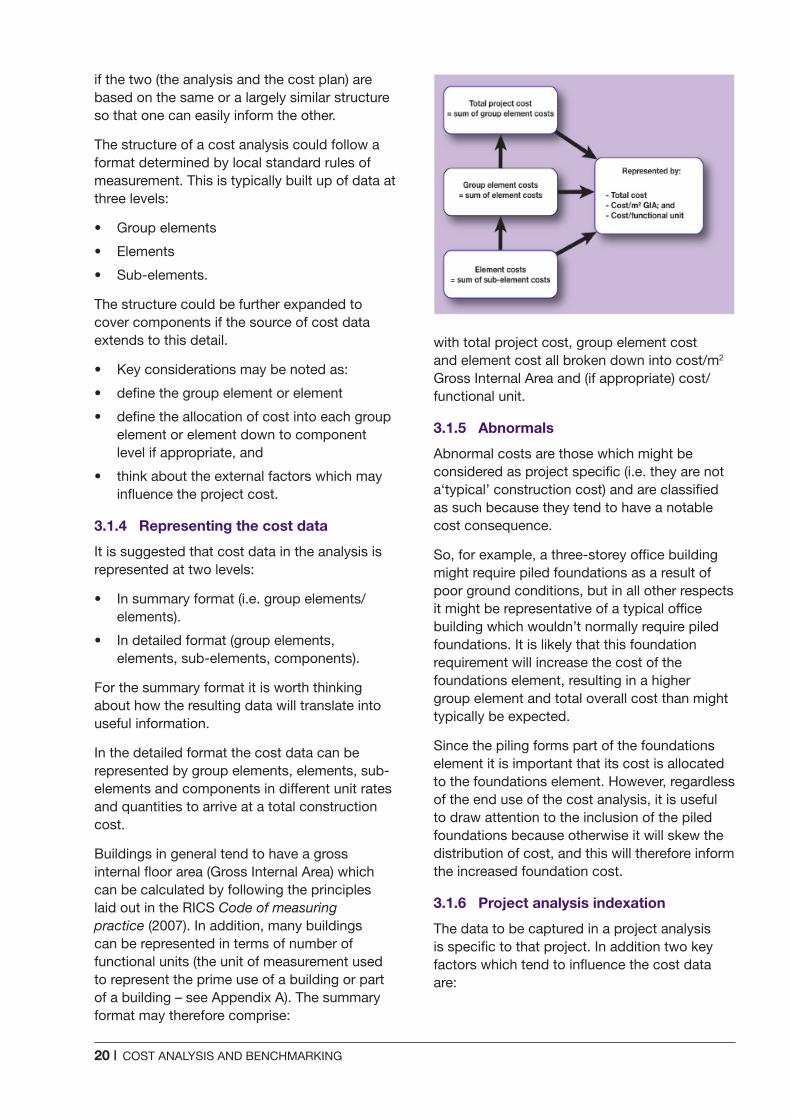
The structure of a cost analysis could follow a format determined by local standard rules of measurement. This is typically built up of data at three levels:
• Group elements
• Elements
• Sub-elements.
The structure could be further expanded to cover components if the source of cost data extends to this detail.
• Key considerations may be noted as:
• define the group element or element
• define the allocation of cost into each group element or element down to component level if appropriate, and
• think about the external factors which may influence the project cost.
3.1.4 Representing the cost data
It is suggested that cost data in the analysis is represented at two levels:
• In summary format (i.e. group elements/elements).
• In detailed format (group elements, elements, sub-elements, components).
For the summary format it is worth thinking about how the resulting data will translate into useful information.
In the detailed format the cost data can be represented by group elements, elements, sub- elements and components in different unit rates and quantities to arrive at a total construction cost.
Buildings in general tend to have a gross internal floor area (Gross Internal Area) which can be calculated by following the principles laid out in the RICS Code of measuring practice (2007). In addition, many buildings can be represented in terms of number of functional units (the unit of measurement used to represent the prime use of a building or part of a building – see Appendix A). The summary format may therefore comprise:
with total project cost, group element cost and element cost all broken down into cost/m2 Gross Internal Area and (if appropriate) cost/functional unit.
3.1.5 Abnormals
Abnormal costs are those which might be considered as project specific (i.e. they are not a‘typical’ construction cost) and are classified as such because they tend to have a notable cost consequence.
So, for example, a three-storey office building might require piled foundations as a result of poor ground conditions, but in all other respects it might be representative of a typical office building which wouldn’t normally require piled foundations. It is likely that this foundation requirement will increase the cost of the foundations element, resulting in a higher group element and total overall cost than might typically be expected.
Since the piling forms part of the foundations element it is important that its cost is allocated to the foundations element. However, regardless of the end use of the cost analysis, it is useful to draw attention to the inclusion of the piled foundations because otherwise it will skew the distribution of cost, and this will therefore inform the increased foundation cost.
3.1.6 Project analysis indexation
The data to be captured in a project analysis is specific to that project. In addition two key factors which tend to influence the cost data are:
COST ANALYSIS AND BENCHMARKING | 21
• Pricing conditions at the time the project cost was calculated.
• The location of the project.
When considering pricing conditions it is useful to note that in general, in the long term construction prices will always rise; however, the rate of price increase tends to vary from period to period. In addition, when general economic growth slows or shrinks, the level of construction project pricing invariably does the same.
In terms of location, the price to build in one part of the country may be significantly different to the price to build an identical project in a different part of the county. This is because labour, plant, material and equipment costs, import duties and local taxes will vary according to location. It also tends to cost more to build in some inner city locations than it does in towns, and similarly it can be expensive to construct in isolated areas because of limited (or non-existent) local suppliers.
If the cost analysis is to be used to inform cost plans and to support benchmarking then it can prove valuable to have a way of updating the cost data in respect of these two factors. A recognised and commonly used way of doing this is to ‘attach’ the cost data to separate indices; one to represent the pricing conditions and the other, the location of the project. A regionally accepted library of cost and price indices (such as BCIS) can serve this purpose.
The important thing is to select the most appropriate index for your region (or nation as applicable) and your project. The choice of index available is much reduced if the cost analysis data is to be updated to reflect future costs. When indices are to be used, it is suggested that the definition of each index
series is considered in deciding the appropriate index. It is also worth understanding how the indices are compiled, the nature of the source data and the sample size used.
Note: BCIS indices are reviewed and updated regularly as the sample size increases and confidence grows over time.
Indices in the UK (for example) are recorded at three levels:
1 Country
2 Region in the Country
3 District.
Again, such indices are periodically reviewed and updated.
If the project you are analysing is, for example, located in Greater London in the UK and its base date is January 2013 then you can identify that the cost data is attached to:
• A Tender Price Index PI of 219 (TPI for 1Q2013 current at the time of writing)
• Location factor of: 105 (location factor for 110).
This will then provide the basis for updating the cost data for a different time and/or location if required.
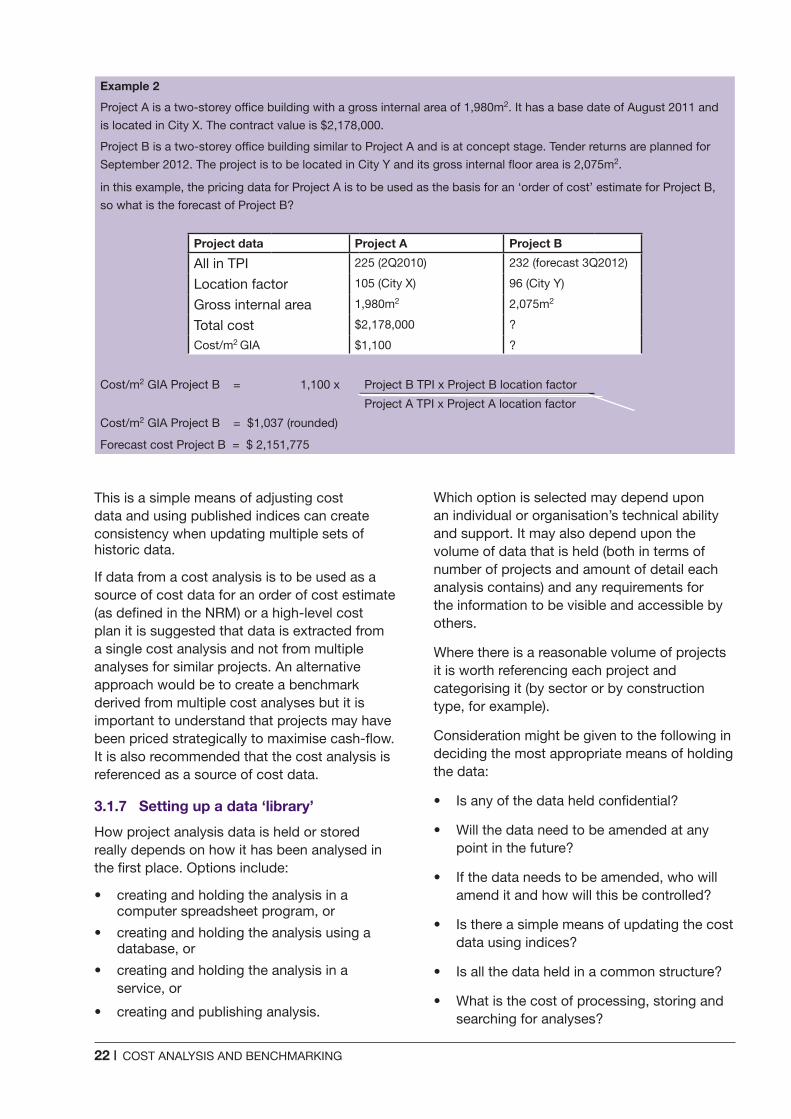
Example 2 demonstrates the impact of indexation, particularly in respect of location. The Gross Internal Area for Project B is slightly larger than Project A and the Tender Price Index shows a small increase from Project A to B. However, the Cost/m2 Gross Internal Area (and therefore resulting total forecast cost) for Project B is notably less than it is for Project A. This is because the location index identifies that it is comparably cheaper to construct in City Y than it is in City X.
22 | COST ANALYSIS AND BENCHMARKING
Example 2
Project A is a two-storey office building with a gross internal area of 1,980m2. It has a base date of August 2011 and
is located in City X. The contract value is $2,178,000.
Project B is a two-storey office building similar to Project A and is at concept stage. Tender returns are planned for
September 2012. The project is to be located in City Y and its gross internal floor area is 2,075m2.
in this example, the pricing data for Project A is to be used as the basis for an ‘order of cost’ estimate for Project B,
so what is the forecast of Project B?
Project data Project A Project B
All in TPI 225 (2Q2010) 232 (forecast 3Q2012)
Location factor 105 (City X) 96 (City Y)
Gross internal area 1,980m2 2,075m2
Total cost $2,178,000 ?
Cost/m2 GIA $1,100 ?
Cost/m2 GIA Project B = 1,100 x Project B TPI x Project B location factor
Project A TPI x Project A location factor
Cost/m2 GIA Project B = $1,037 (rounded)
Forecast cost Project B = $ 2,151,775
This is a simple means of adjusting cost data and using published indices can create consistency when updating multiple sets of historic data.
If data from a cost analysis is to be used as a source of cost data for an order of cost estimate (as defined in the NRM) or a high-level cost plan it is suggested that data is extracted from a single cost analysis and not from multiple analyses for similar projects. An alternative approach would be to create a benchmark derived from multiple cost analyses but it is important to understand that projects may have been priced strategically to maximise cash-flow. It is also recommended that the cost analysis is referenced as a source of cost data.
3.1.7 Setting up a data ‘library’
How project analysis data is held or stored really depends on how it has been analysed in the first place. Options include:
• creating and holding the analysis in a computer spreadsheet program, or
• creating and holding the analysis using a database, or
• creating and holding the analysis in a service, or
• creating and publishing analysis.
Which option is selected may depend upon an individual or organisation’s technical ability and support. It may also depend upon the volume of data that is held (both in terms of number of projects and amount of detail each analysis contains) and any requirements for the information to be visible and accessible by others.
Where there is a reasonable volume of projects it is worth referencing each project and categorising it (by sector or by construction type, for example).
Consideration might be given to the following in deciding the most appropriate means of holding the data:
• Is any of the data held confidential?
• Will the data need to be amended at any point in the future?
• If the data needs to be amended, who will amend it and how will this be controlled?
• Is there a simple means of updating the cost data using indices?
• Is all the data held in a common structure?
• What is the cost of processing, storing and searching for analyses?
COST ANALYSIS AND BENCHMARKING | 23
If any of the analysis data is to be used for benchmarking, a major consideration, particularly if there is a reasonable volume of analyses held, is: how will the data be extracted for benchmarking?
3.2 Deciding what to benchmarkIt is perhaps most common to benchmark forecast construction cost because this is an area where risk of cost advice being inaccurate, certainly during early design development, is quite high. The benchmarking process not only identifies the cost ‘benchmark’, but it also identifies a cost range for the projects selected. This helps to inform the risk associated with early cost advice.
However, construction projects are multi-faceted; there are a number of factors which are related to a project’s cost and it is worth benchmarking these as well. This will help give substance to cost advice. In addition, this process may significantly contribute to design development and value engineering. Deciding what to benchmark therefore really depends on the nature of the advice to be given to the employer.
In terms of construction cost it is worth spending some time thinking about how this should be approached and understanding what aspects of cost are common throughout the benchmarking data. For example:
• The cost for professional fees may only be available for projects constructed on a management or design and build basis.
• If fees are to form part of the benchmark data this immediately restricts projects procured and priced traditionally since the contractors for these projects will not have priced for fees. It may be worth considering fees separate to construction cost.
• Construction costs relating to external works and facilitating works may be project specific and if used in benchmarking may ‘skew’ the resulting data range.
To get a ‘bigger picture’ of the construction cost it might therefore be worth benchmarking factors that are related to the gross internal area of a project and/or the functional unit as one exercise, while also including those unrelated factors as another.
Other aspects of a project which are worth benchmarking include:
• Programme duration; there are instances where the programme duration is established by considering time available rather than the time reasonably required for construction and it is not until the contractor is consulted that the ‘right’ programme duration is calculated. By this time it might not be possible to accommodate the ‘right’ programme duration. Benchmarking programme duration may therefore identify the optimum construction period as well as a range of possible outcomes. In addition, as noted earlier, a relatively short or long programme duration may impact on the construction cost.
• Carbon dioxide emissions; this will help drive design development so that it is energy efficient.
• EPC and DEC ratings; again, this will assist with energy efficient design.
• The relationship between the Net Internal Area and Gross Internal Area and also wall to floor ratios. This will help establish how efficient the design of the building is.
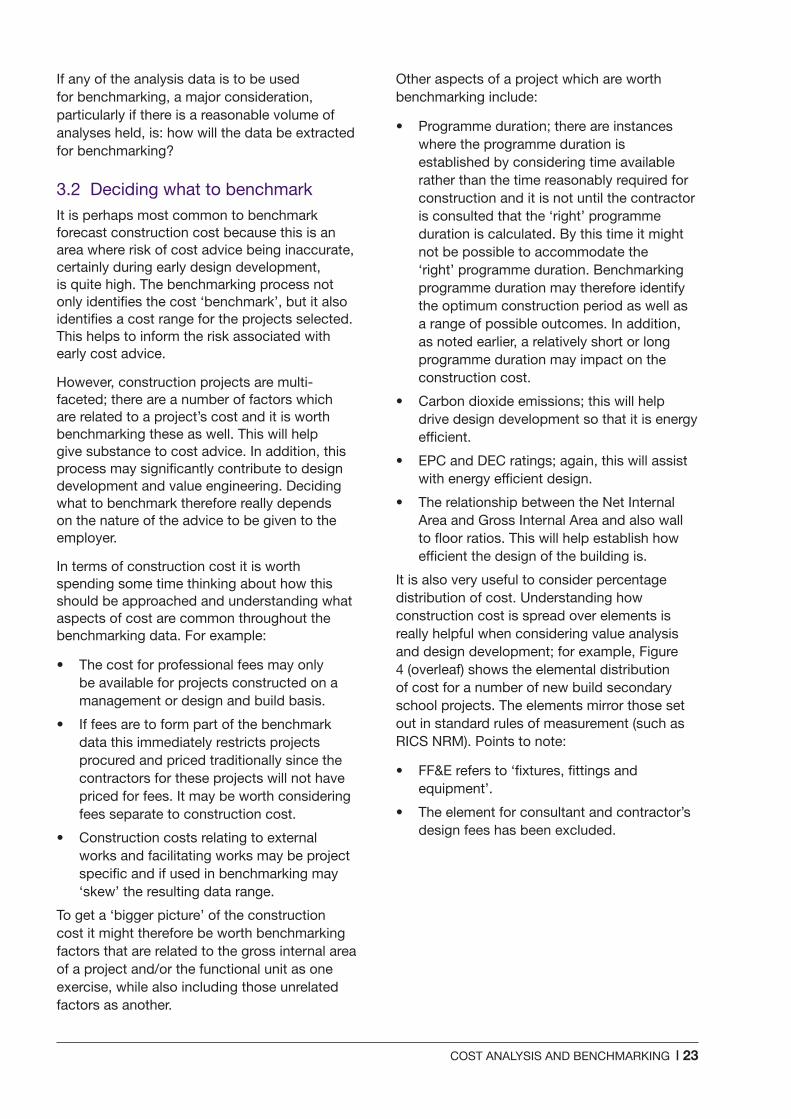
It is also very useful to consider percentage distribution of cost. Understanding how construction cost is spread over elements is really helpful when considering value analysis and design development; for example, Figure 4 (overleaf) shows the elemental distribution of cost for a number of new build secondary school projects. The elements mirror those set out in standard rules of measurement (such as RICS NRM). Points to note:
• FF&E refers to ‘fixtures, fittings and equipment’.
• The element for consultant and contractor’s design fees has been excluded.
24 | COST ANALYSIS AND BENCHMARKING
From the chart it is clear that there are inconsistencies between projects; some are showing overheads and profit, some are not. Likewise, some show risk and inflation and others do not and this might lead us to review and amend the projects included in the exercise.
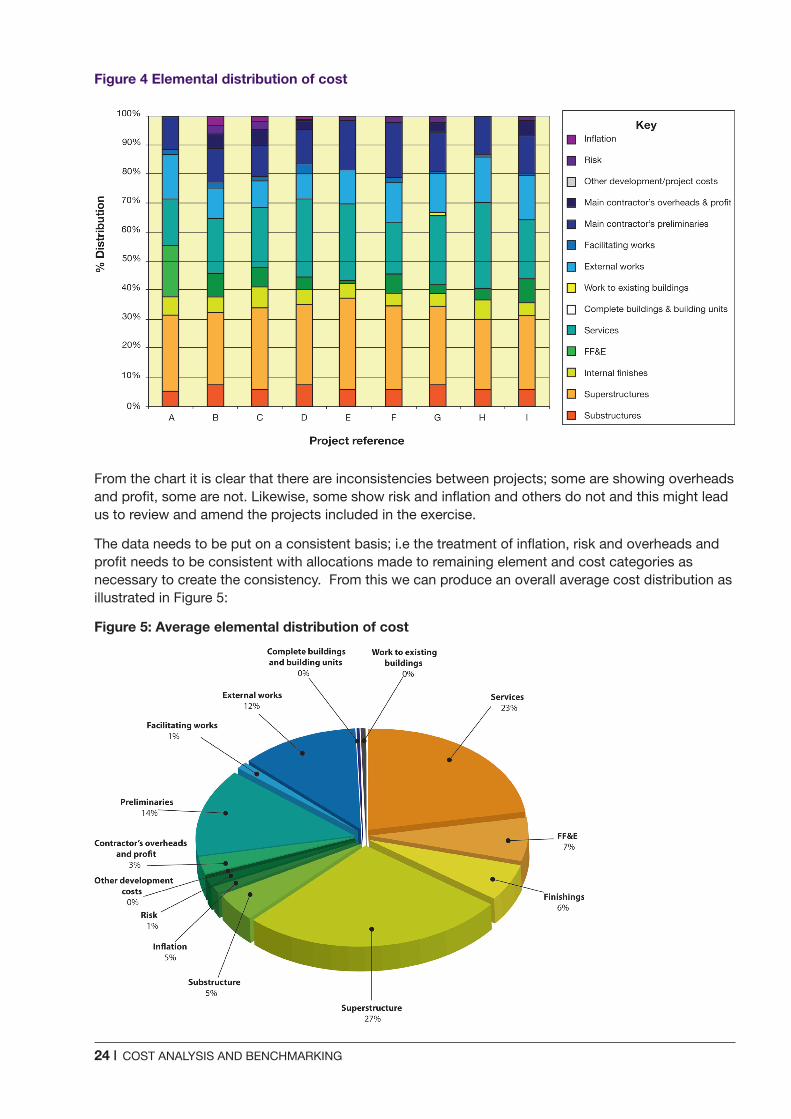
The data needs to be put on a consistent basis; i.e the treatment of inflation, risk and overheads and profit needs to be consistent with allocations made to remaining element and cost categories as necessary to create the consistency. From this we can produce an overall average cost distribution as illustrated in Figure 5:
Figure 5: Average elemental distribution of cost
Figure 4 Elemental distribution of cost
COST ANALYSIS AND BENCHMARKING | 25
This type of data might be used to inform the value engineering process.
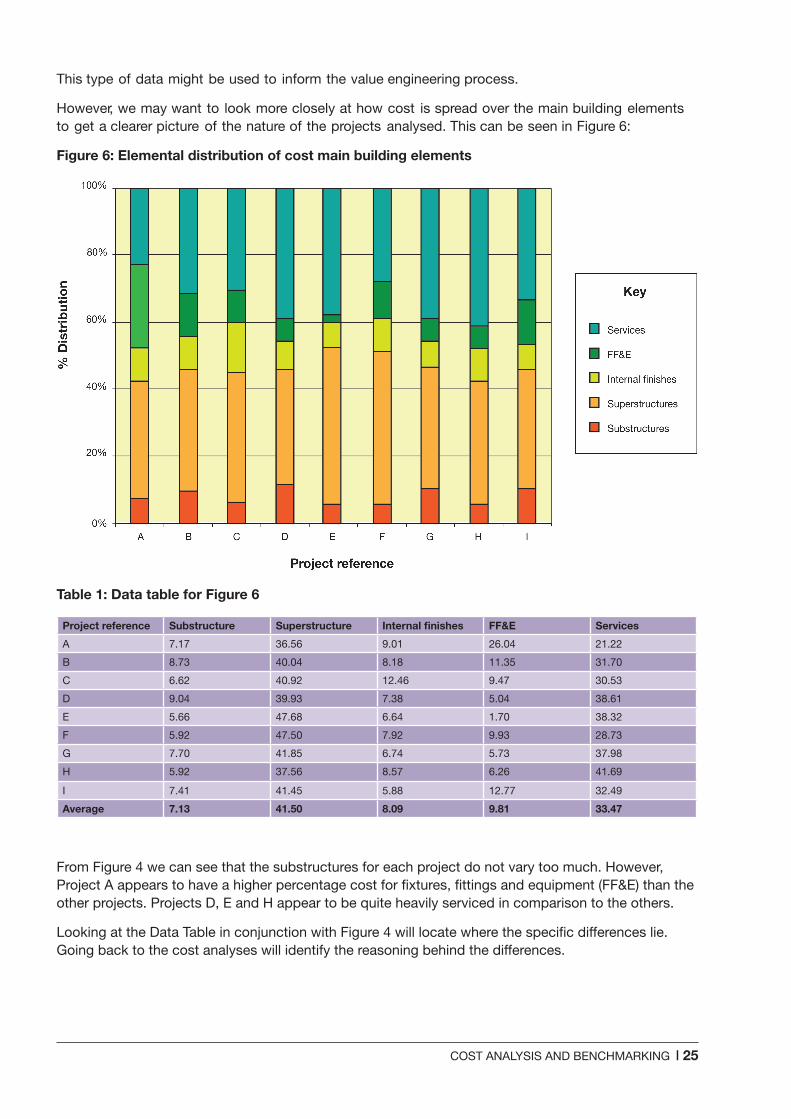
However, we may want to look more closely at how cost is spread over the main building elements to get a clearer picture of the nature of the projects analysed. This can be seen in Figure 6:
Figure 6: Elemental distribution of cost main building elements
Table 1: Data table for Figure 6
Project reference Substructure Superstructure Internal finishes FF&E Services
A 7.17 36.56 9.01 26.04 21.22
B 8.73 40.04 8.18 11.35 31.70
C 6.62 40.92 12.46 9.47 30.53
D 9.04 39.93 7.38 5.04 38.61
E 5.66 47.68 6.64 1.70 38.32
F 5.92 47.50 7.92 9.93 28.73
G 7.70 41.85 6.74 5.73 37.98
H 5.92 37.56 8.57 6.26 41.69
I 7.41 41.45 5.88 12.77 32.49
Average 7.13 41.50 8.09 9.81 33.47
From Figure 4 we can see that the substructures for each project do not vary too much. However, Project A appears to have a higher percentage cost for fixtures, fittings and equipment (FF&E) than the other projects. Projects D, E and H appear to be quite heavily serviced in comparison to the others.
Looking at the Data Table in conjunction with Figure 4 will locate where the specific differences lie. Going back to the cost analyses will identify the reasoning behind the differences.
26 | COST ANALYSIS AND BENCHMARKING
3.2.1 Project data used for benchmark baselining
If project data is to be used for establishing a benchmark it is important that the appropriate projects are selected in the first place. Using inappropriate data may result in the benchmarking output being skewed. This, in turn, may incorrectly inform project risk, cost and design development.
So what might be considered in the selection process?
• It is helpful for the projects to all:
• be of a similar size (Gross Internal Area and number of storeys)
• be of the same construction type (i.e. all new build), and
• perform the same function (i.e. all schools or all offices, not a combination).
When benchmarking construction cost, it is essential that all cost data used is commonly based i.e. it should all be set to the same location and price, otherwise the output results will not be comparable (following the same procedure as set out in Example 1).
Spreadsheet programs and databases can be structured so that it is relatively straightforward and time efficient to update selected project data to a common base price and location. It is always worth recording what location and pricing index the benchmarking data reflects.
3.2.2 Representing the ‘benchmark results
It is advisable to keep representation of benchmarking results simple. Do not over-populate graphs and charts with unnecessary data which may detract from the important information.
It may also be helpful to separate out detailed data (elemental cost data for example) from any resulting charts so that both can be seen clearly.
It is advisable to appreciate the confidential nature of the project data used and to keep it so. It is therefore suggested that ‘published’ benchmarking data does not identify projects by name or employer, but by reference. If presenting a number of benchmarking charts and graphs all using the same projects, it is advisable for the project reference used to be the same for all charts and graphs. This not only avoids confusion but it is easier to track a project’s profile linearly.
Similarly, it is worth sorting the benchmarking results from highest to lowest, or vice versa, for one key benchmarking aspect and then keeping the resulting order the same throughout the benchmarking process.
For example, the cost/m2 for the projects noted in Figure 4, when sorted from high to low is as follows in Figure 7:
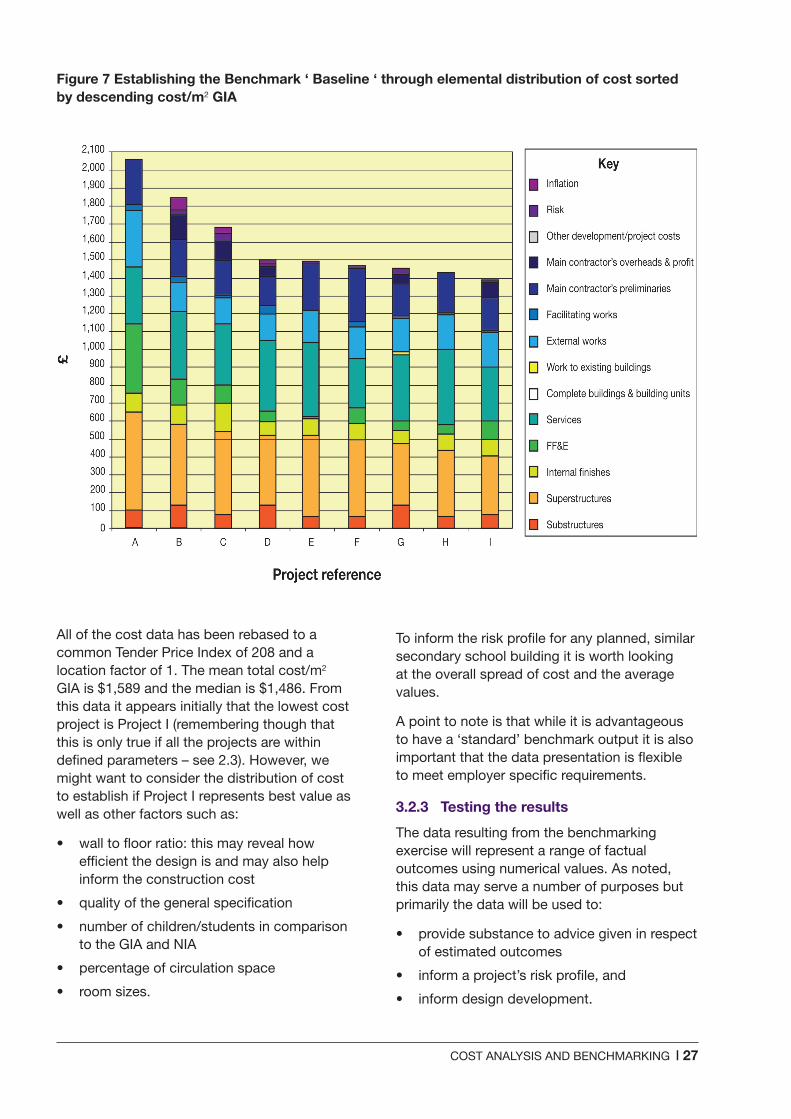
COST ANALYSIS AND BENCHMARKING | 27
All of the cost data has been rebased to a common Tender Price Index of 208 and a location factor of 1. The mean total cost/m2 GIA is $1,589 and the median is $1,486. From this data it appears initially that the lowest cost project is Project I (remembering though that this is only true if all the projects are within defined parameters – see 2.3). However, we might want to consider the distribution of cost to establish if Project I represents best value as well as other factors such as:
• wall to floor ratio: this may reveal how efficient the design is and may also help inform the construction cost
• quality of the general specification
• number of children/students in comparison to the GIA and NIA
• percentage of circulation space
• room sizes.
Figure 7 Establishing the Benchmark ‘ Baseline ‘ through elemental distribution of cost sorted by descending cost/m2 GIA
To inform the risk profile for any planned, similar secondary school building it is worth looking at the overall spread of cost and the average values.
A point to note is that while it is advantageous to have a ‘standard’ benchmark output it is also important that the data presentation is flexible to meet employer specific requirements.
3.2.3 Testing the results
The data resulting from the benchmarking exercise will represent a range of factual outcomes using numerical values. As noted, this data may serve a number of purposes but primarily the data will be used to:
• provide substance to advice given in respect of estimated outcomes
• inform a project’s risk profile, and
• inform design development.
28 | COST ANALYSIS AND BENCHMARKING
It is beneficial to consider the numerical ranges and the average numerical value for each range. In addition it is worth testing the data, particularly for pricing sensitivity, by running the exercise with a variety of possible pricing scenarios or indices.
It is also an idea to identify a set of key performance indicators (KPIs) so that the benchmarking results can be assessed against the KPIs again providing a means of validating the benchmarking data. For example published data may identify that the cost to construct a school should not exceed more than $10,000 per pupil. The benchmarking data can be compared against this KPI to see how the proposed project compares to published data.
3.2.4 Analysing the results
A key stage in the benchmarking process is that of analysing the results arising from the collection and comparison of project data.
The results should be interrogated and reported on accordingly. This interrogation may reveal whether any of the projects used have been influenced by project specific abnormals. If they have, the relevant project data needs to be either:
• dealt with by adjusting it accordingly, or
• removed from the benchmarking exercise.
Doing nothing about abnormals will skew the data range and resulting average calculations and is therefore not recommended.
The analysis should also identify what key factors potentially contribute to the ‘benchmark’ result, such as design efficiencies, procurement approach, and optimum construction programme, among others. This will help establish if the ‘benchmark’ result is realistically achievable under different circumstances.
To review, as part of the benchmarking analysis process it is worth checking that:
• adjustments for location and pricing conditions are correct
• special features which may distort the like-for-like comparison are adjusted
• due regard is given to the effects of plan shape, number of storeys and the site conditions, and the influence upon relative roof and wall areas, wall to floor ratios and degree of foundation/ basement provision
• the use of specialist installations techniques, fast track processes, and off-site pre-fabrication is accounted for long term employer relationships or one off project influences are recorded, and
• reference is made to market conditions, supply chain interrogation, form of contract, procurement route and risk transfer issues, and whether the contract was fixed price and competitive or negotiated.
COST ANALYSIS AND BENCHMARKING | 29
4.1 Common difficulties
There are a few common pitfalls to be mindful of when recording and analysing project data and carrying out any subsequent benchmarking exercises especially when comparing projects across different global regions where different method of measurement and cost breakdown and analysis exist. Some of these are noted below.
4.1.1 Cost analysis and International Considerations
It is recommended that as far as is practicable all project analyses (at least for a certain building type) be structured on a consistent basis, with costs also allocated consistently. If this is deviated from then the cost modelling and benchmarking processes can become complicated and unrepresentative.
When comparing projects across international regions it is essential that a common definition of measurement and cost analysis is determined from the outset and clearly defined. Typically adjustment should be made to cost analyses to achieve a like for like comparison. These adjustments also need to be clearly defined and stated. Regional differences can be explained in a separate cost element or included in the abnormals.
There is a danger that the main focus of the analysis is on recording just the numbers. Unless there is a comprehensive description of what that cost represents it is has limited meaning when the data is interrogated.
Identifying the base data for projects that are not fixed price contracts needs careful thought. Proper consideration should be given to the contractor(s)’ pricing programme(s) and the pricing conditions for individual packages. A general rule of thumb for projects which are not fixed price is to set the base date for the middle of the construction programme. However,
if the major cost work packages are settled well in advance of this then this might not be appropriate.
Recording all the supplementary details about a project is important but it is an aspect of the analysis process which can easily be missed. Having this information helps to inform the cost data and helps to identify the right project data to use in the benchmarking process.
4.1.2 Benchmarking
A key pitfall in the benchmarking process is a failure to carry out the analysis and interrogation of the benchmarking results. Benchmarking is not just about representing data in a certain way for a number of similar projects. It is about understanding the reasoning behind the resulting comparison.
Once the reasoning is established it is advisable to review the results to see if the selected projects are appropriate or unnecessarily skew the results (in which case action should be taken). Failure to do so may lead to incorrect comparison.
In the review, care needs to be taken to look at the results objectively so that any correlations found are correct and not assumed.
It is also worth considering that construction regulation changes over time and some buildings necessarily become more expensive to build because of this regulation. Unfortunately price indices do not take account of this change in regulation and so the impact cannot automatically be calculated. There is no reason, though, why this should not be considered in the analysis/interrogation process and reported on accordingly. Ignoring changes in regulation may result in the creation of a misleading benchmark or target model (see 4.2.2).
4 Practical considerations (Level 3: doing/advising)
30 | COST ANALYSIS AND BENCHMARKING
It is common for benchmarking to focus on cost data but it helps to benchmark other aspects of projects as this too will inform the reasoning and results.
A benchmarking exercise has a limited life and unfortunately the exercise is often not repeated with updated indices or with new project data introduced. It is useful to think of benchmarking as an ongoing process, especially if benchmarking data is feeding into cost planning and design development
Although it is extremely beneficial to work with benchmarking programs that produce a standard ‘benchmark output’, it is important to think about the data representation and what will work best in terms of reporting. It is worth building some flexibility into such programs so that there is no restriction on presentation and reporting.
It is useful to remember that the benchmarking results can inform the price risk profile for a project in the early stages of design development as well as identifying a target benchmark to aim for.
4.2 Reporting
A useful way of approaching the reporting aspect of historical and/or benchmarking data is to consider the findings from the employer or reader’s view point. Depending upon the nature and experience of the employer it may be beneficial to report the analysis and benchmarking process on a step-by-step basis, setting out the main principles; do not assume that the reasoning behind the approach is evident.
Regardless of the employer ‘type’, however, it is advisable to convey the following key points:
• the purpose for the benchmarking exercise
• the scope of the benchmarking exercise
• the methodology behind the selection of the comparison projects and the benchmarking process
• the basic structure on which the project analyses and benchmarking is set up
• what is excluded from the benchmarking results, i.e. professional fees, VAT, etc.
• how abnormals have been dealt with
(particularly important when comparing projects across international regions)
• rebasing factors used and the rationale supporting their selection
• what the main drivers are for the benchmarking results.
In respect of the benchmarking results, areas for clarification in the reporting process include:
• what sets apart the ‘benchmark’ project from the remaining comparison projects
• what the range of data means/conveys in terms of the particular aspect benchmarked and the risk profile?
• how data about a planned project relates to the benchmark results (if appropriate)
• how sensitive the data is, referring to the main drivers behind the results
• what the impact of abnormals is (again if appropriate).
It is useful for recommendations to set out considerations for the employer in light of the reported information. It is worth highlighting here that benchmarking is a tool, not just a process (as a process its use is restricted). As such, for it to be useful the recommendations are best reviewed in a timely manner and benchmarking repeated as decisions are made and direction established.
4.2.1 Setting a target model
As well as informing the risk profile the benchmarking results can be used to set a target model for a planned project. This target model will need to be practical and realistic and should enhance the value of the project overall. It is advisable to take care, therefore, if the focus of the benchmarking exercise is about cost, not to detract from overall value, employer aspirations and building performance.
Benchmarking cost/m2 Gross Floor Area A will give cost targets for construction elements, typically known as the baseline. If the elemental percentage distribution of cost is also benchmarked then this can provide another level of insight into what can be practically and realistically achieved resulting in more robust targets. Consideration should also be given to changing regulations, and building efficiencies, i.e. wall to floor ratios, storey heights, etc.
COST ANALYSIS AND BENCHMARKING | 31
reflect the project including the abnormal costs and one to reflect it excluding abnormal costs. This in itself will then facilitate benchmarking of (typical) abnormal costs for certain building type and elements.
4.2.2 Risk in the target model
It is recommended that a risk allowance element for a planned project be a properly considered for assessment, taking into account completeness of design and other uncertainties.
While it is useful in the early stages of design development to set a percentage allowance for risk through a target model, it is advisable to replace this over time with a calculated allowance following a formal risk analysis. Risk exposure changes as the design of a project develops – more of the project requirements are defined and as a result a risk response can be decided. A risk analysis might consider risk areas such as:
• design development risks (resulting from an inadequate project brief for example)
• site abnormals separated from the base building costs such as landscaping, water features and special lighting features
• construction risks (an example being risk arising due to weather)
• employer change risks, and
• other employer risks such as those arising from an unrealistic tender period.
• The relationship and balance between development, construction and on-going capex costs.
A list of typical risks for each category can be found in the RICS New rules of measurement (NRM).
A risk response tends to cover considerations such as:
• avoiding the risk through perhaps considering different design solutions
• reducing the risk again, e.g. through redesign or further site investigation
• transfering the risk, e.g. through changing the contract strategy
• sharing the risk
• retaining the risk.
4.2.3 Value engineering
Building a considered target model based on benchmarking data can prove beneficial in the value engineering process.
Because the basis of the target model is found in factual/realised data it can inform the value engineering process, helping to drive design to achieve employer aspirations. It is, however, useful to make adjustments to the benchmarking data and resulting target model should parameters change through clarification of the employer’s brief, unearthing of new site data and design development.
4.2.4 Confidentiality
The analysis data providing the benchmarking output and sitting in any publicly released report should remain confidential unless there is prior agreement for the source of the data to be named. Certainly for information taken from ‘branded’ projects, descriptions may need to be rewritten and interrogation carefully worded so that context is not lost but employer confidentiality is retained.
OGC Project Procurement Lifecycle the Integrated Process, 2007, Office of Government Commerce
RIBA Outline Plan of Work, 2007, RIBA
RICS Code of Measuring Practice, 6th Edition, 2007, RICS
RICS New Rules of Measurement; Order of cost estimating and cost planning for capital building works (NRM 1), 2nd Edition, 2012, RICS
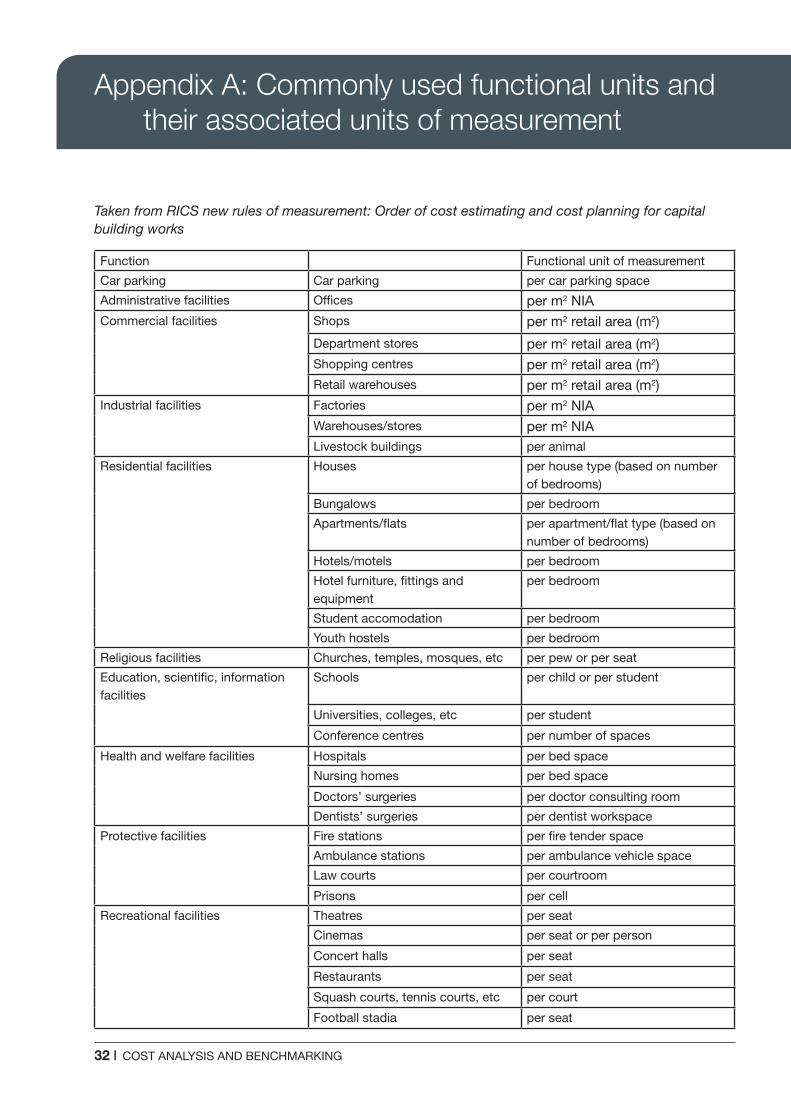
32 | COST ANALYSIS AND BENCHMARKING
Appendix A: Commonly used functional units and their associated units of measurement
Taken from RICS new rules of measurement: Order of cost estimating and cost planning for capital building works
Function Functional unit of measurement
Car parking Car parking per car parking space
Administrative facilities Offices per m2 NIACommercial facilities Shops per m2 retail area (m2)
Department stores per m2 retail area (m2)Shopping centres per m2 retail area (m2)Retail warehouses per m2 retail area (m2)
Industrial facilities Factories per m2 NIAWarehouses/stores per m2 NIALivestock buildings per animal
Residential facilities Houses per house type (based on number of bedrooms)
Bungalows per bedroom
Apartments/flats per apartment/flat type (based on number of bedrooms)
Hotels/motels per bedroom
Hotel furniture, fittings and equipment
per bedroom
Student accomodation per bedroom
Youth hostels per bedroom
Religious facilities Churches, temples, mosques, etc per pew or per seat
Education, scientific, information facilities
Schools per child or per student
Universities, colleges, etc per student
Conference centres per number of spaces
Health and welfare facilities Hospitals per bed space
Nursing homes per bed space
Doctors’ surgeries per doctor consulting room
Dentists’ surgeries per dentist workspace
Protective facilities Fire stations per fire tender space
Ambulance stations per ambulance vehicle space
Law courts per courtroom
Prisons per cell
Recreational facilities Theatres per seat
Cinemas per seat or per person
Concert halls per seat
Restaurants per seat
Squash courts, tennis courts, etc per court
Football stadia per seat

COST ANALYSIS AND BENCHMARKING | 33
Appendix B: Elements to other elemental classifications
The need for elemental classification is acknowledged in International Standard Building Construction – Organization of information about construction works – Part 2: Framework for a classification of information (ISO 12006.2).
Within this, standard ‘Elements’ is one of the recommended classification tables. It defines Elements as ‘a part of an entity (building) which, in itself or in combination with other such parts, fulfils a predominating function of the construction entity [building]’.
Elemental tables are produced by many national standards organisations and professional institutions.
The standard elemental classification used in the UK is defined in the BCIS Elemental Standard Form of Cost Analysis and form the basis for NRM1 – Order of cost estimating and cost planning for capital building works.
In the United States ASTM International (formerly known as the American Society for Testing and Materials, ASTM), publish Standard Classification for Building Elements and Related Siteworks – UNIFORMAT II.
Also in the US, the OmniClass Construction Classification System (known as OmniClass or OCCS) is a complete set of ISO tables that includes an Elements table (Table 21).
In Europe, many countries have elemental tables, all of them slightly different. The European Council of Construction Economists (CEEC), agreed a common elemental cost grouping, the ‘CEEC Code of Measurement for Cost Planning’, which provides links back to the national elemental cost planning systems in the UK, Germany, Switzerland, Belgium, Holland and Ireland. The CEEC code, which BCIS helped to prepare, enables costs prepared in one system to be compared with costs in another system on a common basis. This has established a methodology for mapping any elemental classification.
A BCIS International survey of Elements also identified elemental classification systems in Australia, South Africa, Canada, Hong Kong and Malaysia. The survey is available on the BCIS website at www.rics.org/bcis
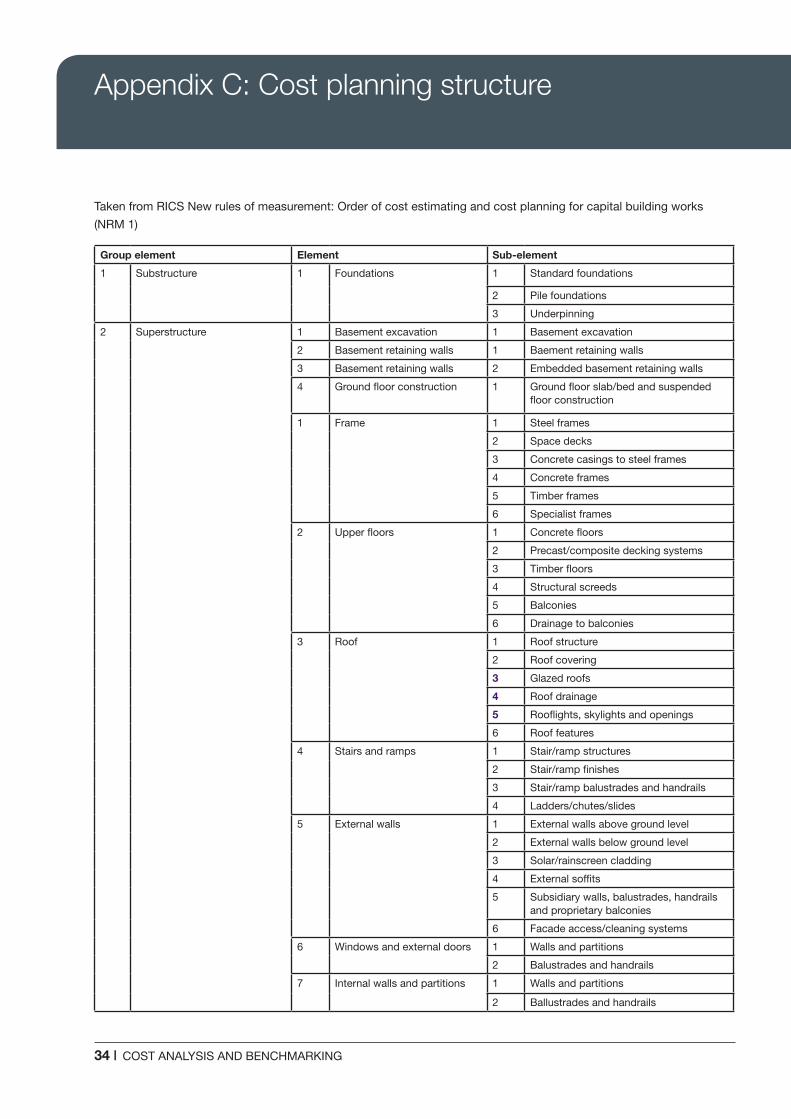
34 | COST ANALYSIS AND BENCHMARKING
Taken from RICS New rules of measurement: Order of cost estimating and cost planning for capital building works
(NRM 1)
Group element Element Sub-element
1 Substructure 1 Foundations 1 Standard foundations
2 Pile foundations
3 Underpinning
2 Superstructure 1 Basement excavation 1 Basement excavation
2 Basement retaining walls 1 Baement retaining walls
3 Basement retaining walls 2 Embedded basement retaining walls
4 Ground floor construction 1 Ground floor slab/bed and suspended floor construction
1 Frame 1 Steel frames
2 Space decks
3 Concrete casings to steel frames
4 Concrete frames
5 Timber frames
6 Specialist frames
2 Upper floors 1 Concrete floors
2 Precast/composite decking systems
3 Timber floors
4 Structural screeds
5 Balconies
6 Drainage to balconies
3 Roof 1 Roof structure
2 Roof covering
3 Glazed roofs
4 Roof drainage
5 Rooflights, skylights and openings
6 Roof features
4 Stairs and ramps 1 Stair/ramp structures
2 Stair/ramp finishes
3 Stair/ramp balustrades and handrails
4 Ladders/chutes/slides
5 External walls 1 External walls above ground level
2 External walls below ground level
3 Solar/rainscreen cladding
4 External soffits
5 Subsidiary walls, balustrades, handrails and proprietary balconies
6 Facade access/cleaning systems
6 Windows and external doors 1 Walls and partitions
2 Balustrades and handrails
7 Internal walls and partitions 1 Walls and partitions
2 Ballustrades and handrails
Appendix C: Cost planning structure
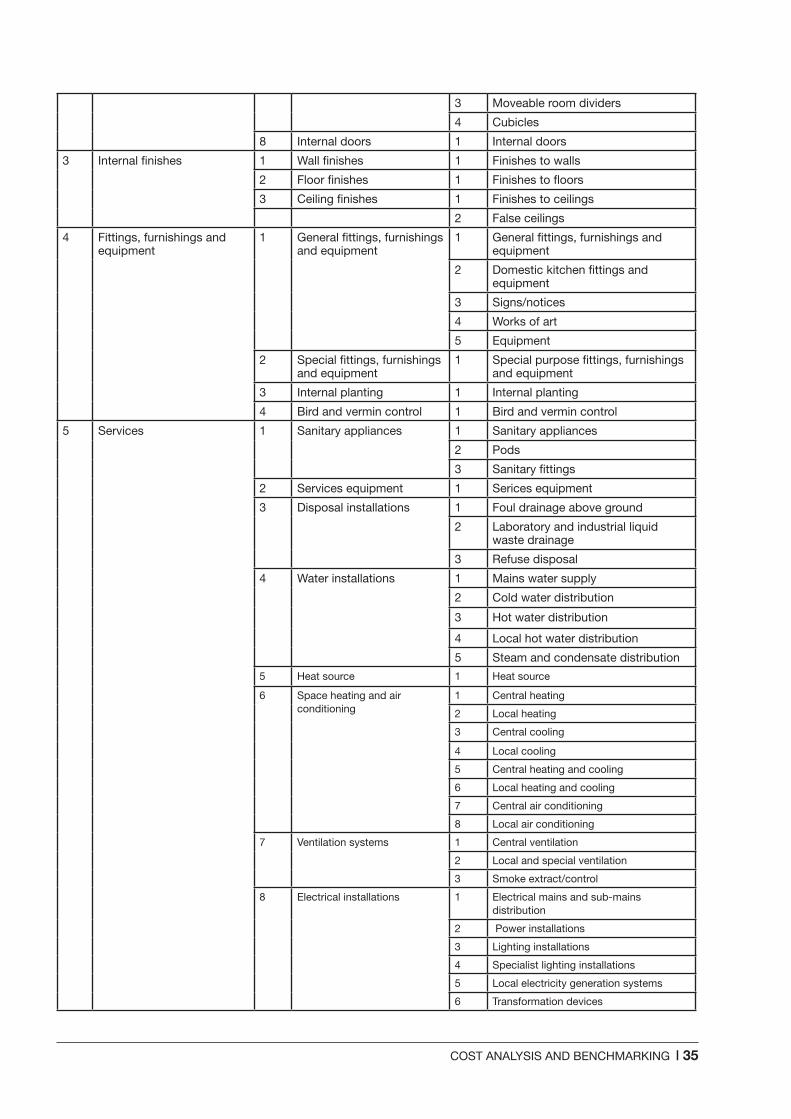
COST ANALYSIS AND BENCHMARKING | 35
3 Moveable room dividers
4 Cubicles
8 Internal doors 1 Internal doors
3 Internal finishes 1 Wall finishes 1 Finishes to walls
2 Floor finishes 1 Finishes to floors
3 Ceiling finishes 1 Finishes to ceilings
2 False ceilings
4 Fittings, furnishings and equipment
1 General fittings, furnishings and equipment
1 General fittings, furnishings and equipment
2 Domestic kitchen fittings and equipment
3 Signs/notices
4 Works of art
5 Equipment
2 Special fittings, furnishings and equipment
1 Special purpose fittings, furnishings and equipment
3 Internal planting 1 Internal planting
4 Bird and vermin control 1 Bird and vermin control
5 Services 1 Sanitary appliances 1 Sanitary appliances
2 Pods
3 Sanitary fittings
2 Services equipment 1 Serices equipment
3 Disposal installations 1 Foul drainage above ground
2 Laboratory and industrial liquid waste drainage
3 Refuse disposal
4 Water installations 1 Mains water supply
2 Cold water distribution
3 Hot water distribution
4 Local hot water distribution
5 Steam and condensate distribution
5 Heat source 1 Heat source
6 Space heating and air conditioning
1 Central heating
2 Local heating
3 Central cooling
4 Local cooling
5 Central heating and cooling
6 Local heating and cooling
7 Central air conditioning
8 Local air conditioning
7 Ventilation systems 1 Central ventilation
2 Local and special ventilation
3 Smoke extract/control
8 Electrical installations 1 Electrical mains and sub-mains distribution
2 Power installations
3 Lighting installations
4 Specialist lighting installations
5 Local electricity generation systems
6 Transformation devices
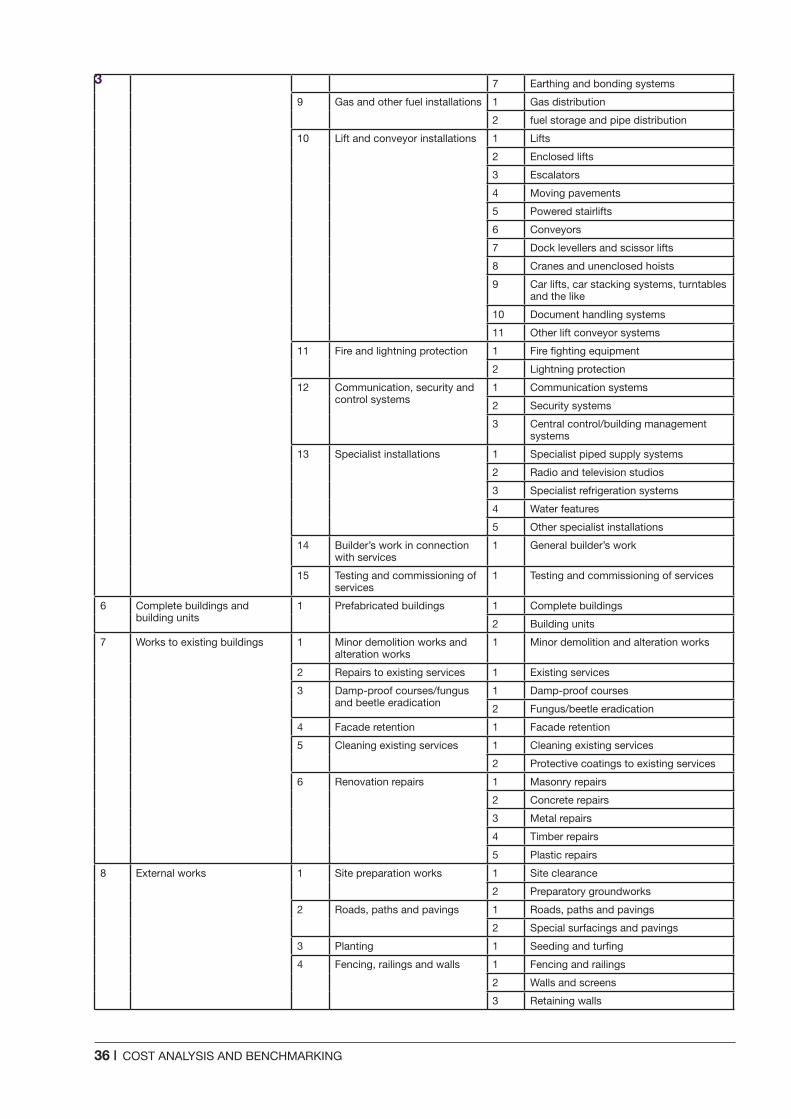
36 | COST ANALYSIS AND BENCHMARKING
3 7 Earthing and bonding systems
9 Gas and other fuel installations 1 Gas distribution
2 fuel storage and pipe distribution
10 Lift and conveyor installations 1 Lifts
2 Enclosed lifts
3 Escalators
4 Moving pavements
5 Powered stairlifts
6 Conveyors
7 Dock levellers and scissor lifts
8 Cranes and unenclosed hoists
9 Car lifts, car stacking systems, turntables and the like
10 Document handling systems
11 Other lift conveyor systems
11 Fire and lightning protection 1 Fire fighting equipment
2 Lightning protection
12 Communication, security and control systems
1 Communication systems
2 Security systems
3 Central control/building management systems
13 Specialist installations 1 Specialist piped supply systems
2 Radio and television studios
3 Specialist refrigeration systems
4 Water features
5 Other specialist installations
14 Builder’s work in connection with services
1 General builder’s work
15 Testing and commissioning of services
1 Testing and commissioning of services
6 Complete buildings and building units
1 Prefabricated buildings 1 Complete buildings
2 Building units
7 Works to existing buildings 1 Minor demolition works and alteration works
1 Minor demolition and alteration works
2 Repairs to existing services 1 Existing services
3 Damp-proof courses/fungus and beetle eradication
1 Damp-proof courses
2 Fungus/beetle eradication
4 Facade retention 1 Facade retention
5 Cleaning existing services 1 Cleaning existing services
2 Protective coatings to existing services
6 Renovation repairs 1 Masonry repairs
2 Concrete repairs
3 Metal repairs
4 Timber repairs
5 Plastic repairs
8 External works 1 Site preparation works 1 Site clearance
2 Preparatory groundworks
2 Roads, paths and pavings 1 Roads, paths and pavings
2 Special surfacings and pavings
3 Planting 1 Seeding and turfing
4 Fencing, railings and walls 1 Fencing and railings
2 Walls and screens
3 Retaining walls
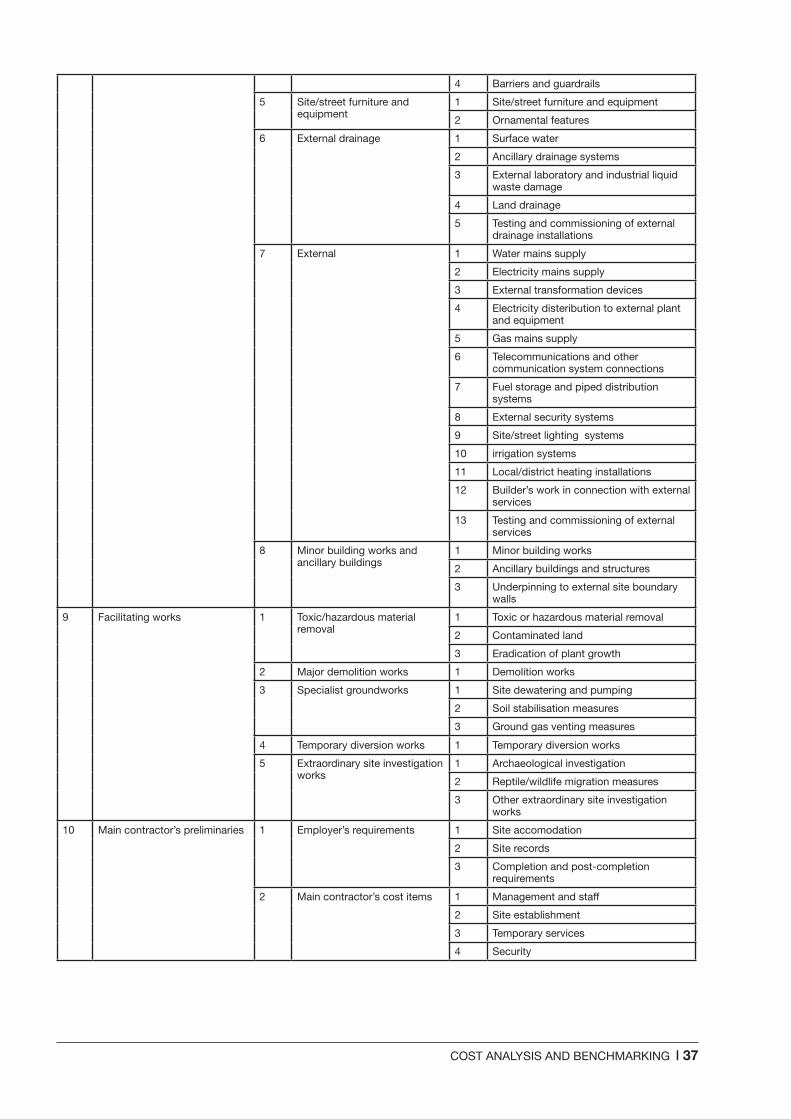
COST ANALYSIS AND BENCHMARKING | 37
4 Barriers and guardrails
5 Site/street furniture and equipment
1 Site/street furniture and equipment
2 Ornamental features
6 External drainage 1 Surface water
2 Ancillary drainage systems
3 External laboratory and industrial liquid waste damage
4 Land drainage
5 Testing and commissioning of external drainage installations
7 External 1 Water mains supply
2 Electricity mains supply
3 External transformation devices
4 Electricity disteribution to external plant and equipment
5 Gas mains supply
6 Telecommunications and other communication system connections
7 Fuel storage and piped distribution systems
8 External security systems
9 Site/street lighting systems
10 irrigation systems
11 Local/district heating installations
12 Builder’s work in connection with external services
13 Testing and commissioning of external services
8 Minor building works and ancillary buildings
1 Minor building works
2 Ancillary buildings and structures
3 Underpinning to external site boundary walls
9 Facilitating works 1 Toxic/hazardous material removal
1 Toxic or hazardous material removal
2 Contaminated land
3 Eradication of plant growth
2 Major demolition works 1 Demolition works
3 Specialist groundworks 1 Site dewatering and pumping
2 Soil stabilisation measures
3 Ground gas venting measures
4 Temporary diversion works 1 Temporary diversion works
5 Extraordinary site investigation works
1 Archaeological investigation
2 Reptile/wildlife migration measures
3 Other extraordinary site investigation works
10 Main contractor’s preliminaries 1 Employer’s requirements 1 Site accomodation
2 Site records
3 Completion and post-completion requirements
2 Main contractor’s cost items 1 Management and staff
2 Site establishment
3 Temporary services
4 Security
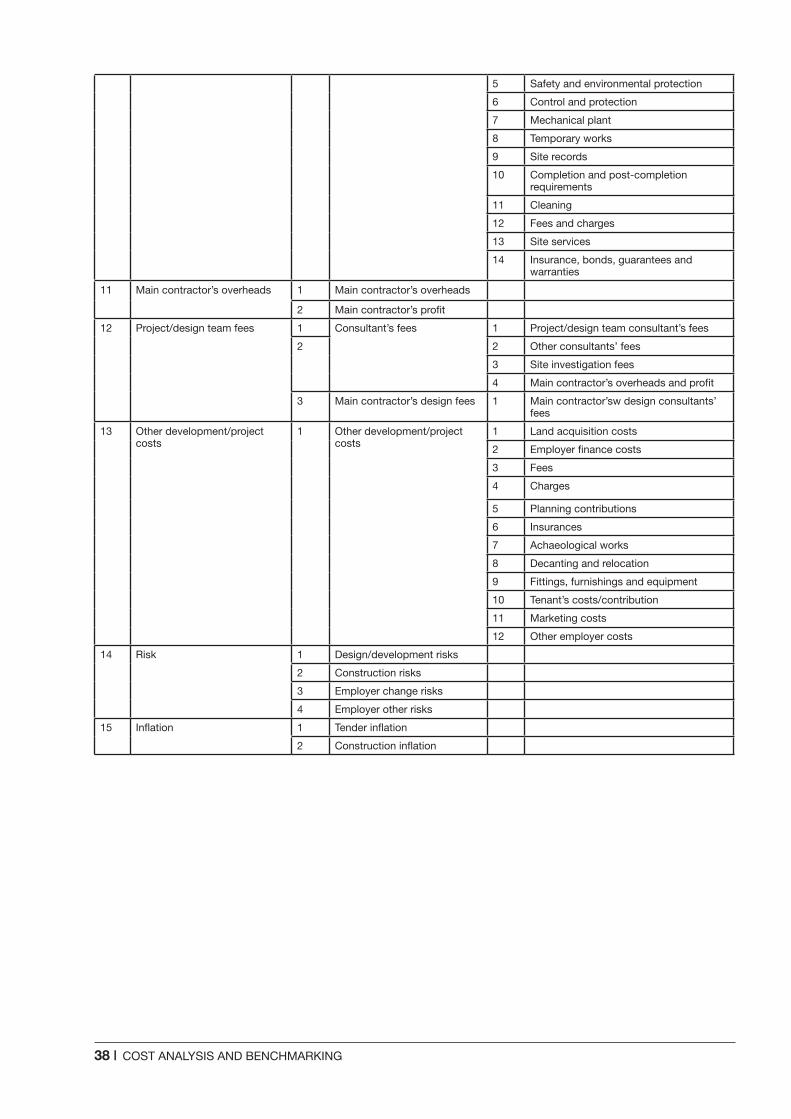
38 | COST ANALYSIS AND BENCHMARKING
5 Safety and environmental protection
6 Control and protection
7 Mechanical plant
8 Temporary works
9 Site records
10 Completion and post-completion requirements
11 Cleaning
12 Fees and charges
13 Site services
14 Insurance, bonds, guarantees and warranties
11 Main contractor’s overheads 1 Main contractor’s overheads
2 Main contractor’s profit
12 Project/design team fees 1 Consultant’s fees 1 Project/design team consultant’s fees
2 2 Other consultants’ fees
3 Site investigation fees
4 Main contractor’s overheads and profit
3 Main contractor’s design fees 1 Main contractor’sw design consultants’ fees
13 Other development/project costs
1 Other development/project costs
1 Land acquisition costs
2 Employer finance costs
3 Fees
4 Charges
5 Planning contributions
6 Insurances
7 Achaeological works
8 Decanting and relocation
9 Fittings, furnishings and equipment
10 Tenant’s costs/contribution
11 Marketing costs
12 Other employer costs
14 Risk 1 Design/development risks
2 Construction risks
3 Employer change risks
4 Employer other risks
15 Inflation 1 Tender inflation
2 Construction inflation

COST ANALYSIS AND BENCHMARKING | 39
BCIS Principles of elemental classification for building(s) (International), 2012, RICS
BCIS Elemental Standard Form of Cost Analysis – Principles, instructions and definitions, 4th (NRM) Edition, 2012, RICS
Building Cost Information Service (www.rics.org/bcis)
CEN Standard EN 15221-6
Constructing Excellence, Benchmarking factsheet, 2004
The European Council of Construction Economists (www.ceecorg.eu)
International Standard ISO 9836
International Standard ISO 12006-2
MacDonald, M. Review of Large Public Procurement in the UK, July 2002 (www.hm-treasury.gov.uk/d/7(3).pdf)
Rossiter, J. Better value from benchmarking, 1996, CIOB
References

rics.org/guidance
rics.org
RICS HQ
Parliament Square London SW1P 3ADUnited Kingdom
Worldwide mediaenquiries:
e pressoffi [email protected]
Contact Centre:
e [email protected] +44 (0)870 333 1600f +44 (0)20 7334 3811
Advancing standards in land, property and construction.
RICS is the world’s leading qualifi cation when it comes to professional standards in land, property and construction.
In a world where more and more people, governments, banks and commercial organisations demand greater certainty of professional standards and ethics, attaining RICS status is the recognised mark of property professionalism.
Over 100 000 property professionals working in the major established and emerging economies of the world have already recognised the importance of securing RICS status by becoming members.
RICS is an independent professional body originally established in the UK by Royal Charter. Since 1868, RICS has been committed to setting and upholding the highest standards of excellence and integrity – providing impartial, authoritative advice on key issues affecting businesses and society.
RICS is a regulator of both its individual members and fi rms enabling it to maintain the highest standards and providing the basis for unparalleled client confi dence in the sector.
RICS has a worldwide network. For further information simply contact the relevant RICS offi ce or our Contact Centre.
AsiaRoom 2203Hopewell Centre183 Queen’s Road EastWanchaiHong Kong
t +852 2537 7117f +852 2537 [email protected]
AmericasOne Grand Central Place60 East 42nd StreetSuite 2810New York 10165 – 2811USA
t +1 212 847 7400f +1 212 847 [email protected]
OceaniaSuite 2, Level 161 Castlereagh StreetSydney, NSW 2000Australia
t +61 2 9216 2333f +61 2 9232 [email protected]
Europe (excluding United Kingdom and Ireland)Rue Ducale 671000 BrusselsBelgium
t +32 2 733 10 19f +32 2 742 97 [email protected]
AfricaPO Box 3400Witkoppen 2068South Africa
t +27 11 467 2857 f +27 86 514 0655 [email protected]
Middle EastOffi ce G14, Block 3Knowledge VillageDubaiUnited Arab Emirates
t +971 4 375 3074f +971 4 427 [email protected]
India48 & 49 Centrum Plaza Sector RoadSector 53, Gurgaon – 122002India
t +91 124 459 5400f +91 124 459 [email protected]
United KingdomParliament SquareLondon SW1P 3ADUnited Kingdom
t +44 (0)870 333 1600f +44 (0)207 334 [email protected]
Ireland 38 Merrion SquareDublin 2Ireland
t +353 1 644 5500f +353 1 661 [email protected]
RICS Professional Guidance, global
1st edition, guidance note
GN 112 /2013
Cost analysis and benchmarking
Part of the QS & Construction Standards


