This report is solely for the use of Zinnov client and Zinnov personnel. No part of it may be circulated, quoted, or reproduced for distribution outside the client organization without prior written approval from Zinnov Global R&D Benchmarking December , 2010
Transcript
This report is solely for the use of Zinnov client and Zinnov personnel. No part of it may be circulated, quoted, or reproduced for distribution outside the client organization without prior written approval from Zinnov
Global R&D Benchmarking December , 2010
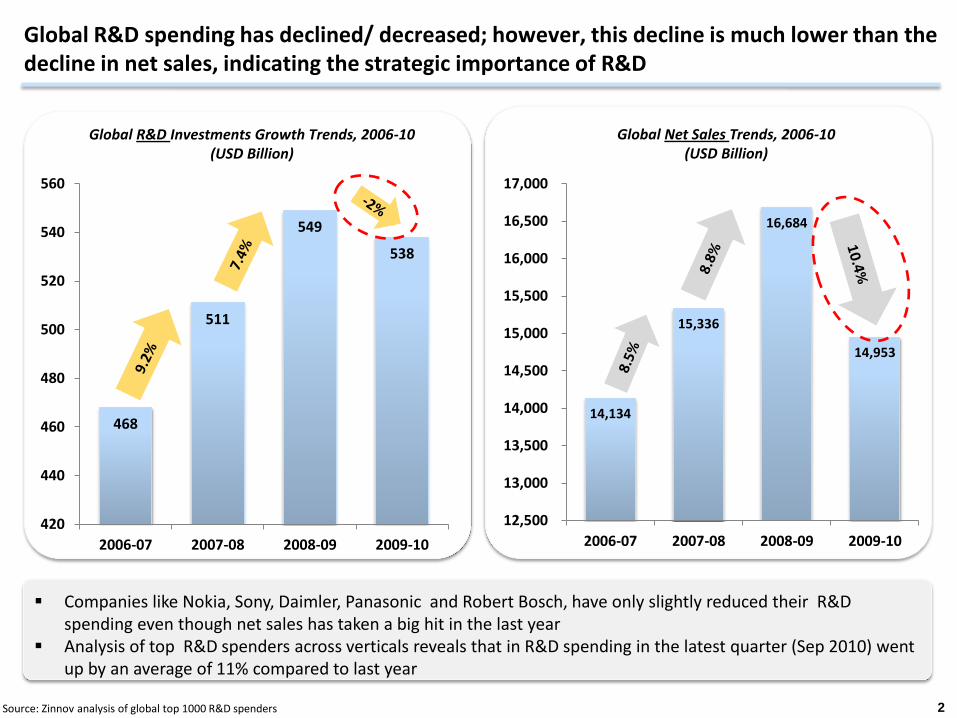
Global R&D spending has declined/ decreased; however, this decline is much lower than the decline in net sales, indicating the strategic importance of R&D
Source: Zinnov analysis of global top 1000 R&D spenders 2
468
511
549
538
420
440
460
480
500
520
540
560
2006-07 2007-08 2008-09 2009-10
Global R&D Investments Growth Trends, 2006-10 (USD Billion)
14,134
15,336
16,684
14,953
12,500
13,000
13,500
14,000
14,500
15,000
15,500
16,000
16,500
17,000
2006-07 2007-08 2008-09 2009-10
Global Net Sales Trends, 2006-10 (USD Billion)
Companies like Nokia, Sony, Daimler, Panasonic and Robert Bosch, have only slightly reduced their R&D spending even though net sales has taken a big hit in the last year
Analysis of top R&D spenders across verticals reveals that in R&D spending in the latest quarter (Sep 2010) went up by an average of 11% compared to last year
Source: Zinnov analysis of global top 1000 R&D spenders
14.1%
30.5%
15.4%
30.3%
9.7%
0%
5%
10%
15%
20%
25%
30%
35%
0-10 11-50 51-100 101-500 501-1000
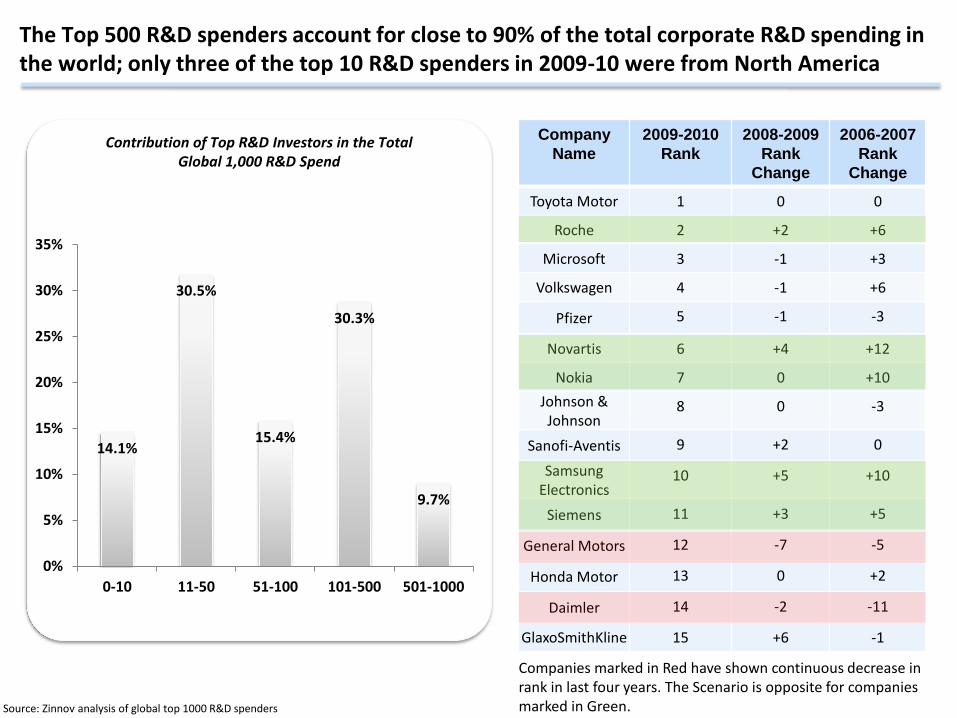
Contribution of Top R&D Investors in the Total Global 1,000 R&D Spend
Company
Name
2009-2010
Rank
2008-2009
Rank
Change
2006-2007
Rank
Change
Toyota Motor 1 0 0
Roche 2 +2 +6
Microsoft 3 -1 +3
Volkswagen 4 -1 +6
Pfizer 5 -1 -3
Novartis 6 +4 +12
Nokia 7 0 +10
Johnson & Johnson
8 0 -3
Sanofi-Aventis 9 +2 0
Samsung Electronics
10 +5 +10
Siemens 11 +3 +5
General Motors 12 -7 -5
Honda Motor 13 0 +2
Daimler 14 -2 -11
GlaxoSmithKline 15 +6 -1
The Top 500 R&D spenders account for close to 90% of the total corporate R&D spending in the world; only three of the top 10 R&D spenders in 2009-10 were from North America
Companies marked in Red have shown continuous decrease in rank in last four years. The Scenario is opposite for companies marked in Green.
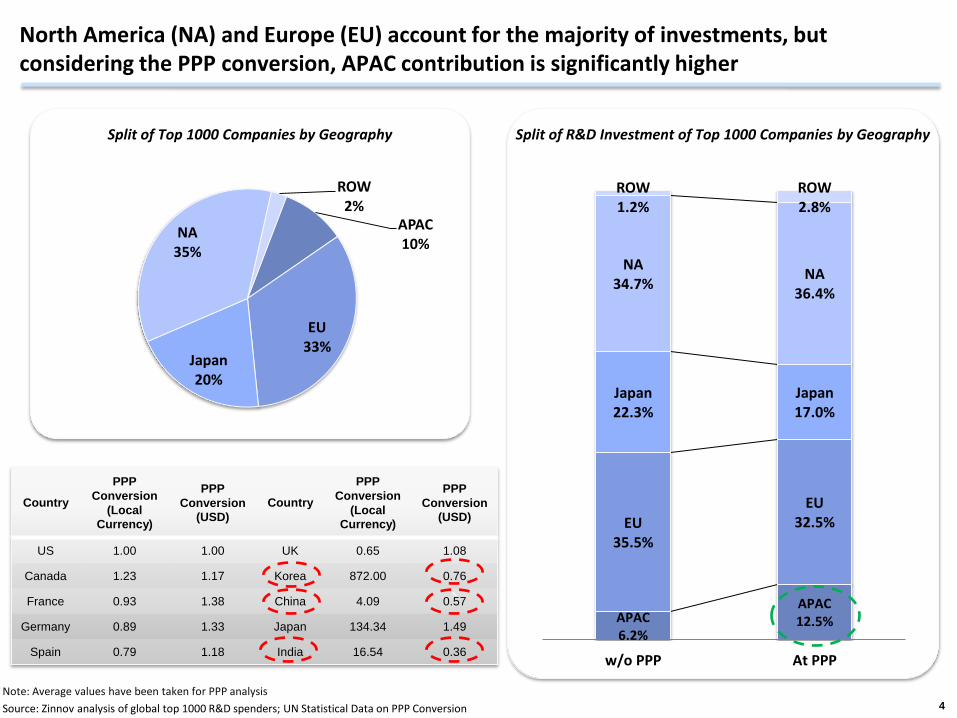
North America (NA) and Europe (EU) account for the majority of investments, but considering the PPP conversion, APAC contribution is significantly higher
Note: Average values have been taken for PPP analysis
Source: Zinnov analysis of global top 1000 R&D spenders; UN Statistical Data on PPP Conversion 4
Split of Top 1000 Companies by Geography
Split of R&D Investment of Top 1000 Companies by Geography
APAC 10%
EU 33%
Japan 20%
NA 35%
ROW 2%
Country
PPP
Conversion
(Local
Currency)
PPP
Conversion
(USD) Country
PPP
Conversion
(Local
Currency)
PPP
Conversion
(USD)
US 1.00 1.00 UK 0.65 1.08
Canada 1.23 1.17 Korea 872.00 0.76
France 0.93 1.38 China 4.09 0.57
Germany 0.89 1.33 Japan 134.34 1.49
Spain 0.79 1.18 India 16.54 0.36
` APAC 6.2%
APAC 12.5%
EU 35.5%
EU 32.5%
Japan 22.3%
Japan 17.0%
NA 34.7%
NA 36.4%
ROW 1.2%
ROW 2.8%
w/o PPP At PPP
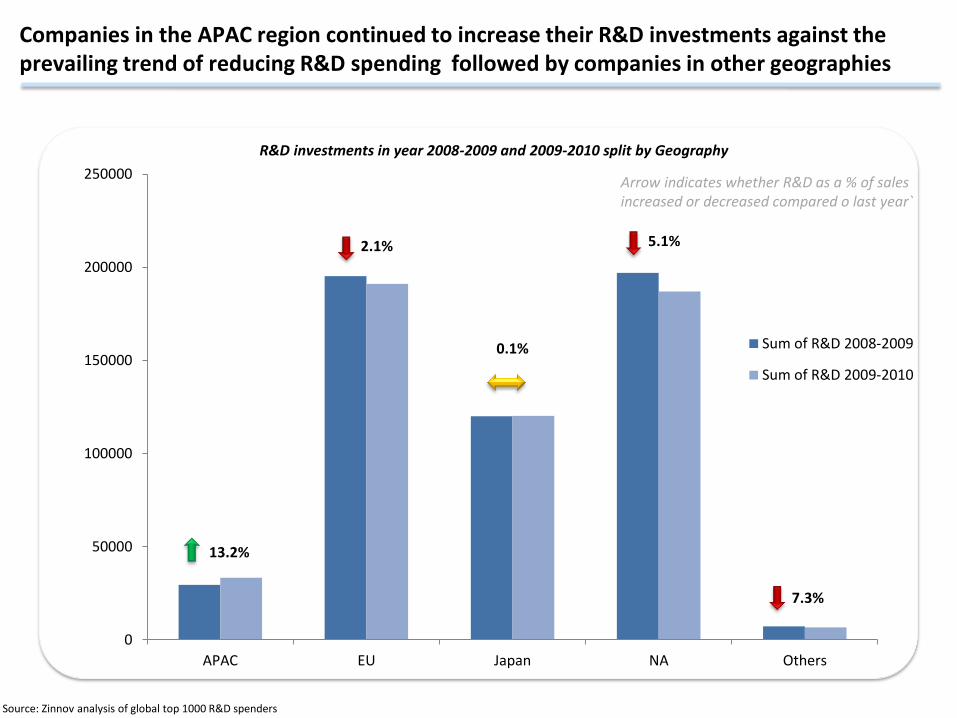
0
50000
100000
150000
200000
250000
APAC EU Japan NA Others
Sum of R&D 2008-2009
Sum of R&D 2009-2010
Arrow indicates whether R&D as a % of sales increased or decreased compared o last year`
R&D investments in year 2008-2009 and 2009-2010 split by Geography
2.1%
13.2%
0.1%
5.1%
7.3%
Companies in the APAC region continued to increase their R&D investments against the prevailing trend of reducing R&D spending followed by companies in other geographies
Source: Zinnov analysis of global top 1000 R&D spenders
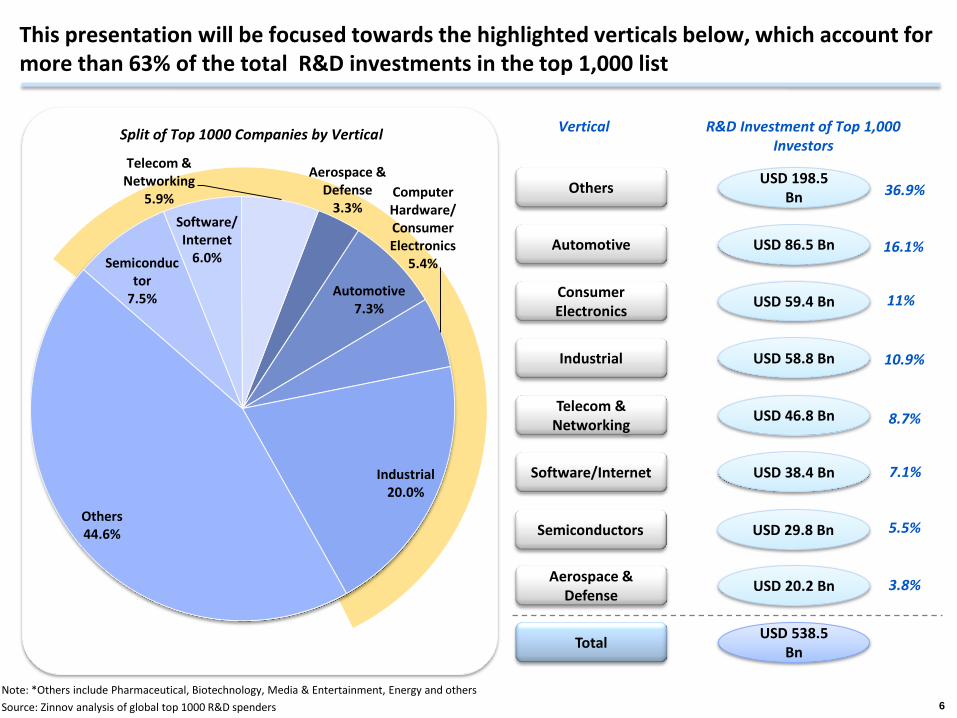
This presentation will be focused towards the highlighted verticals below, which account for more than 63% of the total R&D investments in the top 1,000 list
Note: *Others include Pharmaceutical, Biotechnology, Media & Entertainment, Energy and others
Source: Zinnov analysis of global top 1000 R&D spenders 6
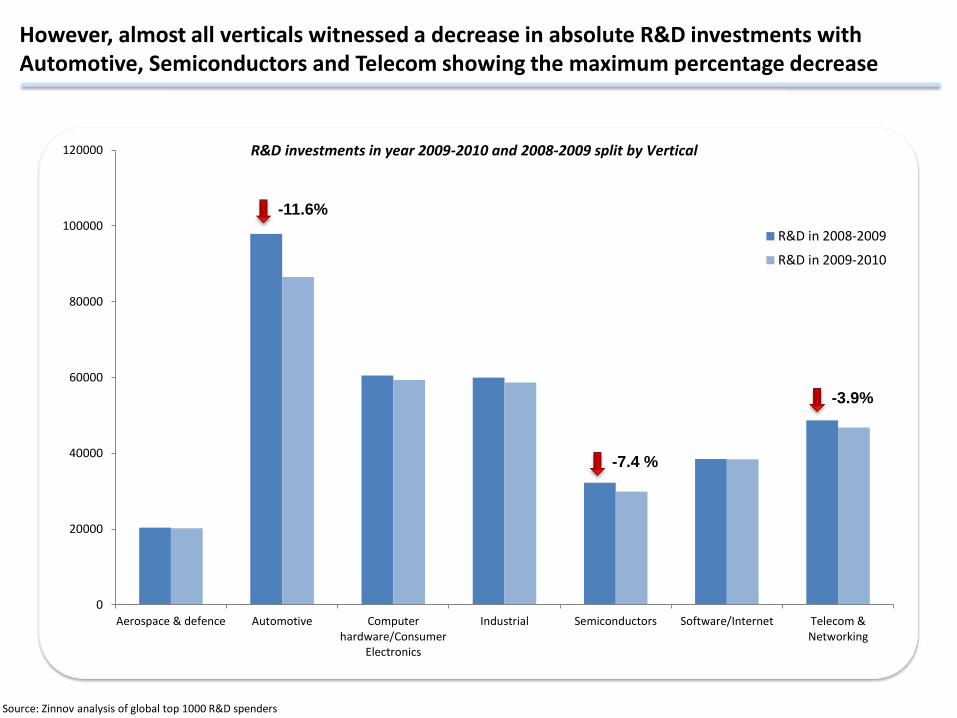
R&D investments in year 2009-2010 and 2008-2009 split by Vertical
Source: Zinnov analysis of global top 1000 R&D spenders
-11.6%
-7.4 %
-3.9%
However, almost all verticals witnessed a decrease in absolute R&D investments with Automotive, Semiconductors and Telecom showing the maximum percentage decrease
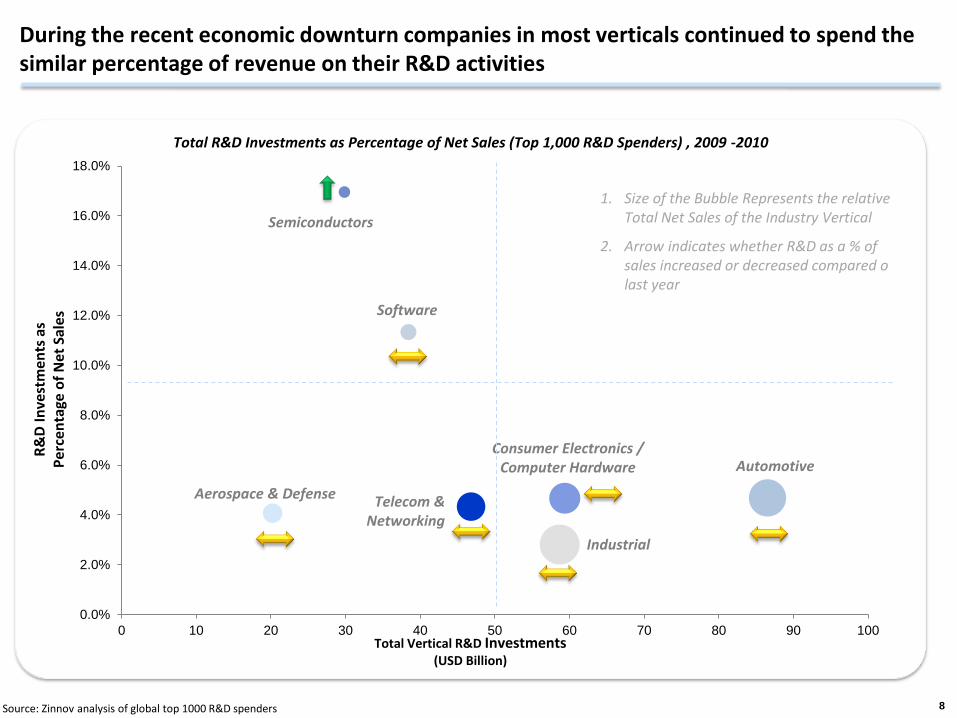
0.0%
2.0%
4.0%
6.0%
8.0%
10.0%
12.0%
14.0%
16.0%
18.0%
0 10 20 30 40 50 60 70 80 90 100
During the recent economic downturn companies in most verticals continued to spend the similar percentage of revenue on their R&D activities
Source: Zinnov analysis of global top 1000 R&D spenders 8
Total Vertical R&D Investments (USD Billion)
1. Size of the Bubble Represents the relative Total Net Sales of the Industry Vertical
2. Arrow indicates whether R&D as a % of sales increased or decreased compared o last year
Total R&D Investments as Percentage of Net Sales (Top 1,000 R&D Spenders) , 2009 -2010
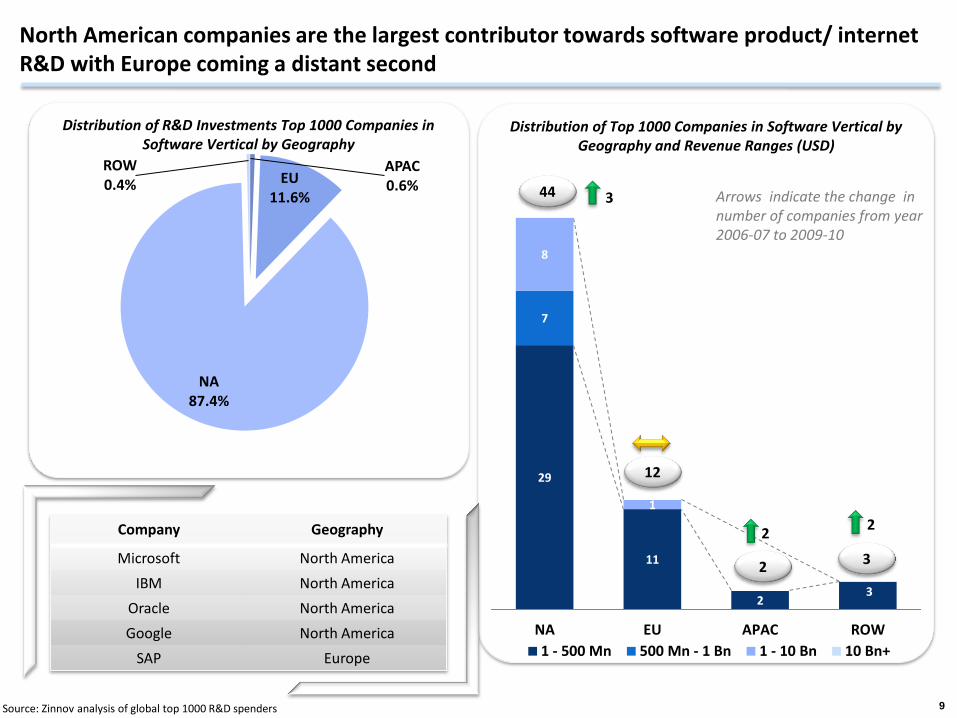
Distribution of R&D Investments Top 1000 Companies in Software Vertical by Geography
North American companies are the largest contributor towards software product/ internet R&D with Europe coming a distant second
Source: Zinnov analysis of global top 1000 R&D spenders 9
29
11
2
7
8
1
3
NA EU APAC ROW
1 - 500 Mn 500 Mn - 1 Bn 1 - 10 Bn 10 Bn+
44
12
2 3
Distribution of Top 1000 Companies in Software Vertical by Geography and Revenue Ranges (USD)
Company Geography
Microsoft North America
IBM North America
Oracle North America
Google North America
SAP Europe
APAC 0.6% EU
11.6%
NA 87.4%
ROW 0.4%
3
2 2
Arrows indicate the change in number of companies from year 2006-07 to 2009-10
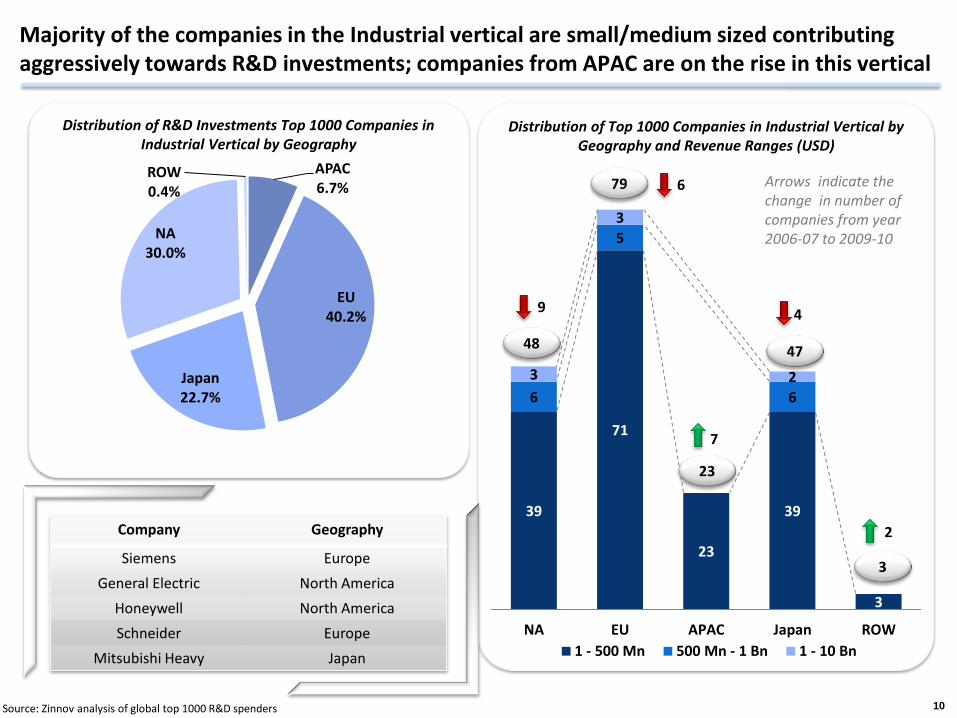
Distribution of R&D Investments Top 1000 Companies in Industrial Vertical by Geography
Majority of the companies in the Industrial vertical are small/medium sized contributing aggressively towards R&D investments; companies from APAC are on the rise in this vertical
Source: Zinnov analysis of global top 1000 R&D spenders 10
39
71
23
39
3
6
5
6
3
3
2
NA EU APAC Japan ROW
1 - 500 Mn 500 Mn - 1 Bn 1 - 10 Bn
3
48
79
23
47
Distribution of Top 1000 Companies in Industrial Vertical by Geography and Revenue Ranges (USD)
APAC 6.7%
EU 40.2%
Japan 22.7%
NA 30.0%
ROW 0.4%
Company Geography
Siemens Europe
General Electric North America
Honeywell North America
Schneider Europe
Mitsubishi Heavy Japan
9
6
7
2
4
Arrows indicate the change in number of companies from year 2006-07 to 2009-10
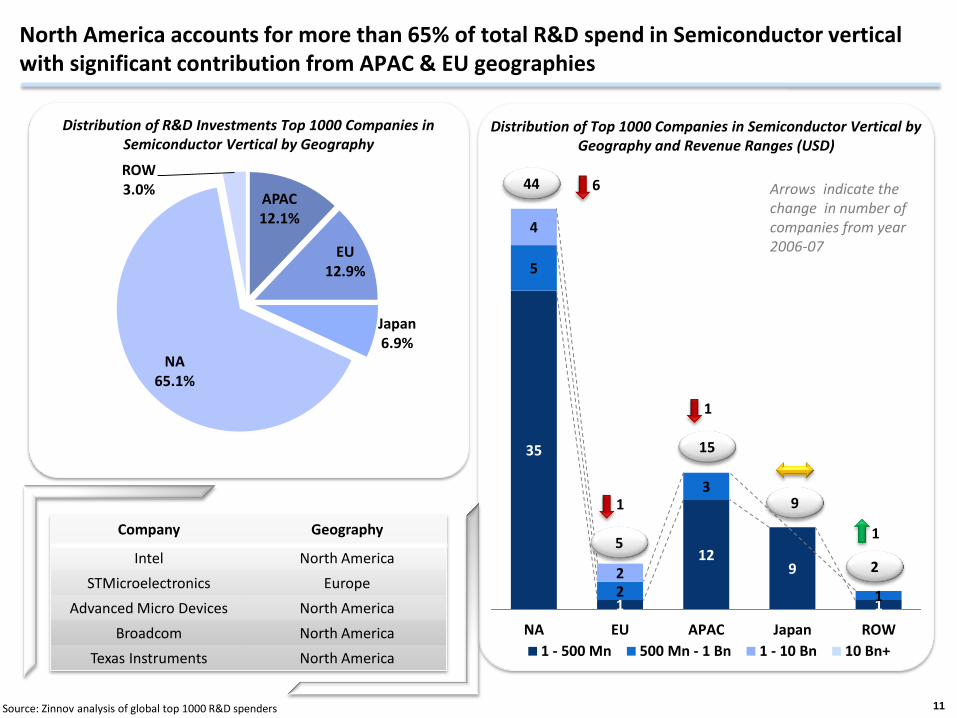
Distribution of R&D Investments Top 1000 Companies in Semiconductor Vertical by Geography
North America accounts for more than 65% of total R&D spend in Semiconductor vertical with significant contribution from APAC & EU geographies
Source: Zinnov analysis of global top 1000 R&D spenders 11
35
1
12 9
1
5
2
3
1
4
2
NA EU APAC Japan ROW
1 - 500 Mn 500 Mn - 1 Bn 1 - 10 Bn 10 Bn+
44
5
15
9
Distribution of Top 1000 Companies in Semiconductor Vertical by Geography and Revenue Ranges (USD)
APAC 12.1%
EU 12.9%
Japan 6.9%
NA 65.1%
ROW 3.0%
Company Geography
Intel North America
STMicroelectronics Europe
Advanced Micro Devices North America
Broadcom North America
Texas Instruments North America
2
6
1
1
1
Arrows indicate the change in number of companies from year 2006-07
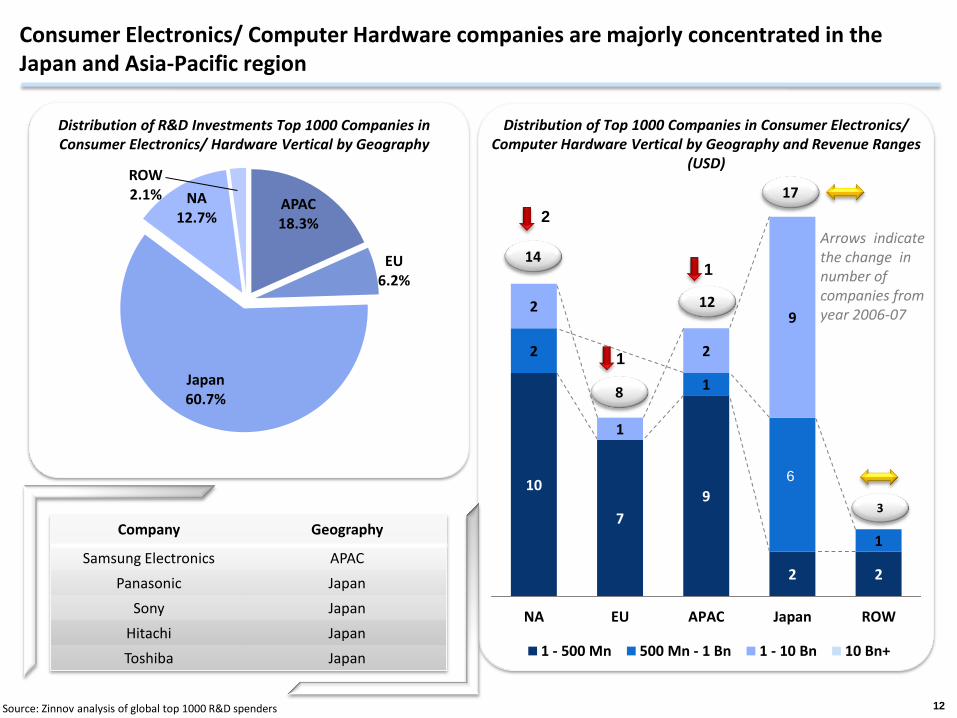
Distribution of R&D Investments Top 1000 Companies in Consumer Electronics/ Hardware Vertical by Geography
Consumer Electronics/ Computer Hardware companies are majorly concentrated in the Japan and Asia-Pacific region
Source: Zinnov analysis of global top 1000 R&D spenders 12
10
7
9
2 2
2
1
1
2
1
2
9
NA EU APAC Japan ROW
1 - 500 Mn 500 Mn - 1 Bn 1 - 10 Bn 10 Bn+
3
6
14
8
12
17
Distribution of Top 1000 Companies in Consumer Electronics/ Computer Hardware Vertical by Geography and Revenue Ranges
(USD)
APAC 18.3%
EU 6.2%
Japan 60.7%
NA 12.7%
ROW 2.1%
0.0%
Company Geography
Samsung Electronics APAC
Panasonic Japan
Sony Japan
Hitachi Japan
Toshiba Japan
Arrows indicate the change in number of companies from year 2006-07
2
1
1
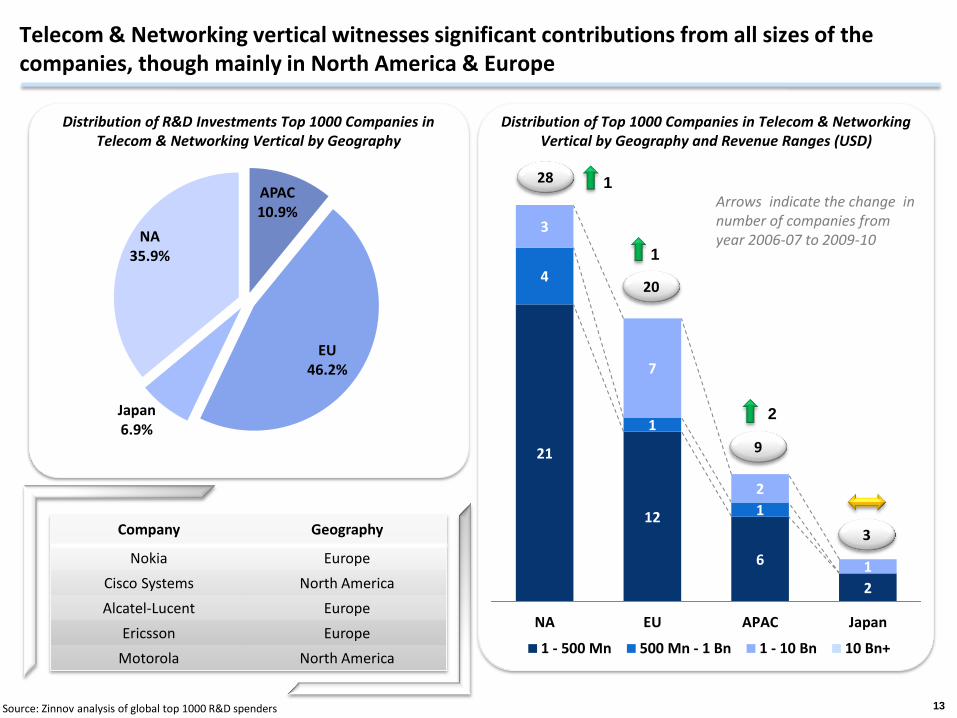
Distribution of R&D Investments Top 1000 Companies in Telecom & Networking Vertical by Geography
Telecom & Networking vertical witnesses significant contributions from all sizes of the companies, though mainly in North America & Europe
Source: Zinnov analysis of global top 1000 R&D spenders 13
21
12
6
2
4
1
1
3
7
2
1
NA EU APAC Japan
1 - 500 Mn 500 Mn - 1 Bn 1 - 10 Bn 10 Bn+
28
20
9
3
Distribution of Top 1000 Companies in Telecom & Networking Vertical by Geography and Revenue Ranges (USD)
APAC 10.9%
EU 46.2%
Japan 6.9%
NA 35.9%
Company Geography
Nokia Europe
Cisco Systems North America
Alcatel-Lucent Europe
Ericsson Europe
Motorola North America
1
1
2
Arrows indicate the change in number of companies from year 2006-07 to 2009-10
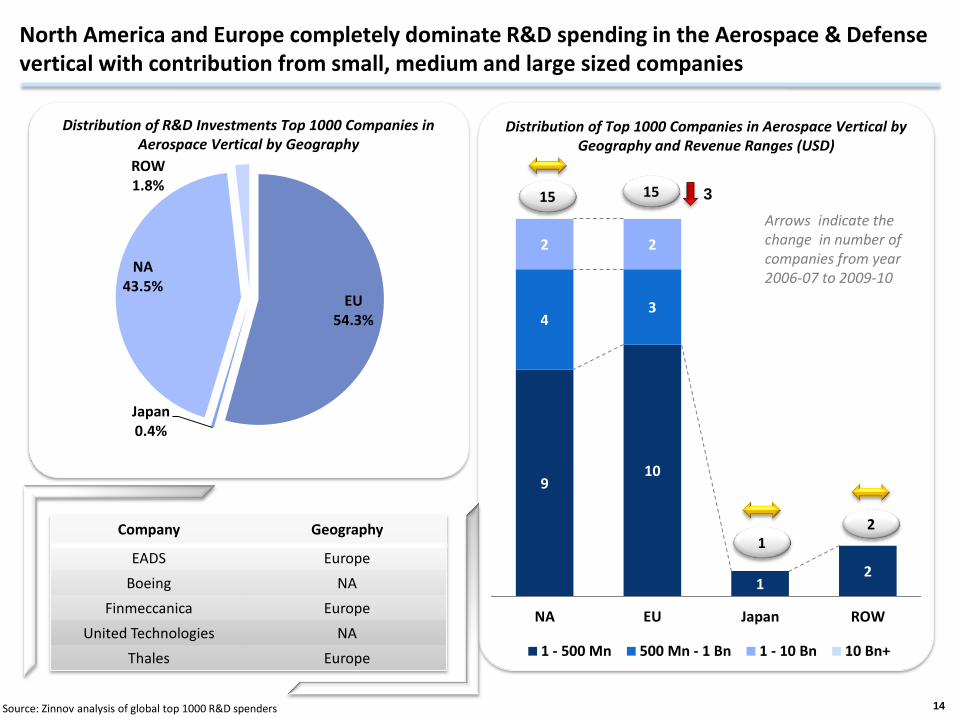
Distribution of R&D Investments Top 1000 Companies in Aerospace Vertical by Geography
North America and Europe completely dominate R&D spending in the Aerospace & Defense vertical with contribution from small, medium and large sized companies
Source: Zinnov analysis of global top 1000 R&D spenders 14
9 10
1 2
4 3
2 2
NA EU Japan ROW
1 - 500 Mn 500 Mn - 1 Bn 1 - 10 Bn 10 Bn+
2
15 15
1
Distribution of Top 1000 Companies in Aerospace Vertical by Geography and Revenue Ranges (USD)
EU 54.3%
Japan 0.4%
NA 43.5%
ROW 1.8%
Company Geography
EADS Europe
Boeing NA
Finmeccanica Europe
United Technologies NA
Thales Europe
3
Arrows indicate the change in number of companies from year 2006-07 to 2009-10
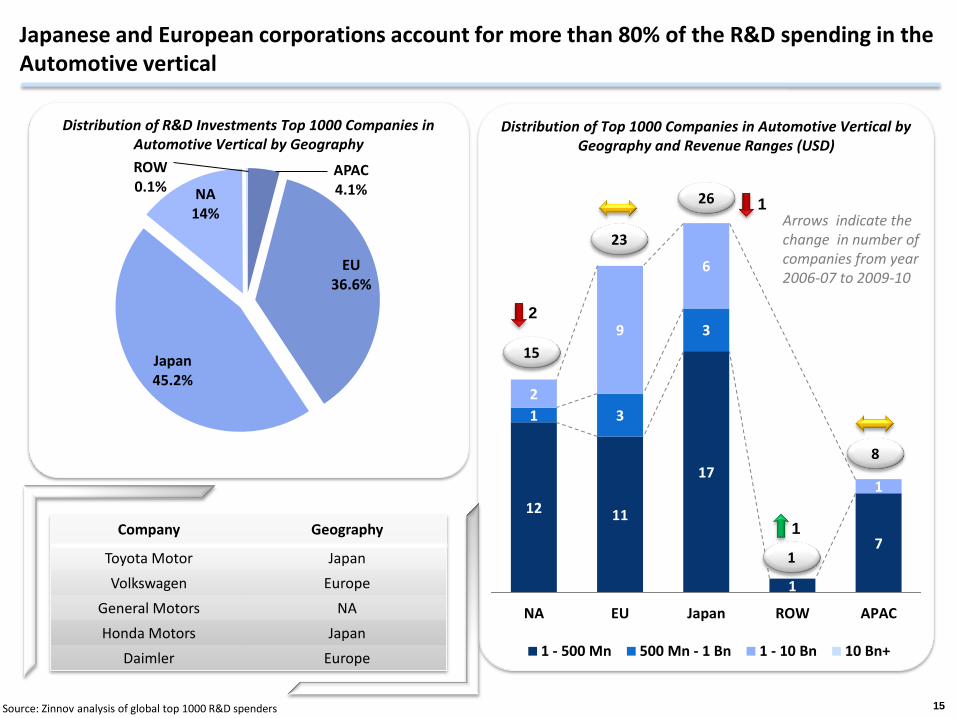
Distribution of R&D Investments Top 1000 Companies in Automotive Vertical by Geography
Japanese and European corporations account for more than 80% of the R&D spending in the Automotive vertical
Source: Zinnov analysis of global top 1000 R&D spenders 15
12 11
17
1
7
1 3
3
2
9
6
1
NA EU Japan ROW APAC
1 - 500 Mn 500 Mn - 1 Bn 1 - 10 Bn 10 Bn+
8
15
23
1
Distribution of Top 1000 Companies in Automotive Vertical by Geography and Revenue Ranges (USD)
APAC 4.1%
EU 36.6%
Japan 45.2%
NA 14%
ROW 0.1%
0.0%
Company Geography
Toyota Motor Japan
Volkswagen Europe
General Motors NA
Honda Motors Japan
Daimler Europe
26
2
1
1
Arrows indicate the change in number of companies from year 2006-07 to 2009-10