PNNL-22732 Prepared for the U.S. Department of Energy under Contract DE-AC05-76RL01830 Cost Study for Manufacturing of Solid Oxide Fuel Cell Power Systems MR Weimar LA Chick DW Gotthold GA Whyatt September 2013
Transcript
PNNL-22732
Prepared for the U.S. Department of Energy under Contract DE-AC05-76RL01830
Cost Study for Manufacturing of Solid Oxide Fuel Cell Power Systems MR Weimar LA Chick DW Gotthold GA Whyatt September 2013
PNNL-22732
PNNL-22732
Cost Study for Manufacturing of Solid Oxide Fuel Cell Power Systems
Mark Weimar Larry Chick
David Gotthold Greg Whyatt
Pacific Northwest National Laboratory
August, 2013
PNNL-22732
Executive Summary
Solid oxide fuel cell (SOFC) power systems can be designed to produce electricity from fossil fuels at extremely high net efficiencies, approaching 70%. However, in order to penetrate commercial markets to an extent that significantly impacts world fuel consumption, their cost will need to be competitive with alternative generating systems, such as gas turbines. This report discusses a cost model developed at PNNL to estimate the manufacturing cost of SOFC power systems sized for ground-based distributed generation. The power system design was developed at PNNL in a study on the feasibility of using SOFC power systems on more electric aircraft to replace the main engine-mounted electrical generators [Whyatt and Chick, 2012]. We chose to study that design because the projected efficiency was high (70%) and the generating capacity was suitable for ground-based distributed generation (270 kW). The electricity costs for a mass manufactured solid oxide fuel cell could be competitive with centralized power production plants with costs estimated to be in the $0.07-0.08/kWh range based on a cost model using a standard approach to manufacturing solid oxide fuel cells. A process flow sheet was developed to understand the steps required to manufacture the units, as well as to estimate the materials, equipment, and labor required to make them. Equipment was sized to meet a production volume of 10,000 units per year. Appropriate material and equipment prices were collected. A sputtering approach was also examined using the model to project the decreases in costs associated with the process. The process not only reduces material costs but increases the power density of the fuel cell by 50%. The increased power density reduces the number of repeat units required to make up the 270 kW fuel cell stack. Stack costs decreased by 33%. However, due the BOP and the remainder of costs associated in power system manufacturing and installation, the cost of electricity was only reduced by $0.002/kWh. In addition, to the 10,000 units per year production scale model was adjusted to reflect the costs of production at 50, 250, 1000 and 4000 units of production per year. Material prices were adjusted to reflect purchase levels. Machinery and labor were adjusted to reflect the production scale.
PNNL-22732
Introduction Solid oxide fuel cell (SOFC) power systems can be designed to produce electricity from fossil fuels at extremely high net efficiencies, approaching 70%. However, in order to penetrate commercial markets to an extent that significantly impacts world fuel consumption, their cost will need to be competitive with alternative generating systems, such as gas turbines. This report discusses a cost model developed at PNNL to estimate the manufacturing cost of SOFC power systems sized for ground-based distributed generation. The power system design was developed at PNNL in a study on the feasibility of using SOFC power systems on more electric aircraft to replace the main engine-mounted electrical generators [Whyatt and Chick, 2012]. Figure 1 is a drawing of the proposed system, which is described in detail in Whyatt and Chick, 2012. That study showed that the SOFC systems would likely be too heavy for the fuel savings to justify the added weight. However, because the projected efficiency was high (70%) and the generating capacity was suitable for ground-based distributed generation (270 kW), we chose the design for the cost study.
Figure 1. CAD drawing of 270kW SOFC power system described in Whyatt and Chick,
2012. The system is approximately 10 feet long and 2 feet in diameter. The more electric aircraft power system design was based on a small-scale prototype system that was demonstrated at PNNL [Powell et al. 2012]. The demonstration system, fueled by methane, used adiabatic steam reforming and anode recycle to achieve high efficiency. While the demonstration system was operated at ambient pressure, experiments at PNNL have demonstrated that significant benefits would be obtained by operating the power system at elevated pressure [Chick et al. 2012]. The power density (W/cm2 active cell area) increased by ~80% by increasing the pressure from one to eight atmospheres. The resulting decrease in the number of cells required will more than offset the cost of the pressure vessel. The power system is designed so that the energy necessary to compress the cathode air to eight atmospheres is obtained by combusting and expanding the anode purge stream [Whyatt and Chick, 2012].
Stacks (6)
Steam Reformer Sections (5)
Anode Recycle Pump (insulated with cooling jacket)
Burner
Compressor/Expander
Anode Exit Header
Anode Inlet Header
Cathode RecuperatorExhaust Exit
Air Inlet
Fuel Introduction and Mixing
Anode Purge Line
Fuel Pumps and Motor Controller (exterior of vessel, location TBD)
Cathode Exit Header
PNNL-22732
In order to discern whether economies of large-scale power system production would lower the cost of electricity sufficiently to significantly penetrate commercial markets, we based the estimate on production of ten thousand power systems per year or 2.7 gigawatts installed per year. In addition, the study was extended to evaluate the reduced costs associated with a potential innovation in the manufacturing process: sputtering. The approach discussed in more detail in a later section replaces many manufacturing steps and reduces the number of firings and in turn lowers manufacturing costs but also increases the cell power density by as much as 50%. Thus, two separate manufacturing cost estimates were developed for the SOFC system: the standard production process and a manufacturing process for sputtering. A process flow sheet was developed for each of manufacturing processes and a corresponding major machinery layout was developed to understand the flow of products throughout the manufacturing facility. The primary focus of the costing effort was on the development of the stack, while less emphasis was placed on costing the balance of plant (BOP). The BOP is described in Whyatt and Chick, 2012.
SOFC Stack Design
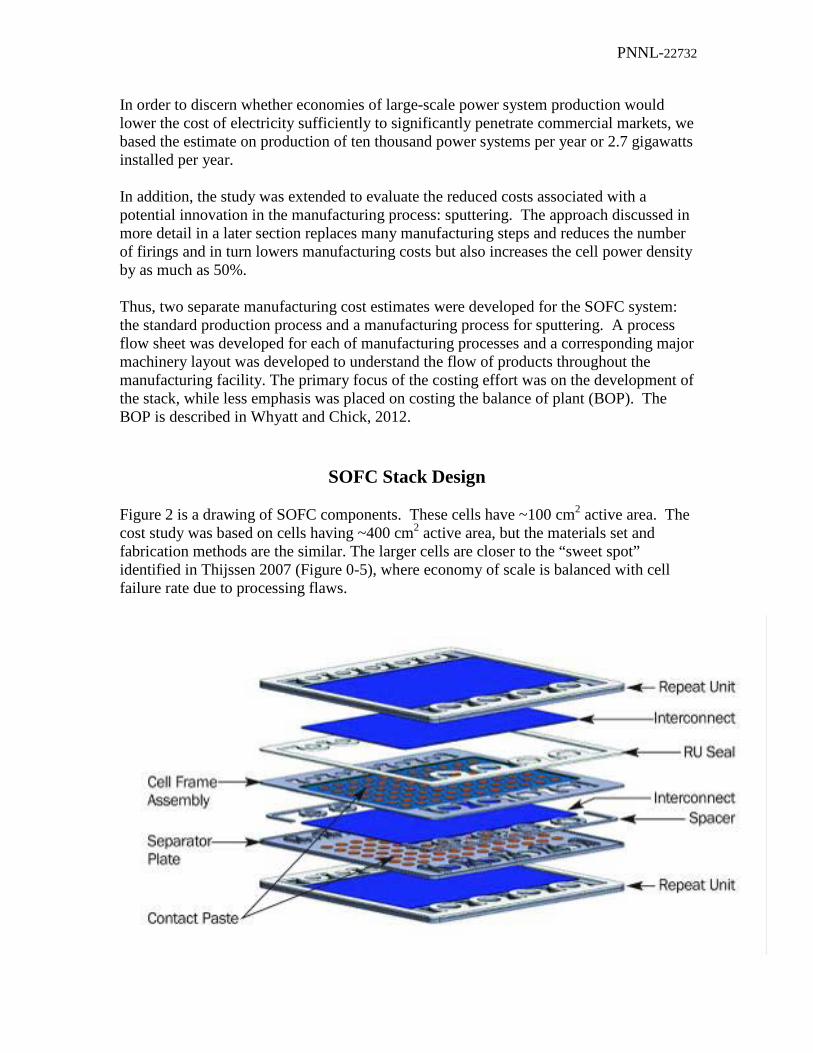
Figure 2 is a drawing of SOFC components. These cells have ~100 cm2 active area. The cost study was based on cells having ~400 cm2 active area, but the materials set and fabrication methods are the similar. The larger cells are closer to the “sweet spot” identified in Thijssen 2007 (Figure 0-5), where economy of scale is balanced with cell failure rate due to processing flaws.
PNNL-22732
Figure 2. SOFC repeat unit components
The figure shows three repeat units, with an exploded view of the middle one.
Process Flow Diagrams for Stack Manufacturing (L) The process flow diagram for the standard manufacturing approach is shown in Figure 3. The steps are color coded and the key in the upper-right corner relates the colors to specific sections in the following process descriptions. Figure 4 is the process flow diagram for the approach using sputtering.
PNNL-22732
Figure 3. Process flow diagram for standard approach
PNNL-22732
Figure 4. Process flow diagram for approach using sputtering
Standard Production Process
Based on the power density expected from the cells made by the standard process, about 36,000 cells must be made per day (three shifts, 310 days/year) in order to produce 10,000 power systems per year. The chemical vendors shown in the following tables are those used for our laboratory scale development processing. For the cost model, prices from vendors that supply bulk quantities were used. For the results shown in the tables no materials wastage was assumed. However, in costing the materials needed, a 10% wastage was assumed.
PNNL-22732
The furnace heating schedules listed below were developed in the laboratory and are very conservative. For the cost study, furnaces were sized based on experience of the vendors and the heating rates were generally much more aggressive. The cells are made by laminating and firing six cast tapes, followed by successively screen printing and firing three more layers. The component layers are, from the bottom:
Tape Casting Tape casting starts with preparation of a slurry containing the ceramic powder(s), pore formers, dispersant, binder, plasticizer and solvent(s). The batch is blended in a ball mill for 12 hours. Tables 1 through 4 list the materials and chemicals used and their proportions in units of grams per cell. Whereas the active area of each cell is 403 cm2, the area of the entire cell is 460 cm2, including a cathode-free boarder, which is about 9 mm wide to accommodate an electrically insulating gap and a glass-sealing surface.
Table 1. Components of anode backing layer tape casting slurry
Table 2. Components of bulk anode tape casting slurry
Table 3. Components of active anode tape casting slurry
Table 4. Components of electrolyte tape casting slurry
After ball milling the tapes are cast. The bulk anode is composed of three tape layers. The g/cell numbers in Table 2 include materials masses for the three bulk anode tapes combined. The wet cast slurry passes through a drying hood in which the solvents evaporate, leaving the flexible tapes. The six tapes are stacked and then bonded together by running the stack through a hot roll laminator. The laminated tape is then laser cut to the proper dimensions to make the cell blanks. The tape casting slurries are all prepared by weighing the components into a ball mill and milling for 12 hours. Ball Mills Bulk anode requires 7505 kg of slurry per day, 3753 kg per ball mill load. Ball Mill: 5 ton capacity, 37 kW, with yttria-stabilized zirconia lining and milling media. The other tape cast components are active anode (431 kg/day), backing layer (393 kg/day) and electrolyte (420 kg/day). These each require 0.5 ton capacity, 7.5 kW, with yttria-stabilized zirconia lining and milling media. They will each require one load per day. Tape Casting Machines Information was based on discussions with a leading vendor of large tape casting machines. The vendor estimated we would need four 100 foot long machines for the bulk anode tapes (~$1.2M each). These cast 52 inch wide tapes and run at 120 inches per minute. The required drying time was estimated at 10 minutes using under-bed heaters and forced air. For the thinner tapes (backing layer, active anode and electrolyte) the vendor recommended three 50 foot long machines (~$670K each). Laser Cutter
The laser cutter was estimated at $22K by a vendor. Only one is required. The laminator was not explicitly costed. Bi-Layer Sintering and Inspection The cell blanks are stacked on kiln furniture and fired in air to 1375°C using the furnace schedule shown in Table 5.
Table 5. Firing schedule for bi-layers
Segment Rate/Time Temperature Ramp 0.5°/min 190°C Hold 2 hr 190°C
Ramp 0.5°/min 450°C Hold 1 hr 450°C
Ramp 3°/min 1375°C Hold 1 hr 1375°C
Ramp 5°/min Ambient The fired bilayers are inspected for pinholes in the electrolyte. They are wiped with alcohol (isopropyl), which wicks through any pin holes and stains the underlying electrolyte. This process could be automated, with the defective parts optically detected. Bi-Layer Sintering Furnaces Estimates were obtained from a leading manufacturer of continuous “pusher”-type furnaces. Our laboratory-developed debinding and firing schedule (above) is excessively long for large-scale production. The vendor stated, “We have a tremendous amount of experience with debinding of various ceramic bodies and sintering. Very often the ratio of debinding to sintering is 2:1 or in cases of difficult binders is 3:1.” He assumed 3:1 to estimate the furnaces. He recommended 16 furnaces each 95 feet long. These cost $750,000 each. Robotics Estimates for pick-and-place robots to load and unload the bi-layer sintering furnaces were obtained. Each was $165K. Equipment to inspect the bi-layers was not specifically costed. Glycine-Nitrate Powder Synthesis Three oxide ceramic materials will be synthesized in-house by glycine-nitrate combustion synthesis (GNP). These are the barrier layer, Ce0.80Sm0.18Fe0.02O2, the cathode, La0.6Sr0.4Co0.2Fe0.8O3 and the spinel, Mn1.5Co1.5O4. The raw materials are metal carbonates, which are dissolved in nitric acid. Glycine is added and the solution is heated to boil off water. Eventually the solution ignites and burns, producing ash, which is the desired material. As discussed below, the barrier and cathode materials would be made into ink and screen printed. The spinel would be made into a slurry and sprayed onto
PNNL-22732
metal parts. The synthesis would be carried out in a custom made machine (developed by PNNL) similar to a small rotary kiln. Equipment for Combustion Synthesis Our GNP reactor, built in 1992 produced 1.2 kg/hr (2.64 lb/hr), which is big enough to make the barrier layer powder, if operated three shifts per day. Instead, we assumed that a scaled up version would be built and we’d use it to make all three powders. Each powder would have a dedicated bag house. The machine would be connected to the appropriate bag house each shift. Total capital cost for the entire system was estimated to be $650K. Screen Printing Screen printing inks are prepared by mixing in a three-roll mill. Compositions are shown in Tables 6-8.
Table 8. Components of cathode metallization ink Metallization Grams per
460 cm2 Cell Single component electrode paste, 52% solids, Ag (Ferro EL44-016) 3.237 The printing screen with the pattern to be printed is placed over the cell and the ink is squeegeed across the screen to fill the pattern. The screen printed parts are dried at 80°C for ½ hour before firing. The prints parts are then fired air using the furnace schedules listed in Tables 9-11.
Table 9. Firing schedule for barrier layer
Segment Rate/Time Temperature Ramp 3°/min 1225°C Hold 2 hr 1225°C
Ramp 5°/min Ambient
Table 10. Firing schedule for cathode
Segment Rate/Time Temperature Ramp 3°/min 1000°C
PNNL-22732
Hold 1 hr 1000°C Ramp 5°/min Ambient
Table 11. Firing schedule for metallization
Segment Rate/Time Temperature
Ramp 3°/min 1000°C Hold 1 hr 1000°C
Ramp 5°/min Ambient
Three-Roll Mills Discussions with a vendor indicated the barrier ink and metallization would each require a 6” x 12” mill, $21K. Cathode ink would require a 9” x 26” mill, $51K. Screen Printing Machines An automated screen printer vendor specified devices to load the pusher furnaces, unload the furnaces, load cassettes with parts to be printed, perform the screen printing and then load the next pusher furnace. Each screen printing/firing step (barrier, cathode and metallization) would require six parallel lines. Each barrier coating line was estimated at $245K plus furnace. Each cathode and metallization line was estimated at $265K plus furnace. Pusher Furnaces for Firing Prints For the three printing steps, with six parallel lines each, the furnace vendor recommended a total of 24 pusher furnaces each 93 feet long. Each would cost $750K. Steel Parts Each repeat unit contains two main steel parts, the cell frame and the separator plate. These are stamped from 0.012” thick ferritic stainless steel, either 430 or 441 alloy. The blanks are appx. 32.5 x 24.4 cm and weigh 180.5 grams. Gas manifold ports are stamped out of each piece. This results in scrapping about 5.2% of each. The frame also has a cell cavity stamped out. This results in scrapping an additional 55.2% of each frame. So, 361 grams of stainless steel must be purchased for each repeat unit and of that 32.8% is scrapped. Smaller anode cavity spacers are also stamped from 430 or 441 alloy. We can assume they would be stamped from the scrap that is produced when the cell cavity is removed from the cell frame. These spacers do not require coatings. We assume these spacers, which encircle the anode inlet and outlet ports, are formed as two “trees”, one for the inlet ports and one for the outlet ports. These steel parts would be made in one die stamping press, estimated at $320K, which can do 600 strokes per minute. Three sets of tooling would be made for the separator plate, cell frame and anode spacers. The same press would be used to make the stack
PNNL-22732
current collectors and load frame (see section on Manifold, Current Collectors and Load Frame). Flow Fields Flow fields are 430 or 441 steel parts that are photochemically etched using ferric chloride. They make multiple point contact to the adjacent structures, but provide flow channels for the anode and cathode gasses. Both flow fields are etched from 40 mil thick blanks 5.7 x 11.2 inches. Both sides of the cathode field must be coated with the MnCo spinel (see below). The anode flow field is electroplated with nickel. Photochemical Machining Equipment Quote was obtained from a manufacturer of etching equipment. He recommended making the pieces with two etching passes of 25 minutes and 15 minutes. The machines are composed of a series of dual primary etch modules (DPEM). A total of 8 machines would be required, composed of 80 DPEMs. Additionally, equipment is needed to rejuvenate the etchant with HCl and sodium chlorate, develop and later strip the photo-activated polymer resist and chemically clean the parts. Total capital cost was $9.2M. The electroplating equipment was not explicitly costed. Coatings for Steel Parts After stamping, both steel parts must be coated on the cathode side to prevent chrome from volatilizing and poisoning the cathode. The area of the separator plate that covers the cell, appx. 438 cm2, must be coated with Mn1.5Co1.5O4 spinel, which is electrically conductive. The cathode flow field must also be coated with the spinel. The periphery of both parts must be coated with alumina, Al2O3, which is electrically insulating, but prevents chrome volatility and adheres well to the sealing glass. The anode sides of these pieces require no coatings. Al2O3 Coating: A slurry spray approach has been developed by the SECA Core program at PNNL. After the parts are sprayed and dried, 0.00345 grams of Al and binder have been added per cm2 of coated surface. The Al coated area of the frame is 314 cm2. The Al coated area of the separator plate is the same. The components of the Al coating slurry are listed in Table 12. These figures are based on coupon experiments and assume zero wastage.
Table 12. Components of Al coating slurry
After coating and drying, the pieces require heating to 1000°C in air for 1 hour to form the Al2O3 coating and bond to the substrate. After firing the coating is wire brushed to remove loose particles.
Mn1.5Co1.5O4 Spinel Coating: This slurry spray process is less well-developed. However, we do have some key knowledge and can suggest two different approaches to large-scale production: First, it has been demonstrated that, if the particles in the applied slurry are the spinel oxide, Mn1.5Co1.5O4, they will not sinter to form a high density coating in air. The slurry coated pieces must first be heat-treated in a reducing atmosphere (2% H2) at 850°C for ½ hour. This causes the spinel to phase-separate into Co metal and MnO2, which when heated in air at 1000°C for 1 hr will densify nicely. A second approach, which has not been tried, would be to combine Co metal and MnO2 powders in the slurry mix, spray coat and heat in air. However, it has been pointed out the Co metal powders with acceptable particle size for this process may be so much more expensive than the spinel powder that the H2 heat treatment (first process) is justified. We chose the first approach for the cost study. There is also some doubt as to the optimum thickness of the spinel coating. There is some evidence that the area-specific electrical resistance of the spinel improves with thickness. For this cost study, we assume 5 microns would be sufficient. Therefore, the coating would be 0.0027 grams per cm2 over the 438 cm2 area on each separator plate. Ball Mill Two 0.5 ton capacity ball mills are needed, one for the alumina and one for the spinel (~$10K each). Sprayers Sprayers were not explicitly costed. Furnaces Quotes were obtained for the reducing furnace and the oxidizing furnace The reducing furnace was $465K and the oxidizing furnace was $555K. One reducing furnace is needed for the spinel. Two oxidizing furnaces are needed, one for the alumina and one for the spinel. Cassette Fabrication and Glass Sealing There are two glass sealing operations, one to seal each cell into its frame, which can be done piece-by-piece and one to seal all of the repeat units together to form the stack. It is assumed that the glass seal material would be applied as a paste by a robotic dispenser. The estimated amounts of materials for the glass seals per repeat unit are listed in Table 13. The target seal dimensions are 5 mm width and 0.3 mm thick.
PNNL-22732
Table 13. Components of glass seal paste
Three-Roll Mill A 9” x 26” three-roll mill ($51K), as used to make the cathode ink, is appropriate to make the glass sealing paste. Cell-to-Frame Sealing A bead of glass sealing paste is applied to the edge of the cell by a low-cost two-axis robot. The pasted pieces are then dried in air at 80°C for one hour. Next the cell is placed onto the frame and a weighted plate is placed onto the cell. The pieces would then enter a belt furnace and be heated in air according to the schedule shown in Table 14. Pick-and-place robots would be used to load and unload the belt furnace.
Table 14. Heating schedule for sealing cells into frames
Segment Rate/Time Temperature
Ramp 3°/min 600°C Ramp 5°/min 875°C Hold 1 hr 875°C
Ramp 15°C/min 50°C Drying Belt Furnace The low-temperature belt furnace was not explicitly costed. Furnace The oxidizing furnace discussed in the metals coating section ($555K) is suitable for this glass sealing step. Robotics The estimate for pick-and-place robots to load and unload the furnaces was $165K each. The two-axis glass applicator robots were not explicitly costed. Repeat Unit Fabrication The cathode flow field is brazed to the cathode side of the separator plate. First metallization paste is robotically dispensed onto the separator plate. This is the same composition shown in Table 8. Assume the amount needed for this step is about 20% of that needed to metalize the cathode, or about 0.65 grams per repeat unit. Next the flow field is placed onto the separator plate. A weighted plate is placed onto the flow field and the assembly is run through a belt furnace. The heating schedule is listed in Table 15.
Table 15. Heating schedule for brazing cathode flow field to separator plate
Segment Rate/Time Temperature
Ramp 20°/min 1000°C Ramp 20°/min 50°C
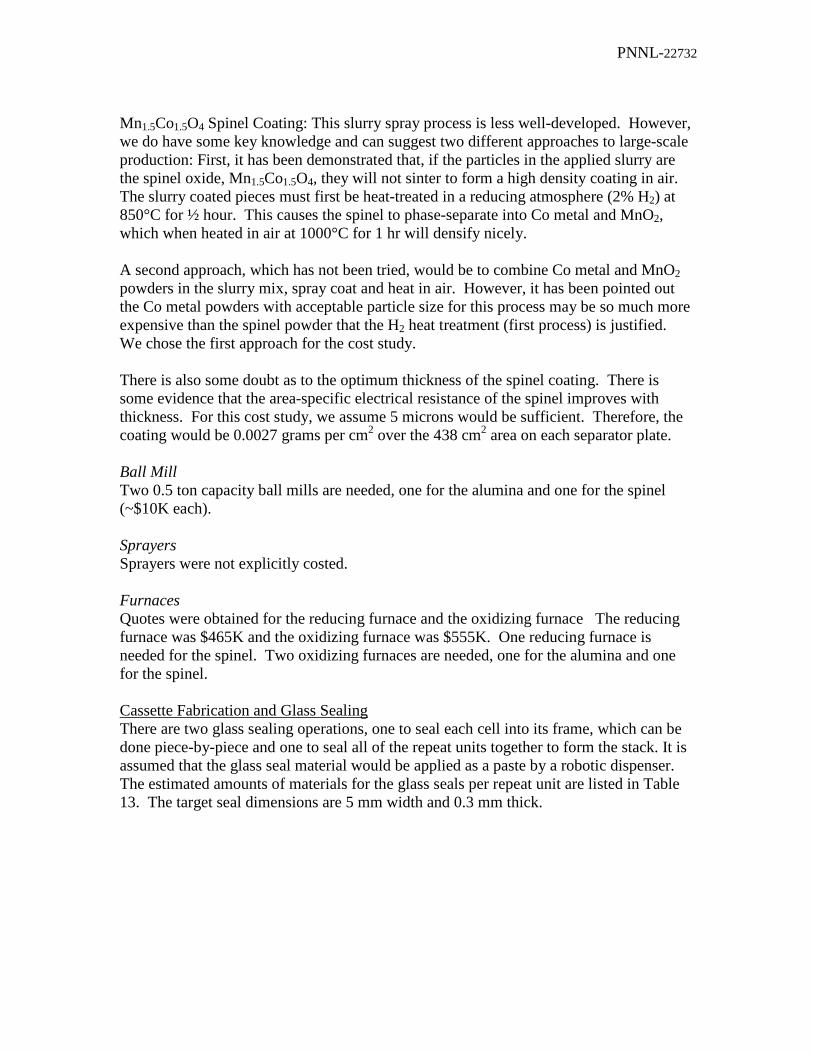
Next the inlet and outlet spacer trees are laser tack welded to the anode side of the separator plates. The anode flow field is laser tack welded to the separator plate. Ni contact paste is applied robotically to the cell anode. While the paste is still wet, the cell-in-frame is placed onto the separator plate assembly and the two are laser welded together. The components of the Ni contact paste are the same as listed in Table 8, with Ni substituted for Ag. Furnace The reducing furnace discussed in the metals coating section ($465K) is suitable for this glass sealing step. Robotics Four pick-and-place robots ($165K each) would be required to load and unload the furnace and to place the anode spacers and anode flow fields. Manifold, Current Collectors and Load Frame Figure 5 is a CAD drawing of a completed stack. Masses of the balance-of-stack components are listed in Table 16. We assume all parts are 430 or 441 SS. The load frame and current collectors are stamped sheet steel. The manifold is cast followed by some machining. The inside of the cathode side of the manifold must be coated with aluminum slurry and oxidized in air to form and alumina coating. It was assumed that these few parts can be fired in one of the oxidizing pusher furnaces used to make repeat units. The die press costed out in the section on steel repeat unit parts would be used to make the current collectors and load frame.
PNNL-22732
Figure 5. Stack assembly.
Table 16. Manifold, Current Collectors and Load frame
Component Material Mass (kg) Manifold 430 or 441 SS 19.30
Load Frame 430 or 441 SS 6.20 Lower Current Collector 430 or 441 SS 1.96 Upper Current Collector 430 or 441 SS 2.22
Casting Costs Cost of the cast manifold was estimated using the SEER for Manufacturing Software (Galorath. 2010.)
Stack Assembly, Sealing and Acceptance Testing The repeat units are stacked up on a cast steel manifold in a frame, the components of which are described in the next section. A current collector plate is attached to the top. The top of the load frame is attached and the assembly is loaded into a furnace. A load of 82 lbs is applied to the top of the stack. The stack is then heated according to the schedule shown in Table 17 with air flowing through both the anode and cathode cavities. During this process, the binder burns out of the glass paste, the glass softens and flows and the repeat units are compressed together and sealed.
Load Frame
Repeat Units
Manifold
Upper Current Collector
Lower Current Collector
PNNL-22732
Table 17. Heating schedule for sealing a stack
Segment Rate/Time Temperature Ramp 3°/min 600°C Hold 1 hr 600°C
Ramp 5°/min 875°C Hold 4 hr 875°C
Next the furnace temperature is lowered to 750°C at 5°C/min and reducing gas (~2% H2 in N2) is flowed through the anode cavities for 2 hrs to reduce the NiO to Ni metal. The stack is now ready for electrochemical acceptance testing. The anode is supplied with a mixture of 50% H2 and 50% N2 and an I-V curve and a fuel utilization curve are taken. These tests require no more than one hour to complete. The furnace is then cooled to ambient at 5°C/min. The furnace is opened, the load frame is bolted down and the stack is removed and is ready for installation into the power system. The entire heating, reducing, testing and cooling procedure is estimated at 14.9 hours. The remaining 9 hours of each day would be devoted to loading and unloading the furnaces. Batch furnaces for Stack Assembly, Sealing and Acceptance Testing It was assumed that six stacks can be assembled in each batch furnace. Each furnace would be loaded and unloaded by a pick-and-place robot. Thirty two such furnaces, each with a robot would be required. Each robot was $165K, as above. The vendor quoted the basic furnace at $175K each. Adding a load frame, gas manifolding, mass flow meters and electrical load bank and test equipment for each furnace was estimated to add another $100K. Each of the thirty two build stations would be $440K.
Production Process Utilizing Sputtering As discussed above, after the bi-layers are sintered, the standard process requires sequential screen printing, firing and cooling of three more layers. In all, these steps require 18 high temperature pusher furnaces. The process discussed in this section would use sputtering to apply these layers. The electrolyte would also be applied by sputtering. Comparing the process flow diagrams, Figures 3 and 4, the Screen Printing steps are eliminated in Figure 4. These steps are replaced by production of sputtering targets and by the sputtering step. Although much equipment was eliminated in going to the sputtering process, by far the majority of the projected cost savings was due to a projected 50% increase in cell power density due to elimination of undesired porosity in the barrier layer and to thinning the electrolyte down to 1 micron.
PNNL-22732
New process flow and performance improvements In the new process flow, the goal would be to deposit a subset of the ceramic layers using sputtering to reduce the number of firing steps, reduce the overall material consumption by enabling thinner layers, and improving the power density to reduce the total amount of cell area in a system of given power. Figure 6 shows the multiple implementation options that are possible, though for this cost study, the focus was on the first stage (hybrid sputter process), where the stack is partially deposited using traditional tape casting and partially sputtered.
A key factor in this sputtering process was that the individual layer thicknesses would be reduced and an increase in power density would be achieved. The electrolyte in current cells is ~8 µm simply because it is very difficult to prepare thinner layers by tape casting. Based on measured cell performance and the known ionic resistivity of YSZ and Sm0.2Ce0.8O2 barrier layer, we calculate that decreasing the thickness of the electrolyte from 8 µm to 1 µm and the barrier layer from 5 µm to 1 µm would increase the power density by 7% at 650°C and 9% at 800°C. This effect of decreasing the ionic resistance is mostly due to thinning the electrolyte. A much bigger improvement comes from eliminating the unintentional porosity in the barrier layer, which would increase performance by 40%. The combined effects of thinning the electrolyte-barrier layer and producing a fully dense barrier layer can reasonably be expected to increase power density by about 50%. Based on these improvements in power density, it was estimated that the amount of cells needed per system would be reduced from 1009 to 673, which lead to 6.7M cells required
Figure 6: Schematic representation of cell fabrication process with varying level of sputter process integration.
Metallization
Cathode
Barrier
Sinter
Sinter
Sinter
Sinter
Tape
Cas
t and
Scr
een
Prin
t
StandardProcess
YSZ/Ni anode
YSZ/Ni support
YSZ Electrolyte
Metallization
Cathode Barrier (dense)
Sinter
Tape
Cas
t Sp
utte
r
HybridSputterProcess
YSZ/Ni anode
YSZ/Ni support
YSZ Electrolyte
Metallization
CathodeBarrier (dense)
Sulfur resistant anode
YSZ/Ni support
Sinter
Tape
Cas
t Sp
utte
r
SulfurResistant
Stack
YSZ Electrolyte
Sulfur resistant anode
Metal support
Bond
Sput
ter
Metallization
CathodeBarrier (dense)
Sacrificial Deposition
Support
Full SputterProcess
YSZ Electrolyte
Metallization
Cathode
Barrier
Sinter
Sinter
Sinter
Sinter
Tape
Cas
t and
Scr
een
Prin
t
StandardProcess
YSZ/Ni anode
YSZ/Ni support
YSZ Electrolyte
Metallization
Cathode
Barrier
Sinter
Sinter
Sinter
Sinter
Tape
Cas
t and
Scr
een
Prin
t
StandardProcess
YSZ/Ni anode
YSZ/Ni support
YSZ Electrolyte
Metallization
Cathode Barrier (dense)
Sinter
Tape
Cas
t Sp
utte
r
HybridSputterProcess
YSZ/Ni anode
YSZ/Ni support
YSZ Electrolyte
Metallization
Cathode Barrier (dense)
Sinter
Tape
Cas
t Sp
utte
r
HybridSputterProcess
YSZ/Ni anode
YSZ/Ni support
YSZ/Ni anode
YSZ/Ni support
YSZ Electrolyte
Metallization
CathodeBarrier (dense)
Sulfur resistant anode
YSZ/Ni support
Sinter
Tape
Cas
t Sp
utte
r
SulfurResistant
Stack
YSZ Electrolyte
Metallization
CathodeBarrier (dense)
Sulfur resistant anode
YSZ/Ni support
Sinter
Tape
Cas
t Sp
utte
r
SulfurResistant
Stack
YSZ Electrolyte
Sulfur resistant anode
Metal support
Bond
Sput
ter
Metallization
CathodeBarrier (dense)
Sacrificial Deposition
Support
Full SputterProcess
YSZ ElectrolyteSulfur resistant
anode
Metal support
Bond
Sput
ter
Metallization
CathodeBarrier (dense)
Sacrificial Deposition
Support
Full SputterProcess
YSZ Electrolyte
PNNL-22732
per year. The sputtering process is not as efficient in area as, for example, ink-jet printing. Each substrate must be mounted in a carrier, or platen, that holds multiple substrates as they move through the system. For the standard cell size of 296.4mm x 155.2mm, an optimal packing of 8 across and 2 down gives a total platen size of approximately 1.28m by 0.6m. This corresponds very well to the current standard for thin film solar panels of 1.2x0.6m and ensures that similar equipment can be used. Using 6.7M total substrates/year, 16 substrates/platen, and 0.768m2/platen and factoring in 90% yield; the approximate capacity demand is 357k m2/year, which is quite low for a typical sputtering line, so the added complexity of the process should align well. Process Equipment The major piece of process equipment needed would be the sputtering deposition itself. Because sputtering systems are typically highly customized for substrate size, process and throughput; getting a precise system cost was difficult without a final process. However, solar processing systems provide a reasonable baseline as they have similar throughputs, multiple layers and (in the case of the TCO layer) complex oxides. Figure 7 shows a typical multi-chamber sputtering system designed for solar thin film deposition (in this case, a transparent conductive oxide, or TCO, layer.) This system platform can be configured with a range of modules for different materials, rates, and layers. For a system designed for TCO deposition, prices range from $6.5M to $11M for throughputs from 400k to 1.6M square meters per year. Because the multi-layer SOFC process is more complex and has thicker layers, a specifically designed system would have more deposition modules and a lower throughput than a standard TCO system. Based on a four layer oxide process, compared to a single ITO layer, the throughput would be cut by 4. In addition, the layers are thicker for the SOFC process, 1-4µm each, compared to ~1µm for typical ITO layers. Combining these reductions gives an overall reduction in throughput of approximately a factor of 8 to 10. Therefore, to achieve the targeted 357,000 m2/year, two systems capable of 1.2-1.6M m2/year of ITO provides a useful reference. Systems in this class have an unadjusted initial capital cost around $8-9M. After discussions with people familiar with system design, we estimate that a full system optimized for SOFC stack deposition would cost approximately 50-100% more, or $12-18M in order to achieve a throughput of 357 k m2/year. Higher throughputs
Figure 7: Multichamber sputtering system, typical of systems used for thin-film solar deposition [Von Ardenne]
PNNL-22732
could be achieved with sub-linear price increases, but for manufacturing optimization, multiple tools are desirable to better manage both planned and un-planned downtime. Using these approximations and the fact that a fully sputtered structure has not yet been demonstrated, we conservatively based the capital cost on two $15M systems. Additional costs of $330k/system ($660k total) are added to provide for robotic loading and unloading of the platens. This was based on a cost estimate from a robotics vendor of $165k for a pick and place robot, with one robot at each end of the deposition system. For sputtering, targets of the required materials are needed for deposition (Figure 8). The specifics of making these targets are discussed below. The total number of targets can be estimated as follows. The cost model addressed each layer independently, but the overall calculation was the same. For each material, several parameters are specified, including : film thickness, deposition utilization (percentage of material that reaches the platen), target utilization (percentage of target material that can be consumed before the target must be replaced) and target reclaim (percentage of used target material that can be reused). These values can vary depending on the type of material, the ease of recycling, and the target design. Using the barrier layer as an example, the target thickness is 1µm and the deposition utilization was assumed as 70%, which is conservative for a 1.3m wide substrate. The assumed target consumption was 50%, which should be achievable with either a planar or rotary magnatron system and does not account for additional O2 that can be added during the process to counter the uneven sputtering yield of Ce and O. The reclamation rate was estimated to be 75% (of the remaining 50% left on the target). The layer thickness, combined with the film porosity (in this case 0% as a fully dense barrier is desired) and density (7.13g/cm3) gives a usage density of 10.2g/m2. By combining these, a total of 7.2g/m2 is used in coating the platen with the 16 substrates and using the 70% deposition utilization, 10.2g of target would be consumed for every m2 produced. Typical targets are the same width as the platen (1.28m) and are around 10cm wide and 2cm thick. Combining this with the material density (7.13g/cm3 for CeO) the total mass per target can be calculated, in this case 9.14kg. Then, by combining with the amount of target that can be effectively used (50%), the total used material per target can be obtained (4.57kg). Using the total g/m2 to coat a platen and the total number of platens along with the recycling capacity, it was possible to determine both the total amount of material needed each ear (4595kg/year) and the number of targets needed each year (805). Because target fabrication has both variable (material content) and fixed (target holder) costs, it is important to provide both the total amount of material needed and the number of discrete targets that must be made.
Figure 8: Rotating magnetron sputtering source
PNNL-22732
Sputtering Target Fabrication The silver targets for the metallization layer would be purchased. The ceramic targets for the electrolyte, barrier and cathode would be made on-site by isostatic pressing (60,000 psi) and sintering of ceramic powders. Powder for the electrolyte, 8 mole% yttria stabilized zirconia would be purchased. Powder for the cathode and barrier would be made by combustion synthesis, as discussed above for the standard process. After sintering the targets would need to be surface ground so that the faces are parallel. Each target would be made in two pieces, each 64cm x 10cm x 2cm. Cold Isostatic Press Quote was $249K. Ceramic Surface Grinder Quote was $120K. Batch Furnaces Quote for two 24” x 24” x 36” furnaces was $200K each. Equipment for combustion synthesis discussed in standard process. Description of Cost Study The project developed two separate cost projections for two different SOFC power system manufacturing processes: the standard production process and the sputtering process. The primary emphasis of the cost estimating focused on the manufacturing process for the SOFC stack for both approaches and less detail was taken in development of the balance of plant components because of the emphasis in reducing the costs of the stack. The same balance of plant was used for both the standard production process and the sputtering process. In addition to the costs for manufacturing, an estimate of the levelized cost for power for each system was developed. The primary components for developing stack costs are materials, capital (building and equipment), electricity due to the high power requirements of furnaces, operations and maintenance (O&M), and labor. The approach taken required the development of a flow sheet for each of the manufacturing processes for the stack. From the process flow sheet, quantities of materials required in each maufacturing process were determined along with the major equipment required to perform that step. Annual quantities of materials were estimated to determine price discounts. The process flow sheet was also used to develop a plant layout. The annual production quantities were also used to size the equipment. Materials
PNNL-22732
Most materials were priced from the Alibaba website. Materials were priced based on delivery to the center of the United States. The prices from Alibaba were also evaluated against prices from a US distributor to determine whether the Alibaba prices were competitive or significantly underpriced. Similar prices were received. Prices used in this study are shown in Table 18. Material costs contributed 55% of the total stack manufacturing costs. A 10 percent scrap rate was assumed for most material purchases and was included in the costs of materials for each process step. The steel scrap rate was an exception. The stamping of the cell frame and separator parts for each repeat unit results in an approximate 33% loss. The anode and cathode flow field blanks lose approximately 53% of the original material. Capital Major capital costs for each manufacturing step were estimated based on quotes from the manufacturers. The building was assumed to provide a 30 year life while equipment was based on a 7 year life. Cost to install equipment was assumed to be 65% of the FOB price. The cost of the major equipment was multiplied by 4.55 to obtain an estimate of the total capital cost of the manufacturing facility, including the cost of the building and auxiliary equipment (Peters and Timmerhaus 1991). A 6% sales tax was added to the cost of capital. Annualized capital costs were separated into building and equipment and estimated separately using a 10% after-tax rate of return. The cost recovery factors are outlined in Table 19. The cost factors for equipment and buildings are based on the following formulas. A cost recovery factor was developed separately for equipment and buildings. The first equation provides a factor to annualize capital to a before tax rate of return and the second equation adds a factor to the first to account for taxes adjusted for tax depreciation to reach an after-tax rate of return. 𝐶𝑅𝐹 = (𝑖 ∗ (1 + 𝑖)𝑛/(((𝑖 ∗ 1)𝑛) − 1) (eq.1)
Where CRF is the capital recovery factor, i is the discount rate, and n is the life of the asset.
𝐹𝐶𝑅𝐹 = 𝐶𝑅𝐹 ∗ (1 − 𝑡 ∗ 𝑁𝑃𝑉)/(1 − 𝑡) (eq. 2) Where FCRF is the fixed charge recovery factor after taxes t is the effective tax rate, and NPV is the net present value of depreciation over life of the asset.
PNNL-22732
Table 18. Material prices used in this study
Multiplying the appropriate FCRF by the investment cost of equipment and buildings provides the annualized cost of capital per piece of equipment and buildings. Dividing the annualized costs of capital and equipment by the number of power systems produced per year provides the cost per power system.
Electricity For equipment with significant electricity requirements, the cost of electricity was estimated separately. Furnaces were the main pieces of equipment with significant electricity requirements. The facility had more than 70 furnaces used to sinter materials at different processing steps. The furnaces varied in power draw from as low as 50 kW to as high as 400 kW. Electricity costs for each piece of equipment with known energy requirements was estimated using expected operating hours and the industrial rate of electricity from the EIA ($0.0644/kWh). O&M and Labor Operations and maintenance costs include labor costs. O&M excluding labor was assumed to be 3% of total installed capital costs. Labor was estimated based upon the number of people required to operate each piece of equipment. A burdened labor rate of $55/hour was used for all process labor. The plant was operated on a 3 shift basis. The plant operating factors are in Table 20.
Table 20. Plant Operations Factors
Stack loss In addition, a 1% stack loss factor was assumed. The assumption added to the costs of production as 1 out of 100 stacks was assumed to not operate or meet quality assurance requirements. Balance of Plant The balance plant components were each priced based upon quotes from manufacturers with the exception of the steam methane reformer and the heat exchanger. The steam methane reformer price was based upon an analogy of a catalytic converter of size required to meet the fuel consumption requirements of the 270 kW power system. The
Equipment FactorEquipment Capital Recovery Factor 0.205 Present Value of Depreciation 0.803 Fixed Charge Recovery Factor 0.231
Buildings FactorBuilding Capital Recovery Factor 0.1061 Present Value of Depreciation 0.4924 Fixed Charge Recovery Factor 0.1404
Plant Operations AssumptionsCapacity Factor 85%Days of operation 310Shifts per day 3Hours of Operation/shift 8Hours per year 7,440
PNNL-22732
combustor/expander/compressor (essentially a jet engine) was estimated based on a quote from the manufacturer. The anode blower provides an indication of the cost decreases associated with mass manufacturing of the SOFC power system. The manufacturer doesn’t currently make the blower in large volumes. They would need to build a larger plant to do so. According the manufacturers estimates the costs would decrease from $45,200 for 1 unit to slightly more than $2000 each for purchases of 10,000 per year. Similarly the heat exchanger would drop from nearly $40,000 to less than $10,000 per unit with increased manufacturing volume. We also assumed 1 person per shift, assisted by a robot, was required to operate each power system assembly station. Also,1 person per shift was assumed to provide quality assurance on the system. Overhead In addition to direct expenses, we added other indirect expenses associated with the manufacturing plant. These expenses included general and adminstrative (G&A), property tax and markup. The assumptions associated with these costs and other general assumptions are shown in table 21.
Table 21. Economic assumptions
Economic AssumptionsBuilding Lifetime 30 yearsBuildng Depreciation Life 20Equipment Lifetime 7 yearsOutput per year 10,000SOFC Life 15 YearsSOFC Install Costs 42%BoP_Scaling_Factor 0.385After-Tax Rate of Return 10%Federal Tax Rate 35%State Tax Rate 6%Manufacturing Sales Tax Rate 6%Retail Sales Tax Rate 6%Effective Tax Rate 38.9%Property Tax Rate 0.75%Insurance Rate 1%Weighted Labor Rate 55G&A 0.1Labor Overhead 0.2Number of Workers 129.9Markup 0.3Workers per machine 1.5Inflation rate 0.015Discount Rate 0.03
PNNL-22732
Installed Costs Adding the total indirect costs to the direct costs provides an estimate of the manufacturer’s retail price at 10,000 units on a per unit basis. However, in order to estimate the levelized cost of electricity for the power system, the installed cost was required. We estimated that the cost of installation would be 42% of the FOB cost, based on Thijssen 2009. We didn’t add a building cost to our estimate as we assumed the power system would be installed in the back section of a commercial building similar to a furnace with venting. Levelized cost of electricity The levelized cost of electricity was developed from the capital and operating costs associated with the SOFC power system. Capital costs were annualized. Fuel and O&M costs along with property taxes and insurance were added to approximate total costs. The installed capital was annualized using equation 2 above. We assumed the same after-tax rate of return as for the manufacturing facility and a 15 year life for the power system. O&M costs were estimated at 3% of total installed costs. Property taxes and insurance were each estimated at 1% of total installed costs. The addition of property taxes assumes that assessors would revalue the facility when they know that improvements have been made to the property. The additional insurance assumes the owner would provide extra insurance to cover catastrophic events. Fuel costs were based on steam reformation of de-sulfurized pipeline natural gas. NG costs were estimated from Cascade Natural Gas commercial delivered rates at $8.69/MBTU. Based on the higher heating value, the electrical conversion efficiency was determined to be 64.8%, which resulted in 5,266 BTU’s of natural gas required to make 1 kWh of electricity using the SOFC power system. To obtain the levelized cost of electicity, the annualized cost of installed capital, plus all of the operating costs were totalled and divided by the annual output of the SOFC power system (see eq. 3 and eq. 4).
𝐶 = (𝐾 + 𝑂𝑀 + 𝐹 + 𝑃 + 𝐼)/𝑘𝑊ℎ (eq. 3) Where C is the cost/kWh, kWh is the annual electricity production in kilowatts,
K is the annualized capital cost, OM is the operations and maintenance cost, F is the annual fuel cost, P is the added cost of property tax, and I is the added cost of insurance.
PNNL-22732
𝑘𝑊ℎ = 𝑘𝑊 ∗ 8760 ∗ 𝐶𝐹 (eq. 4) Where kW is power capacity of power system, 8760 is the number of hours per year, and CF is the capacity factor or percent of the hours the power
system operates.
Results The standard processing approach to manufacturing the SOFC yielded an installed cost of production for the power system of a little more than $174,178. The largest cost component, excluding installation, was the balance of plant at 60,459, followed by the stack cost at nearly $25,000 per power system (see table 22). The bulk-anode tape-casting step cost more than $6,167 driven mainly by the cost of materials, NiO and YSZ. The manifold and stack assembly step, the second most expensive process included a large number of furnaces and a large number of robots, as well as a significant amount of labor to ensure a well built and functioning power system. As previously mentioned, the casting of the manifold was estimated using the SEER for manufacturing cost estimating software. Once the four tape cast components are combined together into the “bi-layer”, the resulting laminated components are laser cut and fired. The bi-layer firing requires 16 furnaces and 16 robots. The equipment, electricity and labor associated with the robots and furnaces costs approximately $2,000 (see Table A1 in Appendix A). The remaining cost for the 4 tape casting steps cost a total of $8,200 Following the sintering of the bi-layer, three screen printing and firing steps take place to add the barrier layer, the cathode, and the metallization layers. These three steps require 24 furnaces. The combined cost of the three steps is approximately $5,200. Chemical etching of the anode and cathode flow fields is relatively expensive. The cathode flow field requires etching from steel followed by electroplating with silver. The silver price, currently $1,100/kg, has been as high as $2,400/kg within the last two years. The flow field blanks cost approximately $1,500 prior to etching. Material loss during etching was estimated at 53 percent. The waste treatment costs were estimated at $0.75/gallon based on an estimate from a chemical etching machine vendor. At $39,000, the power inverter was the single largest component of the balance of plant. The heat exchanger was second at almost $9,900. The expander/compressor was estimated at ~$3,300 based on internet pricing. The anode blower/pump is not manufactured at 10,000 units per year but the company estimated their costs for this project at $2060/per system, significantly below their one unit cost of $45,000.
PNNL-22732
Table 22. Standard production method costs.
A 30% markup was added to cover minor pieces of equipment that were not explicitly costed. For example, sprayers, laminators, and laser cutters were not included directly in the estimate as their costs were considered insignificant. As a significant number of costs were budgetary in nature, some element of markup is needed. At this level of design, a 30 percent contingency is not unreasonable. The levelized cost of electricity based on the estimated installed costs of the power system indicates that the SOFC system could be a competitive form of distributed electrical generation if the manufacturing costs estimated in this study could be realized. The average cost of electricity was projected to be $0.0668/kWh. Fuel cost was the primary driver of LCOE, amounting to nearly 71% of total costs (see table 23). Because the fuel cost dominates the levelized cost of electricity, the high net efficiency (65% HHV) of the SOFC power system gives it a substantial cost advantage over other generating technologies. By comparison a microturbine of similar generating capacity (200 kW, Capstone Turbine Corporation) is 30% efficient based on HHV. The cost of
Materials Costs Annualized Capital and O&MLow Avg High Capital Electricity O&M Labor Low Average High
Total Costs Per System 109,944 122,661 138,603 Installation Costs per System 46,177 51,517 58,213
Total Installed Cost Per System 156,121 174,178 196,816
Total Installed Cost Per kW 602 672 759
PNNL-22732
natural gas alone for this turbine is $0.10/kWh. For a diesel generator (225 kW Cummins), the cost of fuel alone is $0.30/kWh.
Table 23. Levelized cost of electricity (LCOE) Constant $2010 with standard process
Table 23a. LCOE nominal 2010$ with standard process
Standard process compared with sputtering process As previously mentioned, a portion of this study was to estimate the difference in costs associated with the standard versus the sputtering process. Figure 9 compares the stack-only costs per kW for the standard versus the sputtering process. The sputtering process was estimated to decrease the stack cost from $91.29/kW down to $61.53, a decrease of 33%.
Total Annual Costs of electricity 151,692 155,848 161,058
kilowatthours produced 2,043,533 2,043,533 2,043,533
Levelized Cost Electricity 0.0742 0.0763 0.0788
PNNL-22732
Figure 9. Stack cost per kW for standard process (left) and sputtering process (right).
Aspects of the two processes are compared in Table 24 (for a completed breakdown of costs see Table 25). The main reason that the sputtering lowers the cost per kW was due to the 50% increased cell power density, which not only decreases the number of cells required per power system, but also decreases the number of furnaces, robots and stack assembly/test stations. Table 24. Comparison of standard process with the sputtering process
Standard Process Sputtering Process Estimated cell power density 0.69 W/cm2 1.03 W/cm2
No. cells made per day 32,500 21,700 No. pusher furnaces 36 14
Stack materials cost per power system $ 13,738 $ 8,831 Stack capital cost per power system $ 7,401 $ 5,295
Total direct stack cost per power system $ 24,879 $ 16,700 Total direct costs per power system $85,348 $76,917
Levelized cost of electricity $0.0668/kW-hr $0.0630/kW-hr
It is interesting to compare costs per installed kW to those estimates by Thijssen (2006). Figure 10 shows Thijssen’s numbers compared to ours for the standard process. Thijssen assumed the cell power density would be lower than ours, 0.4 versus 0.69 W/cm2. The costs in the plot on the right have therefore been adjusted by a factor of 0.69/0.4 to put them on the same basis. After adjusting for the difference in power density the results are remarkably similar to Thijssen’s.
Stack Cost for Standard Process
010
2030
4050
6070
8090
100Co
st $
/kW
Cells Assembly Interconnect BOS
Stack Cost for Sputtering Process
0
1020
30
40
5060
70
8090
100
Cost
$/k
W
Cells Assembly Interconnect BOS
Stack Cost for Standard Process
010
2030
4050
6070
8090
100Co
st $
/kW
Cells Assembly Interconnect BOS
Stack Cost for Sputtering Process
0
1020
30
40
5060
70
8090
100
Cost
$/k
W
Cells Assembly Interconnect BOS
PNNL-22732
Figure 10. Comparison of stack cost from standard process with those of Thijssen
Table 25. Summary of costs for SOFC power system using sputtering
Stack Cost for Standard Process Adjusted to Power Density Assumed by Thijssen
0
20
40
60
80
100
120
140
160
180
Cost
$/k
W
Cells Assembly Interconnect BOS
Stack Costs from Thijssen (2012$)
0
2040
6080
100120
140160
180Co
st $
/kW
Cells Assembly Interconnect Bal. of Stack
Stack Cost for Standard Process Adjusted to Power Density Assumed by Thijssen
Total Costs Per System 100,004 110,430 120,937 Installation Costs 42,002 46,381 50,793
Total Installed Costs per system 142,006 156,811 171,730
Total Installed Cost Per kW 526 581 636
TotalsMaterials Costs Annualized Capital and O&M
PNNL-22732
Effect of Production Volume on Cost of NGSOFC Currently only a few NGSOFC power systems are being manufactured each year. We developed cost estimates at 50, 250, 1000, and 4000 units per year after we initially estimated costs for a mature market at 10,000 units per year. Materials prices were adjusted to reflect change in the markup for smaller versus larger quantities. Those prices are shown in Table 26. Table 26. Material prices used for each level of manufacturing
Stack costs Stack costs increased by more than 8-fold between 10,000 and 50 units per year. The main cause was that the capital costs per unit climbed as fewer units were made. For each
Average Average Average Average AverageMaterial 50 250 1000 4000 10000
reduced production volume, the stack production process was re-designed. The major equipment items are shown in Table 27 for each production volume. For example, the most expensive items are the bi-layer and screen print layer sintering furnaces. At 10,000 units per year a total of 40 continuous belt or “pusher” sintering furnaces were required, each over 90 feet long and loaded and unloaded by robotics. At 50 units per year the sintering was done in four batch furnaces, loaded and unloaded by hand labor. At 1000, 4000 and 10,000 units per year, the factory was assumed to operate three 8 hour shifts per day; at 250 units/yr, two 8hr shifts and at 50 units/yr, one shift. For 10,000 units/yr, 43 laborers were required per shift; for 4000 units/yr, 27 laborers per shift and for 1000 units/yr, 20 laborers per shift. The lower production volumes used more labor and less robotics. For 250 units/yr, 18 laborers were assumed per shift; for 50 units/yr, 10 laborers/shift. These counts did not include supervisors, engineers, management, administrator or building maintenance personnel. Table 27. FOB cost of major equipment for each production volume.
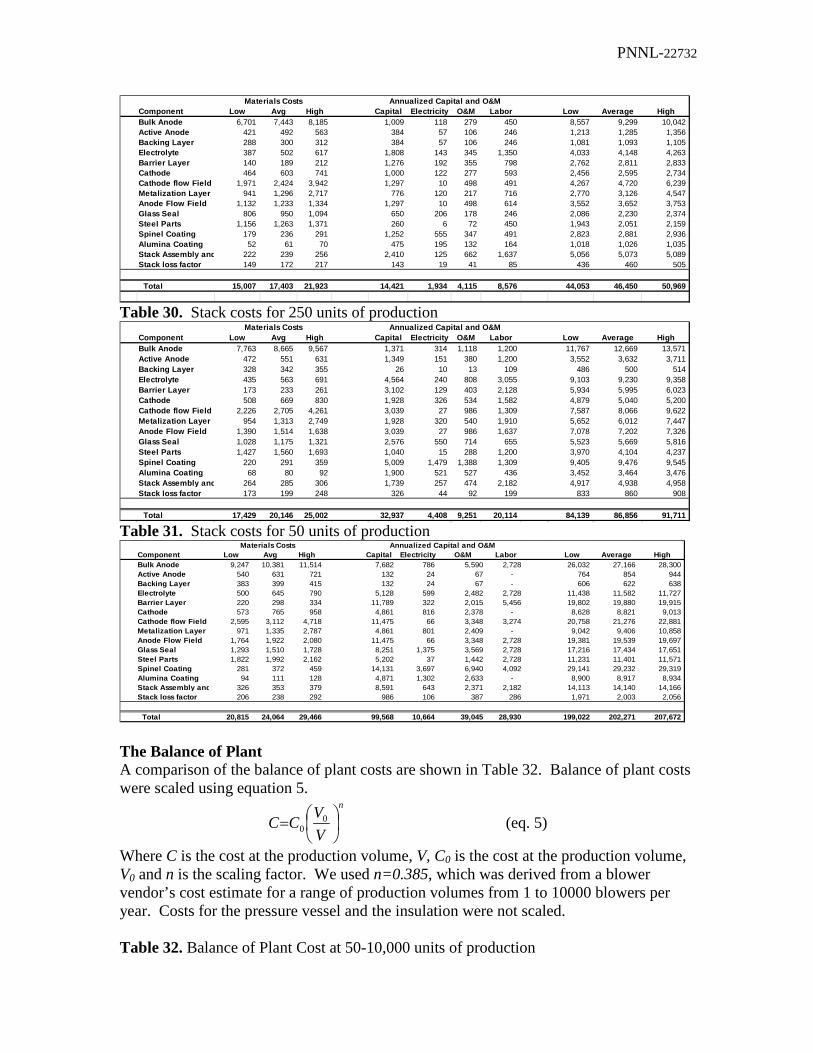
Tables 28 through 31 list total stack costs for each reduced production volume. These should be compared to Table 22, which shows total stack cost for a volume of 10,000 units per year (average) of $24,879 versus $202,271 for a volume of 50 units per year, more than a factor of eight higher. Table 28. Stack costs for 4000 units of production
Table 29. Stack costs for 1000 units of production
Units Produced per YearEquipment Cost Equipment Cost Equipment Cost Equipment Cost Equipment Cost
Tape Casting Machines Four 100 ft.x52" Three 50 ft.x52" $6,900,000 Two 100 ft.x52"
Three 50 ft.x26" $3,750,000 One 100 ft.x52" Three 50 ft.x26" $2,550,000 Two 50 ft.x12" $800,000 One 50 ft.x26" $450,000
Bi-Layer Sintering Furnaces Sixteen each 95' $12,000,000 Six each 100' $4,800,000 Two each 75' $1,350,000 One at 57' $500,000 One Batch
Furnace $250,000
Screen Print Layer Sintering Furnaces 24 each 93' $18,000,000 Nine each 93' $6,750,000 Three each 70' $1,950,000 Three each 26' $1,500,000 Three Batch
The Balance of Plant A comparison of the balance of plant costs are shown in Table 32. Balance of plant costs were scaled using equation 5.
n
VVCC
= 0
0 (eq. 5)
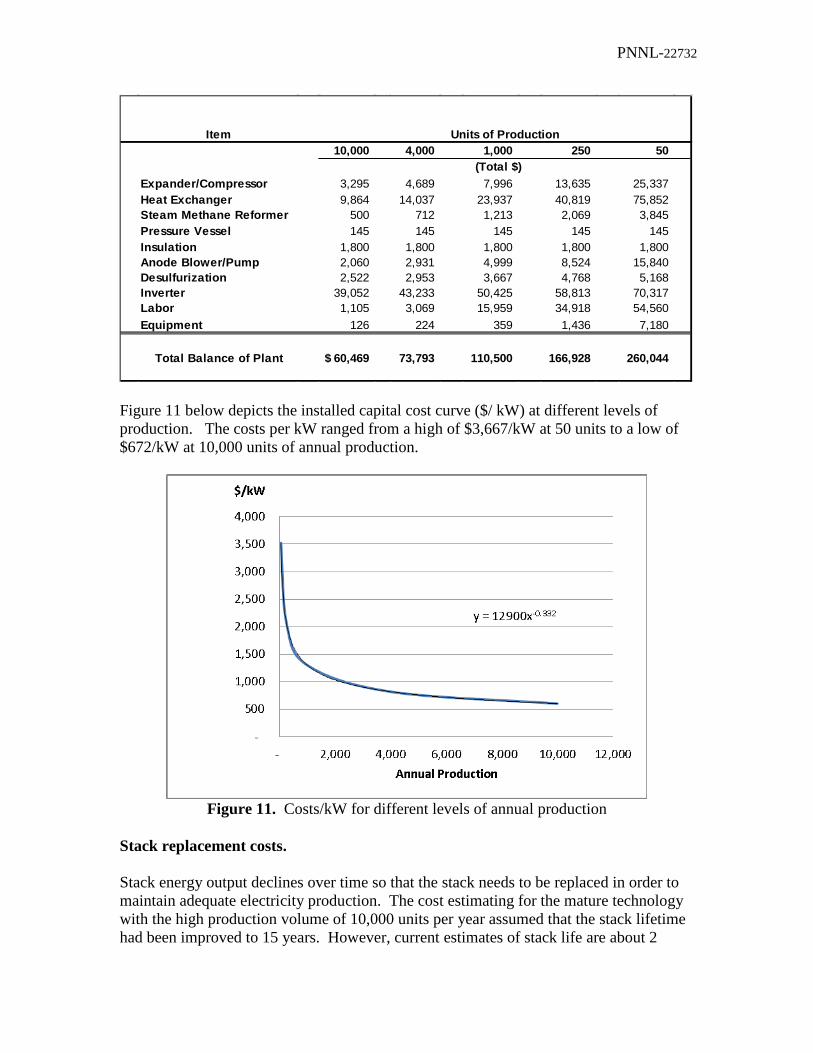
Where C is the cost at the production volume, V, C0 is the cost at the production volume, V0 and n is the scaling factor. We used n=0.385, which was derived from a blower vendor’s cost estimate for a range of production volumes from 1 to 10000 blowers per year. Costs for the pressure vessel and the insulation were not scaled. Table 32. Balance of Plant Cost at 50-10,000 units of production
Figure 11 below depicts the installed capital cost curve ($/ kW) at different levels of production. The costs per kW ranged from a high of $3,667/kW at 50 units to a low of $672/kW at 10,000 units of annual production.
Figure 11. Costs/kW for different levels of annual production
Stack replacement costs. Stack energy output declines over time so that the stack needs to be replaced in order to maintain adequate electricity production. The cost estimating for the mature technology with the high production volume of 10,000 units per year assumed that the stack lifetime had been improved to 15 years. However, current estimates of stack life are about 2
Total Balance of Plant 60,469$ 73,793 110,500 166,928 260,044
PNNL-22732
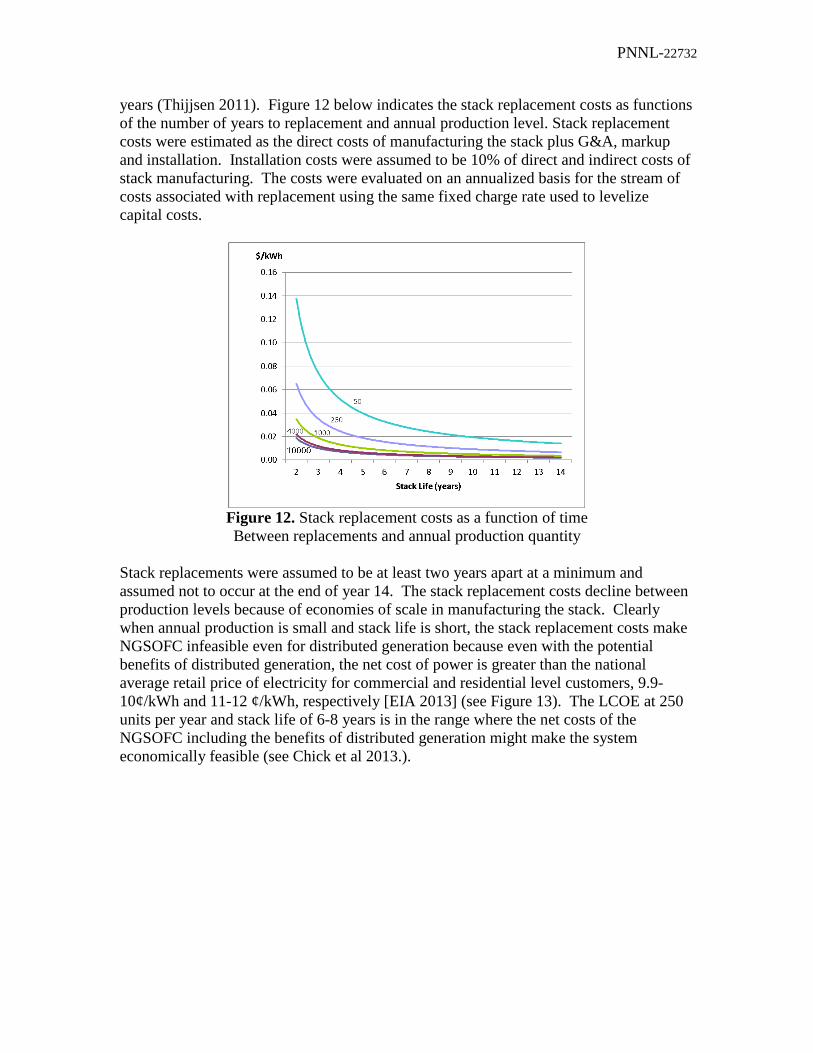
years (Thijjsen 2011). Figure 12 below indicates the stack replacement costs as functions of the number of years to replacement and annual production level. Stack replacement costs were estimated as the direct costs of manufacturing the stack plus G&A, markup and installation. Installation costs were assumed to be 10% of direct and indirect costs of stack manufacturing. The costs were evaluated on an annualized basis for the stream of costs associated with replacement using the same fixed charge rate used to levelize capital costs.
Figure 12. Stack replacement costs as a function of time Between replacements and annual production quantity
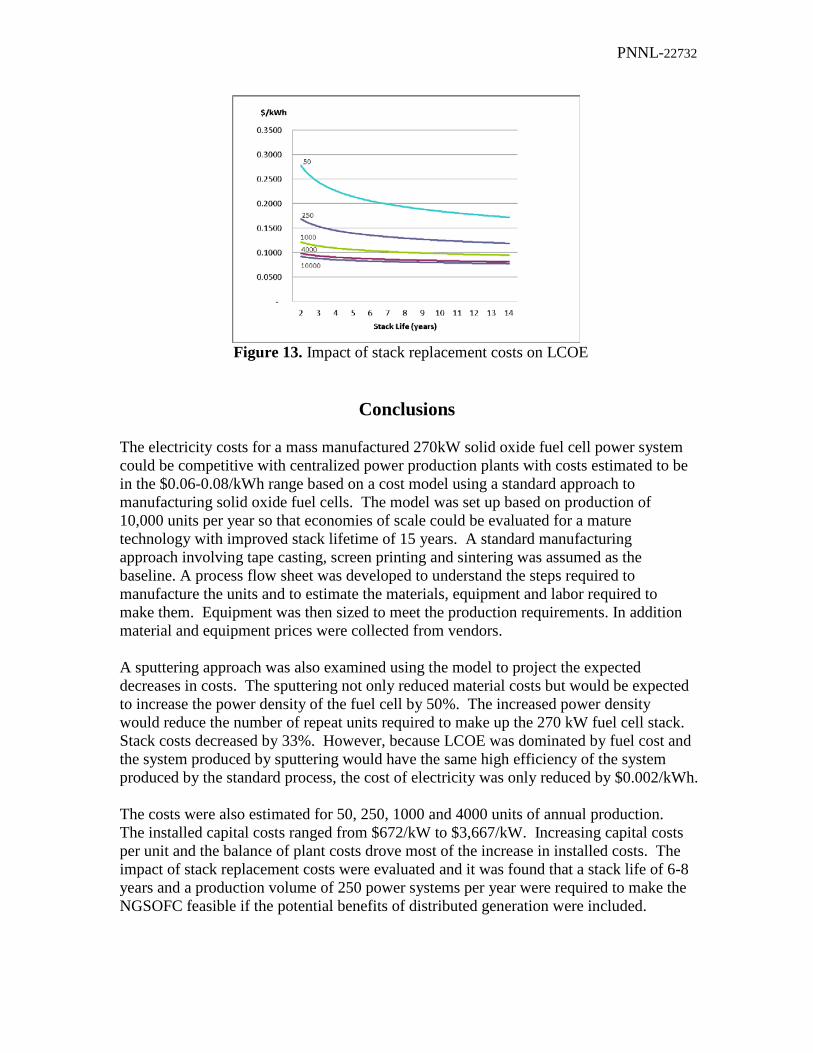
Stack replacements were assumed to be at least two years apart at a minimum and assumed not to occur at the end of year 14. The stack replacement costs decline between production levels because of economies of scale in manufacturing the stack. Clearly when annual production is small and stack life is short, the stack replacement costs make NGSOFC infeasible even for distributed generation because even with the potential benefits of distributed generation, the net cost of power is greater than the national average retail price of electricity for commercial and residential level customers, 9.9-10¢/kWh and 11-12 ¢/kWh, respectively [EIA 2013] (see Figure 13). The LCOE at 250 units per year and stack life of 6-8 years is in the range where the net costs of the NGSOFC including the benefits of distributed generation might make the system economically feasible (see Chick et al 2013.).
PNNL-22732
Figure 13. Impact of stack replacement costs on LCOE
Conclusions The electricity costs for a mass manufactured 270kW solid oxide fuel cell power system could be competitive with centralized power production plants with costs estimated to be in the $0.06-0.08/kWh range based on a cost model using a standard approach to manufacturing solid oxide fuel cells. The model was set up based on production of 10,000 units per year so that economies of scale could be evaluated for a mature technology with improved stack lifetime of 15 years. A standard manufacturing approach involving tape casting, screen printing and sintering was assumed as the baseline. A process flow sheet was developed to understand the steps required to manufacture the units and to estimate the materials, equipment and labor required to make them. Equipment was then sized to meet the production requirements. In addition material and equipment prices were collected from vendors. A sputtering approach was also examined using the model to project the expected decreases in costs. The sputtering not only reduced material costs but would be expected to increase the power density of the fuel cell by 50%. The increased power density would reduce the number of repeat units required to make up the 270 kW fuel cell stack. Stack costs decreased by 33%. However, because LCOE was dominated by fuel cost and the system produced by sputtering would have the same high efficiency of the system produced by the standard process, the cost of electricity was only reduced by $0.002/kWh. The costs were also estimated for 50, 250, 1000 and 4000 units of annual production. The installed capital costs ranged from $672/kW to $3,667/kW. Increasing capital costs per unit and the balance of plant costs drove most of the increase in installed costs. The impact of stack replacement costs were evaluated and it was found that a stack life of 6-8 years and a production volume of 250 power systems per year were required to make the NGSOFC feasible if the potential benefits of distributed generation were included.
PNNL-22732
References Chick, L., M. Weimar, G. Whyatt. September 2013. “The Case for Natural Gas Fueled Solid Oxide Fuel Cell Power Systems for Distributed Generation. Pacific Northwest National Laboratory. Draft
Chick et al. 2012. Larry A. Chick, Olga A. Marina, Chris A. Coyle and Ed C. Thomsen, “Effects of temperature and pressure on the performance of a solid oxide fuel cell running on steam reformate of kerosene”. J. Power Sources, in press. EIA--Energy Information Administration. 2012. "Electric Power Monthly: Table 5.6. Average Retail Price of Electricty to Utlitmate Customers by End-Use Sector, by State, April 2012 and 2011: Industrial Customers April 12." http://www.eia.gov/electricity/monthly/epm_table_grapher.cfm?t=epmt_5_6_a EIA—U.S. Energy Information Agency. July 2013. “Electric Power Monthly: Table 5.3. Average Retail Price of Eclectricty to Ultimate Customers: Total by End-UsecSector, 2003-May 2013. Accessed August 1, 2013 at http://www.eia.gov/electricity/monthly/epm_table_grapher.cfm?t=epmt_5_3 Galorath. 2010. “SEER for Manufacturing v. 6.1” Accessed 8/12/13 at http://www.galorath.com/index.php/products/manufacturing/C6 Peters & Timmerhaus. 1991. "Plant Design and Economics for Chemical Engineers" McGraw-Hill, Fourth Edition. Powell et al. 2012. Mike Powell, Kerry Meinhardt, Vince Sprenkle, Larry Chick, Gary McVay, “Demonstration of a highly efficient solid oxide fuel cell power system using adiabatic steam reforming and anode gas recirculation”. J. Power Sources 205 (2012) 377-384. Thijssen, JHJS. September 2006. “The impact of scale-up and production volume on SOFC Stack Cost. Presented at 7th Annual SECA Workshop and Peer Review. J. Thijssen, LLC. Redmond, Washington. Thijssen, J. March 2009. “Natural Gas Fueled Distributed Generation Solid Oxide Fuel Cell Systems: Projection of Performance and Cost of Electricity. Prepared for National Energy Technology Laboratory. Report Number: R102 04 2009/1. Thijssen, J. May 2011. “Solid oxide fuel Cells and Critical Materials: A Review of implications. National Energy Technology Laboratory. R1020604D1. Accessed July 30, 2013 at http://www.netl.doe.gov/technologies/coalpower/fuelcells/publications/Rare%20Earth%20Update%20for%20RFI%20110523final.pdf Whyatt, G and L Chick. 2012. “Electrical Generation for More-Electric Aircraft using Solid Oxide Fuel Cells”, PNNL 21382.