COUNTRY REPORT PERU Dr. Carlos ZAVALA Dr. Miguel ESTRADA ‐ Dr. Zenon AGUILAR – Eng. Alberto BISBAL CISMID‐FIC‐UNI Science and Technology Research Partnership for Sustainable Development : SATREPS DHN IGP INDECI UNMSM CON UPT CONIDA National System for Disaster Risk Management (SINAGERD): A new strategic decision model to reduce the disaster risk (LAW 29664 ) Centro Nacional de Estimación, Prevención y Reducción del Riesgo de Desastres ‐ CENEPRED SECTORS, REGIONAL & LOCAL GVMTs Strategic level Political level Financial Management on DRM National Development Plan with DRR approach at the 3 government levels ‐ CEPLAN
Transcript
COUNTRY REPORTPERU
Dr. Carlos ZAVALA
Dr. Miguel ESTRADA ‐ Dr. Zenon AGUILAR – Eng. Alberto BISBAL
CISMID‐FIC‐UNI
Science and Technology Research Partnership
for Sustainable Development : SATREPS
DHN IGP INDECI UNMSM CON UPTCONIDA
National System for Disaster Risk Management (SINAGERD): A new strategic decision model to reduce the disaster risk
(LAW 29664 )
Centro Nacional de Estimación, Prevención y Reducción del Riesgo de Desastres ‐ CENEPRED
SECTORS, REGIONAL & LOCAL GVMTs
Strategic level
Political level
Financial Management on DRM
National Development Plan with DRR approach at the 3
government levels ‐ CEPLAN
TECHNICAL TOOLS FOR PLANNING AND MANAGEMENT THE RISK (SOURCE: CENEPRED)
RISK REDUCTION PLAN BY SECTORFOR EXAMPLE: EDUCATION
RISK REDUCTION PLAN BY SECTORFOR EXAMPLE: HOUSING ANDCONSTRUCTION
RISK REDUCTION PLAN FOR DRAIN SYSTEMS AND WATER
SUPPLY
RISK REDUCTION PLAN OFTRANSPORTATION SYSTEM AND HIGWAYS AND BRIDGES
NATIONAL PLAN OF RISK REDUCTION
ACTIONS TAKEN BY CISMID‐FIC‐UNI AFTER PISCO EARTHQUAKE 15/8/2007
THE PISCO QUAKE AUGUST 15TH 2007Geophysical Institute of Peru (IGP) reports the following parameters (2007)
Depth : 26 kmMagnitude : 7.0 ML (Richter)
7.9Mw (moment magnitude)
Epicenter at 74 km on West direction fromPisco. La circle represents a focal inverse mechanism (Tavera, et al 2007)
Time : 18 hrs, 40 min, 53.6 sec.Location : Latitude -13.49°Longitude : -76.85°
ZON
A 2
ZON
A 3
ECUADOR
COLOMBIA
BRASIL
BO
LIV
IA
CHILE
ZONA 1
EXPLORATION OF SOILS
AFTER QUAKE MICROZONING MAP ‐ PISCO
Zone I: with load capacity between 2.0 kg/cm2 to 3.5 kg/cm2 and natural periods less than 0.1 sec.
Zone II: with load capacity between 1.5 kg/cm2 to 2.0 kg/cm2and natural periods less than 0.1 sec.
Zone III: with load capacity between 0.8 kg/cm2 to 1.0 kg/cm2and natural periods between 0.1 sec to 0.16 sec.
Zone IV‐A: conformed of soils of debris and wet mud, Zone IV‐B: wet, loose sand with high liquefaction potential
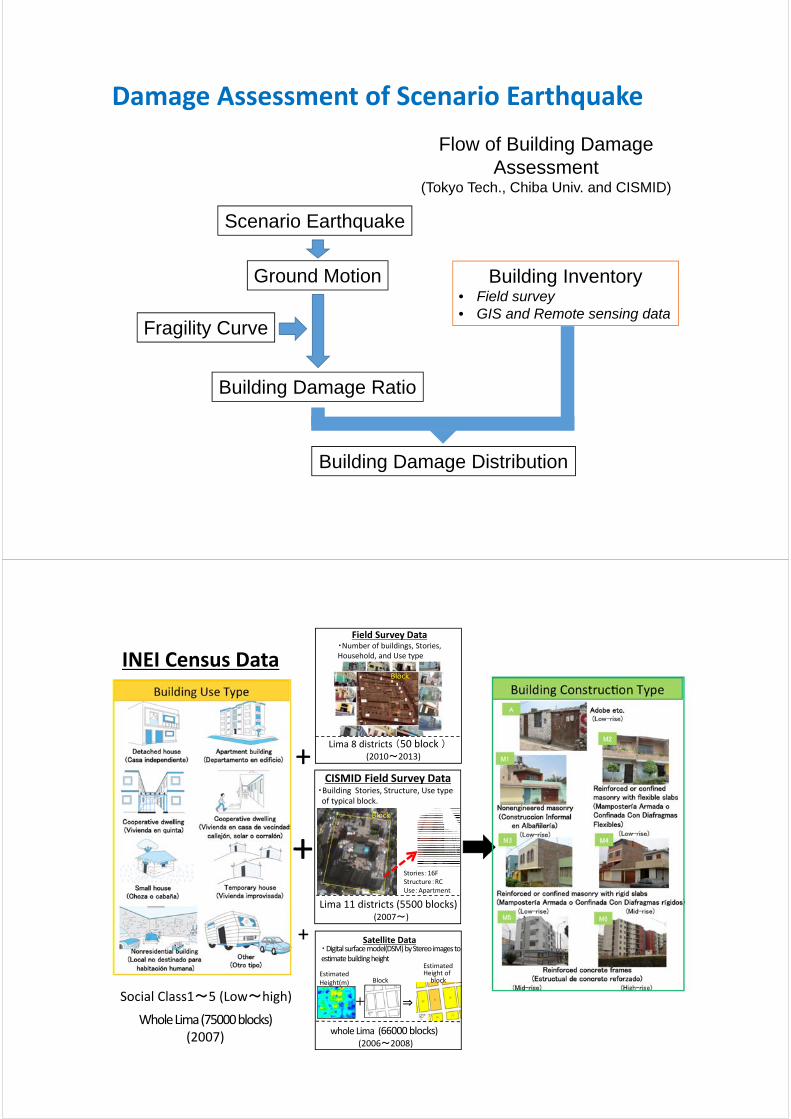
PROGRESS AND IMPLEMENTATION OF RESULTSOF SATREPS PROJECT
ACTIVITIES DEVELOPED G1 ‐ Seismology
• Seismic monitoring by the cismid ground motion network at lima city
• Ground response analysis for lima city
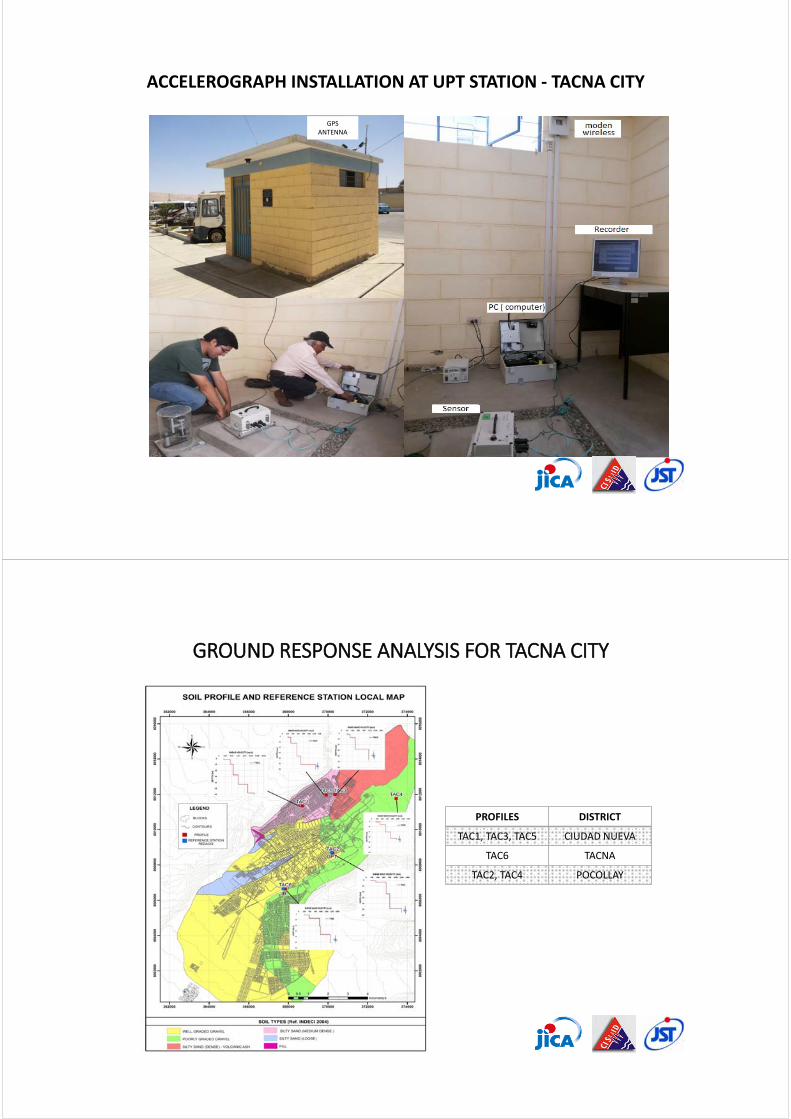
• Ground motion accelerograph instalation in tacna city
• Ground response analysis for tacna city
• Updating of the ground motion network monitoring center
• Advice to SENCICO for improvement of the peruvianseismic code
CISMID’S STRONG GROUND MOTION NETWORK AT LIMA CITY
0
50
100
150
200
250
0 500 1000 1500 2000 2500 3000 3500
DEPT
H (m
)
SHEAR WAVE VELOCITY (m/s)
EMO
0
50
100
150
200
250
0 500 1000 1500 2000
DEPT
H (m
)
SHEAR WAVE VELOCITY (m/s)
MOL
0
50
100
150
200
250
0 500 1000 1500 2000
DEPT
H(m)
SHEAR WAVE VELOCITY (m/s)
CSM
0
50
100
150
200
250
0 500 1000 1500 2000
DEPT
H (m
)
SHEAR WAVE VELOCITY (m/s)
PPI
0
200
400
600
800
1000
0 500 1000 1500 2000 2500 3000 3500
DEPT
H (m
)
SHEAR VELOCITY (m/s)
CMA
0
200
400
600
800
1000
0 500 1000 1500 2000 2500 3000 3500
DEPT
H (m
)
SHEAR WAVE VELOCITY (m/s)
VSV
GPS ANTENNA
ACCELEROGRAPH INSTALLATION AT UPT STATION ‐ TACNA CITY
PROFILES DISTRICT
TAC1, TAC3, TAC5 CIUDAD NUEVA
TAC6 TACNA
TAC2, TAC4 POCOLLAY
GROUND RESPONSE ANALYSIS FOR TACNA CITY
REAL TIME MONITORING OF GROUND MOTION ACCELEROGRAPHS ‐ REDACIS
IMPROVEMENT OF SEISMIC NEW STANDARDS WITH SATREPS OUTPUTS TARGET RESPONSE SPECTRA FOR SEISMIC ZONE 3 IN PERU
0.0
0.2
0.4
0.6
0.8
1.0
1.2
1.4
1.6
0.0 0.5 1.0 1.5 2.0 2.5 3.0 3.5 4.0
AC
EL
ER
AC
IÓN
ES
PE
CT
RA
L (
g)
PERIODO (s)
COMPARACIÓN DE ESPECTROS DE DISEÑO - E-030 - IBC - EPU - TR=475 AÑOS
Norma E030 Suelo Tipo 1
Norma E030 Suelo Tipo 2
Norma E030 Suelo Tipo 3
IBC Suelo Tipo B
IBC Suelo Tipo C
IBC Suelo Tipo D
Espectro Peligro Uniforme Suelo Tipo B
Espectro Peligro uniforme Suelo Tipo C
Espectro Peligro Uniforme Suelo Tipo D
IMPLEMENTACION DE LA REDSSAT - IGP
ACTIVITIES DEVELOPED G2 ‐ Tsunami
• Elaborate tsunami scenarios using the seismic source.
• To develop propagation and inundation models
• Evaluate the probable impact over the buildings.
• Propose countermeasures to reduce the impact.
TSUNAMI SIMULATION FOR EACH EARTHQUAKE SCENARIO
Propagation and Inundation modeling for the 4th Scenario
ReGiD, IRIDeS, Tohoku University
ReGiD, IRIDeS, Tohoku University
TSUNAMI SIMULATION FOR EACH EARTHQUAKE SCENARIO
Model_01
Max. = 6.87
Model_02
Max. = 7.82
Model_03
Max. = 6.46
Model_04
Max. = 7.98
Model_05
Max. = 6.09
Model_06
Max. = 7.55
Model_07
Max. = 6.93
0 1 2 3 4 5 6 7 8 9 10
Inund. depth (m)
Model_08
Max. = 6.21
0 1 2 3 4 5 6 7 8 9 10
Inund. depth (m)
Model_09
Max. = 7.00
0 1 2 3 4 5 6 7 8 9 10
Inund. depth (m)
Model_10
Max. = 6.15
0 1 2 3 4 5 6 7 8 9 10
Inund. depth (m)
Model_11
Max. = 7.86
0 1 2 3 4 5 6 7 8 9 10
Inund. depth (m)
Model_12
Max. = 6.59
0 1 2 3 4 5 6 7 8 9 10
Inund. depth (m)
DAMAGE ESTIMATION – La Punta
B. Adriano, E. Mas, S. Koshimura, Y. Fujii (2013). Proceedings of International Sessions in Coastal Engineering, JSCE, Vol.4, 2013, JAPAN
Applying fragility curve (FC) for a probabilistic estimation
Schematic Figure of Backscattering Characteristics of Buildings
ACTIVITIES DEVELOPED G5 – Disaster Mitigation Planning
1. Formulate Land-use Policies for Disaster Mitigation
2. Develop Local Disaster Mitigation Plans for the Study Areas
3. Awareness Raising and Dissemination Activities
• POPULATION RESETTLEMENT ACT FOR AREAS WITH VERYHIGH RISK CAN NOT BE MITIGATED.
Law 29869. Regulated on October 23, 2013 by SupremeDecree No. 115-2013-PCM
Local governments will submitted to Ministry of Housing andSanitation, the feasibility of the resettlement plan. Otherwise,suggest measures to reduce damage to any disaster.
1. Formulate Land-use Policies for DisasterMitigation
On going Activities:
• Standard for Construction Earthquake Resistant (in adoption).National Building Regulations. Ministry of Housing
• Guidelines for mapping seismic hazard. CENEPRED
• Technical guidance for the post-disaster damage assessment usinggeoespacial information. INDECI-CISMID
• GUIDELINES FOR IMPLEMENTATION TSUNAMIDRILLS FOR NATIONWIDEDIRECTIVE Nº 001-2014-INDECI/10.3 (formulation)This directive regulates the steps for the development of drillsTsunami Evacuation in coastal areas. It also includesguidelines for vertical evacuation in coastal urban areas withbuildings over 3 floors.
2. Develop Local Disaster Mitigation Plansfor the Study Areas
New macrozonation
• Includes work developed by researches fromSATREPS Project.
• Changes in acceleration values. (Proposed by G1)
2. Develop Local Disaster Mitigation Plansfor the Study Areas
• 2 AWARENESS CENTER IN PERU
• Lima Awareness Center in CISMID• Arequipa Awareness Center in INDECI
Installation Place: CISMID Awareness Center Hall
INDECI Arequipa Public Awareness Center
Schedule: Procurement- June and July, 2013Delivery- in February, 2014
INDECI ArequipaCISMID
3. Awareness Raising and Dissemination Activities
EWBS PROJECT
DHN
IGP
COENControl
PC
WL LAN
Internet
EWBSServer
DigitalTV
UP Link
IRD
INDECICOEN IRTP
COE• Activación• Código de Área• Mensaje de Texto
MTC - IRTP
Receptor
TRANSMISSION STATIONS
Cerro Azul
Atico
Caleta Grau
La Planchada
TIDE GAGES
Lima
Trujillo
Yungay
Cañete
Pisco
Arequipa
Camaná
Ilo
La Cruz
Bayovar
Huarmey
Huacho
Land use: Location of Schools, Hospitals, Recreational
Technical Tools for planning and managementthe risk in Peru Using SATREPS OUTPUTS
RISK REDUCTION PLAN BY SECTOR FOR EXAMPLE: LOCAL GOVERNMENT
NATIONAL PLA
N OF RISK
RED
UCTION
G1: Superficial Movement Microzoning Map
G2: Superficial Movement Tsunami Propagation Map
G3: Geoespacial Data Base Capacity & Behavior ofBuilding = Vulnerability
G4: Damage Evaluation & Detection Risk Map
G5: Disaster Mitigation Plan Stakeholder Plan
Vertical and Horizontal Evacuation Routes and countermeasures
Vulnerability of Buildings – Retrofit policiesLimit of Story Height – Recommendations for New buildings
Identification of Risk zones – Plans for Relocations Identification of number of casualties prior event
Plans for countermeasures for disaster attentionEmergency budget for restoration‐ Emergency action plan
Final Remarks
• The goals has been achieved on SATREPS project.
• The develop of methodologies and rules for the evaluation of theearthquake and tsunami risk under SATREPS project, has beenadopted for the National Government by the Program PREVAEDPP‐068 and assure sustainability on time for the project.
• The dissemination of the achievements of SATREPS project must beconducted to promote a disaster risk reduction culture amongdecision makers and also general public for safe and sustainable cities