35
Page | 1 REPUBLIC OF KENYA COUNTY GOVERNMENT OF TURKANA KIBISH SUB COUNTY SOCIAL INTELLIGENCE REPORT SEPTEMBER 2018

Page | 1
REPUBLIC OF KENYA
COUNTY GOVERNMENT OF TURKANA
KIBISH SUB COUNTY
SOCIAL INTELLIGENCE REPORT
SEPTEMBER 2018

Page | 2
TABLE OF CONTENT EXECUTIVE SUMMARY ......................................................................................................................................... 4
SOCIAL INTELLIGENCE REPORT ....................................................................................................................... 5
Relevance of Social Intelligence Report .................................................................................................................... 5
Methodology .............................................................................................................................................................. 5
Analysis of SIR .......................................................................................................................................................... 5
CHAPTER 1 ................................................................................................................................................................. 7
BACKGROUND INFORMATION ........................................................................................................................... 7
1.1 COUNTY LEVEL ............................................................................................................................................... 7
1.1.1 Location, size, administrative units and political units..................................................................................... 7
Administrative Units by Sub-County ........................................................................................................................ 7
Political Units by Sub-County ................................................................................................................................... 7
1.1.2 County subdivision............................................................................................................................................ 8
1.1.3 County population and area coverage .............................................................................................................. 8
1.1.4 Language and culture ....................................................................................................................................... 8
1.1.5 Climate.............................................................................................................................................................. 8
1.1.6 Economic activities ........................................................................................................................................... 8
1.2 SUB-COUNTY LEVEL .............................................................................................................................. 9
1.2.1 Position and size of the Sub-county .................................................................................................................. 9
1.2.3 Administrative and political Units .................................................................................................................... 9
Table 1: Sub County Administrative Units ................................................................................................................ 9
Table 2: Sub-County Political Units .......................................................................................................................... 9
1.2.3 Settlement Structure .......................................................................................................................................... 9
1.2.4 Economic activities ......................................................................................................................................... 10
1.2.5 Topographic features ...................................................................................................................................... 10
1.2.6 Climatic Information ...................................................................................................................................... 10
1.2.7 Population ...................................................................................................................................................... 10
CHAPTER 2 ............................................................................................................................................................... 11
EDUCATION AND LITERACY SECTOR ............................................................................................................ 11
2.1 COUNTY LEVEL INFORMATION ................................................................................................................ 11
2.2 FACILITY LEVEL INFORMATION ............................................................................................................... 11
2.2.1 Loruth Primary School ............................................................................................................................... 11
Brief background of the school ............................................................................................................................ 11
The school Infrastructure .................................................................................................................................... 12
Table 3: Loruth Primary Enrolment .................................................................................................................... 13
Dropout rate ........................................................................................................................................................ 14
Funding ................................................................................................................................................................ 15
2.2.2 Kokuro Primary School .................................................................................................................................. 15
Brief background of the school ............................................................................................................................ 15

Page | 3
The school Infrastructure .................................................................................................................................... 15
Table 4: Kokuro Primary Enrolment ................................................................................................................... 16
Dropout rate ........................................................................................................................................................ 17
Funding ................................................................................................................................................................ 18
2.2.3 School Performances ...................................................................................................................................... 18
2.2.4 Staffing ........................................................................................................................................................... 18
2.2.5 School Facilities.............................................................................................................................................. 18
Toilets .................................................................................................................................................................. 18
Water Points ........................................................................................................................................................ 18
2.2.6 Challenges facing the facilities and Recommendations .................................................................................. 19
2.1.7 Secondary Schools .......................................................................................................................................... 20
CHAPTER 3 ............................................................................................................................................................... 21
HEALTH SECTOR ................................................................................................................................................... 21
3.1 COUNTY LEVEL INFORMATION ................................................................................................................ 21
3.2 FACILITY LEVEL INFORMATION ............................................................................................................... 21
3.2.1. Loruth Dispensary ..................................................................................................................................... 21
3.2.2. Kokuro Health Center ................................................................................................................................ 23
3.2.3 Challenges facing the facilities and Recommendations .................................................................................. 24
WATER AND SANITATION SECTOR ................................................................................................................. 27
4.1 COUNTY LEVEL INFORMATION ................................................................................................................ 27
4.1.1 Water Resources and Quality ..................................................................................................................... 27
4.1.2 Water Supply Schemes ............................................................................................................................... 27
4.1.3 Water Sources ............................................................................................................................................. 27
4.1.4 Sanitation .................................................................................................................................................... 27
4.2 FACILITY LEVEL INFORMATION ............................................................................................................... 28
4.2.1 Loruth Water Supply System ...................................................................................................................... 28
4.2.2 Loruth Primary Hand Pump ........................................................................................................................ 30
4.2.3 Kokuro Water Supply System .................................................................................................................... 32
4.2.4 Challenges facing the facilities and Recommendations .................................................................................. 33
CHAPTER 5 ............................................................................................................................................................... 35
CONCLUSION AND RECOMMENDATION ....................................................................................................... 35

Page | 4
EXECUTIVE SUMMARY
The Inter- Religious Council of Kenya (IRCK) under a Consortium led by the Amref Health
Africa in Kenya is implementing a 5-year project dubbed AFYA TIMIZA. The overall goal of the
project is to provide enhanced access to and utilization of quality Family planning, /
Reproductive, Maternal Newborn and Child Health (FP/RMNCAH) WASH and Nutrition
services in Samburu and Turkana Counties.
IRCK‟s scope of work within the consortium will contribute to increased care seeking and health
promoting behavior on FP/RMNCAH, WASH and Nutrition services in both counties.
Additionally, a key delivery of the project is to conduct county level advocacy using the Social
Budgeting Observatory Framework SBOF/Social Intelligence Reporting SIR.
The Social Budgeting initiative is one key step towards ensuring more equitable social
development via engagement of the „claim holders‟ as well as “duty bearers” and increasing
levels of citizen participation and shared accountability in the social budgeting process.
A key element of the Social Budgeting Initiative is the conduct of the Social Intelligence
Reporting (SIR). The reports are derived from participatory engagements of the communities and
interactions with various stakeholders. It is not a survey or data gathering exercise but facilitates
community involvement and engagement; it focuses on problem identification and problem-
solving.
AFYA TIMIZA supported a cadre of sensitized religious leaders in liaison with the county
departments of finance and economic planning, health, water and education to conduct the site
visits to SIR mapped facilities: Loruth dispensary, Kokuro health center, Loruth primary school,
Kokuro primary school and the water access points to the communities, schools and hospitals.
The objective of conducting the exercise was to gather credible evidence on the real issues
affecting essential social service provision at the sub County and facility levels. This would
create an understanding of these issues and articulate responsibilities and accountabilities around
them, at the end of the process, build consensus on time-bound, remedial actions to be
undertaken by relevant stakeholders at the identified facilities.

Page | 5
SOCIAL INTELLIGENCE REPORT
Relevance of Social Intelligence Report
The report is an assessment tool on quality of service delivery particularly in the Social Pillar of
the Vision 2030 at facility and community levels. In addition, the report provides a broad
evaluation of effectiveness of the social sector policies, projects and programmes carried out in
selected communities.
The report describes the communities‟ status, milestones, opportunities, constraints, conclusions,
action points and recommendations that require attention in addressing the overall progress of
communities for quality social services.
Guidance on undertaking SIR was based on the following principles:
a) Facilitating the engagement of „duty bearer‟s‟ and „rights‟ holders‟
b) Promoting accountability for quality and equitable delivery of social services
c) Ensuring transparency and good governance
d) Identifying constraints to optimal utilization of public investments
e) Monitoring the situation of vulnerable groups
f) Informing meetings of social budgeting observatories at all levels
The entire report covers executive summary, sub county back ground information, SIR
methodology, Sectoral analysis (Education. Health, Water) Follow Up Actions, Conclusion and
Recommendations.
Methodology
Preparation of SIR entails a lengthy process of series of data collection, field visits, meetings,
stakeholder‟s engagements by various committees coordinated by Sub County Social Sector
heads. The County SIR lead team comprised of the County representatives in the department of
Health, Education, Water, finance and Planning.
The scope of the report is limited to major human development activities undertaken in the three
facilities where this SIR was conducted.
Engagement with stakeholders during collection and compilation of information and generation
of SIR was done from relevant County departmental reports. Field visits and observations from
Water, Education and Health for committees were the main points of discussion.
Analysis of SIR
This is the second generated SIR conducted by AFYA TIMIZA and the County Government of
Turkana. The main challenges included lengthy time in data collection, analysis and reporting.
The vastness in geographical coverage also meant that a lot of time was taken travelling from
one place to another during the field visits. Also, not all the respondents were willing to give out
information
Rationale of Social Budgeting and SIR.
The Social Budgeting initiative is one key step towards ensuring more equitable social
development via engagement of the „claim holders‟ as well as “duty bearers” and increasing
levels of citizen participation and shared accountability in the social budgeting process.
Page | 6
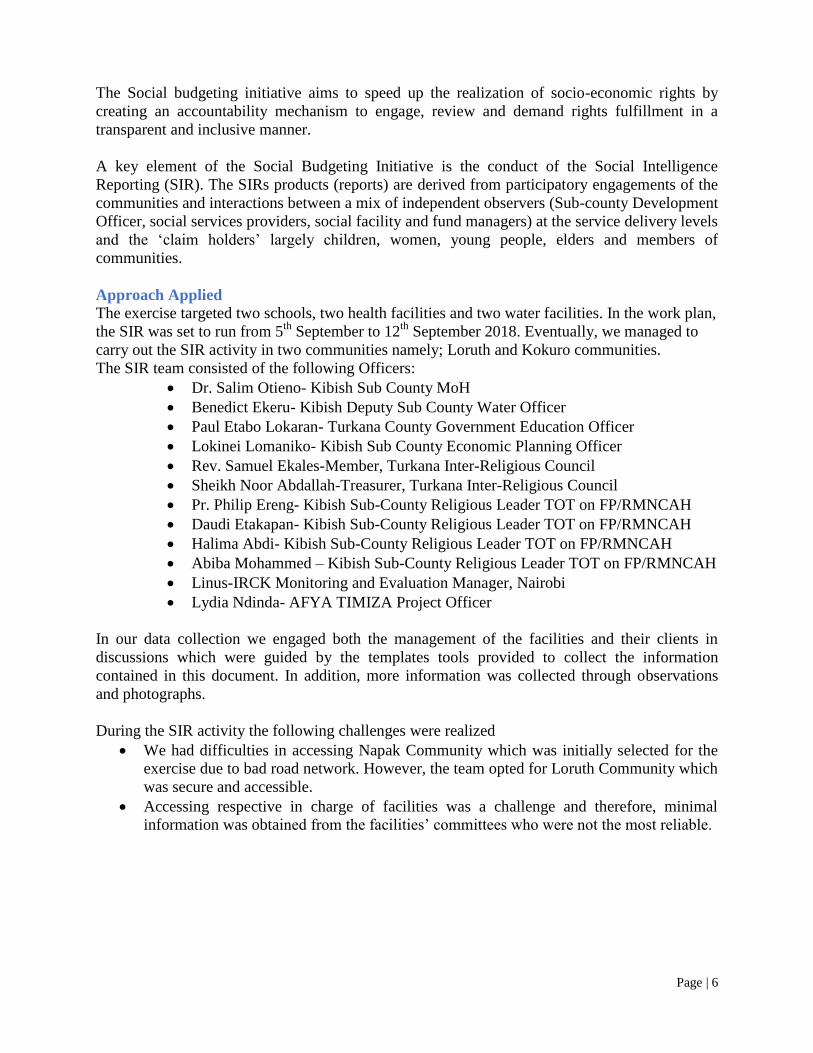
The Social budgeting initiative aims to speed up the realization of socio-economic rights by
creating an accountability mechanism to engage, review and demand rights fulfillment in a
transparent and inclusive manner.
A key element of the Social Budgeting Initiative is the conduct of the Social Intelligence
Reporting (SIR). The SIRs products (reports) are derived from participatory engagements of the
communities and interactions between a mix of independent observers (Sub-county Development
Officer, social services providers, social facility and fund managers) at the service delivery levels
and the „claim holders‟ largely children, women, young people, elders and members of
communities.
Approach Applied
The exercise targeted two schools, two health facilities and two water facilities. In the work plan,
the SIR was set to run from 5th
September to 12th
September 2018. Eventually, we managed to
carry out the SIR activity in two communities namely; Loruth and Kokuro communities.
The SIR team consisted of the following Officers:
Dr. Salim Otieno- Kibish Sub County MoH
Benedict Ekeru- Kibish Deputy Sub County Water Officer
Paul Etabo Lokaran- Turkana County Government Education Officer
Lokinei Lomaniko- Kibish Sub County Economic Planning Officer
Rev. Samuel Ekales-Member, Turkana Inter-Religious Council
Sheikh Noor Abdallah-Treasurer, Turkana Inter-Religious Council
Pr. Philip Ereng- Kibish Sub-County Religious Leader TOT on FP/RMNCAH
Daudi Etakapan- Kibish Sub-County Religious Leader TOT on FP/RMNCAH
Halima Abdi- Kibish Sub-County Religious Leader TOT on FP/RMNCAH
Abiba Mohammed – Kibish Sub-County Religious Leader TOT on FP/RMNCAH
Linus-IRCK Monitoring and Evaluation Manager, Nairobi
Lydia Ndinda- AFYA TIMIZA Project Officer
In our data collection we engaged both the management of the facilities and their clients in
discussions which were guided by the templates tools provided to collect the information
contained in this document. In addition, more information was collected through observations
and photographs.
During the SIR activity the following challenges were realized
We had difficulties in accessing Napak Community which was initially selected for the
exercise due to bad road network. However, the team opted for Loruth Community which
was secure and accessible.
Accessing respective in charge of facilities was a challenge and therefore, minimal
information was obtained from the facilities‟ committees who were not the most reliable.

Page | 7
CHAPTER 1
BACKGROUND INFORMATION
1.1 COUNTY LEVEL
1.1.1 Location, size, administrative units and political units
Turkana County is situated in North Western part of Kenya. It borders West Pokot and Baringo
Counties to the South, Samburu County to the South East, and Marsabit County to the East. It
also borders South Sudan to the North, Uganda to the West and Ethiopia to the North East.
It lies between Longitudes 34° 30‟ and 36°40‟ East and between Latitudes 1° 30‟ and 5° 30‟
North
It covers an area of 71,597.6 Km2, accounting for 13.5% of the total land area in Kenya.
Administrative Units by Sub-County Number
Sub-County Divisions Locations Sub-locations
Turkana South 3 9 21
Turkana East 2 12 30
Turkana North 3 6 17
Kibish 2 9 17
Turkana West 4 13 36
Turkana Central 3 8 21
Loima 3 9 20
Total 20 66 162
Source: Ministry of Interior and National Coordination, Turkana County
Political Units by Sub-County
Number
Constituency Wards
Turkana Central 5
Loima 4
Turkana South 5
Turkana North 6Turkana East 3
Turkana West 7
Total 30
Source: Independent Eelectoral and Boundaries Commission, Turkana County
Page | 8
1.1.2 County subdivision
Sub-County Population* Headquarters
Turkana North
Turkana South
Turkana East
Turkana West
Loima
Kibish
Total
* 1999 census. Sources:
1.1.3 County population and area coverage
In the last census carried out in Kenya in 2009, Turkana County population was reported to be
855,399, the total population is expected to grow to 1,122,207 in 2017 and to 1,366,596 by 2023.
1.1.4 Language and culture
The Turkana, who are plain Nilotes, are the dominant community in the county. The El Molo
community the Minority community in the County and are found on the southern shores of Lake
Turkana
1.1.5 Climate
Turkana has a hot, dry climate with temperatures ranging between 20°C and 41° C and with a
mean of 30.5°C. Rainfall in the area is bimodal and highly variable. The long rain occur between
April and July and short rains between October and November .annual rainfall is low, ranging
from 52 mm to 480 mm with a mean of mm
Rain patterns and distributions are erratic and unreliable
1.1.6 Economic activities
The main economic activity in the County is pastoralism characterized by livestock rearing. The
major livestock reared include cattle, donkeys, camels and goats. Fishing is also practiced at
Lake Turkana, mainly by the El Molo people. Basket weaving is also a major income generating
activity in the county, especially among women in Lodwar and other urban centers. Other
economic activities include farming of cassava, millet, sorghum and drought resistant maize,
honey production, charcoal production, weaving and tourism.
The recent discovery of oil has brought in a fresh focus on Turkana County and the entire region
as a whole with the economic status of the County expected to change when oil drilling
commences.

Page | 9
1.2 SUB-COUNTY LEVEL
1.2.1 Position and size of the Sub-county
Kibish Sub-county is one of the seven sub-counties in Turkana County. It previously formed part
of the former Turkana district before its sub-division in 2007 into three districts namely Turkana
South, Turkana Central and Turkana North. Turkana North was further sub-divided into Turkana
North, Turkana West in 2009. Kibish Sub County was created after March 2013 General
elections as a special Sub County. The sub-county headquarters for Kibish is based at Kibish
center.
The sub-county borders Turkana North sub-county to the south, Turkana West sub-county to the
west, South Sudan to the North West and Ethiopia to the north east. The total area of the sub-
county is approximately 5,087 km².The sub-county lies between Longitudes 35013‟ and 35
033‟
East and between Latitudes 4020‟ and 4
037‟ North.
1.2.3 Administrative and political Units Administratively, Kibish Sub- County consists of two divisions, five locations and seven sub-
locations. The sub-county also comprises of one electoral ward.
Table 1: Sub County Administrative Units
Number
Sub-County Divisions Locations Sub-locations
Kibish 2 9 17
Total 2 9 17
Source: Ministry of Interior and National Coordination, Turkana County
Table 2: Sub-County Political Units
1.2.3 Settlement Structure
The population density in the Sub-County varies from 20 persons per Km² in Kaikor Location to
10 persons per Km² in Lobulono Location. This is based on the 2009 Housing and Population
Census. The low density in Lobulono Location is attributed the frequent cases of cattle rustling
experienced along the border with South Sudan and Ethiopia.
Permanent and semi-permanent settlement areas in the sub-county are found in Kibish, Kokuro
and Kaikor centers. Along these areas, there exist peri-urban market centres with the necessary
social infrastructure like schools and health facilities that support human settlement.
Number
Sub county Wards
Kibish 1
Total 1
Source: Independent Eelectoral and Boundaries Commission, Turkana County

Page | 10
1.2.4 Economic activities
The main economic activity in the Sub County is pastoralism characterized by livestock rearing.
With the major livestock reared being cattle, donkeys, camels and goats. Farming is also done in
some parts of the sub county especially Kaikor and Kokuro. Some of the crops farmed include
sorghum, maize, Sukuma wiki, spinach, tomatoes and onions. Other economic activities include
honey production and charcoal production.
1.2.5 Topographic features
The physiographic features in the sub-county include low lying open plains known as Kasarani
plains, mountain ranges and river drainage patterns. The sub-county has an altitude of 1,579
metres above sea level. The mountain ranges, because of their high elevation are normally
green, covered with dense bushes and high woody cover. The ranges support important
economic activities like honey production, grazing during the dry season, water catchments
sources, gum Arabica harvesting and wood production.
The plains form part of the arid area in the sub-county and receive the lowest amount of rainfall
of around 200 mm per annum. These plains are dominated by dwarf shrub and grassland, which
provide forage for livestock during and shortly after rainy season. However, this forage dries
rapidly at the onset of the dry season.
1.2.6 Climatic Information
Kibish sub-county is Arid and Semi-Arid and is characterized by warm and hot climate. The
temperatures range between 25ºC and 41ºC with a mean of 30ºC.
The rainfall pattern and distribution is erratic and unreliable both with time and space. There are
two rainfall seasons. The long rains usually occur between April and July and the short rains
between October and November and range between 120 mm and 500 mm.
The driest periods are January, February and September. Rainfall is distributed on an east-west
gradient with more rainfall in the eastern parts and other areas of higher elevation. The rain falls
in brief violent storms resulting in flash floods. The surface runoff and potential evaporation
rates are extremely high.
1.2.7 Population
According to the 2009 Population and Housing Census, the present Kibish sub-county comprised
of Kibish division with a population of 21,673. By 2015, the population was projected to be
26,492.

Page | 11
CHAPTER 2
EDUCATION AND LITERACY SECTOR
2.1 COUNTY LEVEL INFORMATION
Increased investment in Early Childhood Development Centers (ECDCs) has raised the number
of children enrolling for basic education in Turkana. The number of primary schools has
significantly increased and this can be attributed to the Constituency Development Funds (CDF)
used in establishing new schools, Faith Based Organizations and Non-Governmental
Organizations.
The number of secondary schools has also increased with two national schools, as shown below:
Education
Sector
Number of schools/institutions Enrolment Staffing and Performance by
Gender and type
Unit Public Private Public Private Public Private
2016/
2017
2017/2
018
2016/2
017
2017/
2018
2016/
2017
2017/
2018
2016/
2017
2017/
2018
2016/
2017
2017/2
018
2016/
2017
2017/
2018
ECD 863 35
Primary
Education 390 395 36 38 143,884 145,707 9,014
Secondary
Education 46 46 6 10 13,631 15,185 967 8,227
2.2 FACILITY LEVEL INFORMATION
The following schools were visited; Loruth Primary School and Kokuro Primary School
2.2.1 Loruth Primary School
Brief background of the school
The school is located at Loruth Centre, Kaaleng/Kaikor ward in Kibish Sub County. Since
inception the school has pupils from class one to class eight. The current total population for the
year 2017/2018 is at 291 pupils; 171 boys and 120 girls. For year 2016/2017 the total population
was 229 pupils. 141 boys and 88 girls. K.C.P.E mean score is 164.46 for 2016 and for 2017 was
not available. The school has 5 teachers, male gender.
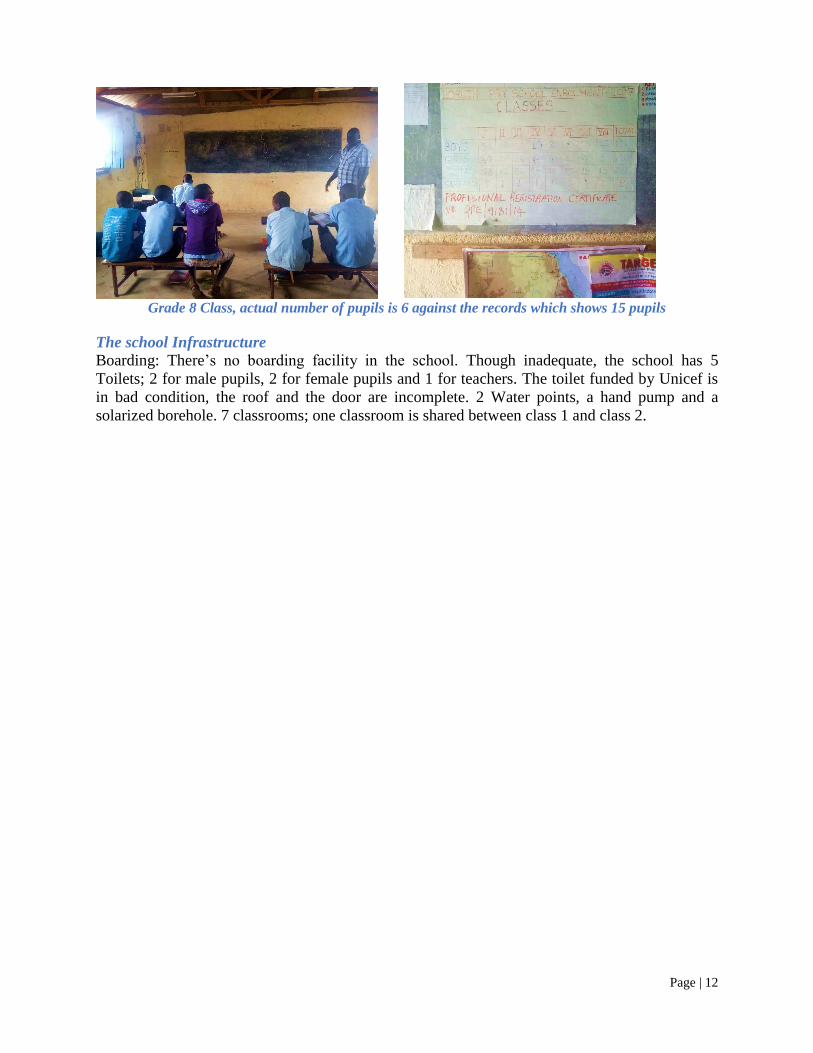
However, it was observed a difference on the school register records against the actual number of
pupils in class.
Page | 12
Grade 8 Class, actual number of pupils is 6 against the records which shows 15 pupils
The school Infrastructure
Boarding: There‟s no boarding facility in the school. Though inadequate, the school has 5
Toilets; 2 for male pupils, 2 for female pupils and 1 for teachers. The toilet funded by Unicef is
in bad condition, the roof and the door are incomplete. 2 Water points, a hand pump and a
solarized borehole. 7 classrooms; one classroom is shared between class 1 and class 2.

Page | 13
Shared Classroom Between Grade 1 and Grade 2 Pupils
Loruth pupils' gender disaggregated toilet
Hole from the collapsed toilet
Table 3: Loruth Primary Enrolment
Loruth Primary Enrolment figure by level and gender
Class 2016/2017 2017/2018
Male Female Male Female
ECDE
One (1) 47 42 51 47
Two (2) 31 20 38 24
Three (3) 26 18 30 26
Four (4) 6 2 10 6
Five (5) 7 1 8 4
Six (6) 6 2 9 4
Seven (7) 10 0 15 4
Eight (8) 8 3 10 5
Total (exclude ECDE) 141 88 171 120

Page | 14
Dropout rate
The dropout rate for girls as drastically increased to 87% in 2017/2018 as compared to 80% in
2016/2017. These was because of early marriage and being pregnant at an early age.
The dropout for boys has marginally reduced to 65% in 2017/2018 up from 70% in 2016/2017.
47 42 31
20 26
18 6 2 7
1 6 2 10
0 8 3
141
88
0
20
40
60
80
100
120
140
160
Boys Girls
Loruth Primary Enrolment in 2017
Std 1 Std 2 Std 3 Std 4 Std 5 Std 6 Std 7 Std 8 Total
51 47
30 24
30 26
10 6 8 4 9
4 15
4 10
5
171
120
0
20
40
60
80
100
120
140
160
180
Boys Girls
Loruth Primary Enrolment in 2018
Std 1 STd 2 Std 3 Std 4 Std 5 Std 6 Std 7 Std 8 Total
Page | 15
Funding
The school is largely funded by the national government to support the free primary education
program. In 2017, the school received KES 151,000 for the School Instructional materials, KES
161,000 for General Purpose Account. It also received KES 300,000 from UNICEF for the
construction of toilets. The information of amount received in 2018 was not displayed as
required.
2.2.2 Kokuro Primary School
Brief background of the school
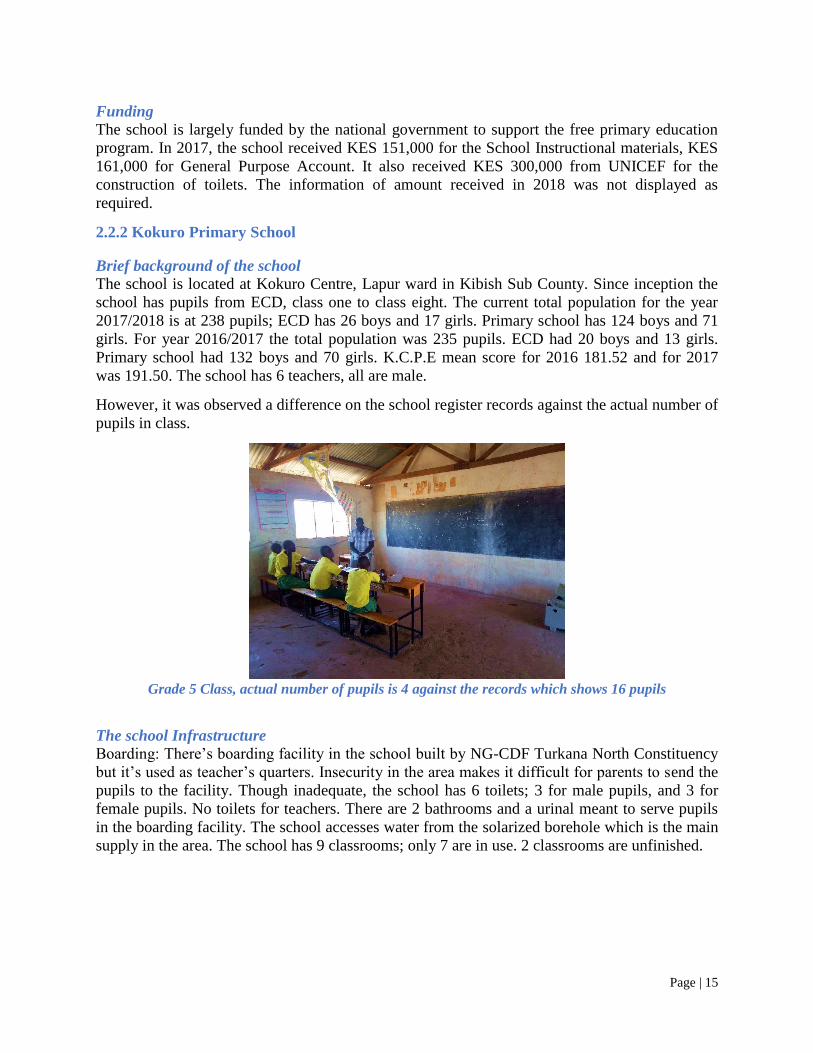
The school is located at Kokuro Centre, Lapur ward in Kibish Sub County. Since inception the
school has pupils from ECD, class one to class eight. The current total population for the year
2017/2018 is at 238 pupils; ECD has 26 boys and 17 girls. Primary school has 124 boys and 71
girls. For year 2016/2017 the total population was 235 pupils. ECD had 20 boys and 13 girls.
Primary school had 132 boys and 70 girls. K.C.P.E mean score for 2016 181.52 and for 2017
was 191.50. The school has 6 teachers, all are male.
However, it was observed a difference on the school register records against the actual number of
pupils in class.
Grade 5 Class, actual number of pupils is 4 against the records which shows 16 pupils
The school Infrastructure
Boarding: There‟s boarding facility in the school built by NG-CDF Turkana North Constituency
but it‟s used as teacher‟s quarters. Insecurity in the area makes it difficult for parents to send the
pupils to the facility. Though inadequate, the school has 6 toilets; 3 for male pupils, and 3 for
female pupils. No toilets for teachers. There are 2 bathrooms and a urinal meant to serve pupils
in the boarding facility. The school accesses water from the solarized borehole which is the main
supply in the area. The school has 9 classrooms; only 7 are in use. 2 classrooms are unfinished.

Page | 16
Unfinished classroom
ECD class pupils during break time, they use the dining hall as
their classroom which is also used as a store
Class 3 pupils in class session, every pupil is happy to have a
place to sit and write on the desks provided by Shalom Centre
Boarding facility being used as teacher's quarter and book
store
Table 4: Kokuro Primary Enrolment
Enrolment figure by level and gender
2016/2017 2017/2018
Male Female Male Female
Kokuro Primary ECDE 20 13 26 17
One (1) 32 24 36 23
Two (2) 16 9 14 10
Three (3) 17 9 12 8
Four (4) 13 7 11 8
Five (5) 10 10 8 8
Six (6) 10 7 10 8
Seven (7) 17 1 15 3
Eight (8) 17 3 18 3

Page | 17
Total (exclude ECDE) 132 70 124 71
Dropout rate
The dropout rate for girls stands at 72% in 2017/2018. The dropout for boys stands at 15% in
2017/2018. The number of pregnancy cases was last reported in 2014, 2 girls in standard 6 and 8.
32 24
16 9
17 9
13 7 10 10 10 7
17
1
17
3
132
70
0
20
40
60
80
100
120
140
Boys Girls
Kokuro Primary Enrolment in 2017
Std 1 Std 2 Std 3 Std 4 Std 5 Std 6 Std 7 Std 8 Total
36
23 14
10 12 8 11 8 8 8 10 8
15
3
18
3
124
71
0
20
40
60
80
100
120
140
Boys Girls
Kokuro primary Enrolment in 2018
Std 1 Std 2 Std 3 Std 4 Std 5 Std 6 Std 7 Std 8 Total

Page | 18
These dropout rates is attributed to: age of the pupils when above a certain age they drop out of
school, early marriage, delays in the school feeding program, the nomadic way of life that is
during wet season the retention rate is high compared to the dry season and exam fees.
Funding
The school is largely funded by the national government, but the amount received by the school
was not displayed. Development partners such as SHALOM center provided desks and
construction materials on 28th
August 2018. Safaricom also pays the school KES 120,000 per
quarter and was used to construct the kitchen in 2017. UNICEF also donated KES 500,000 for
connection of water in 2017 and CDF allocated KES 3 million for the construction of school‟s
dining hall in 2017
2.2.3 School Performances
School KCPE Mean (Marks 0ut of 500)
2016 2017
Loruth primary 181.52 191.50
Kokuro primary 164.46 -
2.2.4 Staffing
Primary Schools Male (TSC) Female (TSC) Total pupils
Teacher: Pupil
ratio
Loruth primary 5 0 520 1:104
Kokuro primary 6 0 397 1:66
2.2.5 School Facilities
Toilets
School
Teachers Pupils
Males Females Males Females
Loruth primary 0 0 3 3
Kokuro primary 1 0 6 6
Water Points
School Water points
Hand washing facilities
Loruth primary 2 0
Kokuro primary 1 0

Page | 19
2.2.6 Challenges facing the facilities and Recommendations
Facility Challenges facing the facility Recommendations
Loruth primary Acute shortage of staff Ensure gender mainstreaming
by observing the two thirds
gender rule by also employing
female teachers
Poor school management Capacity build the Board of
Management with skills on
management and
administration including
conducting orientation on their
roles and responsibilities
Sensitize the local level
communities on social
accountability to improve
governance for improved
service delivery
Poor school furnishing characterized
by:
Pupils sitting on stones
Classes rough floors
Provision of pupils with desks
Install a structural upgrade of
the classroom floor plans.
Lack of staff quarters Construction of staff quarters
adequate for the staffing level
in the school
The school has no fence Construction of the school
fence
No access to lighting system Establishment of the school‟s
lighting system since the
school already has installed
solar panels.
Low birth registration levels Sensitize communities on the
importance of civil registry in
safe guarding the basic rights
of children and identity
including legal protection
Encourage Civil Registry
office to hold open days at the
community levels to enhance
registration.
The toilets structural and hygienic
condition is deplorable Renovation of the existing
toilets
Incomplete ECD classroom Completion of the ECD
classroom and proper

Page | 20
furnishing with floor and
equipment
Inadequate classrooms Construction of one more
classroom
Uncovered collapsed pit latrine Fill up the pit
Kokuro Primary Challenges facing the facility Recommendations
Lack of lighting system Establishment of the school‟s
lighting system since the
school already has installed
solar panels.
High levels of insecurity Ensure improved security in
the area
Lack of staff quarters Construction of staff quarters
adequate for the staffing level
in the school
Lack of ECD Class Construction of an ECD
classroom
Employment of an ECD
teacher
Low birth registration levels Sensitize communities on the
importance of civil registry in
safe guarding the basic rights
of children and identity
including legal protection.
Encourage Civil Registry
office to hold open days at the
community levels to enhance
registration.
The school‟s feeding program is not
reliable
Maintain the feeding program
provide food subsidy
Incomplete classroom Commence with the classroom
roofing materials delivered by
Shalom Centre
2.1.7 Secondary Schools
There were no Secondary schools around Loruth and Kokuro centers.

Page | 21
CHAPTER 3
HEALTH SECTOR
3.1 COUNTY LEVEL INFORMATION
Access to health service in the county has improved in the last four years, the average distance a
person needs to travel to the nearest health facility dropped from 50Km in 2013 to 35Km in
2017. A majority (81.7%) of the Population seek care from Public clinics. In Turkana North,
nearly 10% seek assistance from mobile clinics, the highest proportion in the county. Lodwar
County Referral Hospital has a new ICU, among other upgrades.
There are 13 hospitals, 19 health centers, 177 dispensaries and 168 community health units. Of
these there are 1 hospital, 2 health centers with maternity wards and 5 health clinics serving
refugees and host communities in Kakuma camps and Kalobeyei settlement.
Staffing
Number of health personnel
Public Private
2016/17 2017/18 2016/17 2017/18
Doctors/Pharmacists 21 1
Clinical officers 123 2
Nurses 56 99
Other health personnel
3.2 FACILITY LEVEL INFORMATION
The following health facilities were visited: Loruth dispensary and Kokuro health center.
3.2.1. Loruth Dispensary
Brief background of the facility
The dispensary is located in Loruth Centre, Kaaleng/Kaikor ward. It was started as a public
dispensary in 2006 and is operated by the County Government of Turkana. Currently, the facility
has 6 staff members. These includes; 2 females and 4 male workers. 3 are subordinate staff; 1
watchman, 1 cleaner and 1 patient attendant. 3 are technical staff; 2 nurses, a nutritionist and a
community health extension worker (CHW).

Page | 22
Focus Group Discussion between the SIR Team with the Loruth Dispensary Management Committee
Infrastructure
Water serving the facility is outsourced and stored in water tanks from community water Supply
System. Water is purified once in every 2 months though supply of PUR to the community, since
the water is not purified from the source. Water is not enough to efficiently sustain the facility
because the facility is not the only beneficiary of the supply system.
Causes of morbidity in the last three months for outpatients
Leading causes of
morbidity
2016/2017 2017/2018
Male Female Male Female
Adult > 18 Malaria Upper
Respiratory tract
infection
Malaria Upper
Respiratory
tract infection
Diarrhea Diarrhea Diarrhea Diarrhea
Upper
Respiratory
tract
infections
Malaria Upper
Respiratory
tract
infections
Malaria
Children < 5 Upper
Respiratory
tract
infections
Upper
Respiratory tract
infection
Upper
Respiratory
tract
infections
Upper
Respiratory
tract infection
Diarrhea Malaria Diarrhea Malaria
Malaria Diarrhea Malaria Diarrhea
Causes of morbidity in the last three months for inpatients
Leading causes of
morbidity
2016/2017 2017/2018
Male Female Male Female
Adult > 18 N/A N/A N/A N/A
N/A N/A N/A N/A
N/A N/A N/A N/A

Page | 23
Children < 5 N/A N/A N/A N/A
N/A N/A N/A N/A
N/A N/A N/A N/A
Note: The facility has no inpatient services
Funding
The center is funded by Ministry of health. At the time of visit, records were not accessed
because the records office was locked. The facility committee however pointed out that the
subordinate staffs are paid using the HSSF funds received from the County Government of
Turkana. It was noted that the facility receives little amount of money which is not enough to
effectively run the facility activities.
3.2.2. Kokuro Health Center
Brief background of the facility
The dispensary is located in Kokuro Centre, Lapur ward. It was started as a public dispensary
though the County Government has since upgraded it to a Health center, but it has not yet been
approved by the National Government Ministry of health services. Currently, the facility has 6
staff members. All are male.
Focus Group Discussion between the SIR team with the Kokuro Health Centre Management Committee
Infrastructure
Water serving the facility is outsourced and stored in water tanks from community water Supply
System. Water source is reliable throughout the year though was is not purified but the quality is
fresh ad soft.
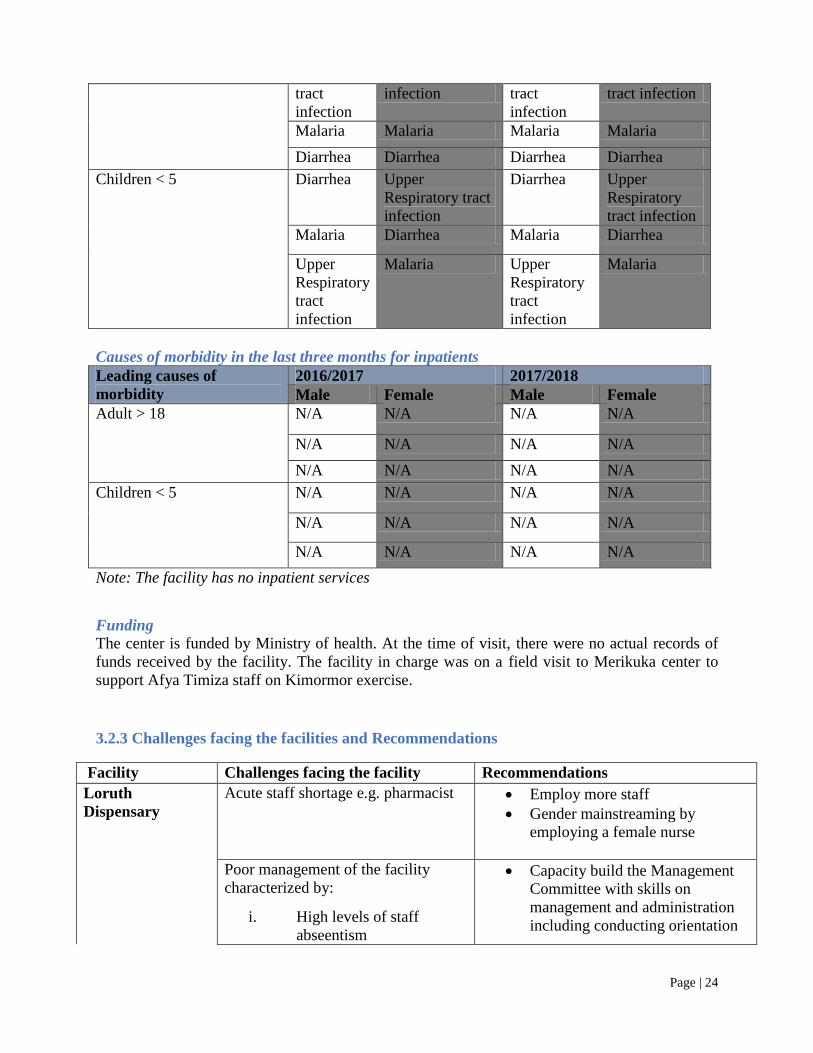
Causes of morbidity in the last three months for outpatients
Leading causes of
morbidity
2016/2017 2017/2018
Male Female Male Female
Adult > 18 Upper
Respiratory
Upper
Respiratory tract
Upper
Respiratory
Upper
Respiratory
Page | 24
tract
infection
infection tract
infection
tract infection
Malaria Malaria Malaria Malaria
Diarrhea Diarrhea Diarrhea Diarrhea
Children < 5 Diarrhea Upper
Respiratory tract
infection
Diarrhea Upper
Respiratory
tract infection
Malaria Diarrhea Malaria Diarrhea
Upper
Respiratory
tract
infection
Malaria Upper
Respiratory
tract
infection
Malaria
Causes of morbidity in the last three months for inpatients
Leading causes of
morbidity
2016/2017 2017/2018
Male Female Male Female
Adult > 18 N/A N/A N/A N/A
N/A N/A N/A N/A
N/A N/A N/A N/A
Children < 5 N/A N/A N/A N/A
N/A N/A N/A N/A
N/A N/A N/A N/A
Note: The facility has no inpatient services
Funding
The center is funded by Ministry of health. At the time of visit, there were no actual records of
funds received by the facility. The facility in charge was on a field visit to Merikuka center to
support Afya Timiza staff on Kimormor exercise.
3.2.3 Challenges facing the facilities and Recommendations
Facility Challenges facing the facility Recommendations
Loruth
Dispensary
Acute staff shortage e.g. pharmacist Employ more staff
Gender mainstreaming by
employing a female nurse
Poor management of the facility
characterized by:
i. High levels of staff
abseentism
Capacity build the Management
Committee with skills on
management and administration
including conducting orientation
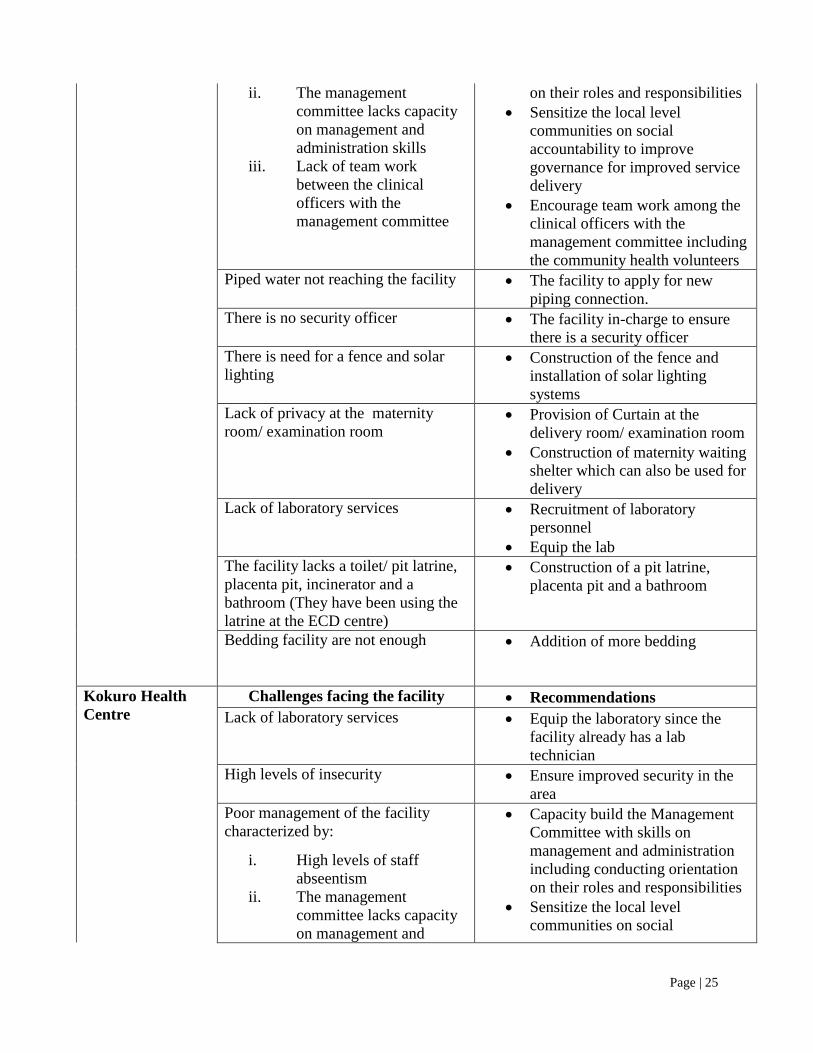
Page | 25
ii. The management
committee lacks capacity
on management and
administration skills
iii. Lack of team work
between the clinical
officers with the
management committee
on their roles and responsibilities
Sensitize the local level
communities on social
accountability to improve
governance for improved service
delivery
Encourage team work among the
clinical officers with the
management committee including
the community health volunteers
Piped water not reaching the facility
The facility to apply for new
piping connection.
There is no security officer The facility in-charge to ensure
there is a security officer
There is need for a fence and solar
lighting Construction of the fence and
installation of solar lighting
systems
Lack of privacy at the maternity
room/ examination room
Provision of Curtain at the
delivery room/ examination room
Construction of maternity waiting
shelter which can also be used for
delivery
Lack of laboratory services
Recruitment of laboratory
personnel
Equip the lab
The facility lacks a toilet/ pit latrine,
placenta pit, incinerator and a
bathroom (They have been using the
latrine at the ECD centre)
Construction of a pit latrine,
placenta pit and a bathroom
Bedding facility are not enough
Addition of more bedding
Kokuro Health
Centre
Challenges facing the facility Recommendations
Lack of laboratory services
Equip the laboratory since the
facility already has a lab
technician
High levels of insecurity Ensure improved security in the
area
Poor management of the facility
characterized by:
i. High levels of staff
abseentism
ii. The management
committee lacks capacity
on management and
Capacity build the Management
Committee with skills on
management and administration
including conducting orientation
on their roles and responsibilities
Sensitize the local level
communities on social

Page | 26
administration skills
iii. Lack of team work
between the clinical
officers with the
management committee
accountability to improve
governance for improved service
delivery
Encourage team work among the
clinical officers with the
management committee including
the community health volunteers
No access to lighting system Establishment of the school‟s
lighting system since the school
already has installed solar panels.
Acute shortage of staff Gender mainstreaming by
employing a female nurse
Employ more staff
The maternity room has been
declared unfit for use by the PHO
without any recommendations since
the room has cracks and is at the
verge of falling
Follow up with the PHO for
recommendations
Renovation or construction of a
new maternity room
The facility lacks a fence Commence with the
establishment of the fence since
the materials have already been
supplied

Page | 27
CHAPTER 4
WATER AND SANITATION SECTOR
4.1 COUNTY LEVEL INFORMATION
4.1.1 Water Resources and Quality
Turkana is generally a water scarce County. The main sources of water for domestic and
livestock include; Boreholes, Pans, Dams and Shallow wells, springs and roof catchments. Water
quality in the county is generally good.
Most water sources in the county are not protected hence contaminated. Human habitation along
Catchment areas, lack of proper sanitation and sewerage services in the major urban centers are
the main causes of water contamination.
4.1.2 Water Supply Schemes Water in major urban centres in the County is supplied and managed by the Lodwar Water and
Sanitation Company (LOWASCO) in collaboration with the County Water Directorate. The
major urban centers include; Lodwar, Kakuma, Lokichar, Lokichoggio, Kalemng‟orok and
Kainuk. Major rehabilitation and augmentation was carried out in all the water supplies under
LOWASCO and are currently operational with minimum setbacks.
Rural water supplies across the Counties are managed by respective water management
committees.
4.1.3 Water Sources The county has been classified as water scarce. The average distance to Water points is
approximately 20 kilometers in rural areas but it reduces in urban and market centers. The
following is a breakdown of the current water sources for domestic and livestock use in the
county;
Operational Boreholes
Water Pans
Springs
Others are various shallow wells owned by some community members and individuals
4.1.4 Sanitation Sanitation in the county is poor due to low latrine coverage as most people do not use pit latrines
Because of cultural beliefs. The public health department in collaboration with stakeholders
undertakes Chlorination of water sources through provision of chlorination tablets across the
county. The water Department also undertakes health education on sanitation, water treatment
and safe storage before consumption.

Page | 28
4.1.5 Funding The county funding information is summarized in the table below:
County Level
information
2016/2017 2017/ 2018 Notes /Remarks
Kenya
shillings
Kenya
shilling
DW1: Amount of
Fund received (Ksh)
DW1a: MoWI 814,000,000 646,319,693 Supplementary budget
DW1b: Water Trust
Fund 0 0 Anticipating 72 Million
DW1c: CDTF 0 0
DW1d: Others 0 605,000,000
Equalization fund through Rift Valley
Water Service Board
4.2 FACILITY LEVEL INFORMATION
4.2.1 Loruth Water Supply System
Considered as rural facility, the water facility is located at the Loruth Center in Kaaleng Kaikor
ward, Kibish Sub County. The water is quality is saline. The water source is reliable.
2016/2017 2017/2018
Average supply per day in
dry season
100 liters/HH 100 liters/HH
Average supply in wet
season
60 liters/HH 60 liters/HH
Number of households using
the water
350 HHs 350 HHs
Number of livestock using
water
5000 shoats 3000 shoats
% of adult males drawing
water
20% 20%
%of females drawing water 30% 30%
%of female children <18
drawing water
30% 30%
% of male children <18
drawing water
20% 20%

Page | 29
100 100
60 60
0
20
40
60
80
100
120
2016/2017 2017/2018
loruth Average water supply in wet and dry season
average water supply per day in dry season average water supply per day in wet season
350 350
20 20 30 30 30 30 20 20
0
50
100
150
200
250
300
350
400
2016/2017 2017/2018
loruth Household Information on Water
Number of HHs using water % of adult males drawing water
%of females drawing water %of female children <18 drawing water
% of male children <18 drawing water

Page | 30
4.2.2 Loruth Primary Hand Pump
Loruth Primary school hand pump
Considered as rural facility, the water facility is located at the Loruth Center in Kaaleng/Kaikor
ward, Kibish Sub County. The water is quality is saline.
2016/2017 2017/2018
Average supply per day in dry season 400 liters 400 liters
Average supply in wet season 400 liters 400 liters
Number of households using the water - -
Number of livestock using water - -
% of adult males drawing water - 7 = 88%
%of females drawing water - 1 = 12%
%of female children <18 drawing water - 260 = 55%
% of male children <18 drawing water - 207 = 45%

Page | 31
400 400 400 400
0
50
100
150
200
250
300
350
400
450
2016/2017 2017/2018
loruth Average water supply in wet and dry season
Average water supply per day in dry season Average water supply in wet season
0 0 0
88
0
12
0
55
0
45
0
10
20
30
40
50
60
70
80
90
100
2016/2017 2017/2018
loruth Household Information on Water
Number of households using the water % of adult males drawing water
%of females drawing water %of female children <18 drawing water
% of male children <18 drawing water

Page | 32
4.2.3 Kokuro Water Supply System
Kokuro water supply system
Considered as rural facility, the water facility is located at the Kokuro Center in Lapur ward,
Kibish Sub County. The water is quality is fresh. There‟s operational water tariffs.
2016/2017 2017/2018
Average supply per day in dry season 40 liters/HH/Day 40 liters/HH/Day
Average supply in wet season 200 liters/HH/Day 200/HH/Day
Number of households using the water 2024 People
337 HHs
2500 People
416 HHs
Number of livestock using water - -
% of adult males drawing water 1194 males
58%
1500 females
60%
%of females drawing water 42% 40%
%of female children <18 drawing water 35% 40%
% of male children <18 drawing water 65% 60%

Page | 33
4.2.4 Challenges facing the facilities and Recommendations
Facility Challenges facing the facility Recommendations
Loruth Water
Supply System
Water pump is insufficient. When its
cloudy there is marked reduction of
the amount of water yielded
It will require a hybrid system
(solar and generator) to solve the
situation.
40
200
40
200
1 0
50
100
150
200
250
2016/2017 2017/2018
Kokuro Average water supply in dry and wet seasons
Average supply per day in dry season/HH/Day Average supply in wet season/HH/Day
337
416
58 60 42 40 35 40
65 60
0
50
100
150
200
250
300
350
400
450
2016/2017 2017/2018
Kokuro Household Information on Water
Number of households using the water % of adult males drawing water
%of females drawing water %of female children <18 drawing water
% of male children <18 drawing water

Page | 34
Poor school management Capacity build the Water Users‟
Association with skills on
management and administration
including conducting orientation
on their roles and responsibilities
Sensitize the local level
communities on social
accountability to improve
governance for improved service
delivery
Loruth Primary
school borehole
Poor drainage system at Loruth
Primary School Borehole
Renovation of the borehole
drainage system
Kokuro Water
Supply
Challenges facing the facility Recommendations
Existence of notable defaulters such
as the Administration Police and
Health Center, from the monthly
tariffs. The last time the health
facility paid its tariff was in October
2017.
The Water Users‟ Committee
commence disconnection OF the
defaulters.
Poor school management Capacity build the Water Users‟
Association with skills on
management and administration
including conducting orientation
on their roles and responsibilities
Sensitize the local level
communities on social
accountability to improve
governance for improved service
delivery

CHAPTER 5
CONCLUSION AND RECOMMENDATION
Optimal staffing at education and health facilities should be addressed towards improving the
quality of available services. Strategies for timely interventions should be strengthened at facility
levels towards addressing immediate, medium term and long-term needs through strategic plans
and school infrastructure development plans.
Timely completion of ongoing structural works at facility levels is called for. Among these are
classrooms, administration blocks, staff houses, laboratory blocks, sanitation blocks and
perimeter fences. In follow up of agreed recommendations and conduct of subsequent SIR,
support is called for ensure that the issues raised are closed out to the desired conclusion by all
relevant and responsible authorities.
Adequate provision of essential supplies and nutritional supplements to health facilities on
regular basis should be informed by the by facility specific demands. Referral mechanisms and
handling of emergency cases require fast tracking through proper equipment such as ambulances
services.
Parents need to meet their obligations on timely acquisition of birth certificates as this has been
emphasized as a major area of compliance particularly by the Kenya National Examination
Council. This should form part of the agenda in school management committee sittings.
Religious leaders have a role to sensitize communities and congregations on the importance of
civil registry in safe guarding the basic rights of children and identity including legal protection
There is need to empower the local level communities on civic education in the following areas;
public finance management act and social accountability in order to encourage improve
governance for enhanced public service delivery.
END/-


