213
COUNTY OF LOS ANGELES COMPREHENSIVE ANNUAL FINANCIAL REPORT Fiscal Year Ended June 30, 2009 Wendy L. Watanabe, Auditor-Controller

COUNTY OF LOS ANGELES COMPREHENSIVE ANNUAL FINANCIAL REPORT Fiscal Year Ended June 30, 2009 Wendy L. Watanabe, Auditor-Controller

COUNTY OF LOS ANGELES COMPREHENSIVE ANNUAL FINANCIAL REPORT FOR THE FISCAL YEAR ENDED JUNE 30, 2009
TABLE OF CONTENTS
PageI. INTRODUCTORY SECTION:
Auditor-Controller’s Letter of Transmittal ....................................................................................... i Certificate of Achievement for Excellence in Financial Reporting ............................................... ix Board of Supervisors and Principal County Officials .................................................................... x Organization Chart....................................................................................................................... xi
II. FINANCIAL SECTION:
Independent Auditor’s Report .......................................................................................................1 Management’s Discussion and Analysis (Required Supplementary Information-Unaudited) ......3 Basic Financial Statements:
Government-wide Financial Statements: Statement of Net Assets..................................................................................................23 Statement of Activities.....................................................................................................24
Fund Financial Statements: Balance Sheet - Governmental Funds ............................................................................26 Reconciliation of the Balance Sheet of Governmental Funds to the
Statement of Net Assets ............................................................................................28 Statement of Revenues, Expenditures, and Changes in Fund Balances -
Governmental Funds .................................................................................................30 Reconciliation of the Statement of Revenues, Expenditures, and Changes in
Fund Balances of Governmental Funds to the Statement of Activities .....................32 Statements of Revenues, Expenditures, and Changes in Fund Balance -
Budget and Actual on Budgetary Basis: General Fund .......................................................................................................33 Fire Protection District .........................................................................................34 Flood Control District............................................................................................35 Public Library .......................................................................................................36 Regional Park and Open Space District ..............................................................37
Statement of Net Assets - Proprietary Funds..................................................................38 Statement of Revenues, Expenses and Changes in Fund Net Assets -
Proprietary Funds ......................................................................................................40 Statement of Cash Flows - Proprietary Funds ................................................................42 Statement of Fiduciary Net Assets - Fiduciary Funds .....................................................46 Statement of Changes in Fiduciary Net Assets - Fiduciary Funds..................................47
Notes to the Basic Financial Statements ..............................................................................48 Required Supplementary Information-Unaudited:
Schedule of Funding Progress - Pension Plan ...................................................................105 Schedule of Funding Progress - Other Post Employment Benefits ....................................106

COUNTY OF LOS ANGELES COMPREHENSIVE ANNUAL FINANCIAL REPORT FOR THE FISCAL YEAR ENDED JUNE 30, 2009
TABLE OF CONTENTS
Page
Combining and Individual Fund Statements and Schedules: Major Governmental Fund - General Fund -
Schedule of Expenditures - Budget and Actual on Budgetary Basis ............................107 Nonmajor Governmental Funds:
Combining Balance Sheet - Nonmajor Governmental Funds - Summary.....................109 Combining Statement of Revenues, Expenditures and Changes in Fund Balances -
Nonmajor Governmental Funds - Summary............................................................110 Combining Balance Sheet - Nonmajor Governmental Funds - Special Revenue.........112 Combining Statement of Revenues, Expenditures and Changes in Fund Balances -
Nonmajor Governmental Funds - Special Revenue ................................................116 Schedules of Revenues, Expenditures and Changes in Fund Balance -
Nonmajor Governmental Funds - Special Revenue - Budget and Actual on Budgetary Basis:
Totals..................................................................................................................119 Road...................................................................................................................120 Other Streets, Highways, Roads, and Bridges ..................................................121 Street Lighting Districts .....................................................................................122 Garbage Disposal Districts.................................................................................123 Sewer Maintenance Districts..............................................................................124 Health Services Measure B................................................................................125 Health and Sanitation.........................................................................................126 Other Public Protection ......................................................................................127 Public Assistance ...............................................................................................128 Recreation..........................................................................................................129 Courthouse Temporary Construction.................................................................130 Criminal Justice Temporary Construction ..........................................................131 Registrar Recorder Improvement.......................................................................132 Other Special Revenue......................................................................................133
Combining Balance Sheet - Nonmajor Governmental Funds - Debt Service ...............134 Combining Statement of Revenues, Expenditures and Changes in Fund Balances -
Nonmajor Governmental Funds - Debt Service.......................................................136 Schedules of Revenues, Expenditures and Changes in Fund Balance -
Nonmajor Governmental Funds - Debt Service - Budget and Actual on Budgetary Basis - Regional Park and Open Space District.....................................138
Combining Balance Sheet - Nonmajor Governmental Funds - Capital Projects...........139 Combining Statement of Revenues, Expenditures and Changes in Fund Balances -
Nonmajor Governmental Funds - Capital Projects ..................................................140 Combining Balance Sheet - Nonmajor Governmental Funds - Permanent Funds .......141 Combining Statement of Revenues, Expenditures and Changes in Fund Balances -
Nonmajor Governmental Funds - Permanent Funds...............................................142

COUNTY OF LOS ANGELES COMPREHENSIVE ANNUAL FINANCIAL REPORT FOR THE FISCAL YEAR ENDED JUNE 30, 2009
TABLE OF CONTENTS
Page
Nonmajor Enterprise Funds: Combining Statement of Net Assets - Nonmajor Enterprise Funds..............................143 Combining Statement of Revenues, Expenses and Changes in Fund Net Assets -
Nonmajor Enterprise Funds.....................................................................................144 Combining Statement of Cash Flows - Nonmajor Enterprise Funds.............................145
Internal Service Funds: Combining Statement of Net Assets - Internal Service Funds ......................................147
Combining Statement of Revenues, Expenses and Changes in Fund Net Assets - Internal Service Funds.............................................................................................148
Combining Statement of Cash Flows - Internal Service Funds.....................................149 Fiduciary Funds:
Combining Statement of Fiduciary Net Assets - Fiduciary Funds - Investment Trust Funds ...........................................................................................151
Combining Statement of Changes in Fiduciary Net Assets - Fiduciary Funds - Investment Trust Funds ...........................................................................................152
Combining Statement of Changes in Assets and Liabilities - Fiduciary Funds - Agency Funds..........................................................................................................153
III. STATISTICAL SECTION (Not covered by Independent Auditor’s Report):
Statistical Section - Contents....................................................................................................155
Schedules of Financial Trends Information Net Assets by Category - Last Eight Fiscal Years ..............................................................157 Changes in Net Assets - Last Eight Fiscal Years ...............................................................158 Fund Balances, Governmental Funds - Last Eight Fiscal Years ........................................160 Changes in Fund Balances, Governmental Funds - Last Eight Fiscal Years.....................162 Bar Chart-Governmental Funds Expenditures and Revenues - Last Eight Fiscal Years ...163
Schedules of Revenue Capacity Information Assessed Value and Actual Value of Taxable Property - Last Ten Fiscal Years ...............164 Direct and Overlapping Property Tax Rates - Tax Rate Area #4 - Last Ten Fiscal Years .165 Principal Property Taxpayers - Current Year and Nine Years Ago.....................................166 Property Tax Levies and Collections - Last Ten Fiscal Years ............................................167

COUNTY OF LOS ANGELES COMPREHENSIVE ANNUAL FINANCIAL REPORT FOR THE FISCAL YEAR ENDED JUNE 30, 2009
TABLE OF CONTENTS
Page
Schedules of Debt Capacity Information Ratio of Outstanding Debt by Type - Last Ten Fiscal Years...............................................168 Ratio of Net General Bonded Debt - Last Ten Fiscal Years ...............................................169 Estimated Direct and Overlapping Bonded Debt ................................................................170 Computation of Legal Debt Margin - Last Ten Fiscal Years ...............................................172 Pledged-Revenue Coverage - Last Eight Fiscal Years.......................................................173
Schedules of Demographic and Economic Information Demographic and Economic Statistics - Last Ten Fiscal Years .........................................174 Ten Largest Industries – Current Year and Nine Years Ago ..............................................175
Schedules of Operating Information Full-Time Equivalent County Employees by Function/Program - Last Ten Fiscal Years ...176 Operating Indicators by Function/Program - Last Eight Fiscal Years .................................177 Capital Asset Statistics by Function/Program - Last Eight Fiscal Years.............................178

IIINNNTTTRRROOODDDUUUCCCTTTOOORRRYYY SSSEEECCCTTTIIIOOONNN
C O U N T Y O F L O S A N G E L E S DEPARTMENT OF AUDITOR-CONTROLLER
KENNETH HAHN HALL OF ADMINISTRATION 500 WEST TEMPLE STREET, ROOM 525 LOS ANGELES, CALIFORNIA 90012-3873
PHONE: (213) 974-8301 FAX: (213) 626-5427
Help Conserve Paper – Print Double-Sided “To Enrich Lives Through Effective and Caring Service”
WENDY L. WATANABE AUDITOR-CONTROLLER
MARIA M. OMS CHIEF DEPUTY
ASST. AUDITOR-CONTROLLERS
ROBERT A. DAVIS JOHN NAIMO
JUDI E, THOMAS
December 11, 2009
The Honorable Board of Supervisors County of Los Angeles 383 Kenneth Hahn Hall of Administration 500 West Temple Street Los Angeles, California 90012
Dear Supervisors:
In accordance with Section 25253 of the Government Code of California, I hereby submit the Comprehensive Annual Financial Report (CAFR) of the County of Los Angeles for the year ended June 30, 2009. The report contains financial statements that have been prepared in accordance with generally accepted accounting principles (GAAP) prescribed for governmental entities, and provides a comprehensive overview of the County's financial operations and financial position. The accuracy, completeness and fairness of the presentation of all information in this report are the responsibility of the County.
The Independent Auditor’s Report is presented at the front of the financial section of this report. Management’s Discussion and Analysis (MD&A), immediately follows the Independent Auditor’s Report and provides a narrative introduction, overview, and analysis of the basic financial statements. The MD&A complements this letter of transmittal and should be read in conjunction with it.
The report includes financial data for all County funds. Additionally, the following entities are considered part of the County for purposes of meeting the reporting entity requirements prescribed by the Governmental Accounting Standards Board:
Fire Protection District Regional Park and Open Space District Flood Control District Garbage Disposal Districts Street Lighting Districts Sewer Maintenance Districts Improvement Districts Waterworks Districts Community Development Various Joint Powers Authorities Commission (including the Los Angeles County Employees Retirement Association Housing Authority of the Los Angeles County Capital Asset Leasing Corporation County of Los Angeles) Los Angeles County Securitization Corporation First 5 LA

Honorable Board of Supervisors December 11, 2009 Page 2
These entities are component units of the County and are included in the County's basic financial statements because the County Board of Supervisors is financially accountable for them. All component units are blended into the basic financial statements except for First 5 LA, which is discretely presented. Note 1 to the basic financial statements contains additional information regarding the relationship between the County and these entities.
Other local governmental entities provide public or specialized services to the residents of the County, including over eighty cities, one hundred school districts and numerous special districts. The operations of these entities are not included in the County's reporting entity since each entity is responsible for conducting its own day-to-day operations and is compelled to answer to its own separately elected governing board. Significant entities that do not meet the criteria for inclusion in this report include the City of Los Angeles, Los Angeles Unified School District and Los Angeles County Sanitation Districts. Also, the Los Angeles County Superior Court is not included due to legislation (AB233) which transferred oversight responsibilities for Court operations to the State in 1997-98. However, AB233 requires the County to continue to fund certain Court-related expenditures, and the County continues to receive certain Court collections. Accordingly, the County's financial statements include various Court-related financial transactions.
LOS ANGELES COUNTY AND ITS SERVICES
Los Angeles County was established by an act of the State Legislature on February 18, 1850 as one of California's original 27 counties. Located in the southern portion of the State, the County covers 4,083 square miles. With a population of nearly 10.4 million, its population is the largest of any county in the nation.
Los Angeles County was a general law county until 1913 when it became a charter county as a result of local election. The County is governed by a five-member Board of Supervisors who are elected by district to serve alternating four-year terms. The Assessor, District Attorney and Sheriff are also elected officials while all other departments are headed by appointed officials. On March 5, 2002, County voters approved two charter amendments providing for term limits for members of the Board of Supervisors. The affected officials are limited to three consecutive terms commencing December 2002.
On March 27, 2007, the Board of Supervisors (Board) amended the County Code by adopting the Interim Governance Structure Ordinance. This governance structure provides delegated authority to the Chief Executive Office (CEO) to oversee, evaluate, and recommend for appointment and removal certain Department Heads and County Officers. The departments that continue to report directly to the Board (rather than to the CEO) are the Fire Department, Auditor-Controller, County Counsel, Executive Officer of the Board, and the CEO. The change in administrative structure was designed to improve the operational efficiency of County governance. The Board has retained the exclusive responsibility for establishing County policy, regulations, and organizational direction.
ii

Honorable Board of Supervisors December 11, 2009 Page 3
There are over one million residents in the unincorporated areas of the County. These residents receive all municipal services from the County, including law enforcement, fire protection, land use and zoning, building and business permits, local road building and maintenance, animal care and control, and public libraries. In addition, the County provides a wide range of services to all County residents.
The County also provides municipal services to many incorporated cities within its boundaries under the Contract Services Plan. Established in 1954, the Plan allows cities to provide municipal services without incurring the cost of creating numerous city departments and facilities by having the County provide, at cost, any or all municipal services within a city at the same level as provided in unincorporated areas, or at any higher level the city may choose. Although the Plan was developed to assist new cities, the great majority of the cities in the County now contract for one or more services.
The County’s principal functions include seven major areas as required under the County's charter, County ordinances, or by State or federal mandate: general government, public protection, public ways and facilities, health and sanitation, public assistance, education and recreation and cultural services. The State and federal governments mandate certain minimum levels of services in the public assistance and health areas.
ECONOMIC OVERVIEW
With a 2008 Gross Product estimated at $513.6 billion, Los Angeles County’s economy is larger than that of 44 states and all but 17 countries. The County serves as the central trade district for the western United States and controls nearly 75% of the Pacific Coast trade with Asia. It is a leader in the communications industry, has established itself as a leading financial center, and serves as the western headquarters for many national firms. The County’s economy continued to expand in 2008 in the midst of a prolonged recession, with a slight increase of 1.1% in Gross Product. However, the economic downturn in 2009 has created significant financial challenges for major industries.
The County’s unemployment rate has trended upward since 2006 and rose to 7.5% in 2008. It is forecasted to climb even higher in 2009, approaching 12%, with a projected loss of 168,000 jobs. However, this negative trend may be offset by positive factors in major public and private construction projects. In the November 2008 election, the electorate approved a one-half of one percent sales tax rate increase to provide new funding for highway transit projects throughout the County. There are a number of voter-approved school construction projects that are also in progress. These voter-approved measures, combined with the terminal expansions under way at the ports of Los Angeles and Long Beach and certain provisions of the American Recovery and Reinvestment Act that benefit the County, are expected to provide a strong foundation for the creation of new jobs.
iii
Honorable Board of Supervisors December 11, 2009 Page 4
INTERNAL AND BUDGETARY CONTROLS
The County has developed a system of internal accounting controls designed to provide reasonable, but not absolute, assurance that assets are safeguarded against loss from unauthorized use. It also provides reliable records for preparing financial statements and maintaining accountability for assets. The concept of reasonable assurance recognizes that the costs of a system of internal accounting controls should not outweigh related benefits. Also, the evaluation of costs and benefits requires estimates and judgments by management. All internal accounting control evaluations occur within the above framework. We believe that the County's system of internal accounting controls adequately safeguards assets and also provides reasonable assurance of proper recording of financial transactions.
In accordance with the provisions of Section 29000-29144 of the Government Code, commonly known as the County Budget Act, the County prepares and adopts a budget on or before August 30 of each fiscal year. Expenditures are controlled at the object level for all budget units within the County, except for capital asset expenditures which are controlled at the sub-object level.
Encumbrance accounting is utilized to ensure effective budgetary control and accountability. Unencumbered appropriations lapse at year-end and encumbrances outstanding at the time are reported as reservations of fund balance for subsequent year expenditures.
The Board of Supervisors must approve all transfers of appropriations between budget units and transfers exceeding $250,000 within budget units. The Board must also approve necessary supplemental appropriations, normally financed by unanticipated revenues earned during the year.
In addition to these procedural controls, the Auditor-Controller's Audit Division performs periodic internal control, operational and management audits of the various departments to help ensure that prescribed procedures are followed and that operations are conducted in an efficient manner. The Countywide Contract Monitoring Division provides oversight of various social service contract providers to enhance accountability and performance effectiveness. In addition, the Auditor-Controller operates the County’s federal Health Insurance Portability and Accountability Act (HIPAA) Privacy Program, providing supervision and oversight of the County’s HIPAA covered departments. A fraud hotline provides County employees and citizens with a way to anonymously report perceived fraudulent activities by County employees, vendors, contractors, inspectors, etc. Allegations reported over the hotline are evaluated and investigated, as appropriate, by the Office of County Investigations within the Auditor-Controller.
iv

Honorable Board of Supervisors December 11, 2009 Page 5
BUDGET OUTLOOK AND MAJOR CAPITAL ASSET INITIATIVES
The County’s approach to the Fiscal Year (FY) 2009-10 Budget was highly influenced by what may be the worst recession and economic crisis in many decades. The County continues to see shortfalls in a number of key revenue sources, including documentary transfer taxes and State revenues that are derived from the State’s share of sales taxes and vehicle license fees. The rising unemployment rate has increased the ranks of those seeking public assistance from the County, causing caseloads and costs to increase accordingly. In planning for the FY 2009-10 Budget, the County faced a deficit of approximately $300 million. The proposal to address the deficit consisted of departmental spending reductions of $107 million, use of one-time reserves of $115 million, and federal stimulus funding of $78 million.
DEPARTMENTAL SPENDING REDUCTIONS
All County departments, with the exception of Health Services, were required to submit 5% spending reduction proposals. This information was subsequently used to develop a final spending plan which achieved $107 million of net budgetary savings. Significant budget savings were identified in the following areas:
Reductions of $29.9 million to the Sheriff’s budget, consisting of 51 administrative positions ($6.1 million), service and supply curtailments ($14 million), and capital asset spending reductions ($9.8 million). Revenue increases of $1.7 million were also identified.
Elimination of 51 budgeted positions in the District Attorney’s budget, combined with service and supply reductions from various operational units for total spending reductions of $9.5 million.
Elimination of 925 vacant and budgeted positions in the Department of Public Social Services’ administrative budget to achieve net County savings of $5.8 million.
Elimination of 75 temporary and vacant positions in the Department of Parks and Recreation to achieve net County savings of $3.3 million. These reductions will impact grounds maintenance, recreation programs, and nature areas.
USE OF ONE-TIME RESERVES
Prior to the recession, the County was able to set aside excess funds to protect against reducing service levels due to temporary revenue shortfalls. The General Fund’s unreserved fund balance on a GAAP basis as of June 30, 2009 was $2.627 billion. A portion of these funds ($115 million) was used to offset revenue losses that are directly related to the cyclical nature of the current economic environment. Examples of areas targeted for use of these funds include the Sheriff’s Department (to maintain a constant level of jail capacity) and General Relief, a public assistance program.
v

Honorable Board of Supervisors December 11, 2009 Page 6
FEDERAL ECONOMIC STIMULUS
Among the benefits brought to the County by the American Recovery and Reinvestment Act (ARRA) is an increase in the Federal Medical Assistance Percentage (FMAP), which is the federal match rate for non-administrative medical assistance costs. The FMAP change is projected to temporarily decrease the County’s contribution to the In-Home Supportive Services program by $78 million and provide budgetary relief in this area. There are several other ARRA initiatives that will enable the County to augment a variety of programs.
CAPITAL ASSET INITIATIVES
The County has been able to continue to fund high priority capital asset acquisitions and improvements. The FY 2009-10 Budget provided $1.4 billion for the continued development, design, and construction of projects that address high-priority health, public safety, recreation, and infrastructure needs. The following notable capital asset projects were included in the FY 2009-10 Budget:
$493.1 million for public protection facilities, including a jail master plan, new construction at the Biscailuz Center Training Academy, new fire stations in the Santa Clarita Valley, refurbishment and expansion of the Coroner’s facility, security improvements at juvenile halls and camps, a new animal shelter in the east Antelope Valley, and four new spay and neuter clinics.
$214.6 million for recreational facilities, including new community rooms, refurbishment of swimming pools, and beach facility refurbishments.
$161.4 million for general government facilities, most notably the new County data center in Downey.
$155.3 million for health facilities, including a mental health urgent care center, expansion of emergency room and construction of tuberculosis unit at Olive View Medical Center; and replacement surgery and emergency suites at Harbor-UCLA Medical Center.
$106.4 million for infrastructural improvements at County flood control and aviation facilities and watershed testing efforts.
$98.2 million for new or replacement libraries and refurbishment of the historic Patriotic Hall.
vi

vii

viii

ix

COUNTY OF LOS ANGELES BOARD OF SUPERVISORS AND PRINCIPAL COUNTY OFFICIALS AS OF JUNE 30, 2009
BOARD OF SUPERVISORS
Don Knabe, Chairman Fourth District
Gloria Molina Zev Yaroslavsky First District Third District
Mark Ridley Thomas Michael D. Antonovich Second District Fifth District
Sachi A. Hamai Executive Officer
Board of Supervisors
PRINCIPAL COUNTY OFFICIALS
Rick Auerbach Assessor
Steve Cooley Leroy D. Baca District Attorney Sheriff
______________
William T Fujioka Chief Executive Officer
Mark J. Saladino Wendy L. Watanabe Treasurer and Tax Collector Auditor-Controller
Robert Kalunian Acting County Counsel
x

AP
PO
INTIV
E�
REQU
IRED
BY
COUN
TY C
HART
ER�
REQU
IRED
OR
AUTH
ORIZ
ED B
Y ST
ATE
LAW
�ES
TABL
ISHE
D BY
ORD
INAN
CE O
F TH
EBO
ARD
OF S
UPER
VISO
RS
ELE
CTIV
E�
REQU
IRED
BY
COUN
TY C
HART
ER
ELEC
TORA
TE
�CH
IEF
INFO
RMAT
ION
OFFI
CER
�RE
GIST
RAR-
RECO
RDER
/CO
UNTY
CLE
RK
�CH
ILDR
EN &
FAM
ILY
SERV
ICES
�PU
BLIC
SOCI
AL S
ERVI
CES
�M
ENTA
LHE
ALTH
�BE
ACHE
S&
HAR
BORS
�AL
TERN
ATE
PUBL
IC D
EFEN
DER
�
PROB
ATIO
N
�HU
MAN
RESO
URCE
S
�CO
MM
UNIT
Y&
SEN
IOR
SERV
ICES
�PU
BLIC
HEAL
TH
�CO
NSUM
ERAF
FAIR
S
�PU
BLIC
WOR
KS
�
CORO
NER
�PU
BLIC
DEFE
NDER
�RE
GION
ALPL
ANNI
NG
CO
UN
TYO
F LO
S A
NG
ELES
LE
GE
ND
�PU
BLIC
LIBR
ARY
�M
USEU
MOF
ART
�AF
FIRM
ATIV
EAC
TION
COM
PLIA
NCE
OFFI
CE
�IN
TERN
ALSE
RVIC
ES
�HE
ALTH
SERV
ICES
�CH
ILD
SUPP
ORT
SERV
ICES
�M
ILIT
ARY
& V
ETER
ANS
AFFA
IRS
HEAL
TH &
MEN
TAL
HEAL
TH S
ERVI
CES
OPER
ATIO
NSCH
ILDR
EN &
FAM
ILIE
SW
ELL-
BEIN
G
�AN
IMAL
CAR
E&
CON
TROL
�PA
RKS
&RE
CREA
TION
�AG
RICU
LTUR
ALCO
MM
ISSI
ONER
/W
EIGH
TS&
MEA
SURE
S
�
OMBU
DSM
AN
COM
MUN
ITY
& M
UNIC
IPAL
SERV
ICES
PUBL
IC S
AFET
Y
�M
USEU
MOF
NAT
URAL
HIST
ORY
� E
MPL
OYEE
S RE
TIRE
MEN
TAS
SOCI
ATIO
N
�
BOAR
D OF
RET
IREM
ENT
� B
OARD
OF
INVE
STM
ENTS
� HUM
AN R
ELAT
IONS
COM
MIS
SION
�RE
GION
ALPL
ANNI
NGCO
MM
ISSI
ON
�CH
IEF
EXEC
UTIV
EOF
FICE
R
�CO
UNTY
COUN
SEL
�FI
REDE
PART
MEN
T
�AU
DITO
R-CO
NTRO
LLER
�CO
MM
UNIT
YDE
VELO
PMEN
TCO
MM
ISSI
ON/
HOUS
ING
AUTH
ORIT
Y
�
ASSE
SSOR
�DI
STRI
CTAT
TORN
EY
�
SHER
IFF
�BO
ARD
OFSU
PERV
ISOR
S
�GR
AND
JURY
Foot
note
: Sev
eral
dep
artm
ents
repo
rt di
rect
ly to
the
Boar
d of
Sup
ervi
sors
or a
re h
eade
d by
ele
cted
offi
cial
s, b
utw
ork
with
the
Chi
ef E
xecu
tive
Offic
e th
roug
h th
e cl
uste
rs. T
hese
are
: Ass
esso
r, Au
dito
r-Co
ntro
ller,
Exec
utiv
eO
ffice
of
the
Boar
d of
Sup
ervi
sors
, Co
unty
Cou
nsel
(O
pera
tions
); Co
mm
unity
Dev
elop
men
t Co
mm
issi
on(C
omm
unity
and
Mun
icip
al S
ervi
ces)
; Sh
eriff
, Dis
trict
Atto
rney
, Fire
(Pub
lic S
afet
y).
�OF
FICE
OF
EDUC
ATIO
N
BOAR
D OF
EDUC
ATIO
N
� BOAR
D AD
VISO
RYCO
MM
ISSI
ONS
& C
OMM
ITTE
ES
�CI
VIL
SERV
ICE
COM
MIS
SION
�EM
PLOY
EERE
LATI
ONS
COM
MIS
SION
�AS
SESS
MEN
TAP
PEAL
SBO
ARD
�AR
TSCO
MM
ISSI
ON
�EX
ECUT
IVE
OFFI
CE
BOAR
D OF
SUP
ERVI
SORS
�TR
EASU
RER
&TA
X CO
LLEC
TOR
xi

xii

FFFIIINNNAAANNNCCCIIIAAALLL SSSEEECCCTTTIIIOOONNN

2

COUNTY OF LOS ANGELES MANAGEMENT’S DISCUSSION AND ANALYSIS
This section of the County’s Comprehensive Annual Financial Report (CAFR) presents a narrative overview and analysis of financial activities for the fiscal year ended June 30, 2009. We recommend that this information be used in conjunction with additional information contained in the letter of transmittal.
Financial Highlights
At the end of the current year, the net assets (total assets less total liabilities) of the County were positive $16.129 billion. However, net assets are classified into three categories and the unrestricted component is negative $2.006 billion. See further discussion on page 7.
During the current year, the County’s net assets decreased by a total of $1.152 billion. Net assets related to governmental activities decreased by $787 million, while net assets related to business-type activities decreased by $365 million. Governmental Accounting Standards Board Statement No. 45, “Accounting and Financial Reporting by Employers for Postemployment Benefits Other Than Pensions” (GASB 45) was implemented in the prior year and continued to have a material effect on the County’s changes in net assets during the current year. See further discussion on page 7.
At the end of the current year, the County’s General Fund reported a total fund balance of $3.167 billion. The amount of unreserved fund balance was $2.627 billion. Of the unreserved total, $972 million was designated.
The County’s capital asset balances were $17.735 billion at year-end and increased by $210 million during the year.
During the current year, the County’s total long-term debt decreased by $334 million. Bond maturities of $384 million exceeded the $50 million of newly issued and accreted long-term debt.
Overview of the Basic Financial Statements
This discussion and analysis are intended to serve as an introduction to the County’s basic financial statements, which are comprised of the following three components:
Government-wide financial statements Fund financial statements Notes to the basic financial statements
This report also includes other supplementary information in addition to the basic financial statements.
3

COUNTY OF LOS ANGELES MANAGEMENT’S DISCUSSION AND ANALYSIS-Continued
GOVERNMENT-WIDE FINANCIAL STATEMENTS
The government-wide financial statements are designed to provide readers with a broad overview of the County’s finances, in a manner similar to a private-sector business.
The Statement of Net Assets presents information on all County assets and liabilities, with the difference representing net assets. Over time, increases and decreases in net assets may serve as an indicator of whether the financial position of the County is improving or deteriorating.
The Statement of Activities presents information that indicates how the County’s net assets changed during the fiscal year. All changes in net assets are reported as soon as the underlying events giving rise to the change occur, regardless of the timing of related cash flows. Therefore, revenues and expenses are reported in these statements for some items that affect cash flows in future periods. For example, property tax revenues have been recorded that have been earned but not yet collected and workers’ compensation expenses have been accrued but not yet paid.
The government-wide financial statements report the following different types of programs or activities:
Governmental Activities - The majority of County services are reported under this category. Taxes and intergovernmental revenues are the major revenue sources that fund these activities which include general government, public protection, public ways and facilities, health and sanitation, public assistance, recreation, and cultural services.
Business-type Activities - County services that are intended to recover costs through user charges and fees are reported under this category. The County Hospitals, the Waterworks Districts, the Aviation Fund, and housing programs operated by the Community Development Commission, a blended component unit, are regarded as business-type activities.
Discretely Presented Component Unit - Component units are separate entities for which the County is financially accountable. First 5 LA is the only component unit that is discretely presented.
FUND FINANCIAL STATEMENTS
The fund financial statements contain information regarding major individual funds. A fund is a fiscal and accounting entity with a balanced set of accounts. The County uses separate funds to ensure compliance with fiscal and legal requirements.
4
COUNTY OF LOS ANGELES MANAGEMENT’S DISCUSSION AND ANALYSIS-Continued
FUND FINANCIAL STATEMENTS-Continued
The County’s funds are classified into the following three categories:
Governmental Funds - These funds are used to account for essentially the same services that were previously described as governmental activities above. However, the fund financial statements focus on near-term inflows and outflows of spendable resources, as well as on balances of spendable resources available at the end of the fiscal year. Such information may be useful in evaluating the County’s near-term financing requirements. Because the focus of governmental funds is narrower than that of the government-wide financial statements, it is useful to compare the information presented for governmental funds with similar information presented for governmental activities in the government-wide financial statements. By doing so, readers may better understand the long-term impact of the government’s near-term financing decisions. Both the governmental funds balance sheet and the governmental funds statement of revenues, expenditures and changes in fund balances provide a reconciliation to facilitate this comparison between governmental funds and governmental activities. Governmental funds include the General Fund, as well as Special Revenue Funds, Debt Service Funds, Capital Project Funds, and Permanent Funds.
Proprietary Funds - These funds are used to account for functions that were classified as “business type activities” in the government-wide financial statements. The County’s Internal Service Funds are also reported within the proprietary fund section. The County’s five Hospital Funds and Waterworks Funds are all considered major funds for presentation purposes. The remaining proprietary funds are combined in a single column, with individual fund details presented elsewhere in this report.
Fiduciary Funds - These funds are used to report assets held in a trustee or agency capacity for others and cannot be used to support the County’s programs. The Pension Trust Fund, the Investment Trust Funds, and Agency Funds are reported in this fund category, using the accrual basis of accounting.
NOTES TO THE BASIC FINANCIAL STATEMENTS
The notes to the basic financial statements provide additional information that is essential to a full understanding of the data provided in the government-wide and the fund financial statements.
REQUIRED SUPPLEMENTARY INFORMATION
In addition to the basic financial statements and accompanying notes, this report presents certain required supplementary information concerning the County’s progress in funding its obligation to provide pension benefits and other postemployment benefits to employees.
5

COUNTY OF LOS ANGELES MANAGEMENT’S DISCUSSION AND ANALYSIS-Continued
Government-wide Financial Analysis
As noted earlier, net assets may serve over time as a useful indicator of a government’s financial position. In the case of the County, assets exceeded liabilities by $16.129 billion at the close of the most recent fiscal year.
Summary of Net Assets As of June 30, 2009 and 2008 (in thousands)
Governmental Business-type Activities Activities Total 2009 2008 2009 2008 2009 2008 Current and other assets $ 7,981,471 $ 8,052,812 $ 730,736 $ 994,087 $ 8,712,207 $ 9,046,899 Capital assets 15,252,601 15,074,565 2,482,382 2,450,785 17,734,983 17,525,350 Total assets 23,234,072 23,127,377 3,213,118 3,444,872 26,447,190 26,572,249 Current and other liabilities
1,472,639 1,377,389 203,922 218,966 1,676,561 1,596,355
Long-term liabilities 7,009,138 6,179,573 1,631,997 1,483,193 8,641,135 7,662,766 Total liabilities 8,481,777 7,556,962 1,835,919 1,702,159 10,317,696 9,259,121Net assets: Invested in capital assets, net of
related debt 14,081,048 13,913,070 2,217,449 2,259,617 16,298,497 16,172,687 Restricted net assets 1,644,109 1,605,763 192,427 307,985 1,836,536 1,913,748 Unrestricted net assets (deficit) (972,862) 51,582 (1,032,677) (824,889) (2,005,539) (773,307) Total net assets 14,752,295 15,570,415 1,377,199 1,742,713 16,129,494 17,313,128 Total liabilities and net assets $ 23,234,072 $ 23,127,377 $ 3,213,118 $ 3,444,872 $ 26,447,190 $ 26,572,249
Significant changes in assets and liabilities included the following:
Current and Other Assets
Current and other assets decreased for governmental activities by $71 million. The total amount reported for “pooled cash and investments” and “other investments” decreased by $365 million while “internal balances” (receivables from the business-type activities) rose by $344 million. The economic downturn in the current period had a negative impact on overall cash flows. The internal balances predominately reflect short-term cash advances from the General Fund (a governmental activity) to hospital business-type activities, which required significantly higher ($253 million) short-term cash flows and therefore reduced current and other assets for business-type activities. As described in Note 7 to the basic financial statements, the asset classified as “net pension obligation” continued to amortize downward, and was reduced by $32 million for governmental activities during the current year.
6
COUNTY OF LOS ANGELES MANAGEMENT’S DISCUSSION AND ANALYSIS-Continued
Long-Term Liabilities
Long-term liabilities increased by $830 million for governmental activities and by $149 million for business-type activities. The County implemented GASB 45 in the prior year, which established new financial reporting requirements for other postemployment benefits (OPEB). OPEB continued to be funded on a pay-as-you-go basis in the current year and OPEB-related liabilities increased for both governmental and business-type activities by $1.030 billion and $201 million, respectively. Specific disclosures related to OPEB and other changes in long-term liabilities are discussed and referenced in Notes 8 and 10 to the basic financial statements.
The County’s total net assets consist of the following three components:
Capital Assets, Net of Related Debt
The largest portion of the County’s net assets ($16.298 billion) represents its investment in capital assets (i.e., land, structures and improvements, infrastructure, and equipment, net of related depreciation), less any related debt used to acquire those assets that is still outstanding. The County uses these capital assets to provide services to citizens; consequently, these assets are not available for future spending. Although the County’s investment in its capital assets is reported net of related debt, it should be noted that the resources needed to repay this debt must be provided from other sources, since the capital assets themselves cannot be used to liquidate these liabilities.
Restricted Net Assets
The County’s restricted net assets at year-end were $1.837 billion. Asset restrictions are primarily due to external restrictions imposed by State legislation and bond covenants. Net assets that pertain to the various separate legal entities included in the basic financial statements are also generally restricted because their funding sources require that funds be used for specific purposes.
Unrestricted Net Assets (Deficit)
The County’s total unrestricted net assets are negative $2.006 billion. Both governmental and business-type activities reported deficits in this category of $973 million and $1.033 billion, respectively. The deficits are primarily due to unfunded liabilities related to OPEB, workers’ compensation, accrued vacation and sick leave, and litigation and self-insurance claims. For the business-type activities, medical malpractice liabilities and third party payor liabilities are additional factors. The current economic downturn and overall difficult budgetary environment has impaired the County’s ability to implement a funding plan for OPEB liabilities. For the business-type activities, financial losses incurred by the County’s healthcare business activities have limited the opportunities to accumulate reserves or incremental funding to address long-term accounting liabilities.
7

COUNTY OF LOS ANGELES MANAGEMENT’S DISCUSSION AND ANALYSIS-Continued
The following table indicates the changes in net assets for governmental and business-type activities:
Summary of Changes in Net Assets For the Years Ended June 30, 2009 and 2008
(in thousands)
Governmental Business-type Activities Activities Total 2009 2008 2009 2008 2009 2008
Revenues:
Program revenues: Charges for services $ 2,694,729 $ 2,738,552 $ 2,095,944 $ 1,806,747 $ 4,790,673 $ 4,545,299 Operating grants and contributions 7,215,270 7,113,135 279,195 263,471 7,494,465 7,376,606 Capital grants and contributions 206,137 184,502 837 2,897 206,974 187,399 General revenues: Taxes 5,192,566 5,034,399 4,453 4,405 5,197,019 5,038,804 Unrestricted grants and contributions 756,417 778,936 37 37 756,454
778,973
Investment earnings 197,705 324,132 9,844 14,073 207,549 338,205 Miscellaneous 142,075 229,810 25,758 24,950 167,833 254,760 Total revenues 16,404,899 16,403,466 2,416,068 2,116,580 18,820,967 18,520,046Expenses: General government 1,103,361 1,171,448 1,103,361 1,171,448 Public protection 6,125,158 5,799,593 6,125,158 5,799,593 Public ways and facilities 327,403 299,304 327,403 299,304 Health and sanitation 2,783,150 2,638,135 2,783,150 2,638,135 Public assistance 5,233,389 5,061,367 5,233,389 5,061,367 Education 109,910 112,035 109,910 112,035 Recreation and cultural services 331,726 290,669 331,726 290,669 Interest on long-term debt 165,782 191,551 165,782 191,551 Hospitals 3,443,266 3,092,682 3,443,266 3,092,682 Aviation 5,073 4,182 5,073 4,182 Waterworks 76,904 74,810 76,904 74,810 Community Development Commission 268,201 246,195 268,201 246,195Total expenses 16,179,879 15,564,102 3,793,444 3,417,869 19,973,323 18,981,971Excess (deficiency) before transfers 225,020 839,364 (1,377,376) (1,301,289) (1,152,356) (461,925) Transfers ( 1,011,862) (1,152,946) 1,011,862 1,152,946 Changes in net assets (786,842) (313,582) (365,514) (148,343) (1,152,356) (461,925) Net assets – beginning, as restated 15,539,137 15,883,997 1,742,713 1,891,056 17,281,850 17,775,053
Net assets – ending $ 14,752,295 $ 15,570,415 $ 1,377,199 $ 1,742,713 $ 16,129,494 $ 17,313,128
8

COUNTY OF LOS ANGELES MANAGEMENT’S DISCUSSION AND ANALYSIS-Continued
Operating grants and contributions40%
Unrestricted grantsand contributions4%
Other3%
Charges for services25%
Taxes28%
Other6%
Public assistance26%
Generalgovernment 6%
Public protection31%
REVENUES BY SOURCE – ALL ACTIVITIES FOR THE YEAR ENDED JUNE 30, 2009
EXPENSES BY TYPE – ALL ACTIVITIES FOR THE YEAR ENDED JUNE 30, 2009
Health andsanitation 14%
Hospitals17%
99

COUNTY OF LOS ANGELES MANAGEMENT’S DISCUSSION AND ANALYSIS-Continued
As discussed in Note 2 to the basic financial statements, the County restated beginning net asset balances in conjunction with implementing Governmental Accounting Standards Board Statement No. 49, “Accounting and Financial Reporting for Pollution Remediation Obligations.” The beginning net assets were reduced from the amounts previously reported for governmental activities by $31 million. Prior year amounts were not restated as information was not available. During the current year, net assets decreased for both governmental activities ($787 million) and business-type activities ($365 million). Following are specific major factors that resulted in the net asset changes.
Governmental Activities
Total current year revenues ($16.405 billion) from governmental activities were nearly identical to the prior year total ($16.403 billion). The most significant changes in specific revenue sources were experienced in the following areas:
Taxes, the County’s largest general revenue source, were $158 million higher than the previous year. The additional growth in tax revenues was concentrated in property taxes ($141 million). Voter approved taxes also increased by $48 million, primarily due to an increase in the County’s Measure B parcel tax, which provides funding for trauma centers and emergency medical services. However, documentary transfer taxes decreased by $20 million as real estate transfer activity declined for the second consecutive year. The continued property tax growth was attributable to the early lien date (January 1, 2008), which preceded the start of the fiscal year by six months. This gap, combined with the stabilizing effect of Proposition 13, enabled the County to continue to experience growth in this area. The net decrease in other taxes was $11 million in comparison to the prior year.
Current year investment earnings decreased by $126 million, or 39%. The yield from the County’s treasury pool declined from 4.62% in the prior year to 2.57% in the current year.
Program revenues recognized from operating grants and contributions increased by $102 million. The largest source of this increase ($93 million) was associated with health and sanitation programs and was concentrated in mental health services. In the current year, mental health revenues were augmented by the federal economic stimulus program known as the American Recovery and Reinvestment Act (ARRA). The federal Medical Assistance Percentage (FMAP) was increased and provided $60 million of new mental health revenues in the current year. State mental health revenues derived from the Mental Health Services Act (Proposition 63) were $39 million higher than the previous year.
Expenses related to governmental activities increased by $616 million during the current year. The largest portion of the net increase was attributable to the public protection category, which grew by $326 million. Salaries and employee benefits expenses increased in the public protection area by $276 million, primarily due to previously negotiated increases that became effective in the current year.
10

COUNTY OF LOS ANGELES MANAGEMENT’S DISCUSSION AND ANALYSIS-Continued
Governmental Activities-Continued
Public assistance expenses and health and sanitation expenses were higher by $172 million and $145 million, respectively, during the current year. Although year-over-year staffing levels in these areas were comparable, there were increased demands for services. The recessionary economic conditions were especially noticeable in the public assistance area and contributed to higher assistance expenses in the current year.
Business-type Activities
Revenues from business-type activities increased in comparison to the prior year by $299 million (14.1%). The most significant change was in the area of charges for services, which increased by $289 million. As mentioned previously, the federal economic stimulus package increased the FMAP and also provided $60 million of current year revenues to the business-type healthcare activities.
Expenses related to business-type activities increased from the previous year by $376 million. The increased expenses were principally related to the Hospitals, where expenses were higher by $351 million. Hospital cost increases were most prominent at the LAC+USC Medical Center, where expenses were higher by $229 million. In November of the current year, LAC+USC began operating out of a new facility. For all facilities, the average patient census during the current year was very similar to the prior year, at approximately 1,300 patients per day.
Financial Analysis of the County’s Funds
As noted earlier, the County uses fund accounting to ensure and demonstrate compliance with finance-related legal requirements.
Governmental Funds
The focus of the County’s governmental funds is to provide information on near-term inflows, outflows, and balances of resources that are available for spending. Such information is useful in assessing the County’s financing requirements. In particular, unreserved fund balance may serve as a useful measure of a government’s net resources available for spending at the end of the fiscal year. Types of governmental funds reported by the County include the General Fund, Special Revenue Funds, Debt Service Funds, Capital Project Funds, and the Permanent Funds.
As of the end of the current fiscal year, the County’s governmental funds reported combined total fund balances of $5.892 billion, a decrease of $111 million in comparison with the prior year. Of the total fund balances, $1.443 billion is reserved to indicate the extent that funds have been committed or are otherwise unavailable for spending. An additional $1.613 billion has been designated and set aside for intended spending purposes as indicated in the financial statements. The remaining $2.836 billion of the balances are unreserved and undesignated.
11

COUNTY OF LOS ANGELES MANAGEMENT’S DISCUSSION AND ANALYSIS-Continued
Governmental Funds-Continued
Revenues from all governmental funds for the current year were $16.240 billion, a decrease of $33 million (0.2%) from the previous year. Expenditures for all governmental funds in the current year were $15.345 billion, an increase of $465 million (3.1%) from the previous year. In addition, other financing uses exceeded other financing sources by $1.006 billion as compared to $1.045 billion in the prior year.
The General Fund is the County’s principal operating fund. During the current year, the fund balance in the General Fund decreased by $208 million (6.2%). At the end of the current fiscal year, the General Fund’s total fund balance was $3.167 billion. Of this amount, $540 million was reserved and therefore unavailable for spending. Of the unreserved total of $2.627 billion, $972 million has been designated (earmarked) and the remaining $1.655 billion is considered both unreserved and undesignated.
General Fund revenues during the current year were $13.538 billion, a decrease of $90 million (0.7%) from the previous year. General Fund expenditures during the current year were $13.135 billion, an increase of $391 million (3.1%) from the previous year. Other financing sources/uses-net was negative $611 million in the current year as compared to negative $683 million in the prior year.
Following are significant changes in General Fund revenues and expenditures:
Revenues from taxes increased by $174 million (4.6%). Of this net increase, property taxes increased by $201 million. However, documentary transfer taxes decreased by $20 million as real estate activity declined for the second consecutive fiscal year. As previously mentioned, property tax revenues were not immediately impacted by the downturn in the housing market and provisions of Proposition 13 are also a stabilizing factor when housing prices decrease.
Intergovernmental revenues recognized from the State decreased by $177 million. The County receives certain revenues from the State which are derived from the State’s share of sales taxes and vehicle license fees. State revenues directly funded by sales taxes were $156 million lower than the previous year amount. The County relies on this revenue to augment funding for public safety programs (primarily the Sheriff’s Department), health and mental health services, and public assistance programs. Revenues derived from State vehicle license fees also decreased in comparison with the prior year by $45 million and these revenues provide supplemental funding for health, mental health, and social service programs.
Investment income decreased by $99 million, as current year revenues were $125 million in comparison with the prior year amount of $224 million. As previously mentioned, the yield on investments during the current year was considerably lower than the prior year’s yield.
12

COUNTY OF LOS ANGELES MANAGEMENT’S DISCUSSION AND ANALYSIS-Continued
Governmental Funds-Continued
Current expenditures increased by $548 million (4.4%), and there were increases in all functional areas. The most significant increase was in the area of public protection, where expenditures were higher by $198 million. Of this amount, salaries and employee benefits increased by $164 million. These costs were notably higher in the Sheriff’s Department ($78 million) and Probation Department ($37 million), and were largely due to negotiated salary and benefit increases, as there was limited program expansion in these areas. Expenditures also increased in the areas of public assistance ($177 million) and health and sanitation ($135 million).
The Fire Protection District reported a year-end fund balance of $205 million, which represented an increase of $35 million from the previous year. The increase in fund balance also provided additional liquidity to the District, as total pooled cash and investments also increased by $35 million. Revenues increased by $44 million, of which $24 million was attributable to property taxes and the remaining increase was associated with a variety of other revenues. Expenditures were higher by $35 million, of which $31 million was related to salaries and benefits.
The Flood Control District reported a year-end fund balance of $192 million, which was $30 million higher than the previous year. The fund balance increase provided additional liquidity, as pooled cash and investments were $26 million higher than the prior year. Revenues increased from a wide variety of sources and were $18 million higher than the prior year. Expenditures were virtually unchanged from the prior year.
The Public Library Fund reported a year-end fund balance of $27 million, which was $2 million lower than the previous year. Although revenues were nearly $4 million higher in the current year, expenditures increased by $9 million, as salaries and employee benefits were $5 million higher and there were increased operating costs.
The Regional Park and Open Space District year-end fund balance ($288 million) remained nearly unchanged in comparison to the previous year balance of $286 million. Current year revenues were $6 million lower than the previous year, largely due to reduced investment income. Expenditures increased by $19 million, as additional reimbursement claims were received from County agencies, various cities, and other agencies that are eligible for recreational funding from this District.
13

COUNTY OF LOS ANGELES MANAGEMENT’S DISCUSSION AND ANALYSIS-Continued
Proprietary Funds
The County’s proprietary funds provide the same type of information found in the government-wide financial statements, but in more detail.
The County’s principal proprietary funds consist of four hospital enterprise funds and an additional fund (Martin L. King Jr. Ambulatory Care Center) which was converted from a full-service hospital in 2007-2008 to a multi-service ambulatory care center. Each of these funds incurred a net loss prior to contributions and transfers.
The County is legally required to provide local matching funds to the health care system in order to remain eligible for federal and State assistance. Such funds were provided to the hospitals as operating subsidies from the County General Fund during the year. The amount of subsidy, per facility, ranged from $60 million for M. L. King Ambulatory Care Center to $414 million for the LAC+USC Medical Center. The total subsidy amount was $803 million and is reflected in the Statement of Revenues, Expenses and Changes in Fund Net Assets as “transfers in.” By comparison, the total General Fund subsidy in the prior year was $1.001 billion.
An additional source of local funding for the Hospitals is the Health Services Measure B Special Revenue Fund (“Measure B Fund”). The Measure B Fund receives voter approved property taxes for trauma and emergency services. In the current year, the Measure B Fund provided transfers to the LAC+USC Medical Center ($110 million), Harbor UCLA Medical Center ($59 million), and Olive View UCLA Medical Center ($42 million). The total amount of current year Measure B transfers ($211 million) exceeded the prior year amount by $64 million. The additional transfer amounts were funded by unspent prior year Measure B funds plus a Board-approved 24% increase in the current year Measure B Fund tax rate.
Waterworks Funds reported year-end net assets of $884 million, an $11 million reduction from the previous year. There was a $4 million decrease in current year operating revenues, of which $3 million was associated with water service charges to customers. In addition, there were current year cost increases of $5 million for services, supplies, and other professional services.
General Fund Budgetary Highlights
The accompanying basic financial statements include a Statement of Revenues, Expenditures, and Changes in Fund Balances - Budget and Actual on Budgetary Basis for the County’s General Fund. The County’s budgetary basis of accounting is discussed in Notes 1 and 15 to the basic financial statements. There are approximately 100 separate budget units within the General Fund, excluding capital improvement projects, which are individually budgeted. The data presented below represents the net budgetary changes for the General Fund in a highly summarized format. Accordingly, in certain instances, budgets have been increased for programs within a category even though actual amounts have not been realized for the category in its entirety. Under the budgetary basis, there was a net decrease of $95 million in the General Fund’s available (unreserved and undesignated) fund balance from the previous year.
14

COUNTY OF LOS ANGELES MANAGEMENT’S DISCUSSION AND ANALYSIS-Continued
Budgetary Summary - Revenues/Financing Sources
Following is a summary of current year budgetary changes and actual results (on the County’s budgetary basis) for General Fund revenues and other financing sources (in thousands):
Increase (Decrease) Variance- From Original Final Budget Actual PositiveCategory Budget Amount Amount (Negative)
Taxes $ 12,372 $ 4,030,607 $ 3,938,502 $ (92,105) Intergovernmental revenues 82,346 7,922,721 7,196,242 (726,479) Charges for services (186,727) 1,607,359 1,504,841 (102,518) All other revenues 120,297 689,829 733,383 43,554 Other sources and transfers 5,455 496,713 264,099 (232,614) Total $ 33,743 $ 14,747,229 $ 13,637,067 $ (1,110,162)
Changes from Amounts Originally Budgeted
During the year, net increases in budgeted revenues and other financing sources approximated $34 million. The most significant changes occurred in the following areas:
Estimated revenues from charges for services decreased by $187 million. Nearly all ($172 million) of the decrease was associated with reduced revenues from the Managed Care health services program. The budget for these revenues was modified in the current year as certain Managed Care revenues ($170 million), initially budgeted in the General Fund, were recorded directly in the Hospital Enterprise Funds.
The increase of $120 million related to “all other revenues” was mostly attributable to tobacco settlement revenues of $116 million. The County’s policy is to budget tobacco settlement revenues after they have been received. Miscellaneous revenue increases accounted for the remaining $4 million.
The budget for intergovernmental revenues was increased by $82 million. Of this amount, $66 million was associated with caseload increases in the General Relief and CalWORKS public assistance programs. Additional net increases of $16 million were associated with a variety of federal and State funded programs.
Actual Revenues/Financing Sources Compared with Final Budget Amounts
Actual revenues and other financing sources recognized by the General Fund were approximately $1.110 billion, or 7.5%, lower than budget. As discussed below, most of this variance was concentrated in the areas of intergovernmental revenues, “other sources and transfers,” and charges for services.
15
COUNTY OF LOS ANGELES MANAGEMENT’S DISCUSSION AND ANALYSIS-Continued
Actual Revenues/Financing Sources Compared with Final Budget Amounts-Continued
Actual intergovernmental revenues were $726 million lower than the amount budgeted. Social service programs, including children and family services, accounted for approximately $249 million of this variance, which was mostly attributable to cost containment efforts that led to reduced reimbursable social service related expenditures. Approximately $99 million (consisting of State assistance) was associated with mental health services, due to lower than expected revenues. There was $85 million of unrealized intergovernmental assistance for Sheriff-related programs, most of which was associated with lower than anticipated State public safety augmentation funding. An additional $187 million pertained to anticipated reimbursement of capital improvement, disaster recovery and homeland security projects and programs that were not completed prior to year-end. The remaining variance of $106 million was related to a variety of other programs that received intergovernmental revenues.
The actual amount of “other sources and transfers” was $233 million lower than the amount budgeted. Of this amount, “transfers in” totaling $106 million were assumed in the budget for capital improvements and extraordinary building maintenance projects which did not incur expected costs. Mental health programs funded by the Mental Health Services Act Fund (Proposition 63) did not fully materialize at the budgeted level and “transfers in” were $61 million lower than budgeted. Programs operated by the Registrar-Recorder and the Sheriff did not realize budgeted “transfers in” of $33 million and $21 million, respectively, as reimbursable costs were lower than anticipated. There were various other sources and transfers that comprised the remaining variance of $12 million.
The amount budgeted for charges for services revenues exceeded actual revenues by $103 million. Actual revenues for health administration and managed care programs were $84 million lower than estimated revenues. Anticipated service levels for these programs did not materialize as assumed by the budget. The remaining variance of $19 million was generated by a variety of service-related revenue sources.
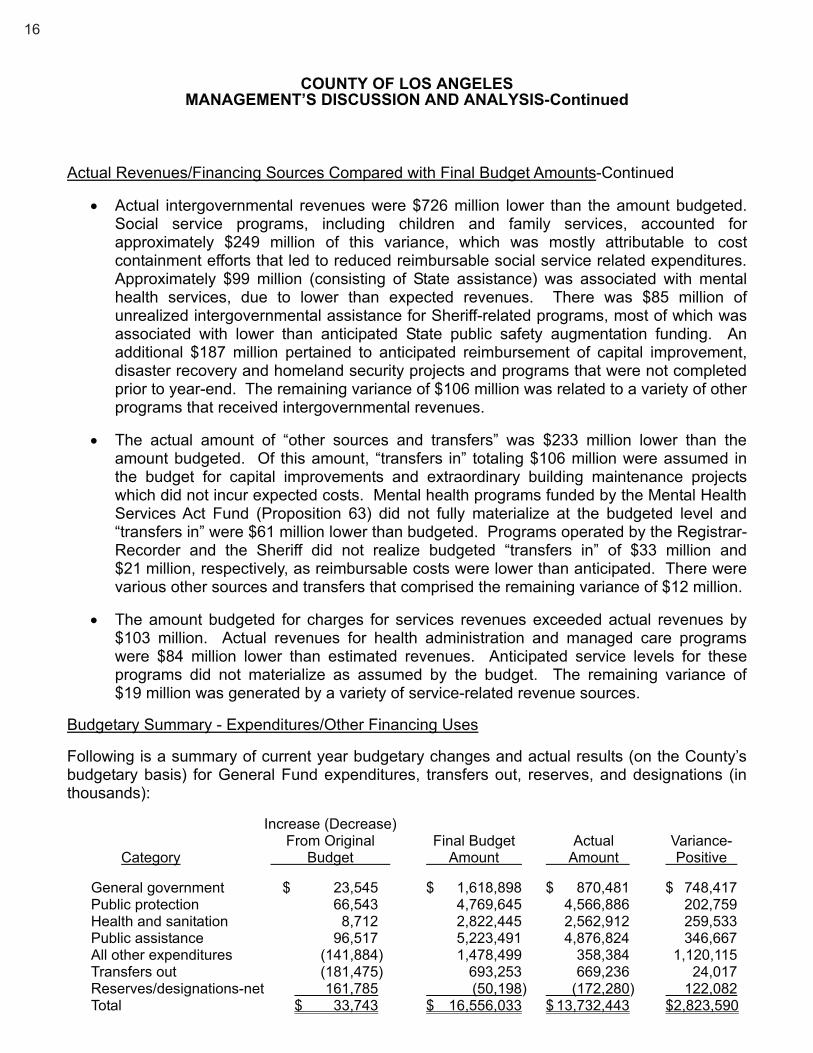
Budgetary Summary - Expenditures/Other Financing Uses
Following is a summary of current year budgetary changes and actual results (on the County’s budgetary basis) for General Fund expenditures, transfers out, reserves, and designations (in thousands):
Increase (Decrease) From Original Final Budget Actual Variance- Category Budget Amount Amount Positive
General government $ 23,545 $ 1,618,898 $ 870,481 $ 748,417 Public protection 66,543 4,769,645 4,566,886 202,759 Health and sanitation 8,712 2,822,445 2,562,912 259,533 Public assistance 96,517 5,223,491 4,876,824 346,667 All other expenditures (141,884) 1,478,499 358,384 1,120,115 Transfers out (181,475) 693,253 669,236 24,017 Reserves/designations-net 161,785 (50,198) (172,280) 122,082 Total $ 33,743 $ 16,556,033 $ 13,732,443 $2,823,590
16

COUNTY OF LOS ANGELES MANAGEMENT’S DISCUSSION AND ANALYSIS-Continued
Changes from Amounts Originally Budgeted
During the year, net increases in General Fund appropriations, reserves and designations were approximately $34 million. As discussed below, the most significant increases and reductions occurred in the following areas:
Appropriations for “transfers out” were reduced by $181 million. Of this amount, General Fund operating subsidies to the Hospital Funds were reduced by $170 million (from $788 million originally budgeted to $618 million). As previously mentioned, the original budget anticipated the recognition of certain Managed Care revenues in the General Fund. There was a related $170 million amount originally appropriated to “transfer out” such revenues to the Hospital Enterprise Funds. The budget was subsequently amended to reduce the “transfer out” appropriations, consistent with the change in the budgeted revenues. The remaining $11 million reduction was related to various transfers to Special Revenue Funds.
Provisions for net reserves and designations were increased during the year by $162 million. At the end of the fiscal year, the designation for health services, which is predominately funded by tobacco settlement revenues, was increased by $157 million. This amount was comprised of tobacco settlement revenues recognized in the current year ($116 million) plus prior year funds that were appropriated, but unexpended ($41 million). Miscellaneous increases of $5 million were made to reserves and other designations.
Appropriations for “all other expenditures” were reduced by $142 million. In January 2009, the Board reduced capital outlay appropriations by $133 million. This action curtailed or postponed various capital improvement projects and was in response to worsening overall economic conditions and increased State budget uncertainties. Various other appropriation reductions of $9 million comprised the remainder of this category.
Actual Expenditures/Other Financing Uses Compared with Final Budget Amount
Actual expenditures/other financing uses for the current year were $2.824 billion lower (approximately 17%) than the final total budget of $16.556 billion. There were budgetary savings in all categories. Due to economic uncertainties, the County developed targeted savings goals for each department that were designed to avoid service curtailments and avoid impacts to high-priority programs. Savings were achieved through a variety of measures including departmental hiring freezes, reduction in purchases of services and supplies and capital assets, and development of efficiency initiatives. Following are the functional areas that recognized the largest variations from the final budget:
17

COUNTY OF LOS ANGELES MANAGEMENT’S DISCUSSION AND ANALYSIS-Continued
Actual Expenditures/Other Financing Uses Compared with Final Budget Amount-Continued
The category referred to as “all other expenditures” reflected actual spending of $1.120 billion less than the budgeted amount. Nearly all ($1.106 billion) of this variance was related to the capital outlay category. There were many capital improvements anticipated in the budget that remained in the planning stages and did not incur expenditures during the year. Most of the unused balance has been reestablished in the following year’s budget to ensure the continuity of the projects, many of which are multi-year in nature.
The general government function reported actual expenditures that were $748 million less than the amount budgeted. Of this amount, $582 million represented budgetary savings for items that are not associated with specific County departments, such as provisional appropriations, central non-departmental appropriations, and extraordinary maintenance and repairs. The remaining $166 million was spread across virtually every department comprising general government and was mostly related to savings in the areas of salaries and services and supplies.
Actual public assistance expenditures were $347 million lower than the final budget. Of this amount, $304 million was concentrated in social service, children, and family programs. Administrative costs were lower than anticipated due to overall cost containment efforts, vacant positions, and delays in hiring. The remaining variance amount of $43 million was related to other public assistance programs.
Overall expenditures for the health and sanitation category were $260 million less than the budgeted amount. Appropriations related to mental health services exceeded actual expenditures by $137 million, primarily due to less than anticipated costs for services and supplies and to a lesser extent, salary savings. The remaining variance was associated with a variety of health care programs administered by the Departments of Health Services ($62 million) and Public Health Services ($61 million).
Capital Assets
The County’s capital assets for its governmental and business type activities as of June 30, 2009 were $17.735 billion (net of depreciation). Capital assets include land, easements, buildings and improvements, equipment, and infrastructure. The major infrastructure network elements are roads, sewers, water, flood control, and aviation. Specific disclosures related to Capital Assets and changes during the current year are discussed and referenced in Note 6 (Capital Assets) to the basic financial statements.
18

COUNTY OF LOS ANGELES MANAGEMENT’S DISCUSSION AND ANALYSIS-Continued
The total increase in the County’s capital assets (net of depreciation) for the current fiscal year was $210 million, as shown in the following table.
Changes in Capital Assets, Net of Depreciation Primary Government - All Activities
(in thousands)
Current Prior Increase Year Year (Decrease)
Land and easements $ 7,394,023 $ 7,262,068 $ 131,955 Buildings and improvements 4,065,790 3,059,365 1,006,425 Infrastructure 5,159,541 5,197,564 (38,023) Equipment 481,895 437,770 44,125 Construction-in-progress 633,734 1,568,583 (934,849) Total $ 17,734,983 $ 17,525,350 $ 209,633
The County’s most significant capital asset activity during the current year was the opening of the new LAC+USC Medical Center in November 2008. There was a reclassification of $912 million of construction-in-progress capital assets to buildings and improvements to reflect the completion of the new Hospital and its placement into service. There were also various building and improvement projects completed during the current year, of which $41 million pertained to Sheriff’s stations.
Debt Administration
The following table indicates the changes in the County’s long-term debt during the year:
Changes in Long-Term Debt Primary Government - All activities
(in thousands)
Current Prior Year Year Decrease
Bonds and Notes Payable $ 1,856,042 $ 1,942,453 $ 86,411 Pension Bonds Payable 653,634 900,824 247,190 Total $ 2,509,676 $ 2,843,277 $ 333,601
During the current year, the County’s liabilities for long-term debt decreased by $334 million, or 11.7%. Specific changes related to governmental and business-type activities are presented in Note 10 (Long-Term Obligations) to the basic financial statements. During the current year, significant long-term debt transactions were as follows:
19
COUNTY OF LOS ANGELES MANAGEMENT’S DISCUSSION AND ANALYSIS-Continued
New debt of $25 million was issued to finance the acquisition of equipment. Equipment debt totaling $16 million was redeemed during the year in accordance with maturity schedules.
Pension bonds totaling $247 million were redeemed during the year.
In addition to the above borrowing, the County continued to finance General Fund cash flow shortages occurring periodically during the fiscal year by selling $500 million in tax and revenue anticipation notes which reached maturity on June 30, 2009, and by periodic borrowing from available trust funds.
Bond Ratings
The County's debt is rated by Moody's, Standard and Poor's, and Fitch. The following is a schedule of ratings:
Moody's Standard and Poor's Fitch
General Obligation Bonds Aa3 AA- Pension Bonds A1 A+ Facilities A2 A+ A Equipment/Non-Essential Leases A2 A+ A Short-Term MIG1 SP-1+ F-1+ Commercial Paper P-1 A-1+ Flood Control District General Obligation Bonds Aa1 AA AA Flood Control District Revenue Bonds Aa1 AA- AA Regional Park and Open Space District Bonds Aa2 AA AA+
During the current year, the County’s bond ratings remained at the same level as the previous year.
Economic Conditions and Outlook
The Board of Supervisors adopted the County’s 2009-2010 Budget on June 17, 2009. The Budget was adopted based on estimated fund balances that would be available at the end of 2008-2009. The Board updated the Budget on September 22, 2009 to reflect final 2008-2009 fund balances and other pertinent financial information. For the County’s General Fund, the 2009-2010 Budget, as updated in September 2009, utilized $1.713 billion of available fund balance, which exceeded the previously estimated fund balance of $1.535 billion. Of the additional fund balance of $178 million, $151 million was used to carryover lapsed appropriations. Of the remaining $27 million, $15 million was set aside for budgetary uncertainties and $12 million was provisionally appropriated for specific budgetary issues associated with the Sheriff’s Department.
20

COUNTY OF LOS ANGELES MANAGEMENT’S DISCUSSION AND ANALYSIS-Continued
The County’s 2009-2010 Budget is shaped largely by the impact of the current recession that the nation is enduring. The County continues to see erosion in a number of key revenue sources, including investment income, deed recording fees, documentary transfer taxes, and State assistance payments to the County which are funded by the State’s share of sales taxes. In addition, for the first time since the mid-1990s, the County’s assessed property values are projected to experience a year-to-year decline. The County Assessor has released the Net Local Property Tax Roll for 2009-2010 and it is 0.5% lower than the previous year. The resulting decrease to County General Fund property tax revenues is estimated at $19 million. Property tax revenues are the County’s single most important source of funding and are vital to programs which rely on discretionary funding sources. County management is closely monitoring changes in assessed property values and adjusting revenue estimates as new information becomes available.
The County’s financial outlook continues to be affected by ongoing and severe budget problems at the State level. The State Legislative Analyst’s Office (LAO) has estimated that the State’s budget deficit will be approximately $20.7 billion by the time the State Legislature enacts a 2010-2011 State budget plan. The budget problem consists of a $6.3 billion projected deficit for 2009-2010 and a $14.4 billion gap between projected revenues and spending in 2010-2011. Many County programs receive substantial State funding and the County is likely to be confronted with program curtailments and increased local funding requirements. The County is highly dependent upon cash receipts from the State and is closely monitoring the State’s liquidity and ability to make timely cash remittances to the County.
Obtaining Additional Information
This financial report is designed to provide a general overview of the County’s finances for all interested parties. Questions concerning any of the information provided in this report or requests for additional information should be addressed to the Los Angeles County Auditor-Controller, 500 West Temple Street, Room 525, Los Angeles, CA 90012-2766.
21

22

BASIC FINANCIAL STATEMENTS

COUNTY OF LOS ANGELESSTATEMENT OF NET ASSETSJUNE 30, 2009 (in thousands)
COMPONENT UNITGOVERNMENTAL BUSINESS-TYPE
ACTIVITIES ACTIVITIES TOTAL FIRST 5 LAASSETSPooled cash and investments: (Notes 1 and 5)
Operating (Note 1) 3,368,654$ 105,300$ 3,473,954$ 874,241$ Other (Note 1) 858,182 116,285 974,467
Total pooled cash and investments 4,226,836 221,585 4,448,421 874,241 Other investments (Note 5) 266,516 30,380 296,896 Taxes receivable 423,422 950 424,372 Accounts receivable - net 1,041,794 1,041,794 Interest receivable 20,655 563 21,218 1,817 Other receivables 2,123,764 54,547 2,178,311 45,267 Internal balances (Note 14) 733,793 (733,793) Inventories 99,220 17,554 116,774 Restricted assets (Note 5) 10,452 70,468 80,920 Net pension obligation (Note 7) 76,813 26,688 103,501 Capital assets: (Notes 6 and 9)
Capital assets, not being depreciated 7,669,105 358,652 8,027,757 2,039 Capital assets, net of accumulated depreciation 7,583,496 2,123,730 9,707,226 11,834
Total capital assets 15,252,601 2,482,382 17,734,983 13,873 TOTAL ASSETS 23,234,072 3,213,118 26,447,190 935,198
LIABILITIESAccounts payable 318,188 66,092 384,280 37,944 Accrued payroll 583,772 120,075 703,847 Other payables 148,527 14,637 163,164 Accrued interest payable 14,680 610 15,290 Unearned revenue 35,200 2,280 37,480 2,085 Advances payable 372,272 228 372,500 Noncurrent liabilities: (Note 10)
Due within one year 999,602 417,288 1,416,890 60 Due in more than one year 6,009,536 1,214,709 7,224,245 216
TOTAL LIABILITIES 8,481,777 1,835,919 10,317,696 40,305
NET ASSETSInvested in capital assets, net of related debt
(Notes 6 and 10) 14,081,048 2,217,449 16,298,497 13,873 Restricted for:
Capital projects 118,539 118,539 Debt service 10,356 162,881 173,237 Permanent trust 3,019 3,019 Special purpose 1,512,195 29,546 1,541,741 881,020
Unrestricted (deficit) (972,862) (1,032,677) (2,005,539) TOTAL NET ASSETS 14,752,295$ 1,377,199$ 16,129,494$ 894,893$
The notes to the basic financial statements are an integral part of this statement.
PRIMARY GOVERNMENT
23

COUNTY OF LOS ANGELESSTATEMENT OF ACTIVITIESFOR THE YEAR ENDED JUNE 30, 2009 (in thousands)
OPERATING CAPITALFUNCTIONS CHARGES FOR GRANTS AND GRANTS ANDPRIMARY GOVERNMENT: EXPENSES SERVICES CONTRIBUTIONS CONTRIBUTIONS
Governmental activities: General government 1,103,361$ 634,153$ 50,579$ 54,278$ Public protection 6,125,158 1,323,593 1,033,372 71,271 Public ways and facilities 327,403 35,113 200,571 78,089 Health and sanitation 2,783,150 484,240 1,614,646 1,299 Public assistance 5,233,389 42,120 4,313,788 Education 109,910 2,611 1,452 Recreation and cultural services 331,726 172,899 862 1,200 Interest on long-term debt 165,782
Total governmental activities 16,179,879 2,694,729 7,215,270 206,137
Business-type activities:Hospitals 3,443,266 2,022,633 47,532 Aviation 5,073 3,128 145 671 Waterworks 76,904 58,406 140 166 Community Development Commission 268,201 11,777 231,378
Total business-type activities 3,793,444 2,095,944 279,195 837 Total primary government 19,973,323$ 4,790,673$ 7,494,465$ 206,974$
COMPONENT UNIT -First 5 LA 171,191$ $ 137,736$ $
GENERAL REVENUES:Taxes:
Property taxesUtility users taxesVoter approved taxesDocumentary transfer taxesOther taxes
Sales and use taxes, levied by the StateGrants and contributions not restricted
to special programsInvestment earningsMiscellaneous
TRANSFERS - NETTotal general revenues and transfers
CHANGE IN NET ASSETSNET ASSETS, JULY 1, 2008, as restated (Note 2)NET ASSETS, JUNE 30, 2009
The notes to the basic financial statements are an integral part of this statement.
PROGRAM REVENUE
24

COMPONENT UNIT
GOVERNMENTAL BUSINESS-TYPE FUNCTIONSACTIVITIES ACTIVITIES TOTAL FIRST 5 LA PRIMARY GOVERNMENT:
Governmental activities:(364,351)$ $ (364,351)$ General government
(3,696,922) (3,696,922) Public protection(13,630) (13,630) Public ways and facilities
(682,965) (682,965) Health and sanitation(877,481) (877,481) Public assistance(105,847) (105,847) Education(156,765) (156,765) Recreation and cultural services(165,782) (165,782) Interest on long-term debt
(6,063,743) (6,063,743) Total governmental activities
Business-type activities:(1,373,101) (1,373,101) Hospitals
(1,129) (1,129) Aviation(18,192) (18,192) Waterworks(25,046) (25,046) Community Development Commission
(1,417,468) (1,417,468) Total business-type activities(6,063,743) (1,417,468) (7,481,211) Total primary government
COMPONENT UNIT -(33,455)$ Total - First 5 LA
GENERAL REVENUES:Taxes:
4,656,370 4,453 4,660,823 Property taxes63,947 63,947 Utility users taxes
303,213 303,213 Voter approved taxes36,522 36,522 Documentary transfer taxes58,940 58,940 Other taxes73,574 73,574 Sales and use taxes, levied by the State
Grants and contributions not restricted 756,417 37 756,454 to special programs197,705 9,844 207,549 28,103 Investment earnings142,075 25,758 167,833 453 Miscellaneous
(1,011,862) 1,011,862 TRANSFERS - NET5,276,901 1,051,954 6,328,855 28,556 Total general revenues and transfers(786,842) (365,514) (1,152,356) (4,899) CHANGE IN NET ASSETS
15,539,137 1,742,713 17,281,850 899,792 NET ASSETS, JULY 1, 2008, as restated (Note 2)14,752,295$ 1,377,199$ 16,129,494$ 894,893$ NET ASSETS, JUNE 30, 2009
PRIMARY GOVERNMENT
NET (EXPENSE) REVENUE AND CHANGES IN NET ASSETS
25

COUNTY OF LOS ANGELESBALANCE SHEETGOVERNMENTAL FUNDSJUNE 30, 2009 (in thousands)
FIRE FLOODGENERAL PROTECTION CONTROL PUBLIC
FUND DISTRICT DISTRICT LIBRARYASSETS:Pooled cash and investments: (Notes 1 and 5)
Operating (Note 1) 1,107,989$ 154,635 173,805 30,501 Other (Note 1) 733,590 43,689 8,717 3,970
Total pooled cash and investments 1,841,579 198,324 182,522 34,471 Other investments (Notes 4 and 5) 6,099 31 120 Taxes receivable 301,269 68,437 19,616 9,103 Interest receivable 12,555 600 671 148 Other receivables 1,895,101 40,451 9,582 1,547 Due from other funds (Note 14) 326,379 3,516 20,013 423 Advances to other funds (Note 14) 825,017 6,213 Inventories 46,486 7,084 588 TOTAL ASSETS 5,254,485$ 318,443 238,617 46,400
LIABILITIES AND FUND BALANCESLIABILITIES:
Accounts payable 247,337$ 5,593 9,760 2,941 Accrued payroll 504,374 49,288 5,227 Other payables 121,665 2,069 370 366 Due to other funds (Note 14) 495,105 10,125 18,401 4,708 Deferred revenue 343,386 46,431 18,060 6,233 Advances payable 361,964 Third party payor liability (Notes 10 and 13) 13,836
TOTAL LIABILITIES 2,087,667 113,506 46,591 19,475
FUND BALANCES:Reserved for:
Encumbrances 368,798 20,702 116,124 7,704 Inventories 46,486 7,084 588 Housing programsDebt serviceEndowments and annuitiesAssets unavailable for appropriation 124,567 25 3,011 16
Unreserved, designated for:Budget uncertainties 47,500 Program expansion 464,395 25,423 6,797 Health services 228,229 Capital projects 278,955 60,246 49,789 Special revenue funds - program expansion
Unreserved, undesignated, reported in: General fund 1,655,388 Special revenue funds 43,957 23,102 11,820 Capital projects funds
TOTAL FUND BALANCES 3,166,818 204,937 192,026 26,925
TOTAL LIABILITIES AND FUND BALANCES 5,254,485$ 318,443 238,617 46,400
The notes to the basic financial statements are an integral part of this statement.
26

REGIONALPARK AND NONMAJOR TOTAL
OPEN SPACE GOVERNMENTAL ELIMINATIONS GOVERNMENTALDISTRICT FUNDS (NOTE 4) FUNDS
ASSETS:Pooled cash and investments: (Notes 1 and 5)
286,387$ 1,567,932 3,321,249$ Operating (Note 1)2,753 56,188 848,907 Other (Note 1)
289,140 1,624,120 4,170,156 Total pooled cash and investments499,010 (246,875) 258,385 Other investments (Notes 4 and 5)
3,817 21,180 423,422 Taxes receivable1,167 5,317 20,458 Interest receivable4,440 111,882 2,063,003 Other receivables
330,739 681,070 Due from other funds (Note 14)11,034 842,264 Advances to other funds (Note 14)35,293 89,451 Inventories
298,564$ 2,638,575 (246,875) 8,548,209$ TOTAL ASSETS
LIABILITIES AND FUND BALANCESLIABILITIES:
1,653$ 45,449 312,733$ Accounts payable481 559,370 Accrued payroll
616 21,630 146,716 Other payables2,919 265,265 796,523 Due to other funds (Note 14)5,715 34,705 454,530 Deferred revenue
10,051 372,015 Advances payable855 14,691 Third party payor liability (Notes 10 and 13)
10,903 378,436 2,656,578 TOTAL LIABILITIES
FUND BALANCES:Reserved for:
78,136 169,062 760,526 Encumbrances35,293 89,451 Inventories1,618 1,618 Housing programs
694,741 (246,875) 447,866 Debt service3,019 3,019 Endowments and annuities
13,100 140,719 Assets unavailable for appropriationUnreserved, designated for:
5,282 52,782 Budget uncertainties43,463 540,078 Program expansion
228,229 Health services60,897 449,887 Capital projects
341,914 341,914 Special revenue funds - program expansionUnreserved, undesignated, reported in:
1,655,388 General fund166,062 746,221 991,162 Special revenue funds
188,992 188,992 Capital projects funds287,661 2,260,139 (246,875) 5,891,631 TOTAL FUND BALANCES
298,564$ 2,638,575 (246,875) 8,548,209$ TOTAL LIABILITIES AND FUND BALANCES
27

Fund balances - total governmental funds (page 27) 5,891,631$
Amounts reported for governmental activities in the statement ofnet assets are different because:
Capital assets used in governmental activities are not reported in governmental funds:
Land and easements 7,147,049$ Construction-in-progress 522,056 Buildings and improvements - net 2,772,919 Equipment - net 278,116 Infrastructure - net 4,438,662 15,158,802
Other long-term assets are not available to pay for current-periodexpenditures and are unearned, or not recognized, in governmental funds:
Deferred revenue - taxes 290,514$ Long-term receivables 183,278 473,792
The net pension obligation (an asset) pertaining to governmentalfund types is not recorded in governmental fund statements. 71,663
Accrued interest payable is not recognized in governmental funds. (14,525)
Long-term liabilities, including bonds and notes payable, are not due andpayable in the current period and, therefore, are not reported in thegovernmental funds:
Bonds and notes payable (including accreted interest) (1,492,994)$ Pension bonds payable (452,572) Capital lease obligations (157,794) Accrued vacation/sick leave (768,186) Workers' compensation (1,774,460) Litigation/self-insurance (111,317) Pollution remediation obligations (30,065) OPEB obligation (1,959,360) (6,746,748)
Assets and liabilities of certain internal service funds are included ingovernmental activities in the accompanying statement of net assets. (82,320)
Net assets of governmental activities (page 23) 14,752,295$
The notes to the basic financial statements are an integral part of this statement.
JUNE 30, 2009 (in thousands)
COUNTY OF LOS ANGELESRECONCILIATION OF THE BALANCE SHEET OF GOVERNMENTAL FUNDS
TO THE STATEMENT OF NET ASSETS
28

29

COUNTY OF LOS ANGELESSTATEMENT OF REVENUES, EXPENDITURES AND CHANGES IN FUND BALANCESGOVERNMENTAL FUNDSFOR THE YEAR ENDED JUNE 30, 2009 (in thousands)
FIRE FLOODGENERAL PROTECTION CONTROL PUBLIC
FUND DISTRICT DISTRICT LIBRARYREVENUES:Taxes 3,970,566$ 635,783 100,612 74,249 Licenses, permits and franchises 54,877 15,392 606 Fines, forfeitures and penalties 264,375 6,576 1,913 895 Revenue from use of money and property:
Investment income (Note 5) 124,626 2,712 4,750 1,170 Rents and concessions (Note 9) 58,759 84 7,604 11 Royalties 387 678
Intergovernmental revenues:Federal 3,062,976 4,598 2,086 105 State 4,029,726 15,558 8,515 1,890 Other 118,448 38,055 6,134 1,167
Charges for services 1,654,173 187,701 126,963 2,333 Miscellaneous 198,837 397 2,061 1,053 TOTAL REVENUES 13,537,750 906,856 261,922 82,873
EXPENDITURES:Current:
General government 946,008 Public protection 4,420,786 844,287 211,631 Public ways and facilitiesHealth and sanitation 2,480,693 Public assistance 4,796,019 Education 115,164 Recreation and cultural services 242,999
Debt service:Principal 76,123 3,751 832 Interest and other charges 158,524 7,055 1,505 Capital leases 12,601 3,604 190
Capital outlay 772 108 TOTAL EXPENDITURES 13,134,525 858,697 211,631 117,799
EXCESS (DEFICIENCY) OF REVENUES OVEREXPENDITURES 403,225 48,159 50,291 (34,926)
OTHER FINANCING SOURCES (USES):Transfers in (Note 14) 299,247 32 39,665 Transfers out (Note 14) (911,752) (13,351) (20,477) (7,014) Capital leases (Note 9) 772 108 Sales of capital assets 886 92 281 1 TOTAL OTHER FINANCING SOURCES (USES) (610,847) (13,259) (20,164) 32,760
NET CHANGE IN FUND BALANCES (207,622) 34,900 30,127 (2,166)
FUND BALANCE, JULY 1, 2008 3,374,440 170,037 161,899 29,091
FUND BALANCE, JUNE 30, 2009 3,166,818$ 204,937 192,026 26,925
The notes to the basic financial statements are an integral part of this statement.
30

REGIONALPARK AND NONMAJOR TOTAL
OPEN SPACE GOVERNMENTAL ELIMINATIONS GOVERNMENTALDISTRICT FUNDS (NOTE 4) FUNDS
REVENUES:$ 300,729 5,081,939$ Taxes
9,948 80,823 Licenses, permits and franchises915 89,373 364,047 Fines, forfeitures and penalties
Revenue from use of money and property:6,818 69,321 (12,822) 196,575 Investment income (Note 5)
24,423 90,881 Rents and concessions (Note 9)8 1,073 Royalties
Intergovernmental revenues:203,091 3,272,856 Federal390,728 4,446,417 State
19,983 183,787 Other79,140 143,399 2,193,709 Charges for services
125,414 327,762 Miscellaneous86,873 1,376,417 (12,822) 16,239,869 TOTAL REVENUES
EXPENDITURES:Current:
17,267 963,275 General government84,872 5,561,576 Public protection
309,264 309,264 Public ways and facilities164,337 2,645,030 Health and sanitation155,349 4,951,368 Public assistance
151 115,315 Education51,937 8,052 302,988 Recreation and cultural services
Debt service:126,194 (23,120) 183,780 Principal
66,205 (12,822) 220,467 Interest and other charges16,395 Capital leases
74,614 75,494 Capital outlay51,937 1,006,305 (35,942) 15,344,952 TOTAL EXPENDITURES
EXCESS (DEFICIENCY) OF REVENUES OVER34,936 370,112 23,120 894,917 EXPENDITURES
OTHER FINANCING SOURCES (USES):188,287 527,231 Transfers in (Note 14)
(33,280) (554,759) (1,540,633) Transfers out (Note 14)880 Capital leases (Note 9)
4,885 6,145 Sales of capital assets(33,280) (361,587) (1,006,377) TOTAL OTHER FINANCING SOURCES (USES)
1,656 8,525 23,120 (111,460) NET CHANGE IN FUND BALANCES
286,005 2,251,614 (269,995) 6,003,091 FUND BALANCE, JULY 1, 2008
287,661$ 2,260,139 (246,875) 5,891,631$ FUND BALANCE, JUNE 30, 2009
31

Net change in fund balances - total governmental funds (page 31) (111,460)$
Amounts reported for governmental activities in the statement of activitiesare different because:
Governmental funds report capital outlay as expenditures. However, inthe statement of activities, the cost of those assets is allocated overtheir estimated useful lives and reported as depreciation expense:
Expenditures for general capital assets, infrastructure and otherrelated capital asset adjustments 349,363$ Less - current year depreciation expense (311,823) 37,540
In the statement of activities, only the gain or loss on the disposal of capital assets is reported, whereas in the governmental funds, the proceeds fromthe sale are reported as an increase in financial resources. Thus, the change in net assets differs from the change in fund balance. (23,055)
Contribution of capital assets is not recognized in the governmental funds. 145,950
Revenue timing differences result in more revenue in government-widestatements. (35,594)
Repayment of debt principal is an expenditure in the governmental funds,but the repayment reduces long-term liabilities in the statement of net assets:
Pension bonds 80,706$ Certificates of participation 76,496 Assessment bonds 23,120 Other long term notes and loans 19,131 199,453
Some expenses reported in the accompanying statement of activities do notrequire (or provide) the use of current financial resources and, therefore, are not reported as expenditures in governmental funds:
Change in workers' compensation (29,214)$ Change in litigation/self-insurance 28,323 Change in pollution remediation obligations 1,213 Change in accrued vacation/sick leave (58,331) Change in OPEB liability (985,024) Change in accrued interest payable 754 Change in accretion of tobacco settlement bonds (20,666) Change in accretion of pension bonds 90,442 Transfer of capital assets from governmental fund to enterprise fund (131) (972,634)
The change in the net pension obligation (an asset) is not recognized in governmental funds. (29,926)
The portion of internal service funds that is reported with governmental activities. 2,884
Change in net assets of governmental activities (page 25) (786,842)$
The notes to the basic financial statements are an integral part of this statement.
TO THE STATEMENT OF ACTIVITIES FOR THE YEAR ENDED JUNE 30, 2009 (in thousands)
COUNTY OF LOS ANGELESRECONCILIATION OF THE STATEMENT OF REVENUES, EXPENDITURES AND
CHANGES IN FUND BALANCES OF GOVERNMENTAL FUNDS
32

COUNTY OF LOS ANGELESSTATEMENT OF REVENUES, EXPENDITURES AND CHANGES IN FUND BALANCE -BUDGET AND ACTUAL ON BUDGETARY BASISGENERAL FUNDFOR THE YEAR ENDED JUNE 30, 2009 (in thousands)
ORIGINAL FINAL ACTUAL ON VARIANCE FROMBUDGET BUDGET BUDGETARY FINAL BUDGET
BASIS OVER (UNDER)
REVENUES:Taxes 4,018,235$ 4,030,607 3,938,502 (92,105) Licenses, permits and franchises 56,826 59,223 54,877 (4,346) Fines, forfeitures and penalties 217,469 217,469 264,375 46,906 Revenue from use of money and property:
Investment income 103,014 102,887 112,602 9,715 Rents and concessions 56,569 55,738 58,758 3,020 Royalties 156 156 387 231
Intergovernmental revenues:Federal 3,270,698 3,419,375 3,058,947 (360,428) State 4,442,714 4,368,409 4,019,006 (349,403) Other 126,963 134,937 118,289 (16,648)
Charges for services 1,794,086 1,607,359 1,504,841 (102,518) Miscellaneous 135,498 254,356 242,384 (11,972)
TOTAL REVENUES 14,222,228 14,250,516 13,372,968 (877,548)
EXPENDITURES:Current:
General government 1,595,353 1,618,898 870,481 (748,417) Public protection 4,703,102 4,769,645 4,566,886 (202,759) Health and sanitation 2,813,733 2,822,445 2,562,912 (259,533) Public assistance 5,126,974 5,223,491 4,876,824 (346,667) Recreation and cultural services 261,006 262,081 248,026 (14,055)
Debt Service-Interest 9,104 9,104 9,104
Capital Outlay 1,350,273 1,207,314 101,254 (1,106,060) TOTAL EXPENDITURES 15,859,545 15,912,978 13,235,487 (2,677,491)
EXCESS (DEFICIENCY) OF REVENUES OVER EXPENDITURES (1,637,317) (1,662,462) 137,481 1,799,943
OTHER FINANCING SOURCES (USES):Sales of capital assets 715 715 886 171 Transfers in 490,543 495,998 263,213 (232,785) Transfers out (874,728) (693,253) (669,236) 24,017 Changes in reserves and designations 211,983 50,198 172,280 122,082
OTHER FINANCING SOURCES (USES) - NET (171,487) (146,342) (232,857) (86,515)
NET CHANGE IN FUND BALANCE (1,808,804) (1,808,804) (95,376) 1,713,428
FUND BALANCE, JULY 1, 2008 (Note 15) 1,808,804 1,808,804 1,808,804
FUND BALANCE, JUNE 30, 2009 (Note 15) $ 1,713,428 1,713,428
The notes to the basic financial statements are an integral part of this statement.
GENERAL FUND
33

COUNTY OF LOS ANGELESSTATEMENT OF REVENUES, EXPENDITURES AND CHANGES IN FUND BALANCE -BUDGET AND ACTUAL ON BUDGETARY BASISFIRE PROTECTION DISTRICTFOR THE YEAR ENDED JUNE 30, 2009 (in thousands)
ORIGINAL FINAL ACTUAL ON VARIANCE FROMBUDGET BUDGET BUDGETARY FINAL BUDGET
BASIS OVER (UNDER)
REVENUES:Taxes 642,453$ 642,453 629,671 (12,782) Licenses, permits and franchises 9,231 9,231 15,392 6,161 Fines, forfeitures and penalties 3,727 3,727 6,576 2,849 Revenue from use of money
and property:Investment income 1,000 1,000 1,616 616 Rents and concessions 114 114 84 (30)
Intergovernmental revenues:Federal 15,084 19,108 4,598 (14,510) State 15,829 16,300 15,558 (742) Other 29,407 29,407 38,054 8,647
Charges for services 178,049 178,049 187,701 9,652 Miscellaneous 672 887 397 (490)
TOTAL REVENUES 895,566 900,276 899,647 (629)
EXPENDITURES:Current-Public protection:
Salaries and employee benefits 767,203 767,739 747,146 (20,593) Services and supplies 119,754 132,514 107,076 (25,438) Other charges 1,069 1,160 535 (625) Capital assets 26,860 21,939 11,706 (10,233)
TOTAL EXPENDITURES 914,886 923,352 866,463 (56,889)
EXCESS (DEFICIENCY) OF REVENUES OVER EXPENDITURES (19,320) (23,076) 33,184 56,260
OTHER FINANCING SOURCES (USES):Sales of capital assets 103 103 92 (11) Transfers out (10,951) (13,351) (13,351) Changes in reserves and designations (13,180) (7,024) (5,025) 1,999
OTHER FINANCING SOURCES (USES) - NET (24,028) (20,272) (18,284) 1,988
NET CHANGE IN FUND BALANCE (43,348) (43,348) 14,900 58,248
FUND BALANCE, JULY 1, 2008 (Note 15) 43,348 43,348 43,348
FUND BALANCE, JUNE 30, 2009 (Note 15) $ 58,248 58,248
FIRE PROTECTION DISTRICT
The notes to the basic financial statements are an integral part of this statement.
34

COUNTY OF LOS ANGELESSTATEMENT OF REVENUES, EXPENDITURES AND CHANGES IN FUND BALANCE -BUDGET AND ACTUAL ON BUDGETARY BASISFLOOD CONTROL DISTRICTFOR THE YEAR ENDED JUNE 30, 2009 (in thousands)
ORIGINAL FINAL ACTUAL ON VARIANCE FROMBUDGET BUDGET BUDGETARY FINAL BUDGET
BASIS OVER (UNDER)
REVENUES:Taxes 93,744$ 98,625 99,459 834 Licenses, permits and franchises 1,300 1,300 606 (694) Fines, forfeitures and penalties 1,000 1,000 1,913 913 Revenue from use of money
and property:Investment income 6,849 6,849 3,792 (3,057) Rents and concessions 6,934 6,934 7,603 669 Royalties 200 200 678 478
Intergovernmental revenues:Federal 4,119 4,119 2,086 (2,033) State 9,227 9,227 8,515 (712) Other 6,199 6,199 6,134 (65)
Charges for services 122,697 142,361 126,679 (15,682) Miscellaneous 717 717 2,013 1,296
TOTAL REVENUES 252,986 277,531 259,478 (18,053)
EXPENDITURES:Current-Public protection:
Services and supplies 264,934 250,326 220,435 (29,891) Other charges 20,006 20,246 19,820 (426) Capital assets 156 256 177 (79)
Capital Outlay 1,725 1,725 937 (788)
TOTAL EXPENDITURES 286,821 272,553 241,369 (31,184)
EXCESS (DEFICIENCY) OF REVENUES OVER EXPENDITURES (33,835) 4,978 18,109 13,131
OTHER FINANCING SOURCES (USES):Sales of capital assets 900 900 281 (619) Transfers in 12,964 32 32 Transfers out (1,954) (1,954) (1,425) 529
Long-term debt proceeds 49 49 Appropriation for contingencies (3,005) (7,886) 7,886 Changes in reserves and designations (6,475) (27,475) (20,065) 7,410
OTHER FINANCING SOURCES (USES) - NET 2,430 (36,383) (21,128) 15,255
NET CHANGE IN FUND BALANCE (31,405) (31,405) (3,019) 28,386
FUND BALANCE, JULY 1, 2008 (Note 15) 31,405 31,405 31,405
FUND BALANCE, JUNE 30, 2009 (Note 15) $ 28,386 28,386
FLOOD CONTROL DISTRICT
The notes to the basic financial statements are an integral part of this statement.
35

COUNTY OF LOS ANGELESSTATEMENT OF REVENUES, EXPENDITURES AND CHANGES IN FUND BALANCE -BUDGET AND ACTUAL ON BUDGETARY BASISPUBLIC LIBRARYFOR THE YEAR ENDED JUNE 30, 2009 (in thousands)
ORIGINAL FINAL ACTUAL ON VARIANCE FROMBUDGET BUDGET BUDGETARY FINAL BUDGET
BASIS OVER (UNDER)
REVENUES:Taxes 75,881$ 75,881 73,541 (2,340) Fines, forfeitures and penalties 895 895 Revenue from use of money
and property:Investment income 700 700 943 243 Rents and concessions 16 16 11 (5)
Intergovernmental revenues:Federal 16 16 105 89 State 2,054 1,874 1,890 16 Other 1,255 1,255 1,167 (88)
Charges for services 2,300 2,300 2,333 33 Miscellaneous 1,192 1,192 1,053 (139)
TOTAL REVENUES 83,414 83,234 81,938 (1,296)
EXPENDITURES:Current-Education:
Salaries and employee benefits 80,826 80,826 75,085 (5,741) Services and supplies 57,622 57,335 40,902 (16,433) Other charges 680 680 540 (140) Capital assets 892 1,472 1,302 (170)
TOTAL EXPENDITURES 140,020 140,313 117,829 (22,484)
DEFICIENCY OF REVENUES OVER EXPENDITURES (56,606) (57,079) (35,891) 21,188
OTHER FINANCING SOURCES (USES):Sales of capital assets 1 1 Transfers in 47,123 48,496 39,664 (8,832) Transfers out (3,079) (6,625) (6,625) Changes in reserves and designations (4,064) (1,418) (468) 950
OTHER FINANCING SOURCES (USES) - NET 39,980 40,453 32,572 (7,881)
NET CHANGE IN FUND BALANCE (16,626) (16,626) (3,319) 13,307
FUND BALANCE, JULY 1, 2008 (Note 15) 16,626 16,626 16,626
FUND BALANCE, JUNE 30, 2009 (Note 15) $ 13,307 13,307
PUBLIC LIBRARY
The notes to the basic financial statements are an integral part of this statement.
36

COUNTY OF LOS ANGELESSTATEMENT OF REVENUES, EXPENDITURES AND CHANGES IN FUND BALANCE -BUDGET AND ACTUAL ON BUDGETARY BASISREGIONAL PARK AND OPEN SPACE DISTRICTFOR THE YEAR ENDED JUNE 30, 2009 (in thousands)
ORIGINAL FINAL ACTUAL ON VARIANCE FROMBUDGET BUDGET BUDGETARY FINAL BUDGET
BASIS OVER (UNDER)
REVENUES: Fines, forfeitures and penalties 826$ 826 915 89 Revenue from use of money and property- Investment income 8,123 8,123 5,344 (2,779) Charges for services 78,387 78,387 79,245 858
TOTAL REVENUES 87,336 87,336 85,504 (1,832)
EXPENDITURES: Current-Recreation and cultural services: Services and supplies 4,965 4,965 4,029 (936) Other charges 186,049 186,049 44,098 (141,951)
TOTAL EXPENDITURES 191,014 191,014 48,127 (142,887)
EXCESS (DEFICIENCY) OF REVENUES OVER EXPENDITURES (103,678) (103,678) 37,377 141,055
OTHER FINANCING SOURCES (USES): Transfers in 72,891 72,891 71,651 (1,240) Transfers out (109,036) (109,036) (104,931) 4,105 Appropriation for contingencies (17,325) (17,325) 17,325
Changes in reserves and designations (3,981) (3,981) (1,470) 2,511
OTHER FINANCING SOURCES (USES) - NET (57,451) (57,451) (34,750) 22,701
NET CHANGE IN FUND BALANCE (161,129) (161,129) 2,627 163,756
FUND BALANCE, JULY 1, 2008 (Note 15) 164,013 164,013 164,013
FUND BALANCE, JUNE 30, 2009 (Note 15) 2,884$ 2,884 166,640 163,756
REGIONAL PARK AND OPEN SPACE DISTRICT
The notes to the basic financial statements are an integral part of this statement.
37

COUNTY OF LOS ANGELESSTATEMENT OF NET ASSETSPROPRIETARY FUNDSJUNE 30, 2009 (in thousands) BUSINESS-TYPE ACTIVITIES -
Harbor Olive View LAC+USC Martin Luther Rancho LosUCLA Medical UCLA Medical Medical King Jr. Ambulatory Amigos National
Center Center Center Care Center Rehab CenterASSETSCurrent assets:
Pooled cash and investments: (Notes 1 and 5)Operating (Note 1) 650$ 708 10,990 285 240Other (Note 1) 15,869 14,128 27,512 53,752 4,131 Total pooled cash and investments 16,519 14,836 38,502 54,037 4,371
Other investments (Note 5)Taxes receivableAccounts receivable - net (Note 13) 179,036 199,616 350,104 181,137 114,961Interest receivable 2 55 134Other receivables 11,611 12,180 23,444 3,515 3,797Due from other funds (Note 14) 40,438 65,610 179,931 4,714 27,645Advances to other funds (Note 14)Inventories 2,762 3,582 7,857 1,931 1,411
Total current assets 250,368 295,879 599,972 245,334 152,185Noncurrent assets:
Restricted assets (Note 5) 9,166 26,800 22,473 1,083 7,274Net pension obligation (Note 7) 4,218 3,659 11,075 4,700 3,036Capital assets: (Notes 6 and 9)
Land and easements 1,001 15,171 18,183 2,277 217Buildings and improvements 77,672 152,939 1,075,313 194,951 187,179Equipment 36,475 33,661 145,309 50,681 13,409InfrastructureConstruction in progress 49,013 13,959 12,080 Less accumulated depreciation (71,904) (105,181) (215,835) (143,581) (102,919) Total capital assets - net 92,257 110,549 1,022,970 104,328 109,966 Total noncurrent assets 105,641 141,008 1,056,518 110,111 120,276
TOTAL ASSETS 356,009 436,887 1,656,490 355,445 272,461 LIABILITIESCurrent liabilities:
Accounts payable 12,716 6,646 29,147 7,702 3,529Accrued payroll 29,563 21,263 52,466 7,054 9,729Other payables 2,256 2,028 3,179 3,142 1,005Accrued interest payable 83 79 191 203Due to other funds (Note 14) 32,478 36,607 79,946 44,288 33,921Advances from other funds (Note 14) 134,597 200,128 275,238 154,996 56,469Advances payable 228Unearned revenue 71 61 1,013 79 51Current portion of long-term liabilities (Note 10) 106,262 62,664 177,835 34,271 28,725 Total current liabilities 318,026 329,397 619,131 251,723 133,632
Noncurrent liabilities:Accrued vacation and sick leave (Note 10) 32,869 22,516 53,142 9,397 10,461Bonds and notes payable (Note 10) 7,737 12,383 34,317 30,910Pension bonds payable (Notes 7 and 10) 13,104 11,366 34,407 14,603 9,431Workers' compensation (Notes 10 and 17) 27,625 24,969 121,700 56,778 22,661Litigation and self-insurance (Notes 10 and 17) 13,165 4,923 55,896 13,825 196OPEB obligation (Notes 8 and 10) 83,415 71,705 174,490 25,225 33,714Third party payor liability (Notes 10 and 13) 23,609 18,220 102,521 17,747 14,158
Total noncurrent liabilities 201,524 153,699 554,539 171,892 121,531TOTAL LIABILITIES 519,550 483,096 1,173,670 423,615 255,163 NET ASSETSInvested in capital assets, net of related debt
(Notes 6 and 10) 20,411 104,366 918,372 68,248 77,359Restricted:
Debt service 9,083 26,800 22,394 892 7,071Special purpose
Unrestricted (deficit) (193,035) (177,375) (457,946) (137,310) (67,132)TOTAL NET ASSETS (DEFICIT) (Note 3) (163,541)$ (46,209) 482,820 (68,170) 17,298
The notes to the basic financial statements are an integral part of this statement.
38

GOVERNMENTALENTERPRISE FUNDS ACTIVITIES
Nonmajor InternalWaterworks Enterprise Service
Funds Funds Total FundsASSETSCurrent assets:
Pooled cash and investments: (Notes 1 and 5)86,393$ 4,863 104,129$ 48,576$ Operating (Note 1)
881 6 116,279 9,281 Other (Note 1)87,274 4,869 220,408 57,857 Total pooled cash and investments
30,380 30,380 8,131 Other investments (Note 5)950 950 Taxes receivable
1,024,854 Accounts receivable - net (Note 13)349 13 553 207 Interest receivable
8,484 8,456 71,487 6,789 Other receivables1,821 53 320,212 65,910 Due from other funds (Note 14)1,164 1,164 Advances to other funds (Note 14)
11 17,554 9,769 Inventories100,042 43,782 1,687,562 148,663 Total current assets
Noncurrent assets:66,796 14,124 Restricted assets (Note 5)26,688 5,150 Net pension obligation (Note 7)
Capital assets: (Notes 6 and 9)10,965 199,160 246,974 Land and easements
119,091 179,967 1,987,112 1,734 Buildings and improvements535 3,175 283,245 217,720 Equipment
1,108,349 41,505 1,149,854 Infrastructure35,368 1,258 111,678 Construction in progress
(480,038) (188,274) (1,307,732) (114,404) Less accumulated depreciation794,270 236,791 2,471,131 105,050 Total capital assets - net794,270 236,791 2,564,615 124,324 Total noncurrent assets894,312 280,573 4,252,177 272,987 TOTAL ASSETS
LIABILITIESCurrent liabilities:
3,231 3,074 66,045 5,539 Accounts payable120,075 24,402 Accrued payroll
19 3,007 14,636 1,811 Other payables556 209 Accrued interest payable
6,263 249 233,752 36,917 Due to other funds (Note 14)821,428 22,000 Advances from other funds (Note 14)
228 Advances payable475 530 2,280 711 Unearned revenue19 987 410,763 77,667 Current portion of long-term liabilities (Note 10)
10,007 7,847 1,669,763 169,256 Total current liabilitiesNoncurrent liabilities:
211 128,596 37,657 Accrued vacation and sick leave (Note 10)67 3,324 88,738 30,470 Bonds and notes payable (Note 10)
82,911 15,998 Pension bonds payable (Notes 7 and 10)253,733 14,531 Workers' compensation (Notes 10 and 17)88,005 1,341 Litigation and self-insurance (Notes 10 and 17)
388,549 84,482 OPEB obligation (Notes 8 and 10)176,255 Third party payor liability (Notes 10 and 13)
67 3,535 1,206,787 184,479 Total noncurrent liabilities10,074 11,382 2,876,550 353,735 TOTAL LIABILITIES
NET ASSETSInvested in capital assets, net of related debt
794,184 233,111 2,216,051 67,154 (Notes 6 and 10)Restricted:
90,054 2,969 159,263 13,915 Debt service29,546 29,546 3,042 Special purpose3,565 (1,029,233) (164,859) Unrestricted (deficit)
884,238$ 269,191 1,375,627 (80,748)$ TOTAL NET ASSETS (DEFICIT) (Note 3)Adjustment to reflect the consolidation of internal
1,572 service fund activities related to enterprise funds1,377,199$ NET ASSETS OF BUSINESS-TYPE ACTIVITIES (PAGE 23)
39
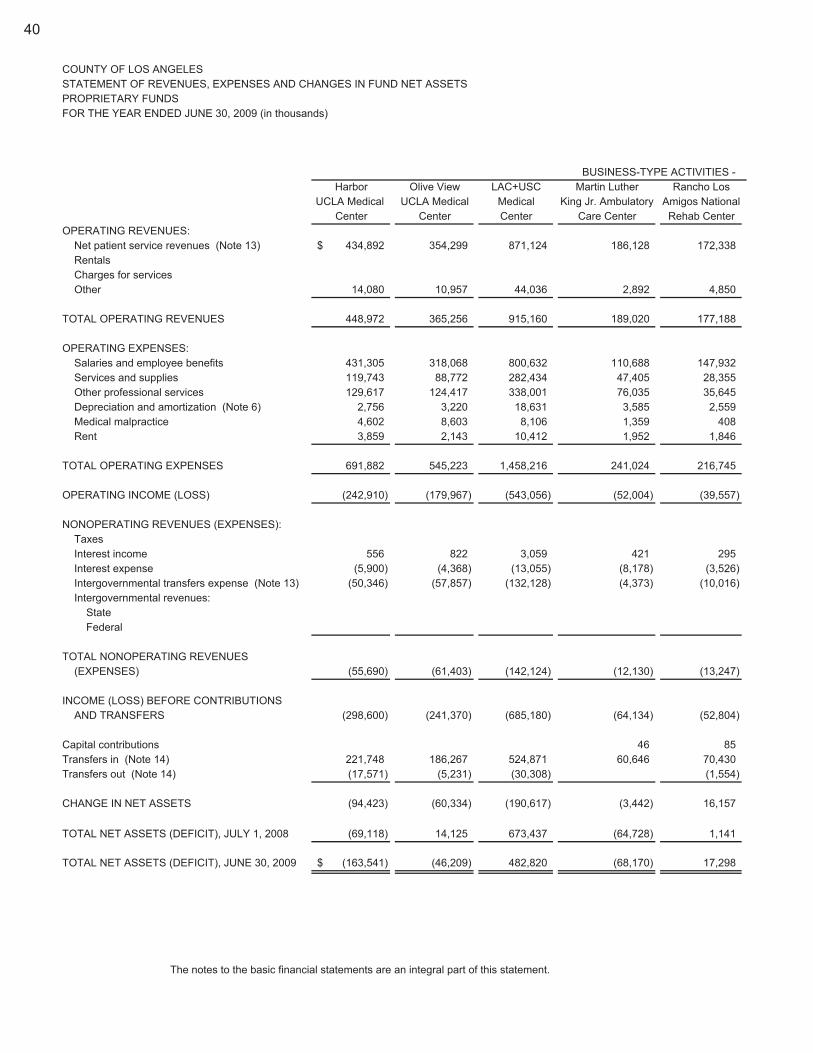
COUNTY OF LOS ANGELESSTATEMENT OF REVENUES, EXPENSES AND CHANGES IN FUND NET ASSETSPROPRIETARY FUNDSFOR THE YEAR ENDED JUNE 30, 2009 (in thousands)
BUSINESS-TYPE ACTIVITIES - Harbor Olive View LAC+USC Martin Luther Rancho Los
UCLA Medical UCLA Medical Medical King Jr. Ambulatory Amigos NationalCenter Center Center Care Center Rehab Center
OPERATING REVENUES:Net patient service revenues (Note 13) 434,892$ 354,299 871,124 186,128 172,338 RentalsCharges for servicesOther 14,080 10,957 44,036 2,892 4,850
TOTAL OPERATING REVENUES 448,972 365,256 915,160 189,020 177,188
OPERATING EXPENSES:Salaries and employee benefits 431,305 318,068 800,632 110,688 147,932 Services and supplies 119,743 88,772 282,434 47,405 28,355 Other professional services 129,617 124,417 338,001 76,035 35,645 Depreciation and amortization (Note 6) 2,756 3,220 18,631 3,585 2,559 Medical malpractice 4,602 8,603 8,106 1,359 408 Rent 3,859 2,143 10,412 1,952 1,846
TOTAL OPERATING EXPENSES 691,882 545,223 1,458,216 241,024 216,745
OPERATING INCOME (LOSS) (242,910) (179,967) (543,056) (52,004) (39,557)
NONOPERATING REVENUES (EXPENSES):TaxesInterest income 556 822 3,059 421 295 Interest expense (5,900) (4,368) (13,055) (8,178) (3,526) Intergovernmental transfers expense (Note 13) (50,346) (57,857) (132,128) (4,373) (10,016) Intergovernmental revenues:
StateFederal
TOTAL NONOPERATING REVENUES (EXPENSES) (55,690) (61,403) (142,124) (12,130) (13,247)
INCOME (LOSS) BEFORE CONTRIBUTIONSAND TRANSFERS (298,600) (241,370) (685,180) (64,134) (52,804)
Capital contributions 46 85 Transfers in (Note 14) 221,748 186,267 524,871 60,646 70,430 Transfers out (Note 14) (17,571) (5,231) (30,308) (1,554)
CHANGE IN NET ASSETS (94,423) (60,334) (190,617) (3,442) 16,157
TOTAL NET ASSETS (DEFICIT), JULY 1, 2008 (69,118) 14,125 673,437 (64,728) 1,141
TOTAL NET ASSETS (DEFICIT), JUNE 30, 2009 (163,541)$ (46,209) 482,820 (68,170) 17,298
The notes to the basic financial statements are an integral part of this statement.
40

GOVERNMENTALENTERPRISE FUNDS ACTIVITIES
Nonmajor InternalWaterworks Enterprise Service
Funds Funds Total FundsOPERATING REVENUES:
$ 2,018,781$ $ Net patient service revenues (Note 13)14,582 14,582 25,731 Rentals
58,406 323 58,729 433,605 Charges for services1 888 77,704 Other
58,407 15,793 2,169,796 459,336 TOTAL OPERATING REVENUES
OPERATING EXPENSES:1,808,625 348,699 Salaries and employee benefits
50,996 269,401 887,106 43,725 Services and supplies3,594 840 708,149 32,672 Other professional services
22,305 2,810 55,866 30,262 Depreciation and amortization (Note 6)23,078 Medical malpractice20,212 Rent
76,895 273,051 3,503,036 455,358 TOTAL OPERATING EXPENSES
(18,488) (257,258) (1,333,240) 3,978 OPERATING INCOME (LOSS)
NONOPERATING REVENUES (EXPENSES):4,453 4,453 Taxes2,915 1,777 9,845 1,216 Interest income
(9) (223) (35,259) (4,869) Interest expense(254,720) Intergovernmental transfers expense (Note 13)
Intergovernmental revenues:97 25 122 State79 230,610 230,689 785 Federal
TOTAL NONOPERATING REVENUES 7,535 232,189 (44,870) (2,868) (EXPENSES)
INCOME (LOSS) BEFORE CONTRIBUTIONS(10,953) (25,069) (1,378,110) 1,110 AND TRANSFERS
166 671 968 Capital contributions2,980 1,066,942 4,362 Transfers in (Note 14)
(349) (55,013) (2,889) Transfers out (Note 14)
(11,136) (21,418) (365,213) 2,583 CHANGE IN NET ASSETS
895,374 290,609 (83,331) TOTAL NET ASSETS (DEFICIT), JULY 1, 2008
884,238$ 269,191 (80,748)$ TOTAL NET ASSETS (DEFICIT), JUNE 30, 2009Adjustment to reflect the consolidation of internal
(301) service fund activities related to enterprise fundsCHANGE IN NET ASSETS OF BUSINESS-TYPE
(365,514)$ ACTIVITIES (PAGE 25)
41

COUNTY OF LOS ANGELESSTATEMENT OF CASH FLOWSPROPRIETARY FUNDSFOR THE YEAR ENDED JUNE 30, 2009 (in thousands)
BUSINESS-TYPE ACTIVITIES -Harbor Olive View LAC+USC Martin Luther Rancho Los
UCLA Medical UCLA Medical Medical King Jr. Ambulatory Amigos NationalCenter Center Center Care Center Rehab Center
CASH FLOWS FROM OPERATINGACTIVITIES:Cash received from patient services 384,217$ 283,653 761,855 205,985 121,908 Rentals receivedCash received from charges for servicesOther operating revenues 14,096 10,958 44,040 2,893 4,853 Cash received for services provided to other funds 16,536 16,473 31,667 7,112 288 Cash paid for salaries and employee benefits (388,083) (286,807) (726,937) (116,438) (134,412) Cash paid for services and supplies (58,297) (77,626) (152,756) (11,333) (7,632) Other operating expenses (137,700) (132,640) (355,591) (83,065) (37,524) Cash paid for services from other funds (30,612) (23,726) (114,133) (34,877) (20,065)
Net cash provided by (required for) operatingactivities (199,843) (209,715) (511,855) (29,723) (72,584)
CASH FLOWS FROM NONCAPITALFINANCING ACTIVITIES:Cash advances received from other funds 263,508 251,597 470,436 134,196 78,926 Cash advances paid/returned to other funds (226,732) (123,443) (403,645) (125,928) (76,278) Interest paid on pension bonds (2,981) (2,586) (7,828) (3,321) (2,144) Interest paid on advances (1,231) (1,426) (2,380) (2,754) (572) Intergovernmental transfers (50,346) (57,857) (132,128) (4,373) (10,016) Intergovernmental receiptsTransfers in 220,799 144,872 529,694 84,848 91,092 Transfers out (5,231) (1,554)
Net cash provided by (required for)noncapital financing activities 203,017 205,926 454,149 82,668 79,454
CASH FLOWS FROM CAPITAL ANDRELATED FINANCING ACTIVITIES:Proceeds from taxesCapital contributionsProceeds from bonds and notesInterest paid on capital borrowing (1,816) (356) (2,969) (2,400) (1,125) Principal payments on bonds and notes (1,710) (1,621) (3,947) (4,193) Principal payments on capital leases (130) Acquisition and construction of capital assets (32,977) (4,376) (85,257) (1,713) (881)
Net cash required for capital and related financing activities (36,503) (4,732) (89,847) (8,060) (6,329)
CASH FLOWS FROM INVESTING ACTIVITIES -Interest income received 236 489 2,617 65 65
Net increase (decrease) in cash and cashequivalents (33,093) (8,032) (144,936) 44,950 606
58,778 49,668 205,911 10,170 11,039
Cash and cash equivalents, June 30, 2009 25,685$ 41,636 60,975 55,120 11,645
The notes to the basic financial statements are an integral part of this statement.
Cash and cash equivalents, July 1, 2008
42
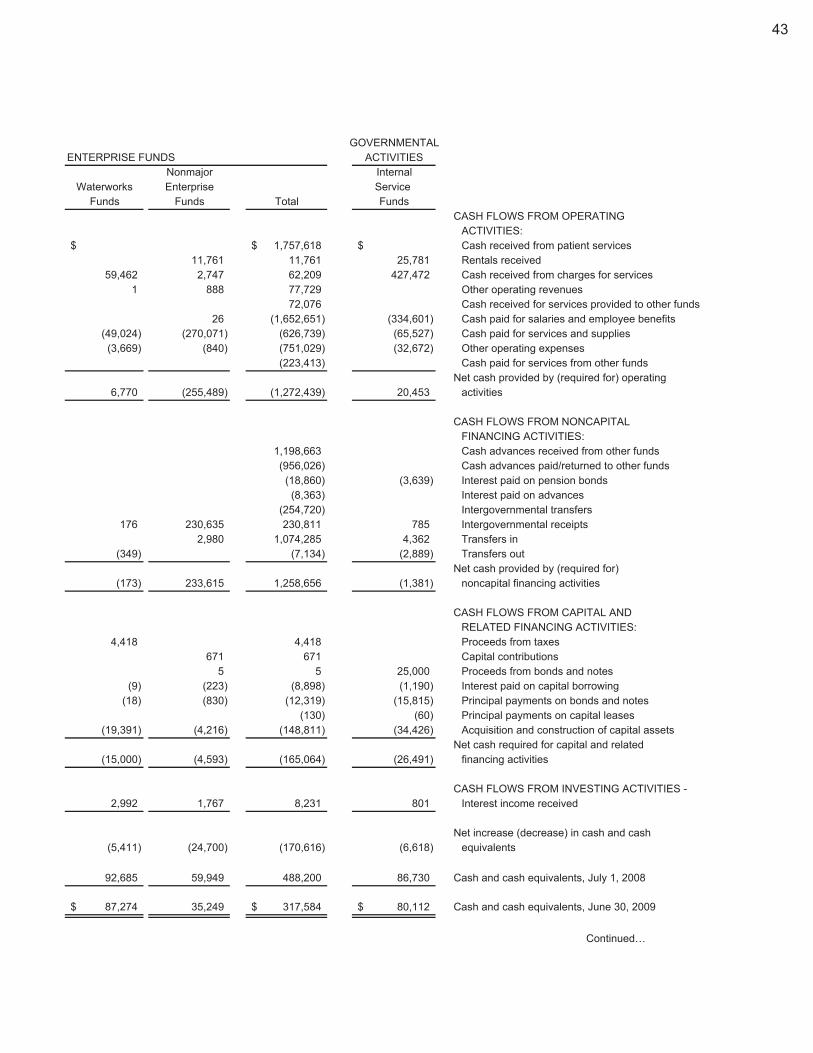
GOVERNMENTALENTERPRISE FUNDS ACTIVITIES
Nonmajor InternalWaterworks Enterprise Service
Funds Funds Total FundsCASH FLOWS FROM OPERATING
ACTIVITIES:$ 1,757,618$ $ Cash received from patient services
11,761 11,761 25,781 Rentals received59,462 2,747 62,209 427,472 Cash received from charges for services
1 888 77,729 Other operating revenues72,076 Cash received for services provided to other funds
26 (1,652,651) (334,601) Cash paid for salaries and employee benefits(49,024) (270,071) (626,739) (65,527) Cash paid for services and supplies(3,669) (840) (751,029) (32,672) Other operating expenses
(223,413) Cash paid for services from other fundsNet cash provided by (required for) operating
6,770 (255,489) (1,272,439) 20,453 activities
CASH FLOWS FROM NONCAPITALFINANCING ACTIVITIES:
1,198,663 Cash advances received from other funds(956,026) Cash advances paid/returned to other funds(18,860) (3,639) Interest paid on pension bonds(8,363) Interest paid on advances
(254,720) Intergovernmental transfers176 230,635 230,811 785 Intergovernmental receipts
2,980 1,074,285 4,362 Transfers in (349) (7,134) (2,889) Transfers out
Net cash provided by (required for)(173) 233,615 1,258,656 (1,381) noncapital financing activities
CASH FLOWS FROM CAPITAL ANDRELATED FINANCING ACTIVITIES:
4,418 4,418 Proceeds from taxes671 671 Capital contributions
5 5 25,000 Proceeds from bonds and notes(9) (223) (8,898) (1,190) Interest paid on capital borrowing
(18) (830) (12,319) (15,815) Principal payments on bonds and notes(130) (60) Principal payments on capital leases
(19,391) (4,216) (148,811) (34,426) Acquisition and construction of capital assetsNet cash required for capital and related
(15,000) (4,593) (165,064) (26,491) financing activities
CASH FLOWS FROM INVESTING ACTIVITIES -2,992 1,767 8,231 801 Interest income received
Net increase (decrease) in cash and cash(5,411) (24,700) (170,616) (6,618) equivalents
92,685 59,949 488,200 86,730 Cash and cash equivalents, July 1, 2008
87,274$ 35,249 317,584$ 80,112$ Cash and cash equivalents, June 30, 2009
Continued…
43
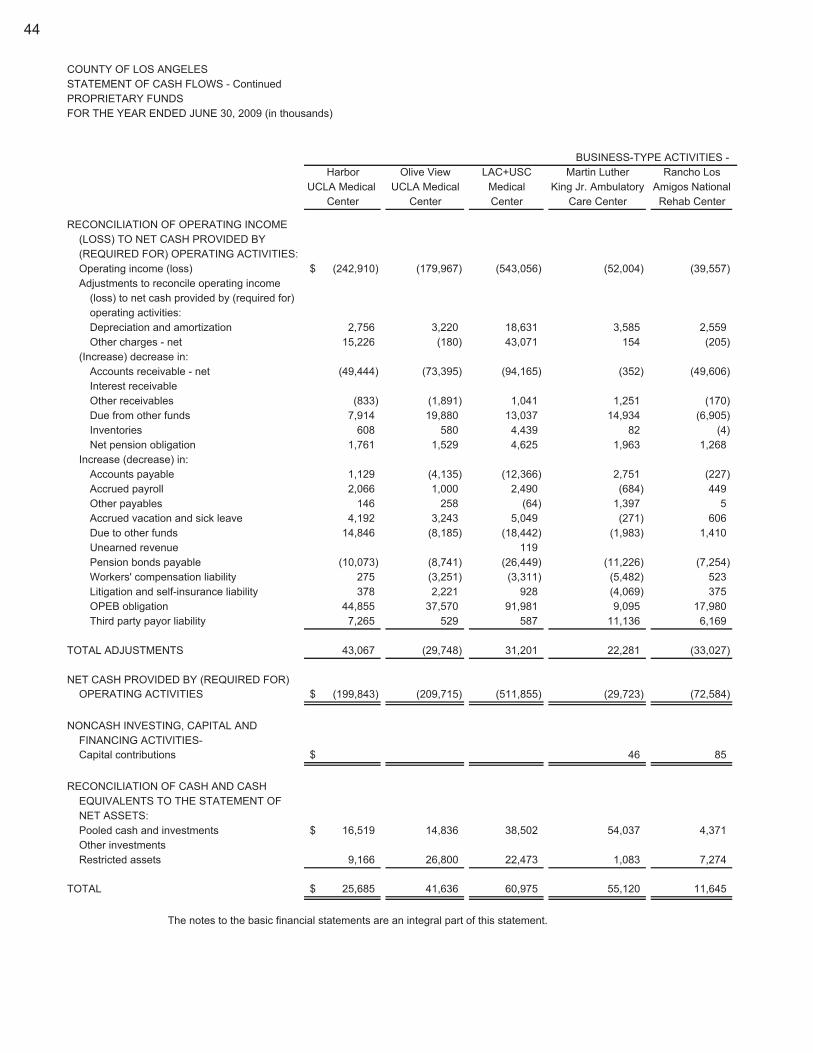
COUNTY OF LOS ANGELESSTATEMENT OF CASH FLOWS - ContinuedPROPRIETARY FUNDSFOR THE YEAR ENDED JUNE 30, 2009 (in thousands)
BUSINESS-TYPE ACTIVITIES -Harbor Olive View LAC+USC Martin Luther Rancho Los
UCLA Medical UCLA Medical Medical King Jr. Ambulatory Amigos NationalCenter Center Center Care Center Rehab Center
RECONCILIATION OF OPERATING INCOME (LOSS) TO NET CASH PROVIDED BY (REQUIRED FOR) OPERATING ACTIVITIES:Operating income (loss) (242,910)$ (179,967) (543,056) (52,004) (39,557) Adjustments to reconcile operating income
(loss) to net cash provided by (required for)operating activities:Depreciation and amortization 2,756 3,220 18,631 3,585 2,559 Other charges - net 15,226 (180) 43,071 154 (205)
(Increase) decrease in:Accounts receivable - net (49,444) (73,395) (94,165) (352) (49,606) Interest receivableOther receivables (833) (1,891) 1,041 1,251 (170) Due from other funds 7,914 19,880 13,037 14,934 (6,905) Inventories 608 580 4,439 82 (4) Net pension obligation 1,761 1,529 4,625 1,963 1,268
Increase (decrease) in:Accounts payable 1,129 (4,135) (12,366) 2,751 (227) Accrued payroll 2,066 1,000 2,490 (684) 449 Other payables 146 258 (64) 1,397 5 Accrued vacation and sick leave 4,192 3,243 5,049 (271) 606 Due to other funds 14,846 (8,185) (18,442) (1,983) 1,410 Unearned revenue 119 Pension bonds payable (10,073) (8,741) (26,449) (11,226) (7,254) Workers' compensation liability 275 (3,251) (3,311) (5,482) 523 Litigation and self-insurance liability 378 2,221 928 (4,069) 375 OPEB obligation 44,855 37,570 91,981 9,095 17,980 Third party payor liability 7,265 529 587 11,136 6,169
TOTAL ADJUSTMENTS 43,067 (29,748) 31,201 22,281 (33,027)
NET CASH PROVIDED BY (REQUIRED FOR)OPERATING ACTIVITIES (199,843)$ (209,715) (511,855) (29,723) (72,584)
NONCASH INVESTING, CAPITAL AND FINANCING ACTIVITIES-Capital contributions $ 46 85
RECONCILIATION OF CASH AND CASHEQUIVALENTS TO THE STATEMENT OFNET ASSETS:Pooled cash and investments 16,519$ 14,836 38,502 54,037 4,371 Other investmentsRestricted assets 9,166 26,800 22,473 1,083 7,274
TOTAL 25,685$ 41,636 60,975 55,120 11,645
The notes to the basic financial statements are an integral part of this statement.
44

GOVERNMENTALENTERPRISE FUNDS ACTIVITIES
Nonmajor InternalWaterworks Enterprise Service
Funds Funds Total Funds
RECONCILIATION OF OPERATING INCOME (LOSS) TO NET CASH PROVIDED BY (REQUIRED FOR) OPERATING ACTIVITIES:
(18,488)$ (257,258) (1,333,240)$ 3,978$ Operating income (loss) Adjustments to reconcile operating income
(loss) to net cash provided by (required for)operating activities:
22,305 2,810 55,866 30,262 Depreciation and amortization1 9 58,076 (13,118) Other charges - net
(Increase) decrease in:(266,962) Accounts receivable - net
90 Interest receivable408 (1,756) (1,950) (1,030) Other receivables648 (5) 49,503 (6,552) Due from other funds
(11) 5,694 (2,093) Inventories11,146 2,150 Net pension obligation
Increase (decrease) in:711 (921) (13,058) 1,475 Accounts payable
5,321 957 Accrued payroll19 1,314 3,075 71 Other payables
26 12,845 1,113 Accrued vacation and sick leave1,241 87 (11,026) (7,390) Due to other funds
216 335 524 Unearned revenue(63,743) (12,299) Pension bonds payable(11,246) (22,415) Workers' compensation liability
(75) (242) Litigation and self-insurance liability201,481 44,730 OPEB obligation25,686 Third party payor liability
25,258 1,769 60,801 16,475 TOTAL ADJUSTMENTS
NET CASH PROVIDED BY (REQUIRED FOR)6,770$ (255,489) (1,272,439)$ 20,453$ OPERATING ACTIVITIES
NONCASH INVESTING, CAPITAL AND FINANCING ACTIVITIES-
166$ 297$ Capital contributions
RECONCILIATION OF CASH AND CASHEQUIVALENTS TO THE STATEMENT OFNET ASSETS:
87,274$ 4,869 220,408$ 57,857$ Pooled cash and investments30,380 30,380 8,131 Other investments
66,796 14,124 Restricted assets
87,274$ 35,249 317,584$ 80,112$ TOTAL
45
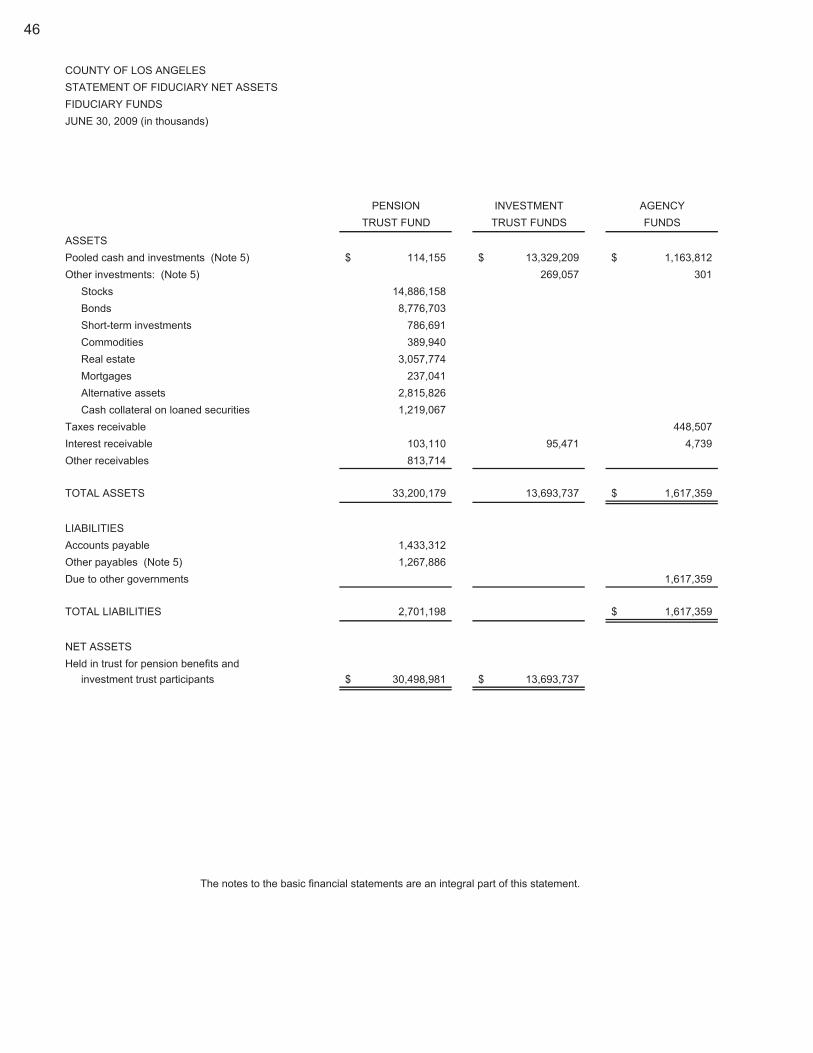
COUNTY OF LOS ANGELESSTATEMENT OF FIDUCIARY NET ASSETSFIDUCIARY FUNDSJUNE 30, 2009 (in thousands)
PENSION INVESTMENT AGENCYTRUST FUND TRUST FUNDS FUNDS
ASSETSPooled cash and investments (Note 5) 114,155$ 13,329,209$ 1,163,812$ Other investments: (Note 5) 269,057 301
Stocks 14,886,158 Bonds 8,776,703 Short-term investments 786,691 Commodities 389,940 Real estate 3,057,774 Mortgages 237,041 Alternative assets 2,815,826 Cash collateral on loaned securities 1,219,067
Taxes receivable 448,507 Interest receivable 103,110 95,471 4,739 Other receivables 813,714
TOTAL ASSETS 33,200,179 13,693,737 1,617,359$
LIABILITIESAccounts payable 1,433,312 Other payables (Note 5) 1,267,886 Due to other governments 1,617,359
TOTAL LIABILITIES 2,701,198 1,617,359$
NET ASSETSHeld in trust for pension benefits and
investment trust participants 30,498,981$ 13,693,737$
The notes to the basic financial statements are an integral part of this statement.
46

COUNTY OF LOS ANGELESSTATEMENT OF CHANGES IN FIDUCIARY NET ASSETSFIDUCIARY FUNDSFOR THE YEAR ENDED JUNE 30, 2009 (in thousands)
PENSION INVESTMENTTRUST FUND TRUST FUNDS
ADDITIONS:Contributions:
Pension trust contributions:Employer 831,671$ $ Member 415,545
Contributions to investment trust funds 41,476,476 Total contributions 1,247,216 41,476,476
Investment earnings:Investment income 1,073,730 373,706 Net decrease in the fair value of investments (8,393,120) Securities lending income (Note 5) 38,753
Total investment earnings (losses) (7,280,637) 373,706 Less - Investment expenses:
Expense from investing activities 104,603 Expense from securities lending activities (Note 5) 22,550
Total net investment expense 127,153 Net investment earnings (losses) (7,407,790) 373,706
Miscellaneous 1,221
NET INCREASE (DECREASE) IN ADDITIONS (6,159,353) 41,850,182
DEDUCTIONS:Salaries and employee benefits 35,843 Services and supplies 13,887 Benefit payments 1,996,008 Distribution from investment trust funds 42,045,082 Miscellaneous 20,599
TOTAL DEDUCTIONS 2,066,337 42,045,082
CHANGE IN NET ASSETS (8,225,690) (194,900)
NET ASSETS HELD IN TRUST, JULY 1, 2008 38,724,671 13,888,637
NET ASSETS HELD IN TRUST, JUNE 30, 2009 30,498,981$ 13,693,737$
The notes to the basic financial statements are an integral part of this statement.
47
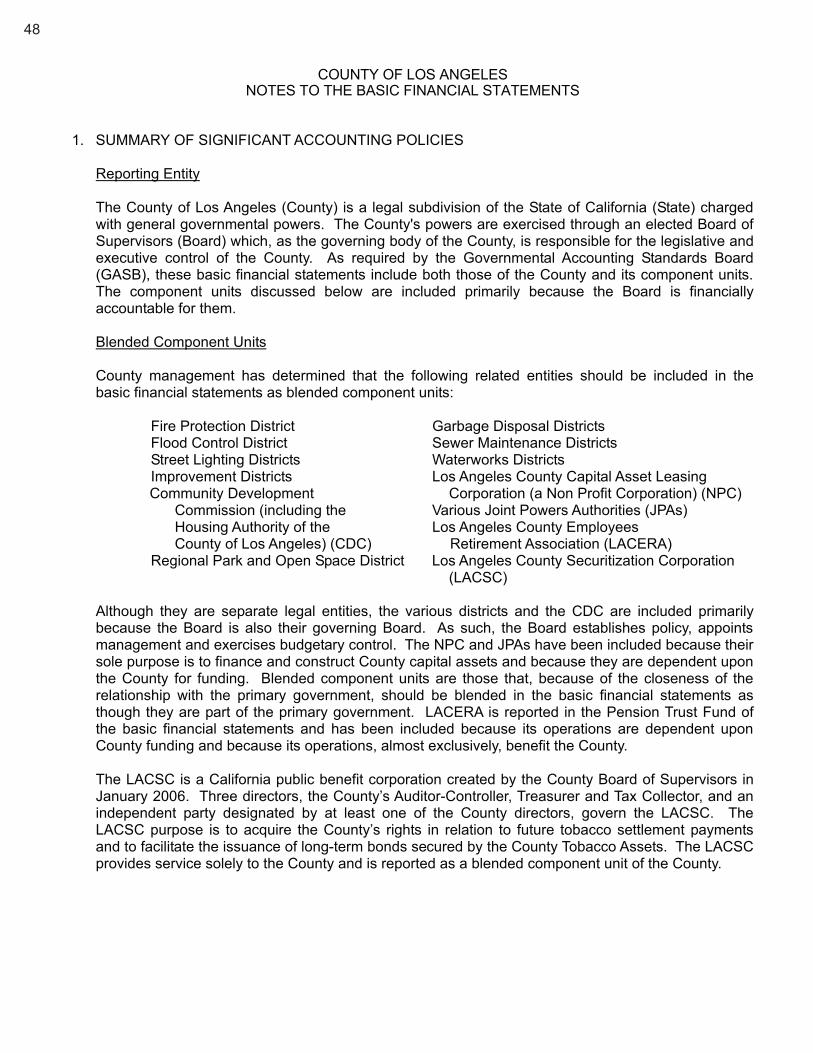
COUNTY OF LOS ANGELESNOTES TO THE BASIC FINANCIAL STATEMENTS
1. SUMMARY OF SIGNIFICANT ACCOUNTING POLICIES
Reporting Entity
The County of Los Angeles (County) is a legal subdivision of the State of California (State) charged with general governmental powers. The County's powers are exercised through an elected Board of Supervisors (Board) which, as the governing body of the County, is responsible for the legislative and executive control of the County. As required by the Governmental Accounting Standards Board (GASB), these basic financial statements include both those of the County and its component units. The component units discussed below are included primarily because the Board is financially accountable for them.
Blended Component Units
County management has determined that the following related entities should be included in the basic financial statements as blended component units:
Fire Protection District Garbage Disposal Districts Flood Control District Sewer Maintenance Districts Street Lighting Districts Waterworks Districts Improvement Districts Los Angeles County Capital Asset Leasing Community Development Corporation (a Non Profit Corporation) (NPC)
Commission (including the Various Joint Powers Authorities (JPAs) Housing Authority of the Los Angeles County Employees County of Los Angeles) (CDC) Retirement Association (LACERA)
Regional Park and Open Space District Los Angeles County Securitization Corporation (LACSC)
Although they are separate legal entities, the various districts and the CDC are included primarily because the Board is also their governing Board. As such, the Board establishes policy, appoints management and exercises budgetary control. The NPC and JPAs have been included because their sole purpose is to finance and construct County capital assets and because they are dependent upon the County for funding. Blended component units are those that, because of the closeness of the relationship with the primary government, should be blended in the basic financial statements as though they are part of the primary government. LACERA is reported in the Pension Trust Fund of the basic financial statements and has been included because its operations are dependent upon County funding and because its operations, almost exclusively, benefit the County.
The LACSC is a California public benefit corporation created by the County Board of Supervisors in January 2006. Three directors, the County’s Auditor-Controller, Treasurer and Tax Collector, and an independent party designated by at least one of the County directors, govern the LACSC. The LACSC purpose is to acquire the County’s rights in relation to future tobacco settlement payments and to facilitate the issuance of long-term bonds secured by the County Tobacco Assets. The LACSC provides service solely to the County and is reported as a blended component unit of the County.
48
COUNTY OF LOS ANGELESNOTES TO THE BASIC FINANCIAL STATEMENTS-Continued
1. SUMMARY OF SIGNIFICANT ACCOUNTING POLICIES-Continued
Discretely Presented Component Unit
First 5 LA (First 5), was established by the County as a separate legal entity to administer the County's share of tobacco taxes levied by the State pursuant to Proposition 10. The County’s Board established First 5 with nine voting members and four non-voting representatives. Of the nine voting members, one is a member of the Board of Supervisors, two are heads of County Departments (Public Health Services and Mental Health), one is an early childhood education expert, and five are public members appointed by the Board. The non-voting representatives are from other County commissions and planning groups.
First 5 services are focused on the development and well-being of all children, from the prenatal stage until age five. First 5 is a component unit of the County because the County’s Board appoints the voting Commissioners and the County has the ability to impose its will by removing those commissioners at will. It is discretely presented because its governing body is not substantially the same as the County's governing body and it does not provide services entirely or exclusively to the County.
Component Unit Financial Statements
Separate financial statements or additional financial information for each of the component units may be obtained from the Auditor-Controller at 500 West Temple Street, Room 525, Los Angeles, California 90012.
Government-wide Financial Statements
The statement of net assets and statement of activities display information about the primary government, the County, and its component units. These statements include the financial activities of the overall government, except for fiduciary activities. Eliminations have been made to minimize the double counting of internal activities, except for services provided among funds (other than internal service funds). These statements distinguish between the governmental and business-type activities of the County and between the County and its discretely presented component unit. Governmental activities, which normally are supported by taxes and intergovernmental revenues, are reported separately from business-type activities, which rely to a significant extent on fees charged to external parties.
The statement of activities presents a comparison between direct expenses and program revenues for each segment of the business-type activities of the County and for each function of the County’s governmental activities. Direct expenses are those that are specifically associated with a program or function and, therefore, are clearly identifiable to a particular function. Program revenues include charges paid by the recipients of goods or services offered by the programs. Grants and contributions that are restricted to meeting the operational or capital requirements of a particular program are also recognized as program revenues. Revenues that are not classified as program revenues, including all taxes, are presented instead as general revenues.
49
COUNTY OF LOS ANGELESNOTES TO THE BASIC FINANCIAL STATEMENTS-Continued
1. SUMMARY OF SIGNIFICANT ACCOUNTING POLICIES-Continued
Government-wide Financial Statements-Continued
Net assets are classified into the following three categories: 1) invested in capital assets, net of related debt; 2) restricted and 3) unrestricted. Net assets are reported as restricted when they have external restrictions imposed by creditors, grantors, or laws or regulations of other governments and restrictions imposed by law through constitutional provisions or enabling legislation. At June 30, 2009, the restricted net assets balances were $1.644 billion and $192.4 million for governmental activities and business-type activities, respectively. For governmental activities, $84 million was restricted by enabling legislation.
When both restricted and unrestricted net assets are available, restricted resources are used first and then unrestricted resources are used to the extent necessary.
Fund Financial Statements
The fund financial statements provide information about the County’s funds, including fiduciary funds and blended component units. Separate statements for each fund category - governmental, proprietary, and fiduciary - are presented. The emphasis of fund financial statements is on major governmental and enterprise funds, each displayed in a separate column. All remaining governmental and enterprise funds are separately aggregated and reported as nonmajor funds.
The County reports the following major governmental funds:
General Fund The General Fund is available for any authorized purpose and is used to account for all
resources except for those accounted for in other funds.
Fire Protection District Fund The Fire Protection District Fund was established to provide for fire prevention and
suppression, rescue service, management of hazardous materials incidents, ocean lifeguard services, and acquisition and maintenance of district property and equipment. Revenues are derived principally from the Countywide tax levy, voter-approved taxes and charges for services.
Flood Control District Fund The Flood Control District Fund was established to provide for the control and conservation of
flood, storm and other waste waters, to conserve such waters for beneficial and useful purposes, and to protect the harbors, waterways, public highways and property located within the District from damage from such flood and storm waters. Revenues are derived primarily from the Countywide tax levy and benefit assessments (charges for services).
Public Library Fund The Public Library Fund was established to provide free library services to the unincorporated
areas of the County and to cities that contract for these services. Revenues are derived principally from the Countywide tax levy and voter-approved taxes.
50

COUNTY OF LOS ANGELESNOTES TO THE BASIC FINANCIAL STATEMENTS-Continued
1. SUMMARY OF SIGNIFICANT ACCOUNTING POLICIES-Continued
Fund Financial Statements-Continued
Regional Park and Open Space District Fund The Regional Park and Open Space District Fund was established to administer grant
programs designed to preserve beaches, parks, and wild lands, to acquire and renovate new and existing recreational facilities, and to restore rivers, streams, and trails in the County. Funding is derived from voter-approved assessments, charges for services and long-term debt proceeds.
The County’s major enterprise funds consist of five Hospital Funds and a Waterworks Enterprise Fund. The Hospital Enterprise funds provide health services to County residents. Revenues are principally patient service fees. Subsidies are also received from the General Fund. The Waterworks Enterprise Fund provides water services to County residents. Revenues are derived primarily from the sale of water and water service standby charges. A description of each Enterprise Fund is provided below:
Harbor-UCLA Medical Center The Harbor-UCLA Medical Center (H/UCLA) provides acute and intensive care unit
medical/surgical inpatient and outpatient care services, trauma and emergency room services, acute psychiatric services, pediatric and obstetric services, and transplants.
Olive View-UCLA Medical Center The Olive View-UCLA Medical Center (OV/UCLA) provides acute and intensive care,
emergency services, medical/surgical inpatient and outpatient health care services, obstetric and gynecological services, and psychiatric services.
LAC+USC Medical Center The LAC+USC Medical Center (LAC+USC) provides acute and intensive care unit
medical/surgical inpatient and outpatient services, trauma and emergency room services, a burn center, psychiatric services, renal dialysis, AIDS services, pediatric and obstetric services, and communicable disease services.
Martin Luther King, Jr. Ambulatory Care Center The Martin Luther King, Jr. Multi-Service Ambulatory Care Center (MLK-MACC) was formerly
known as Martin Luther King, Jr.-Harbor Hospital, until its loss of the hospital’s licensing/accreditation on August 25, 2007. At that time, inpatient and emergency services were closed and the facility was re-organized as MLK-MACC. The MLK-MACC provides urgent care services, comprehensive outpatient services, including, primary, specialty and subspecialty services in surgery, medicine, pediatrics, obstetrics, HIV/AIDS, and dental services.
Rancho Los Amigos National Rehabilitation Center The Rancho Los Amigos National Rehabilitation Center (Rancho) specializes in the
rehabilitation for victims of spinal cord injuries and strokes, pathokinesiology and polio services, services for liver diseases, pediatrics, ortho diabetes, dentistry, and neuro-science.
51

COUNTY OF LOS ANGELESNOTES TO THE BASIC FINANCIAL STATEMENTS-Continued
1. SUMMARY OF SIGNIFICANT ACCOUNTING POLICIES-Continued
Fund Financial Statements-Continued
Waterworks Funds The Waterworks Enterprise funds provide for the administration, maintenance, operation and
improvement of district water systems.
The following fund types have also been reported:
Internal Service Funds The Internal Service Funds are used to account for the financing of services provided by a
department or agency to other departments or agencies on a cost-reimbursement basis. The County's principal Internal Service Fund is used to account for the cost of services provided by the Department of Public Works to various other County funds and agencies.
Fiduciary Fund Types
Pension Trust Fund The Pension Trust Fund is used to account for financial activities of LACERA.
Investment Trust Funds The Pooled Investment Trust Fund is used to account for net assets of the County's external
investment pool.
The Specific Investment Trust Fund is used to account for the net assets of individual investment accounts, in aggregate. The related investment activity occurs separately from the County’s investment pool and is provided as a service to external investors.
Agency Funds The Agency Funds are used primarily to account for assets held by the County in an agency
capacity pending transfer or distribution to individuals, private organizations, other govern-mental entities, and other funds. Such funds have no equity accounts since all assets are due to individuals or entities at some future time. These funds (including Clearing and Revolving Funds, Deposit Funds, Other Agency Funds, State and City Revenue Funds, and Tax Collection Funds) account for assets held by the County in an agency capacity for individuals or other government units.
Basis of Accounting
The government-wide, proprietary, pension and investment trust fund financial statements are reported using the economic resources measurement focus and the accrual basis of accounting. Revenues are recorded when earned and expenses are recorded at the time liabilities are incurred, regardless of when the related cash flows take place. Nonexchange transactions, in which the County gives (or receives) value without directly receiving (or giving) equal value in exchange, include property and sales taxes, grants, entitlements and donations. On an accrual basis, revenue from property taxes is recognized in the fiscal year for which the taxes are levied. Revenues from grants and similar items are recognized in the fiscal year in which all eligibility requirements have been satisfied.
52

COUNTY OF LOS ANGELESNOTES TO THE BASIC FINANCIAL STATEMENTS-Continued
1. SUMMARY OF SIGNIFICANT ACCOUNTING POLICIES-Continued
Basis of Accounting-Continued
Governmental funds are reported using the current financial resources measurement focus and the modified accrual basis of accounting. Under this method, revenues are recognized when measurable and available. The County considers revenues to be available if collectible within one year after year-end, except for property taxes, which are considered available to the extent that they are collectible within 60 days after year-end. Expenditures are generally recorded when a liability is incurred, as under accrual accounting. However, debt service expenditures, as well as expenditures related to compensated absences and claims (including workers’ compensation) and judgments are recorded only when payment is due. General capital asset acquisitions are reported as expenditures in governmental funds. Proceeds of long-term debt and capital leases are reported as other financing sources.
For the governmental funds financial statements, revenues are recorded when they are susceptible to accrual. Specifically, property and sales taxes, investment income, and charges for services and other miscellaneous revenue are all considered to be susceptible to accrual and have been recognized as revenue in the current fiscal period. Entitlements and shared revenues are recorded at the time of receipt or earlier if the susceptible to accrual criteria are met. Expenditure-driven grants are recognized as revenue when the qualifying expenditures have been incurred and all other eligibility requirements have been met and are recorded at the time of receipt or earlier, if the susceptible to accrual criteria are met. All other revenues are not considered susceptible to accrual and are recognized when received.
Proprietary funds distinguish operating revenues and expenses from nonoperating items. Operating revenues and expenses generally result from providing services and producing and delivering goods in connection with a proprietary fund’s principal ongoing operations. The principal operating revenues of the County’s five Hospital Enterprise Funds (Hospitals) are from patient services. The principal operating revenues for the Waterworks Enterprise Funds are from charges for services. The principal operating revenues for the County’s Nonmajor Enterprise Funds and Internal Service Funds are charges for services and rental revenues. Operating expenses for all Enterprise Funds and the Internal Service Funds include the cost of sales and services, administrative expenses and depreciation on capital assets. Medical malpractice expenses, which are self-insured, are classified as operating expenses of the Hospitals. All other revenues and expenses not meeting this definition are reported as nonoperating items. As discussed in Note 13, intergovernmental transfer payments are recorded in the Hospitals and this item is classified as a nonoperating expense.
Agency funds do not have a measurement focus because they report only assets and liabilities. They do however, use the accrual basis of accounting to recognize receivables and payables.
The County applies all applicable Financial Accounting Standards Board (FASB) statements issued on or before November 30, 1989, in accounting and reporting for government-wide and proprietary fund financial statements. FASB statements issued after November 30, 1989, have not been applied unless specifically adopted in a GASB statement.
53

COUNTY OF LOS ANGELESNOTES TO THE BASIC FINANCIAL STATEMENTS-Continued
1. SUMMARY OF SIGNIFICANT ACCOUNTING POLICIES-Continued
Budgetary Data
In accordance with the provisions of Sections 29000-29144 of the Government Code of the State of California (Government Code), commonly known as the County Budget Act, the County prepares and adopts a budget on or before August 30 for each fiscal year. Budgets are adopted for the major governmental funds and certain nonmajor governmental funds on a basis of accounting which is different from generally accepted accounting principles (GAAP). Annual budgets were not adopted for the JPAs, Public Buildings and the LACSC debt service funds, the capital project funds and the permanent funds.
The County budget is organized by budget unit and by expenditure object. Budget units are established at the discretion of the Board of Supervisors. Within the General Fund (with certain exceptions), budget units are generally defined as individual departments. For other funds, each individual fund constitutes a budget unit. Expenditures are controlled on the object level for all budget units within the County, except for capital asset expenditures, which are controlled on the sub-object level. The total budget exceeds $25 billion and is currently controlled through the use of approximately 400 separate budget units. There were no excesses of expenditures over the related appropriations within any fund for the year ended June 30, 2009. The County prepares a separate budgetary document, the County Budget, which demonstrates legal compliance with budgetary control.
Transfers of appropriations between budget units must be approved by the Board. Supplemental appropriations financed by unanticipated revenue during the year must also be approved by the Board. Transfers of appropriations between objects of expenditure within the same budget unit must be approved by the Board or the Chief Executive Office, depending upon the amount transferred. The original and final budget amounts are reported in the accompanying basic financial statements. Any excess of budgetary expenditures and other financing uses over revenues and other financing sources is financed by beginning available fund balances as provided for in the County Budget Act.
Note 15 describes the differences between the budgetary basis of accounting and GAAP. A reconciling schedule is also presented for the major governmental funds.
Property Taxes
All jurisdictions within California derive their taxing authority from the State Constitution and various legislative provisions contained in the Government Code and Revenue and Taxation Code. Property is assessed at 100% of full cash or market value (with some exceptions) pursuant to Article XIIIA of the California State Constitution and statutory provisions by the County Assessor and State Board of Equalization. The total 2008-2009 assessed valuation of the County of Los Angeles approximated $1.081 trillion.
The property tax levy to support general operations of the various jurisdictions is limited to one percent (1%) of full cash value and is distributed in accordance with statutory formulae. Amounts needed to finance the annual requirements of voter-approved debt are excluded from this limitation and are separately calculated and levied each fiscal year. The rates are formally adopted by either the Board or the city councils and, in some instances, the governing board of a special district.
54

COUNTY OF LOS ANGELESNOTES TO THE BASIC FINANCIAL STATEMENTS-Continued
1. SUMMARY OF SIGNIFICANT ACCOUNTING POLICIES-Continued
Property Taxes-Continued
The County is divided into 11,372 tax rate areas, which are unique combinations of various jurisdictions servicing a specific geographic area. The rates levied within each tax rate area vary only in relation to levies assessed as a result of voter-approved taxes or indebtedness.
Property taxes are levied on both real and personal property. Secured property taxes are levied during September of each year. They become a lien on real property on January 1 preceding the fiscal year for which taxes are levied. These tax payments can be made in two equal installments; the first is due November 1 and delinquent with penalties after December 10; the second is due February 1 and delinquent with penalties after April 10. Secured property taxes which are delinquent and unpaid as of June 30 are declared to be tax defaulted and are subject to redemption penalties, costs, and interest when paid. If the delinquent taxes are not paid at the end of five (5) years, the property may be sold at public auction. The proceeds are used to pay the delinquent amounts due, and any excess is remitted, if claimed, to the taxpayer. Additional tax liens are created when there is a change in ownership of property or upon completion of new construction. Tax bills for these new tax liens are issued throughout the fiscal year and contain various payment and delinquent dates but are generally due within one year. If the new tax liens are lower, the taxpayer receives a tax refund rather than a tax bill. Unsecured personal property taxes are not a lien against real property. These taxes are due on August 1 and become delinquent, if unpaid, on August 31.
Deposits and Investments
In accordance with GASB Statements No. 25, “Financial Reporting for Defined Benefit Pension Plans and Note Disclosures for Defined Contribution Plans” and No. 31, "Accounting and Financial Reporting for Certain Investments and for External Investment Pools," the accompanying basic financial statements reflect the fair value of investments. Specific disclosures related to GASB 31 appear in Note 5.
Deposits and investments are reflected in the following asset accounts:
Pooled Cash and Investments
As provided for by the Government Code, the cash balances of substantially all funds are pooled and invested by the County Treasurer for the purpose of increasing interest earnings through investment activities. Interest earned on pooled investments is deposited to participating funds based upon each fund's average daily deposit balance during the allocation period. Each respective fund's share of the total pooled cash and investments is included among asset balances under the caption "Pooled Cash and Investments."
Pooled Cash and Investments are identified within the following categories for all County operating funds:
Operating Pooled Cash and Investments
This account represents amounts reflected in the County’s day-to-day financial records. Such amounts are utilized to determine the availability of cash for purposes of disbursing and borrowing funds.
55
COUNTY OF LOS ANGELESNOTES TO THE BASIC FINANCIAL STATEMENTS-Continued
1. SUMMARY OF SIGNIFICANT ACCOUNTING POLICIES-Continued
Deposits and Investments-Continued
Other Pooled Cash and Investments
This account represents amounts identified in various agency funds as of June 30, 2009 that were owed to or were more appropriately classified in County operating funds. Accordingly, certain cash balances have been reclassified from the agency funds as required by GASB Statement No. 34.
Other Investments
"Other Investments" represent Pension Trust Fund investments, investments of the CDC, various JPAs, NPCs and Public Buildings (bond financed capital assets), and amounts on deposit with the County Treasurer which are invested separately as provided by the Government Code or by specific instructions from the depositing entity.
Restricted Assets
Enterprise Funds’ restricted assets represent cash and investments of certain JPAs and Public Buildings projects restricted in accordance with the provisions of the certificates of participation issued. The Internal Service Funds’ restricted assets represent cash and investments restricted for debt service in accordance with the provisions of the LAC-CAL bond indenture. All of the above noted assets are included in the various disclosures in Note 5. These restricted assets are presented as noncurrent assets and are generally associated with long-term bonds payable.
Inventories
Inventories, which consist of materials and supplies held for consumption, are valued at cost using the average cost basis. The inventory costs of the governmental funds are accounted for as expenditures when the inventory items are consumed. Reported inventories are offset with a corresponding reservation of fund balance because these amounts are not available for appropriation and expenditure.
Of the amounts reported as inventories in the governmental activities, $35,293,000 represents land held for resale by the CDC. The CDC records land held for resale at the lower of cost or estimated net realizable value.
Capital Assets
Capital assets, which include land and easements, buildings and improvements, equipment, and infrastructure assets, are reported in the applicable governmental or business-type activities columns in the government-wide financial statements. Infrastructure assets are divided into the five following networks: road; water; sewer; flood control and aviation. Capital assets are recorded at historical cost or estimated historical cost if purchased or constructed. Donated capital assets are recorded at the estimated fair value at the date of donation. Certain buildings and equipment are being leased under capital leases as defined in FASB Statement No. 13. The present value of the minimum lease obligation has been capitalized in the statement of net assets and is also reflected as a liability in that statement.
56

COUNTY OF LOS ANGELESNOTES TO THE BASIC FINANCIAL STATEMENTS-Continued
1. SUMMARY OF SIGNIFICANT ACCOUNTING POLICIES-Continued
Capital Assets-Continued
Capital outlay is recorded as expenditures of the General, Special Revenue, and Capital Project Funds and as assets in the government-wide financial statements to the extent the County’s capitalization threshold is met. Interest incurred during the construction phase of the capital assets of business-type activities is reflected in the capitalized value of the asset constructed, net of interest earned on the invested proceeds over the same period.
The County’s capitalization thresholds are $5,000 for equipment, $100,000 for buildings and improvements and $100,000 for infrastructure assets. Maintenance and repairs are charged to operations when incurred. Betterments and major improvements which significantly increase values, change capacities, or extend useful lives are capitalized. Upon sale or retirement of capital assets, the cost and the related accumulated depreciation, as applicable, are removed from the respective accounts and any resulting gain or loss is included in the results of operations. Specific disclosures related to capital assets appear in Note 6.
Capital assets are depreciated or amortized using the straight-line method over the following estimated useful lives:
Buildings and Improvements 10 to 50 years Equipment 2 to 35 years Infrastructure 15 to 100 years
Works of art and historical treasures held for public exhibition, education, or research in furtherance of public service, rather than financial gain, are not capitalized. These items are protected, encumbered, conserved, and preserved by the County. It is the County’s policy to utilize proceeds from the sale of these items for the acquisition of other items for collection and display.
Advances Payable
The County uses certain agency funds as clearing accounts for the distribution of financial resources to other County funds. Pursuant to GASB 34, for external financial reporting purposes, the portions of the clearing account balances that pertain to other County funds should be reported as cash of the appropriate funds. The corresponding liability is included in “Advances Payable.”
Vacation and Sick Leave Benefits
Vacation pay benefits accrue to employees ranging from 10 to 20 days per year depending on years of service and the benefit plan. Sick leave benefits accrue at the rate of 10 to 12 days per year for union represented employees depending on years of service. Non-represented employees accrue at a rate of 8 days per year depending on the benefit plan. All benefits are payable upon termination, if unused, within limits and rates as specified in the County Salary Ordinance.
Liabilities for accrued vacation and sick leave benefits are accrued in the government-wide financial statements and in the proprietary funds. For the governmental funds, expenditures are recorded when amounts become due and payable (i.e., when employees terminate from service).
57

COUNTY OF LOS ANGELESNOTES TO THE BASIC FINANCIAL STATEMENTS-Continued
1. SUMMARY OF SIGNIFICANT ACCOUNTING POLICIES-Continued
Long-term-Debt
In the government-wide and proprietary funds financial statements, long-term debt and other long-term obligations are reported as liabilities in the applicable governmental activities or proprietary funds statement of net assets. Bond premiums and discounts, as well as issuance costs, are deferred and amortized over the life of the bonds using the effective interest method. Bonds payable are reported net of the applicable bond premium or discount. Bond issuance costs are reported as deferred charges and amortized over the term of the related debt.
In the governmental funds financial statements, bond premiums, discounts, and issuance costs, are recognized in the period issued. Bond proceeds are reported as other financing sources net of the applicable premium or discount. Issuance costs, even if withheld from the actual net proceeds received, are reported as debt service expenditures. Interest is reported as an expenditure in the period in which the related payment is made. The matured portion of long-term debt (i.e. portion that has come due for payment) is reported as a liability in the fund financial statement of the related fund.
Cash Flows
For purposes of reporting cash flows, all amounts reported as "Pooled Cash and Investments," "Other Investments," and "Restricted Assets" are considered cash equivalents. Pooled cash and investment amounts represent funds held in the County Treasurer's cash management pool. Such amounts are similar in nature to demand deposits (i.e., funds may be deposited and withdrawn at any time without prior notice or penalty).
Use of Estimates
The preparation of financial statements in conformity with GAAP requires management to make estimates and assumptions that affect the reported amounts of certain assets and liabilities, disclosures of contingent assets and liabilities at the date of the financial statements, and the reported amounts of revenues and expenditures during the reporting period. Actual results could differ from those estimates.
2. ACCOUNTING CHANGES AND RESTATEMENT OF NET ASSETS
As discussed below, the County implemented the following GASB Statements in the 2008-2009 fiscal year:
Governmental Accounting Standards Board Statement No. 49
For the fiscal year ended June 30, 2009, the County implemented GASB Statement No. 49, “Accounting and Financial Reporting for Pollution Remediation Obligations.” This Statement provides specific accounting and reporting guidance for pollution remediation obligations, including disclosure requirements. These obligations address the current and potential detrimental effects of existing pollution by participating in pollution remediation activities. This matter is further discussed in Note 18.
58

COUNTY OF LOS ANGELESNOTES TO THE BASIC FINANCIAL STATEMENTS-Continued
2. ACCOUNTING CHANGES AND RESTATEMENT OF NET ASSETS-Continued
Governmental Accounting Standards Board Statement No. 52
GASB Statement No. 52, “Land, and Other Real Estate Held as Investments by Endowments,” was implemented by the County for the fiscal year ended June 30, 2009. GASB 52 establishes standards for accounting and financial reporting for land and other real estate held as investments by endowments. For the fiscal year ended June 30, 2009, no County endowment held land or real estate as investments. While GASB No. 52 is not applicable for the current period, the County will apply the Statement as appropriate in the future.
Restatement of Net Assets
In order to meet the guidelines in GASB Statement 49, the County restated its beginning government-wide/governmental activities’ balances to reflect the inclusion of its pollution remediation obligations. The effects of the changes are as follows (in thousands):
Effect of Net Assets Including Net Assets July 1, 2008 as Remediation July 1, 2008 previously reported Obligations as restated
Government-wide: Governmental activities $ 15,570,415 $ (31,278) $ 15,539,137
3. NET ASSET DEFICITS
The following funds had net asset deficits at June 30, 2009 (in thousands):
Accumulated Deficit
Enterprise Funds: Harbor/UCLA Medical Center $ 163,541 Olive View/UCLA Medical Center 46,209 M. L. King, Jr. Ambulatory Care Center 68,170 Internal Service Fund- Public Works 90,462 The Enterprise and Internal Service Funds’ deficits result primarily from the recognition of certain
liabilities including accrued vacation and sick leave, OPEB obligation, workers’ compensation, self-insurance and, for the enterprise funds, medical malpractice and third party payor liabilities, as required by GAAP. Deficits are expected to continue until such liabilities are retired through user charges or otherwise funded.
59

COUNTY OF LOS ANGELESNOTES TO THE BASIC FINANCIAL STATEMENTS-Continued
4. ELIMINATIONS
The Regional Park and Open Space District (RPOSD), a blended component unit, is authorized to issue assessment bonds to acquire and improve recreational land and facilities. These bonds are secured by voter-approved property tax assessments. The RPOSD executed a financing agreement with the Public Works Financing Authority, another blended component unit referred to in the basic financial statements as “Joint Powers Authorities” (JPAs). Under the terms of the agreement, the RPOSD sold $510,185,000 of bonds in 1997 that were acquired as an investment by the JPAs. The JPAs financed this investment from proceeds of a simultaneous issuance of an equivalent amount of bonds as a public offering. The structure of the publicly offered JPA bonds was designed to match the RPOSD’s bonds relative to principal and interest maturities and interest rates. This series of transactions was conducted to facilitate the issuance of RPOSD related bonds and to minimize the County’s overall interest cost. Pursuant to the financing agreement with the JPAs, the RPOSD has pledged all available tax assessments necessary to ensure the timely payment of principal and interest on the bonds issued by the JPAs. The 1997 bonds were partially refunded in 2004-2005 and the remaining 1997 bonds were fully refunded in 2007-2008. The transactions between the two component units have been accounted for as follows:
Fund Financial Statements
At June 30, 2009, the governmental fund financial statements reflect an investment asset (referred to as “Other Investments”) held by the JPAs of $246,875,000 that has been recorded in the Nonmajor Governmental Funds. The governmental fund financial statements do not reflect a liability for the related bonds payable ($246,875,000), as this obligation is not currently due. Accordingly, the value of the asset represents additional fund balance in the Nonmajor Governmental Funds.
In order to reflect the economic substance of the transaction described above, an eliminations column has been established in the governmental fund financial statements. The purpose of the column is to remove the duplication of assets, fund balances, revenues and expenditures that resulted from the consolidation of the two component units into the County’s overall financial reporting structure.
Government-wide Financial Statements
The government-wide financial statements are designed to minimize the duplicative effects of transactions between funds. Accordingly, the effects of the transaction described above have been eliminated from the amounts presented within governmental activities (as appropriate under the accrual basis of accounting). The specific items eliminated were other investments and bonds payable ($246,875,000) and investment earnings and interest expense ($12,822,000 for each). Accordingly, there are no reconciling differences between the two sets of financial statements (after the effects of eliminations) for this matter.
The bonds payable of $246,875,000, that were publicly issued, are included among the liabilities presented in the Government-wide Financial Statements. Disclosures related to those outstanding bonds appear in Note 10 and are captioned “Assessment Bonds.”
60

COUNTY OF LOS ANGELESNOTES TO THE BASIC FINANCIAL STATEMENTS-Continued
5. CASH AND INVESTMENTS
Investments in the County's cash and investment pool, other cash and investments, and Pension Trust Fund investments, are stated at fair value. Aggregate pooled cash and investments and other cash and investments are as follows at June 30, 2009 (in thousands):
Restricted Assets
Pooled Cash Other Pooled Cash Other and Investments Investments and Investments Investments Total
Governmental Funds $ 4,170,156 $ 258,385 $ $ $ 4,428,541 Proprietary Funds 278,265 38,511 32,891 48,029 397,696 Fiduciary Funds (excluding Pension Trust Fund) 14,493,021 269,358 14,762,379 Pension Trust Fund 114,155 32,169,200 32,283,355
Component Unit 874,241 874,241 Total $ 19,929,838 $32,735,454 $ 32,891 $ 48,029 $ 52,746,212
Deposits-Custodial Credit Risk
The custodial credit risk for deposits is the risk that the County will not be able to recover deposits that are in the possession of an outside party. Deposits are exposed to custodial credit risk if they are not insured or not collateralized.
At June 30, 2009, the carrying amount of the County's deposits was $106,709,000 and the balance per various financial institutions was $106,091,000. The County’s deposits are not exposed to custodial credit risk since all of its deposits are either covered by federal depository insurance or collateralized with securities held by the County or its agent in the County’s name, in accordance with California Government Code Section 53652.
At June 30, 2009, the carrying amount of Pension Trust Fund deposits was $32,076,000. Pension Trust Fund deposits are held in the Fund’s custodial bank and, therefore, are not exposed to custodial credit risk since its deposits are eligible for and covered by “pass through insurance” in accordance with applicable law and FDIC rules and regulations.
Investments
State statutes authorize the County to invest pooled funds in certain types of investments including obligations of the United States Treasury, federal, State and local agencies, commercial paper rated A -1 by Standard & Poor’s Corporation or P-1 by Moody’s Commercial Paper Record, medium-term corporate and deposit notes, negotiable certificates of deposit, floating rate notes, money market funds, guaranteed investment contracts, repurchase and reverse repurchase agreements, bankers’ acceptances, State and local area investment funds, and mortgage pass-through securities.
The investments are managed by the County Treasurer who reports on a monthly basis to the Board of Supervisors. In addition, Treasury investment activity is subject to an annual investment policy review, compliance oversight, quarterly financial reviews, and annual financial reporting.
61

COUNTY OF LOS ANGELESNOTES TO THE BASIC FINANCIAL STATEMENTS-Continued
5. CASH AND INVESTMENTS-Continued
Investments-Continued
Investments held by the County Treasurer are stated at fair value, except for certain non-negotiable securities that are reported at cost because they are not transferable and have terms that are not affected by changes in market interest rates. The fair value of pooled investments is determined annually and is based on current market prices. The method used to determine the value of participants' equity withdrawn is based on the book value, which is amortized cost, of the participants' percentage participation at the date of such withdrawals.
The Pension Trust Fund is managed by LACERA. Pension Trust Fund investments are authorized by State Statutes which are referred to as the “County Employees' Retirement Law of 1937.” Statutes authorize a "Prudent Expert" guideline as to form and types of investments which may be purchased. Examples of the Fund's investments are obligations of the various agencies of the federal government, corporate and private placement bonds, global bonds, domestic and global stocks, domestic and global convertible debentures and real estate. LACERA’s investment policy also allows the limited use of derivatives by certain investment managers. The classes of derivatives that are permitted are futures contracts, currency forward contracts, options, and swaps.
The interest rate risk, foreign currency risk, credit risk, concentration of credit risk, and custodial credit risk related to Pension Trust Fund investments are different than the corresponding risk on investments held by the County Treasurer. Detailed deposit and investment risk disclosures are included in Note G of LACERA’s Report on Audited Financial Statements for the year ended June 30, 2009.
The School Districts and the Superior Court are required by legal provisions to participate in the County's investment pool. Eighty percent (80%) of the Treasurer's external investment pool consists of these involuntary participants. Voluntary participants in the County's external investment pool include the Sanitation Districts, Metropolitan Transportation Authority, the South Coast Air Quality Management District and other special districts with independent governing boards. The deposits held for both involuntary and voluntary entities are included in the External Pooled Investment Trust Fund. Certain specific investments have been made by the County, as directed by external depositors. This investment activity occurs separately from the County's investment pool and is reported in the Specific Investment Trust Fund. The pool is not registered as an investment company with the Securities and Exchange Commission (SEC) nor is it an SEC Rule 2a7-like pool. California Government Code statutes and the County Board of Supervisors set forth the various investment policies that the County Treasurer must follow.
County pooled and other investments (excluding Pension Trust Fund other investments) at June 30, 2009 (in thousands) are as follows:
Fair Value
U.S. Government securities $ 8,922,471 Negotiable certificates of deposit 3,080,420 Commercial paper 7,218,659 Corporate and deposit notes 814,954
62

COUNTY OF LOS ANGELESNOTES TO THE BASIC FINANCIAL STATEMENTS-Continued
5. CASH AND INVESTMENTS-Continued
Investments-Continued Fair
Value Municipal bonds 5,315 Los Angeles County securities 40,000 Guaranteed investment contracts 135,300 Money market mutual funds 142,603 State and Local Agency Investment Funds 109,797 Mortgage trust deeds 784
Total $ 20,470,303
Pension Trust Fund investments are reported in the basic financial statements at fair value at June 30, 2009 (in thousands) and are as follows:
Fair Value Domestic and international equity $ 16,073,149 Fixed income 9,800,435 Real estate 3,057,774 Private equity 2,815,826 Commodities 389,940
Total $ 32,137,124
The Pension Trust Fund also had deposits with the Los Angeles County Treasury Pool at June 30, 2009 totaling $114,155,000. The Pension Trust Fund portfolio contained no concentration of investments in any one organization (other than those issued or guaranteed by the U.S. Government) that represents 5% or more of the total investment portfolio.
The County has not provided nor obtained any legally binding guarantees during the year ended June 30, 2009 to support the value of shares in the Treasurer's investment pool.
Fair value fluctuates with interest rates, and increasing rates could cause fair value to decline below original cost. County management believes the liquidity in the portfolio is more than adequate to meet cash flow requirements and to preclude the County from having to sell investments below original cost for that purpose.
A summary of deposits and investments held by the Treasurer’s Pool is as follows (in thousands):
Weighted Average Interest Rate % Maturity Fair Value Principal Range Maturity Range (Years) U. S. Government securities $ 8,720,913 $ 8,644,805 1.85% - 7.20% 9/15/09 – 5/19/14 2.92 Negotiable certificates of deposit 3,080,420 3,080,126 0.20% - 2.55% 7/1/09 – 3/9/10 0.08 Commercial paper 7,218,659 7,218,783 0.18% - 0.82% 7/1/09 - 8/28/09 0.05 Corporate and deposit notes 812,481 801,257 0.62% - 7.38% 7/6/09 – 3/3/12 1.01 Los Angeles County securities 40,000 40,000 0.51% - 0.88% 6/30/10 – 6/30/11 1.63 Deposits 90,256 90,256 $ 19,962,729 $ 19,875,227 1.36
63
COUNTY OF LOS ANGELESNOTES TO THE BASIC FINANCIAL STATEMENTS-Continued
5. CASH AND INVESTMENTS-Continued
Investments-Continued
A summary of other (non-pooled) deposits and investments, excluding the Pension Trust Fund, is as follows (in thousands):
Weighted Average Interest Rate % Maturity Fair Value Principal Range Maturity Range (Years)
Local Agency Investment Fund $ 109,797 $ 109,706 07/01/09-06/15/12 0.64 Corporate and deposit notes 2,473 2,540 1.48% - 5.33% 08/03/09-02/01/11 1.46 Mortgage trust deeds 784 784 4.50% - 5.50% 08/01/12-04/01/17 5.28 Municipal bonds 5,315 5,315 5.00% 09/02/21 12.18 Guaranteed investment contracts 135,300 135,300 4.87% 03/15/10 0.71 U.S. agency securities 180,853 179,360 3.38% - 5.59% 09/18/09-06/25/14 2.90 U.S. treasury bonds 107 86 7.25% 05/15/16 6.88 U.S. treasury notes 20,296 20,027 3.38% - 4.88% 10/15/09-07/31/11 0.30 U.S. treasury bills 302 302 0.35% 12/10/09 0.45
Money market mutual funds 142,603 142,603 0.01% - 0.26% 07/01/09-07/31/10 0.20 Deposits 16,453 16,453
$ 614,283 $ 612,476 1.09
Interest Rate Risk
Interest rate risk is the risk that changes in interest rates will adversely affect the fair value of an investment. The government code limits most investment maturities to five years, with the exception of commercial paper and bankers’ acceptances which are limited to 270 days and 180 days, respectively. The County Treasurer manages equity and mitigates exposure to declines in fair value by generally investing in short-term investments with maturities of six months or less and by holding all investments to maturity. The County’s investment guidelines limit the weighted average maturity of its portfolios to a target of less than 1.5 years. Of the Pooled Cash and Investments and Other Investments at June 30, 2009, 53.97% have a maturity of six months or less, 2.23% have a maturity of between six and twelve months and 43.80% have a maturity of more than one year.
As of June 30, 2009, variable-rate notes comprised 3.56% of the Treasury Pool and Other Investment portfolios. The notes are tied to one-month and three-month London Interbank Offered Rate (LIBOR) with monthly and quarterly coupon resets. The fair value of variable-rate coupon resets back to the market rate on a periodic basis. Effectively, at each reset date, a variable-rate investment reprices back to par value, eliminating interest rate risk at each periodic reset.
Custodial Credit Risk
Custodial credit risk for investments is the risk that the County will not be able to recover the value of investment securities that are in the possession of an outside party. All securities owned by the County are deposited in trust for safekeeping with a custodial bank different from the County’s primary bank, except for Bond Anticipation Notes, certain long-term debt proceeds issued by Los Angeles County entities, investment in the State’s Local Agency Investment Fund, and mortgage trust deeds which are held in the County Treasurer’s vault. Securities are not held in broker accounts. At June 30, 2009, the County’s external investment pools and specific investments did not have any securities exposed to custodial credit risk and there was no securities lending.
64

COUNTY OF LOS ANGELESNOTES TO THE BASIC FINANCIAL STATEMENTS-Continued
5. CASH AND INVESTMENTS-Continued
Credit Risk and Concentration of Credit Risk
Credit risk is the risk that an issuer or other counterparty to an investment will not fulfill its obligations. Concentration of credit risk is the risk of loss attributed to the magnitude of an investment in a single issuer. The County Treasurer mitigates these risks by holding a diversified portfolio of high quality investments.
The County’s investment policy establishes minimum acceptable credit ratings for investments from any two Nationally Recognized Statistical Rating Organizations (NRSROs). For an issuer of short-term debt, the rating must be no less than A-1 (S&P) or P-1 (Moody’s) while an issuer of long-term debt shall be rated no less than an “A.” All investments purchased in the fiscal year met the credit rating criteria in the Investment Policy, at the issuer level. While the NRSROs rated the issuer of the investments purchased, it did not in all instances rate the investment itself (e.g. commercial paper, corporate and deposit notes, and negotiable certificates of deposit). For purposes of reporting credit quality distribution of investments in the following table, some investments are reported as not rated. At June 30, 2009, a portion of the County’s other investments was invested in the State of California’s Local Agency Investment Fund which is unrated as to credit quality.
The County’s Investment Policy, approved annually by the Board of Supervisors, limits the maximum total par value for each permissible security type (e.g., commercial paper and certificates of deposit) to a certain percentage of the investment pool. Exceptions to this are obligations of the United States government and United States government agencies or government-sponsored enterprises, which do not have limits. Further, the County restricts investments in any one issuer based on the issuer’s Nationally Recognized Statistical Rating Organization (NRSRO) ratings. For bankers acceptances, certificates of deposit, corporate notes and floating rate notes, the highest issuer limit was $500 million, approximately 2.54% of the investment pool’s daily investment balance. For commercial paper, the highest issuer limit was $750 million, or 3.82% of the investment pool’s daily investment balance.
The Pool and SPI had the following U.S. Agency securities in a single issuer that represent 5 percent or more of total investments at June 30, 2009 (in thousands):
Issuer Pool SPI
Federal Farm Credit Bank $ 2,121,656 $ 36,186 Federal Home Loan Bank 2,951,637 66,978 Federal Home Loan Mortgage Corp 3,601,532 25,699
Non-Pooled Investments had a total of $135,300,000 invested in guaranteed investment contracts (GIC) with FSA Capital Management Services.
65

COUNTY OF LOS ANGELESNOTES TO THE BASIC FINANCIAL STATEMENTS-Continued
5. CASH AND INVESTMENTS-Continued
Credit Risk and Concentration of Credit Risk-Continued
The following is a summary of the credit quality distribution and concentration of credit risk by investment type as a percentage of each portfolio’s fair value at June 30, 2009:
S & P Moody’s % of Portfolio Pooled Cash and Investments:
Commercial paper Not Rated Not Rated 36.32% Corporate and deposit notes A A2 0.25% A A3 0.25% A+ Aa2 0.04% A+ Aa3 0.88% AA Aa1 1.14% AA- A1 0.10% AA+ Aa2 1.04% Not Rated Aa2 0.13% Not Rated Aa3 0.25% Not Rated Not Rated 0.01% Los Angeles County securities AA- Aa2 0.20% Negotiable certificates of deposit Not Rated Not Rated 15.15% Not Rated Aa1 0.35% U.S. Government securities AAA Aaa 43.65% Not Rated Not Rated 0.24%
100.00%Other Investments: Local Agency Investment Fund Not Rated Not Rated 18.37% Corporate and deposit notes AA Aa1 0.04% AA+ Aa2 0.38% Mortgage trust deeds AA- Aa3 0.13% Municipal bonds AA Aa3 0.89% Guaranteed investment contracts Not Rated Not Rated 22.63% U.S. agency securities AAA Aaa 7.35% AAA/Stable Not Rated 8.37% Not Rated Not Rated 14.53% U.S. treasury notes AAA Aaa 3.39% U.S. treasury bonds AAA Aaa 0.02% U.S. treasury bills AAA Aaa 0.05% Money market mutual funds Not Rated Not Rated 23.85% 100.00%
The earned yield, which includes net gains on investments sold, on all investments held by the Treasurer’s Pool for the fiscal year ended June 30, 2009 was 2.57%.
66

COUNTY OF LOS ANGELESNOTES TO THE BASIC FINANCIAL STATEMENTS-Continued
5. CASH AND INVESTMENTS-Continued
Credit Risk and Concentration of Credit Risk-Continued
A separate financial report is issued for the Treasurer’s Pool. The most current report, as of June 30, 2008, is available on the Treasurer’s website, and the report as of June 30, 2009, is in progress. The following represents a condensed statement of net assets and changes in net assets for the Treasurer's Pool as of June 30, 2009 (in thousands):
Statement of Net Assets Net assets held in trust for all pool participants $ 19,962,729
Equity of internal pool participants $ 6,556,452 Equity of external pool participants 13,406,277 Total equity $ 19,962,729
Statement of Changes in Net Assets Net assets at July 1, 2008 $ 20,341,707 Net change in investments by pool participants (378,978) Net assets at June 30, 2009 $ 19,962,729
The unrealized gain on investments held in the Treasurer’s Pool was $91,302,000 as of June 30, 2009. This amount takes into account all changes in fair value (including purchases, sales and redemptions) that occurred during the year.
Reverse Repurchase Agreements
The California Government Code permits the County Treasurer to enter into reverse repurchase agreements, that is, a sale of securities with a simultaneous agreement to repurchase them in the future at the same price plus a contract rate of interest. The fair value of the securities underlying reverse repurchase agreements normally exceeds the cash received, providing the broker-dealer a margin against a decline in the fair value of the securities. If the broker-dealer defaults on the obligation to resell these securities to the County or provide securities or cash of equal value, the County would suffer an economic loss equal to the difference between the fair value plus accrued interest of the underlying securities and the agreement obligation, including accrued interest.
The County's investment guidelines limit the maximum par value of reverse repurchase agreements to $500,000,000 and proceeds from reverse repurchase agreements may only be reinvested in instruments with maturities at or before the maturity of the reverse repurchase agreement. During the fiscal year, the County did not enter into any reverse repurchase agreements.
Derivatives
The California Government Code permits the County Treasurer to purchase floating rate notes, that is, any instruments that have a coupon interest rate that is adjusted periodically due to changes in a base or benchmark rate. The County's investment guidelines limit the amount of floating rate notes to 10% of the Los Angeles County Treasury Pool portfolio and prohibit the purchase of inverse floating rate notes and hybrid or complex structured investments. As of June 30, 2009, there were approximately $700,000,000 in floating rate notes.
LACERA utilizes forward currency contracts to control currency exposure and facilitate the settlement of international security purchase and sale transactions. Included in net investment income are gains and losses from foreign currency transactions. At June 30, 2009, forward currency contracts receivable and payable totaled $96,571,000 and $97,991,000, respectively.
67

COUNTY OF LOS ANGELESNOTES TO THE BASIC FINANCIAL STATEMENTS-Continued
5. CASH AND INVESTMENTS-Continued
Securities Lending Transactions
LACERA, as the administering agency for the Pension Trust Fund, is authorized to participate in a securities lending program under policies adopted by the LACERA Board of Investments. This program is an investment management activity that mirrors the fundamentals of a loan transaction in which a security is used as collateral. Securities are lent to brokers and dealers (borrowers) and LACERA receives cash as collateral. LACERA pays the borrower interest on the collateral received and invests the collateral with the goal of earning a higher yield than the interest rate paid to the borrower.
LACERA’s program is managed by one principal borrower and two agent lenders. Under exclusive borrowing and lending arrangements, securities on loan must be collateralized with a fair value of 102% for U.S. securities, and 105% for international securities, of the borrowed securities. Collateral is marked to market daily. Cash collateral is invested by the agent lenders in short-term, liquid instruments.
Under the terms of the lending agreements, the two agent lenders have agreed to hold LACERA harmless for borrower default from the loss of securities or income, or from any litigation arising from these loans. The principal borrower’s agreement entitles LACERA to terminate all loans upon the occurrence of default and purchase a like amount of “replacement securities.” Either LACERA or the borrower can terminate all loans on securities on demand.
At year end, LACERA had no credit risk exposure to borrowers because the collateral exceeded the amount borrowed. As of June 30, 2009, there were no violations of legal or contractual provisions. LACERA had no losses on securities lending transactions resulting from the default of a borrower for the year ended June 30, 2009. Securities on loan at year-end, which include stocks and government and corporate bonds, are maintained in LACERA’s financial records. A corresponding liability is recorded for the fair value of the invested cash collateral received.
As of June 30, 2009, the fair value of securities on loan was $1.17 billion. The value of the cash collateral received for those securities was $1.22 billion and there was no non-cash collateral. Securities lending assets (Other Investments) and liabilities (Other Payables) of $1.27 billion are recorded in the Pension Trust Fund. Pension Trust Fund income, net of expenses, from securities lending was $16.2 million for the year ended June 30, 2009.
For the year ended June 30, 2009, the Los Angeles County Treasury Pool did not enter into any securities lending transactions.
Summary of Deposits and Investments
Following is a summary of the carrying amount of deposits and investments at June 30, 2009 (in thousands):
Pension County Trust Fund Total
Deposits $ 106,709 $ 32,076 $ 138,785 Investments 20,470,303 32,137,124 52,607,427 $ 20,577,012 $ 32,169,200 $ 52,746,212
68

COUNTY OF LOS ANGELESNOTES TO THE BASIC FINANCIAL STATEMENTS-Continued
6. CAPITAL ASSETS
Capital assets activity of the primary government for the year ended June 30, 2009 is as follows (in thousands):
Balance Balance July 1, 2008 Additions Deletions June 30, 2009 Governmental Activities Capital assets, not depreciated: Land $ 2,350,698 17,258 (199) $ 2,367,757 Easements 4,664,562 114,732 (2) 4,779,292 Construction in progress-buildings and improvements 255,267 84,461 (178,383) 161,345 Construction in progress-infrastructure 323,841 130,330 (93,460) 360,711 Subtotal 7,594,368 346,781 (272,044) 7,669,105
Capital assets, depreciated: Buildings and improvements 4,045,330 189,462 (2,677) 4,232,115 Equipment 1,092,873 123,011 (40,341) 1,175,543 Infrastructure 7,052,454 119,989 (75) 7,172,368 Subtotal 12,190,657 432,462 (43,093) 12,580,026
Less accumulated depreciation for: Buildings and improvements (1,384,461) (74,791) 1,091 (1,458,161) Equipment (744,121) (108,894) 48,352 (804,663) Infrastructure (2,581,878) (151,854) 26 (2,733,706) Subtotal (4,710,460) (335,539) 49,469 (4,996,530)
Total capital assets, being depreciated, net 7,480,197 96,923 6,376 7,583,496
Governmental activities capital assets, net $15,074,565 443,704 (265,668) $ 15,252,601
Business-type Activities Capital assets, not depreciated: Land $ 216,273 $ 216,273 Easements 30,535 166 30,701 Construction in progress-buildings and improvements 958,635 83,692 (966,783) 75,544
Construction in progress-infrastructure 30,840 20,868 (15,574) 36,134 Subtotal 1,236,283 104,726 (982,357) 358,652
Capital assets, being depreciated: Buildings and improvements 1,070,651 916,461 1,987,112 Equipment 273,934 47,981 (11,210) 310,705 Infrastructure 1,134,743 15,111 1,149,854 Subtotal 2,479,328 979,553 (11,210) 3,447,671
Less accumulated depreciation for: Buildings and improvements (672,155) (23,121) ( 695,276) Equipment (184,916) (18,071) 3,297 (199,690) Infrastructure (407,755) (21,220) (428,975) Subtotal (1,264,826) (62,412) 3,297 (1,323,941)
Total capital assets, being depreciated, net 1,214,502 917,141 (7,913) 2,123,730
Business-type activities capital assets, net $ 2,450,785 1,021,867 (990,270) $ 2,482,382
Total Capital Assets, net $17,525,350 $1,465,571 $ (1,255,938) $ 17,734,983
69

COUNTY OF LOS ANGELESNOTES TO THE BASIC FINANCIAL STATEMENTS-Continued
6. CAPITAL ASSETS-Continued
Depreciation Expense
Depreciation expense was charged to functions/programs of the primary government as follows (in thousands):
Governmental activities: General government $ 16,229 Public protection 160,570 Public ways and facilities 86,227 Health and sanitation 17,106 Public assistance 9,990 Education 1,782 Recreation and cultural services 19,919 Capital assets held by the County’s internal service funds are charged to the various functions based on their usage of the assets 23,716 Total depreciation expense, governmental activities $ 335,539
Business-type activities: Hospitals $ 30,751 Aviation 1,651 Waterworks 22,305 Community Development Commission 1,159 Capital assets held by the County’s internal service funds are charged to the various functions based on their usage of the assets 6,546 Total depreciation expense, business-type activities $ 62,412
Discretely Presented Component Unit
Capital assets activity for the First 5 LA component unit for the year ended June 30, 2009 was as follows (in thousands):
Balance Balance July 1, 2008 Additions Deletions June 30, 2009
Capital assets, not depreciated- Land $ 2,039 $ $ $ 2,039 Capital assets, depreciated: Buildings and improvements 17,290 (5,368) 11,922 Equipment 1,669 602 (144) 2,127 Subtotal 18,959 602 (5,512) 14,049
Less accumulated depreciation for: Buildings and improvements (6,115) (240) 5,368 (987) Equipment (1,035) (337) 144 (1,228)
Subtotal (7,150) (577) 5,512 (2,215)
Total capital assets being depreciated, net 11,809 25 11,834
Component unit capital assets, net $ 13,848 $ 25 $ $ 13,873
70

COUNTY OF LOS ANGELESNOTES TO THE BASIC FINANCIAL STATEMENTS-Continued
7. PENSION PLAN
Plan Description
The County pension plan is administered by the Los Angeles County Employees Retirement Association (LACERA) which was established under the County Employees’ Retirement Law of 1937. It provides benefits to employees of the County and the following additional entities that are not part of the County's reporting entity:
Little Lake Cemetery District Local Agency Formation Commission Los Angeles County Office of Education South Coast Air Quality Management District
New employees of the latter two agencies are not eligible for LACERA benefits.
LACERA is technically a cost sharing, multi-employer defined benefit plan. However, because the non-County entities are immaterial to its operations the disclosures herein are made as if LACERA was a single employer defined benefit plan. LACERA provides retirement, disability, death benefits and cost of living adjustments to eligible members. Benefits are authorized in accordance with the California Constitution, the County Employees’ Retirement Law, the bylaws, procedures and policies adopted by LACERA's Boards of Retirement and Investments and Board of Supervisors’ resolutions.
LACERA issues a stand-alone financial report which is available at its offices located at Gateway Plaza, 300 N. Lake Avenue, Pasadena, California 91101-4199.
Funding Policy
LACERA has seven benefit tiers known as A, B, C, D and E, and Safety A and B. All tiers except E are employee contributory. Tier E is employee non-contributory. New general employees are eligible for tiers D or E at their discretion. New safety members are eligible for only Safety B. Rates for the tiers are established in accordance with State law by LACERA's Boards of Retirement and Investments and the County Board of Supervisors.
The following employer rates were in effect for 2008-2009:
A B C D E General Members 17.64% 10.79% 10.22% 10.79% 10.67% Safety Members 28.16% 20.54%
The rates were determined by the actuarial valuation performed as of June 30, 2007 and are the same as those used to calculate the annual required contribution (ARC).
Employee rates vary by the option and employee entry age from 5% to 15% of their annual covered salary.
During 2008-2009, the County contributed the full amount of the ARC.
71

COUNTY OF LOS ANGELESNOTES TO THE BASIC FINANCIAL STATEMENTS-Continued
7. PENSION PLAN-Countinued
Annual Pension Cost and Net Pension Obligation
The County's annual pension cost and net pension obligation for 2008-2009, computed in accordance with GASB 27, were as follows (in thousands):
Annual required contribution (ARC): County $ 847,055 Non County entities 116 Total ARC 847,171 Interest on net pension obligation (asset) (5,686) Adjustment to ARC 48,908 Annual pension cost 890,393 Contributions made: County 847,055 Non County entities 116 Total contributions 847,171 Cost in excess of contributions 43,222 Net pension obligation (asset), July 1, 2008 (146,723) Net pension obligation (asset), June 30, 2009 $ (103,501)
Trend Information (in thousands) Fiscal Year Annual Pension Percentage of APC Net Pension Ended Cost (APC) Contributed Obligation (Asset)
June 30, 2007 $ 842,896 89.2% $ (176,440) June 30, 2008 858,347 96.5% (146,723) June 30, 2009 890,393 95.1% (103,501)
Funded Status and Funding Progress
As of June 30, 2008, the most recent actuarial valuation date, the funded ratio was determined to be 94.5%. The actuarial value of assets was $39.7 billion, and the actuarial accrued liability (AAL) was $42.0 billion, resulting in an unfunded AAL of $2.3 billion. The covered payroll was $6.1 billion and the ratio of the unfunded AAL to the covered payroll was 37.8%.
The schedule of funding progress, presented as Required Supplementary Information (RSI) following the notes to the financial statements, presents multiyear trend information about whether the actuarial value of plan assets is increasing or decreasing over time relative to the actuarial accrued liability for benefits.
Actuarial Methods and Assumptions
The annual required contribution was calculated using the entry age normal method. The most recent actuarial valuation also assumed an annual investment rate of return of 7.75%, and projected salary increases ranging from 4.26% to 10.24%, with both assumptions including a 3.5% inflation factor. Additionally, the valuation assumed post-retirement benefit increases of between 2% and 3%, in accordance with the provisions of the specific benefit options. The actuarial value of assets was determined utilizing a three-year smoothed method based on the difference between the expected market value and the actual market value of assets as of the valuation date.
72
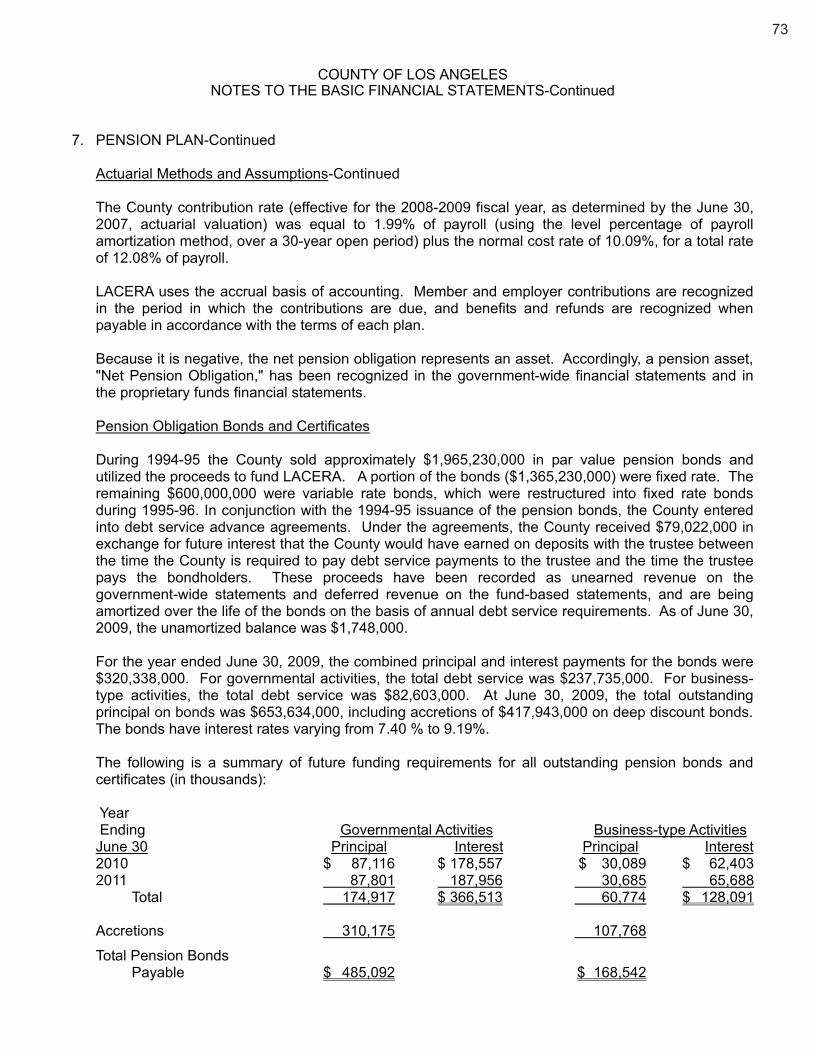
COUNTY OF LOS ANGELESNOTES TO THE BASIC FINANCIAL STATEMENTS-Continued
7. PENSION PLAN-Continued
Actuarial Methods and Assumptions-Continued
The County contribution rate (effective for the 2008-2009 fiscal year, as determined by the June 30, 2007, actuarial valuation) was equal to 1.99% of payroll (using the level percentage of payroll amortization method, over a 30-year open period) plus the normal cost rate of 10.09%, for a total rate of 12.08% of payroll.
LACERA uses the accrual basis of accounting. Member and employer contributions are recognized in the period in which the contributions are due, and benefits and refunds are recognized when payable in accordance with the terms of each plan.
Because it is negative, the net pension obligation represents an asset. Accordingly, a pension asset, "Net Pension Obligation," has been recognized in the government-wide financial statements and in the proprietary funds financial statements.
Pension Obligation Bonds and Certificates
During 1994-95 the County sold approximately $1,965,230,000 in par value pension bonds and utilized the proceeds to fund LACERA. A portion of the bonds ($1,365,230,000) were fixed rate. The remaining $600,000,000 were variable rate bonds, which were restructured into fixed rate bonds during 1995-96. In conjunction with the 1994-95 issuance of the pension bonds, the County entered into debt service advance agreements. Under the agreements, the County received $79,022,000 in exchange for future interest that the County would have earned on deposits with the trustee between the time the County is required to pay debt service payments to the trustee and the time the trustee pays the bondholders. These proceeds have been recorded as unearned revenue on the government-wide statements and deferred revenue on the fund-based statements, and are being amortized over the life of the bonds on the basis of annual debt service requirements. As of June 30, 2009, the unamortized balance was $1,748,000.
For the year ended June 30, 2009, the combined principal and interest payments for the bonds were $320,338,000. For governmental activities, the total debt service was $237,735,000. For business-type activities, the total debt service was $82,603,000. At June 30, 2009, the total outstanding principal on bonds was $653,634,000, including accretions of $417,943,000 on deep discount bonds. The bonds have interest rates varying from 7.40 % to 9.19%.
The following is a summary of future funding requirements for all outstanding pension bonds and certificates (in thousands):
Year Ending Governmental Activities Business-type Activities June 30 Principal Interest Principal Interest 2010 $ 87,116 $ 178,557 $ 30,089 $ 62,403 2011 87,801 187,956 30,685 65,688 Total 174,917 $ 366,513 60,774 $ 128,091
Accretions 310,175 107,768
Total Pension Bonds Payable $ 485,092 $ 168,542
73
COUNTY OF LOS ANGELESNOTES TO THE BASIC FINANCIAL STATEMENTS-Continued
8. OTHER POSTEMPLOYMENT BENEFITS
Plan Description
LACERA administers a cost sharing, multi-employer defined benefit Other Postemployment Benefit (OPEB) plan on behalf of the County. As indicated in Note 7-Pension Plan, because the non-County entities are immaterial to its operations, the disclosures herein are made as if LACERA was a single employer defined benefit plan.
In April 1982, the County of Los Angeles adopted an ordinance pursuant to Government Code Section 31691 which provided for a health insurance program and death benefits for retired employees and their dependents. In 1994, the County amended the agreements to continue to support LACERA’s retiree insurance benefits program regardless of the status of active member insurance.
LACERA issues a stand-alone financial report that includes the required information for the OPEB plan. The report is available at its offices located at Gateway Plaza, 300 North Lake Avenue, Pasadena, California 91101-4199.
Funding Policy
In 1996-1997, the County entered into an agreement with LACERA to establish an Internal Revenue Code Section 401(h) Account to use in connection with the County’s payment of retiree health care costs. Section 401(h) permits the establishment of a separate account (a “401(h) Account”) to fund retiree healthcare benefits, and limits contributions to the 401(h) Account to 25% of aggregate contributions to LACERA. This agreement also permits the use of LACERA excess earnings reserves to reduce the County’s funding requirements for these benefits.
Health care benefits earned by County employees are dependent on the number of completed years of retirement service credited to the retiree by LACERA upon retirement; it does not include reciprocal service in another retirement system. The benefits earned by County employees range from 40% of the benchmark plan cost with ten completed years of service to 100% of the benchmark plan cost with 25 or more completed years of service. In general, each completed year of service after ten years reduces the member's cost by 4%. Service includes all service on which the member's retirement allowance was based.
Health care benefits include medical, dental, vision, Medicare Part B reimbursement and death benefits. In addition to these retiree health care benefits, the County provides long-term disability benefits to employees, and these benefits have been determined to fall within the definition of OPEB, per GASB 45. These long-term disability benefits provide for income replacement if an employee is unable to work because of illness or injury. Specific coverage depends on the employee’s employment classification, chosen plan and, in some instances years of service.
A trust fund has not been established for the retiree health benefits or the long-term disability benefits. The County’s contribution is on a pay-as-you-go basis. During the 2008-2009 fiscal year, the County made payments to LACERA totaling $365 million for retiree health care benefits. Included in this amount was, $31.6 million for Medicare Part B reimbursements and $7 million in death benefits. Additionally, $35.6 million was paid by member participants. The County also made payments of $32 million for long-term disability benefits.
74

COUNTY OF LOS ANGELESNOTES TO THE BASIC FINANCIAL STATEMENTS-Continued
8. OTHER POSTEMPLOYMENT BENEFITS-Continued
Annual OPEB Cost and Net OPEB Obligation (including Long-Term Disability)
The County’s Annual OPEB cost (expense) is calculated based on the annual required contribution (ARC), an amount actuarially determined in accordance with the parameters of GASB 45. The OPEB cost and OPEB obligation were determined by the OPEB health care actuarial valuation as of July 1, 2006, and the OPEB long-term disability actuarial valuation as of July 1, 2007. The following table shows the ARC, the amount actually contributed and the net OPEB Obligation (in thousands):
Annual OPEB required contribution (ARC) $ 1,615,272
Interest on Net OPEB obligation 61,707
Adjustment to ARC ____ (48,485)
Annual OPEB cost (expense) 1,628,494
Less: Contributions made (pay-as-you-go) 397,259
Increase in Net OPEB Obligation 1,231,235
Net OPEB obligation, July 1, 2008 1,234,148
Net OPEB obligation, June 30, 2009 $ 2,465,383
Trend Information (in thousands) Fiscal Year Annual OPEB Percentage of OPEB Net OPEB Ended Cost Cost Contributed Obligation
June 30, 2008 $ 1,615,272 23.6% $ 1,234,148 June 30, 2009 1,628,494 24.4% 2,465,383
Funded Status and Funding Progress
As of July 1, 2008, the most recent actuarial valuation date for OPEB health care benefits, the funded ratio was 0%. The actuarial value of assets was zero. The actuarial accrued liability (AAL) was $20.9 billion, resulting in an unfunded AAL of $20.9 billion. The covered payroll was $6.1 billion and the ratio of the unfunded AAL to the covered payroll was 341.31%.
As of July 1, 2009, the most recent actuarial valuation date for OPEB long-term disability benefits, the funded ratio was 0%. The actuarial value of assets was zero. The actuarial accrued liability (AAL) was $951.8 million, resulting in an unfunded AAL of $951.8 million. The covered payroll was $6.1 billion and the ratio of the unfunded AAL to the covered payroll was 15.54%.
The schedules of funding progress are presented as RSI following the notes to the financial statements. These RSI schedules present multi-year trend information. However, there is no data available prior to the two years presented.
75

COUNTY OF LOS ANGELESNOTES TO THE BASIC FINANCIAL STATEMENTS-Continued
8. OTHER POSTEMPLOYMENT BENEFITS-Continued
Actuarial Methods and Assumptions
Actuarial valuations involve estimates of the value of reported amounts and assumptions about the probability of events far into the future. Actuarially determined amounts are subject to continued revision as actual results are compared to past expectations and new estimates are made about the future.
Actuarial calculations are based on the benefits provided under the terms of the substantive plan in effect at the time of each valuation and on the pattern of sharing of costs between the employer and plan members to that point.
The projection of benefits for financial reporting purposes does not explicitly incorporate the potential effects of legal or contractual funding limitations on the pattern of cost sharing between the employer and plan members in the future.
Actuarial calculations reflect a long-term perspective. Actuarial methods and assumptions used include techniques designed to reduce short-term volatility in actuarial accrued liabilities and the actuarial value of assets.
While the actuarial valuations for OPEB health care and OPEB long-term disability benefits were prepared by two different firms, they both used the same methods and assumptions, with one exception noted below. The projected unit credit cost method was used. Both valuations assumed an annual investment rate of return of 5%, an inflation rate of 3.5% per annum and projected general wage increases of 4%. The increases in salary due to promotions and longevity do not affect the amount of the OPEB program benefits. An actuarial asset valuation was not performed. Finally, the OPEB valuation report used the level percentage of projected payroll over a rolling (open) 30-year amortization period. The OPEB Long Term Disability valuation report used the level dollar of projected payroll over a rolling (open) 30-year amortization period. The most recent actuarial valuations for OPEB health care benefits (July 1, 2008) and OPEB long-term disability benefits (July 1, 2009) were each adjusted to reflect projected salary increases of 4%, from the former actuarial assumption of 3.75%.
The healthcare cost trend initial and ultimate rates, based on the June 30, 2006 actuarial valuation, are as follows: Initial Year Ultimate
LACERA Medical Under 65 6.50% 5.00% LACERA Medical Over 65 15.00% 5.25% Firefighters Local 1014 (all) 11.50% 5.00% Part B Premiums 11.50% 5.00% Dental (all) 7.20% 3.00%
76

COUNTY OF LOS ANGELESNOTES TO THE BASIC FINANCIAL STATEMENTS-Continued
9. LEASES
Operating Leases
The following is a schedule of future minimum rental payments required under operating leases entered into by the County that have initial or remaining noncancelable lease terms in excess of one year as of June 30, 2009 (in thousands):
Governmental Year Ending June 30 Activities
2010 $ 74,095 2011 58,913 2012 45,404 2013 36,994 2014 23,674 2015-2019 44,607 2020-2024 4,786
Total $ 288,473
Rent expenditures related to operating leases were $92,131,000 for the year ended June 30, 2009.
Capital Leases
The following is a schedule of future minimum lease payments under capital leases together with the present value of future minimum lease payments as of June 30, 2009 (in thousands):
Governmental Business-type Year Ending June 30 Activities Activities
2010 $ 28,567 $ 147 2011 22,438 2012 19,035 2013 18,757 2014 17,745 2015-2019 72,654 2020-2024 71,515 2025-2029 71,765 2030-2034 56,162 2035-2039 26,060
Total $ 404,698 $ 147 Less: Amount representing interest 246,904 4 Present value of future minimum lease payments $ 157,794 $ 143
77

COUNTY OF LOS ANGELESNOTES TO THE BASIC FINANCIAL STATEMENTS-Continued
9. LEASES-Continued
Capital Leases-Continued
The following is a schedule of property under capital leases by major classes at June 30, 2009 (in thousands):
Governmental Business-type Activities Activities
Land $ 17,279 $ Buildings and improvements 152,893 1,200 Equipment 61,795 393 Accumulated depreciation (66,460) (988) Total $ 165,507 $ 605
Future rent revenues to be received from noncancelable subleases are $1,298,000 as of June 30, 2009.
Leases of County-Owned Property
The County has entered into operating leases relative to the Marina del Rey Project area, various County golf courses and regional parks, and Asset Development Projects. Substantially all of the Marina's land and harbor facilities are leased to others under agreements classified as operating leases. Certain golf courses and regional parks are leased under agreements which provide for activities such as golf course management and clubhouse operations, food and beverage concessions, and recreational vehicle camping. The Asset Development Projects are ground leases and development agreements entered into by the County for private sector development of commercial, industrial, residential, and cultural uses on vacant or underutilized County owned property. The Asset Development leases cover remaining periods ranging generally from 1 to 88 years and are accounted for in the General Fund. The lease terms for the golf courses and regional parks cover remaining periods ranging from 1 to 26 years and are also accounted for in the General Fund. The Marina del Rey leases cover remaining periods ranging from 1 to 58 years and are accounted for in the General Fund.
The land carrying value of the Asset Development Project ground leases and the Marina del Rey Project area leases is $504,770,000. The carrying value of the capital assets associated with the golf course and regional park operating leases is not determinable.
The following is a schedule of future minimum rental receipts on noncancelable leases as of June 30, 2009 (in thousands):
Governmental Year Ending June 30 Activities
2010 $ 40,938 2011 41,036 2012 40,511 2013 37,926 2014 36,162 Thereafter 1,318,516 Total $ 1,515,089
78

COUNTY OF LOS ANGELESNOTES TO THE BASIC FINANCIAL STATEMENTS-Continued
9. LEASES-Continued
Leases of County-Owned Property- Continued
The following is a schedule of rental income for these operating leases for the year ended June 30, 2009 (in thousands):
Governmental Activities
Minimum rentals $ 40,010 Contingent rentals 22,156 Total $ 62,166
The minimum rental income is a fixed amount based on the lease agreements. The contingent rental income is a percentage of revenue above a certain base for the Asset Development leases or a calculated percentage of the gross revenue less the minimum rent payment for the other leases.
10. LONG-TERM OBLIGATIONS
Long-term obligations of the County consist of bonds, notes and loans payable, pension bonds payable (see Note 7), OPEB (see Note 8), capital lease obligations (see Note 9) and other liabilities which are payable from the General, Special Revenue, Debt Service, Enterprise and Internal Service Funds.
A summary of bonds, notes and loans payable recorded within governmental activities follows (in thousands):
Original Par Balance Amount of Debt June 30, 2009 Los Angeles County Flood Control District Refunding Bonds 2.5% to 5.0% $ 143,195 $ 67,295 Los Angeles County Flood Control District Revenue Bonds 4.0% to 4.12% 20,540 17,410 Regional Park and Open Space District Bonds (issued by Public Works Financing Authority), 3.0% to 5.25% 275,535 264,399 Community Development Commission (CDC) Notes Payable, 2.31% to 7.91% 69,295 43,733 NPC Bond Anticipation Notes, 0.510% to 0.879% 29,600 29,600
NPC Bonds 3.0% to 4.0% 39,986 11,518 Marina del Rey Loans Payable, 4.5% to 4.7% 23,500 20,092 Public Buildings Certificates of Participation, 2.8% to 7.75% 944,106 695,923
Los Angeles County Securitization Corporation Tobacco Settlement Asset-Backed Bonds 5.25% to 6.65% 319,827 384,142 Total $ 1,865,584 $ 1,534,112
79

COUNTY OF LOS ANGELESNOTES TO THE BASIC FINANCIAL STATEMENTS-Continued
10. LONG-TERM OBLIGATIONS-Continued
A summary of bonds and notes payable recorded within business-type activities follows (in thousands):
Original Par Balance Amount of Debt June 30, 2009
NPC Bond Anticipation Notes, 0.510% to 0.879% $ 10,400 $ 10,400 NPC Bonds 3.0% to 4.0% 14,049 4,047 Public Buildings Certificates of Participation, 2.8% to 7.0% 140,064 98,217 Commercial Paper, 0.20% to 0.75% 205,500 205,500 Waterworks District Bonds, 3.3% to 8.0% 280 86 Community Development Commission Mortgage Notes, 0.00% to 7.3% 11,401 3,680 Total $ 381,694 $ 321,930
General Obligation Bonds
Waterworks Districts issued general obligation bonds to finance water system projects. Revenue for retirement of such bonds is provided from ad valorem taxes on property within the jurisdiction of the governmental unit issuing the bonds. Principal and interest requirements on general obligation long-term debt for Waterworks District bonds are as follows (in thousands):
Year Ending Business-type Activities June 30 Principal Interest
2010 $ 19 $ 7 2011 21 6 2012 22 3 2013 24 1
Total $ 86 $ 17
Assessment Bonds
The Regional Park and Open Space District issued voter approved assessment bonds in 1997, some of which were advance refunded in 2004-2005 and the remainder in 2007-2008, to fund the acquisition, restoration, improvement and preservation of beach, park, wildlife and open space resources within the District. As discussed in Note 4, the bonds were purchased by the Public Works Financing Authority (Authority) and similar bonds were issued as a public offering. The bonds issued by the Authority are payable from the pledged proceeds of annual assessments levied on parcels within the District’s boundaries.
80

COUNTY OF LOS ANGELESNOTES TO THE BASIC FINANCIAL STATEMENTS-Continued
10. LONG-TERM OBLIGATIONS-Continued
Assessment Bonds-Continued
The bonds mature in fiscal year 2019-2020. Annual principal and interest payments of the bonds are expected to require less than 50% of annual assessment revenues. Total principal and interest remaining on the bonds is $306,589,000, not including unamortized bond premiums. Principal and interest for the current year and assessment revenues were $35,942,000 and $79,140,000, respectively.
Principal and interest requirements on assessment bonds are as follows (in thousands):
Year Ending Governmental Activities June 30 Principal Interest
2010 $ 24,215 $ 11,692 2011 25,375 10,515 2012 26,560 9,270 2013 27,855 7,925 2014 29,255 6,497 2015-2019 99,995 13,463 2020-2024 13,620 352
Subtotal 246,875 $ 59,714
Add: Unamortized Bond Premiums 17,524
Total Assessment Bonds $ 264,399
Certificates of Participation
The County has issued certificates of participation (COPs) through various financing entities that have been established by, and are component units of, the County. The debt proceeds have been used to finance the acquisition of County facilities and equipment. The County makes annual payments to the financing entities for the use of the property and the debt is secured by the underlying capital assets that have been financed.
The County has pledged net revenues from the Calabasas Landfill for the payment of the Calabasas Landfill Project Revenue bonds, included here in the Public Buildings COPS, issued in 2005 and maturing in 2022. To the extent that the net revenues are insufficient to cover the debt payments in any fiscal year, the County has covenanted to make the debt payments from any source of legally available funds. The County paid $1,808,000 of the current fiscal year debt payment of $3,037,000, due to the shortfall of net landfill revenues. Total principal and interest remaining on the bonds is $45,432,000.
81

COUNTY OF LOS ANGELESNOTES TO THE BASIC FINANCIAL STATEMENTS-Continued
10. LONG-TERM OBLIGATIONS-Continued
Certificates of Participation-Continued
Principal and interest requirements on COPs (Flood Control District Refunding bonds and Revenue bonds, NPC bonds, and Public Buildings COPs for Governmental Activities and NPC bonds and Public Buildings COPs for Business-type activities) are as follows (in thousands):
Year Ending Governmental Activities Business-type Activities June 30 Principal Interest Principal Interest
2010 $ 84,509 $ 36,045 $ 14,636 $ 6,503 2011 72,846 33,626 14,008 5,858 2012 71,026 31,096 13,164 5,236 2013 64,440 28,889 12,610 4,488 2014 51,489 26,680 13,201 3,898 2015-2019 142,570 125,768 28,096 8,179 2020-2024 127,716 67,267 2025-2029 66,675 19,418 2030-2034 44,965 4,630 Subtotal 726,236 $ 373,419 95,715 $ 34,162
Accretions 74,161 Unamortized Bond
Premiums 26,597 6,549 Unamortized Loss (34,848)
Total Certificates of Participation $ 792,146 $ 102,264
Tobacco Settlement Asset-Backed Bonds
In 2006, the County entered into a Sale Agreement with the Los Angeles County Securitization Corporation (LACSC) under which the County relinquishes to the LACSC a portion of its future tobacco settlement revenues (TSRs) for the next 40 years. The County received from the sold TSRs a lump sum payment of $319,827,000 and a residual certificate in exchange for the rights to receive and retain 25.9% of the County’s TSRs through 2046. The residual certificate represented the County’s ownership interest in excess TSRs to be received by the LACSC during the term of the sales agreement. Residuals through 2011 were expected to be approximately $140,632,000. The total TSRs sold, based on the projected payment schedule in the Master Settlement Agreement and adjusted for historical trends, was estimated to be $1,438,000,000. The estimated present value of the TSRs sold, net of the expected residuals and assuming a 5.7% interest rate at the time of the sale, was $309,230,000. In the event of a decline in the tobacco settlement revenues for any reason, including the default or bankruptcy of a participating cigarette manufacturer, resulting in a decline in the tobacco settlement revenues and possible default on the Tobacco Bonds, neither the California County Tobacco Securitization Agency, the County, nor the LACSC has any liability to make up any such shortfall.
82

COUNTY OF LOS ANGELESNOTES TO THE BASIC FINANCIAL STATEMENTS-Continued
10. LONG-TERM OBLIGATIONS-Continued
Tobacco Settlement Asset-Backed Bonds-Continued
Principal and interest requirements (in thousands) for the Tobacco Settlement Asset-Backed bonds, which do not begin until 2011, are as follows:
Year Ending Governmental Activities June 30 Principal Interest
2011 $ $ 21,198 2012 21,197 2013 21,197 2014 21,197 2015-2019 105,987 2020-2024 60,280 93,803 2025-2029 46,370 82,407 2030-2034 69,311 2035-2039 62,196 55,680 2040-2044 53,157 34,810 2045-2049 97,824 10,782
Subtotal 319,827 $ 537,569 Accretions 64,315
Total Tobacco Settlement Asset-Backed Bonds $ 384,142
Notes, Loans, and Commercial Paper
Bond Anticipation Notes (BANS) are issued by the Los Angeles County Capital Assets Leasing Corporation (LACCAL Equipment Acquisition Internal Service Fund) to provide interim financing for equipment purchases. BANS are purchased by the County Treasury Pool and are payable within five years. In addition, the BANS are issued with a formal agreement that, in the event they are not liquidated within the five-year period, they convert to capital leases with a three-year term secured by County real property. During the 2008-2009 fiscal year, LACCAL issued additional BANS in the amount of $25,000,000.
CDC notes are secured by annual contributions from the United States Department of Housing and Urban Development (HUD) and housing units constructed with the note proceeds. Commission mortgage notes are secured by revenues from the operation of housing projects and from housing assistance payments from HUD.
Marina del Rey loans were obtained from the California Department of Boating and Waterways for the restoration and renovation of the marina seawall. The loans are secured by Marina del Rey lease revenue and by Los Angeles County Music Center parking revenues.
Tax-exempt commercial paper notes (TECP) are issued by the County to pay for the construction costs for the various hospital construction projects. Repayment of the TECP is secured by a letter of credit and a sublease of twenty-one County-owned properties. The letter of credit has a termination date of December 15, 2015, with an optional termination date of May 1, 2010. Pursuant to the underlying leases, the County is able to amortize the remaining TECP over the useful life of the underlying assets. The term of individual commercial paper notes may not exceed 270 days.
83

COUNTY OF LOS ANGELESNOTES TO THE BASIC FINANCIAL STATEMENTS-Continued
10. LONG-TERM OBLIGATIONS-Continued
Notes, Loans, and Commercial Paper-Continued
Principal and interest requirements on CDC Notes payable, NPC BANS, and Marina del Rey Loans payable for Governmental Activities and NPC BANS, Commercial paper, and CDC Mortgage notes for Business-type Activities are as follows (in thousands):
Year Ending Governmental Activities Business-type Activities June 30 Principal Interest Principal Interest
2010 $ 14,178 $ 3,296 $ 209,757 $ 44 2011 21,732 3,144 6,849 13 2012 3,895 2,965 2013 4,009 2,759 2014 3,691 2,556 2015-2019 20,109 9,614 977 2020-2024 16,378 4,354 2025-2029 9,433 1,041 Indeterminate maturity 1,997 Total $ 93,425 $ 29,729 $ 219,580 $ 57
Summary-All Future Principal, Interest and Accretions
The following summarizes total future principal and interest requirements for the various debt issues referenced above (in thousands):
Governmental Activities Business-type Activities Debt Type Principal Interest Principal Interest
General Obligation Bonds $ $ $ 86 $ 17 Assessment Bonds 246,875 59,714 Certificates of Participation 726,236 373,419 95,715 34,162 Tobacco Settlement Asset-Backed Bonds 319,827 537,569 Notes, Loans, and Commercial Paper 93,425 29,729 219,580 57 Subtotal 1,386,363 $1,000,431 315,381 $ 34,236
Add: Accretions 138,476 Unamortized Bond Premiums 44,121 6,549
Less: Unamortized Loss on Advance Refunding of Debt (34,848)
Total Bonds and Notes Payable $1,534,112 $ 321,930
Long-term liabilities recorded in the Government-wide Statement of Net Assets include accreted interest on zero coupon bonds, unamortized bond premiums, and unamortized losses on advance debt refundings.
84

COUNTY OF LOS ANGELESNOTES TO THE BASIC FINANCIAL STATEMENTS-Continued
10. LONG-TERM OBLIGATIONS-Continued
Bonds Defeased in Prior Years
In prior years, various debt obligations, consisting of bonds and certificates of participation, were defeased by placing the proceeds of refunding bonds in an irrevocable trust to provide for all future debt service payments on the old obligations. Accordingly, the trust account assets and the related liabilities for the defeased bonds are not reflected in the County's financial position. At June 30, 2009, the amount of outstanding bonds and certificates of participation considered defeased was $220,865,000. All of this amount was related to governmental activities.
Changes in Long-term Liabilities
The following is a summary of long-term liabilities and corresponding activity for the year ended June 30, 2009 (in thousands):
Balance Additions/ Transfers/ Balance Due Within July 1, 2008 Accretions Maturities June 30, 2009 One Year
Governmental activities: Bonds and notes payable $ 1,604,677 $ 45,288 $ 115,853 $ 1,534,112 $ 130,567 Pension bonds payable (Note 7) 668,539 183,447 485,092 246,457 Capital lease obligations (Note 9) 173,369 880 16,455 157,794 13,218 Accrued vacation and sick leave 749,208 113,326 53,882 808,652 54,977 Workers’ compensation liability (Note 17) 1,809,463 284,321 277,522 1,816,262 310,160 Litigation and self-insurance liability (Note 17) 141,059 16,084 44,407 112,736 93,370 Pollution remediation obligation, as restated (Note 18) 31,278 1,213 30,065 2,521 OPEB obligation (Note 8) 1,019,980 1,029,754 2,049,734 133,641 Third party payor liability 13,278 16,267 14,854 14,691 14,691 Total governmental activities $ 6,210,851 $1,505,920 $ 707,633 $ 7,009,138 $ 999,602
Business-type activities: Bonds and notes payable $ 337,776 $ 4,856 $ 20,702 $ 321,930 $ 225,270 Pension bonds payable (Note 7) 232,285 63,743 168,542 85,631 Capital lease obligations (Note 9) 273 130 143 143 Accrued vacation and sick leave 124,808 21,910 9,066 137,652 9,056 Workers’ compensation liability (Note 17) 310,965 28,769 40,015 299,719 45,986 Litigation and self-insurance liability (Note 17) 106,330 23,239 23,481 106,088 18,083
OPEB obligation (Note 8) 214,168 201,481 415,649 27,100 Third party payor liability (Note 13) 156,588 48,806 23,120 182,274 6,019
Total business-type activities $ 1,483,193 $ 329,061 $ 180,257 $ 1,631,997 $ 417,288
85
COUNTY OF LOS ANGELESNOTES TO THE BASIC FINANCIAL STATEMENTS-Continued
10. LONG-TERM OBLIGATIONS-Continued
Changes in Long-term Liabilities-Continued
For governmental activities, the General Fund, the Fire Protection District Special Revenue Fund and the Public Library Special Revenue Fund have typically been used to liquidate workers’ compensation, accrued vacation and sick leave and litigation and self-insurance liabilities.
Bond interest accretions for deep discount bonds have been included in the amounts reported for Bonds and Notes Payable and Pension Bonds Payable. For Bonds and Notes Payable, accretions increased during 2008-2009, thereby increasing liabilities for Bonds and Notes Payable by $22,001,000 for governmental activities. Amounts accreted for Pension Bonds in previous years were paid during 2008-2009 thereby decreasing liabilities for Pension Bonds Payable for governmental and business-type activities by $96,941,000 and $33,685,000, respectively, for interest accretions. Note 17 contains information about changes in the combined current and long-term liabilities for workers' compensation and litigation and self-insurance liabilities.
11. SHORT-TERM DEBT
On July 1, 2008, the County issued $500,000,000 of short-term Tax and Revenue Anticipation Notes at an effective interest rate of 1.58%. The proceeds of the notes were used to assist with County General Fund cash flow needs prior to the first major apportionment of property taxes, which occurred in December 2008. The notes matured and were redeemed on June 30, 2009.
12. CONDUIT DEBT OBLIGATIONS
Community Facilities and Improvement District Bonds
As of June 30, 2009, various community facilities and improvement districts established by the County had outstanding special tax bonds payable totaling $78,136,000 and limited obligation improvement bonds totaling $10,910,000. The bonds were issued to finance the cost of various construction activities and infrastructure improvements which have a regional or direct benefit to the related property owners.
The bonds do not constitute an indebtedness of the County and are payable solely from special taxes and benefit assessments collected from property owners within the districts. In the opinion of County officials, these bonds are not payable from any revenues or assets of the County and neither the full faith and credit of the County, the State or any political subdivision thereof is obligated to the payment of the principal or interest on the bonds. Accordingly, no liability has been recorded in the accompanying basic financial statements.
The County functions as an agent for the districts and bondholders. Debt service transactions related to the various bond issues are reported in the agency funds. Construction activities are reported in the Improvement Districts' Capital Projects Fund. Revenues have been recorded (proceeds from property owners) to reflect the bond proceeds issued for capital improvements.
86

COUNTY OF LOS ANGELESNOTES TO THE BASIC FINANCIAL STATEMENTS-Continued
12. CONDUIT DEBT OBLIGATIONS-Continued
Residential Mortgage Revenue Bonds
Residential Mortgage Revenue Bonds have been issued to provide funds to purchase mortgage loans secured by first trust deeds on newly constructed and existing single family residences in the County. The purpose of this program is to provide low interest rate home mortgage loans to persons who are unable to qualify for conventional mortgages at market rates. Multi-Family Mortgage Revenue Bonds have been issued to provide permanent financing for apartment projects located in the County to be partially occupied by persons of low or moderate income. The amount of Mortgage Revenue Bonds outstanding as of June 30, 2009, was $739,951,000.
The bonds do not constitute an indebtedness of the County. The bonds are payable solely from payments made on and secured by a pledge of the acquired mortgage loans and certain funds and other monies held for the benefit of the bondholders pursuant to the bond indentures. In the opinion of County officials, these bonds are not payable from any revenues or assets of the County, and neither the full faith and credit nor the taxing authority of the County, the State or any political subdivision thereof is obligated to the payment of the principal or interest on the bonds. Accordingly, no liability has been recorded in the accompanying basic financial statements.
Industrial Development and Other Conduit Bonds
Industrial development bonds, and other conduit bonds, have been issued to provide financial assistance to private sector entities and nonprofit corporations for the acquisition of industrial and health care facilities which provide a public benefit. The bonds are secured by the facilities acquired and/or bank letter of credit and are payable solely from project revenue or other pledged funds. The County is not obligated in any manner for the repayment of the bonds. Accordingly, no liability has been recorded in the accompanying basic financial statements.
As of June 30, 2009, the amount of industrial development and other conduit bonds outstanding was $1,610,000.
13. HOSPITAL AND OTHER PROGRAM REVENUES
Net patient service revenue is reported at the estimated net realizable amounts from patients, third-party payors, and others for services rendered, including estimated retroactive adjustments under reimbursement agreements with third-party payors. Retroactive adjustments are accrued on an estimated basis in the period the related services are rendered and adjusted in future periods, as final settlements are determined.
Medi-Cal Hospital / Uninsured Care Demonstration Project
The Medicaid Demonstration Project, a sub-state waiver, included the Supplemental Project Pool (SPP) program and the Federally Reimbursable Ambulatory Care Service Costs. This sub-state waiver was terminated on June 30, 2005. A new Statewide Project, the California's Medi-Cal Hospital Uninsured Care Demonstration Project, was implemented on July 1, 2005. This Demonstration Project and the associated changes to various State Plan Amendments either modified and/or replaced the Medi-Cal Fee For Services, SB 855 and SB 1255 payment funding systems.
87

COUNTY OF LOS ANGELESNOTES TO THE BASIC FINANCIAL STATEMENTS-Continued
13. HOSPITAL AND OTHER PROGRAM REVENUES-Continued
Medi-Cal Hospital / Uninsured Care Demonstration Project-Continued
The Demonstration Project was negotiated between the State of California’s Department of Health Care Services (DHCS) and the federal Centers for Medicare and Medicaid Services (CMS), and covers the period from July 1, 2005 to June 30, 2010. The implementing State legislation (SB 1100) was enacted by the Legislature in September 2005. The five-year Demonstration Project applies to payments Statewide (which currently includes 21 public hospitals, including all University of California owned hospitals, identified as Designated Public Hospitals, and private and non-designated public safety net hospitals that serve large numbers of Medi-Cal patients).
The Medicaid Demonstration Project restructures inpatient hospital fee-for-service (FFS) payments and Disproportionate Share Hospital (DSH) payments, as well as the financing method by which the State draws down federal matching funds. Under the old system, public hospitals negotiated and received inpatient FFS contract per diem payments and supplemental contract payments (SB 1255) under the Medi-Cal Selective Provider Contract Program, and received DSH funds pursuant to a statutory formula (SB 855). The non-federal share of the inpatient FFS per diems was funded with State general funds, while the non-federal share of the supplemental contract payments and DSH payments was provided in the form of intergovernmental transfers (IGTs) of funds made by the public entities that operated public hospitals.
Under the Demonstration Project, payments for the public hospitals are comprised of: 1) FFS cost-based reimbursement for inpatient hospital services; 2) DSH payments and 3) distribution from a newly created pool of federal funding for uninsured care, known as the Safety Net Care Pool (SNCP), which was capped Statewide at $586 million for FY 2008-09. The non-federal share of these three types of payments is provided by the public hospitals rather than the State, primarily through certified public expenditures (CPE) whereby the hospital would expend its local funding for services to draw down the federal financial participation (FFP). The FFP for the FFS cost based reimbursement is provided at 50% match for July through September 30, 2008 and at 61.59% beginning October 1, 2008. The FFP for DSH remains at 50%. For the inpatient hospital cost-based reimbursement, each hospital provides its own CPE and receives all of the resulting federal match. For the DSH and SNCP distributions, the CPEs of all the public hospitals are used in the aggregate to draw down the federal match. It is therefore possible for one hospital to receive the federal match that results from another hospital’s CPE. In this situation, the first hospital is referred to as a “recipient” hospital, while the second is referred to as a “donor” hospital. A recipient hospital is required to “retain” the FFP amounts resulting from donated CPEs.
The Demonstration Project restricts the amount of IGTs that may be used for DSH payments. A hospital’s IGT may be used to draw federal DSH funding, but only with respect to DSH payments made to that hospital, and the gross amount of such IGT funded payments (non-federal plus federal match) may not exceed 75% of the hospital’s uncompensated care costs to ensure compliance with the OBRA 1993 hospital-specific DSH limit. The gross IGT funded DSH payment must be “retained” by the hospital.
The County of Los Angeles provides funding for the State's share of the Demonstration Project by transferring funds to the State. These transferred funds, referred to as IGTs, are used by the State to draw down federal matching funds. The combined IGTs sent to the State by each hospital Enterprise Fund plus the matching federal funds are utilized by the State to provide supplemental funding for health care expenditures.
88

COUNTY OF LOS ANGELESNOTES TO THE BASIC FINANCIAL STATEMENTS-Continued
13. HOSPITAL AND OTHER PROGRAM REVENUES-Continued
Medi-Cal Hospital / Uninsured Care Demonstration Project-Continued
The County recognizes the supplemental funding received for each hospital as net patient services revenue as reflected in the Statement of Revenues, Expenses, and Changes in Net Assets. The IGTs are reflected as non-operating expenses by each Hospital in the Statement of Revenues, Expenses, and Changes in Fund Net Assets. The IGTs paid during FY 2008-09 include payments for FYs 2007-08 and 2008-09. The estimated revenues include amounts collected and accrued for FY 2008-09 and over/under-realization of revenues for FY 2005-06 through FY 2007-08. The amounts below are in thousands:
Intergovernmental Program Transfers Expense Revenues
Medicaid Demonstration Project $221,038 $811,230
Baseline Payments
The Demonstration Project prioritizes payments so that, to the extent possible, total payments to hospitals are at a minimum “baseline” level. For public hospitals, the baseline level is determined and satisfied on a hospital-specific basis. The baseline for the 2008-09 program year is established at each hospital’s total net Medi-Cal inpatient payments for 2007-08. DHCS estimates the aggregate baseline funding for the Statewide designated public hospitals to be $2.366 billion.
The estimated FY 2008-09 baseline for Los Angeles County hospitals is as follows (in thousands):
Baseline Hospital Name Amount
LAC+USC Medical Center $ 381,082 Harbor-UCLA Medical Center 177,628 Rancho Los Amigos National Rehabilitation Center 90,330 Olive View -UCLA Medical Center 113,004
Total $ 762,044
The three funding components utilized to meet each hospital’s baseline level are as follows:
1) Medi-Cal inpatient FFS cost-based reimbursement: The FFP which is paid to the hospital represents approximately half of the facility-specific costs or CPE. The hospital’s amounts will fluctuate based on the number of facility-specific Medi-Cal patients served and the facility-specific cost-computations that are adjusted on an interim and final basis.
2) DSH funds: These payments are made to hospitals to take into account the uncompensated costs of care delivered to the uninsured, undocumented immigrants and shortfalls between Medi- Cal psychiatric and Medi-Cal managed care payments. The non-federal share of these funds will be a combination of CPEs for these services and IGTs that are subject to interim and final cost settlement. There is an annual fixed allotment of federal DSH funds. The waiver allocates almost all of these funds to public hospitals. (DHCS estimates the aggregate value of federal DSH funds for the Statewide designated public hospitals to be $1.091 billion as of June 30, 2009, which includes a 2.5% DSH allotment increase that the State received as part of the American Recovery and Reinvestment Act of 2009.)
89
COUNTY OF LOS ANGELESNOTES TO THE BASIC FINANCIAL STATEMENTS-Continued
13. HOSPITAL AND OTHER PROGRAM REVENUES-Continued
Baseline Payments-Continued
3) SNCP Distributions: These federal payments are made to public hospitals and clinics for uncompensated care delivered to uninsured patients and for certain designated non-hospital costs, such as drugs and supplies for the uninsured. The non-federal share of these funds are based on CPEs for these services.
Stabilization Payments
Payments to private and non-designated public DSH hospitals that exceed the aggregate baseline are considered stabilization funds and are included in the allocation among all waiver hospitals based on State law. Stabilization is distributed to the Designated Public Hospitals from the SNCP. The non-federal share of these funds are based on CPEs for related services.
SB 1100 requires DHCS to finalize the calculation of stabilization funding for each hospital and pay that amount by April 1 following the project year. This determination is based on cost estimates and specified adjustments. Under State law, the stabilization payments determined through this process shall not be modified for any reason other than mathematical errors or mathematical omissions on the part of the State of California.
Reported CPEs Subject to Audit
All CPEs reported by each hospital will be subject to State and federal audit and final reconciliation. If at the end of the final reconciliation process, it is determined that a hospital’s claimed CPEs resulted in an overpayment of federal funds to the State, the hospital may be required to return the overpayment whether or not they received the federal matching funds.
Medi-Cal Physician State Plan Amendment (Physician SPA)
Prior to July 1, 2005, Medi-Cal inpatient physician professional services (including non-physician practitioners) were reimbursed as part of an all-inclusive fixed contract rate per-diem. Effective July 1, 2005, public hospitals were no longer paid a fixed rate but were reimbursed under the Demonstration Project. The Demonstration Project is under State Plan Amendment 05-21, and excluded professional services. However, in December 2007, CMS approved California State Plan Amendment 05-23 which allowed professional services to be paid similarly to the inpatient hospital services under the Demonstration Project. Hospitals were allowed to claim unreimbursed Medi-Cal professional services (Hospital Inpatient, Emergency Room, and Psychiatric services) and were paid the Federal Medical Assistance Percentage (FMAP) share, currently at 61.59%.
Physician payments of $8.85 million and $20.51 million were received for 2006-07 and 2007-08, respectively, in FY 2008-09, based on filed cost report information. Amounts claimed for 2005-06 and 2008-09 have not yet been paid.
90

COUNTY OF LOS ANGELESNOTES TO THE BASIC FINANCIAL STATEMENTS-Continued
13. HOSPITAL AND OTHER PROGRAM REVENUES-Continued
State Senate Bill 474 (SB 474)
South Los Angeles Medical Services Preservation Fund
On October 12, 2007, SB 474 established an annual fund to stabilize health services for low-income, underserved populations of South Los Angeles. The “South Los Angeles Medical Services Preservation Fund” is intended to address the regional impact of the closure of the MLK-Harbor Hospital (currently MLK-MACC) and will help defray the County’s costs for treating uninsured patients in the South Los Angeles area. In FY 2008-09, MLK-MACC received $87.7 million for FY 2007-08 and an estimated amount of $100.0 million was recorded for FY 2008-09.
Intergovernmental Transfers for Private Hospital Supplemental Fund
SB 474 also requires the County to make intergovernmental transfers (IGT) to the State to fund the non-federal share of increased Medi-Cal payments to those private hospitals that serve the South Los Angeles population formerly served by MLK-Harbor Hospital. An IGT expense of $5.0 million was recorded as health care expenditures in the County’s General Fund.
Other Medi-Cal Programs
Cost Based Reimbursement Clinics (CBRC)
A State Plan Amendment to extend CBRC funding has been approved by the federal government. The Amendment is effective July 1, 2005 through June 30, 2010. CBRC reimburses at 100 percent of reasonable costs for Medi-Cal outpatient services provided to Medi-Cal beneficiaries at hospital-based clinics, Multi-Ambulatory Care Centers (MACC) and health centers (excluding clinics that provide predominately public health services). The Department-wide CBRC revenues collected and accrued in FY 2008-09 were $284.6 million.
Medi-Cal Cost Report Settlements
All field audits for FY 2005-06 have been completed. Due to their workload deadlines, the Medi-Cal auditors issued separate audit reports for hospital inpatient costs and CBRC costs. All audit reports for hospital inpatient costs were issued by May 30, 2009. Of the CBRC audit reports, Rancho Los Amigos National Rehabilitation Center’s audit report has been issued and an audit settlement of $9.3 million will be paid to the County. The remaining FY 2005-06 CBRC audit reports have yet to be issued. FY 2006-07 Medi-Cal field audits are in progress.
The FY 2004-05 informal level appeal hearing was held during June 2009. The resolution of these appeal issues are contingent upon the Report of Findings to be issued by the Administrative Appeals Hearing Officer.
91

COUNTY OF LOS ANGELESNOTES TO THE BASIC FINANCIAL STATEMENTS-Continued
13. HOSPITAL AND OTHER PROGRAM REVENUES-Continued
Other Medi-Cal Programs-Continued
Medi-Cal Managed Care Rate Supplement
The State received permission from CMS to supplement the Medi-Cal Managed Care rates paid to L.A. Care for the period October 1, 2006 through September 1, 2008. The supplement is funded by an intergovernmental transfer (IGT) by the County, and CMS understood that the supplemental payment was to be passed through to DHS. The County does not receive managed care payment directly from the State; rather, the State contracts with L.A. Care, which then subcontracts for services with various provider networks, including DHS' Community Health Plan. DHS received gross payments in FY 2008-09 for this entire period in the amount of $149.3 million, based on a $74.7 million IGT.
The State made a proposal to CMS to extend this program to period October 1, 2008 through September 30, 2009, and to include supplemental payments to L.A. Care, as well as Health Net. CMS is still considering this proposal. Assuming the program as it relates to L.A. Care will be approved, an estimated $62.3 million was accrued for FY 2008-09 and an IGT expenditure in the amount of $23.8 million was recorded.
The total estimated IGTs and the related estimated revenues recorded in FY 2008-09, less prior year accruals, are as follows (in thousands):
Intergovernmental Program Transfers Expense Revenues
Medi-Cal Managed Care Rate Supplement $33,682 $82,141
Coverage Initiative
On April 10, 2007, DHCS awarded LA County DHS an allocation of federal funding to implement its Healthy Way LA Program under the Health Care Coverage Initiative (CI). In addition to patient care services, LA County DHS is to claim administrative and case management costs associated with the CI program. In FY 2008-09, an estimated $53.9 million of CI revenues and $7.6 million of CI administrative costs were recorded.
Revenues from the various Medi-Cal programs (i.e., FFS, DSH, SNCP, CBRC, AB 915, SB 1732, etc.) represent approximately 75% of the hospitals’ patient care revenue for the year ended June 30, 2009.
Medicare Program
Services to inpatient Medicare program beneficiaries are primarily paid under prospectively determined rates-per-discharge based upon diagnostic related groups (DRGs). Certain other services to Medicare beneficiaries are reimbursed based on a fee schedule or other rates.
92

COUNTY OF LOS ANGELESNOTES TO THE BASIC FINANCIAL STATEMENTS-Continued
13. HOSPITAL AND OTHER PROGRAM REVENUES-Continued
Medicare Program-Continued
Medicare audits have been completed at all hospitals and notices of program reimbursement have been received for all hospitals through FY 2000-01. For FYs 2001-02 and 2002-03, Medicare audits have been completed for all hospitals except for LAC+USC Medical Center (LAC+USC). For FY 2003-04, the audits for MLK, Rancho, and Olive View-UCLA Medical Center (OV/UCLA) have been completed. The audits for LAC+USC and Harbor/UCLA Medical Center (H/UCLA) have not been scheduled for FY 2003-04.
For FYs 2004-05 through 2005-06, the audits for MLK and OV/UCLA have been completed, and Rancho audits are in progress. The audits for LAC+USC and H/UCLA have not been scheduled.
For FY 2006-07, the audits for MLK, Rancho, and OV/UCLA have been completed and the notice of program reimbursement has been issued. The audits for LAC+USC and H/UCLA have not been scheduled.
For FY 2007-08, the Medicare audits for LAC+USC, Harbor/UCLA, Rancho, and OV/UCLA have not been scheduled. As of mid August 2007, MLK ceased hospital operation and will not undergo a hospital Medicare audit due to low Medicare utilization.
Revenues from the Medicare program represent approximately 7% of patient care revenue for the year ended June 30, 2009.
Revenues related to the aforementioned programs are included in the accompanying basic financial statements as hospital operating revenues. Uncollected amounts are reported as Accounts Receivable. Claims for these programs are subject to audit by State and/or federal agencies.
Accounts Receivable-net
The following is a summary, by hospital, of accounts receivable and allowances for uncollectible amounts as of June 30, 2009 (in thousands):
H/UCLA OV/UCLA LAC+USC MLK-MACC Rancho Total
Accounts receivable $ 824,606 560,616 1,275,400 225,966 310,548 $ 3,197,136
Less: Allowance for uncollectible amounts 645,570 361,000 925,296 44,829 195,587 2,172,282
Accounts Receivable - net $ 179,036 199,616 350,104 181,137 114,961 $ 1,024,854
93

COUNTY OF LOS ANGELESNOTES TO THE BASIC FINANCIAL STATEMENTS-Continued
13. HOSPITAL AND OTHER PROGRAM REVENUES-Continued
Charity Care
Charity care includes those uncollectible amounts, for which the patient is unable to pay. Generally, charity care adjustment accounts are those accounts for which an indigence standard has been established and under which the patient qualifies. Inability to pay may be determined through one of the Department’s Reduced Cost Health Care plans, through other eligibility plans utilized by the Department, by the Treasurer-Tax Collector, or by an outside collection agency. Determinations of charity care may be made prior to, at the time of service, or any time thereafter.
The total amount of such charity care provided by the hospitals for the fiscal year ended June 30, 2009, based on established rates, is as follows (in thousands):
Charges forgone $1,470,327 Less: Federal and State subventions 0 Net charges forgone $1,470,327
Litigation Regarding Reduction in Health Services
In March 2003, two lawsuits were filed in Federal District Court against the County challenging health care reductions approved by the Board. The lawsuits challenged the closure of Rancho Los Amigos National Rehabilitation Center as well as the reduction of the 100 beds at LAC+USC Medical Center.
Negotiated settlements in both cases were approved by the Board of Supervisors in August 2005 and became final in December 2005 and March 2006, respectively. Pursuant to the settlement agreements, the County agreed to keep Rancho open through March 9, 2009 at a specified level of service. The settlement agreement expired on March 10, 2009, but the County has continued its efforts to identify and negotiate with an organization to assume the future operation of Rancho as was originally required by the settlement agreement. In the meantime, the facility is open and operating. With respect to LAC+USC, the settlement allows for the graduated reduction of beds contingent upon the County providing additional outpatient care on the facility’s campus and the facility reaching certain targets showing the efficiency of, and decreased demand on, the hospital.
14. INTERFUND TRANSACTIONS
Interfund Receivables/Payables
Interfund receivables and payables have been eliminated in the government-wide financial statements, except for “internal balances” that are reflected between the governmental and business-type activities. Interfund receivables and payables have been recorded in the fund financial statements. Such amounts arise due to the exchange of goods or services (or subsidy transfers) between funds that were pending the transfer of cash as of June 30, 2009.
94

COUNTY OF LOS ANGELESNOTES TO THE BASIC FINANCIAL STATEMENTS-Continued
14. INTERFUND TRANSACTIONS-Continued
Interfund Receivables/Payables-Continued
Cash transfers related to interfund receivables/payables are generally made within 30 days after year-end. Amounts due to/from other funds at June 30, 2009 are as follows (in thousands):
Receivable Fund Payable Fund Amount
General Fund Fire Protection District $ 7,306 Flood Control District 4,571 Public Library 4,691 Regional Park and Open Space District 2,858 Internal Service Funds 6,271 Waterworks Enterprise Funds 90 Harbor-UCLA Medical Center 27,299 Olive View-UCLA Medical Center 33,082 LAC+USC Medical Center 46,647 M.L. King Ambulatory Care Center 42,503 Rancho Los Amigos Nat’l Rehab Center 32,931 Nonmajor Enterprise Funds 17 Nonmajor Governmental Funds 118,113 326,379
Fire Protection District General Fund 3,065 Internal Service Funds 1 Nonmajor Governmental Funds 450
3,516
Flood Control District General Fund 4,513 Internal Service Funds 15,096 Waterworks Enterprise Funds 22 Nonmajor Enterprise Funds 2 Nonmajor Governmental Funds 380
20,013
Public Library General Fund 273 Nonmajor Governmental Funds 150
423
95

COUNTY OF LOS ANGELESNOTES TO THE BASIC FINANCIAL STATEMENTS-Continued
14. INTERFUND TRANSACTIONS-Continued
Interfund Receivables/Payables-Continued
Receivable Fund Payable Fund Amount
Internal Service Funds General Fund $ 17,450 Fire Protection District 46 Flood Control District 13,394 Public Library 3 Waterworks Enterprise Funds 5,100 Harbor-UCLA Medical Center 70 Olive View-UCLA Medical Center 539 LAC+USC Medical Center 1,217 M.L. King Ambulatory Care Center 9 Rancho Los Amigos Nat’l Rehab Center 26 Nonmajor Enterprise Funds 230 Nonmajor Governmental Funds 27,826
65,910
Waterworks Enterprise Funds General Fund 2 Internal Service Funds 1,819
1,821
Harbor-UCLA Medical Center General Fund 9,181 Fire Protection District 30 Olive View-UCLA Medical Center 82 LAC+USC Medical Center 1,040 M.L. King Ambulatory Care Center 492 Rancho Los Amigos Nat’l Rehab Center 29Nonmajor Governmental Funds 29,584
40,438
Olive View-UCLA Medical Center General Fund 14,233 Fire Protection District 122 Harbor-UCLA Medical Center 12 LAC+USC Medical Center 29,387 M.L. King Ambulatory Care Center 17 Rancho Los Amigos Nat’l Rehab Center 8 Nonmajor Governmental Funds 21,831 65,610 LAC+USC Medical Center General Fund 115,430 Fire Protection District 65 Harbor-UCLA Medical Center 4,988 Olive View-UCLA Medical Center 2,883 M.L. King Ambulatory Care Center 1,267 Rancho Los Amigos Nat’l Rehab Center 927 Nonmajor Governmental Funds 54,371 179,931
96

COUNTY OF LOS ANGELESNOTES TO THE BASIC FINANCIAL STATEMENTS-Continued
14. INTERFUND TRANSACTIONS-Continued
Interfund Receivables/Payables-Continued
Receivable Fund Payable Fund Amount M.L. King Ambulatory Care Center General Fund $ 3,149 LAC+USC Medical Center 1,559 Nonmajor Governmental Funds 6 4,714Rancho Los Amigos Nat’l Rehab Center General Fund 27,424 Fire Protection District 16 Harbor-UCLA Medical Center 109 LAC+USC Medical Center 96 27,645 Nonmajor Enterprise Funds Internal Service Funds 53 Nonmajor Governmental Funds General Fund 300,385
Fire Protection District 2,540 Flood Control District 436 Public Library 14 Regional Park and Open Space District 61 Internal Service Funds 13,677 Waterworks Enterprise Funds 1,051 Olive View-UCLA Medical Center 21 Nonmajor Governmental Funds 12,554 330,739Total Interfund Receivables/Payables $ 1,067,192
Interfund Transfers
Transfers were made during the year from the General Fund to subsidize the operations of the Public Library and the five hospitals. Other transfers primarily consisted of payments from the various operating funds (principally the General Fund) to debt service funds in accordance with long-term debt covenants. In addition, special revenue funds that are statutorily restricted made transfers to other funds to reimburse eligible costs incurred.
97

COUNTY OF LOS ANGELESNOTES TO THE BASIC FINANCIAL STATEMENTS-Continued
14. INTERFUND TRANSACTIONS-Continued
Interfund Transfers-Continued
Interfund transfers to/from other funds for the year ended June 30, 2009 are as follows (in thousands):
Transfer From Transfer To Amount
General Fund Public Library $ 39,665 Internal Service Funds 69 Harbor-UCLA Medical Center 161,540 Olive View-UCLA Medical Center 102,420 LAC+USC Medical Center 413,838 M.L. King Ambulatory Care Center 60,328 Rancho Los Amigos Nat’l Rehab Center 64,719 Nonmajor Governmental Funds 69,173
911,752 Fire Protection District Nonmajor Governmental Funds 13,351 Flood Control District Internal Service Funds 1,425 Nonmajor Governmental Funds 19,052 20,477
Public Library General Fund 3,479 Nonmajor Governmental Funds 3,535 7,014Regional Park and Open Space District Nonmajor Governmental Funds 33,280 Internal Service Funds General Fund 2,624 Nonmajor Governmental Funds 265 2,889
Waterworks Enterprise Funds General Fund 5 Internal Service Funds 344 349
Harbor-UCLA Medical Center Olive View-UCLA Medical Center 12,036 M.L. King Ambulatory Care Center 5 Rancho Los Amigos Nat’l Rehab Center 5,530 17,571 Olive View-UCLA Medical Center Nonmajor Governmental Funds 5,231 LAC+USC Medical Center Harbor-UCLA Medical Center 948 Olive View-UCLA Medical Center 29,360 30,308Rancho Los Amigos Nat’l Rehab Center LAC+USC Medical Center 1,554
98

COUNTY OF LOS ANGELESNOTES TO THE BASIC FINANCIAL STATEMENTS-Continued
14. INTERFUND TRANSACTIONS-Continued
Interfund Transfers-Continued
Transfer From Transfer To Amount Nonmajor Governmental Funds General Fund $ 293,139 Flood Control District 32 Internal Service Funds 2,524 Harbor-UCLA Medical Center 59,260 Olive View-UCLA Medical Center 42,451 LAC+USC Medical Center 109,479 M.L. King Ambulatory Care Center 313 Rancho Los Amigos Nat’l Rehab Center 181 Nonmajor Enterprise Funds 2,980 Nonmajor Governmental Funds 44,400 554,759
Total Interfund Transfers $1,598,535
Short-term Advances
The General Fund makes short-term advances to assist the Hospital Funds in meeting their cash flow requirements. The General Fund, along with other funds that receive services from the Public Works Internal Service Fund, makes short-term advances to ensure sufficient cash is available to fund operations.
Advances from/to other funds at June 30, 2009 are as follows (in thousands):
Receivable Fund Payable Fund Amount
General Fund Internal Service Funds $ 3,589 Harbor-UCLA Medical Center 134,597 Olive View-UCLA Medical Center 200,128 LAC+USC Medical Center 275,238 M.L. King Ambulatory Care Center 154,996 Rancho Los Amigos Nat’l Rehab Center 56,469
825,017 Flood Control District Internal Service Funds 6,213 Waterworks Enterprise Funds Internal Service Funds 1,164 Nonmajor Governmental Funds Internal Service Funds 11,034 Total Short-term Advances $ 843,428
99
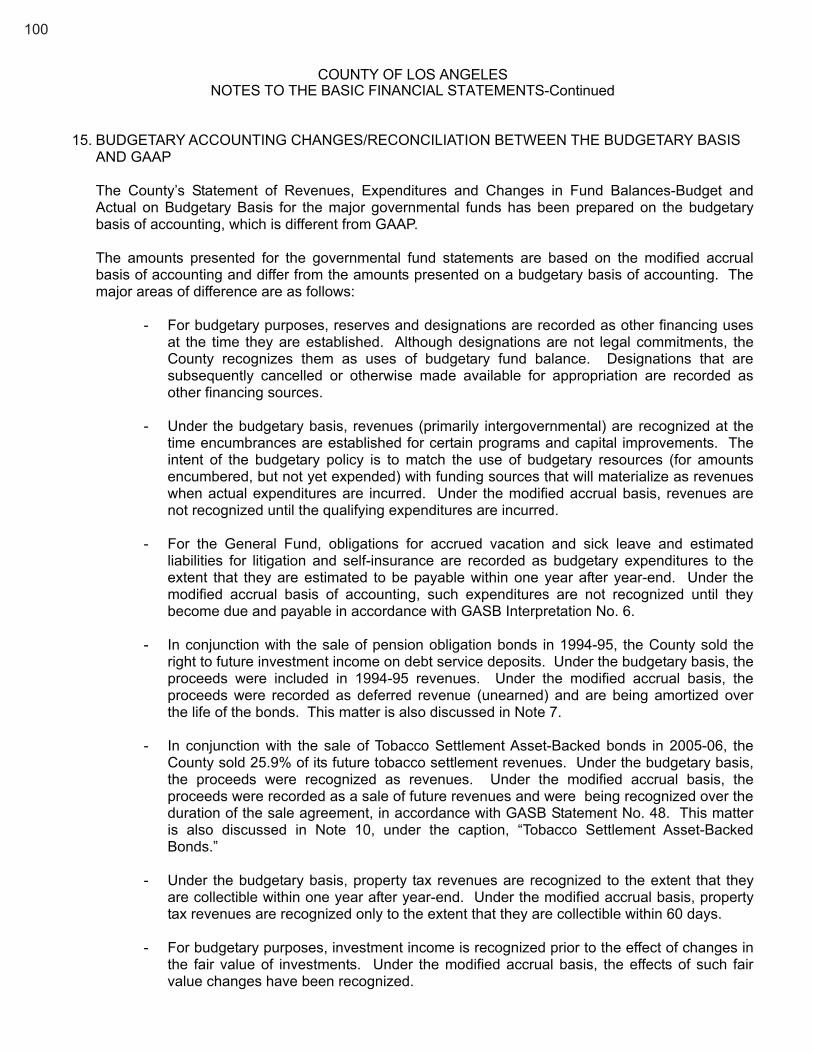
COUNTY OF LOS ANGELESNOTES TO THE BASIC FINANCIAL STATEMENTS-Continued
15. BUDGETARY ACCOUNTING CHANGES/RECONCILIATION BETWEEN THE BUDGETARY BASIS AND GAAP
The County’s Statement of Revenues, Expenditures and Changes in Fund Balances-Budget and Actual on Budgetary Basis for the major governmental funds has been prepared on the budgetary basis of accounting, which is different from GAAP.
The amounts presented for the governmental fund statements are based on the modified accrual basis of accounting and differ from the amounts presented on a budgetary basis of accounting. The major areas of difference are as follows:
- For budgetary purposes, reserves and designations are recorded as other financing uses at the time they are established. Although designations are not legal commitments, the County recognizes them as uses of budgetary fund balance. Designations that are subsequently cancelled or otherwise made available for appropriation are recorded as other financing sources.
- Under the budgetary basis, revenues (primarily intergovernmental) are recognized at the time encumbrances are established for certain programs and capital improvements. The intent of the budgetary policy is to match the use of budgetary resources (for amounts encumbered, but not yet expended) with funding sources that will materialize as revenues when actual expenditures are incurred. Under the modified accrual basis, revenues are not recognized until the qualifying expenditures are incurred.
- For the General Fund, obligations for accrued vacation and sick leave and estimated liabilities for litigation and self-insurance are recorded as budgetary expenditures to the extent that they are estimated to be payable within one year after year-end. Under the modified accrual basis of accounting, such expenditures are not recognized until they become due and payable in accordance with GASB Interpretation No. 6.
- In conjunction with the sale of pension obligation bonds in 1994-95, the County sold the right to future investment income on debt service deposits. Under the budgetary basis, the proceeds were included in 1994-95 revenues. Under the modified accrual basis, the proceeds were recorded as deferred revenue (unearned) and are being amortized over the life of the bonds. This matter is also discussed in Note 7.
- In conjunction with the sale of Tobacco Settlement Asset-Backed bonds in 2005-06, the County sold 25.9% of its future tobacco settlement revenues. Under the budgetary basis, the proceeds were recognized as revenues. Under the modified accrual basis, the proceeds were recorded as a sale of future revenues and were being recognized over the duration of the sale agreement, in accordance with GASB Statement No. 48. This matter is also discussed in Note 10, under the caption, “Tobacco Settlement Asset-Backed Bonds.”
- Under the budgetary basis, property tax revenues are recognized to the extent that they
are collectible within one year after year-end. Under the modified accrual basis, property tax revenues are recognized only to the extent that they are collectible within 60 days.
- For budgetary purposes, investment income is recognized prior to the effect of changes in the fair value of investments. Under the modified accrual basis, the effects of such fair value changes have been recognized.
100

COUNTY OF LOS ANGELESNOTES TO THE BASIC FINANCIAL STATEMENTS-Continued
15. BUDGETARY ACCOUNTING CHANGES/RECONCILIATION BETWEEN THE BUDGETARY BASIS AND GAAP-Continued
- In conjunction with implementing GASB 45, the County determined that certain assets were held by LACERA (the OPEB administrator) in an OPEB Agency Fund. For budgetary purposes, any excess payments (beyond the pay-as-you-go amount) are recognized as expenditures. Under the modified accrual basis, the expenditures are adjusted to recognize the OPEB Agency assets at June 30, 2009.
The following schedule is a reconciliation of the budgetary and GAAP fund balances for the major governmental funds (in thousands):
Regional Fire Flood Park and General Protection Control Public Open Space Fund District District Library District
Fund balance - budgetary basis $ 1,713,428 $ 58,248 $ 28,386 $ 13,307 $ 166,640 Reserves and designations 1,511,430 161,794 168,925 15,105 121,599
Subtotal 3,224,858 220,042 197,311 28,412 288,239
Adjustments:
Accrual of estimated liability for litigation and self-insurance claims 154,664 (708) (1) Accrual of vacation and
sick leave benefits 46,797 Deferral of unearned investment
income (1,143) (56) (13) Deferral of sale of tobacco
settlement revenue (266,794) Change in revenue accruals 8,436 (14,341) (5,285) (1,473) (578) Subtotal (58,040) (15,105) (5,285) (1,487) (578) Fund balance - GAAP basis $ 3,166,818 $ 204,937 $ 192,026 $ 26,925 $ 287,661
16. OTHER COMMITMENTS
Construction Commitments
At June 30, 2009, the LAC+USC Medical Center Hospital Enterprise Fund no longer had contractual commitments to provide for the construction of the LAC+USC Medical Center replacement facility, which was completed during FY 2008-2009. However, there were contractual commitments of approximately $1,492,000 for various hospital construction projects that were financed by commercial paper.
LACERA Capital Commitments
At June 30, 2009, LACERA had outstanding capital commitments to various investment managers, approximating $2,580,000,000. Subsequent to June 30, 2009, LACERA funded $129,000,000 of these capital commitments.
101

COUNTY OF LOS ANGELESNOTES TO THE BASIC FINANCIAL STATEMENTS-Continued
16. OTHER COMMITMENTS-Continued
Investment Purchase Commitments
At June 30, 2009, the County had open trade commitments with various brokers to purchase investments approximating $251,533,000 with settlement dates subsequent to year end. These investment transactions had not been recorded as of June 30, 2009, since the County neither takes delivery of the securities nor earns interest on the investments until the settlement date. By July 1, 2009, the County had purchased such investments.
17. RISK MANAGEMENT
The County purchases insurance for certain risk exposures such as aviation, employee fidelity, boiler and machinery in certain structures, art objects, catastrophic hospital general liability, volunteer, special events, public official bond, crime, safety reserve employee death and disability, and fiduciary liability for the deferred compensation plans. There have been no settlements related to these programs that exceeded insurance coverage in the last three years. The County also has insurance on most major structures. Losses did not exceed coverage in 2007-2008 or 2008-2009.
The County retains the risk for all other loss exposures. Major areas of risk include workers' compensation, medical malpractice, law enforcement, theft and damage to property including natural disasters, errors and omissions, and torts. Expenditures are accounted for in the fund whose operations resulted in the loss. Claims expenditures and liabilities are reported when it is probable that a loss has been incurred and the amount of that loss, including those incurred but not reported, can be reasonably estimated. The County utilizes actuarial studies, historical data, and individual claims reviews to estimate these liabilities. The liabilities include estimable incremental claim adjustment expenses, net of salvage, and subrogation of approximately 10% of the total liabilities. They do not include other claim adjustment costs because the County does not believe it is practical or cost effective to estimate them.
As indicated in the following table, the County’s workers’ compensation liabilities as of June 30, 2009 were approximately $2.116 billion. This amount is undiscounted and is based on an actuarial study of the County’s self-insured program as of June 30, 2009. Approximately $158,556,000 of the total liabilities pertain to salary continuation payments and other related costs mandated by the State Labor Code.
As of June 30, 2009, the County's best estimate of these liabilities is $ 2.335 billion. Changes in the reported liability since July 1, 2007 resulted from the following (in thousands):
Current Year Beginning of Claims and Balance At Fiscal Year Changes In Claim Fiscal Liability Estimates Payments Year-End
2007-2008 Workers’ Compensation $ 2,203,253 $ 231,480 $(314,305) $ 2,120,428 Other 189,414 114,355 (56,380) 247,389 Total 2007-2008 $ 2,392,667 $ 345,835 $(370,685) $ 2,367,817
2008-2009 Workers’ Compensation $ 2,120,428 $ 313,090 $(317,537) $ 2,115,981 Other 247,389 39,323 (67,888) 218,824 Total 2008-2009 $ 2,367,817 $ 352,413 $(385,425) $ 2,334,805
102

COUNTY OF LOS ANGELESNOTES TO THE BASIC FINANCIAL STATEMENTS-Continued
17. RISK MANAGEMENT-Continued
In addition to the above estimated liabilities, the County has determined that claims seeking damages of approximately $ 235.1 million are reasonably possible of creating adverse judgments against the County. Because of the uncertainty of their outcome, no loss has been accrued for these claims.
18. POLLUTION REMEDIATION
As discussed in Note 2, the County implemented GASB Statement No. 49 for the fiscal year ended June 30, 2009. GASB 49 establishes accounting and reporting guidelines for the recognition and measurement of pollution remediation obligations (liabilities).
The County is involved in several remediation actions to clean up pollution sites within its boundaries. These matters generally coincide with the County’s ownership of land, buildings and infrastructure assets. In some cases, regulatory agencies (e.g., Regional Water Quality Board, State Department of Toxic Control, California Coastal Commission) notified the County of the need for remedial action. In addition, the County conducts its own environmental monitoring and this activity identifies pollution sites and matters requiring further investigation and possible remediation. Once the County is aware of these conditions, it commences monitoring, assessment, testing and/or clean up activities, and recognizes pollution remediation obligations when estimates can reasonably be determined.
The types of pollution that have been identified include leaking underground storage tanks, water, groundwater and soil contamination, asbestos and lead paint contamination, methane gas detection and excessive levels of other contaminants. Remediation efforts include developing remediation and feasibility studies, source identification studies, site testing, sampling and analysis, ground water clean up, and removal of storage tanks, asbestos tiles and other hazardous materials.
As of June 30, 2009, the County’s estimated pollution remediation obligations totaled $30.065 million. These obligations were all associated with the County’s government-wide governmental activities. Obligations of enterprise and internal service funds were immaterial. The estimated liabilities were determined by project managers, based on historical cost information for projects of the same type, size and complexity and measured at their current value. In subsequent periods, the County will adjust estimated obligations when new information indicates that such changes are required. At this time, the County has determined there are no estimated recoveries reducing the obligations.
19. PROPOSITION 62 - UNINCORPORATED LOS ANGELES COUNTY UTILITY USE TAX
In September 1995, the California Supreme Court upheld the constitutionality of Proposition 62, which requires voter approval of all new local taxes. Taxes imposed without voter approval after the 1986 effective date of Proposition 62 may be invalidated. The Court did not provide clarification about whether the decision would apply only prospectively to all new taxes or retrospectively to all taxes since the effective date of the Proposition.
On November 4, 2008, the voters approved the Unincorporated Los Angeles County Utility Users’ Tax Continuation Measure (Measure U) to validate and reduce the Los Angeles County’s existing utility users’ tax from 5 percent to 4.5 percent. The adoption of this measure prospectively addresses the validity of future taxes.
103

COUNTY OF LOS ANGELESNOTES TO THE BASIC FINANCIAL STATEMENTS-Continued
19. PROPOSITION 62 - UNINCORPORATED LOS ANGELES COUNTY UTILITY USE TAX-Continued
Prior to Measure U, a class action lawsuit was filed against the County in 2005, contending the County’s utility taxes did not meet the requirements of Proposition 62 and were, therefore, invalid. After discussions and tentative agreement with the plaintiffs, the Board authorized a settlement in July 2008, which was finally approved by the Court in March 2009. The monetary provisions of the settlement are estimated at $65 million and liabilities of this amount have been recognized in the government-wide financial statements (governmental activities). Implementation of the settlement agreement is in progress and provides for refunds to class members who filed claims. County management believes there is no additional material exposure for this matter.
20. SUBSEQUENT EVENTS
Tax and Revenue Anticipation Notes ("TRANS")
On July 1, 2009, the County issued $1,300,000,000 in 2009-10 TRANS which will mature on June 30, 2010. The TRANS are collateralized by taxes and other revenues attributable to the 2009-10 fiscal year and were issued in the form of Fixed Rate Notes at an effective interest rate of 0.80%.
Capital Asset Leasing Corporation Lease Revenue Bonds
On November 24, 2009, the Corporation issued Lease Revenue Bonds in the aggregate principal amount of $24,025,000, with an interest rate between 2% and 5%. The proceeds of the Bonds will be used to redeem certain bond anticipation notes, whose proceeds were originally used to finance the acquisition of equipment. The Bonds mature serially December 1st and June 1st each year, and interest is payable on December 1st and June 1st.
Martin Luther King, Jr. Medical Facility
As mentioned in Note 1, Martin Luther King, Jr.-Harbor Hospital was converted to an ambulatory care center in August 2007. A high priority of the Board is to restore inpatient hospital services at this facility’s site. The County has entered negotiations with the University of California (UC) to establish a partnership that would result in a new hospital. On November 19, 2009, the UC Regents approved, in concept, a partnership with the County to reopen the Martin Luther King Jr. medical facility. On December 1, 2009, the Board ratified the conceptual partnership agreement. It is anticipated that inpatient services would commence in 2013.
The proposed partnership would require the County to provide the hospital building facilities, start-up funding, and certain annual operating funding. A new non-profit entity would be created to operate the hospital and its governance structure would consist of a seven-member board of directors. The County and UC would each appoint two directors and work together to jointly appoint the remaining three members.
A formal agreement is required to implement the intent of the County and UC. The legal process by which the new non-profit entity is established remains pending. Additional agreements between each party and the nonprofit entity are also contemplated. The County intends to evaluate the new entity as a future component unit for financial reporting purposes when all legal agreements have been executed.
104

REQUIRED SUPPLEMENTARY INFORMATION (Unaudited)
Los Angeles County Employees Retirement Association Schedule of Funding Progress-Pension Plan
(Dollar amounts in thousands)
Unfunded Actuarial AAL Actuarial Accrued as a Percentage Actuarial Value of Liability (AAL) Unfunded Funded Covered of Covered Valuation Assets - Entry Age AAL Ratio Payroll Payroll Date (a) (b) (b-a) (a/b) (c) ((b-a)/c)
06/30/06 $ 32,819,725 $ 36,258,929 $ 3,439,204 90.5% $5,205,804 66.1%
06/30/07 37,041,832 39,502,456 2,460,624 93.8% 5,615,736 43.8%
06/30/08 39,662,361 41,975,631 2,313,270 94.5% 6,123,888 37.8%
105

REQUIRED SUPPLEMENTARY INFORMATION (Unaudited)
Schedule of Funding Progress-Other Post Employment Benefits (Dollar amounts in thousands)
Retiree Health Care(1)
Unfunded Actuarial AAL Actuarial Accrued as a Percentage Actuarial Value of Liability (AAL) Unfunded Funded Covered of Covered Valuation Assets - Entry Age AAL Ratio Payroll Payroll Date (a) (b) (b-a) (a/b) (c) ((b-a)/c)
July 1, 2006 $ 0 $ 20,301,800 $ 20,301,800 0% $ 5,205,804 389.98%July 1, 2008 0 20,901,600 20,901,600 0% 6,123,888 341.31%
Long-Term Disability(1)
July 1, 2007 $ 0 $ 929,265 $ 929,265 0% $ 5,615,736 16.55%July 1, 2009 0 951,797 951,797 0% 6,123,888 15.54%
(1) There was no data available prior to the first valuation.
106

COUNTY OF LOS ANGELES MAJOR GOVERNMENTAL FUND
GENERAL FUND The General Fund is the general operating fund of the County. It is used to account for all financial
resources except those accounted for in other funds. Revenues are derived from Taxes; Licenses, permits and franchises; Fines, forfeitures and penalties; Revenue from use of money and property; Intergovernmental revenues; Charges for services and Miscellaneous. Expenditures are expended for functions of General government; Public protection; Public ways and facilities; Health and sanitation; Public assistance; Education; Recreation and cultural services; Debt service and Capital outlay.

COUNTY OF LOS ANGELESGENERAL FUNDSCHEDULE OF EXPENDITURES - BUDGET AND ACTUAL ON BUDGETARY BASISFOR THE YEAR ENDED JUNE 30, 2009 (in thousands)
ORIGINAL FINAL ACTUAL ON VARIANCE FROMBUDGET BUDGET BUDGETARY FINAL BUDGET
BASIS OVER (UNDER)GENERAL GOVERNMENT: Salaries and employee benefits 845,047$ 844,297 732,317 (111,980) Services and supplies 1,209,971 1,212,138 536,363 (675,775) Other charges 114,195 129,974 90,539 (39,435) Capital assets 13,661 15,147 7,131 (8,016) Intrafund transfers (587,521) (582,658) (495,869) 86,789
TOTAL GENERAL GOVERNMENT 1,595,353 1,618,898 870,481 (748,417)
PUBLIC PROTECTION: Salaries and employee benefits 3,484,684 3,532,365 3,493,497 (38,868) Services and supplies 927,420 925,869 776,477 (149,392) Other charges 358,390 389,196 367,612 (21,584) Capital assets 45,178 44,683 11,667 (33,016) Intrafund transfers (112,570) (122,468) (82,367) 40,101
TOTAL PUBLIC PROTECTION 4,703,102 4,769,645 4,566,886 (202,759)
HEALTH AND SANITATION: Salaries and employee benefits 966,408 965,635 887,293 (78,342) Services and supplies 1,890,281 1,902,164 1,711,778 (190,386) Other charges 94,477 97,461 92,502 (4,959) Capital assets 13,256 14,528 6,888 (7,640) Intrafund transfers (150,689) (157,343) (135,549) 21,794
TOTAL HEALTH AND SANITATION 2,813,733 2,822,445 2,562,912 (259,533)
PUBLIC ASSISTANCE: Salaries and employee benefits 1,680,518 1,684,447 1,614,256 (70,191) Services and supplies 928,342 937,088 833,191 (103,897) Other charges 2,572,722 2,661,580 2,489,633 (171,947) Capital assets 6,110 6,285 4,546 (1,739) Intrafund transfers (60,718) (65,909) (64,802) 1,107
TOTAL PUBLIC ASSISTANCE 5,126,974 5,223,491 4,876,824 (346,667)
RECREATION AND CULTURAL SERVICES: Salaries and employee benefits 132,596 132,737 128,452 (4,285) Services and supplies 114,521 115,391 107,054 (8,337) Other charges 14,131 14,136 13,017 (1,119) Capital assets 1,013 1,072 625 (447) Intrafund transfers (1,255) (1,255) (1,122) 133
TOTAL RECREATION AND CULTURAL SERVICES 261,006 262,081 248,026 (14,055)
DEBT SERVICE- Interest 9,104 9,104 9,104
CAPITAL OUTLAY 1,350,273 1,207,314 101,254 (1,106,060)
TOTAL GENERAL FUND 15,859,545$ 15,912,978 13,235,487 (2,677,491)
107

108

NONMAJOR GOVERNMENTAL FUNDS

Continued…
COUNTY OF LOS ANGELES NONMAJOR GOVERNMENTAL FUNDS
NONMAJOR SPECIAL REVENUE FUNDS
The Road Fund was established to provide for the maintenance and construction of streets, roads, highways, and bridges. Revenue consists primarily of the County's share of State highway use taxes as supplemented by federal funds, vehicle code fines and charges for services provided to cities.
The Other Streets, Highways, Roads and Bridges Funds: Article 3-Bikeway, Off-Street Parking,
Proposition C Local Return, Special Road Districts, Construction Fee Districts, Transit Operations, Paratransit Operations, and Off Highway License Fee were established to provide for transportation and road related services or functions. Revenues are derived from local sales tax revenue, parking meter receipts, Districts' share of the countywide tax levy, State revenues and service charges to parking lots.
The Street Lighting Districts Funds were established to provide for the installation and maintenance of
street lighting systems. Revenues are derived primarily from the countywide tax levy and benefit assessments.
The Garbage Disposal Districts Funds were established under the provisions of the Health and Safety
Code to provide garbage and refuse collection and disposal services within the boundaries of each District. Revenues are mostly from charges for services and property taxes.
The Sewer Maintenance Districts Funds were established pursuant to the Health and Safety Code for
the administration, maintenance, operation and repair of sanitary sewers, appurtenances, pumping plants, sewer treatment plants and related services. These Districts are financed through sewer service charges.
The Health Services Measure B Fund was established to support a countywide system of Trauma
Centers and Emergency Medical Services, for bioterrorism preparedness and response, and for related administrative costs. Revenues are derived primarily from a voter approved special tax.
The Health & Sanitation Funds: Hospital Services, Physician Services, Statham Alcohol, Alcohol and
Drug Problem, Proposition 36, Driving Under the Influence, AIDS Education, Mental Health Services Act-Proposition 63, Air Quality Improvement, Bicycle Safety Helmet, Hazardous Waste Enforcement, Mission Canyon Closure, and Solid Waste Management Funds were established to offset the cost of emergency services for the indigent, County alcoholism programs and services, AIDS education, mental health services, air quality improvements, bicycle safety, hazardous waste enforcement and solid waste management. Revenues are from State tobacco taxes, patient collections, court fines, State-assessed vehicle fees, State income tax, penalties assessed for hazardous waste violations, and sanitation services.

Continued…
COUNTY OF LOS ANGELES NONMAJOR GOVERNMENTAL FUNDS
NONMAJOR SPECIAL REVENUE FUNDS The Other Public Protection Funds: Jail Store, Inmate Welfare, Narcotic Enforcement, Vehicle Theft
Prevention, Countywide Warrant System, Sheriff's Processing Fees, Training and Automation, Automated Fingerprint Identification System, DNA Identification Fund, District Attorney Asset Forfeiture, Fire Department Developer Fees, Children’s Waiting Room, Oak Forest Mitigation, Information Systems Advisory Body, Drug Abuse Gang Diversion, Jury Operations Improvement, Dependency Court Facilities and Small Claims Advisor Program were established to provide certain services and supplies to inmates, to supplement the cost of various law enforcement and prosecutorial investigation activities, and to finance vehicle replacement, facilities improvement, equipment maintenance and automated systems. Revenues are derived from sale of minor supplies, fines related to controlled substance convictions, benefit assessments, forfeiture of assets used in connection with transportation or possession of a controlled substance and court revenues.
The Public Assistance Funds: Child Abuse/Neglect Prevention Program, Alternate Dispute Resolution
Program, Alcohol and Drug Abuse Education Program, Domestic Violence Program, and Linkages Support Program were established to provide a variety of public assistance services. The programs are financed from special fees collected for birth certificates, marriage licenses, confidential marriage certificates, court fines for driving under the influence of alcohol or drugs, and disabled parking violation assessments.
The Recreation Funds: Golf Course, Park Improvement, Recreation and Development, Tesoro Adobe
Park, San Gabriel Canyon, and Ford Theater were established to provide for maintenance and improvements to County parks and golf courses, public recreation areas, and Ford Theater. Fish and Game was set up for the preservation and propagation of fish and wildlife. Revenues are derived from a percentage of golf course green fees, vehicle entrance fees collected from the regional parks, and local fish and game fines.
The Community Development Commission: The Housing Authority and Community Development
Commission were established to increase the supply of affordable housing, effect community improvements under grant programs and to administer the County's Community Development Block Grant Funds, the County Redevelopment Agency and other County housing related functions. Revenues are derived principally from Federal grants.
The Courthouse Temporary Construction Fund was established to temporarily account for monies
ultimately to be used for various courthouse construction projects. Revenues are derived principally from surcharges included in fines for criminal convictions.

Continued…
COUNTY OF LOS ANGELES NONMAJOR GOVERNMENTAL FUNDS
NONMAJOR SPECIAL REVENUE FUNDS
The Criminal Justice Temporary Construction Fund was established to temporarily account for monies
ultimately to be used for the improvement of criminal justice facilities and automated information systems. Revenues are derived principally from surcharges on criminal fines.
The Registrar-Recorder Improvement Funds: Modernization and Improvement, Micrographics, Social
Security Truncation and Vitals and Health Statistics funds were established for the improvement of Registrar-Recorder automated information systems. Revenues are derived principally from recording and filing fees.
The Other Special Revenue Funds: Information Technology and the Accumulative Capital Outlay
(ACO) were set up for the replacement of motor vehicles, printing, information technology, communications equipment, and helicopters. Asset Development Implementation fund was established to provide short to intermediate financing for County asset development activities. Productivity Investment was established to account for the start-up and incidental costs associated with productivity improvement projects. Civic Center Employee parking was established to provide parking services and alternative means of transportation for County employees. Civic Art Special fund was established to promote civic art projects. Cable TV Franchise was established to fund cable-related activities. Revenues are derived from a percentage of cable franchise fees. Operating transfers are also made from the General Fund to support operations. Public Library Developer Fees were established to acquire land, construct library facilities, and purchase equipment and library materials. Various funds have been established to report resources that are legally restricted and the principal and earnings may be used for purposes that support recreation, cultural, education, and health and sanitation programs.

Continued…
COUNTY OF LOS ANGELES NONMAJOR GOVERNMENTAL FUNDS NONMAJOR DEBT SERVICE FUNDS
The Detention Facilities and Flood Control District Debt Service Funds receive their funds from a voted indebtedness tax levy. The Flood Control District additionally receives operating transfers from the Flood Control District Special Revenue Fund. The Regional Park and Open Space District receives long-term debt proceeds and also receives voter-approved benefit assessments. Joint Powers Authorities-Public Works Financing Authority and Public Buildings receive their funds primarily from the General Fund in the form of operating transfers. The Los Angeles County Securitization Corporation receives funding primarily from the collection of the County’s future tobacco settlement payments and from long-term debt proceeds secured by the County’s Tobacco Assets. During 2008-2009, all bonds related to the Detention Facilities were redeemed and the fund was closed.
Joint Powers Authorities Public Works Financing Authority Public Buildings Disney Parking Project 1998 Disney Parking Refunding Project 2002 Master Refunding Project - Series A 2002 Master Refunding Project - Series B 2005 Master Refunding Project - Series A 2006 Master Refunding Project - Series A 2006 Master Refunding Project - Series B Calabasas Landfill Project - Series 2005 Los Angeles County Securitization Corporation

Continued…
COUNTY OF LOS ANGELES NONMAJOR GOVERNMENTAL FUNDS
NONMAJOR CAPITAL PROJECTS FUNDS
The Capital Projects Funds were established to account for financial resources for the acquisition or
construction of major capital facilities.
Accumulative Capital Outlay Funds have been established in accordance with Government Code Section 53730 for specific capital projects.
Flood Control District projects are financed by general obligation bonds and certificates of
participation. Improvement Districts are financed by contributions from property owners. Public Buildings projects are financed by bonds and operating transfers.
Gap Loan Fund has been established to record the County’s proceeds from sale of “Gap Loan” receivables that are restricted for capital spending purposes.

COUNTY OF LOS ANGELES NONMAJOR GOVERNMENTAL FUNDS
NONMAJOR PERMANENT FUNDS
Permanent Funds have been established to report resources that are legally restricted to the extent that only earnings, and not principal, may be used for purposes that support various County programs.

COUNTY OF LOS ANGELESCOMBINING BALANCE SHEETNONMAJOR GOVERNMENTAL FUNDS - SUMMARYJUNE 30, 2009 (in thousands)
TOTALSPECIAL DEBT CAPITAL NONMAJOR
REVENUE SERVICE PROJECTS PERMANENT GOVERNMENTALFUNDS FUNDS FUNDS FUNDS FUNDS
ASSETSPooled cash and investments:
Operating 1,306,277$ 58,327 200,309 3,019 1,567,932$ Other 55,666 65 451 6 56,188
Total pooled cash and investments 1,361,943 58,392 200,760 3,025 1,624,120 Other investments 126,053 369,777 3,074 106 499,010 Taxes receivable 20,552 628 21,180 Interest receivable 4,414 149 742 12 5,317 Other receivables 105,572 6,310 111,882 Due from other funds 53,175 266,794 10,770 330,739 Advances to other funds 11,034 11,034 Inventories 35,293 35,293 TOTAL ASSETS 1,718,036$ 695,740 221,656 3,143 2,638,575$
LIABILITIES AND FUND BALANCESLIABILITIES:
Accounts payable 40,497$ 4,952 45,449$ Accrued payroll 481 481 Other payables 21,138 492 21,630 Due to other funds 253,843 11,298 124 265,265 Deferred revenue 34,198 507 34,705 Advances payable 10,051 10,051 Third party payor liability 855 855
TOTAL LIABILITIES 361,063 999 16,250 124 378,436
FUND BALANCES:Reserved for:
Encumbrances 160,835 8,227 169,062 Inventories 35,293 35,293 Housing programs 1,618 1,618 Debt service 694,741 694,741 Endowments and annuities 3,019 3,019 Assets unavailable for appropriation 4,913 8,187 13,100
Unreserved, designated for:Budget uncertainties 5,282 5,282 Program expansion 341,914 341,914 Capital projects 60,897 60,897
Unreserved, undesignated, reported in:Special revenue funds 746,221 746,221 Capital projects funds 188,992 188,992
TOTAL FUND BALANCES 1,356,973 694,741 205,406 3,019 2,260,139 TOTAL LIABILITIES AND FUND
BALANCES 1,718,036$ 695,740 221,656 3,143 2,638,575$
109
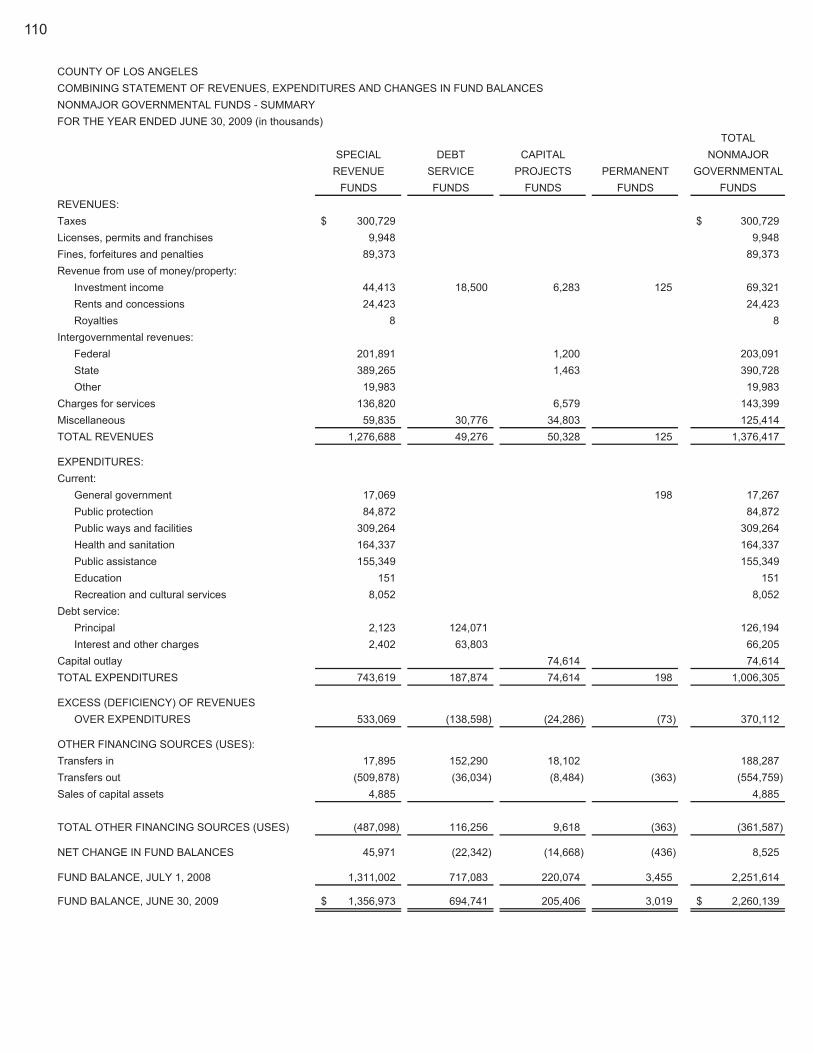
COUNTY OF LOS ANGELESCOMBINING STATEMENT OF REVENUES, EXPENDITURES AND CHANGES IN FUND BALANCES NONMAJOR GOVERNMENTAL FUNDS - SUMMARYFOR THE YEAR ENDED JUNE 30, 2009 (in thousands)
TOTALSPECIAL DEBT CAPITAL NONMAJOR
REVENUE SERVICE PROJECTS PERMANENT GOVERNMENTALFUNDS FUNDS FUNDS FUNDS FUNDS
REVENUES:Taxes 300,729$ 300,729$ Licenses, permits and franchises 9,948 9,948 Fines, forfeitures and penalties 89,373 89,373 Revenue from use of money/property:
Investment income 44,413 18,500 6,283 125 69,321 Rents and concessions 24,423 24,423 Royalties 8 8
Intergovernmental revenues:Federal 201,891 1,200 203,091 State 389,265 1,463 390,728 Other 19,983 19,983
Charges for services 136,820 6,579 143,399 Miscellaneous 59,835 30,776 34,803 125,414 TOTAL REVENUES 1,276,688 49,276 50,328 125 1,376,417
EXPENDITURES:Current:
General government 17,069 198 17,267 Public protection 84,872 84,872 Public ways and facilities 309,264 309,264 Health and sanitation 164,337 164,337 Public assistance 155,349 155,349 Education 151 151 Recreation and cultural services 8,052 8,052
Debt service:Principal 2,123 124,071 126,194 Interest and other charges 2,402 63,803 66,205
Capital outlay 74,614 74,614 TOTAL EXPENDITURES 743,619 187,874 74,614 198 1,006,305
EXCESS (DEFICIENCY) OF REVENUESOVER EXPENDITURES 533,069 (138,598) (24,286) (73) 370,112
OTHER FINANCING SOURCES (USES):Transfers in 17,895 152,290 18,102 188,287 Transfers out (509,878) (36,034) (8,484) (363) (554,759) Sales of capital assets 4,885 4,885
TOTAL OTHER FINANCING SOURCES (USES) (487,098) 116,256 9,618 (363) (361,587)
NET CHANGE IN FUND BALANCES 45,971 (22,342) (14,668) (436) 8,525
FUND BALANCE, JULY 1, 2008 1,311,002 717,083 220,074 3,455 2,251,614
FUND BALANCE, JUNE 30, 2009 1,356,973$ 694,741 205,406 3,019 2,260,139$
110

111

COUNTY OF LOS ANGELESCOMBINING BALANCE SHEETNONMAJOR GOVERNMENTAL FUNDS - SPECIAL REVENUEJUNE 30, 2009 (in thousands)
Street Garbage SewerLighting Disposal Maintenance
Road Other Districts Districts DistrictsASSETSPooled cash and investments: Operating 144,492$ 143,212 57,449 20,865 12,553 Other 14,332 525 788 589 787 Total pooled cash and investments 158,824 143,737 58,237 21,454 13,340 Other investmentsTaxes receivable 632 2,561 2,074 1,563 Interest receivable 570 552 220 81 55 Other receivables 51,949 13,451 7 1,443 1,253 Due from other funds 13,637 960 5,043 20 1,896 Advances to other funds 8,649 765 222 1,067 InventoriesTOTAL ASSETS 233,629$ 160,097 66,290 25,072 19,174
LIABILITIES AND FUND BALANCESLIABILITIES: Accounts payable 8,192$ 5,944 1,475 186 173 Accrued payroll Other payables 305 2,872 215 Due to other funds 21,061 3,614 5,319 52 2,456 Deferred revenue 17,846 911 1,715 2,392 1,774 Advances payable 10,051 Third party payor liability 855 TOTAL LIABILITIES 58,310 13,341 8,509 2,630 4,618
FUND BALANCES:Reserved for: Encumbrances 55,390 50,839 13 1,669 1,204 Inventories Housing programs Assets unavailable for appropriation 3,018 809 Unreserved, designated for: Budget uncertainties Program expansion 19,091 25,679 4,550 16,126 Capital projects 60,897 Unreserved, undesignated 36,923 70,238 53,218 4,647 12,543 TOTAL FUND BALANCES 175,319 146,756 57,781 22,442 14,556
TOTAL LIABILITIES AND FUND BALANCES 233,629$ 160,097 66,290 25,072 19,174
Streets, Highways,Roads and Bridges
112
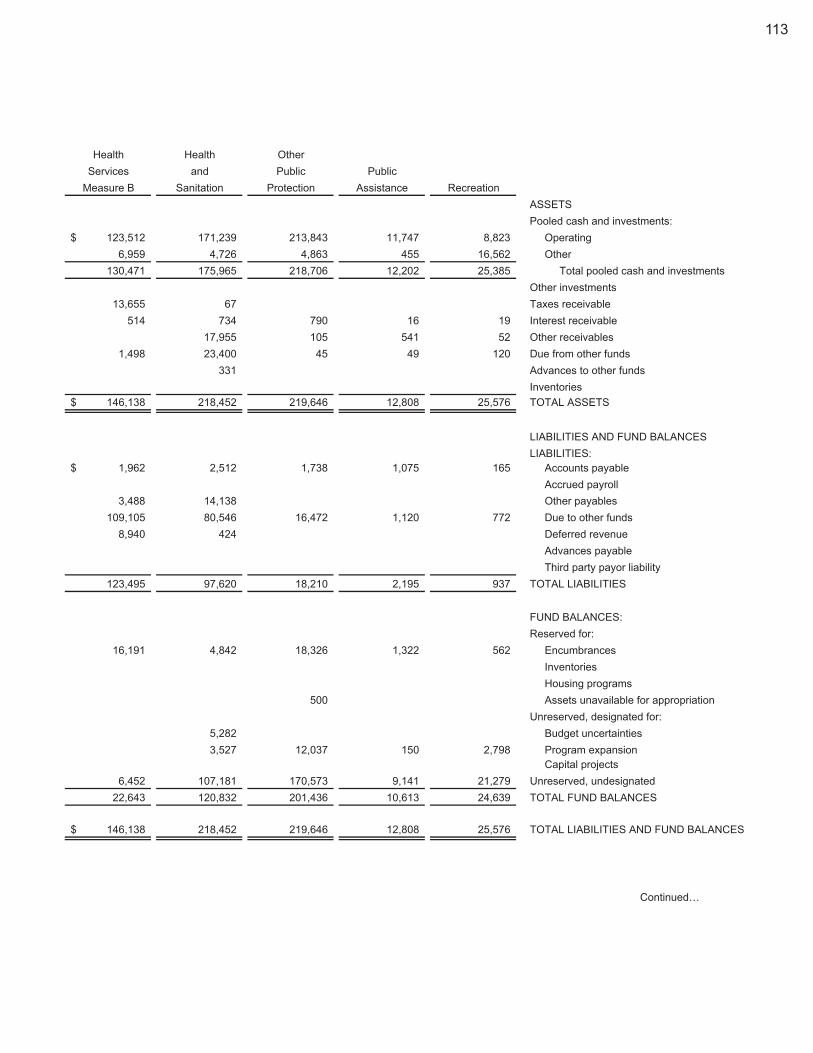
Health Health OtherServices and Public Public
Measure B Sanitation Protection Assistance RecreationASSETSPooled cash and investments:
123,512$ 171,239 213,843 11,747 8,823 Operating6,959 4,726 4,863 455 16,562 Other
130,471 175,965 218,706 12,202 25,385 Total pooled cash and investmentsOther investments
13,655 67 Taxes receivable514 734 790 16 19 Interest receivable
17,955 105 541 52 Other receivables1,498 23,400 45 49 120 Due from other funds
331 Advances to other fundsInventories
146,138$ 218,452 219,646 12,808 25,576 TOTAL ASSETS
LIABILITIES AND FUND BALANCESLIABILITIES:
1,962$ 2,512 1,738 1,075 165 Accounts payable Accrued payroll
3,488 14,138 Other payables109,105 80,546 16,472 1,120 772 Due to other funds
8,940 424 Deferred revenue Advances payable Third party payor liability
123,495 97,620 18,210 2,195 937 TOTAL LIABILITIES
FUND BALANCES:Reserved for:
16,191 4,842 18,326 1,322 562 Encumbrances Inventories Housing programs
500 Assets unavailable for appropriation Unreserved, designated for:
5,282 Budget uncertainties3,527 12,037 150 2,798 Program expansion
Capital projects6,452 107,181 170,573 9,141 21,279 Unreserved, undesignated
22,643 120,832 201,436 10,613 24,639 TOTAL FUND BALANCES
146,138$ 218,452 219,646 12,808 25,576 TOTAL LIABILITIES AND FUND BALANCES
Continued…
113

COUNTY OF LOS ANGELESCOMBINING BALANCE SHEET - ContinuedNONMAJOR GOVERNMENTAL FUNDS - SPECIAL REVENUEJUNE 30, 2009 (in thousands)
CriminalCommunity Courthouse Justice Registrar Other
Development Temporary Temporary Recorder SpecialCommission Construction Construction Improvement Revenue Total
ASSETSPooled cash and investments: Operating 121,426$ 74,407 62,158 24,614 115,937 1,306,277$ Other 2,033 2,267 530 250 55,666 Total pooled cash and investments 121,426 76,440 64,425 25,144 116,187 1,361,943 Other investments 126,053 126,053 Taxes receivable 20,552 Interest receivable 288 239 336 4,414 Other receivables 18,433 144 239 105,572 Due from other funds 622 512 3,586 1,787 53,175 Advances to other funds 11,034 Inventories 35,293 35,293 TOTAL ASSETS 301,827$ 76,728 65,176 28,874 118,549 1,718,036$
LIABILITIES AND FUND BALANCESLIABILITIES: Accounts payable 15,979$ 1,096 40,497$ Accrued payroll 481 481 Other payables 120 21,138 Due to other funds 550 1,766 6,300 2,703 2,007 253,843 Deferred revenue 196 34,198 Advances payable 10,051 Third party payor liability 855 TOTAL LIABILITIES 16,845 1,766 6,300 2,703 3,584 361,063
FUND BALANCES:Reserved for: Encumbrances 10,477 160,835 Inventories 35,293 35,293 Housing programs 1,618 1,618 Assets unavailable for appropriation 586 4,913 Unreserved, designated for: Budget uncertainties 5,282 Program expansion 247,485 164 10,307 341,914 Capital projects 60,897 Unreserved, undesignated 74,962 58,876 26,007 94,181 746,221 TOTAL FUND BALANCES 284,982 74,962 58,876 26,171 114,965 1,356,973
TOTAL LIABILITIES AND FUND BALANCES 301,827$ 76,728 65,176 28,874 118,549 1,718,036$
114

115

COUNTY OF LOS ANGELESCOMBINING STATEMENT OF REVENUES, EXPENDITURES AND CHANGES IN FUND BALANCESNONMAJOR GOVERNMENTAL FUNDS - SPECIAL REVENUEFOR THE YEAR ENDED JUNE 30, 2009 (in thousands)
Street Garbage SewerLighting Disposal Maintenance
Road Other Districts Districts DistrictsREVENUES:Taxes 4,635$ 35,870 19,529 5,221 Licenses, permits and franchises 3,416 Fines, forfeitures and penalties 59 278 385 347 Revenue from use of money/property: Investment income 4,758 4,545 1,636 536 359 Rents and concessions 13 149 RoyaltiesIntergovernmental revenues: Federal 31,846 2,950 State 165,553 271 167 42 Other 3,463 13,848 337 28 Charges for services 26,444 308 4,782 19,499 30,847 Miscellaneous 302 9 489 9 TOTAL REVENUES 240,430 58,009 27,218 25,683 31,590
EXPENDITURES:Current: General government Public protection Public ways and facilities 215,126 72,112 22,026 Health and sanitation 22,037 27,462 Public assistance Education Recreation and cultural servicesDebt service: Principal Interest and other chargesTOTAL EXPENDITURES 215,126 72,112 22,026 22,037 27,462
EXCESS (DEFICIENCY) OF REVENUES OVER EXPENDITURES 25,304 (14,103) 5,192 3,646 4,128
OTHER FINANCING SOURCES (USES):Transfers in 500 Transfers out (2,024) (597) (156) Sales of capital assets 152 18 TOTAL OTHER FINANCING SOURCES (USES) (1,872) (79) (156)
NET CHANGE IN FUND BALANCES 23,432 (14,182) 5,192 3,646 3,972
FUND BALANCE, JULY 1, 2008 151,887 160,938 52,589 18,796 10,584
FUND BALANCE, JUNE 30, 2009 175,319$ 146,756 57,781 22,442 14,556
Streets, Highways,Roads and Bridges
116

Health Health OtherServices and Public Public
Measure B Sanitation Protection Assistance RecreationREVENUES:
231,339$ Taxes2,581 1,336 15 Licenses, permits and franchises
1,471 26,599 12,287 2,228 20 Fines, forfeitures and penaltiesRevenue from use of money/property:
3,042 5,860 5,772 98 148 Investment income2 18,148 429 Rents and concessions
RoyaltiesIntergovernmental revenues:
47 Federal208,053 15,179 State
1,126 1,181 Other17,711 14,814 3,475 4,836 Charges for services3,318 27,407 3,280 2,756 Miscellaneous
235,852 265,250 94,835 10,417 8,204 TOTAL REVENUES
EXPENDITURES:Current: General government
64,014 Public protection Public ways and facilities
43,694 70,894 Health and sanitation6,629 Public assistance
Education7,659 Recreation and cultural services
Debt service: Principal Interest and other charges
43,694 70,894 64,014 6,629 7,659 TOTAL EXPENDITURES
EXCESS (DEFICIENCY) OF REVENUES192,158 194,356 30,821 3,788 545 OVER EXPENDITURES
OTHER FINANCING SOURCES (USES):3,633 30 Transfers in
(216,566) (212,155) (18,345) (2,499) (587) Transfers out63 Sales of capital assets
TOTAL OTHER FINANCING SOURCES(216,566) (212,155) (14,649) (2,499) (557) (USES)
(24,408) (17,799) 16,172 1,289 (12) NET CHANGE IN FUND BALANCES
47,051 138,631 185,264 9,324 24,651 FUND BALANCE, JULY 1, 2008
22,643$ 120,832 201,436 10,613 24,639 FUND BALANCE, JUNE 30, 2009
Continued…
117

COUNTY OF LOS ANGELESCOMBINING STATEMENT OF REVENUES, EXPENDITURES AND CHANGES IN FUND BALANCES - ContinuedNONMAJOR GOVERNMENTAL FUNDS - SPECIAL REVENUEFOR THE YEAR ENDED JUNE 30, 2009 (in thousands)
CriminalCommunity Courthouse Justice Registrar Other
Development Temporary Temporary Recorder SpecialCommission Construction Construction Improvement Revenue Total
REVENUES:Taxes 4,135$ 300,729$ Licenses, permits and franchises 2,600 9,948 Fines, forfeitures and penalties 21,176 24,523 89,373 Revenue from use of money/property: Investment income 10,701 2,435 1,814 2,709 44,413 Rents and concessions 1,218 45 4,419 24,423 Royalties 8 8 Intergovernmental revenues: Federal 167,048 201,891 State 389,265 Other 19,983 Charges for services 11,761 2,343 136,820 Miscellaneous 21,738 527 59,835 TOTAL REVENUES 204,840 23,656 26,337 11,761 12,606 1,276,688
EXPENDITURES:Current: General government 17,069 17,069 Public protection 1,819 13,096 5,943 84,872 Public ways and facilities 309,264 Health and sanitation 250 164,337 Public assistance 148,720 155,349 Education 151 151 Recreation and cultural services 393 8,052 Debt service: Principal 2,123 2,123 Interest and other charges 2,402 2,402 TOTAL EXPENDITURES 153,245 1,819 13,096 23,806 743,619
EXCESS (DEFICIENCY) OF REVENUES OVER EXPENDITURES 51,595 21,837 13,241 11,761 (11,200) 533,069
OTHER FINANCING SOURCES (USES):Transfers in 265 13,467 17,895 Transfers out (3,283) (26,577) (7,004) (14,843) (5,242) (509,878) Sales of capital assets 4,652 4,885 TOTAL OTHER FINANCING SOURCES (USES) (3,018) (26,577) (7,004) (14,843) 12,877 (487,098)
NET CHANGE IN FUND BALANCES 48,577 (4,740) 6,237 (3,082) 1,677 45,971
FUND BALANCE, JULY 1, 2008 236,405 79,702 52,639 29,253 113,288 1,311,002
FUND BALANCE, JUNE 30, 2009 284,982$ 74,962 58,876 26,171 114,965 1,356,973$
118
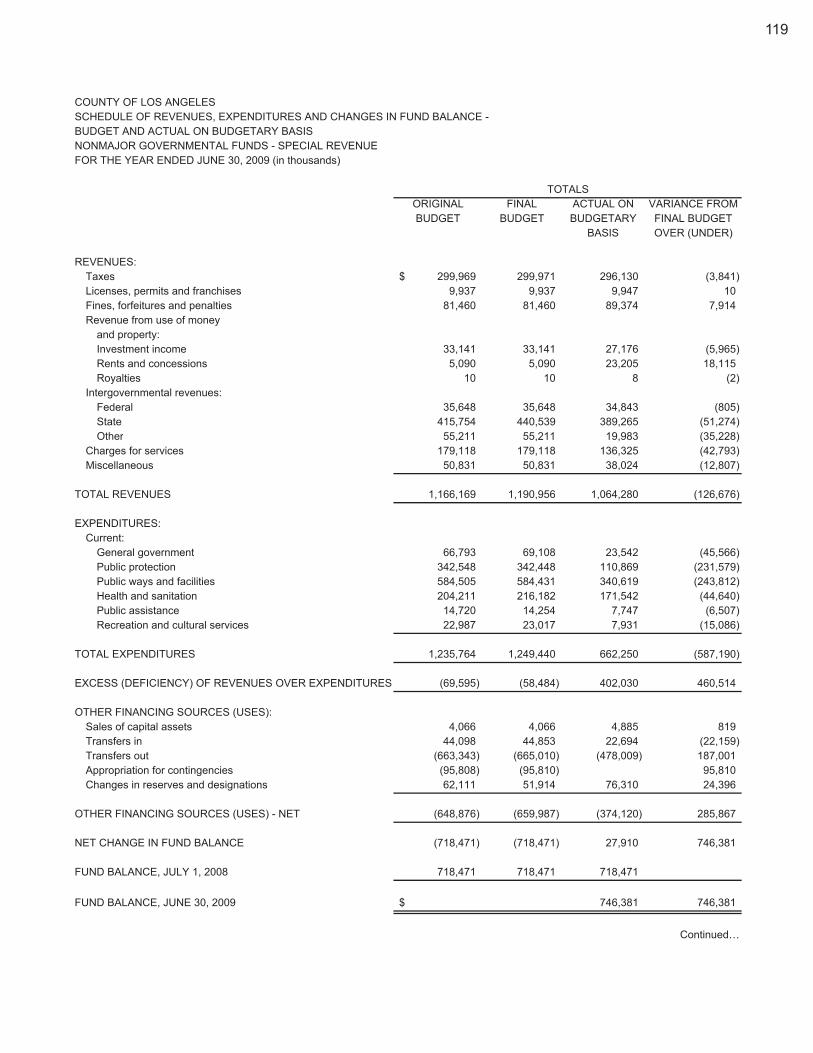
COUNTY OF LOS ANGELESSCHEDULE OF REVENUES, EXPENDITURES AND CHANGES IN FUND BALANCE -BUDGET AND ACTUAL ON BUDGETARY BASISNONMAJOR GOVERNMENTAL FUNDS - SPECIAL REVENUEFOR THE YEAR ENDED JUNE 30, 2009 (in thousands)
ORIGINAL FINAL ACTUAL ON VARIANCE FROMBUDGET BUDGET BUDGETARY FINAL BUDGET
BASIS OVER (UNDER)
REVENUES:Taxes 299,969$ 299,971 296,130 (3,841)Licenses, permits and franchises 9,937 9,937 9,947 10Fines, forfeitures and penalties 81,460 81,460 89,374 7,914Revenue from use of money
and property:Investment income 33,141 33,141 27,176 (5,965)Rents and concessions 5,090 5,090 23,205 18,115Royalties 10 10 8 (2)
Intergovernmental revenues:Federal 35,648 35,648 34,843 (805)State 415,754 440,539 389,265 (51,274)Other 55,211 55,211 19,983 (35,228)
Charges for services 179,118 179,118 136,325 (42,793)Miscellaneous 50,831 50,831 38,024 (12,807)
TOTAL REVENUES 1,166,169 1,190,956 1,064,280 (126,676)
EXPENDITURES:Current:
General government 66,793 69,108 23,542 (45,566)Public protection 342,548 342,448 110,869 (231,579)Public ways and facilities 584,505 584,431 340,619 (243,812)Health and sanitation 204,211 216,182 171,542 (44,640)Public assistance 14,720 14,254 7,747 (6,507)Recreation and cultural services 22,987 23,017 7,931 (15,086)
TOTAL EXPENDITURES 1,235,764 1,249,440 662,250 (587,190)
EXCESS (DEFICIENCY) OF REVENUES OVER EXPENDITURES (69,595) (58,484) 402,030 460,514
OTHER FINANCING SOURCES (USES):Sales of capital assets 4,066 4,066 4,885 819Transfers in 44,098 44,853 22,694 (22,159)Transfers out (663,343) (665,010) (478,009) 187,001Appropriation for contingencies (95,808) (95,810) 95,810Changes in reserves and designations 62,111 51,914 76,310 24,396
OTHER FINANCING SOURCES (USES) - NET (648,876) (659,987) (374,120) 285,867
NET CHANGE IN FUND BALANCE (718,471) (718,471) 27,910 746,381
FUND BALANCE, JULY 1, 2008 718,471 718,471 718,471
FUND BALANCE, JUNE 30, 2009 $ 746,381 746,381
Continued…
TOTALS
119
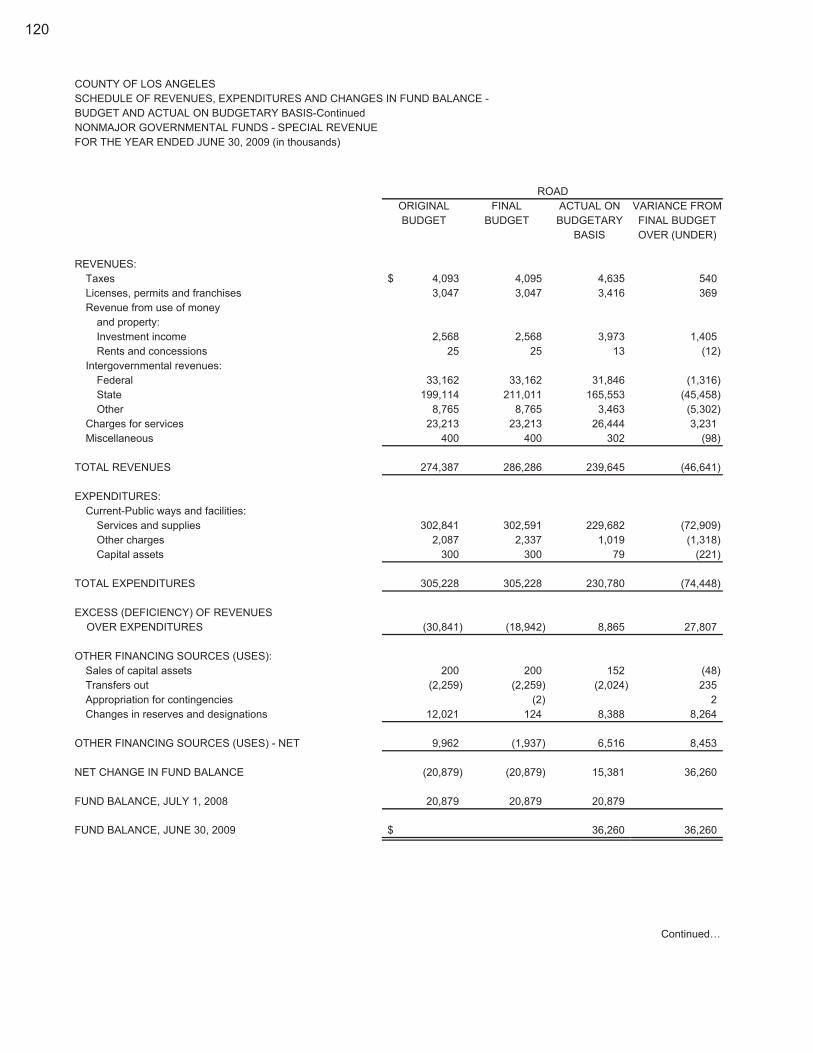
COUNTY OF LOS ANGELESSCHEDULE OF REVENUES, EXPENDITURES AND CHANGES IN FUND BALANCE -BUDGET AND ACTUAL ON BUDGETARY BASIS-ContinuedNONMAJOR GOVERNMENTAL FUNDS - SPECIAL REVENUEFOR THE YEAR ENDED JUNE 30, 2009 (in thousands)
ORIGINAL FINAL ACTUAL ON VARIANCE FROMBUDGET BUDGET BUDGETARY FINAL BUDGET
BASIS OVER (UNDER)
REVENUES:Taxes 4,093$ 4,095 4,635 540 Licenses, permits and franchises 3,047 3,047 3,416 369 Revenue from use of money
and property:Investment income 2,568 2,568 3,973 1,405 Rents and concessions 25 25 13 (12)
Intergovernmental revenues:Federal 33,162 33,162 31,846 (1,316) State 199,114 211,011 165,553 (45,458) Other 8,765 8,765 3,463 (5,302)
Charges for services 23,213 23,213 26,444 3,231 Miscellaneous 400 400 302 (98)
TOTAL REVENUES 274,387 286,286 239,645 (46,641)
EXPENDITURES:Current-Public ways and facilities:
Services and supplies 302,841 302,591 229,682 (72,909) Other charges 2,087 2,337 1,019 (1,318) Capital assets 300 300 79 (221)
TOTAL EXPENDITURES 305,228 305,228 230,780 (74,448)
EXCESS (DEFICIENCY) OF REVENUES OVER EXPENDITURES (30,841) (18,942) 8,865 27,807
OTHER FINANCING SOURCES (USES):Sales of capital assets 200 200 152 (48) Transfers out (2,259) (2,259) (2,024) 235 Appropriation for contingencies (2) 2 Changes in reserves and designations 12,021 124 8,388 8,264
OTHER FINANCING SOURCES (USES) - NET 9,962 (1,937) 6,516 8,453
NET CHANGE IN FUND BALANCE (20,879) (20,879) 15,381 36,260
FUND BALANCE, JULY 1, 2008 20,879 20,879 20,879
FUND BALANCE, JUNE 30, 2009 $ 36,260 36,260
Continued…
ROAD
120

COUNTY OF LOS ANGELESSCHEDULE OF REVENUES, EXPENDITURES AND CHANGES IN FUND BALANCE -BUDGET AND ACTUAL ON BUDGETARY BASIS-ContinuedNONMAJOR GOVERNMENTAL FUNDS - SPECIAL REVENUEFOR THE YEAR ENDED JUNE 30, 2009 (in thousands)
ORIGINAL FINAL ACTUAL ON VARIANCE FROMBUDGET BUDGET BUDGETARY FINAL BUDGET
BASIS OVER (UNDER)
REVENUES:Taxes 39,728$ 39,728 35,800 (3,928) Fines, forfeitures and penalties 35 35 60 25 Revenue from use of money
and property:Investment income 5,128 5,128 3,719 (1,409) Rents and concessions 160 160 149 (11)
Intergovernmental revenues:Federal 2,486 2,486 2,950 464 State 389 389 271 (118) Other 44,328 44,328 13,848 (30,480)
Charges for services 42,274 42,274 308 (41,966) Miscellaneous 9 9
TOTAL REVENUES 134,528 134,528 57,114 (77,414)
EXPENDITURES:Current-Public ways and facilities:
Services and supplies 199,547 199,398 86,717 (112,681) Other charges 7,567 7,642 75 (7,567) Capital assets 2,802 2,802 1,011 (1,791)
TOTAL EXPENDITURES 209,916 209,842 87,803 (122,039)
DEFICIENCY OF REVENUES OVER EXPENDITURES (75,388) (75,314) (30,689) 44,625
OTHER FINANCING SOURCES (USES):Sales of capital assets 18 18 Transfers in 21,500 21,500 500 (21,000) Transfers out (21,845) (21,919) (597) 21,322 Appropriation for contingencies (17,536) (17,536) 17,536 Changes in reserves and designations (2,259) (2,259) 4,982 7,241
OTHER FINANCING SOURCES (USES) - NET (20,140) (20,214) 4,903 25,117
NET CHANGE IN FUND BALANCE (95,528) (95,528) (25,786) 69,742
FUND BALANCE, JULY 1, 2008 95,528 95,528 95,528
FUND BALANCE, JUNE 30, 2009 $ 69,742 69,742
Continued…
OTHER STREETS, HIGHWAYS, ROADS, AND BRIDGES
121

COUNTY OF LOS ANGELESSCHEDULE OF REVENUES, EXPENDITURES AND CHANGES IN FUND BALANCE -BUDGET AND ACTUAL ON BUDGETARY BASIS-ContinuedNONMAJOR GOVERNMENTAL FUNDS - SPECIAL REVENUEFOR THE YEAR ENDED JUNE 30, 2009 (in thousands)
ORIGINAL FINAL ACTUAL ON VARIANCE FROMBUDGET BUDGET BUDGETARY FINAL BUDGET
BASIS OVER (UNDER)
REVENUES:Taxes 18,621$ 18,621 19,217 596 Fines, forfeitures and penalties 102 102 278 176 Revenue from use of money
and property-Investment income 2,145 2,145 1,315 (830)
Intergovernmental revenues:State 154 154 167 13 Other 484 484 337 (147)
Charges for services 4,516 4,516 4,782 266 Miscellaneous 489 489
TOTAL REVENUES 26,022 26,022 26,585 563
EXPENDITURES:Current-Public ways and facilities:
Services and supplies 69,341 69,341 22,019 (47,322) Capital assets 20 20 17 (3)
TOTAL EXPENDITURES 69,361 69,361 22,036 (47,325)
EXCESS (DEFICIENCY) OF REVENUES OVER EXPENDITURES (43,339) (43,339) 4,549 47,888
OTHER FINANCING SOURCES (USES):Transfers in 5,106 5,106 4,991 (115) Transfers out (5,106) (5,106) (4,991) 115 Appropriation for contingencies (5,693) (5,693) 5,693 Changes in reserves and designations 1,254 1,254 1,278 24
OTHER FINANCING SOURCES (USES) - NET (4,439) (4,439) 1,278 5,717
NET CHANGE IN FUND BALANCE (47,778) (47,778) 5,827 53,605
FUND BALANCE, JULY 1, 2008 47,778 47,778 47,778
FUND BALANCE, JUNE 30, 2009 $ 53,605 53,605
Continued…
STREET LIGHTING DISTRICTS
122

COUNTY OF LOS ANGELESSCHEDULE OF REVENUES, EXPENDITURES AND CHANGES IN FUND BALANCE -BUDGET AND ACTUAL ON BUDGETARY BASIS-ContinuedNONMAJOR GOVERNMENTAL FUNDS - SPECIAL REVENUEFOR THE YEAR ENDED JUNE 30, 2009 (in thousands)
ORIGINAL FINAL ACTUAL ON VARIANCE FROMBUDGET BUDGET BUDGETARY FINAL BUDGET
BASIS OVER (UNDER)
REVENUES:Taxes 5,067$ 5,067 5,174 107 Fines, forfeitures and penalties 215 215 385 170 Revenue from use of money
and property-Investment income 890 890 420 (470)
Intergovernmental revenues-State 39 39 42 3
Charges for services 19,256 19,256 19,202 (54)
TOTAL REVENUES 25,467 25,467 25,223 (244)
EXPENDITURES:Current-Health and sanitation-
Services and supplies 24,513 24,513 22,269 (2,244)
TOTAL EXPENDITURES 24,513 24,513 22,269 (2,244)
EXCESS OF REVENUES OVER EXPENDITURES 954 954 2,954 2,000
OTHER FINANCING SOURCES (USES):Appropriation for contingencies (3,153) (3,153) 3,153 Changes in reserves and designations (3,806) (3,806) (3,660) 146
OTHER FINANCING SOURCES (USES) - NET (6,959) (6,959) (3,660) 3,299
NET CHANGE IN FUND BALANCE (6,005) (6,005) (706) 5,299
FUND BALANCE, JULY 1, 2008 6,005 6,005 6,005
FUND BALANCE, JUNE 30, 2009 $ 5,299 5,299
Continued…
GARBAGE DISPOSAL DISTRICTS
123

COUNTY OF LOS ANGELESSCHEDULE OF REVENUES, EXPENDITURES AND CHANGES IN FUND BALANCE -BUDGET AND ACTUAL ON BUDGETARY BASIS-ContinuedNONMAJOR GOVERNMENTAL FUNDS - SPECIAL REVENUEFOR THE YEAR ENDED JUNE 30, 2009 (in thousands)
ORIGINAL FINAL ACTUAL ON VARIANCE FROMBUDGET BUDGET BUDGETARY FINAL BUDGET
BASIS OVER (UNDER)
REVENUES: Fines, forfeitures and penalties 152$ 152 348 196 Revenue from use of money and property- Investment income 527 527 291 (236) Intergovernmental revenues- Other 15 15 28 13 Charges for services 30,927 30,927 30,661 (266) Miscellaneous 9 9
TOTAL REVENUES 31,621 31,621 31,337 (284)
EXPENDITURES: Current-Health and sanitation: Services and supplies 38,452 37,713 27,169 (10,544) Other charges 295 1,034 1,031 (3) Capital assets 113 113 (113)
TOTAL EXPENDITURES 38,860 38,860 28,200 (10,660)
EXCESS (DEFICIENCY) OF REVENUES OVER EXPENDITURES (7,239) (7,239) 3,137 10,376
OTHER FINANCING SOURCES (USES):Transfers out (470) (470) (156) 314 Appropriation for contingencies (2,499) (2,499) 2,499 Changes in reserves and designations 954 954 1,545 591
OTHER FINANCING SOURCES (USES) - NET (2,015) (2,015) 1,389 3,404
NET CHANGE IN FUND BALANCE (9,254) (9,254) 4,526 13,780
FUND BALANCE, JULY 1, 2008 9,254 9,254 9,254
FUND BALANCE, JUNE 30, 2009 $ 13,780 13,780
Continued…
SEWER MAINTENANCE DISTRICTS
124

COUNTY OF LOS ANGELESSCHEDULE OF REVENUES, EXPENDITURES AND CHANGES IN FUND BALANCE -BUDGET AND ACTUAL ON BUDGETARY BASIS-ContinuedNONMAJOR GOVERNMENTAL FUNDS - SPECIAL REVENUEFOR THE YEAR ENDED JUNE 30, 2009 (in thousands)
ORIGINAL FINAL ACTUAL ON VARIANCE FROMBUDGET BUDGET BUDGETARY FINAL BUDGET
BASIS OVER (UNDER)
REVENUES: Taxes 232,460$ 232,460 231,304 (1,156) Fines, forfeitures and penalties 1,471 1,471 Revenue from use of money and property- Investment income 4,000 4,000 2,349 (1,651)
TOTAL REVENUES 236,460 236,460 235,124 (1,336)
EXPENDITURES: Current-Health and sanitation: Services and supplies 26,744 26,744 23,580 (3,164) Other charges 26,572 26,572 24,224 (2,348)
TOTAL EXPENDITURES 53,316 53,316 47,804 (5,512)
EXCESS OF REVENUES OVER EXPENDITURES 183,144 183,144 187,320 4,176
OTHER FINANCING SOURCES (USES): Transfers out (216,603) (216,603) (216,565) 38 Appropriation for contingencies (3,978) (3,978) 3,978 Changes in reserves and designations 1,699 1,699
OTHER FINANCING SOURCES (USES) - NET (220,581) (220,581) (214,866) 5,715
NET CHANGE IN FUND BALANCE (37,437) (37,437) (27,546) 9,891
FUND BALANCE, JULY 1, 2008 37,437 37,437 37,437
FUND BALANCE, JUNE 30, 2009 $ 9,891 9,891
Continued…
HEALTH SERVICES MEASURE B
125
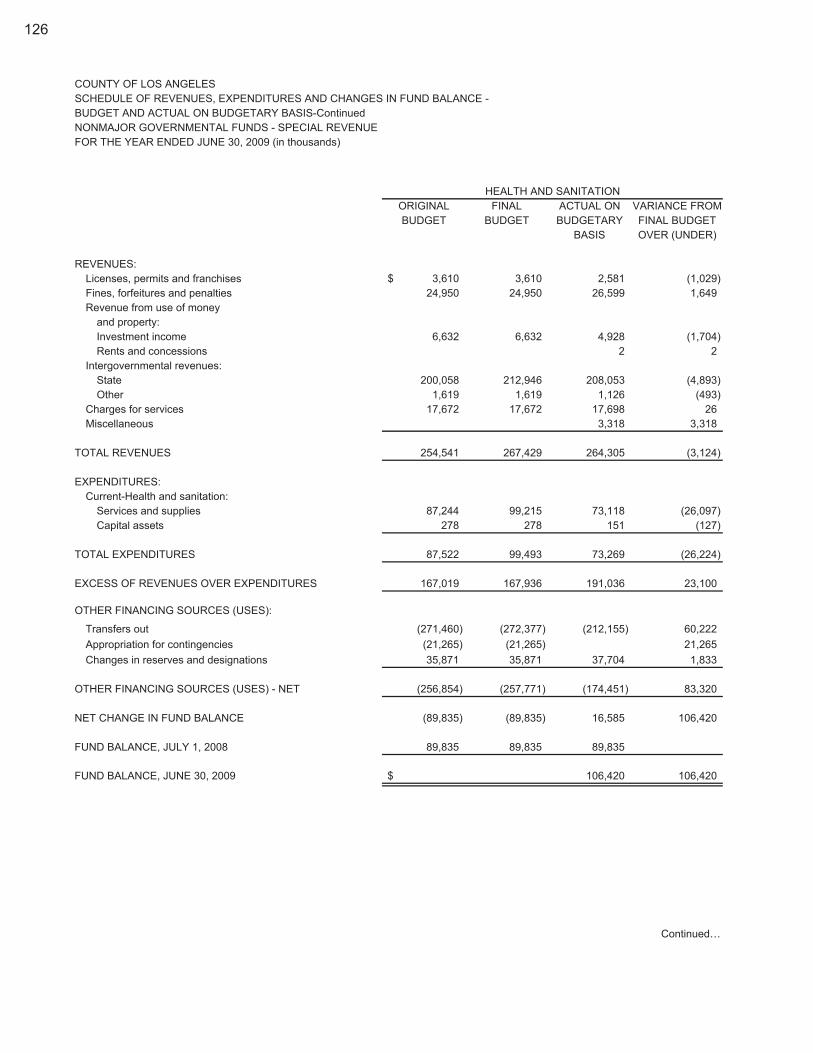
COUNTY OF LOS ANGELESSCHEDULE OF REVENUES, EXPENDITURES AND CHANGES IN FUND BALANCE -BUDGET AND ACTUAL ON BUDGETARY BASIS-ContinuedNONMAJOR GOVERNMENTAL FUNDS - SPECIAL REVENUEFOR THE YEAR ENDED JUNE 30, 2009 (in thousands)
ORIGINAL FINAL ACTUAL ON VARIANCE FROMBUDGET BUDGET BUDGETARY FINAL BUDGET
BASIS OVER (UNDER)
REVENUES:Licenses, permits and franchises 3,610$ 3,610 2,581 (1,029) Fines, forfeitures and penalties 24,950 24,950 26,599 1,649 Revenue from use of money
and property:Investment income 6,632 6,632 4,928 (1,704) Rents and concessions 2 2
Intergovernmental revenues:State 200,058 212,946 208,053 (4,893) Other 1,619 1,619 1,126 (493)
Charges for services 17,672 17,672 17,698 26 Miscellaneous 3,318 3,318
TOTAL REVENUES 254,541 267,429 264,305 (3,124)
EXPENDITURES:Current-Health and sanitation:
Services and supplies 87,244 99,215 73,118 (26,097) Capital assets 278 278 151 (127)
TOTAL EXPENDITURES 87,522 99,493 73,269 (26,224)
EXCESS OF REVENUES OVER EXPENDITURES 167,019 167,936 191,036 23,100
OTHER FINANCING SOURCES (USES):
Transfers out (271,460) (272,377) (212,155) 60,222 Appropriation for contingencies (21,265) (21,265) 21,265 Changes in reserves and designations 35,871 35,871 37,704 1,833
OTHER FINANCING SOURCES (USES) - NET (256,854) (257,771) (174,451) 83,320
NET CHANGE IN FUND BALANCE (89,835) (89,835) 16,585 106,420
FUND BALANCE, JULY 1, 2008 89,835 89,835 89,835
FUND BALANCE, JUNE 30, 2009 $ 106,420 106,420
Continued…
HEALTH AND SANITATION
126

COUNTY OF LOS ANGELESSCHEDULE OF REVENUES, EXPENDITURES AND CHANGES IN FUND BALANCE -BUDGET AND ACTUAL ON BUDGETARY BASIS-ContinuedNONMAJOR GOVERNMENTAL FUNDS - SPECIAL REVENUEFOR THE YEAR ENDED JUNE 30, 2009 (in thousands)
ORIGINAL FINAL ACTUAL ON VARIANCE FROMBUDGET BUDGET BUDGETARY FINAL BUDGET
BASIS OVER (UNDER)
REVENUES:Licenses, permits and franchises 7$ 7 (7) Fines, forfeitures and penalties 11,400 11,400 12,287 887 Revenue from use of money
and property:Investment income 5,940 5,940 4,566 (1,374) Rents and concessions 18,149 18,149
Intergovernmental revenues:Federal 47 47 State 16,000 16,000 15,179 (821) Other 1,181 1,181
Charges for services 13,910 13,910 14,814 904 Miscellaneous 44,643 44,643 27,407 (17,236)
TOTAL REVENUES 91,900 91,900 93,630 1,730
EXPENDITURES:Current-Public protection:
Services and supplies 142,993 142,393 53,016 (89,377) Other charges 3,633 3,633 3,630 (3) Capital assets 33,369 33,869 9,361 (24,508)
TOTAL EXPENDITURES 179,995 179,895 66,007 (113,888)
EXCESS (DEFICIENCY) OF REVENUES OVER EXPENDITURES (88,095) (87,995) 27,623 115,618
OTHER FINANCING SOURCES (USES):Sales of capital assets 60 60 63 3 Transfers in 3,633 3,633 3,633 Transfers out (44,526) (44,626) (14,717) 29,909 Appropriation for contingencies (21,133) (21,133) 21,133 Changes in reserves and designations (1,865) (1,865) 1,065 2,930
OTHER FINANCING SOURCES (USES) - NET (63,831) (63,931) (9,956) 53,975
NET CHANGE IN FUND BALANCE (151,926) (151,926) 17,667 169,593
FUND BALANCE, JULY 1, 2008 151,926 151,926 151,926
FUND BALANCE, JUNE 30, 2009 $ 169,593 169,593
Continued…
OTHER PUBLIC PROTECTION
127

COUNTY OF LOS ANGELESSCHEDULE OF REVENUES, EXPENDITURES AND CHANGES IN FUND BALANCE -BUDGET AND ACTUAL ON BUDGETARY BASIS-ContinuedNONMAJOR GOVERNMENTAL FUNDS - SPECIAL REVENUEFOR THE YEAR ENDED JUNE 30, 2009 (in thousands)
ORIGINAL FINAL ACTUAL ON VARIANCE FROMBUDGET BUDGET BUDGETARY FINAL BUDGET
BASIS OVER (UNDER)
REVENUES:Licenses, permits and franchises 1,195$ 1,195 1,336 141 Fines, forfeitures and penalties 2,016 2,016 2,228 212 Revenue from use of money
and property-
Investment income 33 33 33 Charges for services 2,987 2,987 3,475 488
Miscellaneous 3,642 3,642 3,280 (362)
TOTAL REVENUES 9,873 9,873 10,352 479
EXPENDITURES:Current-Public assistance-
Services and supplies 14,720 14,254 7,747 (6,507)
EXCESS (DEFICIENCY) OF REVENUES OVER EXPENDITURES (4,847) (4,381) 2,605 6,986
OTHER FINANCING SOURCES (USES):Transfers out (2,107) (2,573) (2,499) 74 Appropriation for contingencies (1,739) (1,739) 1,739 Changes in reserves and designations 1,868 1,868 2,156 288
OTHER FINANCING SOURCES (USES) - NET (1,978) (2,444) (343) 2,101
NET CHANGE IN FUND BALANCE (6,825) (6,825) 2,262 9,087
FUND BALANCE, JULY 1, 2008 6,825 6,825 6,825
FUND BALANCE, JUNE 30, 2009 $ 9,087 9,087
Continued…
PUBLIC ASSISTANCE
128

COUNTY OF LOS ANGELESSCHEDULE OF REVENUES, EXPENDITURES AND CHANGES IN FUND BALANCE -BUDGET AND ACTUAL ON BUDGETARY BASIS-ContinuedNONMAJOR GOVERNMENTAL FUNDS - SPECIAL REVENUEFOR THE YEAR ENDED JUNE 30, 2009 (in thousands)
ORIGINAL FINAL ACTUAL ON VARIANCE FROMBUDGET BUDGET BUDGETARY FINAL BUDGET
BASIS OVER (UNDER)
REVENUES: Licenses, permits and franchises 13$ 13 15 2
Fines, forfeitures and penalties 18 18 20 2 Revenue from use of money and property: Investment income 66 66 97 31 Rents and concessions 576 576 428 (148) Charges for services 3,791 3,791 4,837 1,046 Miscellaneous 2,146 2,146 2,756 610
TOTAL REVENUES 6,610 6,610 8,153 1,543
EXPENDITURES: Current-Recreation and cultural services-
Services and supplies 22,987 23,017 7,931 (15,086)
TOTAL EXPENDITURES 22,987 23,017 7,931 (15,086)
EXCESS (DEFICIENCY) OF REVENUES OVER EXPENDITURES (16,377) (16,407) 222 16,629
OTHER FINANCING SOURCES (USES):Transfers in 59 89 30 (59) Transfers out (3,143) (3,143) (587) 2,556 Appropriation for contingencies (2,064) (2,064) 2,064 Changes in reserves and designations (2,799) (2,799) (2,751) 48
OTHER FINANCING SOURCES (USES) - NET (7,947) (7,917) (3,308) 4,609
NET CHANGE IN FUND BALANCE (24,324) (24,324) (3,086) 21,238
FUND BALANCE, JULY 1, 2008 24,324 24,324 24,324
FUND BALANCE, JUNE 30, 2009 $ 21,238 21,238
Continued…
RECREATION
129

COUNTY OF LOS ANGELESSCHEDULE OF REVENUES, EXPENDITURES AND CHANGES IN FUND BALANCE -BUDGET AND ACTUAL ON BUDGETARY BASIS-ContinuedNONMAJOR GOVERNMENTAL FUNDS - SPECIAL REVENUEFOR THE YEAR ENDED JUNE 30, 2009 (in thousands)
ORIGINAL FINAL ACTUAL ON VARIANCE FROMBUDGET BUDGET BUDGETARY FINAL BUDGET
BASIS OVER (UNDER)
REVENUES: Fines, forfeitures and penalties 19,600$ 19,600 21,175 1,575 Revenue from use of money and property: Investment income 2,200 2,200 2,009 (191) Rents and concessions 79 79 45 (34)
TOTAL REVENUES 21,879 21,879 23,229 1,350
EXPENDITURES: Current-Public protection: Services and supplies 69,311 69,311 1,812 (67,499) Other charges 27,399 27,399 26,583 (816)
TOTAL EXPENDITURES 96,710 96,710 28,395 (68,315)
DEFICIENCY OF REVENUES OVER EXPENDITURES (74,831) (74,831) (5,166) 69,665
OTHER FINANCING SOURCES (USES)-Appropriation for contingencies (4,955) (4,955) 4,955
NET CHANGE IN FUND BALANCE (79,786) (79,786) (5,166) 74,620
FUND BALANCE, JULY 1, 2008 79,786 79,786 79,786
FUND BALANCE, JUNE 30, 2009 $ 74,620 74,620
Continued…
COURTHOUSE TEMPORARY CONSTRUCTION
130
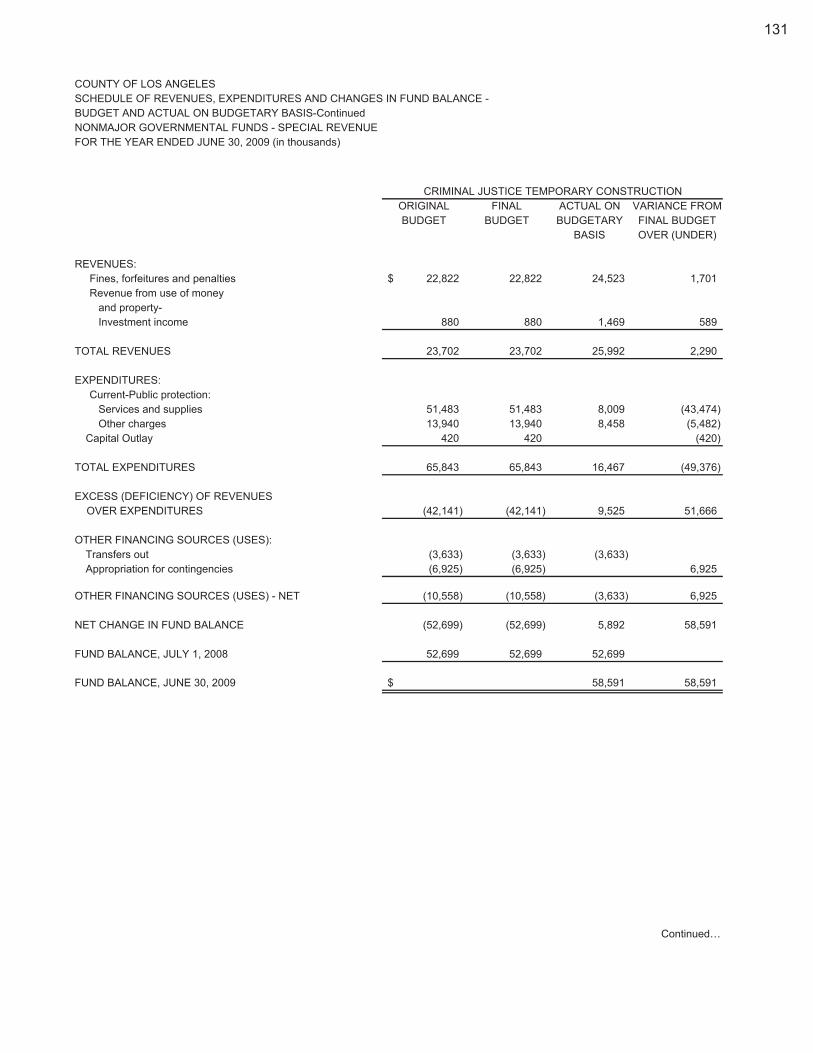
COUNTY OF LOS ANGELESSCHEDULE OF REVENUES, EXPENDITURES AND CHANGES IN FUND BALANCE -BUDGET AND ACTUAL ON BUDGETARY BASIS-ContinuedNONMAJOR GOVERNMENTAL FUNDS - SPECIAL REVENUEFOR THE YEAR ENDED JUNE 30, 2009 (in thousands)
ORIGINAL FINAL ACTUAL ON VARIANCE FROMBUDGET BUDGET BUDGETARY FINAL BUDGET
BASIS OVER (UNDER)
REVENUES: Fines, forfeitures and penalties 22,822$ 22,822 24,523 1,701 Revenue from use of money and property- Investment income 880 880 1,469 589
TOTAL REVENUES 23,702 23,702 25,992 2,290
EXPENDITURES: Current-Public protection: Services and supplies 51,483 51,483 8,009 (43,474) Other charges 13,940 13,940 8,458 (5,482)
Capital Outlay 420 420 (420)
TOTAL EXPENDITURES 65,843 65,843 16,467 (49,376)
EXCESS (DEFICIENCY) OF REVENUES OVER EXPENDITURES (42,141) (42,141) 9,525 51,666
OTHER FINANCING SOURCES (USES):Transfers out (3,633) (3,633) (3,633) Appropriation for contingencies (6,925) (6,925) 6,925
OTHER FINANCING SOURCES (USES) - NET (10,558) (10,558) (3,633) 6,925
NET CHANGE IN FUND BALANCE (52,699) (52,699) 5,892 58,591
FUND BALANCE, JULY 1, 2008 52,699 52,699 52,699
FUND BALANCE, JUNE 30, 2009 $ 58,591 58,591
Continued…
CRIMINAL JUSTICE TEMPORARY CONSTRUCTION
131

COUNTY OF LOS ANGELESSCHEDULE OF REVENUES, EXPENDITURES AND CHANGES IN FUND BALANCE -BUDGET AND ACTUAL ON BUDGETARY BASIS-ContinuedNONMAJOR GOVERNMENTAL FUNDS - SPECIAL REVENUEFOR THE YEAR ENDED JUNE 30, 2009 (in thousands)
ORIGINAL FINAL ACTUAL ON VARIANCE FROMBUDGET BUDGET BUDGETARY FINAL BUDGET
BASIS OVER (UNDER)
REVENUES-Charges for services 19,274$ 19,274 11,761 (7,513)
OTHER FINANCING SOURCES (USES):Transfers out (47,682) (47,682) (14,843) 32,839 Appropriation for contingencies (680) (680) 680 Changes in reserves and designations 25,998 25,998 25,999 1
OTHER FINANCING SOURCES (USES) - NET (22,364) (22,364) 11,156 33,520
NET CHANGE IN FUND BALANCE (3,090) (3,090) 22,917 26,007
FUND BALANCE, JULY 1, 2008 3,090 3,090 3,090
FUND BALANCE, JUNE 30, 2009 $ 26,007 26,007
Continued…
REGISTRAR RECORDER IMPROVEMENT
132

COUNTY OF LOS ANGELESSCHEDULE OF REVENUES, EXPENDITURES AND CHANGES IN FUND BALANCE -BUDGET AND ACTUAL ON BUDGETARY BASIS-ContinuedNONMAJOR GOVERNMENTAL FUNDS - SPECIAL REVENUEFOR THE YEAR ENDED JUNE 30, 2009 (in thousands)
ORIGINAL FINAL ACTUAL ON VARIANCE FROMBUDGET BUDGET BUDGETARY FINAL BUDGET
BASIS OVER (UNDER)
REVENUES: Licenses, permits and franchises 2,065$ 2,065 2,599 534 Fines, forfeitures and penalties 150 150 (150) Revenue from use of money and property: Investment income 2,132 2,132 2,007 (125) Rents and concessions 4,250 4,250 4,419 169 Royalties 10 10 8 (2) Charges for services 1,298 1,298 2,343 1,045 Miscellaneous 454 454
TOTAL REVENUES 9,905 9,905 11,830 1,925
EXPENDITURES: Current-General government: Salaries and employee benefits 5,800 5,853 5,853 Services and supplies 54,028 56,290 13,259 (43,031) Other charges 4,128 4,128 4,001 (127) Capital assets 2,837 2,837 429 (2,408)
TOTAL EXPENDITURES 66,793 69,108 23,542 (45,566)
DEFICIENCY OF REVENUES OVER EXPENDITURES (56,888) (59,203) (11,712) 47,491
OTHER FINANCING SOURCES (USES):Sales of capital assets 3,806 3,806 4,652 846Transfers in 13,800 14,525 13,540 (985) Transfers out (44,509) (44,619) (5,242) 39,377 Appropriation for contingencies (4,188) (4,188) 4,188 Changes in reserves and designations (5,126) (3,426) (2,095) 1,331
OTHER FINANCING SOURCES (USES) - NET (36,217) (33,902) 10,855 44,757
NET CHANGE IN FUND BALANCE (93,105) (93,105) (857) 92,248
FUND BALANCE, JULY 1, 2008 93,105 93,105 93,105
FUND BALANCE, JUNE 30, 2009 $ 92,248 92,248
OTHER SPECIAL REVENUE
133
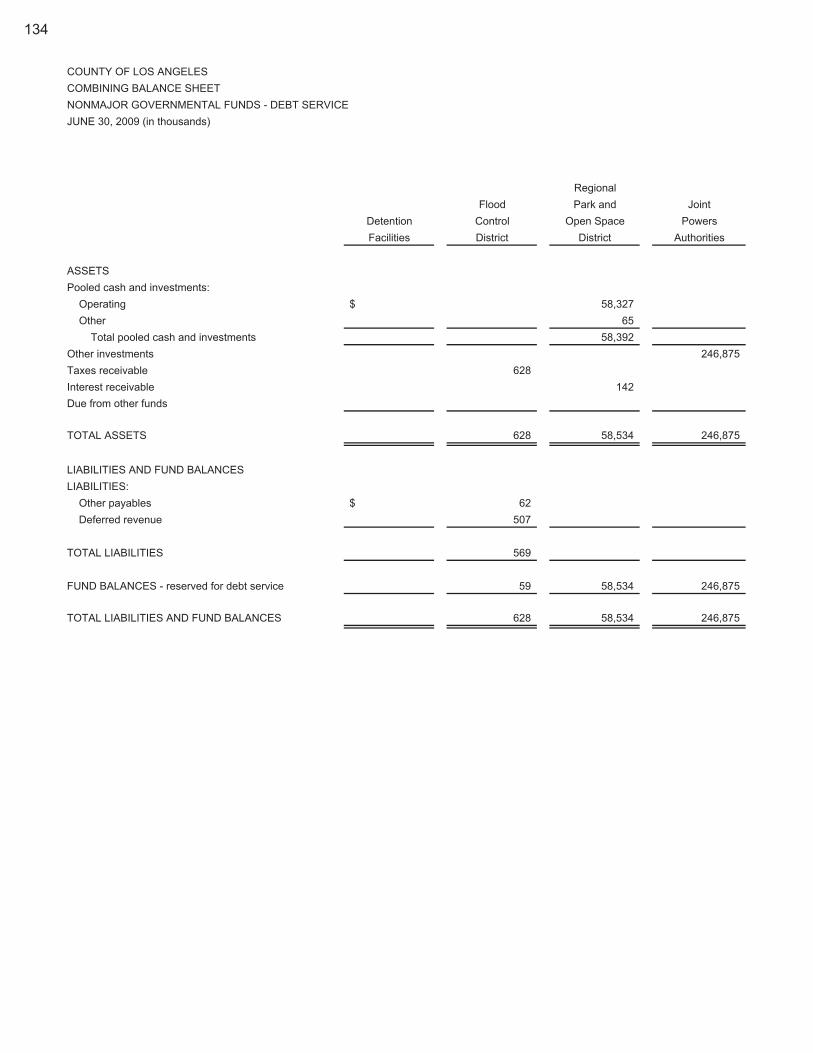
COUNTY OF LOS ANGELESCOMBINING BALANCE SHEETNONMAJOR GOVERNMENTAL FUNDS - DEBT SERVICEJUNE 30, 2009 (in thousands)
RegionalFlood Park and Joint
Detention Control Open Space PowersFacilities District District Authorities
ASSETSPooled cash and investments: Operating $ 58,327 Other 65 Total pooled cash and investments 58,392 Other investments 246,875 Taxes receivable 628 Interest receivable 142 Due from other funds
TOTAL ASSETS 628 58,534 246,875
LIABILITIES AND FUND BALANCESLIABILITIES: Other payables $ 62 Deferred revenue 507
TOTAL LIABILITIES 569
FUND BALANCES - reserved for debt service 59 58,534 246,875
TOTAL LIABILITIES AND FUND BALANCES 628 58,534 246,875
134

LA CountyPublic Securitization
Buildings Corporation Total
ASSETSPooled cash and investments:
$ 58,327$ Operating65 Other
58,392 Total pooled cash and investments90,664 32,238 369,777 Other investments
628 Taxes receivable7 149 Interest receivable
266,794 266,794 Due from other funds
90,671$ 299,032 695,740$ TOTAL ASSETS
LIABILITIES AND FUND BALANCESLIABILITIES:
430$ 492$ Other payables507 Deferred revenue
430 999 TOTAL LIABILITIES
90,241 299,032 694,741 FUND BALANCES - reserved for debt service
90,671$ 299,032 695,740$ TOTAL LIABILITIES AND FUND BALANCES
135

COUNTY OF LOS ANGELESCOMBINING STATEMENT OF REVENUES, EXPENDITURES AND CHANGES IN FUND BALANCESNONMAJOR GOVERNMENTAL FUNDS - DEBT SERVICEFOR THE YEAR ENDED JUNE 30, 2009 (in thousands)
RegionalFlood Park and Joint
Detention Control Open Space PowersFacilities District District Authorities
REVENUES:Revenue from use of money/property -
Investment income $ 11 3,149 12,822 MiscellaneousTOTAL REVENUE 11 3,149 12,822
EXPENDITURES - Debt service:Principal 14,505 23,120 23,120 Interest and other charges 4,576 12,790 12,822
TOTAL EXPENDITURES 19,081 35,910 35,942
EXCESS (DEFICIENCY) OF REVENUESOVER EXPENDITURES (19,070) (32,761) (23,120)
OTHER FINANCING SOURCES (USES):Transfers in 19,078 33,280 Transfers out (81) TOTAL OTHER FINANCING SOURCES (USES) (81) 19,078 33,280
NET CHANGE IN FUND BALANCES (81) 8 519 (23,120)
FUND BALANCE, JULY 1, 2008 81 51 58,015 269,995
FUND BALANCE, JUNE 30, 2009 $ 59 58,534 246,875
136

LA CountyPublic Securitization
Buildings Corporation TotalREVENUES:Revenue from use of money/property -
1,433$ 1,085 18,500$ Investment income826 29,950 30,776 Miscellaneous
2,259 31,035 49,276 TOTAL REVENUES
EXPENDITURES - Debt service:63,326 124,071 Principal33,576 39 63,803 Interest and other charges96,902 39 187,874 TOTAL EXPENDITURES
EXCESS (DEFICIENCY) OF REVENUES(94,643) 30,996 (138,598) OVER EXPENDITURES
OTHER FINANCING SOURCES (USES):99,932 152,290 Transfers in
(35,953) (36,034) Transfers out99,932 (35,953) 116,256 TOTAL OTHER FINANCING SOURCES (USES)
5,289 (4,957) (22,342) NET CHANGE IN FUND BALANCES
84,952 303,989 717,083 FUND BALANCE, JULY 1, 2008
90,241$ 299,032 694,741$ FUND BALANCE, JUNE 30, 2009
137

COUNTY OF LOS ANGELESSCHEDULE OF REVENUES, EXPENDITURES AND CHANGES IN FUND BALANCE -BUDGET AND ACTUAL ON BUDGETARY BASISNONMAJOR GOVERNMENTAL FUNDS - DEBT SERVICEFOR THE YEAR ENDED JUNE 30, 2009 (in thousands)
ORIGINAL FINAL ACTUAL ON VARIANCE FROMBUDGET BUDGET BUDGETARY FINAL BUDGET
BASIS OVER (UNDER)
REVENUES:
Revenue from use of moneyand property-
Investment income 1,495$ 1,495 2,822 1,327
EXPENDITURES:Debt service:
Principal 23,120 23,120 23,120 Interest 22,618 22,619 12,790 (9,829)
TOTAL EXPENDITURES 45,738 45,739 35,910 (9,829)
DEFICIENCY OF REVENUES OVER EXPENDITURES (44,243) (44,244) (33,088) 11,156
OTHER FINANCING SOURCES (USES):Transfers in 36,145 36,145 33,280 (2,865) Appropriation for contingencies (711) (711) 711 Changes in reserves and designations (1,703) (1,702) (906) 796
OTHER FINANCING SOURCES (USES) - NET 33,731 33,732 32,374 (1,358)
NET CHANGE IN FUND BALANCE (10,512) (10,512) (714) 9,798
FUND BALANCE, JULY 1, 2008 10,512 10,512 10,512
FUND BALANCE, JUNE 30, 2009 $ 9,798 9,798
REGIONAL PARK AND OPEN SPACE DISTRICT
138

COUNTY OF LOS ANGELESCOMBINING BALANCE SHEETNONMAJOR GOVERNMENTAL FUNDS - CAPITAL PROJECTSJUNE 30, 2009 (in thousands)
Accumulative FloodCapital Control Improvement Public GapOutlay District Districts Buildings Loan Total
ASSETSPooled cash and investments:
Operating 76,272$ 99 11 123,927 200,309$ Other 183 268 451 Total pooled cash and investments 76,455 99 11 124,195 200,760
Other investments 275 2,799 3,074 Interest receivable 266 476 742 Other receivables 6,310 6,310 Due from other funds 10,770 10,770
TOTAL ASSETS 93,801$ 374 11 2,799 124,671 221,656$
LIABILITIES AND FUND BALANCESLIABILITIES:
Accounts payable 4,952$ 4,952$ Due to other funds 4,781 6,517 11,298
TOTAL LIABILITIES 9,733 6,517 16,250
FUND BALANCES:Reserved for:
Encumbrances 8,227 8,227 Assets unavailable for appropriation 8,187 8,187
Unreserved-Undesignated 67,654 374 11 2,799 118,154 188,992
TOTAL FUND BALANCES 84,068 374 11 2,799 118,154 205,406
TOTAL LIABILITIES AND FUND BALANCES 93,801$ 374 11 2,799 124,671 221,656$
139
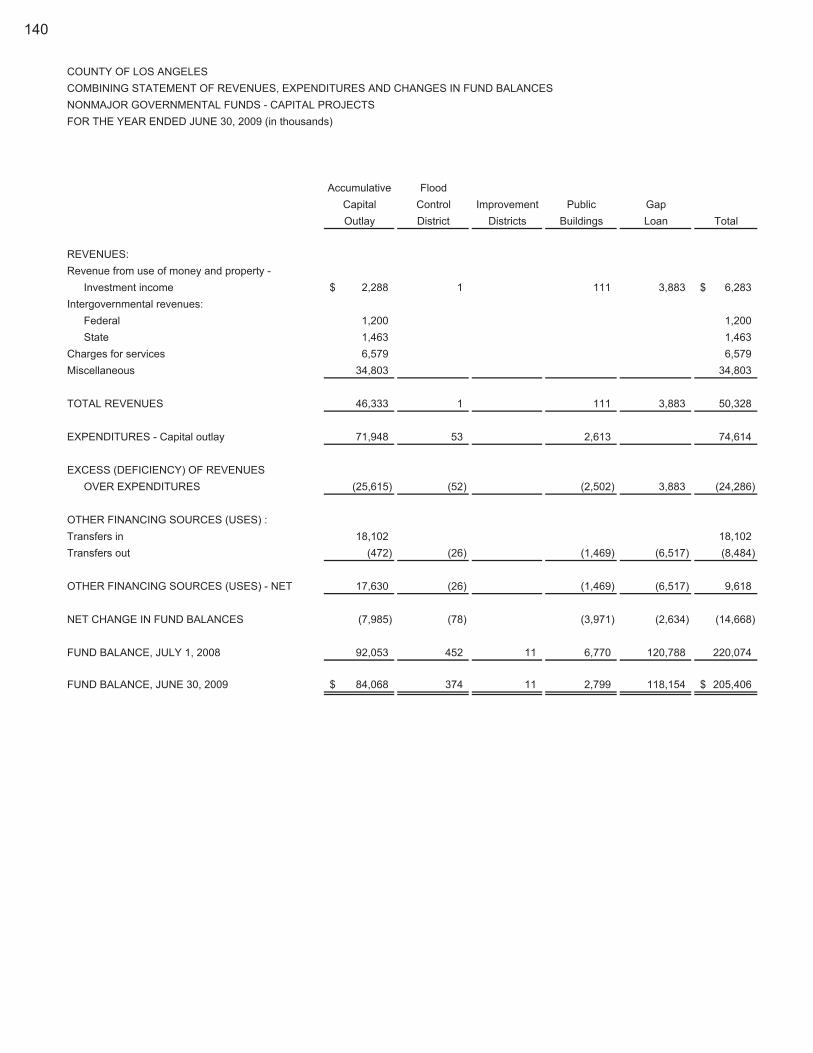
COUNTY OF LOS ANGELESCOMBINING STATEMENT OF REVENUES, EXPENDITURES AND CHANGES IN FUND BALANCESNONMAJOR GOVERNMENTAL FUNDS - CAPITAL PROJECTSFOR THE YEAR ENDED JUNE 30, 2009 (in thousands)
Accumulative FloodCapital Control Improvement Public GapOutlay District Districts Buildings Loan Total
REVENUES:Revenue from use of money and property -
Investment income 2,288$ 1 111 3,883 6,283$ Intergovernmental revenues:
Federal 1,200 1,200 State 1,463 1,463
Charges for services 6,579 6,579 Miscellaneous 34,803 34,803
TOTAL REVENUES 46,333 1 111 3,883 50,328
EXPENDITURES - Capital outlay 71,948 53 2,613 74,614
EXCESS (DEFICIENCY) OF REVENUESOVER EXPENDITURES (25,615) (52) (2,502) 3,883 (24,286)
OTHER FINANCING SOURCES (USES) :Transfers in 18,102 18,102 Transfers out (472) (26) (1,469) (6,517) (8,484)
OTHER FINANCING SOURCES (USES) - NET 17,630 (26) (1,469) (6,517) 9,618
NET CHANGE IN FUND BALANCES (7,985) (78) (3,971) (2,634) (14,668)
FUND BALANCE, JULY 1, 2008 92,053 452 11 6,770 120,788 220,074
FUND BALANCE, JUNE 30, 2009 84,068$ 374 11 2,799 118,154 205,406$
140

COUNTY OF LOS ANGELESCOMBINING BALANCE SHEETNONMAJOR GOVERNMENTAL FUNDS - PERMANENT FUNDSJUNE 30, 2009 (in thousands)
Annuities Endowments Total
ASSETSPooled cash and investments: Operating 601$ 2,418 3,019$ Other 1 5 6 Total pooled cash and investments 602 2,423 3,025 Other investments 106 106 Interest receivable 4 8 12
TOTAL ASSETS 712$ 2,431 3,143$
LIABILITIES - Due to other funds $ 124 124$
FUND BALANCES - Reserved for annuities and endowments 712 2,307 3,019
TOTAL LIABILITIES AND FUND BALANCES 712$ 2,431 3,143$
141

COUNTY OF LOS ANGELESCOMBINING STATEMENT OF REVENUES, EXPENDITURES AND CHANGES IN FUND BALANCESNONMAJOR GOVERNMENTAL FUNDS - PERMANENT FUNDSFOR THE YEAR ENDED JUNE 30, 2009 (in thousands)
Annuities Endowments Total
REVENUES:Revenue from use of money and property -
Investment income 59$ 66 125$
EXPENDITURES - General government 68 130 198
DEFICIENCY OF REVENUES OVER EXPENDITURES (9) (64) (73)
OTHER FINANCING SOURCES (USES)-Transfers out (363) (363)
NET CHANGE IN FUND BALANCES (372) (64) (436)
FUND BALANCE, JULY 1, 2008 1,084 2,371 3,455
FUND BALANCE, JUNE 30, 2009 712$ 2,307 3,019$
142
NONMAJOR ENTERPRISE FUNDS
COUNTY OF LOS ANGELES NONMAJOR ENTERPRISE FUNDS
The Aviation Enterprise Fund was established to provide for the maintenance and operations of the five
airports which are owned by the County. Operating revenues are derived primarily from charges for services and rentals associated with airport operations.
The Community Development Commission Enterprise Fund was established to provide for the
operation, maintenance and management of certain housing developments. Revenues are derived primarily from tenant rentals and federal grants.

COUNTY OF LOS ANGELESCOMBINING STATEMENT OF NET ASSETSNONMAJOR ENTERPRISE FUNDSJUNE 30, 2009 (in thousands)
TotalCommunity Nonmajor
Development EnterpriseAviation Commission Funds
ASSETSCurrent assets:
Pooled cash and investments:Operating 4,863$ 4,863$ Other 6 6 Total pooled cash and investments 4,869 4,869
Other investments 30,380 30,380 Interest receivable 13 13 Other receivables 525 7,931 8,456 Due from other funds 53 53 Inventories 11 11
Total current assets 5,460 38,322 43,782
Noncurrent assets:Capital assets:
Land and easements 134,066 65,094 199,160 Buildings and improvements 34,437 145,530 179,967 Equipment 1,671 1,504 3,175 Infrastructure 41,505 41,505 Construction in progress 988 270 1,258 Less accumulated depreciation (52,650) (135,624) (188,274) Total capital assets - net 160,017 76,774 236,791 Total noncurrent assets 160,017 76,774 236,791
TOTAL ASSETS 165,477 115,096 280,573
LIABILITIESCurrent liabilities:
Accounts payable 262 2,812 3,074 Other payables 1,384 1,623 3,007 Due to other funds 249 249 Unearned revenue 530 530 Current portion of long-term liabilities 987 987
Total current liabilities 1,895 5,952 7,847 Noncurrent liabilities:
Accrued vacation and sick leave 211 211 Bonds and notes payable 3,324 3,324
Total noncurrent liabilities 3,535 3,535TOTAL LIABILITIES 1,895 9,487 11,382
NET ASSETSInvested in capital assets, net of related debt 160,017 73,094 233,111 Restricted:
Debt service 2,969 2,969 Special purpose 29,546 29,546
Unrestricted 3,565 3,565 TOTAL NET ASSETS 163,582$ 105,609 269,191$
143

COUNTY OF LOS ANGELESCOMBINING STATEMENT OF REVENUES, EXPENSES AND CHANGES IN FUND NET ASSETSNONMAJOR ENTERPRISE FUNDSFOR THE YEAR ENDED JUNE 30, 2009 (in thousands)
TotalCommunity Nonmajor
Development EnterpriseAviation Commission Funds
OPERATING REVENUES: Rentals 2,805$ 11,777 14,582$ Charges for services 323 323 Other 888 888
TOTAL OPERATING REVENUES 3,128 12,665 15,793
OPERATING EXPENSES: Services and supplies 2,582 266,819 269,401 Other professional services 840 840 Depreciation and amortization 1,651 1,159 2,810
TOTAL OPERATING EXPENSES 5,073 267,978 273,051
OPERATING LOSS (1,945) (255,313) (257,258)
NONOPERATING REVENUES (EXPENSES): Interest income 91 1,686 1,777 Interest expense (223) (223) Intergovernmental revenues: State 25 25 Federal 120 230,490 230,610
TOTAL NONOPERATING REVENUES 236 231,953 232,189
LOSS BEFORE CONTRIBUTIONS AND TRANSFERS (1,709) (23,360) (25,069)
Capital contributions 671 671 Transfers in 2,980 2,980
CHANGE IN NET ASSETS (1,038) (20,380) (21,418)
TOTAL NET ASSETS, JULY 1, 2008 164,620 125,989 290,609
TOTAL NET ASSETS, JUNE 30, 2009 163,582$ 105,609 269,191$
144

COUNTY OF LOS ANGELESCOMBINING STATEMENT OF CASH FLOWSNONMAJOR ENTERPRISE FUNDSFOR THE YEAR ENDED JUNE 30, 2009 (in thousands)
Total Community NonmajorDevelopment Enterprise
Aviation Commission Funds
CASH FLOWS FROM OPERATING ACTIVITIES:Rentals received 2,805$ 8,956 11,761$ Cash received from charges for services 1,599 1,599 Other operating revenues 888 888 Cash paid for salaries and employee benefits 26 26 Cash paid for services and supplies (2,929) (265,994) (268,923) Other operating expenses (840) (840)
Net cash provided by (required for) operating activities 635 (256,124) (255,489)
CASH FLOWS FROM NONCAPITAL FINANCING ACTIVITIES:Intergovernmental receipts 145 230,490 230,635 Transfers in 2,980 2,980
Net cash provided by noncapital financing activities 145 233,470 233,615
CASH FLOWS FROM CAPITAL AND RELATED FINANCING ACTIVITIES: Capital contributions 671 671 Proceeds from bonds and notes 5 5 Interest paid on capital borrowing (223) (223) Principal payments on bonds (830) (830) Acquisition and construction of capital assets (1,117) (3,099) (4,216) Net cash required for capital and related financing activities (446) (4,147) (4,593)
CASH FLOWS FROM INVESTING ACTIVITIES -Interest income received 81 1,686 1,767
Net increase (decrease) in cash and cash equivalents 415 (25,115) (24,700)
Cash and cash equivalents, July 1, 2008 4,454 55,495 59,949
Cash and cash equivalents, June 30, 2009 4,869$ 30,380 35,249$
Continued…
145

COUNTY OF LOS ANGELESCOMBINING STATEMENT OF CASH FLOWS - ContinuedNONMAJOR ENTERPRISE FUNDSFOR THE YEAR ENDED JUNE 30, 2009 (in thousands)
Total Community NonmajorDevelopment Enterprise
Aviation Commission Funds
RECONCILIATION OF OPERATING LOSS TO NET CASHPROVIDED BY (REQUIRED FOR) OPERATING ACTIVITIES: Operating loss (1,945)$ (255,313) (257,258)$ Adjustments to reconcile operating loss to net cash
provided by (required for) operating activities:Depreciation and amortization 1,651 1,159 2,810 Other charges - net 9 9
(Increase) decrease in:Other receivables 1,281 (3,037) (1,756) Due from other funds (5) (5) Inventories (11) (11)
Increase (decrease) in:Accounts payable (883) (38) (921) Other payables 440 874 1,314 Accrued vacation and sick leave 26 26 Due to other funds 87 87 Unearned revenue 216 216
TOTAL ADJUSTMENTS 2,580 (811) 1,769
NET CASH PROVIDED BY (REQUIRED FOR) OPERATINGACTIVITIES 635$ (256,124) (255,489)$
RECONCILIATION OF CASH AND CASH EQUIVALENTS TO THE STATEMENT OF NET ASSETS:Pooled cash and investments 4,869$ 4,869$ Other investments 30,380 30,380
TOTAL 4,869$ 30,380 35,249$
146

INTERNAL SERVICE FUNDS
COUNTY OF LOS ANGELES INTERNAL SERVICE FUNDS
The Public Works Fund was established to account for the cost of services provided by the Department
of Public Works to the Road Fund, Flood Control District, County Engineer and various other special districts and agencies. Costs are recovered through billings for services.
The Equipment Acquisition Fund was established to account for the operations of the Los Angeles
County Capital Asset Leasing Corporation. County departments are charged for equipment items acquired on their behalf. The charges represent recovery of equipment depreciation expense and bond interest expense.
The Community Development Commission Internal Service Fund was established to account for the
accumulation of resources for, and the payment of, services provided to various departments within the Commission. The charges for services are on a cost-reimbursement basis.

COUNTY OF LOS ANGELESCOMBINING STATEMENT OF NET ASSETSINTERNAL SERVICE FUNDSJUNE 30, 2009 (in thousands)
CommunityPublic Equipment DevelopmentWorks Acquisition Commission Total
ASSETSCurrent assets:
Pooled cash and investments:Operating 44,012$ 4,564 48,576$ Other 9,257 24 9,281
Total pooled cash and investments 53,269 4,588 57,857 Other investments 8,131 8,131 Interest receivable 152 55 207 Other receivables 6,744 45 6,789 Due from other funds 65,868 42 65,910 Inventories 9,725 44 9,769
Total current assets 135,758 4,685 8,220 148,663 Noncurrent assets:
Restricted assets 14,124 14,124 Net pension obligation 5,150 5,150 Capital assets:
Buildings and improvements 1,734 1,734 Equipment 127,549 85,222 4,949 217,720
Less accumulated depreciation (68,055) (41,749) (4,600) (114,404) Total capital assets - net 61,228 43,473 349 105,050 Total noncurrent assets 66,378 57,597 349 124,324
TOTAL ASSETS 202,136 62,282 8,569 272,987
LIABILITIESCurrent liabilities:
Accounts payable 4,820 185 534 5,539 Accrued payroll 24,402 24,402 Other payables 1,811 1,811 Accrued interest payable 209 209 Due to other funds 36,845 72 36,917 Advances from other funds 22,000 22,000 Unearned revenue 711 711 Current portion of long-term liabilities 52,187 25,095 385 77,667
Total current liabilities 142,776 25,489 991 169,256 Noncurrent liabilities:
Accrued vacation and sick leave 37,606 51 37,657 Bonds and notes payable 30,470 30,470 Pension bonds payable 15,998 15,998 Workers' compensation liability 11,736 2,795 14,531 Litigation and self-insurance liability 1,341 1,341 OPEB obligation 84,482 84,482
Total noncurrent liabilities 149,822 30,470 4,187 184,479 TOTAL LIABILITIES 292,598 55,959 5,178 353,735
NET ASSETSInvested in capital assets, net of related debt 61,228 5,577 349 67,154 Restricted:
Debt service 13,915 13,915 Special purpose 3,042 3,042
Unrestricted (Deficit) (151,690) (13,169) (164,859) TOTAL NET ASSETS (DEFICIT) (90,462)$ 6,323 3,391 (80,748)$
147

COUNTY OF LOS ANGELESCOMBINING STATEMENT OF REVENUES, EXPENSES AND CHANGES IN FUND NET ASSETSINTERNAL SERVICE FUNDSFOR THE YEAR ENDED JUNE 30, 2009 (in thousands)
CommunityPublic Equipment DevelopmentWorks Acquisition Commission Total
OPERATING REVENUES:Rentals 2$ 25,729 25,731$ Charges for services 420,316 13,289 433,605
TOTAL OPERATING REVENUES 420,318 25,729 13,289 459,336
OPERATING EXPENSES:Salaries and employee benefits 348,699 348,699 Services and supplies 29,674 13 14,038 43,725 Other professional services 32,672 32,672 Depreciation and amortization 8,998 20,970 294 30,262
TOTAL OPERATING EXPENSES 420,043 20,983 14,332 455,358
OPERATING INCOME (LOSS) 275 4,746 (1,043) 3,978
NONOPERATING REVENUES (EXPENSES) :Interest income 654 386 176 1,216 Interest expense (3,639) (1,229) (1) (4,869) Intergovernmental revenues - Federal 785 785
TOTAL NONOPERATING REVENUES (EXPENSES) (2,985) (843) 960 (2,868)
INCOME (LOSS) BEFORE TRANSFERS (2,710) 3,903 (83) 1,110
Transfers in 4,059 303 4,362 Transfers out (2,624) (265) (2,889)
CHANGE IN NET ASSETS 1,349 1,279 (45) 2,583
TOTAL NET ASSETS (DEFICIT), JULY 1, 2008 (91,811) 5,044 3,436 (83,331)
TOTAL NET ASSETS (DEFICIT), JUNE 30, 2009 (90,462)$ 6,323 3,391 (80,748)$
148

COUNTY OF LOS ANGELESCOMBINING STATEMENT OF CASH FLOWSINTERNAL SERVICE FUNDSFOR THE YEAR ENDED JUNE 30, 2009 (in thousands)
CommunityPublic Equipment DevelopmentWorks Acquisition Commission Total
CASH FLOWS FROM OPERATING ACTIVITIES:Rentals received 2$ 25,779 25,781$ Cash received from charges for services to other funds 414,170 13,302 427,472Cash paid for salaries and employee benefits (334,601) (334,601)Cash paid for services and supplies (50,853) (13) (14,661) (65,527)Other operating expenses (32,672) (32,672)
Net cash provided by (required for) operating activities (3,954) 25,766 (1,359) 20,453
CASH FLOWS FROM NONCAPITAL FINANCING ACTIVITIES:Interest paid on pension bonds (3,639) (3,639) Intergovernmental receipts 785 785 Transfers in 4,059 303 4,362 Transfers out (2,624) (265) (2,889)
Net cash provided by (required for) noncapital financingactivities 420 (2,624) 823 (1,381)
CASH FLOWS FROM CAPITAL AND RELATED FINANCING ACTIVITIES:Proceeds from bonds and notes 25,000 25,000 Interest paid on capital borrowing (1,189) (1) (1,190) Principal payments on bonds and notes (15,815) (15,815) Principal payments on capital leases (60) (60) Acquisition and construction of capital assets (7,256) (27,104) (66) (34,426)
Net cash required for capital and related financing activities (7,256) (19,108) (127) (26,491)
CASH FLOWS FROM INVESTING ACTIVITIES -Interest income received 263 362 176 801
Net increase (decrease) in cash and cash equivalents (10,527) 4,396 (487) (6,618)
Cash and cash equivalents July 1, 2008 63,796 14,316 8,618 86,730
Cash and cash equivalents June 30, 2009 53,269$ 18,712 8,131 80,112$
Continued…
149

COUNTY OF LOS ANGELESCOMBINING STATEMENT OF CASH FLOWS - ContinuedINTERNAL SERVICE FUNDSFOR THE YEAR ENDED JUNE 30, 2009 (in thousands)
CommunityPublic Equipment DevelopmentWorks Acquisition Commission Total
RECONCILIATION OF OPERATING INCOME (LOSS) TONET CASH PROVIDED BY (REQUIRED FOR)OPERATING ACTIVITIES:Operating income (loss) 275$ 4,746 (1,043) 3,978$ Adjustments to reconcile operating income (loss) to net
cash provided by (required for) operating activities:Depreciation and amortization 8,998 20,970 294 30,262 Other charges - net (13,118) (13,118)
(Increase) decrease in:Interest receivable 90 90 Other receivables (1,043) 13 (1,030) Due from other funds (6,602) 50 (6,552) Inventories (2,094) 1 (2,093) Net pension obligation 2,150 2,150
Increase (decrease) in:Accounts payable 1,429 46 1,475 Accrued payroll 957 957 Other payables 71 71 Accrued vacation and sick leave 1,789 (676) 1,113 Due to other funds (7,396) 6 (7,390) Unearned revenue 524 524 Pension bonds payable (12,299) (12,299) Workers' compensation liability (22,415) (22,415) OPEB liability 44,730 44,730
TOTAL ADJUSTMENTS (4,229) 21,020 (316) 16,475
NET CASH PROVIDED BY (REQUIRED FOR)OPERATING ACTIVITIES (3,954)$ 25,766 (1,359) 20,453$
RECONCILIATION OF CASH AND CASH EQUIVALENTS TO THE STATEMENT OF NET ASSETS:Pooled cash and investments 53,269$ 4,588 57,857$ Other investments 8,131 8,131 Restricted assets 14,124 14,124
TOTAL 53,269$ 18,712 8,131 80,112$
150

FIDUCIARY FUNDS
COUNTY OF LOS ANGELES FIDUCIARY FUNDS
POOLED INVESTMENT TRUST FUND The Pooled Investment Trust Fund was established to account for net assets of the County's external
investment pool. The fund primarily consists of deposits held on behalf of School Districts and Sanitation Districts.
SPECIFIC INVESTMENT TRUST FUND The Specific Investment Trust Fund is used to account for the net assets of individual investment
accounts, in aggregate. The related investment activity occurs separately from the County's investment pool and is provided as a service to external investors.
AGENCY Agency funds have been established to account for cash and other assets and related liabilities of such
funds as temporary funds for deposits of unapportioned taxes, departmental funds, and clearing and revolving funds.

COUNTY OF LOS ANGELESCOMBINING STATEMENT OF FIDUCIARY NET ASSETSFIDUCIARY FUNDS - INVESTMENT TRUST FUNDSJUNE 30, 2009 (in thousands)
Pooled SpecificInvestment InvestmentTrust Fund Trust Fund Total
ASSETSPooled cash and investments 13,329,209$ 13,329,209$ Other investments 269,057 269,057 Interest receivable 77,068 18,403 95,471
TOTAL ASSETS 13,406,277 287,460 13,693,737
NET ASSETSHeld in trust for investment trust fund participants 13,406,277$ 287,460 13,693,737$
151
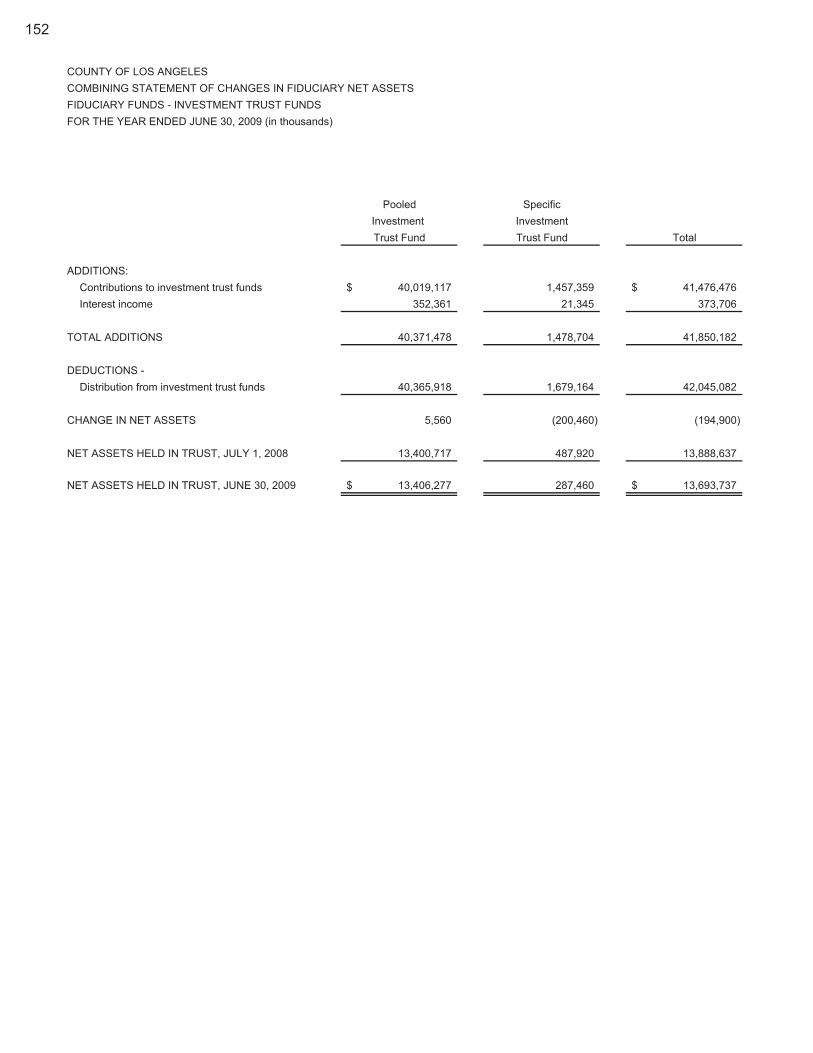
COUNTY OF LOS ANGELESCOMBINING STATEMENT OF CHANGES IN FIDUCIARY NET ASSETSFIDUCIARY FUNDS - INVESTMENT TRUST FUNDSFOR THE YEAR ENDED JUNE 30, 2009 (in thousands)
Pooled SpecificInvestment InvestmentTrust Fund Trust Fund Total
ADDITIONS:Contributions to investment trust funds 40,019,117$ 1,457,359 41,476,476$ Interest income 352,361 21,345 373,706
TOTAL ADDITIONS 40,371,478 1,478,704 41,850,182
DEDUCTIONS -Distribution from investment trust funds 40,365,918 1,679,164 42,045,082
CHANGE IN NET ASSETS 5,560 (200,460) (194,900)
NET ASSETS HELD IN TRUST, JULY 1, 2008 13,400,717 487,920 13,888,637
NET ASSETS HELD IN TRUST, JUNE 30, 2009 13,406,277$ 287,460 13,693,737$
152

COUNTY OF LOS ANGELESCOMBINING STATEMENT OF CHANGES IN ASSETS AND LIABILITIESFIDUCIARY FUNDS - AGENCY FUNDSFOR THE YEAR ENDED JUNE 30, 2009 (in thousands)
Balance Balance July 1, 2008 Additions Deductions June 30, 2009
TOTAL AGENCY FUNDS
ASSETSPooled cash and investments 1,261,788$ 123,226,979 123,324,955 1,163,812$ Other investments 43,927 603 44,229 301 Taxes receivable 310,536 1,003,897 865,926 448,507 Interest receivable 2,498 4,824 2,583 4,739
TOTAL ASSETS 1,618,749$ 124,236,303 124,237,693 1,617,359$
LIABILITIESDue to other governments 1,618,749$ 2,753,876 2,755,266 1,617,359$
TOTAL LIABILITIES 1,618,749$ 2,753,876 2,755,266 1,617,359$
153

154
SSSTTTAAATTTIIISSSTTTIIICCCAAALLL SSSEEECCCTTTIIIOOONNN

STATISTICAL SECTION
The information in this section is not covered by the Independent Auditor’s Report, but is presented as supplemental data for the benefit of the readers of the comprehensive annual financial report. The objectives of statistical section information are to provide financial statement users with additional historical perspective, context, and detail to assist in using the information in the financial statements, notes to financial statements, and required supplementary information to better understand and assess the County’s overall financial health.
CONTENTS PAGE
FINANCIAL TRENDS.....................................................................................................................157 These schedules contain trend information to help the reader understand how the County’s financial performance and well-being have changed over time.
REVENUE CAPACITY ...................................................................................................................164 These schedules contain trend information to help the reader assess the
County’s most significant local revenue source, the property tax.
DEBT CAPACITY...........................................................................................................................168 These schedules present information to help the reader assess the
affordability of the County’s current levels of outstanding debt and the County’s ability to issue additional debt in the future.
DEMOGRAPHIC AND ECONOMIC INFORMATION ....................................................................174 The schedules offer demographic and economic indicators to help the
reader understand the environment within which the County’s financial activities take place.
OPERATING INFORMATION ........................................................................................................176 These schedules contain service and infrastructure data to help the reader
understand how the information in the County’s financial report relates to the services the County provides and the activities it performs.
Sources: Unless otherwise noted, the information in these schedules is derived from the comprehensive annual financial reports for the relevant year.
155

156

CO
UN
TY O
F LO
S A
NG
ELE
SN
ET
AS
SE
TS B
Y C
ATE
GO
RY
(UN
AU
DIT
ED
)LA
ST
EIG
HT
FIS
CA
L Y
EA
RS
(in
thou
sand
s)(a
ccru
al b
asis
of a
ccou
ntin
g)
2001
-02
2002
-03
2003
-04
2004
-05
2005
-06
2006
-07
2007
-08
2008
-09
Gov
ernm
enta
l act
iviti
es I
nves
ted
in c
apita
l ass
ets,
net
of r
elat
ed d
ebt
1,94
4,50
7$
2,
210,
640
2,38
4,00
9
2,
556,
556
13,5
67,5
13
14,1
92,4
94
13,9
13,0
70
14
,081
,048
Res
trict
ed91
3,61
3
90
7,15
5
928,
616
1,
152,
845
1,37
8,43
9
1,
443,
083
1,60
5,76
3
1,
644,
109
Unr
estri
cted
(def
icit)
(1,8
92,0
55)
(2
,391
,517
)
(2,2
03,5
18)
(1
,572
,611
)
(840
,389
)
(1
94,9
53)
51,5
82
(9
72,8
62)
Sub
tota
l gov
ernm
enta
l act
iviti
es n
et a
sset
s96
6,06
5
72
6,27
8
1,10
9,10
7
2,
136,
790
14,1
05,5
63
15,4
40,6
24
15,5
70,4
15
14
,752
,295
Bus
ines
s-ty
pe a
ctiv
ities
Inv
este
d in
cap
ital a
sset
s, n
et o
f rel
ated
deb
t40
2,52
8
49
5,54
9
622,
282
79
3,51
7
1,82
7,22
5
2,
190,
999
2,25
9,61
7
2,
217,
449
Res
trict
ed91
,994
12
7,19
2
105,
557
74
,173
16
5,42
7
186,
266
30
7,98
5
192,
427
Unr
estri
cted
(def
icit)
(748
,183
)
(7
34,9
42)
(590
,882
)
(6
24,5
77)
(444
,450
)
(6
40,6
91)
(824
,889
)
(1,0
32,6
77)
Sub
tota
l bus
ines
s-ty
pe a
ctiv
ites
net a
sset
s(2
53,6
61)
(112
,201
)
13
6,95
7
243,
113
1,
548,
202
1,73
6,57
4
1,
742,
713
1,37
7,19
9
Prim
ary
gove
rnm
ent
Inv
este
d in
cap
ital a
sset
s, n
et o
f rel
ated
deb
t2,
347,
035
2,
706,
189
3,00
6,29
1
3,
350,
073
15,3
94,7
38
16,3
83,4
93
16,1
72,6
87
16
,298
,497
Res
trict
ed1,
005,
607
1,
034,
347
1,03
4,17
3
1,
227,
018
1,54
3,86
6
1,
629,
349
1,91
3,74
8
1,
836,
536
Unr
estri
cted
(def
icit)
(2,6
40,2
38)
(3
,126
,459
)
(2,7
94,4
00)
(2
,197
,188
)
(1,2
84,8
39)
(8
35,6
44)
(773
,307
)
(2,0
05,5
39)
Tota
l prim
ary
gove
rnm
ent n
et a
sset
s71
2,40
4$
614,
077
1,
246,
064
2,37
9,90
3
15
,653
,765
17
,177
,198
17
,313
,128
16,1
29,4
94
Not
es:
(1)
Tre
nd d
ata
is a
vaila
ble
for o
nly
the
prio
r sev
en fi
scal
yea
rs, w
ith th
e im
plem
enta
tion
of G
AS
B 3
4 .(2
) A
sset
rest
rictio
ns a
re p
rimar
ily d
ue to
ext
erna
l res
trict
ions
impo
sed
by S
tate
legi
slat
ion
and
bond
cov
enan
ts.
157

CO
UN
TY O
F LO
S A
NG
ELE
SC
HA
NG
ES
IN N
ET
AS
SE
TS (U
NA
UD
ITE
D)
LAS
T E
IGH
T FI
SC
AL
YE
AR
S (i
n th
ousa
nds)
(acc
rual
bas
is o
f acc
ount
ing)
(1)
2001
-02
2002
-03
2003
-04
2004
-05
2005
-06
2006
-07
2007
-08
2008
-09
Expe
nses
G
over
nmen
t act
iviti
es:
G
ener
al g
over
nmen
t61
1,20
3$
76
4,58
8
65
0,09
6
666,
778
79
5,29
0
80
7,15
5
1,17
1,44
8
1,10
3,36
1
Pub
lic p
rote
ctio
n3,
937,
519
4,17
7,04
9
4,04
4,82
4
4,
159,
675
4,44
3,43
2
4,87
2,41
3
5,
799,
593
6,
125,
158
P
ublic
way
s an
d fa
cilit
ies
208,
299
22
7,77
6
22
2,41
6
249,
065
36
0,98
0
28
2,82
7
299,
304
327,
403
H
ealth
and
san
itatio
n1,
795,
060
1,88
8,14
1
1,91
8,83
1
1,
941,
315
2,15
1,51
5
2,22
3,69
5
2,
638,
135
2,
783,
150
P
ublic
ass
ista
nce
4,50
5,31
9
4,
604,
757
4,
383,
626
4,39
8,39
1
4,
465,
520
4,
539,
458
5,06
1,36
7
5,23
3,38
9
Edu
catio
n73
,455
75,0
79
77,2
07
86
,707
92
,867
99
,136
11
2,03
5
10
9,91
0
Rec
reat
ion
and
cultu
ral s
ervi
ces
231,
605
22
8,00
8
22
9,54
1
236,
421
24
0,27
4
26
6,96
7
290,
669
331,
726
I
nter
est o
n lo
ng-te
rm d
ebt
249,
586
27
0,33
6
24
0,49
4
223,
696
22
1,83
8
23
9,60
8
191,
551
165,
782
Sub
tota
l gov
ernm
enta
l act
iviti
es e
xpen
ses
11,6
12,0
46
12
,235
,734
11,7
67,0
35
11,9
62,0
48
12,7
71,7
16
13,3
31,2
59
15,5
64,1
02
16
,179
,879
B
usin
ess-
type
act
iviti
es:
Hos
pita
ls(2
)3,
086,
454
3,15
8,45
8
3,06
3,73
2
3,
235,
176
2,77
8,25
1
2,89
4,49
3
3,
092,
682
3,
443,
266
A
viat
ion
4,61
8
4,61
7
5,15
5
5,
747
5,23
6
5,
761
4,18
2
5,07
3
Wat
erw
orks
39,8
57
42
,448
45
,473
43,4
44
67,5
63
97,5
04
74,8
10
76,9
04
Com
mun
ity D
evel
opm
ent C
omm
issi
on19
8,34
0
223,
808
222,
207
21
7,56
0
202,
298
211,
077
24
6,19
5
26
8,20
1 S
ubto
tal b
usin
ess-
type
act
iviti
es e
xpen
se3,
329,
269
3,42
9,33
1
3,33
6,56
7
3,
501,
927
3,05
3,34
8
3,20
8,83
5
3,
417,
869
3,
793,
444
Tota
l prim
ary
gove
rnm
ent e
xpen
ses
14,9
41,3
15
15
,665
,065
15,1
03,6
02
15,4
63,9
75
15,8
25,0
64
16,5
40,0
94
18,9
81,9
71
19
,973
,323
Prog
ram
Rev
enue
s
Gov
ernm
enta
l act
iviti
es:
C
harg
es fo
r ser
vice
s
G
ener
al g
over
nmen
t33
2,28
2
354,
291
371,
723
37
1,33
8
500,
233
451,
050
44
5,94
8
63
4,15
3
P
ublic
pro
tect
ion
981,
002
1,
021,
186
1,
055,
700
1,11
2,28
8
1,
118,
277
1,
189,
730
1,27
3,71
0
1,32
3,59
3
H
ealth
and
san
itatio
n37
5,48
4
385,
490
357,
229
37
8,32
4
469,
450
518,
893
70
8,09
7
48
4,24
0
R
ecre
atio
n an
d cu
ltura
l se
rvic
es15
4,70
4
152,
908
157,
486
15
9,99
9
165,
980
173,
531
20
6,36
4
17
2,89
9
O
ther
cha
rges
for
serv
ices
54,5
48
81
,388
55
,947
65,6
29
83,6
94
63,6
64
104,
433
79,8
44
Sub
tota
l gov
ernm
enta
l act
iviti
es c
harg
es fo
r ser
vice
s1,
898,
020
1,99
5,26
3
1,99
8,08
5
2,
087,
578
2,33
7,63
4
2,39
6,86
8
2,
738,
552
2,
694,
729
O
pera
ting
gran
ts a
nd c
ontri
butio
ns6,
243,
962
6,37
3,40
5
6,36
2,28
5
6,
551,
225
6,80
1,25
6
6,98
0,54
9
7,
113,
135
7,
215,
270
C
apita
l gra
nts
and
cont
ribut
ions
27,5
34
38
,471
59
,650
44,0
72
64,2
58
25,1
35
184,
502
206,
137
Tota
l gov
ernm
enta
l act
iviti
es p
rogr
am re
venu
e8,
169,
516
8,40
7,13
9
8,42
0,02
0
8,
682,
875
9,20
3,14
8
9,40
2,55
2
10
,036
,189
10,1
16,1
36
Bus
ines
s-ty
pe a
ctiv
ities
:
Cha
rges
for s
ervi
ces
Hos
pita
ls(2
)2,
516,
003
2,59
4,76
2
2,39
7,04
7
2,
390,
770
1,91
3,81
5
1,86
4,20
9
1,
730,
231
2,
022,
633
Oth
er c
harg
es fo
r ser
vice
s46
,958
50,1
87
57,1
50
68
,151
90
,604
93
,770
76
,516
73
,311
S
ubto
tal b
usin
ess-
type
act
iviti
es c
harg
es fo
r ser
vice
s2,
562,
961
2,64
4,94
9
2,45
4,19
7
2,
458,
921
2,00
4,41
9
1,95
7,97
9
1,
806,
747
2,
095,
944
O
pera
ting
gran
ts a
nd c
ontri
butio
ns26
7,32
9
295,
296
277,
427
26
2,63
6
309,
526
304,
720
26
3,47
1
27
9,19
5
Cap
ital g
rant
s an
d co
ntrib
utio
ns13
,765
26,8
51
83,5
37
13
8,72
3
74,8
21
12,9
92
2,89
7
837
Tota
l bus
ines
s-ty
pe a
ctiv
ities
pro
gram
reve
nue
2,84
4,05
5
2,
967,
096
2,
815,
161
2,86
0,28
0
2,
388,
766
2,
275,
691
2,07
3,11
5
2,37
5,97
6To
tal p
rimar
y go
vern
men
t rev
enue
s11
,013
,571
11,3
74,2
35
11
,235
,181
11
,543
,155
11
,591
,914
11
,678
,243
12
,109
,304
12,4
92,1
12C
ontin
ued.
. .
158

CO
UN
TY O
F LO
S A
NG
ELE
SC
HA
NG
ES
IN N
ET
AS
SE
TS (U
NA
UD
ITE
D) -
Con
tinue
dLA
ST
EIG
HT
FIS
CA
L Y
EA
RS
(in
thou
sand
s)(a
ccru
al b
asis
of a
ccou
ntin
g)(1
)20
01-0
220
02-0
320
03-0
420
04-0
520
05-0
620
06-0
720
07-0
820
08-0
9N
et (e
xpen
se) /
reve
nue:
Gov
ernm
enta
l act
iviti
es(3
,442
,530
)
(3
,828
,595
)
(3
,347
,015
)
(3
,279
,173
)
(3
,568
,568
)
(3,9
28,7
07)
(5
,527
,913
)
(6,0
63,7
43)
Bus
ines
s-ty
pe a
ctiv
ities
(485
,214
)
(462
,235
)
(521
,406
)
(641
,647
)
(664
,582
)
(9
33,1
44)
(1,3
44,7
54)
(1
,417
,468
)To
tal p
rimar
y go
vern
men
t net
exp
ense
s(3
,927
,744
)
(4
,290
,830
)
(3
,868
,421
)
(3
,920
,820
)
(4
,233
,150
)
(4,8
61,8
51)
(6
,872
,667
)
(7,4
81,2
11)
Gen
eral
Rev
enue
s an
d O
ther
Cha
nges
in N
et A
sset
s
Gov
ernm
enta
l Act
iviti
es:
Taxe
s2,
349,
836
2,49
3,27
4
2,
912,
645
3,80
4,85
9
4,
292,
919
4,68
8,59
5
5,
034,
399
5,19
2,56
6
In
terg
over
nmen
tal-m
otor
veh
icle
in-li
eu ta
xes,
not
rest
ricte
d67
5,00
4
690,
854
57
3,85
9
U
nres
trict
ed g
rant
s an
d co
ntrib
utio
ns70
6,16
7
703,
520
71
1,96
1
731,
767
73
0,51
6
761,
705
77
8,93
675
6,41
7
In
vest
men
t ear
ning
s15
4,43
9
102,
573
57
,807
137,
382
24
4,00
5
335,
851
32
4,13
219
7,70
5
M
isce
llane
ous
148,
622
13
6,70
2
186,
406
13
0,90
4
171,
049
25
9,35
7
229,
810
142,
075
Spe
cial
Item
- C
ontri
butio
n of
Dis
ney
Hal
l18
8,49
3
267,
473
Tran
sfer
s (N
et)
(550
,302
)
(538
,115
)
(712
,834
)
(686
,549
)
(989
,117
)
(1
,049
,213
)
(1,1
52,9
46)
(1
,011
,862
) S
ubto
tal g
over
nmen
tal a
ctiv
ities
3,48
3,76
6
3,
588,
808
3,72
9,84
4
4,
306,
856
4,44
9,37
2
5,
263,
768
5,21
4,33
1
5,27
6,90
1
Bus
ines
s-ty
pe a
ctiv
ities
:
Ta
xes
2,55
0
2,77
2
2,84
5
701
74
3
3,78
2
4,
405
4,45
3
U
nres
trict
ed g
rant
s an
d co
ntrib
utio
ns33
32
32
34
34
35
37
37
Inve
stm
ent e
arni
ngs
4,41
5
4,37
3
1,45
2
6,41
6
9,70
3
18
,043
14
,073
9,
844
Mis
cella
neou
s50
,860
58,4
03
53
,401
54,1
03
58
,804
50
,443
24
,950
25
,758
Tran
sfer
s (N
et)
550,
302
53
8,11
5
712,
834
68
6,54
9
989,
117
1,
049,
213
1,15
2,94
6
1,01
1,86
2 S
ubto
tal b
usin
ess-
type
act
iviti
es60
8,16
0
603,
695
77
0,56
4
747,
803
1,
058,
401
1,12
1,51
6
1,
196,
411
1,
051,
954
Tota
l prim
ary
gove
rnm
ent
4,09
1,92
6
4,
192,
503
4,50
0,40
8
5,
054,
659
5,50
7,77
3
6,
385,
284
6,41
0,74
2
6,32
8,85
5C
hang
esin
Net
Ass
ets
Gov
ernm
ent a
ctiv
ities
41,2
36
(2
39,7
87)
38
2,82
9
1,02
7,68
3
88
0,80
4
1,33
5,06
1
(3
13,5
82)
(786
,842
)B
usin
ess-
type
act
iviti
es12
2,94
6
141,
460
24
9,15
8
106,
156
39
3,81
9
188,
372
(1
48,3
43)
(365
,514
)To
tal p
rimar
y go
vern
men
t16
4,18
2$
(9
8,32
7)
63
1,98
7
1,13
3,83
9
1,
274,
623
1,52
3,43
3
(4
61,9
25)
(1,1
52,3
56)
Not
es:
(1)
Tre
nd d
ata
is a
vaila
ble
for o
nly
the
prio
r sev
en fi
scal
yea
rs, w
ith th
e im
plem
enta
tion
of G
AS
B 3
4.(2
)A
mou
nts
pres
ente
dfo
r200
2B
usin
ess-
type
act
iviti
esha
vebe
en re
clas
sifie
d an
d ad
just
edto
con
form
toth
e cu
rren
t yea
r's p
rese
ntat
ion
form
at.
Cha
rges
for s
ervi
ces
reve
nues
and
Hos
pita
l exp
ense
s ha
ve e
ach
been
incr
ease
dby
$568
.6 m
illio
nto
mor
e ap
prop
riate
lydi
spla
yH
ospi
tal
inte
rgov
ernm
enta
ltra
nsfe
r exp
ense
s an
d re
late
d re
venu
es.
159
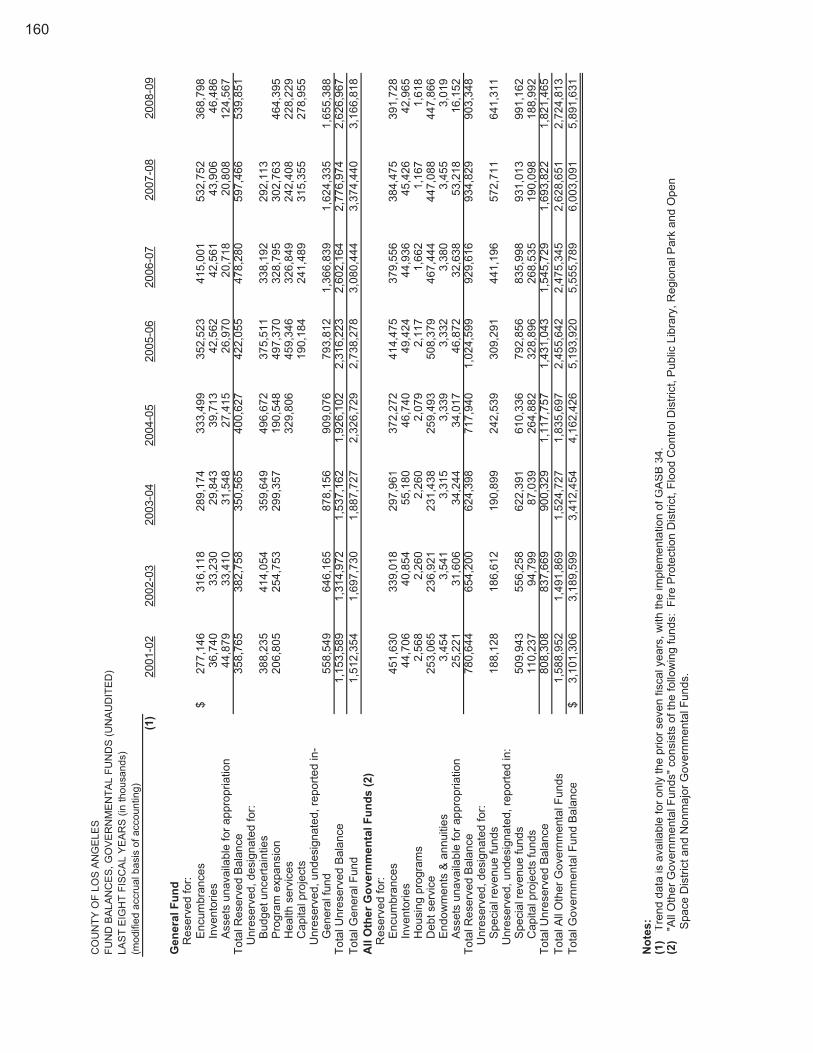
CO
UN
TY O
F LO
S A
NG
ELE
SFU
ND
BA
LAN
CE
S, G
OV
ER
NM
EN
TAL
FUN
DS
(UN
AU
DIT
ED
)LA
ST
EIG
HT
FIS
CA
L Y
EA
RS
(in
thou
sand
s)(m
odifi
ed a
ccru
al b
asis
of a
ccou
ntin
g)(1
)20
01-0
220
02-0
320
03-0
420
04-0
520
05-0
620
06-0
720
07-0
820
08-0
9
Gen
eral
Fun
d
Res
erve
d fo
r:
Enc
umbr
ance
s27
7,14
6$
31
6,11
8
289,
174
33
3,49
9
352,
523
415,
001
532,
752
36
8,79
8
Inv
ento
ries
36,7
40
33
,230
29,8
43
39
,713
42,5
62
42,5
61
43,9
06
46
,486
A
sset
s un
avai
labl
e fo
r app
ropr
iatio
n44
,879
33,4
10
31
,548
27,4
15
26
,970
20
,718
20
,808
124,
567
Tota
l Res
erve
d B
alan
ce35
8,76
5
38
2,75
8
350,
565
40
0,62
7
422,
055
478,
280
597,
466
53
9,85
1
Unr
eser
ved,
des
igna
ted
for:
B
udge
t unc
erta
intie
s38
8,23
5
41
4,05
4
359,
649
49
6,67
2
375,
511
338,
192
292,
113
P
rogr
am e
xpan
sion
206,
805
254,
753
29
9,35
7
190,
548
49
7,37
0
32
8,79
5
30
2,76
3
464,
395
H
ealth
ser
vice
s32
9,80
6
459,
346
326,
849
242,
408
22
8,22
9
Cap
ital p
roje
cts
190,
184
241,
489
315,
355
27
8,95
5
Unr
eser
ved,
und
esig
nate
d, re
porte
d in
-
Gen
eral
fund
558,
549
646,
165
87
8,15
6
909,
076
79
3,81
2
1,
366,
839
1,
624,
335
1,65
5,38
8To
tal U
nres
erve
d B
alan
ce1,
153,
589
1,
314,
972
1,53
7,16
2
1,
926,
102
2,31
6,22
3
2,60
2,16
4
2,77
6,97
4
2,
626,
967
Tota
l Gen
eral
Fun
d1,
512,
354
1,
697,
730
1,88
7,72
7
2,
326,
729
2,73
8,27
8
3,08
0,44
4
3,37
4,44
0
3,
166,
818
All
Oth
er G
over
nmen
tal F
unds
(2)
R
eser
ved
for:
E
ncum
bran
ces
451,
630
339,
018
29
7,96
1
372,
272
41
4,47
5
37
9,55
6
38
4,47
5
391,
728
I
nven
torie
s44
,706
40,8
54
55
,180
46,7
40
49
,424
44
,936
45
,426
42,9
65
Hou
sing
pro
gram
s2,
568
2,
260
2,26
0
2,
079
2,11
7
1,
662
1,16
7
1,
618
D
ebt s
ervi
ce25
3,06
5
23
6,92
1
231,
438
25
9,49
3
508,
379
467,
444
447,
088
44
7,86
6
End
owm
ents
& a
nnui
ties
3,45
4
3,54
1
3,
315
3,33
9
3,
332
3,38
0
3,
455
3,01
9
Ass
ets
unav
aila
ble
for a
ppro
pria
tion
25,2
21
31
,606
34,2
44
34
,017
46,8
72
32,6
38
53,2
18
16
,152
Tota
l Res
erve
d B
alan
ce78
0,64
4
65
4,20
0
624,
398
71
7,94
0
1,02
4,59
9
929,
616
934,
829
90
3,34
8
Unr
eser
ved,
des
igna
ted
for:
S
peci
al re
venu
e fu
nds
188,
128
186,
612
19
0,89
9
242,
539
30
9,29
1
44
1,19
6
57
2,71
1
641,
311
U
nres
erve
d, u
ndes
igna
ted,
repo
rted
in:
S
peci
al re
venu
e fu
nds
509,
943
556,
258
62
2,39
1
610,
336
79
2,85
6
83
5,99
8
93
1,01
3
991,
162
C
apita
l pro
ject
s fu
nds
110,
237
94,7
99
87
,039
264,
882
32
8,89
6
26
8,53
5
19
0,09
8
188,
992
Tota
l Unr
eser
ved
Bal
ance
808,
308
837,
669
90
0,32
9
1,11
7,75
7
1,
431,
043
1,
545,
729
1,
693,
822
1,82
1,46
5To
tal A
ll O
ther
Gov
ernm
enta
l Fun
d s1,
588,
952
1,
491,
869
1,52
4,72
7
1,
835,
697
2,45
5,64
2
2,47
5,34
5
2,62
8,65
1
2,
724,
813
Tota
l Gov
ernm
enta
l Fun
d B
alan
c e3,
101,
306
$
3,
189,
599
3,41
2,45
4
4,
162,
426
5,19
3,92
0
5,55
5,78
9
6,00
3,09
1
5,
891,
631
Not
es:
(1)
Tren
dda
tais
ava
ilabl
efo
r onl
yth
e pr
ior s
even
fisc
al y
ears
, with
the
impl
emen
tatio
n of
GA
SB
34.
(2)
"All
Oth
erG
over
nmen
talF
unds
" con
sist
s of
the
follo
win
gfu
nds:
Fire
Pro
tect
ion
Dis
trict
,Flo
odC
ontro
lDis
trict
,Pub
licLi
brar
y,R
egio
nalP
ark
and
Ope
nS
pace
Dis
trict
and
Non
maj
or G
over
nmen
tal F
unds
.
160

161
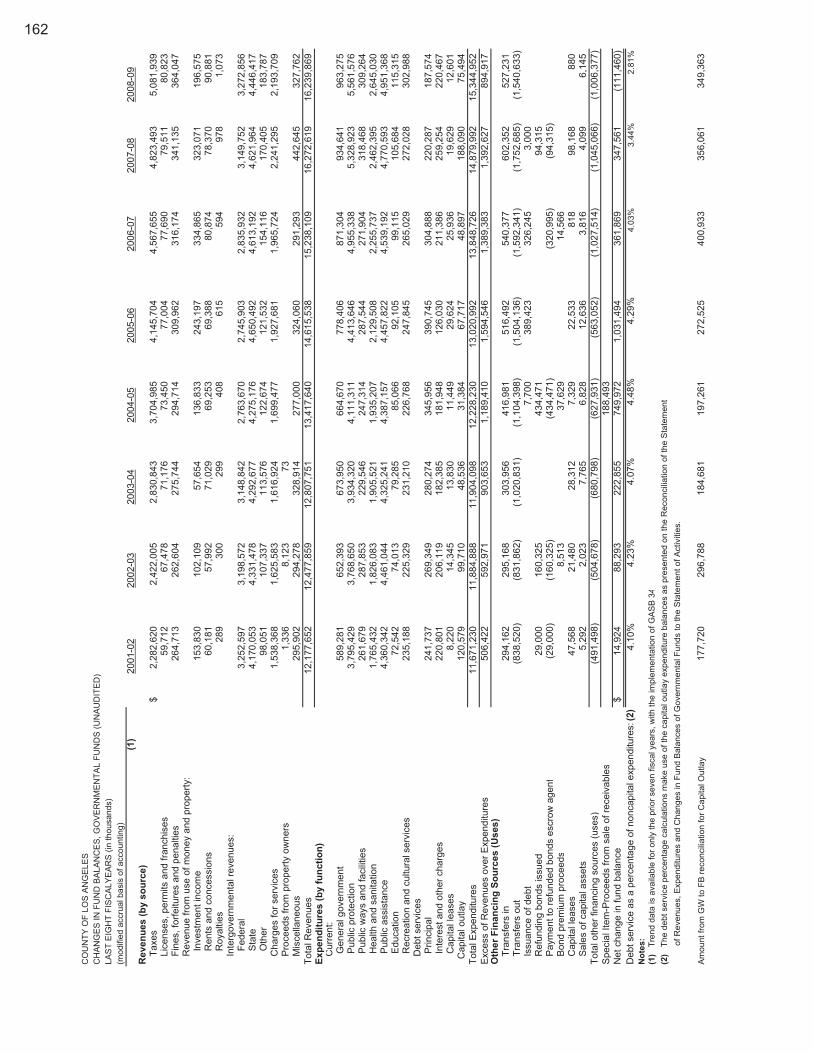
CO
UN
TY O
F LO
S A
NG
ELE
SC
HA
NG
ES
IN F
UN
D B
ALA
NC
ES
, GO
VE
RN
ME
NTA
L FU
ND
S (U
NA
UD
ITE
D)
LAS
T E
IGH
T FI
SC
ALY
EA
RS
(in
thou
sand
s)(m
odifi
ed a
ccru
al b
asis
of a
ccou
ntin
g)
(1)
2001
-02
2002
-03
2003
-04
2004
-05
2005
-06
2006
-07
2007
-08
2008
-09
Rev
enue
s (b
y so
urce
)
Taxe
s2,
282,
620
$
2,42
2,00
5
2,
830,
843
3,70
4,98
5
4,
145,
704
4,
567,
655
4,82
3,49
3
5,
081,
939
Li
cens
es, p
erm
its a
nd fr
anch
ise s
59,7
12
67
,478
71
,176
73
,450
77
,004
77
,690
79,5
11
80
,823
Fi
nes,
forfe
iture
s an
d pe
nalti
es26
4,71
3
262,
604
27
5,74
4
294,
714
30
9,96
2
31
6,17
4
341,
135
36
4,04
7
Rev
enue
from
use
of m
oney
and
pro
perty
:
Inv
estm
ent i
ncom
e15
3,83
0
102,
109
57
,654
13
6,83
3
243,
197
334,
865
32
3,07
1
196,
575
R
ents
and
con
cess
ions
60,1
81
57
,992
71
,029
69
,253
69
,388
80
,874
78,3
70
90
,881
R
oyal
ties
289
30
0
299
40
8
615
59
4
97
8
1,07
3
Inte
rgov
ernm
enta
l rev
enue
s:
Fed
eral
3,25
2,59
7
3,
198,
572
3,14
8,84
2
2,
763,
670
2,74
5,90
3
2,83
5,93
2
3,
149,
752
3,27
2,85
6
Sta
te4,
170,
053
4,33
1,47
8
4,
292,
677
4,27
5,17
6
4,
650,
492
4,
613,
192
4,62
1,96
4
4,
446,
417
O
ther
98,0
51
10
7,33
7
113,
576
12
2,67
4
121,
532
154,
116
17
0,40
5
183,
787
C
harg
es fo
r ser
vice
s1,
538,
368
1,62
5,58
3
1,
616,
924
1,69
9,47
7
1,
927,
681
1,
965,
724
2,24
1,29
5
2,
193,
709
P
roce
eds
from
pro
perty
ow
ner s
1,33
6
8,
123
73
Mis
cella
neou
s29
5,90
2
294,
278
32
8,91
4
277,
000
32
4,06
0
29
1,29
3
442,
645
32
7,76
2To
tal R
even
ues
12,1
77,6
52
12,4
77,8
59
12,8
07,7
51
13,4
17,6
40
14,6
15,5
38
15,2
38,1
09
16
,272
,619
16
,239
,869
Expe
nditu
res
(by
func
tion)
Cur
rent
:
Gen
eral
gov
ernm
ent
589,
281
65
2,39
3
673,
950
66
4,67
0
778,
406
871,
304
93
4,64
1
963,
275
P
ublic
pro
tect
ion
3,79
5,42
9
3,
768,
650
3,93
4,32
0
4,
111,
311
4,41
3,64
6
4,95
5,33
8
5,
328,
923
5,56
1,57
6
Pub
lic w
ays
and
faci
litie
s26
1,67
9
287,
853
22
9,54
6
247,
314
28
7,54
4
27
1,90
4
318,
468
30
9,26
4
Hea
lth a
nd s
anita
tion
1,76
5,43
2
1,
826,
083
1,90
5,52
1
1,
935,
207
2,12
9,50
8
2,25
5,73
7
2,
462,
395
2,64
5,03
0
Pub
lic a
ssis
tanc
e4,
360,
342
4,46
1,04
4
4,
325,
241
4,38
7,15
7
4,
457,
822
4,
539,
192
4,77
0,59
3
4,
951,
368
E
duca
tion
72,5
42
74
,013
79
,285
85
,066
92
,105
99
,115
105,
684
11
5,31
5
Rec
reat
ion
and
cultu
ral s
ervi
ces
235,
188
22
5,32
9
231,
210
22
6,76
8
247,
845
265,
029
27
2,02
8
302,
988
D
ebt s
ervi
ces
P
rinci
pal
241,
737
26
9,34
9
280,
274
34
5,95
6
390,
745
304,
888
22
0,28
7
187,
574
In
tere
st a
nd o
ther
cha
rges
220,
801
20
6,11
9
182,
385
18
1,94
8
126,
030
211,
386
25
9,25
4
220,
467
C
apita
l lea
ses
8,22
0
14
,345
13
,830
11
,449
29
,624
25
,936
19,6
29
12
,601
Cap
ital o
utla
y12
0,57
9
99,7
10
48,5
36
31,3
84
67,7
17
48,8
97
18
8,09
0
75,4
94To
tal E
xpen
ditu
res
11,6
71,2
30
11,8
84,8
88
11,9
04,0
98
12,2
28,2
30
13,0
20,9
92
13,8
48,7
26
14
,879
,992
15
,344
,952
Exc
ess
of R
even
ues
over
Exp
endi
ture
s50
6,42
2
592,
971
90
3,65
3
1,18
9,41
0
1,
594,
546
1,
389,
383
1,39
2,62
7
89
4,91
7O
ther
Fina
ncin
gSo
urce
s(U
ses)
Tr
ansf
ers
in29
4,16
2
295,
168
30
3,95
6
416,
981
51
6,49
2
54
0,37
7
602,
352
52
7,23
1
Tran
sfer
s ou
t(8
38,5
20)
(8
31,8
62)
(1,0
20,8
31)
(1
,104
,398
)
(1,5
04,1
36)
(1
,592
,341
)
(1
,752
,685
)
(1
,540
,633
)
Issu
ance
of d
ebt
7,70
0
38
9,42
3
32
6,24
5
3,00
0
Ref
undi
ng b
onds
issu
ed29
,000
160,
325
43
4,47
1
94,3
15
Pay
men
t to
refu
nded
bon
ds e
scro
w a
gent
(29,
000)
(1
60,3
25)
(434
,471
)
(3
20,9
95)
(9
4,31
5)
Bon
d pr
emiu
m p
roce
eds
8,51
3
37
,629
14
,566
C
apita
l lea
ses
47,5
68
21
,480
28
,312
7,
329
22,5
33
818
98,1
68
88
0
Sal
es o
f cap
ital a
sset
s5,
292
2,02
3
7,
765
6,82
8
12
,636
3,
816
4,
099
6,14
5To
tal o
ther
fina
ncin
g so
urce
s (u
ses)
(491
,498
)
(504
,678
)
(6
80,7
98)
(627
,931
)
(5
63,0
52)
(1,0
27,5
14)
(1,0
45,0
66)
(1,0
06,3
77)
Spe
cial
Item
-Pro
ceed
s fro
m s
ale
of re
ceiv
able
s18
8,49
3
Net
cha
nge
in fu
nd b
alan
c e14
,924
$
88,2
93
222,
855
74
9,97
2
1,03
1,49
4
361,
869
34
7,56
1
(111
,460
)D
ebt s
ervi
ce a
s a
perc
enta
ge o
f non
capi
tal e
xpen
ditu
res:
(2)
4.10
%4.
23%
4.07
%4.
48%
4.29
%4.
03%
3.44
%2.
81%
Not
es:
(1)
Tre
nd d
ata
is a
vaila
ble
for o
nly
the
prio
r sev
en fi
scal
yea
rs, w
ith th
e im
plem
enta
tion
of G
AS
B 3
4(2
) T
he d
ebt s
ervi
ce p
erce
ntag
e ca
lcul
atio
ns m
ake
use
of th
e ca
pita
l out
lay
expe
nditu
re b
alan
ces
as p
rese
nted
on
the
Rec
onci
liatio
n of
the
Sta
tem
ent
of R
even
ues,
Exp
endi
ture
s an
d C
hang
es in
Fun
d B
alan
ces
of G
over
nmen
tal F
unds
to th
e S
tate
men
t of A
ctiv
ities
.
Am
ount
from
GW
to F
B re
conc
iliat
ion
for C
apita
l Out
lay
177,
720
296,
788
18
4,68
1
197,
261
27
2,52
5
400,
933
356,
061
349,
363
162

024681012141618
CO
UN
TY o
f LO
S A
NG
ELES
Gov
ernm
enta
l Fun
ds E
xpen
ditu
res
and
Rev
enue
sLa
st E
ight
Fis
cal Y
ears
Exp
endi
ture
sR
even
ues
Exp
endi
ture
s11
.711
.911
.912
.213
.013
.814
.915
.3R
even
ues
12.2
12.5
12.8
13.4
14.6
15.2
16.3
16.2
01-0
202
-03
03-0
404
-05
05-0
606
-07
07-0
808
-09
In B
illio
ns o
f Dol
lars
163

AS
SE
SS
ED
VA
LUE
AN
D A
CTU
AL
VA
LUE
OF
TAX
AB
LE P
RO
PE
RTY
(U
NA
UD
ITE
D)
(1)
LAS
TTE
NFI
SC
AL
YE
AR
S(in
thou
sand
s)
(2)
(3)
(4)
(5)
Tota
l Tax
able
Tota
l Dire
ctFi
scal
Yea
rS
ecur
edU
nsec
ured
Uni
tary
Exe
mpt
Ass
esse
d V
alue
Tax
Rat
e19
99 -
2000
521,
494,
390
$
37,8
26,5
56$
12,5
05,9
63$
(25,
495,
993)
$
54
6,33
0,91
6$
1.00
000%
2000
- 20
0155
6,12
0,73
7
40
,449
,723
12
,348
,515
(2
6,47
2,18
2)
58
2,44
6,79
3
1.
0000
0%20
01 -
2002
592,
345,
254
44,3
94,2
54
12,4
25,6
35
(26,
803,
046)
622,
362,
097
1.00
000%
2002
- 20
0363
2,81
5,10
5
43
,785
,523
12
,357
,025
(2
8,70
2,61
2)
66
0,25
5,04
1
1.
0000
0%20
03 -
2004
683,
216,
372
44,7
45,1
97
11,5
87,7
36
(29,
937,
047)
709,
612,
258
1.00
000%
2004
- 20
0573
8,65
8,95
7
43
,898
,983
10
,648
,846
(3
1,85
1,68
9)
76
1,35
5,09
7
1.
0000
0%20
05 -
2006
813,
276,
803
43,9
64,9
97
10,7
18,1
05
(32,
058,
237)
835,
901,
668
1.00
000%
2006
- 20
0790
5,27
6,18
2
45
,783
,429
10
,638
,106
(3
6,18
2,79
3)
92
5,51
4,92
4
1.
0000
0%20
07 -
2008
990,
301,
135
48,5
43,9
26
11,1
58,2
01
(40,
091,
971)
1,00
9,91
1,29
1
1.00
000%
2008
- 20
091,
057,
718,
427
52
,279
,248
12
,298
,465
(4
1,41
8,99
9)
1,
080,
877,
141
1.
0000
0%
Not
es:
(1)
Due
to th
e 19
78 p
assa
ge o
f the
pro
perty
tax
initi
ativ
e P
ropo
sitio
n 13
(Pro
p 13
), th
e C
ount
y do
es n
ot tr
ack
the
estim
ated
act
ual v
alue
of a
ll C
ount
y pr
oper
ties.
Und
er P
rop
13 p
rope
rty is
ass
esse
d at
the
1978
mar
ket
valu
e w
ith a
n an
nual
incr
ease
lim
ited
to th
e le
sser
of 2
% o
r the
CP
I on
prop
erty
not
invo
lved
in a
cha
nge
of
ow
ners
hip
or p
rope
rties
that
did
not
und
ergo
new
con
stru
ctio
n. N
ewly
acq
uire
d pr
oper
ty is
ass
esse
d at
its
new
mar
ket v
alue
(usu
ally
the
purc
hase
pric
e) a
nd th
e va
lue
of a
ny n
ew c
onst
ruct
ion
is a
dded
to th
e ex
istin
g
ba
se v
alue
of a
par
cel.
As
a re
sult,
sim
ilar p
rope
rties
can
hav
e su
bsta
ntia
lly d
iffer
ent a
sses
sed
valu
es b
ased
on th
e da
te o
f pur
chas
e. A
dditi
onal
ly, P
rop
13 li
mits
the
prop
erty
tax
rate
to 1
% o
f ass
esse
d va
lue
plus
the
rate
nec
essa
ry to
fund
loca
l vot
er-a
ppro
ved
bond
s an
d sp
ecia
l ass
essm
ents
.(2
) S
ecur
ed p
rope
rty is
gen
eral
ly re
al p
rope
rty, a
s de
fined
as
land
, min
es, m
iner
als,
tim
ber a
nd im
prov
emen
ts
suc
h as
bui
ldin
gs, s
truct
ures
, cro
ps, t
rees
and
vin
es.
(3)
Uns
ecur
ed p
rope
rty is
gen
eral
ly p
erso
nal p
rope
rty in
clud
ing
mac
hine
ry, e
quip
men
t, of
fice
tool
s an
d su
pplie
s.(4
) U
nita
ry p
rope
rties
are
railr
oads
and
util
ities
cro
ssin
g th
e C
ount
y an
d ar
e as
sess
ed b
y th
e S
tate
Boa
rd o
f
E
qual
izat
ion.
(5)
Exe
mpt
pro
perti
es in
clud
e nu
mer
ous
full
and
parti
al e
xclu
sion
s/ex
empt
ions
pro
vide
d by
the
Sta
te C
onst
itutio
n
a
nd th
e le
gisl
atur
e th
at re
lieve
cer
tain
taxp
ayer
s fro
m th
e bu
rden
of p
ayin
g pr
oper
ty ta
xes.
Sour
ce:
Aud
itor-
Con
trolle
r, C
ount
y of
Los
Ang
eles
Tax
paye
rs' G
uide
CO
UN
TY O
F LO
S A
NG
ELE
S
164

CO
UN
TY O
F LO
S A
NG
ELE
SD
IRE
CT
AN
D O
VE
RLA
PP
ING
PR
OP
ER
TY T
AX
RA
TES
FO
R T
AX
RA
TE A
RE
A #
4 (U
NA
UD
ITE
D)
LAS
T TE
N F
ISC
AL
YE
AR
S
Cou
nty
Dire
ct R
ates
Ove
rlapp
ing
Rat
esTo
tal R
ates
Los
Ang
eles
Los
Ang
eles
Fisc
alLo
s A
ngel
esC
ount
y D
eten
tion
Floo
d C
ontro
l C
ity T
a xS
choo
lM
etro
polit
anY
ear
Gen
eral
Faci
litie
s(1
)D
istri
cts
(1)
Dis
trict
No.
1D
istri
cts
Wat
er D
istri
ct
1999
- 20
001.
0000
0.0
0142
2.0
0176
5.0
3111
3.0
3152
8.0
0890
01.
0747
28
2000
- 20
011.
0000
0.0
0131
4.0
0155
2.0
2639
1.0
4076
5.0
0880
01.
0788
22
2001
- 20
021.
0000
0.0
0112
8.0
0107
3.0
4005
1.0
6412
5.0
0770
01.
1140
77
2002
- 20
031.
0000
0.0
0103
3.0
0088
1.0
4231
2.0
5157
1.0
0670
01.
1024
97
2003
- 20
041.
0000
0.0
0099
2.0
0046
2.0
5057
4.0
9700
2.0
0610
01.
1551
30
2004
- 20
051.
0000
0.0
0092
3.0
0024
5.0
5573
3.1
0693
7.0
0580
01.
1696
38
2005
- 20
061.
0000
0.0
0079
5.0
0004
9.0
5128
9.0
9863
4.0
0520
01.
1559
67
2006
- 20
071.
0000
0.0
0066
3.0
0005
2.0
4535
4.1
2827
6.0
0470
01.
1790
45
2007
- 20
081.
0000
0.0
0000
0.0
0000
0.0
3805
1.1
3213
6.0
0450
01.
1746
87
2008
- 20
091.
0000
0.0
0000
0.0
0000
0.0
3854
1.1
4689
7.0
0430
01.
1897
38
Not
es:
(1)
The
Sec
ured
Tax
Rat
e an
d R
atio
s R
epor
t no
long
er in
clud
es th
e D
eten
tion
Faci
litie
s &
Flo
od C
ontro
l Dis
trict
s ra
tes,
as
thes
e bo
nds
have
mat
ured
.(A
)Th
e ta
x ra
te fo
r Tax
Rat
e A
rea
#4, w
hich
app
lies
to m
ost p
rope
rty w
ithin
the
City
of L
os A
ngel
es, i
s us
ed to
i
llust
rate
the
brea
kdow
n of
a ta
x ra
te w
ithin
the
Cou
nty.
(B)
Arti
cle
XIII
A (P
ropo
sitio
n 13
) lim
its th
e m
axim
um a
d va
lore
m ta
x ra
te to
1%
of "
full
cash
val
ue" e
xcep
t for
i
ndeb
tedn
ess
appr
oved
by
the
vote
rs p
rior t
o Ju
ly 1
, 197
8. A
ll ot
her r
ates
are
cal
cula
ted
per $
100
of a
sses
sed
valu
e.(C
) A
n ex
cept
ion
to th
e 1%
lim
it w
as p
rovi
ded
by P
ropo
sitio
n 46
whi
ch w
as a
ppro
ved
in J
une,
198
6 re
-est
ablis
hing
a
utho
rity
of lo
cal g
over
nmen
ts to
issu
e ge
nera
l obl
igat
ion
bond
s fo
r cer
tain
pur
pose
s.(D
) Th
e C
ount
y is
div
ided
into
11,
372
tax
rate
are
as w
hich
are
uni
que
com
bina
tions
of v
ario
us ju
risdi
ctio
ns s
ervi
cing
a s
peci
fic g
eogr
aphi
c ar
ea.
Sour
ce:
Sec
ured
Tax
Rat
e an
d R
atio
s R
epor
t fro
m A
udito
r-C
ontro
ller-
Tax
Div
isio
n.
165

CO
UN
TY O
F LO
S A
NG
ELE
SP
RIN
CIP
AL
PR
OP
ER
TYTA
XP
AY
ER
S(U
NA
UD
ITE
D)
CU
RR
EN
T Y
EA
R A
ND
NIN
E Y
EA
RS
AG
OJU
NE
30,
200
9 A
ND
JU
NE
30,
200
0 (in
thou
sand
s)
2009
(1)
2000
(1)
Per
cent
age
ofP
erce
ntag
e of
Net
Ass
esse
dTo
tal N
etN
et A
sses
sed
Tota
l Net
Sec
ured
Pro
perty
Ass
esse
dS
ecur
ed P
rope
rtyA
sses
sed
Taxp
ayer
Val
ueR
ank
Val
ueV
alue
Ran
kV
alue
Sou
ther
n C
alifo
rnia
Edi
son
Co.
4,23
7,66
2$
1
0.41
%3,
376,
685
$
2
0.66
%M
agui
re T
hom
as P
artn
ers
2,93
7,88
5
2
0.29
%D
ougl
as E
mm
ett R
ealty
Fun
d2,
646,
247
30.
26%
971,
261
8
0.19
%B
P W
est C
oast
Pro
duct
s2,
570,
656
40.
25%
Che
vron
US
A In
c.2,
379,
496
50.
23%
1,43
4,94
0
6
0.28
%Tr
izec
LLC
1,84
1,30
9
6
0.18
%P
artic
ipan
ts in
Lon
g B
each
Uni
t1,
738,
449
70.
17%
Exx
on M
obil
Cor
pora
tion
1,64
5,68
9
8
0.16
%1,
263,
558
70.
25%
Ver
izon
Cal
iforn
ia In
c.1,
499,
091
90.
15%
Sou
ther
n C
alifo
rnia
Gas
Co.
1,49
4,07
8
10
0.15
%1,
511,
353
50.
30%
Pac
ific
Bel
l 3,
431,
571
10.
67%
GTE
Cal
iforn
ia, I
nc.
1,75
9,81
0
4
0.35
%A
tlant
ic R
ichf
ield
Co.
1,76
3,85
4
3
0.35
%S
huw
a In
vest
men
ts C
orpo
ratio
n89
8,88
5
100.
18%
MC
A, I
nc91
4,82
2
90.
18%
Tota
l22
,990
,562
$
2.
25%
17,3
26,7
39$
3.
41%
Not
e:(1
) S
ee s
ched
ule
"Ass
esse
d V
alue
& A
ctua
l Val
ue o
f Tax
able
Pro
perty
." T
otal
ass
esse
d va
lue,
$1,
028,
597,
893
as o
f
J
une
30, 2
009
is b
ased
on
Sec
ured
$1,
057,
718,
427
plus
Uni
tary
$12
,298
,465
less
exe
mpt
ions
of $
41,4
18,9
99.
Tota
l
a
sses
sed
valu
e, $
508,
504,
360
as o
f Jun
e 30
, 200
0 is
bas
ed o
n S
ecur
ed $
521,
494,
390
plus
Uni
tary
$12
,505
,963
le
ss e
xem
ptio
ns o
f $25
,495
,993
(in
thou
sand
s).
Sour
ce:
Los
Ang
eles
Cou
nty
Trea
sure
r and
Tax
Col
lect
or
166

CO
UN
TY O
F LO
S A
NG
ELE
SP
RO
PE
RTY
TA
X L
EV
IES
AN
D C
OLL
EC
TIO
NS
(U
NA
UD
ITE
D)
LAS
TTE
NFI
SC
AL
YE
AR
S(in
thou
sand
s)
Col
lect
ions
with
in th
e fi
scal
C
olle
ctio
ns
year
of t
he le
v yin
Tota
l Col
lect
ions
to D
ate
Per
cent
age
Sub
sequ
ent
Fisc
al Y
ear
Taxe
s Le
vied
Am
ount
of L
evy
Yea
rsA
mou
nt
1999
- 20
006,
078,
979
$
5,85
2,94
6$
96
.3%
205,
700
$
6,
058,
646
$
99.7
%
2000
- 20
016,
441,
176
6,22
8,30
9
96
.7%
199,
586
6,
427,
895
99.8
%
2001
- 20
026,
964,
486
6,76
0,14
7
97
.1%
231,
198
6,
991,
345
100.
4%
2002
- 20
037,
415,
691
7,18
2,97
4
96
.9%
208,
213
7,
391,
187
99.7
%
2003
- 20
048,
241,
631
8,03
1,58
7
97
.5%
240,
718
8,
272,
305
100.
4%
2004
- 20
058,
895,
871
8,65
5,95
3
97
.3%
224,
239
8,
880,
192
99.8
%
2005
- 20
069,
582,
359
9,32
2,04
7
97
.3%
220,
365
9,
542,
412
99.6
%
2006
- 20
0710
,521
,025
10,2
13,0
17
97.1
%23
0,57
8
10,4
43,5
95
99.3
%
2007
- 20
0811
,475
,303
10,9
05,0
99
95.0
%31
1,89
9
11,2
16,9
98
97.7
%
2008
- 20
0912
,317
,105
11,7
51,8
40
95.4
%53
0,66
8
12,2
82,5
08
99.7
%
Sour
ce:
Aud
itor-
Con
trolle
r-A
ccou
ntin
g D
ivis
ion-
Pro
perty
Tax
Sec
tion
of L
evy
Per
cent
age
167

CO
UN
TY O
F LO
S A
NG
ELE
SR
ATI
O O
F O
UTS
TAN
DIN
G D
EB
T B
Y T
YP
E (U
NA
UD
ITE
D)
LAS
T TE
N F
ISC
AL
YE
AR
S (I
n th
ousa
nds,
exc
ept p
er c
apita
)G
over
nmen
tal A
ctiv
ities
Una
mor
tized
Gen
eral
Cer
tific
ates
Not
es,
Una
mor
tized
Loss
on
Pen
sion
O
blig
atio
nA
sses
smen
tof
Loan
s, a
ndA
ccre
ted
Bon
dA
dvan
ceB
onds
Cap
ital
Fisc
al Y
ear
Bon
dsB
onds
Par
ticip
atio
nO
ther
Deb
tIn
tere
stP
rem
ium
sD
ebt R
efun
d.P
ayab
leLe
ases
1999
-00
79,0
25$
46
2,52
0$
1,50
7,40
4$
505,
536
$
$$
$1,
599,
821
$
60,1
15$
2000
-01
66,0
15
43
8,02
0
1,53
7,07
5
47
5,03
6
1,54
4,39
2
54
,217
2001
-02
53,4
80
41
2,29
5
1,36
9,52
8
67
,951
93,7
81
1,55
1,51
5
11
3,18
020
02-0
341
,180
394,
735
1,
276,
035
63,4
28
85
,780
1,
457,
732
120,
270
2003
-04
29,6
25
37
6,21
0
1,17
7,98
1
65
,539
75,3
79
1,34
4,05
6
13
5,25
820
04-0
518
,470
349,
690
1,
079,
504
69,8
88
62
,545
37
,629
(2
5,13
3)
1,
206,
794
130,
928
2005
-06
9,47
5
325,
710
1,
007,
134
387,
764
73
,191
36
,346
(2
3,87
6)
1,
045,
264
123,
676
2006
-07
370
304,
235
87
6,10
6
403,
622
94
,692
50
,079
(4
0,81
8)
87
9,58
5
98,4
5020
07-0
826
9,99
5
812,
318
39
5,83
8
116,
475
48,0
36
(37,
985)
668,
539
17
3,36
920
08-0
924
6,87
5
726,
236
41
3,25
2
138,
476
44,1
21(3
4,84
8)
48
5,09
2
157,
794
Gen
eral
Cer
tific
ates
Not
es,
Una
mor
tized
Pen
sion
To
tal
Obl
igat
ion
ofLo
ans,
and
Bon
dB
onds
Cap
ital
Prim
ary
Per
Per
sona
lP
er C
apita
Fisc
al Y
ear
Bon
dsP
artic
ipat
ion
Oth
er D
ebt
Pre
miu
ms
Pay
able
Leas
esG
over
nmen
t(1
)In
com
e(2
)(2
)19
99-0
074
6$
49
6,36
4$
64,0
25$
$
423,
894
$
3,36
0$
5,
202,
810
$
1.
86%
526
$20
00-0
146
6
44
7,43
9
75,8
44
33
7,68
8
2,
513
4,97
8,70
5
1.
69%
508
2001
-02
382
300,
318
12
6,68
4
542,
234
2,08
6
4,
633,
434
1.54
%47
220
02-0
329
7
27
3,44
7
146,
804
50
9,45
9
1,
761
4,37
0,92
8
1.
41%
438
2003
-04
239
240,
831
17
0,31
9
469,
756
1,49
9
4,
086,
692
1.24
%40
520
04-0
518
1
17
7,94
4
203,
121
10
,005
421,
781
1,09
7
3,
744,
444
1.07
%36
620
05-0
613
6
16
0,64
8
12,6
62
8,
909
36
3,17
7
67
5
3,53
0,89
1
0.
95%
345
2006
-07
121
132,
062
20
,008
8,15
3
305,
612
398
3,
132,
675
0.82
%30
320
07-0
810
4
11
4,75
0
215,
554
7,
368
23
2,28
5
27
3
3,01
6,91
9
0.
73%
291
2008
-09
86
95
,715
219,
580
6,
549
16
8,54
2
14
3
2,66
7,61
3
0.
68%
257
Not
es:
(1)
Det
ails
rega
rdin
gth
eC
ount
y's
outs
tand
ing
debt
can
be
foun
din
the
note
sto
the
finan
cial
sta
tem
ents
.(2
)S
eeth
e"D
emog
raph
icS
tatis
tics"
tabl
efo
r per
sona
linc
ome
and
popu
latio
n.
Sour
ce:
Aud
itor-
Con
trolle
r,C
ount
y of
Los
Ang
eles
Bus
ines
s-Ty
pe A
ctiv
ities
168

CO
UN
TY O
F LO
S A
NG
ELE
SR
ATI
O O
F N
ET
GE
NE
RA
L B
ON
DE
D D
EB
T (U
NA
UD
ITE
D)
LAS
T TE
N F
ISC
AL
YE
AR
S (i
n th
ousa
nds
exce
pt ra
tio a
nd p
er c
apita
)
Rat
io o
f Gen
eral
Bon
ded
Deb
t G
ener
alFi
scal
Pop
ulat
ion
Ass
esse
dG
ener
al B
onde
dto
Ass
esse
dB
onde
d D
ebt
Yea
r(1
)
Val
ue(1
)D
ebt
(2)
Val
uepe
r Cap
ita
1999
-00
9,88
454
6,33
0,91
6$
79
,025
$
.0
0014
57.
9952
2000
-01
9,80
358
2,44
6,79
3
66
,015
.0
0011
36.
7342
2001
-02
9,82
562
2,36
2,09
7
53
,480
.0
0008
65.
4433
2002
-03
9,97
966
0,25
5,04
1
41
,180
.0
0006
24.
1267
2003
-04
10,1
0370
9,61
2,25
8
29
,625
.0
0004
22.
9323
2004
-05
10,2
2676
1,35
5,09
7
18
,470
.0
0002
41.
8062
2005
-06
10,2
4683
5,90
1,66
8
9,
475
.0
0001
10.
9248
2006
-07
10,3
3292
5,51
4,92
4
37
0
.0
0000
00.
0358
2007
-08
10,3
641,
009,
911,
291
.0
0000
00.
0000
2008
-09
10,3
931,
080,
877,
141
.0
0000
00.
0000
Not
es:
(1)
See
"Dem
ogra
phic
s &
Eco
nom
ic S
tatis
tics"
tabl
e fo
r pop
ulat
ion
and
"Rev
enue
Cap
acity
" tab
le fo
r ass
esse
d va
lue.
(2
) L
ong-
term
gen
eral
bon
ded
debt
out
stan
ding
incl
uded
Det
entio
n Fa
cilit
ies
and
Floo
d C
ontro
l gen
eral
obl
igat
ion
bon
ds.
The
Det
entio
n Fa
cilit
ies
mat
ured
on
June
1, 2
007
and
the
Floo
d C
ontro
l bon
ds m
atur
ed o
n
N
ovem
ber 1
, 200
7.
Sour
ce:
Los
Ang
eles
Alm
anac
web
site
add
ress
: ww
w.la
alm
anac
.com
/pop
ulat
ion.
169

CO
UN
TY O
F LO
S A
NG
ELE
SE
STI
MA
TED
DIR
EC
T A
ND
OV
ER
LAP
PIN
G B
ON
DE
D D
EB
T (U
NA
UD
ITE
D)
JUN
E 3
0, 2
009
Full
Cas
h V
alue
(200
8-09
)93
7,88
4,05
9,23
8$
(1)
Pop
ulat
ion
- (20
09)
10,3
93,1
85
(2)
Per
cent
Deb
tA
pplic
able
May
1, 2
009
DIR
EC
T A
ND
OV
ER
LAP
PIN
G T
AX
AN
D A
SS
ES
SM
EN
T D
EB
T:Lo
s A
ngel
es C
ount
y Fl
ood
Con
trol D
istri
ct10
084
,705
,000
Met
ropo
litan
Wat
er D
istri
ct46
.799
137,
319,
966
Lo
s A
ngel
es C
omm
unity
Col
lege
Dis
trict
100
2,40
8,60
5,00
0
O
ther
Com
mun
ity C
olle
ge D
istri
cts
Var
ious
(3)
1,51
0,07
2,65
7
A
rcad
ia U
nifie
d S
choo
l Dis
trict
100
173,
920,
058
B
ever
ly H
ills
Uni
fied
Sch
ool D
istri
ct10
019
8,76
9,54
0
Gle
ndal
e U
nifie
d S
choo
l Dis
trict
100
137,
880,
000
In
glew
ood
Uni
fied
Sch
ool D
istri
ct10
011
8,57
5,00
0
Long
Bea
ch U
nifie
d S
choo
l Dis
trict
100
315,
155,
606
Lo
s A
ngel
es U
nifie
d S
choo
l Dis
trict
100
8,04
6,22
0,00
0
P
asad
ena
Uni
fied
Sch
ool D
istri
ct10
018
9,63
5,00
0
Pom
ona
Uni
fied
Sch
ool D
istri
ct10
017
7,83
1,23
8
Oth
er U
nifie
d S
choo
l Dis
trict
sV
ario
us(3
)2,
529,
282,
197
Hig
h S
choo
l and
Sch
ool
Dis
trict
sV
ario
us(3
)1,
080,
639,
149
City
of L
os A
ngel
es10
01,
298,
085,
000
City
of L
os A
ngel
es S
peci
al T
ax L
ease
Rev
enue
Bon
ds10
070
,590
,000
City
of I
ndus
try10
018
0,41
5,00
0
Oth
er C
ities
100
84,9
90,0
00S
peci
al D
istri
cts
100
8,31
5,00
0C
omm
unity
Fac
ilitie
s D
istri
cts
100
868,
046,
802
Lo
s A
ngel
es C
ount
y R
egio
nal P
ark
& O
pen
Spa
ce
Ass
essm
ent D
istri
ct10
024
6,87
5,00
0
(4)
1915
Act
and
Ben
efit
Ass
essm
ent B
onds
- E
stim
ate
100
160,
329,
187
Lo
s A
ngel
es C
ount
y M
etro
polit
an T
rans
porta
tion
Aut
horit
y
Ben
efit
Ass
essm
ent D
istri
ct B
onds
100
22,1
70,0
00TO
TAL
DIR
EC
T A
ND
OV
ER
LAP
PIN
G T
AX
& A
SS
ES
SM
EN
T D
EB
T20
,048
,426
,400
$
DIR
EC
T A
ND
OV
ER
LAP
PIN
G G
EN
ER
AL
FUN
D O
BLI
GA
TIO
N D
EB
T:Lo
s A
ngel
es C
ount
y G
ener
al F
und
Obl
igat
ions
100
937,
336,
195
$
(5)
Los
Ang
eles
Cou
nty
Pen
sion
Obl
igat
ions
100
352,
255,
398
Lo
s A
ngel
es C
ount
y O
ffice
of E
duca
tion
Cer
tific
ates
of P
artic
ipat
ion
100
15,9
04,2
64C
omm
unity
Col
lege
Dis
trict
Cer
tific
ates
of P
artic
ipat
ion
Var
ious
(3)
82,7
98,1
38A
suza
Uni
fied
Sch
ool D
istri
ct C
ertif
icat
es o
f Par
ticip
atio
n 10
067
,560
,000
Los
Ang
eles
Uni
fied
Sch
ool D
istri
ct C
ertif
icat
es o
f Par
ticip
atio
n10
048
4,57
6,71
0
Nor
wal
k-La
Mira
da U
nifie
d S
choo
l Dis
trict
Cer
tific
ates
of P
artic
ipat
ion
100
35,3
82,9
99P
omon
a U
nifie
d S
choo
l Dis
trict
Cer
tific
ates
of P
artic
ipat
ion
100
63,2
80,0
00O
ther
Uni
fied
Sch
ool D
istri
ct C
ertif
icat
es o
f Par
ticip
atio
n10
027
5,20
2,98
9
Hig
h S
choo
l and
Sch
ool D
istri
ct G
ener
al F
und
Obl
igat
ions
Var
ious
(3)
196,
567,
096
C
ity o
f Bev
erly
Hill
s G
ener
al F
und
Obl
igat
ions
100
201,
235,
000
(C
ontin
ued)
170

CO
UN
TY O
F LO
S A
NG
ELE
SE
STI
MA
TED
DIR
EC
T A
ND
OV
ER
LAP
PIN
G B
ON
DE
D D
EB
T (U
NA
UD
ITE
D) -
Con
tinue
dJU
NE
30,
200
9D
IRE
CT
AN
D O
VE
RLA
PP
ING
GE
NE
RA
L FU
ND
OB
LIG
ATI
ON
DE
BT
- Con
't.:
City
of L
os A
ngel
es G
ener
al F
und
& J
udgm
ent O
blig
atio
ns10
01,
899,
895,
000
City
of L
ong
Bea
ch G
ener
al F
und
Obl
igat
ions
100
277,
785,
000
C
ity o
f Lon
g B
each
Pen
sion
Obl
igat
ions
100
77,0
95,0
00
City
of P
asad
ena
Gen
eral
Fun
d O
blig
atio
ns10
038
1,29
4,97
2
City
of P
asad
ena
Pen
sion
Obl
igat
ions
100
123,
195,
036
O
ther
Citi
es' G
ener
al F
und
Obl
igat
ions
100
1,24
9,32
6,59
9
Lo
s A
ngel
es C
ount
y S
anita
tion
Dis
trict
s G
ener
al F
und
Obl
igat
ions
100
359,
424,
393
W
alnu
t Val
ley
Wat
er D
istri
ct G
ener
al F
und
Obl
igat
ions
100
11,9
95,0
00
TOTA
L G
RO
SS
DIR
EC
T A
ND
OV
ER
LAP
PIN
G G
EN
ER
AL
FUN
D O
BLI
GA
TIO
N D
EB
T7,
092,
109,
789
$
L
ess:
S
choo
l Dis
trict
sel
f-sup
porti
ng b
onds
(82,
473,
820)
Citi
es' s
elf-s
uppo
rting
bon
ds(1
82,8
37,4
24)
W
alnu
t Val
ley
Wat
er D
istri
ct G
ener
al F
und
Obl
igat
ions
(11,
995,
000)
TO
TAL
NE
T D
IRE
CT
AN
D O
VE
RLA
PP
ING
GE
NE
RA
L FU
ND
OB
LIG
ATI
ON
DE
BT
6,81
4,80
3,54
5$
GR
OS
S C
OM
BIN
ED
TO
TAL
DE
BT
27,1
40,5
36,1
89
(6)
NE
T C
OM
BIN
ED
TO
TAL
DE
BT
26,8
63,2
29,9
45$
RA
TIO
S T
O 2
008-
09 A
SS
ES
SE
D V
ALU
ATI
ON
T
otal
Dire
ct a
nd O
verla
ppin
g Ta
x an
d A
sses
smen
t Deb
t1.
840%
RA
TIO
S T
O F
ULL
CA
SH
VA
LUE
(AD
JUS
TED
AS
SE
SS
ED
VA
LUA
TIO
N)
C
ombi
ned
Gro
ss D
irect
Deb
t ($1
,289
,591
,593
).1
40%
G
ross
Com
bine
d To
tal D
ebt
2.87
0%
Net
Com
bine
d To
tal D
ebt
2.84
0%S
TATE
SC
HO
OL
BU
ILD
ING
AID
RE
PA
YA
BLE
AS
OF
6/30
/08:
286,
908
$
Not
es:
(1)
Thi
s ba
lanc
e Is
redu
ced
by h
omow
ners
exe
mpt
ions
of $
8,16
8,70
7,42
0 an
d ex
clud
es re
deve
lopm
ent i
ncre
men
tal
valu
atio
nof
$142
,993
,081
,648
.(2
)Y
early
est
imat
esfro
mth
eC
alifo
rnia
Sta
teD
emog
raph
icR
esea
rch
Uni
t,C
alifo
rnia
Dep
artm
ent o
fFin
ance
and
the
U.S
. Cen
sus
Bur
eau
as o
f Jan
uary
1 o
f eac
h ye
ar.
(3)
All
100%
, or a
lmos
t100
%, e
xcep
tfor
Ant
elop
eV
alle
yJo
intU
HS
D a
ndC
omm
unity
Col
lege
Dis
trict
,Fu
llerto
nU
nion
Hig
h S
choo
l Dis
trict
, Las
Virg
enes
Joi
nt U
nifie
d S
choo
l Dis
trict
, Nor
th O
rang
e C
ount
y Jo
int C
omm
unity
Col
lege
Dis
trict
, and
the
scho
ols
and
spec
ial d
istri
cts
incl
uded
in th
em.
(4)
Exc
lude
s re
fund
ing
issu
eto
be s
old.
(5)
Exc
lude
sta
x an
d re
venu
e an
ticip
atio
n no
tes
tobe
sol
d.(6
)E
xclu
des
tax
and
reve
nue
antic
ipat
ion
note
s, e
nter
pris
e re
venu
e, m
ortg
age
reve
nue
and
tax
allo
catio
nbo
nds
and
non
-bon
ded
capi
tal l
ease
obl
igat
ions
.
Sour
ce:
Cal
iforn
ia M
unic
ipal
Sta
tistic
s - f
or g
ener
al in
form
atio
n pu
rpos
es o
nly.
171

CO
UN
TY O
F LO
S A
NG
ELE
SC
OM
PU
TATI
ON
OF
LEG
AL
DE
BT
MA
RG
IN (U
NA
UD
ITE
D)
LAS
T TE
N F
ISC
AL
YE
AR
S (I
n th
ousa
nds)
(1)
(2)
(3)
CO
MP
UTA
TIO
N O
F LE
GA
L D
EB
T M
AR
GIN
Tota
l net
June
30,
200
9A
sses
sed
Lega
lap
plic
able
Le
gal
Fisc
al Y
ear
Val
ueD
ebt L
imit
debt
Deb
t Mar
gin
Ass
esse
d va
luat
ion
(net
taxa
ble)
1,
080,
877,
141
$19
99 -
2000
546,
330,
916
$
6,82
9,13
6$
47
,865
$
6,78
1,27
1$
99
.30%
2000
- 20
0158
2,44
6,79
3
7,
280,
585
42,3
75
7,
238,
210
99
.42%
App
licab
le p
erce
ntag
e in
com
putin
g ca
paci
ty1.
25%
2001
- 20
0262
2,36
2,09
7
7,
779,
526
36,5
05
7,
743,
021
99
.53%
2002
- 20
0366
0,25
5,04
1
8,
253,
188
30,2
25
8,
222,
963
99
.63%
Tota
l deb
t lim
it13
,510
,964
$20
03 -
2004
709,
612,
258
8,87
0,15
3
23
,470
8,84
6,68
3
99.7
4%20
04 -
2005
761,
355,
097
9,51
6,93
9
16
,205
9,50
0,73
4
99.8
3%Le
ss: T
otal
net
app
licab
le d
ebt
2005
- 20
0683
5,90
1,66
8
10
,448
,771
8,39
5
10,4
40,3
76
99.9
2%20
06 -
2007
925,
514,
924
11,5
68,9
37
37
0
11
,568
,567
10
0.00
%Le
gal d
ebt m
argi
n, J
une
30, 2
009
13,5
10,9
64$
2007
- 20
081,
009,
911,
291
12
,623
,891
12,6
23,8
91
100.
00%
2008
- 20
091,
080,
877,
141
13
,510
,964
13,5
10,9
64
100.
00%
Not
es:
(1)
Ass
esse
d V
alue
doe
s no
t inc
lude
tax
exem
pt p
rope
rty.
Pro
perty
val
ue d
ata
can
be fo
und
in th
e
"A
sses
sed
Val
ue a
nd A
ctua
l Val
ue o
f Tax
able
Pro
perty
" sch
edul
e.(2
) Th
e Le
gal D
ebt L
imit
is 1
.25
% o
f ass
esse
d va
lue.
(3)
The
Lega
l Deb
t Mar
gin
is th
e C
ount
y's
avai
labl
e bo
rrow
ing
auth
ority
und
er s
tate
fina
nce
stat
utes
and
is
cal
cula
ted
by s
ubtra
ctin
g th
e de
bt a
pplic
able
from
the
Lega
l Deb
t Lim
it.
Lega
l Deb
t M
argi
n/D
ebt L
imit
172
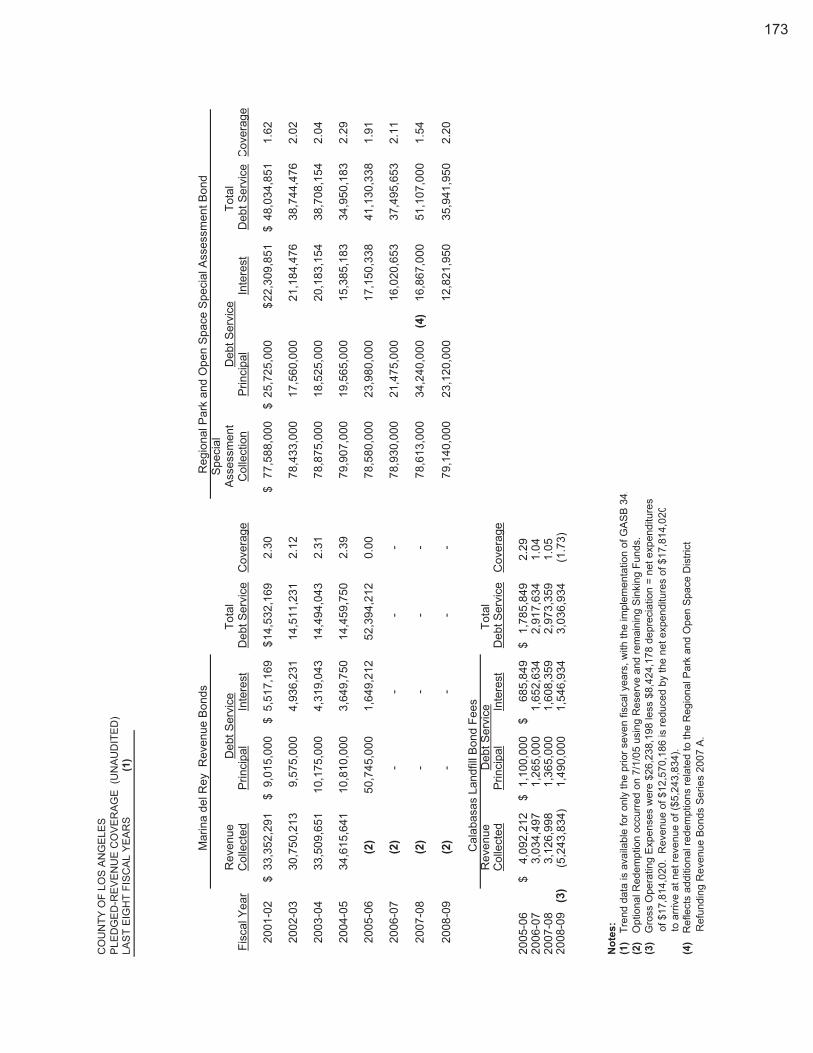
CO
UN
TY O
F LO
S A
NG
ELE
SP
LED
GE
D-R
EV
EN
UE
CO
VE
RA
GE
(U
NA
UD
ITE
D)
LAS
T E
IGH
T FI
SC
AL
YE
AR
S(1
)
Mar
ina
del R
ey R
even
ue B
onds
Reg
iona
l Par
k an
d O
pen
Spa
ce S
peci
al A
sses
smen
t Bon
dS
peci
alR
even
ueD
ebt S
ervi
ceTo
tal
Ass
essm
ent
Deb
t Ser
vice
Tota
lFi
scal
Yea
rC
olle
cted
Prin
cipa
lIn
tere
stD
ebt S
ervi
ceC
over
age
Col
lect
ion
Prin
cipa
lIn
tere
stD
ebt S
ervi
ceC
over
age
2001
-02
33,3
52,2
91$
9,
015,
000
$
5,51
7,16
9$
14
,532
,169
$2.
3077
,588
,000
$
25,7
25,0
00$
22
,309
,851
$48
,034
,851
$ 1.
62
2002
-03
30,7
50,2
13
9,
575,
000
4,93
6,23
1
14,5
11,2
31
2.12
78,4
33,0
00
17,5
60,0
00
21
,184
,476
38
,744
,476
2.
02
2003
-04
33,5
09,6
51
10
,175
,000
4,
319,
043
14
,494
,043
2.
3178
,875
,000
18
,525
,000
20,1
83,1
54
38,7
08,1
54
2.04
2004
-05
34,6
15,6
41
10
,810
,000
3,
649,
750
14
,459
,750
2.
3979
,907
,000
19
,565
,000
15,3
85,1
83
34,9
50,1
83
2.29
2005
-06
(2)
50,7
45,0
00
1,64
9,21
2
52,3
94,2
12
0.00
78,5
80,0
00
23,9
80,0
00
17
,150
,338
41
,130
,338
1.
91
2006
-07
(2)
--
--
78,9
30,0
00
21,4
75,0
00
16
,020
,653
37
,495
,653
2.
11
2007
-08
(2)
--
--
78,6
13,0
00
34,2
40,0
00(4
)16
,867
,000
51
,107
,000
1.
54
2008
-09
(2)
--
--
79,1
40,0
00
23,1
20,0
00
12
,821
,950
35
,941
,950
2.
20
Cal
abas
as L
andf
ill B
ond
Fees
Rev
enue
Deb
t Ser
vice
Tota
lC
olle
cted
Prin
cipa
lIn
tere
stD
ebtS
ervi
ceC
over
age
2005
-06
4,09
2,21
2$
1,10
0,00
0$
68
5,84
9$
1,78
5,84
9$
2.
2920
06-0
73,
034,
497
1,
265,
000
1,65
2,63
4
2,91
7,63
4
1.04
2007
-08
3,
126,
998
1,
365,
000
1,60
8,35
9
2,97
3,35
9
1.05
2008
-09
(3)
(5,2
43,8
34)
1,49
0,00
0
1,
546,
934
3,
036,
934
(1.7
3)
Not
es:
(1)
Tre
nd d
ata
is a
vaila
ble
for o
nly
the
prio
r sev
en fi
scal
yea
rs, w
ith th
e im
plem
enta
tion
of G
AS
B 3
4.(2
) O
ptio
nal R
edem
ptio
n oc
curr
ed o
n 7/
1/05
usi
ng R
eser
ve a
nd re
mai
ning
Sin
king
Fun
ds.
(3)
Gro
ss O
pera
ting
Exp
ense
s w
ere
$26,
238,
198
less
$8,
424,
178
depr
ecia
tion
= ne
t exp
endi
ture
s
o
f $17
,814
,020
. R
even
ue o
f $12
,570
,186
is re
duce
d by
the
net e
xpen
ditu
res
of $
17,8
14,0
20
t
o ar
rive
at n
et re
venu
e of
($5,
243,
834)
.(4
) R
efle
cts
addi
tiona
l red
empt
ions
rela
ted
to th
e R
egio
nal P
ark
and
Ope
n S
pace
Dis
trict
R
efun
ding
Rev
enue
Bon
ds S
erie
s 20
07 A
.
173

CO
UN
TY O
F LO
S A
NG
ELE
SD
EM
OG
RA
PH
IC A
ND
EC
ON
OM
IC S
TATI
STI
CS
(U
NA
UD
ITE
D)
LAS
T TE
N F
ISC
AL
YE
AR
S (I
n th
ousa
nds)
Per
Cap
itaP
erso
nal
Per
sona
l
Sch
ool
Une
mpl
oym
ent
Yea
rIn
com
e **
Inco
me
(1)
Enr
ollm
ent(
2) **
*R
ate
2000
9,88
427
9,05
0,00
0$
28,2
32$
1,
651
5.3%
2001
9,80
329
4,50
8,00
0
30,0
431,
682
5.7%
2002
9,82
530
1,00
3,00
0
30,6
361,
711
6.8%
2003
9,97
931
0,04
4,00
0
31,0
701,
736
7.0%
2004
10,1
0332
9,04
8,00
0
32,5
691,
742
6.5%
2005
10,2
2634
9,86
8,00
0
34,2
141,
734
5.3%
2006
10,2
4637
0,86
0,00
0
36,1
961,
708
4.5%
2007
10,3
3237
9,82
4,00
0
36,7
621,
673
4.4%
2008
10,3
6441
1,00
0,00
0
39,6
571,
648
6.2%
2009
10,3
9339
2,00
0,00
0
37,7
18
1,63
2
11.
7%(3
) ***
*
Not
es:
(1)
Am
ount
s sh
own
are
in a
ctua
l dol
lars
(not
thou
sand
s).
(2)
Pub
lic s
choo
l enr
ollm
ent.
(3)
Yea
r 200
9 is
an
estim
ate
as o
f Jul
y 20
09.
Sour
ces:
* L
os A
ngel
es A
lman
ac w
ebsi
te a
ddre
ss: w
ww
.laal
man
ac.c
om/p
opul
atio
n.**
Bur
eau
of E
cono
mic
Ana
lysi
s w
ebsi
te a
ddre
ss: w
ww
.bea
.gov
. Y
ear 2
009
is a
n es
timat
e fo
reca
st fr
om L
os A
ngel
es E
cono
mic
Dev
elop
men
t Cor
pora
tion.
***
Cal
iforn
ia D
epar
tmen
t of E
duca
tion
web
site
add
ress
: ww
w.c
de.c
a.go
v.**
**Lo
s A
ngel
es E
cono
mic
Dev
elop
men
t Cor
pora
tion-
Eco
nom
ic F
orec
ast :
web
site
add
ress
: ww
w.la
edc.
com
Pop
ulat
ion
Cou
nty
ofLo
s A
ngel
es*
174
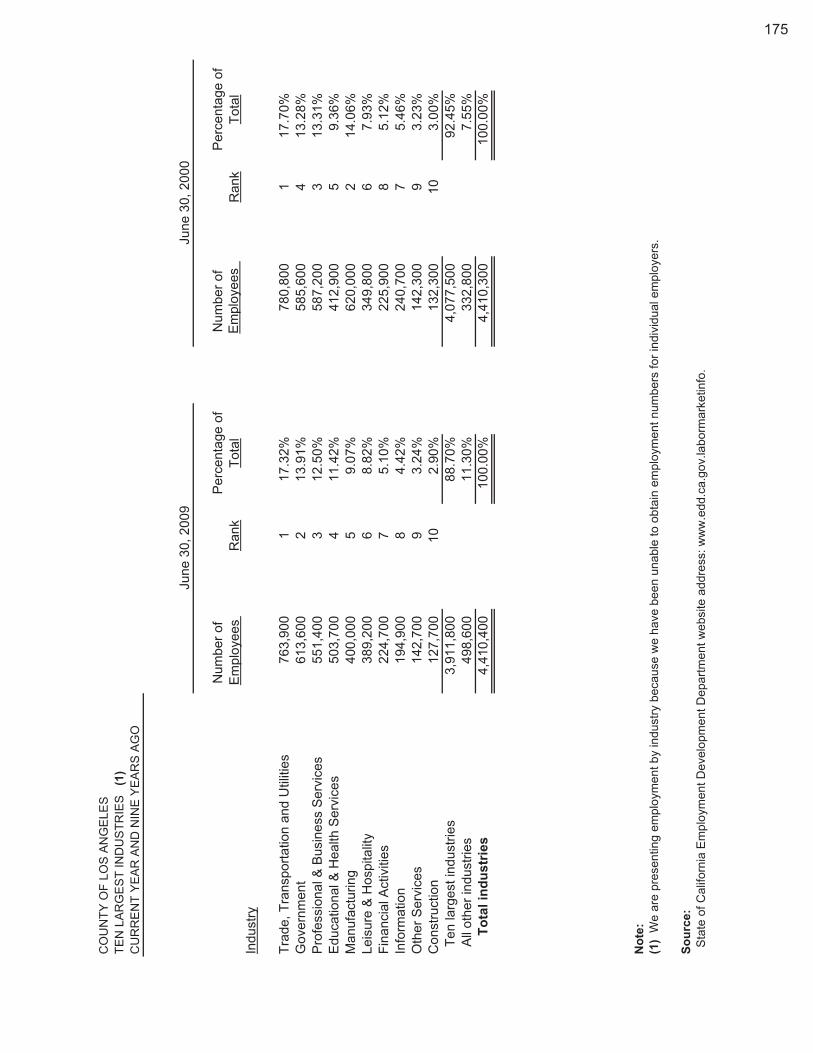
CO
UN
TY O
F LO
S A
NG
ELE
S
Num
ber o
f N
umbe
r of
Em
ploy
ees
Ran
kE
mpl
oyee
sR
ank
Indu
stry
Trad
e, T
rans
porta
tion
and
Util
ities
763,
900
117
.32%
780,
800
1
17.7
0%G
over
nmen
t61
3,60
0
2
13.9
1%58
5,60
0
413
.28%
Pro
fess
iona
l & B
usin
ess
Ser
vice
s55
1,40
0
3
12.5
0%58
7,20
0
313
.31%
Edu
catio
nal &
Hea
lth S
ervi
ces
503,
700
411
.42%
412,
900
5
9.36
%M
anuf
actu
ring
400,
000
59.
07%
620,
000
2
14.0
6%Le
isur
e &
Hos
pita
lity
389,
200
68.
82%
349,
800
6
7.93
%Fi
nanc
ial A
ctiv
ities
224,
700
75.
10%
225,
900
8
5.12
%In
form
atio
n19
4,90
0
8
4.42
%24
0,70
0
75.
46%
Oth
er S
ervi
ces
142,
700
93.
24%
142,
300
9
3.23
%C
onst
ruct
ion
127,
700
102.
90%
132,
300
10
3.00
% T
en la
rges
t ind
ustri
es
3,91
1,80
0
88.7
0%4,
077,
500
92.4
5% A
ll ot
her i
ndus
tries
49
8,60
0
11
.30%
332,
800
7.
55%
T
otal
indu
strie
s 4,
410,
400
10
0.00
%4,
410,
300
100.
00%
Not
e:(1
) W
e ar
e pr
esen
ting
empl
oym
ent b
y in
dust
ry b
ecau
se w
e ha
ve b
een
unab
le to
obt
ain
empl
oym
ent n
umbe
rs fo
r ind
ivid
ual e
mpl
oyer
s.
Sour
ce:
Sta
te o
f Cal
iforn
ia E
mpl
oym
ent D
evel
opm
ent D
epar
tmen
t web
site
add
ress
: ww
w.e
dd.c
a.go
v.la
borm
arke
tinfo
.
TEN
LA
RG
ES
T IN
DU
STR
IES
(1)
CU
RR
EN
T Y
EA
R A
ND
NIN
E Y
EA
RS
AG
O
June
30,
200
9Ju
ne 3
0, 2
000
Per
cent
age
ofTo
tal
Per
cent
age
ofTo
tal
175

CO
UN
TY O
F LO
S A
NG
ELE
SFU
LL-T
IME
EQ
UIV
ALE
NT
CO
UN
TY E
MP
LOY
EE
S B
Y F
UN
CTI
ON
/PR
OG
RA
M (
UN
AU
DIT
ED
)LA
ST
TEN
FIS
CA
L Y
EA
RS
1999
-00
2000
-01
2001
-02
2002
-03
2003
-04
2004
-05
2005
-06
2006
-07
2007
-08
2008
-09
Func
tion/
Pro
gram
(1)
Gen
eral
Gov
ernm
ent
10,4
69
10
,447
10
,808
11
,063
11
,201
10
,915
11,0
18
11,1
85
11,6
92
11
,605
Pub
lic P
rote
ctio
n36
,170
37,1
98
38,4
28
38,1
75
37,6
88
37,0
65
38
,049
39
,528
41
,560
42,5
83
Hea
lth a
nd S
anita
tion
26,3
11
27
,107
27
,737
27
,056
26
,079
26
,322
26,7
17
27,0
72
27,3
95
27
,345
Pub
lic A
ssis
tanc
e17
,653
18,6
00
19,5
36
19,3
10
19,0
48
19,1
32
19
,540
20
,329
20
,867
20,9
40
Edu
catio
n1,
600
1,62
8
1,
666
1,70
6
1,
722
1,72
2
1,
828
1,87
1
1,
878
1,
829
Rec
reat
ion
and
Cul
tura
l Ser
vice
s2,
317
2,28
2
2,
352
2,40
6
2,
388
2,32
4
2,
393
2,64
9
2,
977
3,
075
Tota
l94
,520
97,2
62
100,
527
99,7
16
98,1
26
97,4
80
99
,545
10
2,63
410
6,36
9
107,
377
Not
e:(1
) F
ull t
ime
equi
vale
nt c
ount
is c
alcu
late
d by
div
idin
g th
e to
tal n
umbe
r of m
an-m
onth
s pa
id b
y 12
. Fu
ll tim
e eq
uiva
lent
em
ploy
ees
incl
ude
all e
mpl
oyee
s on
the
Cou
nty'
s pa
yrol
l sys
tem
. Th
is a
ccou
nts
for t
he d
iffer
ence
bet
wee
n th
e to
tal e
mpl
oyee
num
ber o
f Cou
nty
empl
oyee
s on
this
sch
edul
e an
d th
e nu
mbe
r of C
ount
y em
ploy
ees
per t
he "P
rinci
pal E
mpl
oyer
s" s
ched
ule.
(2)
Spe
cific
dat
a fo
r Pub
lic W
ays
and
Faci
litie
s is
not
ava
ilabl
e.
Sour
ce:
Em
ploy
ee C
ount
stu
dy p
erfo
rmed
by
the
Aud
itor C
ontro
ller-
Acc
ount
ing
Div
isio
n.
176
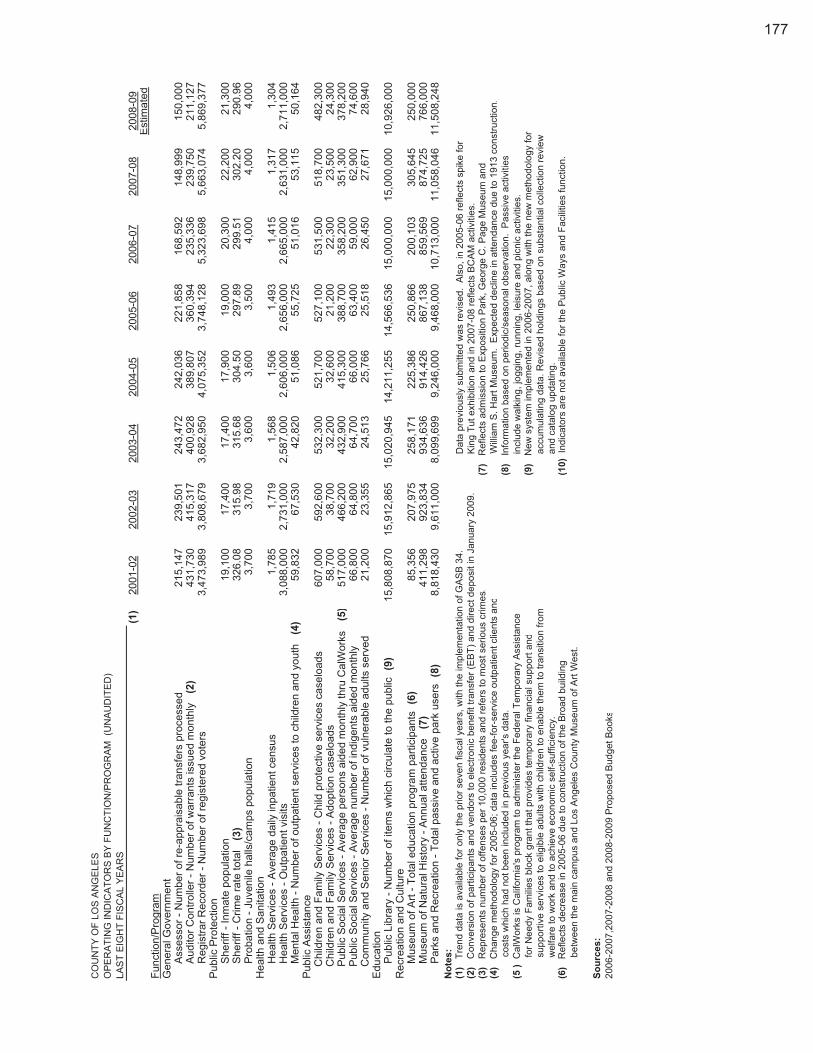
CO
UN
TY O
F LO
S A
NG
ELE
SO
PE
RA
TIN
G IN
DIC
ATO
RS
BY
FU
NC
TIO
N/P
RO
GR
AM
(U
NA
UD
ITE
D)
LAS
T E
IGH
T FI
SC
AL
YE
AR
S
(1)
2001
-02
2002
-03
2003
-04
2004
-05
2005
-06
2006
-07
2007
-08
2008
-09
Est
imat
edFu
nctio
n/P
rogr
amG
ener
al G
over
nmen
t
Ass
esso
r - N
umbe
r of r
e-ap
prai
sabl
e tra
nsfe
rs p
roce
ssed
21
5,14
7
23
9,50
1
24
3,47
2
24
2,03
6
22
1,85
8
16
8,59
2
14
8,99
9
15
0,00
0
Aud
itor C
ontro
ller -
Num
ber o
f war
rant
s is
sued
mon
thly
(2)
431,
730
415,
317
400,
928
389,
807
360,
394
235,
336
239,
750
211,
127
R
egis
trar R
ecor
der -
Num
ber o
f reg
iste
red
vote
rs3,
473,
989
3,
808,
679
3,
682,
950
4,
075,
352
3,
748,
128
5,
323,
698
5,
663,
074
5,
869,
377
Pub
lic P
rote
ctio
n
She
riff -
Inm
ate
popu
latio
n19
,100
17,4
00
17
,400
17,9
00
19,0
00
20
,300
22,2
00
21,3
00
She
riff -
Crim
e ra
te to
tal
(3)
326.
0831
5.98
315.
6830
4.50
297.
8929
9.51
302.
2029
0.96
P
roba
tion
- Juv
enile
hal
ls/c
amps
pop
ulat
ion
3,70
0
3,70
0
3,60
0
3,60
0
3,50
0
4,00
0
4,00
0
4,00
0H
ealth
and
San
itatio
n
Hea
lth S
ervi
ces
- Ave
rage
dai
ly in
patie
nt c
ensu
s1,
785
1,
719
1,
568
1,
506
1,
493
1,
415
1,
317
1,
304
H
ealth
Ser
vice
s - O
utpa
tient
vis
its3,
088,
000
2,
731,
000
2,
587,
000
2,
606,
000
2,
656,
000
2,
665,
000
2,
631,
000
2,
711,
000
M
enta
l Hea
lth -
Num
ber o
f out
patie
nt s
ervi
ces
to c
hild
ren
and
yout
h(4
)59
,832
67,5
30
42
,820
51,0
86
55,7
25
51
,016
53,1
15
50,1
64P
ublic
Ass
ista
nce
C
hild
ren
and
Fam
ily S
ervi
ces
- Chi
ld p
rote
ctiv
e se
rvic
es c
asel
oads
607,
000
592,
600
532,
300
521,
700
527,
100
531,
500
518,
700
482,
300
C
hild
ren
and
Fam
ily S
ervi
ces
- Ado
ptio
n ca
selo
ads
58,7
00
38
,700
32,2
00
32
,600
21
,200
22,3
00
23
,500
24
,300
P
ublic
Soc
ial S
ervi
ces
- Ave
rage
per
sons
aid
ed m
onth
ly th
ru C
alW
orks
(5)
517,
000
466,
200
432,
900
415,
300
388,
700
358,
200
351,
300
378,
200
P
ublic
Soc
ial S
ervi
ces
- Ave
rage
num
ber o
f ind
igen
ts a
ided
mon
thly
66,8
00
64
,800
64,7
00
66
,000
63
,400
59,0
00
62
,900
74
,600
C
omm
unity
and
Sen
ior S
ervi
ces
- Num
ber o
f vul
nera
ble
adul
ts s
erve
d 21
,200
23,3
55
24
,513
25,7
66
25,5
18
26
,450
27,6
71
28,9
40E
duca
tion
P
ublic
Lib
rary
- N
umbe
r of i
tem
s w
hich
circ
ulat
e to
the
publ
ic(9
)15
,808
,870
15,9
12,8
6515
,020
,945
14,2
11,2
55
14,5
66,5
3615
,000
,000
15,0
00,0
0010
,926
,000
Rec
reat
ion
and
Cul
ture
M
useu
m o
f Art
- Tot
al e
duca
tion
prog
ram
par
ticip
ants
(6)
85,3
56
20
7,97
5
25
8,17
1
22
5,38
6
25
0,86
6
20
0,10
3
30
5,64
5
25
0,00
0
Mus
eum
of N
atur
al H
isto
ry -
Ann
ual a
ttend
ance
(7)
411,
298
923,
834
934,
636
914,
426
867,
138
859,
569
874,
725
766,
000
P
arks
and
Rec
reat
ion
- Tot
al p
assi
ve a
nd a
ctiv
e pa
rk u
sers
(8)
8,81
8,43
0
9,61
1,00
0
8,09
9,69
9
9,24
6,00
0
9,46
8,00
0
10,7
13,0
0011
,058
,046
11,5
08,2
48N
otes
:(1
)Tr
end
data
is a
vaila
ble
for o
nly
the
prio
r sev
en fi
scal
yea
rs, w
ith th
e im
plem
enta
tion
of G
AS
B 3
4 .
D
ata
prev
ious
ly s
ubm
itted
was
revi
sed.
Als
o, in
200
5-06
refle
cts
spik
e fo
r (2
)C
onve
rsio
n of
par
ticip
ants
and
ven
dors
to e
lect
roni
c be
nefit
tran
sfer
(EB
T) a
nd d
irect
dep
osit
in J
anua
ry 2
009.
K
ing
Tut e
xhib
ition
and
in 2
007-
08 re
flect
s B
CA
M a
ctiv
ities
.(3
)R
epre
sent
s nu
mbe
r of o
ffens
es p
er 1
0,00
0 re
side
nts
and
refe
rs to
mos
t ser
ious
crim
es.
(7)
Ref
lect
s ad
mis
sion
to E
xpos
ition
Par
k, G
eorg
e C
. Pag
e M
useu
m a
nd
(4)
Cha
nge
met
hodo
logy
for 2
005-
06; d
ata
incl
udes
fee-
for-
serv
ice
outp
atie
nt c
lient
s an
dW
illia
m S
. Har
t Mus
eum
. E
xpec
ted
decl
ine
in a
ttend
ance
due
to 1
913
cons
truct
ion.
cost
s w
hich
had
not
bee
n in
clud
ed in
pre
viou
s ye
ar's
dat
a.(8
)In
form
atio
n ba
sed
on p
erio
dic/
seas
onal
obs
erva
tion.
Pas
sive
act
iviti
es(5
)C
alW
orks
is C
alifo
rnia
's p
rogr
am to
adm
inis
ter t
he F
eder
al T
empo
rary
Ass
ista
nce
incl
ude
wal
king
, jog
ging
, run
ning
, lei
sure
and
pic
nic
activ
ities
.
f
or N
eedy
Fam
ilies
blo
ck g
rant
that
pro
vide
s te
mpo
rary
fina
ncia
l sup
port
and
(9)
New
sys
tem
impl
emen
ted
in 2
006-
2007
, alo
ng w
ith th
e ne
w m
etho
dolo
gy fo
r
s
uppo
rtive
ser
vice
s to
elig
ible
adu
lts w
ith c
hild
ren
to e
nabl
e th
em to
tran
sitio
n fro
m
a
ccum
ulat
ing
data
. Rev
ised
hol
ding
s ba
sed
on s
ubst
antia
l col
lect
ion
revi
ew
wel
fare
to w
ork
and
to a
chie
ve e
cono
mic
sel
f-suf
ficie
ncy.
and
cat
alog
upd
atin
g.(6
)R
efle
cts
decr
ease
in20
05-0
6du
e to
con
stru
ctio
n of
the
Bro
adbu
ildin
g(1
0)In
dica
tors
are
not a
vaila
ble
for t
heP
ublic
Way
s an
dFa
cilit
ies
func
tion.
bet
wee
n th
e m
ain
cam
pus
and
Los
Ang
eles
Cou
nty
Mus
eum
of A
rt W
est.
Sour
ces:
2006
-200
7,20
07-2
008
and
2008
-200
9 P
ropo
sed
Bud
get B
ooks
177

CO
UN
TY O
F LO
S A
NG
ELE
SC
AP
ITA
L A
SS
ET
STA
TIS
TIC
S B
Y F
UN
CTI
ON
/PR
OG
RA
M (
UN
AU
DIT
ED
)LA
ST
EIG
HT
FIS
CA
L Y
EA
RS
(1)
2001
-02
2002
-03
2003
-04
2004
-05
2005
-06
2006
-07
2007
-08
2008
-09
Func
tion/
Pro
gram
Pub
lic P
rote
ctio
nA
nim
al S
helte
rs7
7
7
7
7
6
6
6
P
ublic
way
s an
d fa
cilit
ies
Mile
age
of m
aint
aine
d C
ount
y ro
ads
3,12
0
3,13
1
3,16
4
3,17
0
3,17
9
3,
198
3,21
3
3,21
7
Mile
s of
uni
ncor
pora
ted
Cou
nty
bike
way
sn/
a13
4
13
4
13
5
13
9
141
14
1
14
1
A
irpor
ts5
5
5
5
5
5
5
5
D
ams
15
15
15
15
15
15
15
14
S
torm
dra
ins,
in m
iles
2,70
8
2,73
2
2,75
4
2,77
7
2,78
2
2,
865
2,80
0
2,97
2
Pum
p st
atio
ns(2
)40
40
45
45
45
45
45
45
Hea
lth a
nd S
anita
tion
Hos
pita
ls6
6
5
5
5
5
4
4
H
ealth
cen
ters
39
22
18
18
18
18
18
18
E
duca
tion
Libr
arie
s84
84
84
84
84
84
84
85
Boo
kmob
iles
8
5
5
5
5
4
4
4
Rec
reat
ion
and
Cul
tura
l ser
vice
sM
useu
ms
4
4
4
4
4
4
4
4
Arb
oret
ums
and
Bot
anic
Gar
dens
4
4
4
4
4
4
4
4
Gol
f cou
rses
19
19
19
19
19
19
19
19
B
each
es
21
21
21
20
20
20
20
17
B
oat S
lips
6,00
0
6,00
0
5,24
6
5,24
6
5,24
6
5,
246
4,
796
4,
832
Not
es:
(1)
Tre
nd d
ata
is a
vaila
ble
for o
nly
the
prio
r sev
en y
ears
, with
the
impl
emen
tatio
n of
GA
SB
34.
(2)
Ter
min
olog
y ch
ange
.(3
)N
o ca
pita
l ass
et in
dica
tors
are
ava
ilabl
e fo
r the
Gen
eral
Gov
ernm
ent o
r Pub
lic A
ssis
tanc
e fu
nctio
ns.
Sour
ce:
2008
-09
Cou
nty
of L
os A
ngel
es A
nnua
l Rep
ort,
Dep
t of P
ublic
Wor
ks w
ebsi
te, S
herif
fs D
ept w
ebsi
te a
nd
Dep
artm
ent o
f Hea
lth S
ervi
ces
web
site
.
178


![Los Angeles herald (Los Angeles, Calif. : 1900) (San ... · Los Angeles herald (Los Angeles, Calif. : 1900) (San Francisco) 1907-02-17 [p 10]](https://static.documents.pub/doc/80x56/5acba5097f8b9aa1518b6473/los-angeles-herald-los-angeles-calif-1900-san-angeles-herald-los-angeles.jpg)
