207
County of Los Angeles Comprehensive Annual Financial Report Fiscal Year Ended June 30, 2003 J. Tyler McCauley · Auditor/Controller

County of Los Angeles Comprehensive Annual Financial Report
Fiscal Year Ended June 30, 2003 J. Tyler McCauley · Auditor/Controller

County of Los Angeles Comprehensive Annual Financial Report
Fiscal Year Ended June 30, 2003 J. Tyler McCauley• Auditor/Controller

COUNTY OF LOS ANGELES COMPREHENSIVE ANNUAL FINANCIAL REPORT
FOR THE FISCAL YEAR ENDED JUNE 30, 2003 TABLE OF CONTENTS
I. INTRODUCTORY SECTION: Page
Auditor-Controller's Letter of Transmittal ............................................................................................ i Certificate of Achievement for Excellence in Financial Reporting ..................................................... ix Board of Supervisors and Principal County Officials .......................................................................... x Organization Chart ........................................................................................................................... xi
II. FINANCIAL SECTION:
Independent Auditors' Report ........................................................................................................... 1 Management's Discussion and Analysis .......................................................................................... 3 Basic Financial Statements:
Government-wide Financial Statements: Statement of Net Assets ..................................................................................................... 21 Statement of Activities ........................................................................................................ 22
Fund Financial Statements: Balance Sheet - Governmental Funds ................................................................................ 24 . Reconciliation of the Balance Sheet of Governmental Funds to the
Statement of Net Assets ............................................................................................... 26 Statement of Revenues, Expenditures, and Changes in Fund Balances -
Governmental Funds .................................................................................................... 28 Reconciliation of the Statement of Revenues, Expenditures, and Changes in
Fund Balances of Governmental Funds to the Statement of Activities .......................... 30 Statement of Revenues, Expenditures, and Changes in Fund Balances -
Budget and Actual on Budgetary Basis: General Fund .......................................................................................................... 31 Fire Protection District ............................................................................................ 32 Flood Control District .............................................................................................. 33 Public Library .......................................................................................................... 34 Regional Park and Open Space District.. ................................................................ 35
Statement of Net Assets - Proprietary Funds ...................................................................... 36 Statement of Revenues, Expenses and Changes in Fund Net Assets -
Proprietary Funds ......................................................................................................... 38 Statement of Cash Flows - Proprietary Funds .................................................................... 40 Statement of Fiduciary Net Assets - Fiduciary Funds ......................................................... 44 Statement of Changes in Fiduciary Net Assets - Fiduciary Funds ....................................... 45
Notes to the Basic Financial Statements .................................................................................. 46 Required Supplementary Information (unaudited) -
Schedule of Funding Progress - LACE RA ................................................................................ 94

COUNTY OF LOS ANGELES COMPREHENSIVE ANNUAL FINANCIAL REPORT FOR THE FISCAL YEAR ENDED JUNE 30, 2003
TABLE OF CONTENTS
Combining and Individual Fund Statements and Schedules: Major Governmental Fund - General Fund -
Page
Schedule of Expenditures - Budget and Actual on Budgetary Basis ................................... 95 Nonmajor Governmental Funds:
Combining Balance Sheet - Nonmajor Governmental Funds - Summary ............................ 97 Combining Statement of Revenues, Expenditures and Changes in Fund Balances -
Nonmajor Governmental Funds - Summary .................................................................. 98 Combining Balance Sheet - Non major Governmental Funds - Special Revenue .............. 100 Combining Statement of Revenues, Expenditures and Changes in Fund Balances -
Nonmajor Governmental Funds - Special Revenue .................................................... 104 Schedules of Revenues, Expenditures and Changes in Fund Balances -
Nonmajor Governmental Funds - Special Revenue - Budget and Actual on Budgetary Basis:
Totals .................................................................................................................... 107 Road .....•............................................................................................................... 108 Other Streets, Highways, Roads, and Bridges ...................................................... 109 Street Lighting Districts ........................................................................................ 110 Garbage Disposal Districts .................................................................................... 111 Sewer Maintenance Districts ................................................................................. 112 Health and Sanitation ............................................................................................ 113 Other Public Protection ......................................................................................... 114 Public Assistance .................................................................................................. 115 Recreation . . . . . . . . . . . . . . . . . . . . . . . . . . . . . . . . . . . . . . . . . . . . . . . . . . . . . . . . . . . . . . . . . . . . . . . . . . . . . . . . . . . . . . . . . . . . . . . . . . . . . . . . . . . . 116 Courthouse Temporary Construction .................................................................... 117 Criminal Justice Temporary Construction .............................................................. 118 Other Special Revenue ......................................................................................... 119
Combining Balance Sheet - Nonmajor Governmental Funds - Debt Service .................... 120 Combining Statement of Revenues, Expenditures and Changes in Fund Balances -
Non major Governmental Funds - Debt Service ........................................................... 122 Schedules of Revenues, Expenditures and Changes in Fund Balances -
Nonmajor Governmental Funds - Debt Service - Budget and Actual on Budgetary Basis:
Totals .................................................................................................................... 124 Detention Facilities ................................................................................................ 125 Flood Control District ............................................................................................ 126 Regional Park and Open Space District.. .............................................................. 127 Marina Del Rey ..................................................................................................... 128
Combining Balance Sheet - Nonmajor Governmental Funds - Capital Projects ................ 129 Combining Statement of Revenues, Expenditures and Changes in Fund Balances -
Nonmajor Governmental Funds - Capital Projects ...................................................... 130 Combining Balance Sheet- Nonmajor Governmental Funds - Permanent Funds ............. 131 Combining Statement of Revenues, Expenditures and Changes in Fund Balances -
Nonmajor Governmental Funds - Permanent Funds ................................................... 132

COUNTY OF LOS ANGELES COMPREHENSIVE ANNUAL FINANCIAL REPORT
FOR THE FISCAL YEAR ENDED JUNE 30, 2003 TABLE OF CONTENTS
Nonmajor Enterprise Funds: Page
Combining Statement of Net Assets - Nonmajor Enterprise Funds ................................... 133 Combining Statement of Revenues, Expenses and Changes in Fund Net Assets -
Nonmajor Enterprise Funds ................... ,. .................................................................... 134 Combining Statement of Cash Flows - Nonmajor Enterprise Funds·····························.···· 135
Internal Service Funds: Combining Statement of Net Assets - Internal Service Funds ........................................... 137 Combining Statement of Revenues, Expenses and Changes in Fund Net Assets -
Internal Service Funds ................................................................................................ 138 Combining Statement of Cash Flows - Internal Service Funds ......................................... 139
Fiduciary Funds: Combining Statement of Fiduciary Net Assets - Fiduciary Funds -
Investment Trust Funds .............................................................................................. 141 Combining Statement of Changes in Fiduciary Net Assets - Fiduciary Funds -
Investment Trust Funds .............................................................................................. 142 Combining Statement of Changes in Assets and Liabilities - Fiduciary Funds -
Agency Funds ............................................................................................................. 143 Capital Assets Used in the Operation of Governmental Funds:
Schedule by Source ......................................................................................................... 145 Schedule by Function ....................................................................................................... 146 Schedule of Changes by Function ................................................................................... 148
Ill. STATISTICAL SECTION (Not covered by Independent Auditors' Report):
Bar Chart- General Governmental Expenditures and Revenues - Last Ten Fiscal Years ............ 149 General Governmental Expenditures by Function - Last Ten Fiscal Years ................................... 150 General Governmental Revenues by Source - Last Ten Fiscal Years .......................................... 152 Property Tax Levies and Collections - Last Ten Fiscal Years ....................................................... 154 Gross Assessed Value of Taxable Property - Last Ten Fiscal Years ............................................ 155 Property Tax Rates - Computation of Direct and Overlapping Debt - Tax Rate Area #4 -
Last Ten Fiscal Years ............................................................................................................. 156 Ratio of Net General Bonded Debt to Assessed Value and Net Bonded Debt per Capita -
Last Ten Fiscal Years ............................................................................................................. 157 Computation of Legal Debt Margin ............................................................................................... 158 Estimated Direct and Overlapping Bonded Debt.. ........................................................................ 159 Ratio of Annual Debt Service for General Bonded Debt to Total General Governmental
Expenditures - Last Ten Fiscal Years ..................................................................................... 161 Schedule of Insurance in Force .................................................................................................... 162 Public Official Blanket Bond ......................................................................................................... 163 Demographic Statistics - Last Ten Years ..................................................................................... 164 Property Value, Construction and Bank Deposits - Last Ten Years .............................................. 165 Principal Taxpayers ..................................................................................................................... 166 Special Assessment Billings and Collections -
County Improvement Districts ................................................................................................ 167 Miscellaneous Statistical Data ...................................................................................................... 168


IIINNNTTTRRROOODDDUUUCCCTTTOOORRRYYY SSSEEECCCTTTIIIOOONNN

J. TYLER McCAULEY AUDITOR-CONTROLLER
COUNTY OF LOS ANGELES DEPARTMENT OF AUDITOR-CONTROLLER
KENNETH HAHN HALL OF ADMINISTRATION 500 WEST TEMPLE STREET, ROOM 525 LOS ANGELES, CALIFORNIA 90012-2766
PHONE: (213) 974-8301 FAX: (213) 626-5427
December 5, 2003
The Honorable Board of Supervisors County of Los Angeles 383 Kenneth Hahn Hall of Administration 500 West Temple Street Los Angeles, California 90012
Dear Supervisors:
In accordance with Section 25253 of the Government Code of California, I hereby submit the Comprehensive Annual Financial Report (CAFR) of the County of Los Angeles for the year ended June 30, 2003. The report contains financial statements that have been prepared in accordance with generally accepted accounting principles prescribed for governmental entities, and provides a comprehensive overview of the County's financial operations and financial position. The accuracy, completeness and fairness of the presentation of all information in this report are the responsibility of the County.
This is the second year that the CAFR has been prepared in conformance with new financial reporting requirements established by Governmental Accounting Standards Board (GASS) Statement No. 34, "Basic Financial Statements - and Management's Discussion and Analysis - for State and Local Governments." The County is required by GASS 34 to provide a narrative introduction, overview, and analysis to accompany the basic financial statements. This narrative is referred to as "Management's Discussion and Analysis" (MD&A) and the current year's CAFR represents the first period for which comparative financial information is displayed in the MD&A.
The CAFR consists of three sections: introductory, financial and statistical. The introductory section is composed of this letter, an organization chart of the County, and a listing of the members of the Board of Supervisors and principal County officials. The financial section includes the Independent Auditor's Report, the MD&A, the Basic Financial Statements (including notes) and the Required Supplementary Information. The Basic Financial Statements include the government-wide financial statements that are designed to provide an overview of the County's entire financial operations. In addition, the fund financial statements present financial information of each of the County's major funds, as well as non-major funds, fiduciary funds, and other funds. The statistical section includes other financial information and also demographic information, generally presented on a multi-year basis.
"To Enrich Lives Through Effective and Caring Service"

11
Honorable Board of Supervisors Page 2
The report includes financial data for all County funds and the following additional entities which are considered part of the County for purposes of meeting the reporting entity requirements prescribed by the Governmental Accounting Standards Board:
Fire Protection District Flood Control District Street Lighting Districts Improvement Districts Community Development
Commission (including the Housing Authority of the County of Los Angeles)
Children and Families First Commission
Regional Park and Open Space District Garbage Disposal Districts Sewer Maintenance Districts Waterworks Districts Los Angeles County Employees
Retirement Association Los Angeles County Capital Asset
Leasing Corporation Various Joint Powers Authorities
The above entities are regarded as component units of the County and have been included in the County's basic financial statements because the Board of Supervisors is financially accountable for them. All component units have been blended into the basic financial statements except for the Children and Families First Commission, which is discretely presented. Note 1 to the basic financial statements contains additional infomlation regarding the relationship between the County and these entities.
Other local governmental entities provide public services to the residents of the County, including over eighty cities, one hundred school districts and numerous special districts that provide specialized services to the County's residents. The operations of these entities have not been included in the County's reporting entity since each entity is responsible for conducting its own day-to-day operations and is compelled to answer to its own separately elected governing board. Significant entities that do not meet the criteria for inclusion in this report include the City of Los Angeles, Los Angeles Unified School District and Los Angeles County Sanitation Districts. The Los Angeles County Superior Court is not included due to legislation (AB233) which transferred oversight responsibilities for Court operations to the State in 1997-98. However, AB233 requires the County to continue to fund certain Court-related expenditures, and the County continues to receive certain Court collections. Accordingly, the County's financial statements include various Court-related financial transactions.
LOS ANGELES COUNTY AND ITS SERVICES
Los Angeles County was established by an act of the State Legislature on February 18, 1850 as one of California's original 27 counties. Located in the southern portion of the State, the County covers 4,083 square miles. With a population of nearly ten million, as of January 2003, its population is the largest of any county in the nation.

Honorable Board of Supervisors Page 3
Los Angeles County was a general law county until 1913 when it became a charter county as a result of local election. The County is governed by a five member Board of Supervisors who are elected by district to serve alternating four-year terms. The Assessor, District Attorney and Sheriff are also elected officials while all other departments are headed by appointed officials. On March 5, 2002, County voters approved two charter amendments providing for term limits for the Board of Supervisors and the other elected County officials. The affected officials are limited to three consecutive terms commencing December 2002.
There are over one million residents in the unincorporated areas of the County. These residents receive all municipal services from the County, including law enforcement, fire protection, land use and zoning, building and business permits, local road building and maintenance, animal care and control, and public libraries. In addition, the County provides a wide range of services to all County residents.
The County also provides municipal services to many incorporated cities within its boundaries under the Contract Services Plan. Established in 1954, the Plan allows cities to provide municipal services without incurring the cost of creating numerous city departments and facilities by having the County provide, at cost, any or all municipal services within a city at the same level as provided in unincorporated areas, or at any higher level the city may choose. Although the Plan was developed to assist new cities, the great majority of the cities in the County now contract for one or more services.
The County's principal functions include seven major areas as required under the County's Charter, County Ordinances, or by State or federal mandate: general government, public protection, public ways and facilities, health and sanitation, public assistance, education and recreation and cultural services. The State and federal governments mandate certain minimum levels of services in the public assistance and health areas.
ECONOMIC CONDITION AND OUTLOOK
Los Angeles County serves as the central trade district for the western United States and controls nearly three quarters of the Pacific Coast trade with Asia. The County remains a leader in the communications industry, has established itself as a leading financial center and serves as the western headquarters for many national industrial and financial firms.
Since 2001-2002, the County has experienced a modest recession, with an unemployment rate estimated at 6.7% for that period. The County's economic outlook appears to be slowly recovering during 2003, with job increases projected at 39,500. The modest recovery is supported by defense and aerospace work that has flowed into the County. There has also been support from the construction of major projects, including
Ill

IV
Honorable Board of Supervisors Page4
port expansions, the UCLA Medical Center, and the replacement of the County's LAC+USC Medical Center. Two other significant projects that were recently completed are the Disney Concert Hall and the Gold Line light rail that extends from downtown Los Angeles to the City of Pasadena.
The County's real estate market maintained its relative strength in comparison to overall economic conditions. With continued high demand for housing, there were increases in both existing and new home sales, which went from 107,439 in 2001 to 117 ,208 in 2002. The increase in annual home sales has been accompanied by a decline in industrial vacancy rates, defaults, and foreclosures. The decline in vacant office space reflects, in particular, the increasing space needs of the growing motion picture, multimedia, and business services industries.
Construction activity has increased steadily since 1997. The lack of inventory from previous years has added to the demand for new construction. As a result, the number of residential building permits issued each year has nearly doubled from 11,692 in 1997 to 19,271 in 2002. Annual building permit valuations (both residential and non-residential) have steadily increased from $5.9 billion in 1997 to $7.2 billion in 2002.
FINANCIAL INFORMATION
INTERNAL AND BUDGETARY CONTROLS
The County has developed a system of internal accounting controls designed to provide reasonable, but not absolute, assurance that assets are safeguarded against loss from unauthorized use and to provide reliable records for preparing financial statements and maintaining accountability for assets. The concept of reasonable assurance recognizes that the costs of a system of internal accounting controls should not outweigh related benefits and that the evaluation of costs and benefits requires estimates and judgments by management. All internal accounting control evaluations occur within the above framework. We believe that the County's system of internal accounting controls adequately safeguards assets and also provides reasonable assurance of proper recording of financial transactions.
In accordance with the provisions of Section 29000-29144 of the Government Code, commonly known as the County Budget Act, the County prepares and adopts a budget on or before August 30 of each fiscal year. Expenditures are controlled at the object level for all budget units within the County, except for fixed asset expenditures which are controlled at the sub-object level.

Honorable Board of Supervisors Page 5
Encumbrance accounting is utilized to ensure effective budgetary control and accountability. Unencumbered appropriations lapse at year-end and encumbrances outstanding at the time are reported as reservations of fund balance for subsequent year expenditures.
The Board of Supervisors must approve all transfers of appropriations between budget units and transfers exceeding $250,000 within budget units. The Board must also approve necessary supplemental appropriations, normally financed by unanticipated revenues earned during the year.
In addition to these procedural controls, the Auditor-Controller's Audit Division performs periodic internal control, operational and management audits of the various departments to help ensure that prescribed procedures are followed and that operations are conducted in an efficient manner. In addition, the Auditor-Controller operates a fraud hotline that provides County employees and citizens with a way to anonymously report perceived fraudulent activities by County employees, vendors, contractors, inspectors, etc. Allegations reported over the hotline are evaluated and investigated.
A substantial portion of the County's overall budget is appropriated for contracted services. During 2002-2003, the Auditor-Controller evaluated the effectiveness of the County's contract monitoring program. This effort was focused on a small group of County departments that administer a significant volume of contracts at relatively high dollar values. With support from the Board of Supervisors, the Auditor-Controller has begun to implement a series of pilot projects to test the merits of centralizing the contract monitoring function in the Auditor-Controller in order to improve its effectiveness.
CASH MANAGEMENT
The majority of the entities included in the CAFR have their funds on deposit with the Los Angeles County Treasury Pool (LACTP). The Treasurer invests LACTP funds primarily in certificates of deposit, obligations of various agencies of the federal government and of Los Angeles County, corporate notes, repurchase agreements, and commercial paper. In accordance with Governmental Accounting Standards Board Statement No. 31, "Accounting and Financial Reporting for Certain Investments and for External Investment Pools," the basic financial statements reflect the fair value of investments.
The Treasurer's investment policy is to minimize credit and market risks while maintaining a competitive yield on its portfolio. Investments are placed in conformance with State law and Treasurer's investment policy approved by the Board. Any deviations from the policy are reported to the Los Angeles County Board of Supervisors monthly and the Treasury Oversight Committee quarterly.
v

VI
Honorable Board of Supervisors Page 6
While the Treasurer did not enter into any reverse repurchase agreements during 2002-2003, the Treasurer has determined that, prudently managed and controlled, the use of reverse repurchase agreements can provide incremental gains thereby adding value to the portfolio. The Treasurer's policy limits the maximum par value to $500 million and proceeds from reverse repurchase agreements may only be reinvested in instruments with maturities at or before the maturity of the reverse repurchase agreement.
Floating rate notes (derivatives) are used as part of the Treasurer's investment strategy. The Treasurer's investment policy precludes the use of complex or hybrid structured investments such as inverse floating rate notes, range notes, and interest only strips derived from mortgage pools.
As of June 30, 2003, LACTP investments had the following maturity ranges:
Maturity Period
1to60 days 61 days to 1 year Over 1 year
% of Total
33.4% 20.7% 45.9%
The Retirement Association's Board of Investments manages the Pension Trust Fund. Its investments are made in accordance with State law which authorizes a "Prudent Expert" guideline as to the form and type of investments which may be purchased. Examples of the fund's investments include domestic and global stocks and convertibles, obligations of various federal agencies, domestic corporate bonds, and real estate.
The average earnings rate for LACTP for 2002-2003 was 2.16 percent. The Pension Trust Fund's total fund return earned a positive yield of 3.6 percent, reversing a two-year trend of negative earnings that were due to declining stock markets.
The Governmental Accounting Standards Board has established rating criteria to be utilized as indicators, but not absolute measurements, of credit risk for deposits and investments. Credit risk is the risk that the issuer of a security will not redeem it. A low risk category is not necessarily good and a high risk category is not necessarily bad. Additional factors such as the internal controls and financial stability of the parties involved must be taken into consideration. As of June 30, 2003, all of the County's investments were in the low risk category. Note 4 to the basic financial statements provides additional information regarding deposits and investments.

Honorable Board of Supervisors Page 7
CONSTITUTIONAL LIMITATIONS ON TAXES AND APPROPRIATIONS
Article XlllA and XlllB
Article XlllA of the California Constitution limits the taxing powers of California public agencies. Article XI llA provides that the maximum ad valorem tax on real property cannot exceed one percent of the "full cash value" of the property, and effectively prohibits the levying of any other ad valorem property tax except for taxes which are required to pay debt service on voter-approved general obligation bonds. "Full cash value" is defined as "the County Assessor's valuation of real property as shown on the 1975-76 tax bill under 'full cash value' or, thereafter, the appraised value of real property when purchased, newly constructed, or a change in ownership has occurred after the 1975 assessment." The "full cash value" is subject to annual adjustment to reflect inflation at a rate not to exceed two percent or a reduction in the consumer price index or comparable local data, or declining property value caused by damage, destruction or other factors.
The foregoing limitation does not apply to ad valorem taxes or special assessments to pay the interest and redemptiori Charges on any indebtedness approved by the voters before July 1, 1978 or any bonded indebtedness for the acquisition or improvement of real property approved by two-thirds of the voters voting on a proposition subsequent to that date.
RISK MANAGEMENT
The County purchases insurance for certain risk exposures such as aviation, employee fidelity, boiler and machinery in certain structures, art objects, catastrophic hospital general liability, volunteer, crime, special events, public official bond, public safety reserve employee death and disability, and fiduciary liability for the deferred compensation plans. The County also has insurance on most major structures.
The County retains the risk for all other loss exposures. Major areas of risk include workers' compensation and long-term disability, medical malpractice, law enforcement, theft and damage to property, errors and omissions and torts.
As discussed in Note 15 to the basic financial statements, the County's workers' compensation expenses and related liabilities significantly increased during 2002-2003. Workers' compensation costs have become a major concern for both public and private employers in California. Although State legislative reforms were begun in 2003, additional reforms will be necessary in upcoming years to improve the system in a manner that reasonably controls costs.
vii

viii
Honorable Board of Supervisors Page8
INDEPENDENT AUDIT
OTHER INFORMATION
The basic financial statements have been audited by KPMG LLP, with its subcontractor, Vasquez & Co. LLP. In accordance with the requirements of the Office of Management and Budget Circular A-133, as revised, the auditors are also in the process of completing an annual financial and compliance audit of federal funds received by the County. The County's single audit for 2001-2002 has been completed.
AWARDS
The Government Finance Officers Association of the United States and Canada (GFOA) awarded a Certificate of Achievement for Excellence in Financial Reporting to the County of Los Angeles for its Comprehensive Annual Financial Report for the past twenty-one fiscal years.
In order to be awarded a Certificate of Achievement, a government unit must publish an easily readable and efficiently organized Comprehensive Annual Financial Report, whose contents conform to program standards. The report must satisfy both generally accepted accounting principles (GAAP) and applicable legal requirements.
A Certificate of Achievement is valid for a period of one year only. We believe our current report continues to conform to Certificate of Achievement Program requirements, and we are submitting it to GFOA to determine its eligibility for another certificate.
ACKNOWLEDGEMENTS
I would like to express my appreciation to my Accounting Division, the various County departments who assisted in the preparation of this report and also acknowledge the efforts of our independent auditors.
Sincerely,
S-J-J·~rn~ J. Tyler McCauley Auditor-Controller

Certificate of Achievement for Excellence
in Financial Reporting
Presented to
County of Los Angeles, California
For its Comprehensive Annual
Financial Report
for the Fiscal Year Ended
June 30, 2002
A Certificate of Achievement for Excellence in Financial Reporting is presented by the Government Finance Officers
Association of the United States and Canada to government units and public employee retirement systems whose comprehensive annual financial
reports (CAFRs) achieve the highest standards in government accounting
and fmancial reporting.
President
Executive Director
ix
x
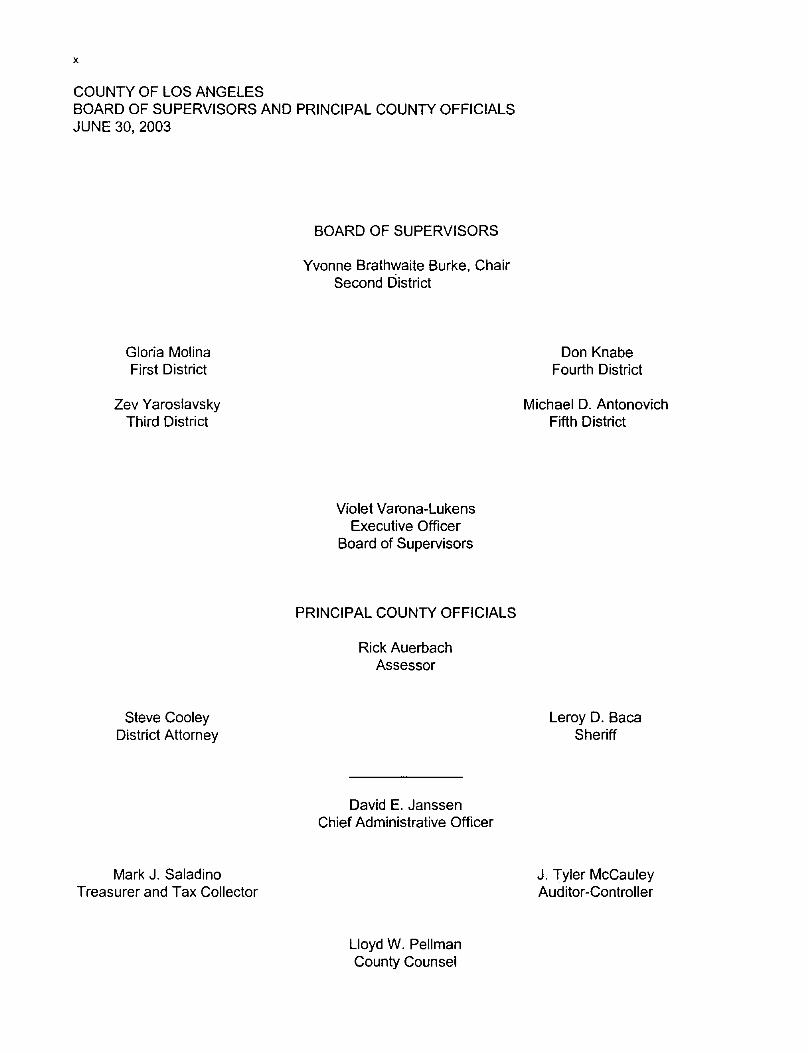
COUNTY OF LOS ANGELES BOARD OF SUPERVISORS AND PRINCIPAL COUNTY OFFICIALS JUNE 30, 2003
Gloria Molina First District
Zev Yaroslavsky Third District
Steve Cooley District Attorney
Mark J. Saladino Treasurer and Tax Collector
BOARD OF SUPERVISORS
Yvonne Brathwaite Burke, Chair Second District
Violet Varona-Lukens Executive Officer
Board of Supervisors
PRINCIPAL COUNTY OFFICIALS
Rick Auerbach Assessor
David E. Janssen Chief Administrative Officer
Lloyd W. Pellman County Counsel
Don Knabe Fourth District
Michael D. Antonovich Fifth District
Leroy D. Baca Sheriff
J. Tyler McCauley Auditor-Controller

I I • •
ASSESSOR DISTRICT ATIORNEY
I I I * * • BOARD ADVISORY BUSINESS CIVIL
COMMISSIONS LICENSE SERVICE & COMMlffiES COMMISSION COMMISSION
I I * * ARTS HUMAN RELATIONS
COMMISSION COMMISSION
I I I * • * AFFIRMATIVE AGRICULTURAL
ALTERNATE ACTION COMMISSIONER/ COMPLIANCE WEIGHTS PUBLIC DEFENDER
OFFICE & MEASURES
I I I • • •
COUNTY FIRE CORONER
COUNSEL DEPARTMENT
I I I * • •
PARKS & PUBLIC RECREATION
PROBATION DEFENDER
REY. 11m1c
COUNTY OF LOS ANGELES
ELECTORATE
I • •
SHERIFF BOARD OF
SUPERVISORS
. I I I I
* * • OFFICE Of EXECUTIVE OFFICE
COMMUNITY EMPLOYEE 0 BOARD OF DEVELOPMENT RELATIONS
EDUCATION SUPERVISORS
COMMISSION COMMISSION BOARD Of ASSESSMENT EDUCATION APPEALS BOARD
I ' I * * 0 EMPl.OYEES RETIREMENT
REGIONAL CHIEF ASSOCIATION PLANNING ADMINISTRATIVE 0 BOARD Of RETIREMENT
COMMISSION OFFICER 0 BOARD Of INVESTMENTS
I I -, I * • * 0
ANIMAL CARE AUDITOR· BEACHES CHILO SUPPORT & CONTROL CONTROLLER & HARBORS SERVICES
I I -, I • * HUMAN * * HEALTH RESOURCES INTERNAL MENTAL
SERVICES OFFICE Of SERVICES HEALTH PUBLIC SAFETY
I I I I 0 • 0 0
PUBLIC PUBLIC PUBLIC REGIONAL LIBRARY SOCIAL SERVICES WORKS PLANNING
*
*
I CHIEF
LEGEND
APPOINTIVE • REQUIRED BY COUNTY CHARTER 0 REQUIRED OR AUTHORIZED BY STATE LAW * ESTABLISHED BY ORDINANCE OF THE
BOARD OF SUPERVISORS
ELECTIVE e REQUIRED BY COUNTY CHARTER 0 REQUIRED BY STAT E LAW/STATE AGENCIES
TY RETAINS LIMITED FOR WHICH COUN RESPONSIBILITY
I 0
GRANO JURY
I *
INFORMATION OMBUDSMAN OFFICER
I I I * * CHILDREN & COMMUNITY CONSUMER
FAMILY SERVICES & SENIOR SERVICES
AFFAIRS
I I I * * * MILITARY MUSEUM MUSEUM
& VETERANS Of ART OF NATURAL AFFAIRS HISTORY
I I • • REGISTRAR· TREASURER &
RECORDER/ TAX COLLECTOR COUNTY CLERK

xii

FFFIIINNNAAANNNCCCIIIAAALLL SSSEEECCCTTTIIIOOONNN

355 South Grand Avenue
Suite 2000
Los Angeles, CA 90071-1568
Independent Auditors' Report
The Honorable Members of the Board of Supervisors County of Los Angeles, California:
We have audited the accompanying financial statements of the governmental activities, the business-type activities, the discretely presented component unit, each major fund, and the aggregate remaining fund information of the County of Los Angeles, California (County) as of and for the year ended June 30, 2003, which collectively comprise the County's basic financial statements as listed in the table of contents. These financial statements are the responsibility of the County's management. Our responsibility is to express opinions on these financial statements based on our audit. We did not audit the financial statements of the Los Angeles County Employees' Retirement Association (LACERA), which statements are shown in the Pension Trust Fund of the basic financial statements, and the Children and Families First Commission (CFFC), shown as a discretely presented component unit. Those financial statements were audited by other auditors whose reports thereon have been furnished to us, and our opinions, insofar as it relates to the amounts included for LA CERA and CFFC, are based on the reports of the other auditors.
We conducted our audit in accordance with auditing standards generally accepted in the United States of America and the standards applicable to financial audits contained in Government Auditing Standards issued by the Comptroller General of the United States. Those standards require that we plan and perform the audit to obtain reasonable assurance about whether the financial statements are free of material misstatement. An audit includes examining, on a test basis, evidence supporting the amounts and disclosures in the financial statements. An audit also includes assessing the accounting principles used and significant estimates made by management as well as evaluating the overall financial statement presentation. We believe that our audit and the reports of the other auditors provide a reasonable basis for our opinions.
In our opinion, based on our audit and the reports of the other auditors, the financial statements referred to above present fairly, in all material respects, the respective financial position of the governmental activities, the business-type activities, the discretely presented component unit, each major fund, and the aggregate remaining fund information of the County of Los Angeles, California as of June 30, 2003, and the respective changes in financial position and cash flows, where applicable, thereof and the respective budgetary comparison for the General Fund, the Fire Protection District, the Hood Control District, the Public Library, and the Regional Park and Open Space District for the year then ended in conformity with accounting principles generally accepted in the United States of America.
In accordance with Government Auditing Standards, we have also issued a report dated December 5, 2003 on our consideration of the County's internal control over financial reporting and on our tests of its compliance with certain provisions of laws, regulations, contracts, and grants. That report is an integral part of an audit performed in accordance with Government Auditing Standards and should be read in conjunction with this report in considering the results of our audit.
1111 KPMG LLP. KPMG LLP. a U $_ ltm1tad habbty parmership. rs a ll'M:lmbef of KPMG lntamauonal. a Swr.;s associauon

The Management's Discussion and Analysis on pages 3 through 20 and the schedule of funding progress on page 94 are not a required part of the basic financia~ statements, but are supplementary information required by the accounting principles generally accepted in the United States of America. We and the other auditors have applied certain limited procedures, which consisted principally of inquiries of management regarding the methods of measurement and presentation of the required supplementary information. However, we did not audit the information and express no opinion on it.
Our audit was conducted for the purpose of forming opinions on the financial statements that collectively comprise the County of Los Angeles' basic financial statements. The accompanying supplementary information identified in the table of contents as the introduction section, combining and individual fund statements and schedules, and the statistical section are presented for purposes of additional analysis and are not required parts of the basic financial statements. The combining and individual fund statements and schedules have been subjected to the auditing procedures applied by us and other auditors in the audit of the basic financial statements and, in our opinion, based on our audit and the reports of the other auditors, are fairly stated, in all material respects, in relation to the basic financial statements taken as a whole. The introductory section and the statistical section have not been subjected to the auditing procedures applied by us and the other auditors in the audit of the basic financial statements, and accordingly, we express no opinion on them.
December 5, 2003

COUNTY OF LOS ANGELES MANAGEMENT'S DISCUSSION AND ANALYSIS
This section of the County's Comprehensive Annual Financial Report (CAFR) presents a narrative overview and analysis of financial activities for the fiscal year ended June 30, 2003. We recommend that this information be used in conjunction with additional information contained in the letter of transmittal.
Financial Highlights
At the end of the current year, the net assets (total assets less total liabilities) of the County were positive $614 million. However, net assets are classified into three categories and the unrestricted component is negative $3.126 billion. See further discussion on page 7.
During the current year, the County's net assets decreased by a total of $98 million. Net assets related to governmental activities decreased by $240 million, while net assets related to business-type activities increased by $142 million.
At the end of the current year, the County's General Fund reported a total fund balance of $1.698 billion. The amount of unreserved fund balance was $1.315 billion. Of the unreserved total, $669 million was designated.
The County's capital asset balances were $4.076 billion at year-end and increased by $216 million during the year. Infrastructure assets are reflected only to the extent that they were acquired since July 1, 2001. Retroactive infrastructure reporting has been deferred until future years as discussed on page 6.
The County's total long-term debt decreased by $269 million during the year. Bond maturities of $598 million exceeded the $329 million of newly issued and accreted long-term debt.
Overview of the Basic Financial Statements
This discussion and analysis are intended to serve as an introduction to the County's basic financial statements, which are comprised of the following three components:
• Government-wide financial statements • Fund financial statements • Notes to the basic financial statements
This report also includes other supplementary information in addition to the basic financial statements.
GOVERNMENT-WIDE FINANCIAL STATEMENTS
The government-wide financial statements are designed to provide readers with a broad overview of the County's finances, in a manner similar to a private-sector business.
The Statement of Net Assets presents information on all County assets and liabilities, with the difference representing net assets. Over time, increases and decreases in net assets may serve as an indicator of whether the financial position of the County is improving or deteriorating.
3

4
COUNTY OF LOS ANGELES MANAGEMENT'S DISCUSSION AND ANALYSIS-Continued
GOVERNMENT-WIDE FINANCIAL STATEMENTS-Continued
The Statement of Activities presents information that indicates how the County's net assets changed during the fiscal year. All changes in net assets are reported as soon as the underlying events giving rise to the change occur, regardless of the timing of related cash flows. Therefore, revenues and expenses are reported in these statements for some items that affect cash flows in future periods. For example, property tax revenues have been recorded that have been earned but not yet collected and workers' compensation expenses have been accrued but not yet paid.
The government-wide financial statements report the following different types of programs or activities:
• Governmental Activities - The majority of County services are reported under this category. Taxes and intergovernmental revenues are the major revenue sources that fund these activities which include general government, public protection, public ways and facilities, health and sanitation, public assistance, recreation, and cultural services.
• Business-type Activities - County services that are intended to recover costs through user charges and fees are reported under this category. The County Hospitals, the Waterworks Districts, the Aviation Fund, and housing programs operated by the Community Development Commission, a blended component unit, are regarded as business-type activities.
• Discretely Presented Component Unit - Component units are separate entities for which the County is financially accountable. The Children and Families First Commission is the only component unit that is discretely presented.
FUND FINANCIAL STATEMENTS
The fund financial statements contain information regarding major individual funds. A fund is a fiscal and accounting entity with a balanced set of accounts. The County uses separate funds to ensure compliance with fiscal and legal requirements.
The County's funds are classified by the following three categories:
• Governmental Funds - These funds are used to account for essentially the same services that were previously described as governmental activities above. However, the fund financial statements focus on near-term inflows and outflows of spendable resources, as well as on balances of spendable resources available at the end of the fiscal year. Such information may be useful in evaluating the County's near-term financing requirements. Because the focus of governmental funds is narrower than that of the government-wide financial statements, it is useful to compare the information presented for governmental funds with similar information presented for governmental activities in the governmentwide financial statements. By doing so, readers may better. understand the long-term impact of the government's near-term financing decisions. Both the governmental fund balance sheet and the governmental fund statement of revenues, expenditures and changes in fund balances provide a reconciliation to facilitate this comparison between governmental funds and governmental activities. Governmental funds include the General Fund, as well as Special Revenue Funds, Debt Service Funds, Capital Project Funds, and Permanent Funds.

COUNTY OF LOS ANGELES MANAGEMENT'S DISCUSSION AND ANALYSIS-Continued
FUND FINANCIAL STATEMENTS-Continued
• Proprietary Funds - These funds are used to account for functions that were classified as "business type activities" in the government-wide financial statements. The County's Internal Service Funds are also reported within the proprietary fund section. The County's six Hospital Funds are all considered major funds for presentation purposes. The remaining proprietary funds are combined in a single column, with individual fund details presented elsewhere in this report.
• Fiduciary Funds - These funds are used to report assets held in a trustee or agency capacity for others and cannot be used to support the County's programs. The Pension Trust Fund, the Investment Trust Funds, and Agency funds are reported in this fund category, using the accrual basis of accounting.
NOTES TO THE BASIC FINANCIAL STATEMENTS
The notes to the basic financial statements provide additional information that is essential to a full understanding of the data provided in the government-wide and the fund financial statements.
REQUIRED SUPPLEMENTARY INFORMATION
In addition to the basic financial statements and accompanying notes, this report presents certain required supplementary information concerning the County's progress in funding its obligation to provide pension benefits to employees.
Government-wide Financial Analysis
This year is the second year that the County has applied Governmental Accounting Standards Board (GASS) Statement No. 34. Accordingly, this year represents the first time that comparable financial information is available in a format consistent with GASS 34. Certain reclassifications and. adjustments have been made to the prior year balances to conform to the current year's presentation format.
As noted earlier, net assets may serve over time as a useful indicator of a government's financial position. In the case of the County, assets exceeded liabilities by $614 million at the close of the most recent fiscal year.
5

6
Current and other assets Capital assets
Total assets
Current and other Liabilities
Long-term liabilities Total liabilities
Net assets: Invested in capital assets. net of
related debt Restricted net
assets Unrestricted net
assets Total net assets
Total liabilities and net assets
COUNTY OF LOS ANGELES MANAGEMENT'S DISCUSSION AND ANALYSIS-Continued
Statement of Net Assets June 30, 2003 (in thousands)
Governmental Business-type Activities Activities Total
2003 2002 2003 2002 2003
$ 5,205,776 $ 5,184,932 $ 1.226.589 $ 1.071,554 $ 6,432.365 3.235.007 3,069.746 841.112 790.313 4,076,119 8 440 783 8 254 678 -2....Q_liLlfil. 1 861 867 10 508 484
1,230.278 1,247,121 172;570 168,073 1,402,848 6.484.227 6,041,492 2.007.332 1. 947 ,455 8,491.559 7.714.505 7,288,613 2,179,902 2.115,528 9,894,407
2,210,640 1.944.507 495,549 402,528 2,706.189
907,155 913.613 127.192 91,994 1.034.347
(2.391.517) (1,892,055) (734,942) (748.183) (3,126.459) 726.278 966.065 (112.201) (253.661) 614,077
$ 8 110 ZB~ l 8 25~ 6ZB l 2 06Z ZOl $ 1 §§i §QZ uo 508 484
2002
$ 6,256,486 3,860.059
10 116 545
1.415.194 7,988,947 9,404.141
2.347,035
1. 005, 607
(2,640,238) 712.404
l 10 116 ~5
As indicated above, the County's total net assets consist of the following three components:
Capital Assets. Net of Related Debt
The largest portion of the County's net assets ($2. 706 billion) represents its investment in capital assets (e.g., land and easements, structures and improvements, infrastructure, and equipment), less any related debt used to acquire those assets that is still outstanding. The County uses these capital assets to provide services to citizens; consequently, these assets are not available for future spending. Although the County's investment in its capital assets is reported net of related debt, it should be noted that the resources needed to repay this debt must be provided from other sources, since the capital assets themselves cannot be used to liquidate these liabilities.
The County began to capitalize newly acquired infrastructure assets during 2001-2002 in accordance with GASB 34. However, infrastructure assets acquired prior to July 1, 2001 are not yet reflected in the basic financial statements. GASB 34 provides a maximum period of four years for the County to identify and report infrastructure assets acquired before July 1, 2001, in the basic financial statements. The County is in the process of evaluating its infrastructure assets that were acquired in prior years to ensure that they are reported prior to the year ending June 30, 2006. Additional infrastructure assets, net of related debt, will increase this category of net assets.

COUNTY OF LOS ANGELES MANAGEMENT'S DISCUSSION AND ANALYSIS-Continued
Restricted Net Assets
The County's restricted net assets at year-end were $1.034 billion. Asset restrictions are primarily due to external restrictions imposed by State legislation and bond covenants. Net assets that pertain to the various separate legal entities included in the basic financial statements are also generally restricted because their funding sources require that funds be used for specific purposes.
Unrestricted Net Assets
The County's unrestricted net assets are negative $3.126 billion. Both governmental and business-type activities reported deficits in this category of $2.391 billion and $735 million, respectively. The deficits are primarily due to unfunded liabilities related to workers' compensation, accrued vacation and sick leave, and litigation and self-insurance claims. For the business-type activities, medical malpractice liabilities and third party payor liabilities are additional factors. At June 30, 2003, there were $4.121 billion of liabilities recorded for all of the issues noted above and for all activities. Of this amount, the County's budget had funded approximately $258 million as of June 30, 2003, which consists of $107 million related to governmental activities and $151 million related to business-type activities. The $107 million represents the County's policy of funding the General Fund's share of liabilities that are payable within one year from the balance sheet date and is applied to accrued vacation and sick leave as well as litigation and self-insurance claims. The budgetary funding of $151 million that has been provided for the business-type activities pertains to estimated third party payor liabilities for the County's hospitals.
In addition to the aforementioned liabilities, the County has recorded pension bonds payable of $1.967 billion. Although the County has also recognized a pension related asset (referred to as "Net Pension Obligation"), the liability for the bonds exceeds the asset amount by $1.304 billion. This difference consists of accreted interest (interest expense that accrues each year but is not payable until deferred periods) of $453 million that is reported as part of the Pension Bonds Payable. Bond proceeds of $400 million were applied to fund the County's pension cost in 1994-95, thereby reducing the pension asset amount. The remaining difference of $451 million is due to timing differences between the amortization of the pension asset and the principal amount of the pension bonds.
For the governmental activities, voter-approved bonds issued by the Regional Park and Open Space District have had the effect of creating additional deficits. Although the County is required to record liabilities of $395 million for outstanding bonds, the County's related assets are only $160 million. The difference of $235 million represents bond proceeds that have been distributed to cities and other eligible entities pursuant to the voter-approved bond measure. The bond covenants require the County to levy property taxes in future years to specifically repay the principal and interest on the bonds. Accordingly, the deficit related to these bonds is expected to be funded by the dedicated tax levy and will not require the use of discretionary County funds.
7

8
COUNTY OF LOS ANGELES MANAGEMENT'S DISCUSSION AND ANALYSIS-Continued
The following table indicates the changes in net assets for governmental and business-type activities:
Statement of Activities For the Year Ended June 30, 2003
(in thousands)
Governrenta 1 Business-type Activities Activities Total
2003 2002 2003 2002 2003 2002
Revenues:
Program revenues: Charges for services* 1,995,263 1.898. 020 2.644.949 2,562,961 4,640.212 $ 4,460.981 Operating grants and contributions 6,373.405 6,243,962 295.296 267,329 6,668.701 6.511.291 Capital grants and contributions 38,471 27,534 26,851 13.765 65,322 41,299
General revenues: Taxes 2,493,274 2.349,836 2,772 2.550 2,496,046 2.352.386 Intergovemnental -motor vehicle
in-lieu taxes. not restricted 690,854 675,004 690,854 675,004 Unrestricted grants and
contributions 703,520 706,167 32 33 703.552 706,200
Investment earnings 102,573 154,439 4.373 4.415 106.946 158,854
Miscellaneous 136.702 148.622 58.403 50,860 195.105 199,482
Total revenues 12.534,062 12.203.584 3,032,676 2. 901. 913 15, 566.738 15,105.497
Expenses: General goverrnent 764,588 611,203 764.588 611,203
Public protection 4,177.049 3,937,519 4,177,049 3.937,519
Public ways and facilities 227,776 208,299 227,776 208.299 Health and sanitation 1.888.141 I. 795. 060 1.888.141 I. 795, 060
Public assistance 4,604 .757 4,505,319 4,604.757 4,505,319
Education 75,079 73,455 75,079 73.455 Recreation and cultural services 228,008 231,605 228,008 231,605
Interest on long-term debt 270,336 249,586 270,336 249,586
Hospitals* 3,158,458 3.086,454 3,158,458 3,086,454
Aviation 4,617 4,618 4,617 4,618
Waterworks 42.448 39,857 42.448 39,857
C011111Unity Development C011111ission 223,808 198.340 223.808 198.340
Tota 1 expenses 12.235 ,734 11.612,046 3,429,331 3,329.269 15,665,065 14, 941. 315
Excess (deficiency} before transfers 298,328 591, 538 (396.655) (427,356) (98.327) 164.182
Transfers (538,115) (550,302) 538,115 550,302
Changes in net assets (239. 787) 41,236 141,460 122. 946 (98.327) 164,182
Net assets - beginning 966,065 924,829 (253.661) (376.607) 712,404 548,222
Net assets - ending Z26 2Z8 966 065 (1]2 201) (253 661) 6B QZZ Zl2 ~Q~
*Amounts presented for 2002 Business-type Activities have been reclassified and adjusted to conform to the current year's presentation format. Charges for services revenues and Hospital expenses have each been increased by $568.6 million to more appropriately display Hospital intergovernmental transfer expenses and related revenues.

COUNTY OF LOS ANGELES MANAGEMENT'S DISCUSSION AND ANALYSIS-Continued
REVENUES BY SOURCE - ALL ACTIVITIES
• Operating grants and contributions 43%
Charges for services 30%
2%
Taxes 16%
• Unrestricted grants and contributions 5%
Intergovernmentalmotor vehicle in-lieu taxes 4%
EXPENSES BY TYPE-ALL ACTIVITIES
Geoeral ~~•emmont \
• Health and sanitation 12%
• Hospitals 20%
r Public Assistance
30%
• Public protection 27%
9

10
COUNTY OF LOS ANGELES MANAGEMENT'S DISCUSSION AND ANALYSIS-Continued
The County's net assets decreased by $98 million during the current fiscal year. Net assets related to governmental activities decreased by $240 million. This decrease was offset by net asset growth of $142 million for the business-type activities. Following are specific major factors that resulted in the net asset changes.
Governmental Activities
Revenues from governmental activities grew by $330 million (2.7%) over the prior year. The most significant changes in revenue were experienced in the following areas:
• Taxes, the County's largest general revenue source, were $143 million higher than the previous year. Property taxes, which represented 88% of total tax revenues, accounted for $117 million of the increase. The increase in property taxes is consistent with the ongoing growth in the real estate market and continued upward trends in the County's assessed property values. Sales taxes, utility user taxes, voter approved taxes and other taxes each increased over the previous year and resulted in the additional growth in taxes of $26 million.
• Operating grants and contributions are the County's largest source of program revenues and grew by $129 million. The growth in this revenue source was associated with reimbursable activities related to health, mental health and public assistance programs.
• Program revenues related to charges for services increased by $97 million. This growth was evident in nearly all functional areas and was associated with cost increases which were recoverable through fee increases and other charges to the service recipient.
• Investment earnings declined by $52 million. Although cash and investments remained at prior year levels or higher, the yield from the County's Treasury Pool declined from 3.55% in the prior year to 2.16% in the current year.
Expenses from governmental activities grew by $624 million (5.4%) when compared with the prior year. As discussed in Note 15 to the basic financial statements, workers' compensation costs for all activities increased by $4 76 million over the prior year. Of this amount, $416 million was related to governmental activities. The following table summarizes total increased expenses by functional area, the amount related to workers' compensation costs, and changes related to all other expenses (in thousands):
Increase Expense Increase In Total Related to Increase (Decrease)
Functional Area Ex1;1enses Workers' Com1;1ensation in All Other Ex1;1enses
General government $ 153,385 $ 37,358 $ 116,027 Public protection 239,530 255,013 (15,483) Health and sanitation 93,081 38,233 54,848 Public assistance 99,438 78,798 20,640 All other areas 38,254 7 080 31 174
Total $ 623,688 $ 416,482 $ 207,206

COUNTY OF LOS ANGELES MANAGEMENT'S DISCUSSION AND ANALYSIS-Continued
Excluding workers' compensation, expenses increased by approximately $207 million. There were minimal increases in salaries and most programs were maintained at the level of the previous year. However, as indicated in Note 6 to the basic financial statements, the County's annual pension cost increased by 32% in comparison to the prior year. The County pays health insurance costs for retired employees and this expense increased by 35%.
Public protection expenses, other than workers' compensation, declined by $15 million. However, this was attributable to a one-time funding opportunity whereby juvenile probation services costs of approximately $81 million were transferred to the public assistance function and funded by grant contributions.
In addition to cost increases in pension benefits and retirees' health insurance, general government expenses also increased due to judgments and settlements. There were also onetime expenses incurred for routine repair and maintenance of various County facilities.
Business-type Activities
Revenues from business-type activities increased by $131 million (4.5%) in comparison to the prior year. The most significant changes were in the following areas:
• Charges for services increased by $82 million, of which $80 million was related to net patient services revenues. There were increased revenues recognized in the Hospitals from Medi-Cal, Medicare, SB 1255 and insurance. These increases were partially offset by reduced revenues related to the Medicaid Demonstration Project and SB 855 programs. Hospital revenues are also discussed in Note 11 to the basic financial statements.
• Operating grants and contributions increased by $28 million. This increase was principally due to increased federal funding for the County's Community Development Commission, which operates a variety of housing related programs.
• Capital grants and contributions increased by $13 million and were attributable to intergovernmental revenues (primarily from the Federal Emergency Management Agency) associated with the rebuilding of the LAC+USC Medical Center.
Expenses related to business-type activities increased from the previous year by $100 million (3%). The most significant changes were in the following areas:
• Hospital expenses increased by $72 million overall. Salaries and benefits were $101 million higher than they were in the previous year. As mentioned earlier in the analysis of governmental activities, there were significant increases in workers' compensation expenses, annual pension cost, and retirees' health insurance. Cost increases in this area were also a factor in the current year for business-type activities.
• Expenses associated with the Community Development Commission increased by $25 million.
11

12
COUNTY OF LOS ANGELES MANAGEMENT'S DISCUSSION AND ANALYSIS-Continued
Financial Analysis of the County's Funds
As noted earlier, the County uses fund accounting to ensure and demonstrate compliance with finance-related legal requirements.
Governmental Funds
The focus of the County's governmental funds is to provide information on near-term inflows, outflows, and balances of resources that are available for spending. Such information is useful in assessing the County's financing requirements. In particular, unreserved fund balance may serve as a useful measure of a government's net resources available for spending at the end of the fiscal year. Types of governmental funds reported by the County include the General Fund, Special Revenue Funds, Debt Service Funds, Capital Project Funds, and the Permanent Funds.
As of the end of the current fiscal year, the County's governmental funds reported combined total fund balances of $3.190 billion, an increase of $88 million in comparison with the prior year. Of the total fund balance, $1.037 billion is reserved to indicate the extent that funds have been committed or are otherwise unavailable for spending. An additional $856 million has been designated and set aside for intended spending purposes as indicated in the financial statements. The remaining $1.297 billion of the balances are unreserved and undesignated.
Revenues from all governmental funds for the current year were $12.478 billion, an increase of $300 million (2.5%) from the previous year. Expenditures for all governmental funds in the current year were $11.885 billion, an increase of $214 million (1.8%) from the previous year. In addition, other financing uses exceeded other financing sources by $505 million, as compared to $491 million in the prior year.
The General Fund is the County's principal operating fund. During the current year, the fund balance in the General Fund increased by $185 million (12.3%). At the end of the current fiscal year, the General Fund's total fund balance was $1.698 billion. Of this amount, $383 million was reserved and therefore unavailable for spending. Of the unreserved total of $1.315 billion, $669 million has been designated (earmarked) and the remaining $646 million is considered both unreserved and undesignated.
General Fund revenues during the current year were $10.844 billion, an increase of $230 million (2.2%) from the previous year. General Fund expenditures during the current year were $10.081 billion, an increase of $175 million (1.8%) from the previous year. Other financing sources/uses-net was negative $577 million in the current year as compared to negative $538 million in the prior year.
Following are significant changes in General Fund revenues and expenditures:
• Revenues from taxes increased by $105 million, primarily from property taxes.
• Intergovernmental revenues increased by $119 million. State revenues increased by $157 million and were offset by a $42 million reduction in federal revenues. Revenues from other governmental agencies increased by $4 million. During the year, State funding for mental health services was increased and funding ratios for certain public assistance programs were modified and resulted in a higher level of State funding and reduced federal assistance.

COUNTY OF LOS ANGELES MANAGEMENT'S DISCUSSION AND ANALYSIS-Continued
Governmental Funds-Continued
• Expenditures increased in the functional areas of general government ($68 million), health and sanitation ($61 million), and public assistance ($100 million), while public protection expenditures decreased by $50 million. Cost increases in the areas of pensions and retiree health care were factors. However, workers' compensation costs did not have the significant impact noted earlier for the government-wide statements as such expenditures are not recognized until paid in the General Fund.
Proprietary Funds
The County's proprietary funds provide the same type of information found in the governmentwide financial statements, but in more detail.
The County's principal proprietary funds are the six hospital enterprise funds and each one has been reported as a major fund. Each hospital enterprise fund incurred a net loss prior to contributions and transfers. The County is legally required to provide local matching funds to the health care system in order to remain eligible for federal and State assistance. Such funds were provided to the hospitals as operating subsidies from the County General Fund during the year. The total subsidy amount was $540 million and is reflected in the Statement of Revenues, Expenses and Changes in Fund Net Assets as "transfers in." Capital contributions of $3.466 million were also made by the General Fund to the Olive View/UCLA Medical Center Fund.
The largest change in net assets was reported in the LAC+USC Medical Center Fund, which had an increase in net assets of $159 million. Contributing to this net asset increase were "transfers in" of $105 million to provide for the eventual replacement of medical equipment at the LAC+USC Replacement Facility, which is currently under construction. These funds were not legally obligated as of June 30, 2003, and are earmarked for future use at the time that the medical center replacement project is completed.
Each hospital enterprise fund, as well as the Public Works Internal Service Fund concluded the year with a net asset deficit. As discussed in Note 2 to the basic financial statements, such deficits are expected to continue in the future.
General Fund Budgetary Highlights
The accompanying basic financial statements include a Statement of Revenues, Expenditures, and Changes in Fund Balances - Budget and Actual on Budgetary Basis for the County's General Fund. The County's budgetary basis of accounting is discussed in Notes 1 and 13 to the basic financial statements. There are approximately 100 separate budget units within the General Fund, excluding capital improvement projects, which are individually budgeted. The data presented below represents the net budgetary changes for the General Fund in a highly summarized format. Accordingly, in certain instances, budgets have been increased for programs within a category even though actual amounts have not been realized for the category in its entirety. Under the budgetary basis, there was a net increase of $75 million in the General Fund's available (unreserved and undesignated) fund balance from the previous year.
13
14
COUNTY OF LOS ANGELES MANAGEMENT'S DISCUSSION AND ANALYSIS-Continued
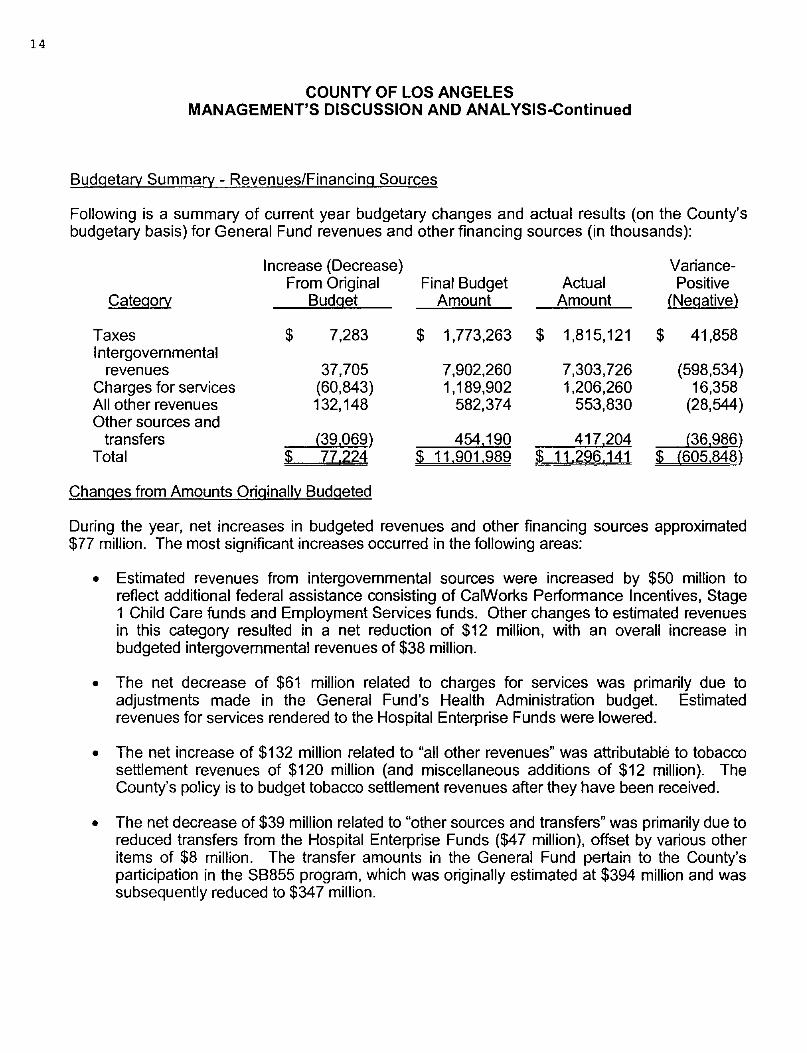
Budgetary Summary - Revenues/Financing Sources
Following is a summary of current year budgetary changes and actual results (on the County's budgetary basis) for General Fund revenues and other financing sources (in thousands):
Increase (Decrease) Variance-From Original Final Budget Actual Positive
Category Budget Amount Amount (Negative)
Taxes $ 7,283 $ 1,773,263 $ 1,815,121 $ 41,858 Intergovernmental
revenues 37,705 7,902,260 7,303,726 (598,534) Charges for services (60,843) 1,189,902 1,206,260 16,358 All other revenues 132, 148 582,374 553,830 (28,544) Other sources and
transfers {39,069) 454190 417 204 {36,986) Total $ 77.224 $ 11.901,989 $ 11.296.141 $ (605,848)
Changes from Amounts Originally Budgeted
During the year, net increases in budgeted revenues and other financing sources approximated $77 million. The most significant increases occurred in the following areas:
• Estimated revenues from intergovernmental sources were increased by $50 million to reflect additional federal assistance consisting of CalWorks Performance Incentives, Stage 1 Child Care funds and Employment Services funds. Other changes to estimated revenues in this category resulted in a net reduction of $12 million, with an overall increase in budgeted intergovernmental revenues of $38 million.
• The net decrease of $61 million related to charges for services was primarily due to adjustments made in the General Fund's Health Administration budget. Estimated revenues for services rendered to the Hospital Enterprise Funds were lowered.
• The net increase of $132 million related to "all other revenues" was attributable to tobacco settlement revenues of $120 million (and miscellaneous additions of $12 million). The County's policy is to budget tobacco settlement revenues after they have been received.
• The net decrease of $39 million related to "other sources and transfers" was primarily due to reduced transfers from the Hospital Enterprise Funds ($47 million), offset by various other items of $8 million. The transfer amounts in the General Fund pertain to the County's participation in the SB855 program, which was originally estimated at $394 million and was subsequently reduced to $347 million.

COUNTY OF LOS ANGELES MANAGEMENT'S DISCUSSION AND ANALYSIS-Continued
Actual Revenues/Financing Sources Compared with Final Budget Amounts
Actual revenues and other financing sources recognized by the General Fund were approximately $606 million lower than budget. As discussed below, most of this variance was concentrated in the area of intergovernmental revenues.
• Actual intergovernmental revenues were $599 million lower than the amount budgeted. Social service programs accounted for approximately $230 million of this variance, which was mostly attributable to lower than anticipated caseload. An additional $179 million pertained to anticipated reimbursement of capital improvement and disaster recovery projects that were not completed prior to year-end. The remaining amount was related to mental health programs ($83 million) and various other programs ($107 million).
Budgetary Summary - Expenditures/Other Financing Uses
Following is a summary of current year budgetary changes and actual results (on the County's budgetary basis) for General Fund expenditures, transfers out, contingencies, reserves, and designations (in thousands):
Increase (Decrease) From Original Final Budget Actual Variance-
Category Budget Amount Amount Positive
General government $ 34,725 $ 878,195 $ 645,675 $ 232,520 Public protection 16,694 3,358,560 3,133,657 224,903 Health and sanitation (137,019) 2,186,822 2,151,618 35,204 Public assistance 74,968 4,720,873 4,412,718 308,155 All other expenditures 11,821 605,972 283,124 322,848 Transfers out (34,786) 570,517 567,500 3,017 Contingencies (39,679) 60,643 60,643 Reserves/designations-net 150,500 123.763 26844 96.919
Total $ 77.224 $ 12.505,345 $11,221.136 $ 1,284,209
Changes from Amounts Originally Budgeted
During the year, net increases in General Fund appropriations, reserves and designations were approximately $77 million. As discussed below, the most significant increases were related to designations and public assistance appropriations. The largest decrease was in health and sanitation appropriations.
• Provisions for net reserves and designations were increased during the year by $150 million. This amount pertains to an increase in the designation for health services. This designation was funded by tobacco settlement revenues received during the year ($120 million) plus the unused balance of amounts received in prior years, including interest ($30 million).
15

16
COUNTY OF LOS ANGELES MANAGEMENT'S DISCUSSION AND ANALYSIS-Continued
Changes from Amounts Originally Budgeted-Continued
• After the original budget was established, appropriations for health and sanitation were reduced by $137 million. At the end of the fiscal year, appropriations for health programs were reduced in order to be more closely aligned with actual expenditures. The most significant changes were associated with appropriation savings related to SB855 Intergovernmental Transfers ($47 million) and programs funded by tobacco settlement revenues ($26 million). The remaining amount ($64 million) was associated with various health programs such as public health, drug and alcohol and administration.
• After the original budget was established, appropriations for public assistance were increased by $75 million. The largest single change was a $50 million increase to the Department of Public Social Services to fund juvenile probation services. This increase was funded by federal revenues as previously discussed in the changes to the budgeted revenues. Additional resources of $32 million were required to fund the foster care program, which provides financial assistance to children in protective custody who are placed in out-of-home care. Various other changes resulted in a net decrease of $7 million.
Actual Expenditures/Other Financing Uses Compared with Final Budget Amount
Actual expenditures/other financing uses for the current year were $1.3 billion lower (approximately 10%) than the final total budget of $12.5 billion. Although there were budgetary savings in all categories, following are the functional areas that recognized the largest variations from the final budget:
• Actual public assistance expenditures were $308 million lower than the final budget. As discussed earlier in the "actual revenues" section, the difference was principally due to social service program curtailments and lower than anticipated public assistance expenditures.
• The category referred to as "all other expenditures" reflected actual spending of $323 million less than the budgeted amount. Nearly all ($314 million) of this variance was related to the capital outlay category. There were many capital improvements anticipated in the budget that remained in the planning stages and did not incur expenditures during the year. Most of the unused balance has been reestablished in the following year's budget to ensure the continuity of the projects.
• The general government function reported actual expenditures that were $233 million less than the amount budgeted. Of this amount, $166 million represented budgetary savings for items that are not associated with specific County departments, such as provisional appropriations and extraordinary maintenance and repairs. The remaining $67 million was spread across virtually every department comprising general government and was mostly related to salary savings (a hiring freeze existed throughout the year) and savings in services and supplies.

COUNTY OF LOS ANGELES MANAGEMENT'S DISCUSSION AND ANALYSIS-Continued
Actual Expenditures/Other Financing Uses Compared with Final Budget Amount-Continued
• Overall expenditures for the public protection functional category were $225 million less than the budgeted amount. This difference was concentrated in the Probation Department ($87 million), the Disaster Recovery budget unit ($70 million), and the Sheriffs Department ($46 million). The remaining $22 million was derived from various other public protection agencies. Probation savings were mostly due to a one-time funding opportunity whereby eligible costs were transferred to grant-funded public assistance programs. The Disaster Recovery variance was due to unused appropriations that were set aside provisionally for County disasters. The Sheriffs Department realized appropriation savings in all expenditure objects.
Capital Assets
The County's capital assets for its governmental and business type activities as of June 30, 2003 were $4.076 billion (net of depreciation). Capital assets include land, buildings and improvements, machinery and equipment. Infrastructure assets have also been recognized for activity that occurred during the current year. Specific changes related to governmental and business-type activities are presented in Note 5 to the basic financial statements. As discussed earlier, the County has deferred recognition of infrastructure assets acquired prior to July 1, 2001.
The total increase in the County's capital assets (net of depreciation) for the current fiscal year was $216 million or 5.6%, as shown in the table below.
Changes in Capital Assets, Net of Depreciation Primary Government - All Activities
(in thousands)
Current Prior Increase Year Year (Decrease)
Land $ 393,666 $ 392,555 $ 1, 111 Buildings and improvements 2,757,917 2,697,259 60,658 Infrastructure 92,897 12, 107 80,790 Equipment 262,704 230,471 32,233 Construction-in-progress 568,935 527,667 41,268
Total s 4,076, 119 s 3.860,059 $ 2:16,060
Major capital asset projects that represented new additions during the year included the following:
• New infrastructure costs were capitalized for completed projects and also for those that remained in progress at the end of the year. The projects were related to the County's Flood Control District and Road Fund operations. The value of the new construction for these activities was $32 million and $46 million, respectively.
17

18
COUNTY OF LOS ANGELES MANAGEMENT'S DISCUSSION AND ANALYSIS-Continued
• Approximately $48 million of new Construction-in-Progress was related to the Antelope Valley Courthouse. Additions of $20 million were related to juvenile detention facilities that will be operated by the Probation Department when completed.
• The County is progressing with the rebuilding of the LAC+USC Medical Center. Construction is underway and the overall project cost is estimated at $821 million. During the year, $58 million of costs were capitalized.
Debt Administration
The following table indicates the changes in the County's long-term debt during the year:
Bonds and Notes Payable Pension Bonds Payable
Total
Changes in Long-Term Debt Primary Government - All activities
(in thousands)
Current Year
$ 2,281,706 1.967.191
$ 4.248,897
Prior Year
$ 2,424,419 2.093,749
$ 4,518,168
Decrease
$ 142,713 126,558
$ 269.271
During the current year, the County's liabilities for long-term debt decreased by $269 million, or nearty 6%. Specific changes related to governmental and business-type activities are presented in Note 8 to the basic financial statements. During the current year, significant long-term debt transactions were as follows:
• Refunding bonds totaling $160 million were issued to advance refund previously issued debt. The refunding will result in a $15.95 million reduction of the County's debt service payments over the next 14 years.
• New debt of $41 million was issued to finance the acquisition of equipment. Equipment debt totaling $52 million was redeemed during the year in accordance with maturity schedules.
• Pension bonds totaling $199 million were redeemed during the year. This amount was offset by $72.4 million related to the accretion of interest on outstanding bonds.
In addition to the above borrowing, the County continued to finance General Fund cash flow shortages occurring periodically during the fiscal year by selling $650 million in tax and revenue anticipation notes which reached maturity on June 30, 2003, and by periodic borrowing from available trust funds.

COUNTY OF LOS ANGELES MANAGEMENT'S DISCUSSION AND ANALYSIS-Continued
Bond Ratings
The County's debt is rated by Moody's, Standard and Poor's, and Fitch. The following is a schedule of ratings:
Moody's Standard and Poor's
General Obligation Bonds Aa3 A+ Pension Bonds A1 A Facilities A2 A Equipment/Non-Essential Leases A3 A Short-Term MIG1 SP-1+ Commercial Paper P-1 A-1+ Flood Control District General
Obligation Bonds Aa1 AA Flood Control District Revenue
'Bonds Aa1 AA-Regional Park and Open Space
District Bonds Aa3 AA
Economic Conditions and Outlook
A A F-1+
AA
AA-
The Board of Supervisors adopted the County's 2003-2004 Budget on June 23, 2003. The Budget was adopted based on estimated fund balances that would be available at the end of 2002-2003. The Board updated the Budget on September 16, 2003 to reflect final 2002-2003 fund balances and other pertinent financial information. For the County's General Fund, the 2003-2004 Budget utilized $678 million of available fund balance.
In conjunction with the September 16, 2003 budget update, the Board reexamined the estimated revenues that were forecast for the County's share of State Vehicle License Fees (VLF). VLF revenues are available for spending at the County's discretion and provide essential County funding for various General Fund services. Although the State was in the process of increasing VLF charges, there was a transitional period of approximately three months where the County's share of VLF (commonly referred to as "backfill") would not be paid. The Board authorized the use of $160 million of the General Fund's available fund balance to offset this loss. The use of fund balance to address this issue was based on its anticipated one-time nature. In addition, the enacting State legislation indicated an intention to repay the County in 2006-2007.
On November 17, 2003, a new State Governor assumed office and immediately rescinded the VLF increase that had begun to take effect and also directed a refund to taxpayers that had already paid the increased amount. State legislative action is needed to appropriate funds for the VLF backfill. At this time, there is uncertainty regarding the ability and timing of the State to restore the VLF backfill, as the State is confronted with a major budgetary deficit. The County is closely monitoring the VLF issue and estimates the financial impact at $60 million per month if the backfill is not restored. The County is also monitoring the effects of other State actions that would potentially reduce County revenues as part of the State's overall plan to balance its budget.
19

20
COUNTY OF LOS ANGELES MANAGEMENT'S DISCUSSION AND ANALYSIS-Continued
Obtaining Additional Information
This financial report is designed to provide a general overview of the County's finances for all interested parties. Questions concerning any of the information provided in this report or requests for additional information should be addressed to the Los Angeles County Auditor-Controller, 500 West Temple Street, Room 525, Los Angeles, CA 90012-2766.

BASIC FINANCIAL STATEMENTS

21
COUNTY OF LOS ANGELES
STATEMENT OF NET ASSETS
JUNE 30, 2003 (in thousands)
PRIMARY GOVERNMENT COMPONENT UNIT
CHILDREN AND
GOVERNMENTAL BUSINESS-TYPE FAMILIES FIRST
ACTIVITIES ACTIVITIES TOTAL COMMISSION
ASSETS
Pooled cash and investments: (Notes 1 and 4)
Operating (Note 1) $ 2,005,166 $ 30,201 $ 2,035,367 $ 606,344
Other (Note 1) 860,415 96,221 956,636
Total pooled cash and investments 2,865,581 126.422 2,992,003 606,344
Other investments (Note 4) 280,386 20,938 301,324
Taxes receivable 237,232 1,501 238,733
Accounts receivable - net 939,853 939,853
Interest receivable 8,503 83 8,586 2,166
Other receivables 1,051,760 30,343 1,082,103 25,421
Internal balances 182,769 (182,769)
Inventories 80.427 29,308 109,735 2,146
Restricted assets (Note 4) 8,097 89,296 97,393
Net pension obligation (Note 6) 491,021 171,614 662,635
Capital assets: (Notes 5 and 7)
Land and construction In progress 636,562 326,039 962,601
Other capital assets, net of depreciation 2,598,445 515,073 3,113,518 8,625
Total capital assets 3,235,007 841,112 4,076, 119 8,625
TOTAL ASSETS 8,440,783 2,067,701 10,508.484 644,702
LIABILITIES
Accounts payable 366,579 69,992 436,571 5,174
Accrued payroll 361,334 83,686 445,020 598
Other payables 193,326 3,784 197,110
Accrued interest payable 27,398 1,479 28,877
Deferred revenue (Note 6) 105,847 13,629 119.476
Advances payable 175,794 175,794
Noncurrentliabilities: (Notes 6, 7, 8, 11 and 15)
Due within one year 749,152 366,690 1,115,842
Due In more than one year 5,735,075 1,640,642 7,375,717 8,498
TOTAL LIABILITIES 7,714,505 2,179,902 9,894,407 14,270
NET ASSETS
Invested in capital assets, net of related debt
(Notes 5 and 8) 2,210,640 495,549 2,706,189 127
Restricted for:
Capital projects 4,534 "4,534
Debt service 21,928 107,356 129,284
Special purpose 880,693 19,836 900,529 630,304
Unrestricted (deficit) (2,391,517) (734,942) (3, 126,459)
TOTAL NET ASSETS (DEFICIT) $ 726,278 $ (112,201) $ 614,077 $ 630.431
The notes to the basic financial statements are an integral part of this statement

22 23
COUNTY OF LOS ANGELES
STATEMENT OF ACTIVITIES
FOR THE YEAR ENDED JUNE 30, 2003 (in thousands)
NET (EXPENSE) REVENUE AND
PROGRAM REVENUE CHANGES IN NET ASSETS
PRIMARY GOVERNMENT COMPONENT UNIT
OPERATING CAPITAL CHILDREN AND
FUNCTIONS CHARGES FOR GRANTS AND GRANTS AND GOVERNMENTAL BUSINESS-TYPE FAMILIES FIRST FUNCTIONS
PRIMARY GOVERNMENT: EXPENSES SERVICES CONTRIBUTIONS CONTRIBUTIONS ACTIVITIES ACTIVITIES TOTAL COMMISSION PRIMARY GOVERNMENT:
Governmental activities: Governmental activities:
General government $ 764,588 $ 354,291 $ 28,019 $ 7,543 $ (374,735) $ $ (374,735) General government
Public protection 4,177,049 1,021,186 978,663 17,294 (2, 159,906) (2,159,906) Public protection
Public ways and facilities 227,776 46,608 164,027 5,856 (11,285) (11,285) Public ways and facilities
Health and sanitation 1,888,141 385,490 1,249,936 2,702 (250,013) (250,013) Health and sanitation
Public assistance 4,604,757 31,861 3,946,935 (625,961) (625,961) Public assistance
Education 75,079 2,919 3,973 (68, 187) (68, 187) Education
Recreation and cultural services 228,008 152,908 1,852 5,076 (68, 172) (68, 172) Recreation and cultural services
Interest on long-term debt 270,336 (270,336) (270,336) Interest on long-term debt
Total governmental activities 12,235,734 1,995,263 6,373,405 38,471 (3,828,595) (3,828,595) Total governmental activities
Business-type activities: Business-type activities:
Hospitals 3, 158,458 2,594,762 83,152 26,107 (454,437) (454,437) Hospitals
Aviation 4,617 2,641 473 744 (759) (759) Aviation
Waterworks 42,448 37,637 713 (4,098) (4,098) Waterworks
Community Development Commission 223,808 9,909 210,958 (2,941) (2,941) Community Development Commission
Total business-type activities 3,429,331 2,644,949 295,296 26,851 (462,235) (462,235) Total business-type activities
Total primary government $ 15,665,065 $ 4,640,212 $ 6,668,701 $ 65,322 (3,828,595) (462,235) (4,290,830) Total primary government
COMPONENT UNIT - COMPONENT UNIT -
Children and Families First Commission $ 63,815 $ $ 134,058 $ $ 70,243 Total - Children & Families First Commission
GENERAL REVENUES: GENERAL REVENUES:
Taices: Taices:
Property taxes 2,193,539 2,772 2,196,311 Property taxes
Sales and use taxes 74,018 74,018 Sales and use taxes
Utility users taxes 52,262 52,262 Utility users taxes
Voter approved taxes 69,792 69,792 Voter approved taxes
Other taxes 103,663 103,663 Other taxes
Intergovernmental - State motor vehlde in~ieu Intergovernmental - State motor vehide in~ieu
taxes, not restricted to specific purposes 690,854 690,854 taxes, not restricted to specific purposes
Grants and contributions not restricted Grants and contributions not restricted
to special programs 703,520 32 703,552 to special programs
Investment earnings 102,573 4,373 106,946 12,075 Investment earnings
Miscellaneous 136,702 58,403 195, 105 Miscellaneous
TRANSFERS - NET (538, 115) 538, 115 TRANSFERS - NET
Total general revenues and transfers 3,588,808 603,695 4, 192,503 12,075 Total general revenues and transfers
CHANGE IN NET ASSETS (239,787) 141,460 (98,327) 82,318 CHANGE IN NET ASSETS
NET ASSETS (DEFICIT), JULY 1, 2002 966,065 (253,661) 712,404 548,113 NET ASSETS (DEFICIT), JULY 1, 2002 NET ASSETS (DEFICIT), JUNE 30, 2003 $ 726,278 $ (112,201) $ 614,077 $ 630,431 NET ASSETS (DEFICIT), JUNE 30, 2003
The notes to the basic financial statements are an integral part of this statement.

24
COUNTY OF LOS ANGELES
BALANCE SHEET
GOVERNMENTAL FUNDS
JUNE 30, 2003 (in thousands)
FIRE FLOOD
GENERAL PROTECTION CONTROL PUBLIC
FUND DISTRICT DISTRICT LIBRARY
ASSETS:
Pooled cash and investments (Notes 1 and 4)
Operating (Note 1) $ 922,000 5,286 110,949 11,813
Other (Note 1) 644,544 17,733 5,107 2,284
Total pooled cash and investments 1,566,544 23,019 116,056 14,097
Other investments (Note 4) 7,490
Taxes receivable 165,472 42,317 15,221 6,036
Interest receivable 5,511 18 286 37
Other receivables 916,871 17,463 1,749 41
Due from other funds (Note 12) 447,456 9,183 9,622 471
Advances to other funds (Note 12) 304,528 6,814
Inventories 33,230 5,602 439
TOT AL ASSETS $ 3,447, 102 97,602 149,748 21, 121
LIABILITIES AND FUND BALANCES
LIABILITIES:
Accounts payable $ 304,857 6,048 2,696 1,071
Accrued payroU 310,698 29,258 3,353
Other payables 188,952 797 56
Due to other funds (Note 12) 524,204 4,620 17,999 2,323
Deferred revenue (Note 6) 231,357 31,765 12,979 4,764
Advances payable 162,673
Third party payor llablllty (Notes 8 and 11) 26,631 1,372
TOTAL LIABILITIES 1,749,372 73,860 33,674 11,567
FUND BALANCES:
Reserved for:
Encumbrances 316, 118 6,082 85,409 2,927
Inventories 33,230 5,602 439
Housing programs
Debt service
Endowments and annuities
Other 33,410 25 3,008 15
Unreserved, designated for:
Budget uncertainties 414,054
Program expansion 254,753 942
Capital projects 19,478
Special revenue funds - program expansion
Unreserved, undesignated, reported in:
General fund 646, 165
Special revenue funds 12,033 8,179 5,231
Capital projects funds
TOTAL FUND BALANCES 1,697,730 23,742 116,074 9,554
TOTAL LIABILITIES AND FUND BALANCES $ 3,447,102 97,602 149,748 21, 121
The notes to the basic financial statements are an integral part of this statement.

25
REGIONAL
PARK AND NONMAJOR TOTAL
OPEN SPACE GOVERNMENTAL ELIMINATIONS GOVERNMENTAL
DISTRICT FUNDS (NOTE 3) FUNDS
ASSETS:
Pooled cash and Investments (Notes 1 and 4)
s 254,279 812,503 $ 2,116,830 Operating (Note 1)
1,564 27,453 698,685 Other (Note 1)
255,843 839,956 2,815,515 Total pooled cash and investments
663,450 (394,735) 276,205 Other investments (Note 4)
3,192 4,990 237,228 Taxes receivable
717 1,825 8,394 Interest receivable
6,429 86,029 1,028,582 Other receivables
5 15,702 482,439 Due from other funds (Note 12)
10,718 322,060 Advances to other funds (Note 12)
34,813 74,084 Inventories s 266,186 1,657,483 (394,735) s 5,244,507 TOT Al ASSETS
LIABILITIES AND FUND BALANCES
LIABILITIES:
$ 2,767 45, 132 s 362,571 Accounts payable
459 343,768 A=ued payroll
204 3,365 193,374 Other payables
3,667 76,003 628,816 Due to other funds (Note 12)
7,476 30,644 318,985 Deferred revenue (Note 6)
13, 121 175,794 Advances payable
3,597 31,600 Third party payer liability (Notes 8 and 11)
14, 114 172,321 2,054,908 TOTAL LIABILITIES
FUND BALANCES:
Reserved for.
133,055 111,545 655,136 Encumbrances 34,813 74,084 Inventories
2,260 2,260 Housing programs
631,656 (394,735) 238,921 Debt service
3,541 3,541 Endowments and annuities
28,558 65,016 Other
Unreserved, designated for.
414,054 Budget uncertainties
255,696 Program expansion
19,478 Capital projects
166, 191 166, 191 Special revenue funds - program expansion
Unreserved, undesignated, reported in:
646, 165 General fund
119,016 411,799 556,258 Special revenue funds
94,799 94,799 Capital projects funds
252,072 1,485, 162 (394,735) 3,189,599 TOTAL FUND BALANCES
$ 266, 186 1,657,483 (394,735) s 5,244,507 TOTAL LIABILITIES AND FUND BALANCES

26
COUNTY OF LOS ANGELES
RECONCILIATION OF THE BALANCE SHEET OF GOVERNMENTAL FUNDS
TO THE STATEMENT OF NET ASSETS
JUNE 30, 2003 (in thousands)
Fund balances - total governmental funds (page 25)
Amounts reported for governmental activities in the statement of
net assets are different because:
Capital assets used in governmental activities are not reported in
governmental funds:
Land
Construction-in-progress
Buildings and improvements - net
Equipment - net
Infrastructure - net
$
Other long-term assets are not available to pay for current-period
expenditures and are deferred, or not recognized, in governmental funds:
Deferred revenue - taxes
Long-term receivables
The net pension obligation (an asset) pertaining to governmental
fund types is not recorded in governmental fund statements.
$
Accrued interest payable is not recognized in governmental funds.
276,239
303,567
2,278,865
143,675
149,653
215,619
23,107
Long-term liabilities, including bonds and notes payable, are not due and payable in the
current period and, therefore, are not reported in the governmental funds:
Bonds and notes payable $ (1,827, 117)
Pension bonds payable (1,359,869)
Capital lease obligations (120,093)
Accrued vacation/sick leave
Workers' compensation
Litigation/self-insurance
Third party payors
Assets and liabilities of the internal service funds are included in
governmental activities in the accompanying statement of net assets.
Net assets of governmental activities (page 21)
(550,190)
(1,853,735)
(493,406)
(2, 120)
The notes to the basic financial statements are an integral part of this statement.
$ 3,189,599
3,151,999
238,726
458,054
(26,976)
(6,206,530)
(78,594)
$ 726,278

27

28
COUNTY OF LOS ANGELES
STATEMENT OF REVENUES, EXPENDITURES AND CHANGES IN FUND BALANCES
GOVERNMENTAL FUNDS
FOR THE YEAR ENDED JUNE 30, 2003 ~n thousands)
FIRE FLOOD
GENERAL PROTECTION CONTROL PUBLIC
FUND DISTRICT DISTRICT LIBRARY
REVENUES:
Taxes $ 1,813,882 419,139 63,102 48,328
Licenses, pennits and franchises 53,915 7,784 535
Fines, forfeitures and penalties 189,982 3,073 1,667 452
Revenue from use of money and property:
lnveslmenl income (Note 4) 62,064 180 2,079 184
Rents and concessions (Note 7) 15,278 85 6,014 32
Royalties 176 119
Intergovernmental revenues:
Federal 3,097,839 2,832 2,347 69
State 4,098,346 11,617 1,106 4,402
Other 72,512 17.440 2,232 1,187
Charges for services 1,206,260 119,624 115,003 2,886
Proceeds from property owners
Miscellaneous 233,379 511 855 890
TOTAL REVENUES 10,843,633 582,285 195,059 58.430
EXPENDITURES:
Current:
General government 633,292
Public protection 2,956,753 561,901 179,010
Public ways and facllltles
Health and sanltation 1,743,716
Public assistance 4,328,436
Education 74,013
Recreation and cultural services 162,201
Debt service:
Principal 129,771 6,394 1.424
Interest and other charges 90,866 3,202 713
Capital leases 14,345
Capital outlay 21,480
TOTAL EXPENDITURES 10,080,860 571.497 179,010 76, 150
EXCESS (DEFICIENCY) OF REVENUES OVER
EXPENDITURES 762,773 10,788 16,049 (17,720)
OTHER FINANCING SOURCES (USES):
Transfers in (Note 12) 68,539 1,700 21,994
Transfers out (Note 12) (669,087) (4,203) (19,305) (480)
Proceeds of refunding bon<ls (Nole 8)
Payment to refunded bonds escrow agent (Note 8)
Bond premium proceeds
Capital leases (Note 7) 21,480
Sales of capital assets 1,671 38 243 15
TOTAL OTHER FINANCING SOURCES (USES) (577,397) (4,165) (17,362) 21,529
NET CHANGE IN FUND BALANCES 185,376 6,623 (1,313) 3,809
FUND BALANCE, JULY 1, 2002 1,512,354 17,119 117,387 5.745
FUND BALANCE, JUNE 30, 2003 $ 1,697,730 23,742 116,074 9,554
The notes to the basic financial statements are an integral part of this statement.

29
REGIONAL
PARK AND NON MAJOR TOTAL
OPEN SPACE GOVERNMENTAL ELIMINATIONS GOVERNMENTAL
DISTRICT FUNDS (NOTE3) FUNDS
REVENUES:
$ 77,554 $ 2,422,005 Taxes
5,244 67,478 Licenses, permits and franchises
925 66,505 262,604 Fuies, forfeitures and penalties
Revenue from use of money and property:
10,220 48,566 (21,184) 102.109 lnvestmentincome (Note 4)
36,583 57,992 Rents and concessions (Note 7)
5 300 Royalties
Intergovernmental revenues:
95,485 3,198,572 Federal
216,007 4,331,478 State
13,966 107,337 Other
77,508 104,302 1,625,583 Charges for seivices
8,123 8,123 Proceeds from property owners
58,643 294,278 Miscellaneous
88,653 730,983 (21,184) 12,477,859 TOTAL REVENUES
EXPENDITURES:
Current
19, 101 652,393 General govenvnent
70,986 3,768,650 Pubfic protection
287,853 287,853 Public ways and facilities
82,367 1,826,083 Health and sanitation
132,608 4,461,044 Public assistance
74,013 Education
58,490 4,638 225,329 Recreation and cultural se/Vices
Debt service:
149,320 (17,560) 269,349 Principal
132,522 (21,184) 206, 119 Interest and other charges
14,345 Capital leases
78,230 99,710 Capital outlay
58,490 957,625 (38,744) 11,884,888 TOTAL EXPENDITURES
EXCESS (DEFICIENCY) OF REVENUES OVER
30,163 (226,642) 17,560 592,971 EXPENDITURES
OTHER FINANCING SOURCES (USES):
202,935 295,168 Transfers in (Note 12)
(38,632) (100,155) (831,862) Transfers out (Note 12)
160,325 160,325 Proceeds of refunding bonds (Note 8)
(160,325) (160,325) Payment to refunded bonds escrow agent (Note 8)
8,513 8,513 Bond premium proceeds
21,480 Capital leases (Note 7)
56 2,023 Sales of capital assets
(38,632) 111,349 (504,678) TOT Al OTHER FINANCING SOURCES (USES)
(8,469) (115,293) 17,560 88,293 NET CHANGE IN FUND BAIJ\NCES
260,541 1,600,455 (412,295) 3,101,306 FUND BALANCE, JULY 1, 2002
$ 252,072 1,485, 162 (394,735) $ 3,189,599 FUND BALANCE, JUNE 30, 2003

30
COUNTY OF LOS ANGELES
RECONCILIATION OF THE STATEMENT OF REVENUES, EXPENDITURES AND
CHANGES IN FUND BALANCES OF GOVERNMENTAL FUNDS
TO THE STATEMENT OF ACTIVITIES
FOR THE YEAR ENDED JUNE 30, 2003 (in thousands)
Net change in fund balances - total governmental funds (page 29)
Amounts reported for governmental activities in the statement of activities
are different because:
Governmental funds report capital outlay as expenditures. However, in
the statement of activities, the cost of those assets is allocated over
their estimated useful lives and reported as depreciation expense:
Expenditures for general capital assets, infrastructure and other
related capital asset adjustments
Less - current year depreciation expense
In the statement of activities, only the gain on the sale of capital assets
$
is reported, whereas in the governmental funds, the proceeds from the sale
increase financial resources. Thus, the change in net assets differs from
the change in fund balance.
296,788
(116,903)
Revenue timing differences result in less revenue in government-wide statements.
Repayment of debt principal is an expenditure in the governmental funds,
but the repayment reduces long-term liabilities in the statement of assets:
Pension bonds $
General obligation bonds
Certificates of participation
Assessment bonds
Other long term notes and loans
Some expenses reported in the accompanying statement of activities do not
require (or provide) the use of current financial resources and, therefore, are
not reported as expenditures in governmental funds:
Change in workers' compensation
Change in litigation/self-insurance
Change in accrued vacation/sick leave
Change in third party payors
Change in accrued interest payable
Accretion of pension bonds
Transfer of capital assets from governmental fund to enterprise fund
The change in the net pension obligation (an asset) is not recognized in
governmental funds.
The portion of internal service funds that is reported with
governmental activities.
Change in net assets of governmental activities (page 23)
$
137,589
12,300
103,380
17,560
6,530
(500,373)
(129,476)
(17,311)
2,278
(1,524)
(50,101)
(3,466)
The notes to the basic financial statements are an integral part of this statement.
$ 88,293
179,885
(15,573)
29,607
277,359
(699,973)
(90,388)
(8,997)
$ (239,787)

31
COUNTY OF LOS ANGELES STATEMENT OF REVENUES, EXPENDITURES AND CHANGES IN FUND BALANCES -BUDGET AND ACTUAL ON BUDGETARY BASIS GENERAL FUND FOR THE YEAR ENDED JUNE 30, 2003 (in thousands)
GENERAL FUND ORIGINAL FINAL ACTUAL ON VARIANCE FROM BUDGET BUDGET BUDGETARY BASIS FINAL BUDGET
OVER (UNDER)
REVENUES: Taxes $ 1,765,980 1,773,263 1,815,121 41,858 Licenses, permits and franchises 50,744 51,712 53,915 2,203 Fines, forfeitures and penalties 176,373 176,373 189,982 13,609 Revenue from use of money and property:
lnvesbnent income 77, 109 80,676 58,836 (21,840) Rents and concessions 22,350 22,355 15,277 (7,078) Royalties 232 232 176 (56)
Intergovernmental revenues: Federal 3,356,016 3,383, 154 3,085,876 (297,278) State 4,376,626 4,386, 174 4,149,165 (237,009) Other 131,913 132,932 68,685 (64,247)
Charges for services 1,250,745 1,189,902 1,206,260 16,358 Miscellaneous 123,418 251,026 235,644 (15,382)
TOTAL REVENUES 11,331,506 11,447,799 10,878,937 (568,862)
EXPENDITURES: Current
General government 843,470 878, 195 645,675 (232,520) Public protection 3,341,866 3,358,560 3,133,657 (224,903) Health and sanitation 2,323,841 2,186,822 2,151,618 (35,204) Public assistance 4,645,905 4,720,873 4,412,718 (308,155) Recreation and cultural services 173,064 174,299 165,890 (8,409)
Debt Service-Interest 11,076 11,076 11,076
Capital OuUay 410,011 420,597 106,158 (314,439) TOTAL EXPENDITURES 11,749,233 11,750.422 10,626,792 (1,123,630)
EXCESS (DEFICIENCY) OF REVENUES OVER EXPENDITURES !417,727) !302,623) 252,145 554,768
OTHER FINANCING SOURCES (USES): Sales of fixed assets 805 1,770 1,672 (98) Transfers in 492,454 452,420 415,532 (36,888) Transfers out (605,303) (570,517) (567,500) 3,017 Appropriation for contingencies (100,322) (60,643) 60,643 Changes in reserves and designations 26,737 (123,763) (26,844) 96,919
OTHER FINANCING SOURCES (USES) - NET !185,629) (300,733) (177,140) 123,593
NET CHANGE IN FUND BALANCE (603,356) (603,356) 75,005 678,361
FUND BALANCE, JULY 1, 2002 (Note 13) 603,356 603,356 603,356
FUND BALANCE, JUNE 30, 2003 (Note 13) 678,361 678,361
The notes to the basic financial statements are an integral part of this statement.
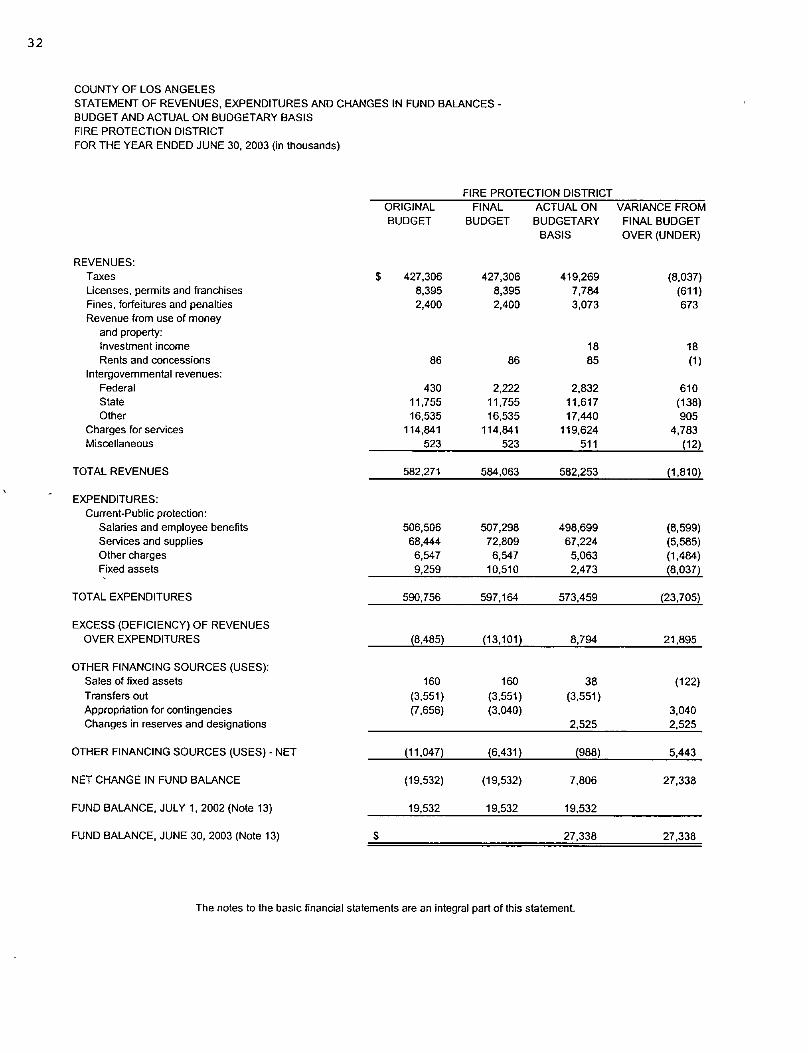
32
COUNTY OF LOS ANGELES STATEMENT OF REVENUES, EXPENDITURES AND CHANGES IN FUND BALANCES -BUDGET AND ACTUAL ON BUDGETARY BASIS FIRE PROTECTION DISTRICT FOR THE YEAR ENDED JUNE 30, 2003 (in thousands)
FIRE PROTECTION DISTRICT ORIGINAL FINAL ACTUAL ON VARIANCE FROM BUDGET BUDGET BUDGETARY FINAL BUDGET
BASIS OVER (UNDER)
REVENUES: Taxes $ 427,306 427,306 419,269 (8,037) Licenses, permits and franchises 8,395 8,395 7,784 (611) Fines, forfeitures and penalties 2,400 2,400 3,073 673 Revenue from use of money
and property: Investment income 18 18 Rents and concessions 86 86 85 (1)
Intergovernmental revenues: Federal 430 2,222 2,832 610 State 11,755 11,755 11,617 (138) Other 16,535 16,535 17,440 905
Charges for services 114,841 114,841 119,624 4,783 Miscellaneous 523 523 511 (12)
TOTAL REVENUES 582,271 584,063 582,253 (1,810)
EXPENDITURES: Current-Public protection:
Salaries and employee benefits 506,506 507,298 498,699 (8,599) Services and supplies 68,444 72,809 67,224 (5,585) Other charges 6,547 6,547 5,063 (1,484) Fixed assets 9,259 10,510 2,473 !8,037)
TOTAL EXPENDITURES 590,756 597, 164 573,459 (23,705)
EXCESS (DEFICIENCY) OF REVENUES OVER EXPENDITURES !8.485) (13,101) 8,794 21,895
OTHER FINANCING SOURCES (USES): Sales of fixed assets 160 160 38 (122) Transfers out (3,551) (3,551) (3,551) Appropriation for contingencies (7,656) (3,040) 3,040 Changes in reserves and designations 2,525 2,525
OTHER FINANCING SOURCES (USES) - NET (11,047) !6.431) !988) 5,443
NET CHANGE IN FUND BALANCE (19,532) (19,532) 7,806 27,338
FUND BALANCE, JULY 1, 2002 (Note 13) 19,532 19,532 19,532
FUND BALANCE, JUNE 30, 2003 (Note 13) $ 27,338 27,338
The notes to the basic financial statements are an integral part of this statement.

33
COUNTY OF LOS ANGELES STATEMENT OF REVENUES, EXPENDITURES AND CHANGES IN FUND BALANCES -BUDGET AND ACTUAL ON BUDGETARY BASIS FLOOD CONTROL DISTRICT FOR THE YEAR ENDED JUNE 30, 2003 (in thousands)
FLOOD CONTROL DISTRICT ORIGINAL FINAL ACTUAL ON VARIANCE FROM BUDGET BUDGET BUDGETARY FINAL BUDGET
BASIS OVER (UNDER)
REVENUES: Taxes $ 59,425 62,550 63,157 607 Licenses, permits and franchises 500 500 535 35 Fines, forfeitures and penalties 1,303 1,303 1,667 364 Revenue from use of money
and property: lnvesbnent income 5,000 5,000 2,169 (2,831) Rents and concessions 6,040 6,040 6,014 (26) Royalties 600 600 119 (481)
Intergovernmental revenues: Federal 14,790 14,790 2,347 (12,443) State 1,800 1,800 1,106 (694) Other 1,540 1,540 2,232 692
Charges for services 110,791 110,791 114,786 3,995 Miscellaneous 860· 860 855 (5)
TOTAL REVENUES 202,649 205,774 194,987 (10,787)
EXPENDITURES: Current-Public protection:
Services and supplies 169,336 176,920 176,696 (224) Other charges 20,968 23,268 22,981 (287) Fixed assets 21,520 23,336 6,843 (16,493)
TOTAL EXPENDITURES 211,824 223,524 206,520 !17,004)
DEFICIENCY OF REVENUES OVER EXPENDITURES (9,175) (17,750) !11,533) 6,217
OTHER FINANCING SOURCES (USES): Sales of fixed assets 150 150 243 93 Transfers in 1,700 1,700 Transfers out (2,052) (2,052) (903) 1,149 Appropriation for contingencies (3,125) 3,125 Changes In reserves and designations 829 10,829 12,831 2,002
OTHER FINANCING SOURCES (USES) - NET (1,073) 7,502 13,871 6,369
NET CHANGE IN FUND BALANCE (10,248) (10,248) 2,338 12,586
FUND BALANCE, JULY 1, 2002 (Note 13) 10,248 10,248 10,248
FUND BALANCE, JUNE 30, 2003 (Note 13) $ 12,586 12,586
The notes to the basic financial statements are an integral part of this statement.

34
COUNTY OF LOS ANGELES STATEMENT OF REVENUES, EXPENDITURES AND CHANGES IN FUND BALANCES -BUDGET AND ACTUAL ON BUDGETARY BASIS PUBLIC LIBRARY FOR THE YEAR ENDED JUNE 30, 2003 (in thousands)
PUBLIC LIBRARY ORIGINAL FINAL ACTUAL ON VARIANCE FROM BUDGET BUDGET BUDGETARY FINAL BUDGET
BASIS OVER (UNDER)
REVENUES: Taxes $ 48,655 48,655 48,350 (305) Fines, forfeitures and penalties 452 452 Revenue from use of money
and property: Investment income 146 146 Rents and concessions 60 70 32 (38)
Intergovernmental revenues: Federal 69 69 State 4,037 4,226 4,402 176 Other 997 997 1,187 190
Charges for services 2,501 2,878 2,886 8 Miscellaneous 591 591 890 299
TOTAL REVENUES 56,841 57,486 58,414 928
EXPENDITURES: Current-Education:
Salaries and employee benefits 52,241 52, 165 49,669 (2,496) Services and supplies 26,643 28,726 26,056 (2,670) Other charges 843 859 686 (173) Fixed assets 1, 124 1,814 1,609 (205)
TOTAL EXPENDITURES 80,851 83,564 78,020 (5,544)
DEFICIENCY OF REVENUES OVER EXPENDITURES (24,010) (26,078) (19,606) 6,472
OTHER FINANCING SOURCES (USES): Sales of fixed assets 15 15 Transfers in 22,063 22,145 21,994 (151) Appropriation for contingencies (2,293) (307) 307 Changes in reserves and designations (80) (80) 561 641
OTHER FINANCING SOURCES (USES) - NET 19,690 21,758 22,570 812
NET CHANGE IN FUND BALANCE (4,320) (4,320) 2,964 7,284
FUND BALANCE, JULY 1, 2002 (Note 13) 4,320 4,320 4,320
FUND BALANCE, JUNE 30, 2003 (Note 13) $ 7,284 7,284
The notes to the basic financial statements are an integral part of this statement.

35
COUNTY OF LOS ANGELES STATEMENT OF REVENUES, EXPENDITURES AND CHANGES IN FUND BALANCES -BUDGET AND ACTUAL ON BUDGETARY BASIS REGIONAL PARK AND OPEN SPACE DISTRICT FOR THE YEAR ENDED JUNE 30, 2003 (in thousands)
REGIONAL PARK AND OPEN SPACE DISTRICT ORIGINAL FINAL ACTUAL ON VARIANCE FROM BUDGET BUDGET BUDGETARY FINAL BUDGET
BASIS OVER (UNDER)
REVENUES: Fines, forfeitures and penalties $ 935 935 925 (10) Revenue from use of money
and property-Investment income 9,550 9,550 6,558 (2,992)
Charges for services 77,391 77,391 77,091 (300) Miscellaneous (24) (24)
TOTAL REVENUES 87,876 87,876 84,550 (3,326)
EXPENDITURES: Current-Recreation and cultural services:
Services and supplies 20,692 20,692 4,392 (16,300) Other charges 302,650 302,650 63,861 (238,789) Fixed Assets (1,325) (1,325)
TOTAL EXPENDITURES 323,342 323,342 66,928 (256,414)
EXCESS (DEFICIENCY) OF REVENUES OVER EXPENDITURES (235,466) !235,466! 17,622 253,088
OTHER FINANCING SOURCES (USES): Transfers in 73,491 73,491 60,721 (12,770) Transfers out (108,877) (108,877) (99,353) 9,524 Long-term debt proceeds 169,747 169,747 (169,747) Appropriation for contingencies (46) (46) 46 Changes in reserves and designations (1) (1) 36,616 36,617
OTHER FINANCING SOURCES (USES) - NET 134,314 134,314 (2,016) (136,330)
NET CHANGE IN FUND BALANCE (101, 152) (101,152) 15,606 116,758
FUND BALANCE, JULY 1, 2002 (Note 13) 104,221 104,221 104,221
FUND BALANCE, JUNE 30, 2003 (Note 13) $ 3,069 3,069 119,827 116,758
The notes to the basic financial statements are an integral part of this statement.

36
COUNTY OF LOS ANGELES STATEMENT OF NET ASSETS PROPRIETARY FUNDS JUNE 30, 2003 (in thousands) BUSINESS-TYPE ACTIVITIES -
Harbor Olive View LAC+USC M. L. King/Drew UCLA Medical UCLA Medical Medical Medical High Desert
Center Center Center Center Hospital ASSETS Current assets:
Pooled cash and investments: (Notes 1 and 4) Operating (Note 1) $ 408 290 1,004 420 83
Other (Note 1) 17,019 12,635 39,595 17,012 3,204 Total pooled cash and investments 17,427 12,925 40,599 17,432 3,287
Other investments (Note 4) Taxes receivable Accounts receivable - net 161,272 140,634 365,283 176, 194 14,741
Interest receivable 4 5 5 1 1
Other receivables 4,270 6,462 12,266 4,084 983 Due from other funds (Note 12) 83,784 52,521 282,912 68,055 12,792
Advances to other funds (Note 12) Inventories 3,284 2,648 13,698 4,708 968
Total current assets 270,041 215,195 714,763 270,474 32,772
Noncurrent assets: Restrlcted assets (Note 4) 5,394 6,379 43,294 12,495 395 Net pension obligation (Note 6) 27,003 17,932 70,905 30,092 6,244
Capital assets: (Notes 5 and 7)
Land 1,001 1,842 18, 183 2,277 13,329
Buildings and improvements 68,849 143,449 164,111 195,867 9,491
Equipment 28,634 19,550 91,304 36,764 4,765
Construction in progress 21,931 177,805 Less accumulated depreciation (71,543) (79,687) (204,605) (121,543) (11,749)
Total capital assets - net 48,872 85, 154 246,798 113,365 15,836 Total noncurrent assets 81,269 109,465 360,997 155,952 22,475
TOTAL ASSETS 351,310 324,660 1,075,760 426,426 55,247
LIABILITIES Current liabilities:
Accounts payable 9,539 4,829 33,934 7,536 1,374
Accrued payroll 15, 116 9,741 33,368 16,097 2,771
Other payables 338 263 754 319 68 Accrued interest payable 149 218 148 621 Due to other funds (Note 12) 69,228 52,150 198,263 43,878 14,788
Advances from other funds (Note 12) 47,902 69,095 58,235 108,457 1,001
Deferred revenue (Note 6) 1,748 1,161 6,205 1,948 404
Current portion of long-term liabilities (Note 8) 38,093 28,147 195,662 47,971 11,001 Total current liabilities 182, 113 165,604 526,569 226,827 31,407
Noncurrent liabilities: Accrued vacation and sick leave (Note 8) 19,961 11,398 37,571 21,229 3,162
Bonds and notes payable (Note 8) 22,290 36,755 25,889 72,932 Pension bonds payable (Notes 6 and 8) 70,708 46,951 185,654 78,795 16,349 Capital lease obligations (Notes 7 and 8) 363 76 26 87 Wor1<ers' compensation (Notes 8 and 15) 34,745 24,561 137,688 71, 144 10,605 Litigation and self-insurance (Notes 8 and 15) 27,742 6,726 96,440 40,788 5,220 Third party payors (Notes 8 and 11) 86,500 85,237 98,010 34,528 8,900
Total noncurrent liabilities 262,309 211,628 581,328 319,442 44,323 TOTAL LIABILITIES 444,422 377,232 1,107,897 546,269 75,730
NET ASSETS Invested in capital assets, net of related debt
(Notes 5 and 8) 22,853 42,598 148,080 40,966 12,327 Restricted 5,245 6,161 43, 146 11,874 395 Unrestricted (121,210) (101,331) (223,363) (172,683) (33,205) TOTAL NET ASSETS (DEFICIT) (Note 2) $ (93,112) (52,572) (32, 137) (119,843) (20,483)
The notes to the basic financial statements are an integral part of this statement.

37
GOVERNMENTAL ENTERPRISE FUNDS ACTIVITIES
Rancho Non major Internal Los Amigos Enterprise Service
Medical Center Funds Total Funds ASSETS Current assets:
Pooled cash and investments: (Notes 1 and 4)
$ 195 26, 118 $ 28,518 $ 45,472 Operating (Note 1)
6,415 338 96,218 6,280 Other (Note 1)
6,610 26,456 124,736 51,752 Total pooled cash and Investments 16,756 16,756 8,363 Other investments (Note 4)
1,501 1,501 Taxes receivable
69,268 927,392 Accounts receivable - net
2 55 73 118 Interest receivable
2,280 12,450 42,795 83 Other receivables
29,524 609 530,197 48,875 Due from other funds (Note 12)
772 772 Advances to other funds (Note 12)
1,085 2,812 29,203 6,448 Inventories
108,769 61,411 1,673,425 115,639 Total current assets Noncurrent assets:
16,784 84,741 12,652 Restricted assets (Note 4)
19,438 171,614 32,967 Net pension obligation (Note 6) Capital assets: (Notes 5 and 7)
217 80,578 117.427 Land
187,179 322,407 1,091,353 1,734 Buildings and improvements
10,301 2,076 193,394 209,777 Equipment
6,550 2,326 208,612 Construction in progress
(87,854) (211,854) (788,835) (109,342) Less accumulated depreciation
116,393 195,533 821,951 102,169 Total capital assets - net
152,615 195,533 1,078,306 147,788 Total noncurrent assets
261,384 256,944 2,751,731 263,427 TOTAL ASSETS
LIABILITIES Current liabilities:
2,938 8,172 68,322 5,677 Accounts payable
6,593 83,686 17,567 Accrued payroll
238 1,731 3,711 251 Other payables
343 1,479 195 Accrued interest payable
30,565 3,998 412,870 19,825 Due to other funds (Note 12)
16,142 300,832 22,000 Advances from other funds (Note 12)
1,258 576 13,300 2,810 Deferred revenue (Note 6)
37,116 604 358,594 43,022 Current portion of long-term liabilities (Note 8)
95,193 15,081 1,242,794 111,347 Total current liabilities
Noncurrent liabilities:
8,468 101,789 31,337 Accrued vacation and sick leave (Note 8)
75,590 7,508 240,964 34,935 Bonds and notes payable (Note 8)
50,893 449,350 86,317 Pension bonds payable (Notes 6 and 8)
716 1,268 192 Capital lease obligations (Notes 7 and 8)
27,832 306,575 56,046 Wor1<ers' compensation (Notes 8 and 15)
13,016 189,932 16,232 Litigation and self-insurance (Notes 8 and 15)
23,700 336,875 Third party payors (Notes 8 and 11)
200,215 7,508 1,626,753 225,059 Total noncurrent liabilities
295,408 22,589 2,869,547 336,406 TOTAL LIABILITIES
NET ASSETS Invested in capital assets, net of related debt
36,411 187,530 490,765 62,368 (Notes 5 and 8)
16,441 43,099 126,361 1,876 Restricted
(86,876) 3,726 (734,942) (137,223) Unrestricted $ (34,024) 234,355 (117,816) $ (72,979) TOTAL NET ASSETS (DEFICIT) (Note 2)
Adjustment to reflect the consolidation of internal 5,615 service fund activities related to enterprise funds
$ (112,201) NET ASSETS OF BUSINESS-TYPE ACTIVITIES (PAGE 21)

38
COUNTY OF LOS ANGELES STATEMENT OF REVENUES, EXPENSES AND CHANGES IN FUND NET ASSETS PROPRIETARY FUNDS FOR THE YEAR ENDED JUNE 30, 2003 (in thousands)
Harbor Olive View UCLA Medical UCLA Medical
Center Center OPERATING REVENUES:
Net patient service revenues (Note 11) $ 442,440 323,063 Rentals Charges for services Other 13,984 11,334
TOTAL OPERATING REVENUES 456,424 334,397
OPERATING EXPENSES: Salaries and employee benefits 224,871 153,379 Services and supplies 52,171 42,281 Other professional services 76,194 54,439 Depreciation and amortization (Note 5) 1,405 2,452 Medical malpractice 7,007 (1,020) Rent 3,660 4, 110 Provision for bad debts 1,863 1,914
TOTAL OPERATING EXPENSES 367,171 257,555
OPERATING INCOME (LOSS) 89,253 76,842
NONOPERATING REVENUES (EXPENSES): Taxes Interest income 488 204 Interest expense (8,592) (8,734) Intergovernmental transfers expense (Note 11) (148,089) (116,995) Intergovernmental revenues:
State Federal
TOTAL NONOPERATING REVENUES (EXPENSES) (156,193) (125,525)
LOSS BEFORE CONTRIBUTIONS AND TRANSFERS (66,940) (48,683)
Capital contributions 3,466 Transfers in (Note 12) 65,409 50,961 Transfers out (Note 12) (175)
CHANGE IN NET ASSETS (1,531) 5,569
TOTAL NET ASSETS (DEFICIT), JULY 1, 2002 (91,581) (58,141)
TOTAL NET ASSETS (DEFICIT), JUNE 30, 2003 $ (93, 112) (52,572)
BUSINESS-TYPE ACTIVITIES -LAC+USC M. L. King/Drew
Medical Medical High Desert Center Center Hospital
1, 145,950 454,634 72,464
45,380 21, 105 2,576
1,191,330 475,739 75,040
509,770 268,043 45,560 150, 156 49,867 11,482 195,210 78,445 14,994
3,286 3,193 390 4,651 4,027 111
10,840 5,089 789 5,958 2,016 4,839
879,871 410,680 78, 165
311,459 65,059 (3, 125)
667 1, 195 60 (22,027) (14,002) (1,740)
(437,928) (160,792) (14,764)
1,864 24,243
(433,181) (173,599) (16,444)
(121,722) (108,540) (19,569)
280,761 85,107 18,063 (112)
159,039 (23,545) (1,506)
(191,176) (96,298) (18,977)
(32, 137) (119,843) (20,483)
The notes to the basic financial statements are an integral part of this statement.

39
GOVERNMENTAL ENTERPRISE FUNDS ACTIVITIES
Rancho Non major Internal Los Amigos Enterprise Service
Medical Center Funds Total Funds OPERATING REVENUES:
$ 192,924 $ 2,631,475 $ Net patient service revenues (Note 11) 12, 162 12, 162 29,719 Rentals
37,626 37,626 319,411 Charges for services 10,250 3,912 106,541 Other
203,174 53,922 2,790,026 349, 130 TOTAL OPERATING REVENUES
OPERATING EXPENSES: 99,579 1,301,202 263,536 Salaries and employee benefits 20,455 250,096 576,506 46,141 Services and supplies 21,066 664 441,032 7,632 Other professional services 2,369 10,947 24,042 33,345 Depreciation and amortization (Note 5)
4,457 19,233 Medical malpractice
260 24,766 Rent 12,605 29, 195 Provision for bad debts
160,611 261,727 2,415,960 352,654 TOTAL OPERATING EXPENSES
42,363 (207,605) 374,046 (3,524) OPERATING INCOME (LOSS)
NONOPERATING REVENUES (EXPENSES): 2,772 2,772 Taxes
972 649 4,435 621 Interest income
(11,572) (404) (67,071) (10,362) Interest expense (59,931) (936,499) Intergovernmental transfers expense (Note 11)
Intergovernmental revenues:
262 2,146 State 200,166 224,431 3,326 Federal
TOTAL NONOPERATING REVENUES
(70,531) 203,667 (771,766) (6,433) (EXPENSES)
LOSS BEFORE CONTRIBUTIONS AND
(26,166) (4,116) (397,740) (9,957) TRANSFERS
3,466 Capital contributions
39,633 1,741 541,675 3,200 Transfers in (Note 12) (6,290) (6,577) (1,604) Transfers out (Note 12)
11,665 (6,667) 141,024 (6,561) CHANGE IN NET ASSETS
(45,669) 243,022 (64,416) TOTAL NET ASSETS (DEFICIT), JULY 1, 2002
$ (34,024) 234,355 $ (72,979) TOTAL NET ASSETS (DEFICIT), JUNE 30, 2003
Adjustment to reflect the consolidation of Internal 436 service fund activities related to enterprise funds
CHANGE IN NET ASSETS OF BUSINESS-TYPE $ 141,460 ACTIVITIES (PAGE 23)

40
COUNTY OF LOS ANGELES STATEMENT OF CASH FLOWS PROPRIETARY FUNDS FOR THE YEAR ENDED JUNE 30, 2003 (in thousands)
BUSINESS-TYPE ACTIVITIES -Harbor Olive View LAC+USC M. L. King/Drew
UCLA Medical UCLA Medical Medical Medical High Desert Center Center Center Center Hospital
CASH FLOWS FROM OPERATING ACTIVITIES: Cash received from patient services $ 37g,478 261,235 900,636 369,694 64,424 Rentals received Cash received from charges for services Other operating revenues 13,987 11,335 45,406 21, 107 2,577 Cash received for services provided to other funds 8,054 6,093 18,502 14,188 5,364 Cash paid for salaries and employee benefits (219,099) (146,384) (478,622) (237,935) (42,243) Cash paid for services and supplies (11,709) (16,825) (83,538) (40,607) (7,206) Other operating expenses (82,389) (59,503) (212,926) (88,818) (16,474) Cash paid for services from other funds (18,046) (24,354) (54,371) (24,322) (4,972)
Net cash provided by (required for) operating activities 70,276 31,597 135,087 13,307 1,470
CASH FLOWS FROM NONCAPITAL FINANCING ACTIVITIES: Cash advances received from other funds 193,165 182,811 370, 151 259,328 14,935 Cash advances paid/returned to other funds (150,312) (119,057) (322,561) (156,366) (14,798) Interest paid on pension bonds (7,016) (4,658) (18,419) (7,817) (1,622) Interest paid on advances (647) (1,226) (667) (1,768) (28) Intergovernmental transfers (151,944) (120,553) (383,178) (171,530) (14,647) Transfers In 65,409 50,961 280,761 85, 107 18,063 Transfers out (175) (112)
Net cash provided by (required for) noncapital financing activities (51,345) (11,897) (73,913) 6,842 1,903
CASH FLOWS FROM CAPITAL AND RELATED FINANCING ACTIVITIES: Proceeds from taxes Intergovernmental receipts 26,107 Proceeds from bonds and notes 54,800 Interest paid on capital borrowing (961) (2,884) (2,950) (4,456) (90) Principal payments on bonds and notes (5,672) (8,731) (23,990) (6,266) (1,605) Principal payments on capital leases (128) (34) (12) (31) Acquisition and construction of capital assets (2,413) (550) (58,392) (821) (177)
Net cash provided by (required for) capital and related financing activities (9,174) (12,165) (4,459) (11,555) (1,903)
CASH FLOWS FROM INVESTING ACTIVITIES -Interest income received 284 69 98 952 8
Net increase in cash and cash equivalents 10,041 7,604 56,813 9,546 1,478
Cash and cash equivalents, July 1, 2002 12,780 11,700 27,080 20,381 2,204
Cash and cash equivalents, June 30, 2003 $ 22,821 19,304 83,893 29,927 3,682
The notes to the basic financial statements are an integral part of this statement.
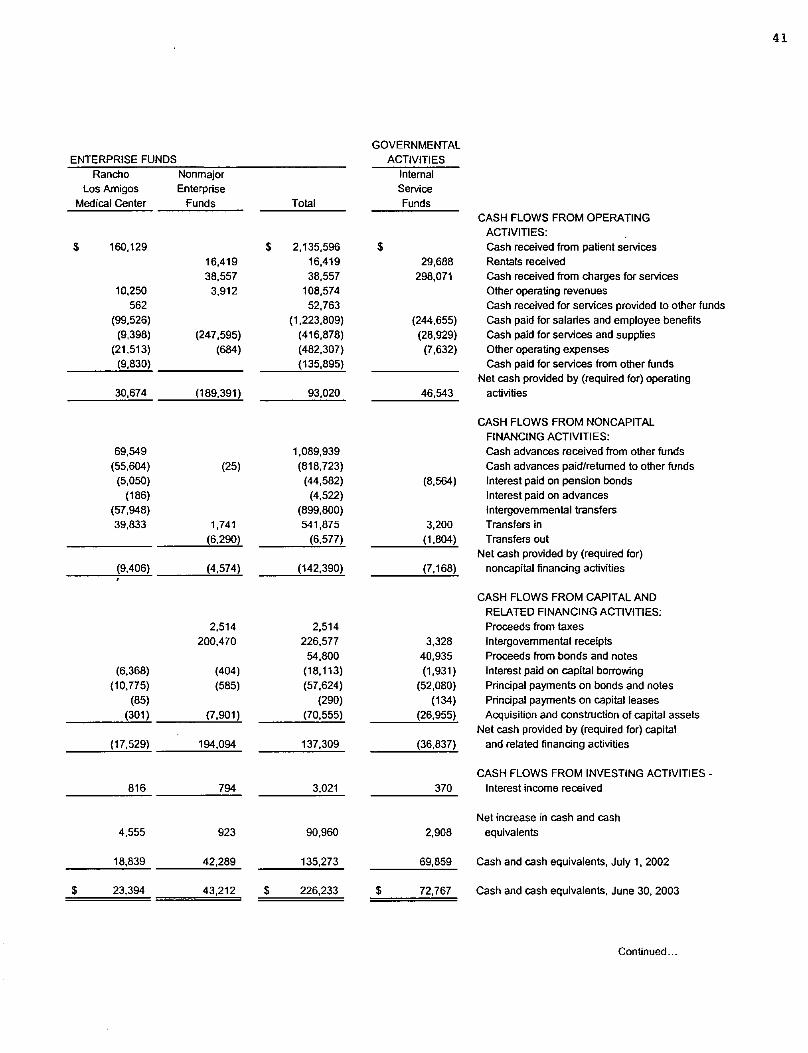
41
GOVERNMENTAL ENTERPRISE FUNDS ACTIVITIES
Rancho Nonmajor Internal Los Amigos Enterprise Service
Medical Center Funds Total Funds CASH FLOWS FROM OPERATING
ACTIVITIES: $ 160,129 $ 2,135,596 $ Cash recelved from patient services
16,419 16,419 29,688 Rentals received 38,557 38,557 298,071 Cash received from charges for services
10,250 3,912 108,574 Other operating revenues 562 52,763 Cash received for services provided to other funds
(99,526) (1,223,809) (244,655) Cash paid for salaries and employee benefits (9,398) (247,595) (416,878) (28,929) Cash paid for services and supplies
(21,513) (684) (482,307) (7,632) Other operating expenses (9,830) (135,895) Cash paid for services from other funds
Net cash provided by (required for) operating 30,674 (189,391) 93,020 46,543 activities
CASH FLOWS FROM NONCAPITAL FINANCING ACTIVITIES:
69,549 1,089,939 Cash advances received from other funds (55,604) (25) (818,723) Cash advances paid/returned to other funds (5,050) (44,582) (8,564) Interest paid on pension bonds
(186) (4,522) Interest paid on advances (57,948) (899,800) Intergovernmental transfers 39,833 1,741 541,875 3,200 Transfers in
(6,290) (6,577) (1,804) Transfers out Net cash provided by (required for)
(9,406) (4,574) (142,390) (7,168) noncapital financing activities
CASH FLOWS FROM CAPITAL AND RELATED FINANCING ACTIVITIES:
2,514 2,514 Proceeds from taxes 200,470 226,577 3,328 Intergovernmental receipts
54,800 40,935 Proceeds from bonds and notes (6,368) (404) (18,113) (1,931) Interest paid on capital borrowing
(10,775) (585) (57,624) (52,080) Principal payments on bonds and notes (85) (290) (134) Principal payments on capital leases
(301) (7,901) (70,555) (26,955) Acquisition and construction of capital assets Net cash provided by (required for) capital
(17,529) 194,094 137,309 (36,837) and related financing activities
CASH FLOWS FROM INVESTING ACTIVITIES -816 794 3,021 370 Interest income received
Net increase in cash and cash 4,555 923 90,960 2,908 equivalents
18,839 42,289 135,273 69,859 Cash and cash equivalents, July 1, 2002
$ 23,394 43,212 $ 226,233 $ 72,767 Cash and cash equivalents, June 30, 2003
Continued ...

42
COUNTY OF LOS ANGELES STATEMENT OF CASH FLOWS - Continued PROPRIETARY FUNDS FOR THE YEAR ENDED JUNE 30, 2003 (in thousands)
BUSINESS-TYPE ACTIVITIES -Harbor Olive View LAC+USC M. L. King/Drew
UCLA Medical UCLA Medical Medical Medical High Desert Center Center Center Center Hospital
RECONCILIATION OF OPERATING INCOME (LOSS) TO NET CASH PROVIDED BY (REQUIRED FOR) OPERATING ACTIVITIES: Operating income (loss) $ 89,253 76,842 311,459 65,059 (3,125) Adjustments to reconcile operating income
(loss) to net cash provided by (required for) operating activities: Depreciation and amortization 1,405 2,452 3,286 3,193 390 Other charges - net (3, 150) (1,565) (365) (2,508) (394)
(Increase) decrease in: Accounts receivable - net (45,103) (52,585) (164,399) (65,341) (8,287) Interest receivable Other receivables (383) (2,277) 856 (918) (80) Due from other funds (13,359) (3,567) (70,697) 720 9,066 Inventories (620) (218) 573 1,738 (101) Net pension obligation 5,328 3,536 13,986 5,937 1,232
Increase (decrease) in: Accounts payable (5,000) 445 12,065 1,373 (200) Accrued payroll 262 (427) 1,259 (441) (83) Other payables (20) (16) (55) (30) (8) Accrued vacation and sick leave 1,099 298 1,725 17 (152) Due to other funds 31,189 2,441 (15,663) Deferred revenue 143 Pension bonds payable (5, 157) (3,424) (13,541) (5,747) (1,193) Worl<ers' compensation liability 3,149 5,810 27,351 29,871 2,967 Litigation and self-insurance liability 5,583 (756) (1,802) (756) (26) Third party payer liability 5,800 4,608 13,243 (3, 197) 1,464
TOTAL ADJUSTMENTS (18,977) (45,245) (176,372) (51,752) 4,595
NET CASH PROVIDED BY (REQUIRED FOR) OPERATING ACTIVITIES $ 70,276 31,597 135,087 13,307 1,470
NONCASH INVESTING, CAPITAL AND FINANCING ACTIVITIES: Capital contributions - buildings and improvements 3,466
RECONCILIATION OF CASH AND CASH EQUIVALENTS TO THE STATEMENT OF NET ASSETS: Pooled cash and investments $ 17,427 12,925 40,599 17,432 3,287 Other investments Restricted assets 5,394 6,379 43,294 12,495 395
TOTAL $ 22,821 19,304 83,893 29,927 3,682
The notes to the basic financial statements are an integral part of this statemenL

43
GOVERNMENTAL ENTERPRISE FUNDS ACTIVITIES
Rancho Non major Internal Los Amigos Enterprise Service
Medical Center Funds Total Funds
RECONCILIATION OF OPERATING INCOME (LOSS) TO NET CASH PROVIDED BY (REQUIRED FOR) OPERATING ACTIVITIES:
$ 42,363 (207,805) $ 374,046 $ (3,524) Operating income (loss) Adjustments to reconcile operating income
(loss) to net cash provided by (required for) operating activities:
2,369 10,947 24,042 33,345 Depreciation and amortization (871) 4,804 (4,049) (155) Other charges - net
(Increase) decrease in: (14,386) (350, 101) Accounts receivable - net
189 Interest receivable 128 5,642 2,968 405 Other receivables
(3,867) (609) (82,313) (22,586) Due from other funds 88 610 2,070 (269) Inventories
3,834 33,853 6,502 Net pension obligation Increase (decrease) in:
893 (3,947) 5,629 (1,186) Accounts payable (258) 312 806 Accrued payroll (21) (58) (208) (43) Other payables
(493) 2,494 917 Accrued vacation and sick leave 1, 117 1,092 20,176 19,781 Due to other funds
(67) 76 621 Deferred revenue (3,713) (32,775) (6,295) Pension bonds payable
(12) 69,136 15,674 Worl<ers' compensation liability 5,006 7,249 2,361 Litigation and self-insurance liability
(1,503) 20,415 Third party payer liability
(11,689) 18,414 (281,026) 50,067 TOTAL ADJUSTMENTS
NET CASH PROVIDED BY (REQUIRED FOR) $ 30,674 (189,391) $ 93,020 $ 46,543 OPERA TING ACTIVITIES
NONCASH INVESTING, CAPITAL AND FINANCING ACTIVITIES:
$ 3,466 Capital contributions - buildings and improvements
RECONCILIATION OF CASH AND CASH EQUIVALENTS TO THE STATEMENT OF NET ASSETS:
$ 6,610 26,456 $ 124,736 $ 51,752 Pooled cash and investments 16,756 16,756 8,363 Other investments
16,784 84,741 12,652 Restricted assets
$ 23,394 43,212 $ 226,233 $ 72,767 TOTAL

44
COUNTY OF LOS ANGELES
STATEMENT OF FIDUCIARY NET ASSETS
FIDUCIARY FUNDS
JUNE 30, 2003 (in thousands)
ASSETS
Pooled cash and investments (Note 4)
Other investments (Note 4)
Taxes receivable
Interest receivable
Other receivables
Capital assets, net
TOTAL ASSETS
LIABILITIES
Accounts payable
Other payables (Note 4)
Due to other governments
TOTAL LIABILITIES
NET ASSETS
Held in trust for pension benefits and
investment trust participants
$
$
PENSION INVESTMENT
TRUST FUND TRUST FUNDS
20,556 $ 9,376,421
29,589,333 2,024,234
94,745 49,971
706,965
42
30,411,641 11,450,626
1,612,982
2,550,853
4, 163,835
26,247,806 $ 11,450,626
The notes to the basic financial statements are an integral part of this statement.
AGENCY
FUNDS
$ 1,107,685
43,579
253,911
2,276
$ 1,407,451
1,407,451
$ 1,407,451

COUNTY OF LOS ANGELES
STATEMENT OF CHANGES IN FIDUCIARY NET ASSETS
FIDUCIARY FUNDS
FOR THE YEAR ENDED JUNE 30, 2003 (in thousands)
ADDITIONS:
Contributions:
Pension trust contributions:
Employer
Member
Contributions to investment trust funds
Total contributions
Investment earnings:
Interest
Net increase in the fair value of investments
Securities lending income (Note 4)
Total investment earnings
Less - Investment expenses:
Expense from investing activities
Expense from securities lending activities (Note 4)
Total net investment expense
Net investment earnings
Miscellaneous
TOTAL ADDITIONS
DEDUCTIONS:
Salaries and employee benefits
Services and supplies
Depreciation and amortization
Benefit payments
Distribution from investment trust funds
Miscellaneous
TOTAL DEDUCTIONS
CHANGE IN NET ASSETS
NET ASSETS HELD IN TRUST, JULY 1, 2002
NET ASSETS HELD IN TRUST, JUNE 30, 2003
PENSION
TRUST FUND
$ 325,524
233, 192
558,716
560,296
405,272
40,995
1,026,563
66,258
33,314
101,572
924,991
151,215
1,634,922
22,504
16,926
93
1,375,653
16,960
1,434,356
200,566
26,047,240
$ 26,247,806
The notes to the basic financial statements are an integral part of this statement.
45
INVESTMENT
TRUST FUNDS
40,722,469
40,722,469
176,274
176,274
176,274
40,696,743
38,066,710
36,066,710
2,632,033
6,616,593
11,450,626

46
COUNTY OF LOS ANGELES NOTES TO THE BASIC FINANCIAL STATEMENTS
1. SUMMARY OF SIGNIFICANT ACCOUNTING POLICIES
Reporting Entity
The County of Los Angeles {the "County'') is a legal subdivision of the State of California (the "State") charged with general governmental powers. The County's powers are exercised through an elected Board of Supervisors (the "Board") which, as the governing body of the County, is responsible for the legislative and executive control of the County. As required by the Governmental Accounting Standards Board ("GASB"), these basic financial statements include both those of the County and its component units. The component units discussed below are included primarily because the Board is financially accountable for them.
Blended Component Units
County management has determined that the following related entities should be included in the basic financial statements as blended component units:
Fire Protection District Flood Control District Street Lighting Districts Improvement Districts Community Development
Commission (including the Housing Authority of the County of Los Angeles) ("CDC")
Regional Park and Open Space District
Garbage Disposal Districts Sewer Maintenance Districts Waterworks Districts Los Angeles County Capital Asset Leasing
Corporation (a Non Profit Corporation) ("NPC") Various Joint Powers Authorities ("JPAs") Los Angeles County Employees
Retirement Association ("LACERA")
Although they are separate legal entities, the various districts and the CDC are included primarily because the Board is also their governing Board. As such, the Board establishes policy, appoints management and exercises budgetary control. The NPC and JPAs have been included because their sole purpose is to finance and construct County capital assets and because they are dependent upon the County for funding. Blended component units are those that, because of the closeness of the relationship with the primary government, should be blended in the basic financial statements as though they are part of the primary government. LACERA is reported in the Pension Trust Fund of the basic financial statements and has been included because its operations are dependent upon County funding and because its operations, almost exclusively, benefit the County.
Discretely Presented Component Unit
The Children and Families First Commission ("Commission") was established by the County as a separate legal entity to administer the County's share of tobacco taxes levied by the State pursuant to Proposition 10. The County's Board established the Commission with nine voting members and four non-voting representatives. Of the nine voting members, one is a member of the Board of Supervisors, two are heads of County Departments (Health and Mental Health), one is an early childhood education expert, and five are public members appointed by the Board. The non-voting representatives are from other County commissions and planning groups.
The Commission's services are focused on the development and well-being of all children, from the prenatal stage until age five. The Commission is a component unit of the County because the County's Board appoints the voting Commissioners and the County has the ability to impose its will by removing those commissioners at will. It is discretely presented because its governing body is not substantially the same as the County's governing body and it does not provide services entirely or exclusively to the County.

COUNTY OF LOS ANGELES NOTES TO THE BASIC FINANCIAL STATEMENTS-Continued
1. SUMMARY OF SIGNIFICANT ACCOUNTING POLICIES-Continued
Component Unit Financial Statements
Separate financial statements or additional financial information for each of the component units may be obtained from the Auditor-Controller at 500 West Temple Street, Room 525, Los Angeles, California 90012.
Government-wide Financial Statements
The statement of net assets and statement of activities display information about the primary government {the County) and its component units. These statements include the financial activities of the overall government, except for fiduciary activities. Eliminations have been made to minimize the double counting of internal activities. These statements distinguish between the governmental and business-type activities of the County and between the County and its discretely presented component unit. Governmental activities, which normally are supported by taxes and intergovernmental revenues, are reported separately from business-type activities, which rely to a significant extent on fees charged to external parties.
The statement of activities presents a comparison between direct expenses and program revenues for each segment of the business-type activities of the County and for each function of the County's governmental activities. Direct expenses are those that are specifically associated with a program or function and, therefore, are clearly identifiable to a particular function. Program revenues include charges paid by the recipients of goods or services offered by the programs. Grants and contributions that are restricted to meeting the operational or capital requirements of a particular program are also recognized as program revenues. Revenues that are not classified as program revenues, including all taxes, are presented instead as general revenues.
Net assets are classified into the following three categories, 1) invested in capital assets, net of related debt; 2) restricted; and 3) unrestricted. Net assets are reported as restricted when their use has been constrained by externally imposed conditions. Such conditions include limitations imposed by creditors (such as through debt covenants), grantors or laws or regulations of other governments. Net asset restrictions are also recognized when imposed by law through constitutional provisions or enabling legislation. Net assets "restricted for special purpose" are principally related to special revenue funds and the restrictions on their net asset use in accordance with the provisions mentioned above.
When both restricted and unrestricted net assets are available, restricted resources are used first and then unrestricted resources are used to the extent necessary.
Fund Financial Statements
The fund financial statements provide information about the County's funds, including fiduciary funds and blended component units. Separate statements for each fund category - governmental, proprietary and fiduciary - are presented. The emphasis of fund financial statements is on major governmental and enterprise funds, each displayed in a separate column. All remaining governmental and enterprise funds are separately aggregated and reported as nonmajor funds.
47

48
COUNTY OF LOS ANGELES NOTES TO THE BASIC FINANCIAL STATEMENTS-Continued
1. SUMMARY OF SIGNIFICANT ACCOUNTING POLICIES-Continued
Fund Financial Statements-Continued
The County reports the following major governmental funds:
General Fund The General Fund is available for any authorized purpose and is used to account for all resources except for those accounted for in other funds.
Fire Protection District Fund The Fire Protection District Fund was established to provide for fire prevention and suppression, rescue service, management of hazardous materials incidents, ocean lifeguard services, and acquisition and maintenance of district property and equipment. Revenues are derived principally from the Countywide tax levy.
Flood Control District Fund The Flood Control District Fund was established to provide for the control and conservation of flood, storm and other waste waters, to conserve such waters for beneficial and useful purposes, and to protect the harbors, waterways, public highways and property located within the District from damage from such flood and storm waters. Revenues are derived primarily from the Countywide tax levy and benefit assessments.
Public Library Fund The Public Library Fund was established to provide free library services to the unincorporated areas of the County and to cities that contract for these services. Revenues are derived principally from the Countywide tax levy.
Regional Park and Open Space District Fund The Regional Park and Open Space District Fund was established to administer grant programs designed to preserve beaches, parks and wild lands, to acquire and renovate new and existing recreational facilities, and to restore rivers, streams, and trails in the County. Funding is derived from voter-approved assessments and long-term debt proceeds.
The County's major enterprise funds consist of six Hospital Enterprise Funds. These funds provide health services to County residents. Revenues are principally patient service fees. Subsidies are also received from the General Fund. A description of each Hospital Enterprise Fund is provided below:
Harbor/UCLA Medical Center The Harbor/UCLA Medical Center provides acute and intensive care unit medical/surgical inpatient and outpatient care services, trauma and emergency room services, acute psychiatric services, pediatric and obstetric services, and transplants.
Olive View/UCLA Medical Center The Olive View/UCLA Medical Center provides acute and intensive care, emergency services, medical/surgical inpatient and outpatient health care services, obstetric and gynecology services, and psychiatric services.

COUNTY OF LOS ANGELES NOTES TO THE BASIC FINANCIAL STATEMENTS-Continued
1. SUMMARY OF SIGNIFICANT ACCOUNTING POLICIES-Continued
Fund Financial Statements-Continued
LAC+USC Medical Center The LAC+USC Medical Center provides acute and intensive care unit medical/surgical inpatient and outpatient services, trauma and emergency room services, a bum center, psychiatric services, renal dialysis, AIDS services, pediatric and obstetric services, and communicable disease services.
M. L. King/Drew Medical Center The M. L. King/Drew Medical Center provides acute and intensive care unit medical/surgical inpatient and outpatient services, trauma and emergency room services, psychiatric services, dental services, pediatric and obstetric services.
High Desert Hospital The High Desert Hospital provides acute medical and surgical inpatient and outpatient services, as well as extended skilled nursing services.
Rancho Los Amigos Medical Center The Rancho Los Amigos Medical Center specializes in the rehabilitation for victims of spinal cord injuries and strokes, pathokinesiology and polio services, services for liver diseases, pediatrics, ortho diabetes, dentistry, and neuro-science.
The following fund types have also been reported:
Internal Service Funds The Internal Service Funds are used to account for the financing of services provided by a department or agency to other departments or agencies on a cost-reimbursement basis. The County's principal Internal Service Fund is used to account for the cost of services provided by the Department of Public Works to various other County funds and agencies.
Fiduciary Fund Types
Pension Trust Fund The Pension Trust Fund is used to account for financial activities of LACERA.
Investment Trust Funds The Pooled Investment Trust Fund is used to account for net assets of the County's external investment pool.
The Specific Investment Trust Fund is used to account for the net assets of individual investment accounts, in aggregate. The related investment activity occurs separately from the County's investment pool and is provided as a service to external investors.
Agency Funds The Agency Funds are used primarily to account for assets held by the County in an agency capacity pending transfer or distribution to individuals, private organizations, other governmental entities, and other funds.
49

50
COUNTY OF LOS ANGELES NOTES TO THE BASIC FINANCIAL STATEMENTS-Continued
1. SUMMARY OF SIGNIFICANT ACCOUNTING POLICIES-Continued
Basis of Accounting
The government-wide, proprietary, pension and investment trust fund financial statements are reported using the economic resources measurement focus and the accrual basis of accounting. Revenues are recorded when earned and expenses are recorded at the time liabilities are incurred, regardless of when the related cash flows take place. Nonexchange transactions, in which the County gives (or receives) value without directly receiving (or giving) equal value in exchange, include property and sales taxes, grants, entitlements and donations. On an accrual basis, revenue from property taxes is recognized in the fiscal year for which the taxes are levied. Revenues from grants and similar items are recognized in the fiscal year in which all eligibility requirements have been satisfied.
Governmental funds are reported using the current financial resources measurement focus and the modified accrual basis of accounting. Under this method, revenues are recognized when measurable and available. The County considers revenues to be available if collectible within one year after yearend, except for property taxes, which are considered available to the extent that they are collectible within 60 days after year-end. Expenditures are generally recorded when a liability is incurred, as under accrual accounting. However, debt service expenditures, as well as expenditures related to compensated absences and claims (including workers' compensation) and judgments are recorded only when payment is due. General capital asset acquisitions are reported as expenditures in governmental funds. Proceeds of long-term debt and capital leases are reported as other financing sources.
For the governmental funds financial statements, revenues are recorded when they are susceptible to accrual. Specifically, property and sales taxes, investment income, and charges for services and other miscellaneous revenue are all considered to be susceptible to accrual and have been recognized as revenue in the current fiscal period. Entitlements and shared revenues are recorded at the time of receipt or earlier if the susceptible to accrual criteria are met. Expenditure-driven grants are recognized as revenue when the qualifying expenditures have been incurred and all other eligibility requirements have been met and are recorded at the time of receipt or earlier, if the susceptible to accrual criteria are met. All other revenues are not considered susceptible to accrual and are recognized when received.
Proprietary funds distinguish operating revenues and expenses from nonoperating items. Operating revenues and expenses generally result from providing services and producing and delivering goods in connection with a proprietary fund's principal ongoing operations. The principal operating revenues of the County's six Hospital Enterprise Funds (Hospitals) are from patient services. The principal operating revenues for the County's Nonmajor Enterprise Funds and Internal Service Funds are charges for services and rental revenues. Operating expenses for all Enterprise Funds and the Internal Service Funds include the cost of sales and services, administrative expenses and depreciation on capital assets. Medical malpractice expenses, which are self-insured, are classified as operating expenses of the Hospitals. All other revenues and expenses not meeting this definition are reported as nonoperating items. As discussed in Note 11, intergovernmental transfer payments are recorded in the Hospitals and this item is classified as a nonoperating expense.
The County applies all applicable Financial Accounting Standards Board ("FASB") pronouncements issued on or before November 30, 1989, in accounting and reporting for operations of the enterprise funds. FASB pronouncements issued after November 30, 1989, have not been applied unless specifically adopted in a GASB pronouncement.

COUNTY OF LOS ANGELES NOTES TO THE BASIC FINANCIAL STATEMENTS-Continued
1. SUMMARY OF SIGNIFICANT ACCOUNTING POLICIES-Continued
Budgetary Data
In accordance with the provisions of Sections 29000-29144 of the Government Code of the State of California (the "Government Code"), commonly known as the County Budget Act, the County prepares and adopts a budget on or before August 30 for each fiscal year. Budgets are adopted for the major governmental funds and certain nonrnajor governmental funds on a basis of accounting which is different from generally accepted accounting principles ("GMP").
The County budget is organized by budget unit and by expenditure object. Budget units are established at the discretion of the Board of Supervisors. Within the General Fund (with certain exceptions), budget units are generally defined as individual departments. For other funds, each individual fund constitutes a budget unit. Expenditures are controlled on the object level for all budget units within the County, except for capital asset expenditures, which are controlled on the sub-object level. The total budget exceeds $19 billion and is currently controlled through the use of approximately 400 separate budget units. There were no excesses of expenditures over the related appropriations within any fund at June 30, 2003. The County prepares a separate budgetary document, the County Budget, which demonstrates legal compliance with budgetary control.
Transfers of appropriations between budget units must be approved by the Board. Supplemental appropriations financed by unanticipated revenue during the year must also be approved by the Board. Transfers of appropriations between objects of expenditure within the same budget unit must be approved by the Board or the Chief Administrative Office, depending upon the amount transferred. Budget amounts reported in the accompanying basic financial statements are as amended. Any excess of budgetary expenditures and other financing uses over revenues and other financing sources is financed by beginning available fund balances as provided for in the County Budget Act.
Note 13 describe the differences between the budgetary basis of accounting and GMP. A reconciling schedule is also presented for the major governmental funds.
Property Taxes
All jurisdictions within California derive their taxing authority from the State Constitution and various legislative provisions contained in the Government Code and Revenue and Taxation Code. Property is assessed at 100% of full cash or market value (with some exceptions) pursuant to Article XlllA of the California State Constitution and statutory provisions by the County Assessor and State Board of Equalization. The total 2002-2003 gross assessed valuation of the County of Los Angeles was $668,206,758,000.
The property tax levy to support general operations of the various jurisdictions is limited to one percent (1%) of full cash value and is distributed in accordance with statutory formulae. Amounts needed to finance the annual requirements of voter-approved debt are excluded from this limitation and are separately calculated and levied each fiscal year. The rates are formally adopted by either the Board or the city councils and, in some instances, the governing board of a special district.
The County is divided into approximately 11,750 tax rate areas, which are unique combinations of various jurisdictions servicing a specific geographic area. The rates levied within each tax rate area vary only in relation to levies assessed as a result of voter-approved taxes or indebtedness.
51

52
COUNTY OF LOS ANGELES NOTES TO THE BASIC FINANCIAL STATEMENTS-Continued
1. SUMMARY OF SIGNIFICANT ACCOUNTING POLICIES-Continued
Property Taxes-Continued
Property taxes are levied on both real and personal property. Secured property taxes are levied during September of each year. They become a lien on real property on January 1 preceding the fiscal year for which taxes are levied. These tax payments can be made in two equal installments; the first is due November 1 and delinquent with penalties after December 10; the second is due February 1 and delinquent with penalties after April 10. Secured property taxes which are delinquent and unpaid as of June 30 are declared to be tax defaulted and are subject to redemption penalties, costs, and interest when paid. If the delinquent taxes are not paid at the end of five (5) years, the property may be sold at public auction. The proceeds are used to pay the delinquent amounts due, and any excess is remitted, if claimed, to the taxpayer. Additional tax liens are created when there is a change in ownership of property or upon completion of new construction. Tax bills for these new tax liens are issued throughout the fiscal year and contain various payment and delinquent dates but are generally due within one year. If the new tax liens are lower, the taxpayer receives a tax refund rather than a tax bill. Unsecured personal property taxes are not a lien against real property. These taxes are due on January 1 and become delinquent, if unpaid, on August 31.
Deposits and Investments
In accordance with GASS Statement No. 31, "Accounting and Financial Reporting for Certain Investments and for External Investment Pools," the accompanying basic financial statements reflect the fair value of investments. Specific disclosures related to GASS 31 appear in Note 4.
Deposits and investments are reflected in the following asset accounts:
Pooled Cash and Investments As provided for by the Government Code, the cash balances of substantially all funds are pooled and invested by the County Treasurer for the purpose of increasing interest earnings through investment activities. Interest earned on pooled investments is deposited to participating funds based upon each fund's average daily deposit balance during the allocation period. Each respective fund's share of the total pooled cash and investments is included among asset balances under the caption "Pooled Cash and Investments."
Pooled Cash and Investments are identified within the following categories for all County operating funds:
Operating Pooled Cash and Investments This account represents amounts reflected in the County's day-to-day financial records. Such amounts are utilized to determine the availability of cash for purposes of disbursing and borrowing funds.
Other Pooled Cash and Investments This account represents amounts identified in various agency funds as of June 30, 2003 that were owed to or were more appropriately classified in County operating funds. Accordingly, certain cash balances have been reclassified from the agency funds as required by GASS Statement No. 34.

COUNTY OF LOS ANGELES NOTES TO THE BASIC FINANCIAL STATEMENTS-Continued
1. SUMMARY OF SIGNIFICANT ACCOUNTING POLICIES-Continued
Deposits and Investments-Continued
Other Investments
"Other Investments" represent Pension Trust Fund investments, investments of the Community Development Commission, various JPAs, NPC, and Public Buildings, and amounts on deposit with the County Treasurer which are invested separately as provided by the Government Code or by specific instructions from the depositing entity.
Restricted Assets
Enterprise Funds' restricted assets represent cash and investments of certain JPAs and Public Buildings projects restricted in accordance with the provisions of the certificates of participation issued. The Internal Service Funds' restricted assets represent cash and investments restricted for debt service in accordance with the provisions of the LAC-CAL bond indenture. All of the above noted assets are included in the various disclosures in Note 4.
Inventories
Inventories, which consist of materials and supplies held for consumption, are valued at cost using the average cost basis. The inventory costs of the governmental funds are accounted for as expenditures when the inventory items are consumed. Reported inventories are offset with a corresponding reservation of fund balance because these amounts are not available for appropriation and expenditure.
Of the amounts reported as inventories in the governmental activities and business-type activities, $34,813,000 and $2,812,000, respectively, represent land held for resale by the Community Development Commission (CDC). The CDC records land held for resale at the lower of cost or estimated net realizable value.
Capital Assets
Capital assets, which include land, buildings and improvements, equipment, and infrastructure assets, are reported in the applicable governmental or business-type activities columns in the govemmentwide financial statements. Capital assets are recorded at historical cost or estimated historical cost if purchased or constructed. Donated capital assets are recorded at the estimated fair market value at the date of donation.
Capital outlay is recorded as expenditures of the General, Special Revenue, and Capital Project Funds and as assets in the government-wide financial statements to the extent the County's capitalization threshold is met. Interest incurred during the construction phase of the capital assets of business-type activities is reflected in the capitalized value of the asset constructed, net of interest earned on the invested proceeds over the same period.
The County's capitalization thresholds are $5,000 for equipment, $100,000 for buildings and improvements and $100,000 for infrastructure assets. Maintenance and repairs are charged to operations when incurred. Betterments and major improvements which significantly increase values, change capacities, or extend useful lives are capitalized. Upon sale or retirement of capital assets, the cost and the related accumulated depreciation, as applicable, are removed from the respective accounts and any resulting gain or loss is included in the results of operations. Specific disclosures related to capital assets appear in Note 5.
53

54
COUNTY OF LOS ANGELES NOTES TO THE BASIC FINANCIAL STATEMENTS-Continued
1. SUMMARY OF SIGNIFICANT ACCOUNTING POLICIES-Continued
Capital Assets-Continued
Capital assets are depreciated or amortized using the straight-line method over the following estimated useful lives:
Buildings and Improvements Equipment Infrastructure
10 to 50 years 2 to 35 years 2 to 50 years
Works of art and historical treasures held for public exhibition, education, or research in furtherance of public service, rather than financial gain, are not capitalized. These items are protected, encumbered conserved, and preserved by the County. It is the County's policy to utilize proceeds from the sale of these items for the acquisition of other items for collection and display.
Pursuant to GASS 34, an extended period of deferral {fiscal year beginning July 1, 2005) is available before the requirement to record and depreciate infrastructure assets acquired prior to July 1, 2001 is effective. As a result, the governmental activities column in the accompanying government-wide financial statements as of June 30, 2003 does not reflect those infrastructure assets completed prior to July 1, 2001. The accompanying government-wide financial statements include infrastructure assets that have been acquired since July 1, 2001. Infrastructure assets that are functional are currently being depreciated.
Vacation and Sick Leave Benefits
Vacation pay benefits accrue to employees ranging from 10 to 20 days per year depending on years of service. Sick leave benefits accrue at the rate of 10 to 12 days per year for union represented employees depending on years of service. Non-represented employees accrue at a rate of 8 days per year. All benefits are payable upon termination, if unused, within limits and rates as specified in the County Salary Ordinance.
Liabilities for accrued vacation and sick leave benefits are accrued in the government-wide financial statements and in the proprietary funds. For the governmental funds, expenditures are recorded when amounts become due and payable (i.e., when employees terminate from service.)
Cash Flows
For purposes of reporting cash flows, all amounts reported as "Pooled Cash and Investments," "Other Investments," and "Restricted Assets" are considered cash equivalents. Pooled cash and investment amounts represent funds held in the County Treasurer's cash management pool. Such amounts are similar in nature to demand deposits (i.e., funds may be deposited and withdrawn at any time without prior notice or penalty).
Adoption of New Accounting Disclosure Requirements
For the year ended June 30, 2003, the County implemented GASS Technical Bulletin No. 2003-1, "Disclosure Requirements for Derivatives Not Reported at Fair Value on the Statement of Net Assets." As discussed in Note 6, the County has entered into a "swap" transaction in conjunction with outstanding pension debt and there are new disclosures related to this transaction.

COUNTY OF LOS ANGELES NOTES TO THE BASIC FINANCIAL STATEMENTS-Continued
1. SUMMARY OF SIGNIFICANT ACCOUNTING POLICIES-Continued
Accounting Reclassifications
Certain reclassifications have been made to amounts previously reported to conform to the current year's report format. Such reclassifications had no effect on previously reported change in net assets.
2. NET ASSET DEFICITS
The following funds had net asset deficits at June 30, 2003 (in thousands):
Enterprise Funds: Harbor/UCLA Medical Center Olive View/UCLA Medical Center LAC+USC Medical Center M. L. King/Drew Medical Center High Desert Hospital Rancho Los Amigos Medical Center
Internal Service Fund-Public Works
Accumulated Deficit
$ 93,112 52,572 32,137
119,843 20,483 34,024
87,795
The Enterprise and Internal Service Funds' deficits result primarily from the recognition of certain liabilities including accrued vacation and sick leave, workers' compensation, self-insurance and, for the enterprise funds, medical malpractice and third party payor liabilities, as required by GAAP. Deficits are expected to continue until such liabilities are retired through user charges or otherwise funded.
3. ELIMINATIONS
The Regional Park and Open Space District (District), a blended component unit, is authorized to issue assessment bonds to acquire and improve recreational land and facilities. These bonds are secured by voter-approved property tax assessments. The District executed a financing agreement with the Public Works Financing Authority, another blended component unit referred to in the basic financial statements as "Joint Powers Authority" (JPA). Under the terms of the agreement, the District sold $510,185,000 of bonds in 1997 that were acquired as an investment by the JPA. The JPA financed this investment from proceeds of a simultaneous issuance of an equivalent amount of bonds as a public offering. The structure of the publicly offered JPA bonds was designed to match the District's bonds relative to principal and interest maturities and interest rates. This series of transactions was conducted to facilitate the issuance of District related bonds and to minimize the County's overall interest cost. Pursuant to the financing agreement with the JPA, the District has pledged all available tax assessments necessary to ensure the timely payment of principal and interest on the bonds issued by the JPA. The transactions between the two component units have been accounted for as follows:
55

56
COUNTY OF LOS ANGELES NOTES TO THE BASIC FINANCIAL STATEMENTS-Continued
3. ELIMINATIONS-Continued
Fund Financial Statements
At June 30, 2003, the Fund Financial Statements reflect an investment asset (referred to as "Other Investments") held by the JPA of $394,735,000 that has been recorded in the Nonmajor Governmental Funds. The Fund Financial Statements do not reflect a liability for the related Bonds Payable ($394,735,000), as this obligation is not currently due. Accordingly, the value of the asset represents additional fund balance in the Nonmajor Governmental Funds.
In order to reflect the economic substance of the transaction described above, an eliminations column has been established in the Fund Financial Statements. The purpose of the column is to remove the duplication of assets, fund balances, revenues and expenditures that resulted from the consolidation of the two component units into the County's overall financial reporting structure.
Government-wide Financial Statements
The government-wide financial statements are designed to m1rnm1ze the duplicative effects of transactions between funds. Accordingly, the effects of the transaction described above have been eliminated from the amounts presented within Governmental Activities (as appropriate under the accrual basis of accounting). The specific items eliminated were Other Investments and Bonds Payable ($394,735,000 for each) and Investment Earnings and Interest Expense ($21, 184,000) for each). Accordingly, there are no reconciling differences between the two sets of Financial Statements (after the effects of eliminations) for this matter.
The Bonds Payable of $394,735,000 that were publicly issued are included among the liabilities presented in the Government-wide Financial Statements. Disclosures related to those outstanding bonds appear in Note 8 and are captioned "Assessment Bonds."
4. CASH AND INVESTMENTS
Investments in the County's cash and investment pool, other cash and investments, and Pension Trust Fund investments, are stated at fair value. Aggregate pooled cash and investments and other cash and investments are as follows at June 30, 2003 (in thousands):
Restricted Assets Pooled Cash Other Pooled Cash Other
and Investments Investments and Investments Investments Total
Governmental Funds $ 2,815,515 $ 276,205 $ 3,091,720 Proprietary Funds 176,488 25, 119 $ 17,383 $ 80,010 299,000 Fiduciary Funds (excluding
Pension Trust Fund) 10,484,106 2,067,813 12,551,919 Pension Trust Fund 20,556 29,589,333 29,609,889 Component Unit 606 344 606 344
Total $14103 QQ9 $ 31 958 4ZQ $ 17 383 $ 8Q 01Q $ 46 158 872

COUNTY OF LOS ANGELES NOTES TO THE BASIC FINANCIAL STATEMENTS-Continued
4. CASH AND INVESTMENTS-Continued
Deposits
At June 30, 2003, the carrying amount of the County's deposits was $73,690,000 and the balance per various financial institutions was $74,153,000. Of the balance in financial institutions, $68,900,000 was covered by either Federal depository insurance or collateralized with securities held by the County or its agent in the County's name. The remaining balance of $5,253,000 was uninsured and uncollateralized.
At June 30, 2003, the carrying amount of Pension Trust Fund deposits was $45,750,000 and the balance per various financial institutions was $45, 750,000. Of the balance in financial institutions, $38,748,000 was either covered by Federal depository insurance or collateralized with securities held by the entity or its agent in the entity's name. The remaining balance of $7,001,000 was uninsured and uncollateralized.
Investments
Statutes authorize the County to invest pooled investments in obligations of the United States Treasury, Federal agencies, municipalities, commercial paper rated A-1 by Standard & Poor's Corporation or P-1 by Moody's Commercial Paper Record, bankers' acceptances, negotiable certificates of deposit, floating rate notes, repurchase agreements and reverse repurchase agreements.
The investments are managed by the County Treasurer who reports on a monthly basis to the Board of Supervisors. In addition, the function of the County Treasury Oversight Committee is to review and monitor the County's investment policy. The committee membership includes the Treasurer and Tax Collector, the Auditor-Controller, Superintendent of Schools, Chief Administrative Officer, and a nonCounty representative.
Investments held by the County Treasurer are stated at fair value, except for certain non-negotiable securities that are reported at cost because they are not transferable and have terms that are not affected by changes in market interest rates. The fair value of pooled investments is determined annually and is based on current market prices. The fair value of each participant's position in the pool is the same as the value of the pool shares. The method used to determine the value of participants' equity withdrawn is based on the book value of the participants' percentage participation at the date of such withdrawals.
The Pension Trust Fund is managed by LACERA. Pension Trust Fund investments are authorized by the County Employees' Retirement Law of 1937. Statutes authorize a "Prudent Expert'' guideline as to form and types of investments which may be purchased. Examples of the Fund's investments are obligations of the various agencies of the Federal government, corporate and private placement bonds, global bonds, domestic and global stocks, domestic and global convertible debentures and real estate.
The School Districts and the Courts are required by legal provisions to participate in the County's investment pool. 86.7% of the Treasurer's external investment pool consists of these involuntary participants. Voluntary participants in the County's external investment pool include the Sanitation Districts, the South Coast Air Quality Management District and other special districts with independent governing boards. The deposits held for both involuntary and voluntary entities are included in the External Pooled Investment Trust Fund. Certain specific investments have been made by the County, as directed by external depositors. This investment activity occurs separately from the County's investment pool and is reported in the Specific Investment Trust Fund.
57

58
COUNTY OF LOS ANGELES NOTES TO THE BASIC FINANCIAL STATEMENTS-Continued
4. CASH AND INVESTMENTS-Continued
Investments-Continued
In accordance with the Governmental Accounting Standards Board Statement No. 3 "Deposits with Financial Institutions, Investments (including Repurchase Agreements), and Reverse Repurchase Agreements," the County's investments and investments of the Pension Trust Fund are categorized separately below to give an indication of the level of credit risk assumed by the entity at year-end. Category 1 includes investments that are insured or registered or for which the securities are held by the County or its agent in the agent's nominee name, with subsidiary records listing the County as the legal owner. Category 2 includes uninsured and unregistered investments for which the securities are held by the counterparty's trust department or agent in the County's name. Category 3 includes uninsured and unregistered investments for which the securities are held by the counterparty, or by the counterparty's trust department or agent but not in the County's name.
County pooled and other investments (excluding Pension Trust Fund other investments) are categorized as follows at June 30, 2003 (in thousands):
I
Category 1 _2_
U.S. Government securities Negotiable certificates of deposit Commercial paper
$10,921,044
Bankers acceptances Corporate and deposit notes Municipal/school bonds Repurchase agreements Los Angeles County securities
983,747 3,286,504
172,285 242,370
5,549 486,906
33 997 $16132 402
Investments not considered securities for purposes of custodial risk classification:
Investment in money market funds Investment in State and local agency investment funds
1st and 2nd Mortgages Total
3 Fair
Value
$ 10,921,044 983,747
3,286,504 172,285 242,370
5,549 486,906
33,997
240,265
121,239 1 943
$ 16 495 849
Pension Trust Fund investments are reported in the basic financial statements at fair value and are categorized as follows at June 30, 2003 (in thousands):
Category Fair 1 2 3 Value
U.S. Government and agency instruments $ 1,689,183 $ 1,689,183 Domestic stocks and convertibles 7,877,157 7,877,157 Global stocks, bonds, and convertibles 5,024,778 5,024,778 Domestic corporate bonds 3,575,369 3,575,369 Short term corporate and government
investments 1,417,584 1,417,584 Private placement bonds 412,080 412,080
$ 19 996 151

COUNTY OF LOS ANGELES NOTES TO THE BASIC FINANCIAL STATEMENTS-Continued
4. CASH AND INVESTMENTS-Continued
Investments-Continued
Investments not considered securities for purposes of custodial risk classification:
Real estate and title holdings Alternative assets Mortgages
Investments held by brokerdealer under securities loans with cash collateral:
Stocks Government bonds Corporate bonds
Securities lending cash collateral -Invested in short-term fixed income fund
Total
Category 1 --'2"--_ 3
Fair Value
3,143,473 1,269,916
331,778
728,475 1,244, 109
344,223
2,485,458 $ 29 543 583
The Pension Trust Fund portfolio contained no concentration of investments in any one organization (other than those issued or guaranteed by the U.S. Government) that represents 5% or more of the total investment portfolio.
The County has not provided nor obtained any legally binding guarantees during the fiscal year ended June 30, 2003 to support the value of shares in the Treasurer's investment pool.
Fair value fluctuates with interest rates, and increasing rates could cause fair value to decline below original cost. County management believes the liquidity in the portfolio is more than adequate to meet cash flow requirements and to preclude the County from having to sell investments below original cost for that purpose.
A summary of investments held by the County Treasurer is as follows (in thousands}:
U. S. Government securities Negotiable certificates of deposit Bankers acceptances Commercial paper Corporate and deposit notes Los Angeles County securities Investments in money market funds Deposits
Interest Rate % Fair Value Principal Range Maturity Range
$ 9,448,109 850,132 172,285
3,286,504 242,370
33,997 18,358 69,351
$ 9,423,602 850, 139 172,305
3,286,861 242,253
33,997 18,358 69,351
$ 14,121 106 $14 096.866
0.89% - 9.25% 07/01/03 - 12/01/08 1.02% - 1.24% 07/07/03 - 06/23/04 0.96% 07/18/03 0.88% -1.32% 07/01/03- 08/25/03 1.23% -1.52% 07/08/03 - 03/15/05
59
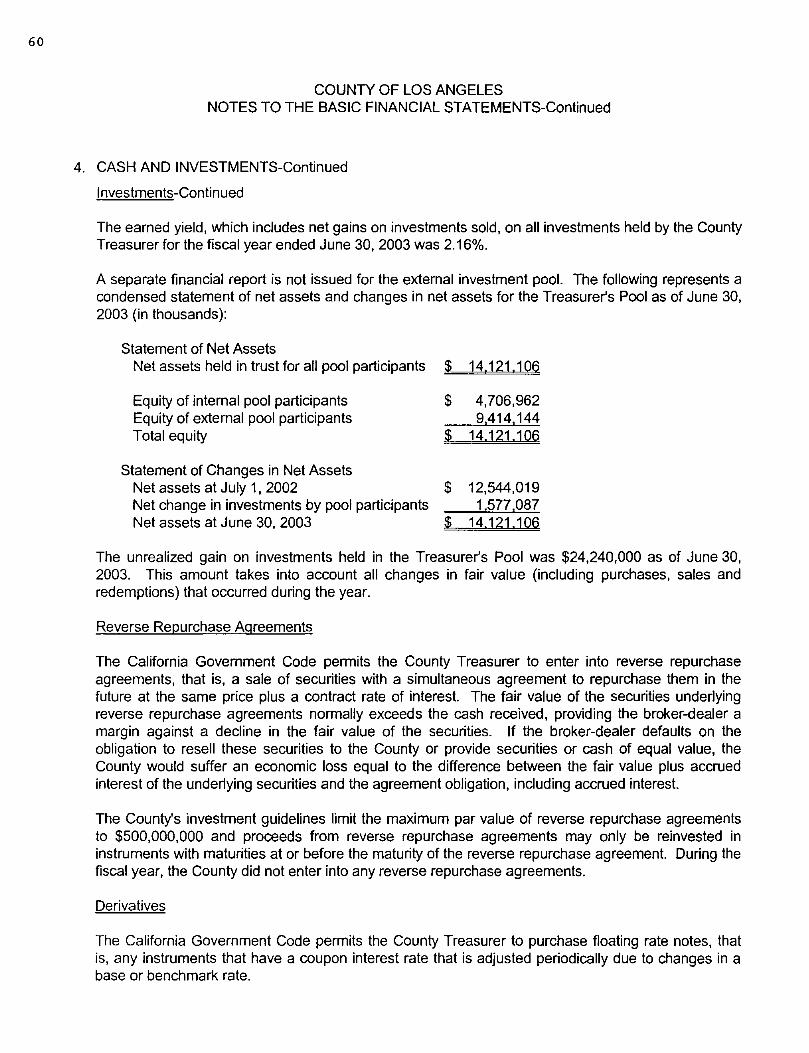
60
COUNTY OF LOS ANGELES NOTES TO THE BASIC FINANCIAL STATEMENTS-Continued
4. CASH AND INVESTMENTS-Continued
Investments-Continued
The earned yield, which includes net gains on investments sold, on all investments held by the County Treasurer for the fiscal year ended June 30, 2003 was 2.16%.
A separate financial report is not issued for the external investment pool. The following represents a condensed statement of net assets and changes in net assets for the Treasurer's Pool as of June 30, 2003 (in thousands):
Statement of Net Assets Net assets held in trust for all pool participants $ 14121106
Equity of internal pool participants $ 4,706,962 Equity of external pool participants 9414144 Total equity $ 14121106
Statement of Changes in Net Assets Net assets at July 1, 2002 $ 12,544,019 Net change in investments by pool participants 1577087 Net assets at June 30, 2003 ~ :14 :12:1 :lQ6
The unrealized gain on investments held in the Treasurer's Pool was $24,240,000 as of June 30, 2003. This amount takes into account all changes in fair value (including purchases, sales and redemptions) that occurred during the year.
Reverse Repurchase Agreements
The California Government Code permits the County Treasurer to enter into reverse repurchase agreements, that is, a sale of securities with a simultaneous agreement to repurchase them in the future at the same price plus a contract rate of interest. The fair value of the securities underlying reverse repurchase agreements normally exceeds the cash received, providing the broker-dealer a margin against a decline in the fair value of the securities. If the broker-dealer defaults on the obligation to resell these securities to the County or provide securities or cash of equal value, the County would suffer an economic loss equal to the difference between the fair value plus accrued interest of the underlying securities and the agreement obligation, including accrued interest.
The County's investment guidelines limit the maximum par value of reverse repurchase agreements to $500,000,000 and proceeds from reverse repurchase agreements may only be reinvested in instruments with maturities at or before the maturity of the reverse repurchase agreement. During the fiscal year, the County did not enter into any reverse repurchase agreements.
Derivatives
The California Government Code permits the County Treasurer to purchase floating rate notes, that is, any instruments that have a coupon interest rate that is adjusted periodically due to changes in a base or benchmark rate.

COUNTY OF LOS ANGELES NOTES TO THE BASIC FINANCIAL STATEMENTS-Continued
4. CASH AND INVESTMENTS-Continued
Derivatives-Continued
The County's investment guidelines limit the amount of floating rate notes to 10% of the Los Angeles County Treasury Pool portfolio and prohibit the purchase of inverse floating rate notes and hybrid or complex structured investments. As of June 30, 2003, there were approximately $1,226,219,000 in floating rate notes.
LACERA utilizes forward currency contracts to control currency exposure and facilitate the settlement of international security purchase and sale transactions. Included in net investment income are gains and losses from foreign currency transactions. The net foreign currency gain in fiscal year 2003 was $34,000,000. At June 30, 2003, forward currency contracts receivable and payable totaled $208,000,000 and $207,000,000, respectively.
Securities Lending Transactions
LACERA, as the administering agency for the Pension Trust Fund, is authorized to participate in a securities lending program under policies adopted by the LACERA Board of Investments. This program is an investment management activity that mirrors the fundamentals of a loan transaction in which a security is used as collateral. Securities are lent to brokers and dealers (borrowers) and LACERA receives cash as collateral. LACERA pays the borrower interest on the collateral received and invests the collateral with the goal of earning a higher yield than the interest rate paid to the borrower.
LACERA's program is managed by one principal borrower and two agent lenders. Under exclusive borrowing and lending arrangements, securities on loan must be collateralized with a fair value of 102%, for U.S. securities, and 105%, for international securities, of the borrowed securities. Collateral is marked to market daily. Cash collateral is invested by the agent lenders in short-term, liquid instruments.
Under the terms of the lending agreements, the two agent lenders have agreed to hold LACERA harmless for borrower default from the loss of securities or income, or from any litigation arising from these loans. The principal borrower's agreement entitles LACERA to terminate all loans upon the occurrence of default and purchase a like amount of "replacement securities." Either LACERA or the borrower can terminate all loans on securities on demand.
At year end, LACERA had no credit risk exposure to borrowers because the collateral exceeded the amount borrowed. As of June 30, 2003, there were no violations of legal or contractual provisions. LACERA had no losses on securities lending transactions resulting from the default of a borrower for the year ended June 30, 2003.
Securities on loan at year-end, which include stocks and government and corporate bonds, are maintained in LACERA's financial records and are presented as unclassified in the preceding schedule of custodial credit risk. A corresponding liability is recorded for the fair value of the cash collateral received.
61

62
COUNTY OF LOS ANGELES NOTES TO THE BASIC FINANCIAL STATEMENTS-Continued
4. CASH AND INVESTMENTS-Continued
5.
Securities Lending Transactions-Continued
As of June 30, 2003, the fair value of securities on loan was$ 2,327,000,000. The value of the cash collateral received for those securities was $2,485,000,000 and the non-cash collateral was $11,000,000. Securities lending assets (Other Investments) and liabilities (Other Payables) of $2,485,458,000 are recorded in the Pension Trust Fund. Pension Trust Fund income, net of expenses, from securities lending was $7,681,000 for the year ended June 30, 2003.
For the year ended June 30, 2003, the Los Angeles County Treasury Pool did not enter into any securities lending transactions.
Summary of Deposits and Investments
Following is a summary of the carrying amount of deposits and investments at June 30, 2003 (in thousands):
Pension County Trust Fund Total
Deposits $ 73,690 $ 45,750 $ 119,440 Investments 16,495,849 29,543,583 46,039,432
$ 16 569 539 $ 29 589 333 $ 46 158 872
CAPITAL ASSETS
Capital assets activity for the year ended June 30, 2003 are as follows (in thousands):
Balance Balance July 1, 2002 Additions Deletions June 30, 2003
Governmental Activities
Capital assets, not depreciated: Land $ 273,701 $ 5,686 $ (3, 148) $ 276,239 Construction in progress-buildings and
improvements 319,955 114,011 (133,045) 300,921 Construction in progress-infrastructure 56,756 42,804 (40, 158) 59402
Subtotal 650,412 162,501 {176,351) 636,562
Capital assets, depreciated: Buildings and improvements 3,245,093 144,554 (21,501) 3,368,146 Equipment 699,276 148,252 (111,597) 735,931 Infrastructure 12,910 85,577 98487
Subtotal 3,957,279 378,383 (133,098) 4,202,564

63
COUNTY OF LOS ANGELES NOTES TO THE BASIC FINANCIAL STATEMENTS-Continued
5. CAPITAL ASSETS-Continued
Balance Balance July 1. 2002 Additions Deletions June 30, 2003
Governmental Activities-Continued
Less accumulated depreciation for: Buildings and improvements (1,031,662) (61,901) 5,541 (1,088,022) Equipment (505,480) (74,260) 69,233 (510,507) Infrastructure (803) (4,787) (5,590)
Subtotal (1,537,945) (140.948) 74 774 (1,604,119)
Total capital assets, being depreciated, net 2,419,334 237,435 (58,324) 2,598,445
Governmental activities capital assets, net $3 069,746 $399 936 $(234 675) $ 3 235 007
Business-type Activities
Capital assets, not depreciated: Land $ 118,854 $ (1,427) $ 117,427 Construction in progress-buildings and
improvements 150,956 ~ 60,062 (2,406) 208,612 Subtotal 269,810 60,062 (3,833) 326,039
Capital assets, being depreciated: Buildings and improvements 1,081,967 10,154 (768) 1,091,353 Equipment 221,004 24,255 (13,811) 231,448
Subtotal 1,302,971 34,409 (14,579) 1,322,801
Less accumulated depreciation for: Buildings and improvements (598,139) (20,720) 5,299 (613,560) Equipment (184,329) (12,622) 2,783. (194, 168}
Subtotal (782,468) (33,342) 8,082 (807,728)
Total capital assets, being depreciated, net 520,503 1 067 (6,497} 515,073
Business-type activities capital assets, net 790,313 61.129 (10 330\ 841112
Total Capital Assets, Net $3,86Q,Ql.'!9 $46:1 Q65 $£245 QQ5) $ 4,QZ6,:l:l9

64
COUNTY OF LOS ANGELES NOTES TO THE BASIC FINANCIAL STATEMENTS-Continued
5. CAPITAL ASSETS-Continued
Depreciation Expense
Depreciation expense was charged to functions/programs of the primary government as follows (in thousands):
Governmental activities: General government Public protection, including depreciation of infrastructure assets . Public ways and facilities, including depreciation of infrastructure assets Health and sanitation Public assistance Education Recreation and cultural services Capital assets held by the County's internal service
funds are charged to the various functions based on their usage of the assets
Total depreciation expense, governmental activities
Business-type activities: Hospitals Aviation Waterworks Community Development Commission Capital assets held by the County's internal service
funds are charged to the various functions based on their usage of the assets
Total depreciation expense, business-type activities
Discretely Presented Component Unit
$ 10,590 77,326
2,605 5,573 8,833 1,524
10,452
24,045 $ HQ948
$ 13,095 1,323 3,000 6,624
9,300 $ 33,342
Capital assets activity for the Children and Families First Commission component unit for the year ended June 30, 2003 was as follows (in thousands):
Balance Balance July 1. 2002 Additions Deletions June 30, 2003
Capital assets, depreciated: Buildings and improvements $ 13,867 $ 13,867 Equipment $ 129 77 ~ (55) 151
Subtotal 129 13 944 (55) 14 018 Less accumulated depreciation for:
Buildings and improvements (5,368) (5,368) Equipment (55) (25) 55 (25)
Subtotal (55) (5,393) 55 (5,393)
Component unit capital assets, net $ Z4 $ 8 551 $ $ 8625

COUNTY OF LOS ANGELES NOTES TO THE BASIC FINANCIAL STATEMENTS-Continued
6. PENSION PLAN
Plan Description
The County pension plan is administered by the Los Angeles County Employees Retirement Association (LACERA) which was established under the County Employees' Retirement Law of 1937. It provides benefits to employees of the County and the following additional entities that are not part of the County's reporting entity:
Little Lake Cemetery District Local Agency Formation Commission Los Angeles County Office of Education South Coast Air Quality Management District
New employees of the latter two agencies are not eligible for LACERA benefits.
LACERA is technically a cost sharing, multi-employer defined benefit plan. However, because the non-County entities are extremely immaterial to its operations, the disdosures herein are made as if LACERA was a single employer defined benefit plan. LACERA provides retirement, disability, death benefits and cost of living adjustments to eligible employees. Benefits are authorized in accordance with the California Constitution, the County Employees' Retirement Law, the bylaws, procedures and policies adopted by LACERA's Boards of Retirement and Investments and Board of Supervisors' resolutions. ·
LACERA issues a stand-alone financial report which is available at its offices located at Gateway Plaza, 300 N. Lake Avenue, Pasadena, California 91101-4199.
Funding Policy
LACERA has seven benefit tiers known as A, B, C, D and E, and Safety A and B. All tiers except E are employee contributory. Tier E is employee non-contributory. New general employees are eligible for tiers D or E at their discretion. New safety members are only eligible for Safety B. Rates for the tiers are established in accordance with State law by LACERA's Boards of Retirement and Investments and the County Board of Supervisors.
The following employer rates were in effect for 2002-2003:
General Members Safety Members
A
14.85% 21.86%
B c
8.22% 7.88% 18.79%
D E
7.94% 7.64%
The rates were determined by the actuarial valuation performed as of June 30, 2001 and are the same as those used to calculate the annual required contribution (ARC).
Employee rates vary by the option and employee entry age from 5% to 15% of their annual covered salary.
During 2002-2003, the County did not pay LACERA the full amount of the ARC. LACERA applied $194,213,000 in excess earnings reserves towards the County's required contribution.
65

66
COUNTY OF LOS ANGELES NOTES TO THE BASIC FINANCIAL STATEMENTS-Continued
6. PENSION PLAN-Continued
Annual Pension Cost and Net Pension Obligation
The County's annual pension cost and net pension obligation, computed in accordance with GASB 27, for 2002-2003 were as follows (in thousands):
Annual required contribution (ARC): County Non County entities
Total ARC Interest on net pension obligation Annual pension cost Contributions made:
County Non County entities
Total contributions Cost in excess of contributions Net pension obligation (asset), July 1, 2002 Net pension obligation (asset), June 30, 2003
Trend Information (in thousands)
Fiscal Year Annual Pension Percentage of APC Ended Cost (APC) Contributed
June 30, 2001 $ 299,849 64.6% June 30, 2002 344,397 75.2% June 30, 2003 455,452 71.3%
$ 518,835 87
518,922 (63,470) 455,452
324,622 87
324,709 130,743
(793,378) ~ (662 635)
Net Pension Obligation (Asset)
$ (878,891) (793,378) (662,635)
The annual required contribution was calculated based upon an actuarial valuation performed as of June 30, 2001 using the entry age normal method. The valuation assumed an annual investment rate of return of 8%, and projected salary increases ranging from 4.78% to 10.24%, with both assumptions including a 4% inflation factor. The valuation also assumed post-retirement benefit increases of between 0% and 3%, in accordance with the provisions of the specific benefit options. The actuarial value of assets was determined utilizing a three-year smoothed method based on the difference between the expected market value and the actual market value of assets as of the valuation date.
The June 30, 2002 valuation determined the funding ratio to be 99.4% and recognized an unfunded actuarial accrued liability (UAAL) of $175 million. The County contribution rate (effective for the 2003-04 fiscal year) was, therefore, increased by .21 % of payroll (using the level percentage of payroll amortization method, over a 30-year open period) over the normal cost rate of 10.03%.
LACERA uses the accrual basis of accounting. Member and employer contributions are recognized in the period in which the contributions are due, and benefits and refunds are recognized when payable in accordance with the terms of each plan.

COUNTY OF LOS ANGELES NOTES TO THE BASIC FINANCIAL STATEMENTS-Continued
6. PENSION PLAN-Continued
Annual Pension Cost and Net Pension Obligation-Continued
Because it is negative, the net pension obligation represents an asset. Accordingly, a pension asset, "Net Pension Obligation," has been recognized in the government-wide financial statements and in the proprietary funds financial statements.
Pension Obligation Bonds and Certificates
During 1994-95 the County sold approximately $1,965,230,000 in par value pension bonds and utilized the proceeds to fund LACERA. A portion of the bonds ($1,365,230,000 ) were fixed rate. The remaining $600,000,000 were variable rate bonds, which were restructured into fixed rate bonds during 1995-96.
In conjunction with the 1994-95 issuance of the pension bonds, the County entered into debt service advance agreements. Under the agreements, the County received $79,022,000 in exchange for future interest that the County would have earned on deposits with the trustee between the time the County is required to pay debt service payments to the trustee and the time the trustee pays the bondholders. These proceeds have been recorded as deferred revenue and are being amortized over the life of the bonds on the basis of annual debt service requirements. As of June 30, 2003, the unamortized balance was $42,891,000.
The outstanding principal balance of the bonds (including accreted interest on deep discount bonds} as of June 30, 2003 was $1,694,958,000. The bonds have interest rates varying from 6.02% to 9.19%.
In 1986, the County issued $461,493,000 in fixed rate pension obligation certificates to purchase annuity contracts to provide pension benefits to a specified group of LACERA members. Variable rate bonds totaling $327,400,000 were issued in May 1996 to advance refund $327,405,000 of the certificates. Interest rates on the bonds are reset weekly and varied during 2002-2003 from 0.75% to 1.80%. The fixed rate certificates which remain outstanding have rates varying from 6.2% to 6.9%. At June 30, 2003, the total outstanding principal (including accreted interest) for the refunding bonds and remaining fixed rate certificates was $ 272,233,000 and has been included in the financial statements as pension bonds payable.
For the year ended June 30, 2003, the combined principal and interest payments for both the bonds and certificates were $236,248,000 and $62,456,000, respectively. For governmental activities, the total debt service was $221,346,000. For business-type activities, the total debt service was $77,358,000. At June 30, 2003, the total outstanding principal, including accreted interest of $452,741,000 on both bonds and certificates, was $1,967,191,000.
67

68
COUNTY OF LOS ANGELES NOTES TO THE BASIC FINANCIAL STATEMENTS-Continued
6. PENSION PLAN-Continued
Pension Obligation Bonds and Certificates-Continued
The following is a summary of future funding requirements for all outstanding pension bonds and certificates (in thousands):
Year Ending Governmental Activities Business-tyQe Activities June 30 Principal Interest Principal Interest
2004 $ 171,991 62,257 $ 60,109 21,758 2005 200,631 48,596 70,118 16,983 2006 231,955 32,503 81,065 11,360 2007 140,971 141,524 49,268 49,461 2008 115,664 167,121 40,423 58,407 2009-2013 261,029 517,514 91,226 180,864
Total ~1,122,241 969 5:15 $ 392,209 338 833
Accretions 335,491 117,250
Total Pension Bonds Payable $1457732 $ 509.459
SwaQ Transaction Related to Pension Bonds
In conjunction with the issuance of $327,400,000 of variable pension refunding bonds in 1996, the County entered into a swap transaction to create a synthetic fixed interest rate. The County also received an up-front payment of $19,036,000 from the counterparty.
The bonds, and the related swap agreement, mature on June 30, 2007. As of June 30, 2003, the swap's notional amount of $230,000,000 was the same as the principal amount of the outstanding bonds. Under the swap, the County is obligated to pay the counterparty a fixed rate of 6.48% and receives a variable payment based on the market interest rate of the variable bonds. The market interest rate is reset on a weekly basis and the rate as of June 30, 2003 was 0.85%.
"Credit risk" refers to the risk that the counterparty will not fulfill its obligations. As of June 30, 2003, the County was not exposed to credit risk because the swap transaction had a negative fair value of $31,555,000. However, should interest rates change, and the fair value of the swap becomes positive, the County would be exposed to credit risk in the amount of the derivative's fair value. The swap counterparty was rated Aaa and AAA by Moody's and Standard and Poor's, respectively. If the counterparty's credit rating falls below Aa3 or AA-, or if the rating is suspended or withdrawn, the fair value of the swap will be fully collateralized by either U.S. Government or Government Guaranteed Agency securities. Collateral would be posted with a third-party trustee.

COUNTY OF LOS ANGELES NOTES TO THE BASIC FINANCIAL STATEMENTS-Continued
6. PENSION PLAN-Continued
Swap Transaction Related to Pension Bonds-Continued
The following is a summary of future funding requirements related to the variable rate pension bonds, net of swap payments associated with those bonds (in thousands):
Year Ending Variable-Rate Bonds Interest Rate June 30 Principal Interest Swaps, Net Total
2004 $ 45,300 $ 1,955 $ 12,949 $ 60,204 2005 52,900 1,570 10,399 64,869 2006 61,300 1,120 7,421 69,841 2007 70 500 599 3,969 75,068 Total $ 230 000 $ 5,244 $ 34738 $ 269 982
Post-Retirement Benefits
In addition.to providing pension benefits, the County provides funding for certain health care benefits for all retired employees and their eligible dependents or survivors. There are approximately 47,000 retirees presently eligible to receive such benefits. LACERA is responsible for administering the benefits to the retirees.
The amount of funding required for health care benefits is dependent on the number of completed years of retirement service credited to the retiree by LACERA upon retirement; it does not include reciprocal service in another retirement system. This ranges from 40% of the benchmark plan cost with ten completed years of service to 100% of the benchmark plan cost with 25 or more completed years of service. In general, each completed year of service after ten years reduces the member's cost by 4%. Service includes all service on which the member's retirement allowance was based.
Prior to 1996-97, the County fully subsidized the funding requirements for these benefits. In 1996-97, the County entered into an agreement with LACERA to establish an Internal Revenue Code Section 401(h} Account for use in connection with the County's payment of retiree health care costs. This agreement, which remains effective until terminated by either party or in the event excess earnings cease to be available, permits the use of LACERA excess earnings reserves to reduce the County's funding requirement for these benefits.
The cost of retiree health care is recognized when the County makes payments to LACERA. For the year ended June 30, 2003, the amounts of such payments were approximately $136,032,000, for governmental activities and $29, 131,000 for business-type activities. These amounts exclude $53,403,000 of LACERA excess earnings reserves, which were utilized to offset a portion of the total funding requirements.
69

70
COUNTY OF LOS ANGELES NOTES TO THE BASIC FINANCIAL STATEMENTS-Continued
7. LEASES
Operating Leases
The following is a schedule of future minimum rental payments required under operating leases entered into by the County that have initial or remaining noncancelable lease terms in excess of one year as of June 30, 2003 (in thousands):
Year Ending June 30
2004 2005 2006 2007 2008 2009-2013 2014-2018 2019-2023 2024-2028 Total
Governmental Activities
$
$
77,013 66,210 55,879 48,884 41,536 77,742 13,604
37 4
380 909
Rent expenditures related to operating leases were $73,684,000 for the year ended June 30, 2003.
Capital Leases
The following is a schedule of future minimum lease payments under capital leases together with the present value of future minimum lease payments as of June 30, 2003 (in thousands):
Governmental Business-type Year Ending June 30 Activities Activities
2004 $ 22,756 $ 499 2005 21,453 464 2006 20,634 430 2007 20,087 238 2008 19,961 149 2009-2013 47,272 292 2014-2018 26,948 2019-2023 24,939 2024-2028 24,939 2029-2033 16, 130 2034-2038 77 Total 245,196 2,072 Less: Amount representing
interest 124,926 311 Present value of future minimum
lease payments $ 12Q 2ZQ $ 1,Z61
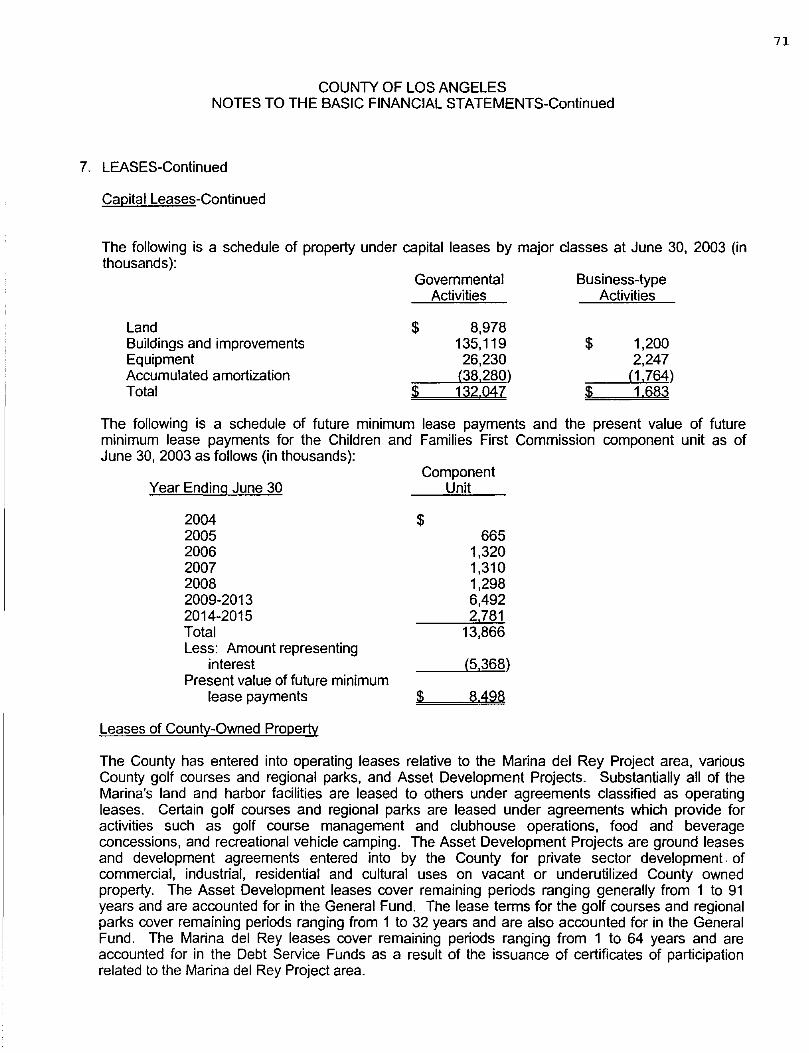
COUNTY OF LOS ANGELES NOTES TO THE BASIC FINANCIAL STATEMENTS-Continued
7. LEASES-Continued
Capital Leases-Continued
The following is a schedule of property under capital leases by major classes at June 30, 2003 (in thousands):
Land Buildings and improvements Equipment Accumulated amortization Total
Governmental Activities
$
$
8,978 135, 119 26,230
(38,280) 132 047
Business-type Activities
$
$
1,200 2,247
(1.764) 1 683
The following is a schedule of future minimum lease payments and the present value of future minimum lease payments for the Children and Families First Commission component unit as of June 30, 2003 as follows (in thousands):
Year Ending June 30
2004 2005 2006 2007 2008 2009-2013 2014-2015 Total Less: Amount representing
interest Present value of future minimum
lease payments
Leases of Countv-Owned Property
Component Unit
$
$
665 1,320 1,310 1,298 6,492 2 781
13,866
(5,368)
8.498
The County has entered into operating leases relative to the Marina del Rey Project area, various County golf courses and regional parks, and Asset Development Projects. Substantially all of the Marina's land and harbor facilities are leased to others under agreements classified as operating leases. Certain golf courses and regional parks are leased under agreements which provide for activities such as golf course management and clubhouse operations. food and beverage concessions, and recreational vehicle camping. The Asset Development Projects are ground leases and development agreements entered into by the County for private sector development. of commercial, industrial, residential and cultural uses on vacant or underutilized County owned property. The Asset Development leases cover remaining periods ranging generally from 1 to 91 years and are accounted for in the General Fund. The lease terms for the golf courses and regional parks cover remaining periods ranging from 1 to 32 years and are also accounted for in the General Fund. The Marina del Rey leases cover remaining periods ranging from 1 to 64 years and are accounted for in the Debt Service Funds as a result of the issuance of certificates of participation related to the Marina del Rey Project area.
71

72
COUNTY OF LOS ANGELES NOTES TO THE BASIC FINANCIAL STATEMENTS-Continued
7. LEASES-Continued
Leases of County-Owned Property-Continued
The following is a schedule of future minimum rental receipts on noncancelable leases as of June 30, 2003 (in thousands):
Year Ending June 30
2004 2005 2006 2007 2008 Thereafter Total
Governmental Activities
$ 32,825 32,837 32,683 32,632 32,785
1,040.993 $ 1.204 755
The following is a schedule of rental income for these operating leases for the year ended June 30, 2003 (in thousands):
Minimum rentals Contingent rentals
Total
8. LONG-TERM OBLIGATIONS
Governmental Activities
$ 32,048 18 482
$ 50 530
Long-term obligations of the County consist of bonds, notes and loans payable, pension bonds payable (see Note 6), capital lease obligations (see Note 7) and other liabilities which are payable from the General, Special Revenue, Debt Service, Enterprise and Internal Service Funds.
A summary of bonds, notes and loans payable recorded within governmental activities follows (in thousands):
Los Angeles County General Obligation Detention Facilities Bonds, 6.5 % to 7.875%
Los Angeles County Flood Control District Storm Drain General Obligation Bonds, 2.5% to 8.5%
Los Angeles County Flood Control District Refunding Bonds 2.5% to 5.0%
Regional Park and Open Space District Bonds (issued by Public Works Financing Authority), 4.2% to 6%
Original Amount of Debt
$ 96,000
132,090
143,195
510,185
Balance June 30. 2003
$ 30,225
10,955
143, 195
394,735

COUNTY OF LOS ANGELES NOTES TO THE BASIC FINANCIAL STATEMENTS-Continued
8. LONG-TERM OBLIGATIONS-Continued
Community Development Commission Notes Payable, 3.82% to 7.91%
NPC Bonds and Bond Anticipation Notes, 4.6% to 8.97%
Marina del Rey Certificates of Participation, 4.75% to 6.5%
Marina del Rey Loans Payable, 4.5% to 4.70% Public Buildings Certificates of Participation,
2.8% to 7.75%
Total
Original Amount of Debt
43,045
88,790
186,491 23,000
1,583, 114
$ 2 805 9:1Q
Balance June 30, 2003
31,006
34,041
97,229 22,823
1,096,949
$ :I 86:1 :158
A summary of bonds and notes recorded within business-type activities follows (in thousands):
NPC Bonds and Bond Anticipation Notes, 4.6% to 8.9%
Public Buildings Certificates of Participation and Commercial Paper, 2.8% to 7.0%
Waterworks District Bonds, 3.3% to 8.0% Community Development Commission
Mortgage Notes, 0.00% to 7.3%
Total
General Obligation Bonds
Original Amount of Debt
$
$
49,945
567,567 1,335
11 384
63Q 23:1
Balance June 30, 2003
$ 19,149
393,298 297
7 804
$ 420.548
The County issued general obligation bonds in 1986 to finance detention facilities. The Flood Control District issued general obligation bonds to finance flood control projects. Waterworks Districts issued general obligation bonds to finance water system projects. Revenue for retirement of such bonds is provided from ad valorem taxes on property within the jurisdiction of the governmental unit issuing the bonds. Principal and interest requirements on general obligation long-term debt are as follows (in thousands):
Year Ending Governmental Activities Business-tv~ Activities June 30 Principal Interest Principal Interest
2004 $ 11,555 2,865 $ 58 23 2005 11, 155 2, 117 58 20 2006 8,995 1,379 45 15 2007 9,105 704 15 12 2008 370 9 17 11 2009-2013 104 26 2014-2018 Total $ 41 :180 7 QZ4 $ 29Z :IQZ
73

74
COUNTY OF LOS ANGELES NOTES TO THE BASIC FINANCIAL STATEMENTS-Continued
8. LONG-TERM OBLIGATIONS-Continued
Assessment Bonds
The Regional Park and Open Space District issued voter approved assessment bonds in 1997 to fund the acquisition, restoration, improvement and preservation of beach, park, wildlife and open space resources within the District. As discussed in Note 3, the bonds were purchased by the Public Works Financing Authority and similar bonds were issued as a public offering. The bonds issued by the Authority are payable from the proceeds of annual assessments levied on parcels within the District's boundaries.
Principal and interest requirements on assessment bonds are as follows (in thousands):
Year Ending June 30
2004 2005 2006 2007 2008 2009-2013 2014-2018 2019-2023
Total
Certificates of Participation
Governmental Activities Principal Interest
$ 18,525 19,565 20,475 21,475 22,630
133,085 127,255 31,725
$ 394 735
20,183 19,208 18,252 17,175 15,989 59,390 21,312
1 605 173.114
The County has issued certificates of participation through various financing entities that have been established by, and are component units of, the County. The debt proceeds have been used to finance the acquisition of County facilities and equipment. The County makes annual payments to the financing entities for the use of the property and the debt is secured by the underlying capital assets that have been financed. Principal and interest requirements on certificates of participation are as follows (in thousands):
Year Ending June 30
2004 2005 2006 2007 2008 2009-2013 2014-2018 2019-2023 2024-2028 2029-2033 2034-2038
Total
Governmental Activities Principal Interest
$ 97,855 99,394 90,533 90,990 94,691
368,965 162,869 120,988 75,025 67,235
7 490 $ 1 276,035
81,112 77,374 54,020 52,032 48,258
193,565 143,264 96,857 30,856 10, 118
197 787 653
Business-type Activities Principal Interest
$ 32,814 32,011 31,387 23,076 23,843 75,876 54,440
$ 273 447
13,486 11,888 10,284 8,603 7,330
23,854 5,085
80 530

COUNTY OF LOS ANGELES NOTES TO THE BASIC FINANCIAL STATEMENTS-Continued
8. LONG-TERM OBLIGATIONS-Continued
Notes. Loans. and Commercial Paper
Bond Anticipation Notes (BANS) are issued by the Los Angeles County Capital Assets Leasing Corporation (Equipment Acquisition Internal Service Fund) to provide interim financing for equipment purchases. BANS are purchased by the County Treasury Pool and are payable within five years. In addition, the BANS are issued with a formal agreement that, in the event they are not liquidated by the five-year period, they convert to capital leases with a three-year term secured by County real property.
Community Development Commission notes are secured by annual contributions from the United States Department of Housing and Urban Development (HUD) and housing units constructed with the note proceeds. Commission mortgage notes are secured by revenues from the operation of housing projects and from housing assistance payments from HUD.
Marina del Rey loans were obtained from the California Department of Boating and Waterways for the restoration and renovation of the marina seawall. The loans are secured by Marina del Rey lease revenue and by Los Angeles County Music Center parking revenues.
Tax-exempt commercial paper {TECP) was initially issued by the County in July 1997 to redeem outstanding BANS which were issued to fund various Hospital Enterprise Funds' construction projects and to provide a future source of interim funding for capital projects pending long-term financing. Repayment of the TECP is secured by a letter of credit and a sublease of twenty-one County-owned properties. Pursuant to the underlying leases, the County is able to amortize the remaining TECP over the useful life of the underlying assets, but plans to retire the remaining TECP over an eight-year period. The term of individual commercial paper notes may not exceed 270 days.
Principal and interest requirements on notes, loans, and commercial paper are as follows (in thousands):
Year Ending Governmental Activities Business-tv12e Activities June 30 Princi12al Interest Princi12al Interest
2004 $ 5,949 2,636 $134,135 327 2005 11,340 2,547 5,970 288 2006 1,748 2,459 615 246 2007 1,714 2,371 660 200 2008 1,793 2,281 710 151 2009-2013 10,241 9,896 1,535 157 2014-2018 11,226 6,832 993 2019-2023 11,645 3,363 2024-2028 6,330 1,204 2029-2033 1,442 65 Indeterminate maturity 2.186
Total $ 63 428 33654 $H6 804 1 369
75

76
COUNTY OF LOS ANGELES NOTES TO THE BASIC FINANCIAL STATEMENTS-Continued
8. LONG-TERM OBLIGATIONS-Continued
Summary-All Future Principal. Interest and Accretions
Following summarizes total future principal and interest requirements for the various debt issues referenced above (in thousands):
Debt Type
General Obligation Bonds Assessment Bonds Certificates of Participation Notes, Loans, and
Commercial Paper Subtotal
Add: Accretions
Total Bonds and Notes Payable
$
Governmental Activities Principal Interest
41,180 7,074 394,735 173, 114
1,276,035 787,653
63,428 33 654 1,775,378 :l QQ:l 495
85,780
$ :l 86:1 :158
Business-type Activities Principal Interest
$ 297
273,447
146.804 420,548
$ 42Q 548
107
80,530
1.369 82 QQ6
Long-term liabilities recorded in the Government-wide Statement of Net Assets include accreted interest on zero coupon bonds for Public Buildings related to governmental activities.
Advance Refunding of Debt
On December 2, 2002, the County issued $17,130,000 in lease revenue refunding bonds, maturing on various dates between 2011 and 2016. These bonds with an average interest rate of 5.39%, were issued to refund the outstanding principal amount of $22,650,000 of bonds issued in 1992 at an interest rate of 6%.
On January 30, 2003, the County issued $143, 195,000 in refunding revenue bonds, maturing on various dates between 2004 and 2017. These bonds, with an average interest rate of 3.34%, were issued to refund the outstanding principal amount of $147,565,000 of capital construction and refunding bonds issued in 1993 at an interest rate of 5%.
U.S. Government securities were purchased and deposited in an irrevocable trust with an escrow agent to provide for all future debt service payments on the refunded bonds. Accordingly, the refunded bonds were considered to be defeased and the liabilities for those bonds were removed from the Government-Wide Statement of Net Assets - governmental activities. The refunded bonds were fully redeemed by the escrow agent prior to June 30, 2003. Specific disclosures related to each refunding issue are as follows (in thousands):
December 2002 January 2003 Refunding Refunding
Proceeds of refunding bonds issued $ 17, 130 $ 143,195
Prior years' bond reserves and /or premiums 6 400 8 513
Deposit to escrow $ 23,53Q $ :15:1 ZQ8
Future years' aggregate debt service payment reduction $ 4,170 $ 11,780
Present value savings (economic gain) $ 856 $ 9,295

COUNTY OF LOS ANGELES NOTES TO THE BASIC FINANCIAL STATEMENTS-Continued
8. LONG-TERM OBLIGATIONS-Continued
Advance Refunding of Debt-Continued
The difference between the reacquisition price of the refunded debt and the net carrying amount of the refunded debt was immaterial and has not been amortized.
Bonds Defeased in Prior Years
In prior years, various debt obligations, consisting of bonds and certificates of participation, were defeased by placing the proceeds of refunding bonds in an irrevocable trust to provide for all future debt service payments on the old obligations. Accordingly, the trust account assets and the related liabilities for the defeased bonds are not reflected in the County's financial position. At June 30, 2003, the amount of outstanding bonds and certificates of participation considered defeased was $168,645,000. All of this amount was related to governmental activities.
Changes in Long-term Liabilities
The following is a summary of long-term liabilities and corresponding activity for the year ended June 30, 2003 (in thousands):
Balance Additions/ Transfers/ Balance Due Within July 1, 2002 Accretions Maturities June 30, 2003 One Year
Governmental activities: Bonds and notes payable $ 1,997,035 $ 186,932 $322,809 $ 1,861, 158 $ 154,655 Pension bonds payable (Note 6) 1,551,515 53,707 147,490 1,457,732 171,991 Capital lease obligations (Note 7) 113, 180 21,501 14,411 120,270 10,822 Accrued vacation and sick leave 561,976 60,871 38,752 584,095 42,392 Workers' compensation liability
(Note 15) 1,405,830 741,277 229,416 1,917,691 270,845 Litigation and self-insurance
Liability (Note 15) 378,215 195,950 64,603 509,562 66,847 Third party payor liability 33 741 6074 6,096 33,719 31,600 Total governmental activities $ 6.041 492 $1,266.312 $823 577 $ 6 484 227 $ 749152
Business-type activities: Bonds and notes payable $ 427,384 $ 69,537 $ 76,373 $ 420,548 $ 167,007 Pension bonds payable (Note 6) 542,234 18,770 51,545 509,459 60,109 Capital lease obligations (Note 7) 2,086 33 358 1,761 397 Accrued vacation and sick leave 108,674 9, 131 6,618 111, 187 9,029 Workers' compensation liability
(Note 15) 297,790 113,865 44,721 366,934 59,868 Litigation and self-insurance
Liability (Note 15) 215,825 30,864 23,123 223,566 33,278 Third party payer liability (Note 11) 353,462 59,021 38,606 373,877 37,002 Total business-type activities $ 194Z455 $ 301.221 $241 344 $ 2 QQZ,332 $ 366 69Q
For governmental activities, the General Fund, the Fire Protection District Special Revenue Fund and the Public Library Special Revenue Fund have typically been used to liquidate workers' compensation, accrued vacation and sick leave and litigation and self-insurance liabilities.
77

78
COUNTY OF LOS ANGELES NOTES TO THE BASIC FINANCIAL STATEMENTS-Continued
8. LONG-TERM OBLIGATIONS-Continued
Changes in Long-Term Liabilities
Bond interest accretions for deep discount bonds have been included in the amounts reported for Bonds and Notes Payable and Pension Bonds Payable. Amounts accreted in previous years were paid during 2002-2003, thereby reducing liabilities for Bonds and Notes Payable by $8,001,000 for governmental activities. Liabilities for Pension Bonds Payable were increased for governmental and business-type activities by $53,707,000 and $18,770,000, respectively, for interest accretions. Note 15 contains information about changes in the combined current and long-term liabilities for workers' compensation and litigation and self-insurance liabilities.
9. SHORT-TERM DEBT
On July 1, 2002, the County issued $650 million of short-term Tax and Revenue Anticipation Notes at an effective interest rate of 1.64%. The proceeds of the notes were used to assist with County General Fund cash flow needs prior to the first major apportionment of property truces, which occurred in December 2002. The notes matured and were redeemed on June 30, 2003.
10. CONDUIT DEBT OBLIGATIONS
Community Facilities and Improvement District Bonds
As of June 30, 2003, various community facilities and improvement districts established by the County had outstanding special tax bonds payable totaling $99,485,400 and limited obligation improvement bonds totaling $19,807,000. The bonds were issued to finance the cost of various construction activities and infrastructure improvements which have a regional or direct benefit to the related property owners.
The bonds do not constitute an indebtedness of the County, and are payable solely from special taxes and benefit assessments collected from property owners within the districts. In the opinion of County officials, these bonds are not payable from any revenues or assets of the County and neither the full faith and credit of the County, the State or any political subdivision thereof is obligated to the payment of the principal or interest on the bonds. Accordingly, no liability has been recorded in the accompanying basic financial statements.
The County functions as an agent for the districts and bondholders. Debt service transactions related to the various bond issues are reported in the agency funds. Construction activities are reported in the Improvement Districts' Capital Projects Fund. Revenues have been recorded (proceeds from property owners) to reflect the bond proceeds issued for capital improvements.
Residential Mortgage Revenue Bonds
Residential Mortgage Revenue Bonds have been issued to provide funds to purchase mortgage loans secured by first trust deeds on newly constructed and existing single family residences in the County. The purpose of this program is to provide low interest rate home mortgage loans to persons who are unable to qualify for conventional mortgages at market rates. Multi-Family Mortgage Revenue Bonds have been issued to provide permanent financing for apartment projects located in the County to be partially occupied by persons of low or moderate income. The amount of Mortgage Revenue Bonds issued since inception of the programs approximates $1,456,504,000. The amount of bonds outstanding as of June 30, 2003 was not determinable.

COUNTY OF LOS ANGELES NOTES TO THE BASIC FINANCIAL STATEMENTS-Continued
10. CONDUIT DEBT OBLIGATIONS-Continued
Residential Mortgage Revenue Bonds-Continued
The bonds do not constitute an indebtedness of the County. The bonds are payable solely from payments made on and secured by a pledge of the acquired mortgage loans and certain funds and other monies held for the benefit of the bondholders pursuant to the bond indentures. In the opinion of County officials, these bonds are not payable from any revenues or assets of the County, and neither the full faith and credit nor the taxing authority of the County, the State or any political subdivision thereof is obligated to the payment of the principal or interest on the bonds. Accordingly, no liability has been recorded in the accompanying basic financial statements.
Industrial Development and Other Conduit Bonds
Industrial development bonds, and other conduit bonds, have been issued to provide financial assistance to private sector entities and nonprofit corporations for the acquisition of industrial and health care facilities which provide a public benefit. The bonds are secured by the facilities acquired and/or bank letter of credit and are payable solely from project revenue or other pledged funds. The County is not obligated in any manner for the repayment of the bonds. Accordingly, no liability has been recorded in the accompanying basic financial statements.
As of June 30, 2003, the amount of industrial development and other conduit bonds outstanding was $178,423,000.
11. HOSPITAL AND OTHER PROGRAM REVENUES
Net patient service revenue is reported at the estimated net realizable amounts from patients, thirdparty payors, and others for services rendered, including estimated retroactive adjustments under reimbursement agreements with third-party payors. Retroactive adjustments are accrued on an estimated basis in the period the related services are rendered and adjusted in future periods, as final settlements are detennined.
Medicaid Demonstration Project
In June 1996, Federal, State, and County officials approved a Medicaid Demonstration Project ("Project") to enable the County to stabilize and restructure its health care system. The basis for the Project required a shift in emphasis from conventional inpatient care to preventive, primary, and outpatient care. The Project was initially approved for a five-year period that was scheduled to end on June 30, 2000. The status of the Project's extension for an additional five-year period is discussed in the next segment of this Note. The plan provided $366.5 million in financial assistance in 1995-96, which provided impetus and support to the restructuring of health care delivery in the County.
Medicaid Demonstration Project Extension
The Federal Health Care Financing Administration, now known as the Center for Medicare & Medicaid Services (CMS), granted an extension and phase-out of the Project over a tenn of five years (July 1, 2000 through June 30, 2005), to continue to assist the County in restructuring its health care delivery system.
79

80
COUNTY OF LOS ANGELES NOTES TO THE BASIC FINANCIAL STATEMENTS-Continued
11. HOSPITAL AND OTHER PROGRAM REVENUES-Continued
Medicaid Demonstration Project Extension-Continued
As part of this extension agreement, the County commits to use $300 million of tobacco litigation settlement revenues and an additional $100 million of General Fund contributions for Project-related services during the extension period. Also, as part of this extension agreement, a minimum of $40 million in State and County funds at a 2 to 1 ratio, respectively, will be made available over the course of the extension period to fund the system's workforce training needs, as identified in the CMS/Department of Labor approved work plan.
For the period July 1, 2000 through June 30, 2005, CMS will provide Federal Financial Participation (FFP) at the applicable Federal-matching rate for the Federally Reimbursable Ambulatory Care Service Costs and the Supplemental Project Pool for both the Department of Health Services and Department of Mental Health. Payments for these components will not exceed the annual and total budget limits as follows (in thousands):
Percent Limit on Dollar Limit on Fiscal Year Demonstration FFP Demonstration FFP
2000-01 100% $ 246,600 2001-02 100% 246,600 2002-03 75% 185,000 2003-04 55% 135,500 2004-05 35% 86,300 2005-06 post-extension 0% Total $ 9QQ QQQ
To provide increased funding to the County for outpatient services, CMS approved an amendment to the State Medi-Cal Plan, effective July 1, 2000, to provide cost-based reimbursement for Countyoperated and contracted facilities for covered outpatient services rendered to Medi-Cal beneficiaries.
If the County does not meet specified milestones in the ''Terms and Conditions" provisions of the extension agreement, the State may impose sanctions on the County of up to 18 percent of the Supplemental Project Pool and 10 percent of the Federally Reimbursable Ambulatory Care Service Cost claim, depending on the program.
The Project Federal Financial Participation (FFP) revenues recorded in the Hospital Enterprise Funds totaled $155.8 million and consisted of the following:
$83.2 million in additional Medi-Cal matching funds for indigent care at health centers and outpatient facilities.
$72.6 million in increased Medi-Cal funding for providing at least 450,000 outpatient visits.

COUNTY OF LOS ANGELES NOTES TO THE BASIC FINANCIAL STATEMENTS-Continued
11. HOSPITAL AND OTHER PROGRAM REVENUES-Continued
Medi-Cal and Medicare Programs
A substantial portion of the Hospitals' revenue is derived from services provided to patients eligible for benefits under the Medi-Cal and Medicare programs. Medi-Cal acute inpatient services are reimbursed at a contractually agreed upon per-diem rate. Services to inpatient Medicare program beneficiaries are primarily paid under prospectively determined rates-per-discharge based upon diagnostic related groups (DRGs). Certain other services to Medicare beneficiaries are reimbursed based on cost, subject to certain limitations. Revenues from Medi-Cal and Medicare programs represent approximately 87% and 4% respectively, of net patient care revenue for the year ended June 30, 2003.
Medi-Cal cost audit reports have been issued for all hospitals through Fiscal Year 1999-2000. Medi-Cal/Cost-Based Reimbursement Clinic Fiscal Year 2000-01 audit reports have been issued for High Desert Hospital and Antelope Valley Cluster clinics, and audits are in progress for all the other facilities. Entrance conferences are being scheduled for FY 2001-02 audits.
The Medicare audits have been completed for Fiscal Year 1997-98 at all hospitals. For Fiscal Year 1998-99, the audits have been completed. However, the notices of program reimbursement have been received only for M.L. King/Drew Medical Center, Olive View/UCLA Medical Center, and High Desert Hospital. For Fiscal Year 1999-00, the audits are in progress. For Fiscal Year 2000-01, only M.L. King/Drew Medical Center has been audited and the notice of program reimbursement have been issued. For Fiscal Year 2001-02, Rancho's audit is in progress.
The Hospitals, excluding health centers, have various outstanding appeals pertaining to Medi-Cal and Medicare audit settlements. These amounts have not been recorded as liabilities, as the outcome is not certain. The County believes the final resolution of the appeals will not have a material effect on its financial condition.
The Hospitals, excluding health centers, also received revenues from the following programs:
During FY 1991-92, SB 855 and SB 146 were enacted to provide higher Medi-Cal reimbursement rates to Disproportionate Share Hospitals ("DSH"). These are hospitals which provide a disproportionate share of services to Medi-Cal and other low income patients. The law requires certain public entities to contribute matching funds to the State. These funds, along with additional Federal revenues, are utilized by the State to fund the supplemental payment amounts.
SB 855 funds cannot exceed each hospital's DSH limits as mandated under OBRA '93. As a result of the original 1115 Waiver, the Department of Health Services may have received SB 855 funds beyond its OBRA '93 DSH limits for the fiscal year ended June 30, 1996 (estimated to be $131 million) in cash flow assistance which may be an obligation that is expected to be repaid in the future, and has been recorded as a liability ("Estimated Liability to Third-Party Payers") of the Hospital Enterprise Funds in the accompanying basic financial statements. Additional potential obligations totaling $ 89.5 million have also been recognized as liabilities in the basic financial statements as of June 30, 2003. The amount includes$ 61 million and$ 28.5 million related to Fiscal Years 1996-97 and 1997-98, respectively.
81

82
COUNTY OF LOS ANGELES NOTES TO THE BASIC FINANCIAL STATEMENTS-Continued
11. HOSPITAL AND OTHER PROGRAM REVENUES-Continued
Medi-Cal and Medicare Programs-Continued
SB 1255, which became effective in 1990, established the State Disproportionate Share and Emergency Services Fund to receive contributions from public agencies. The State utilizes these funds to obtain additional Federal matching funds. The total is then distributed to the hospital applicants through a negotiation process with the California Medical Assistance Commission. To be eligible to receive funds, among other requirements, a hospital must be a disproportionate share provider.
Office of Inspector General
The Office of Inspector General (OIG) performed an audit to verify that Medi-Cal's Fiscal Year (FY) 1997-98 Disproportionate Share Hospital (DSH) payments to the six Los Angeles County hospitals did not exceed their OBRA '93 limits. The OIG Audit found that the DSH payments to four of the six LAC hospitals exceeded their respective FY 1997-98 OBRA '93 limits by more than a total of $195 million ($98 million federal share). According to the OIG, the excess payments occurred because the State's DSH payment formula did not limit hospitals' total operating expenses to amounts that would be allowable under Medicare cost principles. The State and the County strongly disagreed with the audit findings and submitted written objections to many of the points raised by the OIG.
The OIG recommended that the State work with CMS to address and resolve the DSH payments in excess of the limits. In its approval of the State's application for renewal of its Selective Provider Contracting Program (SPCP) waiver for the period of January 1, 2003 through December 31, 2004, CMS agreed to permit the State to make DSH payments to the Los Angeles County hospitals without applying Medicare cost principles, but required the State to exclude any amounts not related to patient care from its calculations of the hospitals' operating expenses and to modify its treatment of bad debt. CMS has agreed not to pursue retroactive recovery of overpayments found by the OIG as long as the State corrects the formula in its State Plan prospectively.
Although the State has initiated action and fully intends to comply with the CMS requirements, the final state plan amendments have not been submitted to CMS for their review and approval. Accordingly, there is still some uncertainty regarding the final acceptance of the state plan amendment and the ultimate resolution of potential liabilities that the OIG has asserted. The County believes that the state plan amendments will ultimately be submitted and approved by CMS and that the potential liabilities of $98 million will not significantly affect the County's financial condition.
Other Program Revenues
Proposition 99 imposes an additional State excise tax on cigarettes and other tobacco products. The increased taxes on tobacco products generate additional revenues for health care, research, health education, and public resources. State Assembly Bill 75 allocates these revenues to health care providers based upon their share of the financial burden for providing care to persons who are uninsured or otherwise unable to pay for care. The County's share of the AB 75 California Healthcare for the Indigent Program (CHIP) revenues for the year ended June 30, 2003 was $24.9 million.

COUNTY OF LOS ANGELES NOTES TO THE BASIC FINANCIAL STATEMENTS-Continued
11. HOSPITAL AND OTHER PROGRAM REVENUES-Continued
Other Program Revenues-Continued
Revenues related to the aforementioned programs are included in the accompanying basic financial statements as hospital operating revenues. Uncollected amounts are reported as Accounts Receivable. Claims for these programs are subject to audit by State and/or Federal agencies.
Intergovernmental Transfers
The County of Los Angeles provides funding for the State's share of the Medicaid Demonstration Project Supplemental Project Pool (SPP) and a portion of the State's share of the SB 855 and SB 1255 programs by transferring funds to the State from the County's General Fund. These transferred funds are referred to as intergovernmental transfers (IGT) and are used by the State to draw down federal matching funds. The IGT funds transferred to the State by the County and the matching federal funds are utilized by the State to provide supplemental funding to the County, and in some instances other providers, under the SPP, SB 855 and SB 1255 programs.
The transfer of County General Funds to the State (IGT) is initially recorded as a health expenditure of the General Fund. At the time the Hospitals recognize the supplemental funding received (net patient services revenue) under one of the aforementioned programs, the General Fund distributes the cost of the IGTs to each of the Hospitals. This cost is reflected as a non-operating expense by each Hospital in its Statement of Revenues, Expenses, and Changes in Fund Net Assets. For the year ended June 30, 2003, the cost of the IGTs and the supplemental funding received are as follows (in thousands):
Intergovernmental Program Transfers Expense Revenues
Medicaid Demonstration Project (SPP) $ 110,000 $ 220,000
SB 855 346,993 528,767
SB 1255 481,506 905,506
Total $ 938.499 $1654273
Charity Care
Charity care includes those uncollectible amounts, which the patient is unable to pay. Generally, charity care adjustment accounts are those accounts for which an indigence standard has been established and under which the patient qualifies. Inability to pay may be determined through one of the Department's Reduced Cost Health Care plans, through other eligibility plans utilized by the Department, by the Treasurer-Tax Collector, or by an outside collection agency. Determinations of charity care may be made prior to, at the time of service, or any time thereafter.
83

84
COUNTY OF LOS ANGELES NOTES TO THE BASIC FINANCIAL STATEMENTS-Continued
11. HOSPITAL AND OTHER PROGRAM REVENUES-Continued
Charity Care-Continued
The total amount of such charity care provided by the hospitals for the fiscal year ended June 30, 2003, based on established rates, is as follows (in thousands):
Charges forgone Less: Federal and State subventions Net charges forgone
$1,574,988 24,883
$1 550 105
Restructuring of the County's Health Care Delivery System
As indicated in the "Medicaid Demonstration Project Extension" segment of this note, the County's reimbursement for health services is scheduled to significantly decline over the next three years. To address projected budget deficits, the Board approved a strategic plan in January 2002 that provided several options for a redesigned Health Care Delivery System (System). The plan established the direction for the System's restructuring and included the immediate closure of five health centers, a two-phased administrative reduction, and the consolidation of certain clinical services.
In June 2002, the Board adopted a redesign plan that contemplates a System based on four acute hospitals, the closure of an additional 11 health centers, and additional reductions focused on narrowing the projected deficit. The Board and County management are continuing to work closely with federal and State officials to collaborate on the resolution of the projected deficit, the restructuring process, and other matters that impact the viability of the System.
The Department's June 26, 2002, Proposed Savings Plan included reducing LAC+USC Medical Center by 100 acute beds and reducing the County's contribution to Rancho Los Amigos National Rehabilitation Center (Rancho) by either implementing an alternative governance structure or, failing that, by closing the hospital. The Department has not been able to implement either of these plans because of a preliminary injunction issued by a federal district court prohibiting any service reductions at these two facilities.
In fiscal year 2003-04, the incremental costs of operating Rancho and not reducing 100 acute beds at LAC+USC Medical Center are approximately $49.5 million and $16.1 million, respectively.
12. INTERFUND TRANSACTIONS
lnterfund Receivables/Payables
lnterfund receivables and payables have been eliminated in the government-wide financial statements, except for "internal balances" that are reflected between the governmental and businesstype activities. lnterfund receivables and payables have been recorded in the fund financial statements. Such amounts arise due to the exchange of goods or services (or subsidy transfers) between funds that were pending the transfer of cash as of June 30, 2003.

COUNTY OF LOS ANGELES NOTES TO THE BASIC FINANCIAL STATEMENTS-Continued
12. INTERFUND TRANSACTIONS-Continued
lnterfund Receivables/Payables-Continued
Cash transfers related to interfund receivables/payables are generally made within 30 days after yearend. Amounts due to/from other funds at June 30, 2003 are as follows (in thousands):
Receivable Fund
General Fund
Payable Fund
Fire Protection District Flood Control District Public Library Regional Park and Open Space District Internal Service Funds Harbor UCLA Medical Center Olive View UCLA Medical Center LAC+USC Medical Center M.L. King/Drew Medical Center High Desert Hospital Rancho Los Amigos Medical Center Nonmajor Enterprise Funds Nonmajor Governmental Funds
Fire Protection District General Fund Flood Control District Internal Service Funds LAC+USC Medical Center Nonmajor Governmental Funds
Flood Control District General Fund Internal Service Funds Nonmajor Enterprise Funds Nonmajor Governmental Funds
Public Library General Fund Nonmajor Governmental Funds
Regional Park and Open Space District General Fund
Amount
$ 4,513 4,085 2,319 3,661 4,674
64,085 37,333
197,410 41,043 13,711 29,451
130 45041
447 456
8,970 20
2 3
188 9,183
1,056 4,936
267 3.363 9,622
220 251 471
5
85

86
COUNTY OF LOS ANGELES NOTES TO THE BASIC FINANCIAL STATEMENTS-Continued
12. INTERFUND TRANSACTIONS-Continued
lnterfund Receivables/Payables-Continued
Receivable Fund
Internal Service Funds
Harbor UCLA Medical Center
Olive View UCLA Medical Center
LAC+USC Medical Center
M. L. King/Drew Medical Center
Payable Fund
General Fund Fire Protection District Flood Control District Public Library Regional Park and Open Space District Harbor UCLA Medical Center LAC+USC Medical Center M. L. King/Drew Medical Center Rancho Los Amigos Medical Center Nonmajor Enterprise Funds Nonmajor Governmental Funds
General Fund Fire Protection District Olive View UCLA Medical Center LAC+USC Medical Center M.L. King/Drew Medical Center Rancho Los Amigos Medical Center
General Fund Fire Protection District Harbor UCLA Medical Center LAC+USC Medical Center High Desert Hospital Rancho Los Amigos Medical Center Nonmajor Governmental Funds
General Fund Fire Protection District Harbor UCLA Medical Center Olive View UCLA Medical Center M.L. King/Drew Medical Center High Desert Hospital Rancho Los Amigos Medical Center
General Fund Fire Protection District Olive View UCLA Medical Center LAC+USC Medical Center Rancho Los Amigos Medical Center
Amount
7,186 32
13,894 4 6 1
50 46 30
2,922 24 704 48 875
71,737 15
11,550 241 211
30 83 784
51,626 5
615 119 134
8 14
52.521
270,596 16
4,492 3,263 2,578
943 1 024
282,912
67,564 35
1 436
19 68,055

COUNTY OF LOS ANGELES NOTES TO THE BASIC FINANCIAL STATEMENTS-Continued
12. INTERFUND TRANSACTIONS-Continued
lnterfund Receivables/Payables-Continued
Receivable Fund
High Desert Hospital
Rancho Los Amigos Medical Center
Nonmajor Enterprise Funds
Nonmajor Governmental Funds
Total lnterfund Receivables/Payables
lnterfund Transfers
Payable Fund
General Fund Fire Protection District Harbor UCLA Medical Center Olive View UCLA Medical Center Rancho Los Amigos Medical Center
General Fund Harbor UCLA Medical Center LAC+USC Medical Center
General Fund Internal Service Funds
General Fund Internal Service Funds Nonmajor Enterprise Funds Nonmajor Governmental Funds
Amount
12,749 4
33 3 3
12.792
29,518 2 4
29,524
3 606 609
2,974 9,607
679 2.442
15,702
$1 061 511
Transfers were made during the year from the General Fund to subsidize the operations of the Public Library and the six hospitals. Other transfers primarily consisted of payments from the various operating funds (principally the General Fund) to debt service funds in accordance with long-term debt covenants. In addition, special revenue funds that are statutorily restricted made transfers to other funds to reimburse eligible costs incurred.
lnterfund transfers to/from other funds for the year ended June 30, 2003 are as follows (in thousands):
Transfer From
General Fund
Transfer To
Flood Control District Public Library Internal Service Funds Harbor UCLA Medical Center Olive View UCLA Medical Center LAC+USC Medical Center M.L. King/Drew Medical Center High Desert Hospital Rancho Los Amigos Medical Center Nonmajor Governmental Funds
Amount
$ 1,700 21,913
186 64,740 50,947
280,611 84,883 18,063 39,833
106,211 669 087
87

88
COUNTY OF LOS ANGELES NOTES TO THE BASIC FINANCIAL STATEMENTS-Continued
12. INTERFUND TRANSACTIONS-Continued
Transfer From Transfer To -'-'-="-'-=-'-=--'--='---~~~~~~~
Fire Protection District Nonmajor Governmental Funds
Flood Control District Internal Service Funds Nonmajor Governmental Funds
Public Library Nonmajor Governmental Funds
Regional Park and Open Space District Nonmajor Governmental Funds
Internal Service Funds General Funds
Olive View UCLA Medical Center Nonmajor Governmental Funds
M. L. King/Drew Medical Center Harbor UCLA Medical Center Nonmajor Governmental Funds
Nonmajor Enterprise Funds Internal Service Funds Nonmajor Governmental Funds
Nonmajor Governmental Funds General Fund Public Library
Total lnterfund Transfers
Short-term Advances
Internal Service Funds Harbor UCLA Medical Center Olive View UCLA Medical Center LAC+USC Medical Center M.L. King/Drew Medical Center Nonmajor Enterprise Funds Nonmajor Governmental Funds
Advances from/to other funds at June 30, 2003 are as follows (in thousands):
Receivable Fund
General Fund
Payable Fund
Internal Service Funds Harbor UCLA Medical Center Olive View UCLA Medical Center LAC+USC Medical Center M.L. King/Drew Medical Center High Desert Hospital Rancho Los Amigos Medical Center
Amount
4 203
903 18,402 19 305
480
38,632
1 804
175
15 97
112
176 6 114 6 290
66,735 81
1,935 654
14 150 224
1,741 28,621
100,155
s 84Q 243
Amount
$ 3,696 47,902 69,095 58,235
108,457 1,001
16 142 304,528

COUNTY OF LOS ANGELES NOTES TO THE BASIC FINANCIAL STATEMENTS-Continued
12. INTERFUND TRANSACTIONS-Continued
Short-term Advances-Continued
Receivable Fund Payable Fund Amount
Flood Control District Internal Service Funds 6 814
Nonmajor Enterprise Funds Internal Service Funds 772
Nonmajor Governmental Funds Internal Service Funds 10 718
Total Short-term Advances $ 322 832
The General Fund makes short-term advances to assist the Hospital Funds in meeting their cash flow requirements. The General Fund, along with other funds that receive services from the Public Works Internal Service Fund, makes short-term advances to ensure sufficient cash is available to fund operations.
13. BUDETARY ACCOUNTING CHANGES/RECONCILIATION BETWEEN THE BUDGETARY BASIS AND GAAP
The County's Statement of Revenues, Expenditures and Changes in Fund Balances-Budget and Actual on Budgetary Basis for the major governmental funds has been prepared on the budgetary basis of accounting, which is different from GAAP.
The amounts presented for the governmental fund statements are based on the modified accrual basis of accounting and differ from the amounts presented on a budgetary basis of accounting. The major areas of difference are as follows:
- For budgetary purposes, designations are recorded as other financing uses at the time they are established. Although designations are not legal commitments, the County recognizes them as uses of budgetary fund balance. Designations that are subsequently cancelled or otherwise made available for appropriation are recorded as other financing sources.
- For budgetary purposes, encumbrances and other reserves are also recorded as other financing uses at the time they are established. For encumbrances, this occurs at the time contracts or purchase agreements are entered into. Other reserves are also recognized as other financing uses to indicate that certain assets (such as inventories) are not available for appropriation. Cancellations of encumbrances and other fund balance reserves are recorded as other financing sources for budgetary purposes.
- For the General Fund, obligations for accrued vacation and sick leave and estimated liabilities for litigation and self-insurance are recorded as budgetary expenditures to the extent that they are estimated to be payable within one year after year-end. Under the modified accrual basis of accounting, such expenditures are not recognized until they become due and payable in accordance with GASB Interpretation No. 6.
89

90
COUNTY OF LOS ANGELES NOTES TO THE BASIC FINANCIAL STATEMENTS-Continued
13. BUDGETARY ACCOUNTING CHANGES/RECONCILIATION BElWEEN THE BUDGETARY BASIS AND GAAP-Continued
- In conjunction with the sale of pension obligation bonds in 1994-95, the County sold the right to future investment income on debt service deposits. Under the budgetary basis, the proceeds were included in 1994-95 revenues. Under the modified accrual basis, the proceeds were recorded as deferred revenue (unearned) and are being amortized over the life of the bonds. This matter is also discussed in Note 6.
- Under the budgetary basis, revenues (primarily intergovernmental) are recognized at the time encumbrances are established for certain programs and capital improvements. The intent of the budgetary policy is to match the use of budgetary resources (for amounts encumbered, but not yet expended) with funding sources that will materialize as revenues when actual expenditures are incurred. Under the modified accrual basis, revenues are not recognized until the qualifying expenditures are incurred.
- Under the budgetary basis, property tax revenues are recognized to the extent that they are collectible within one year after year-end. Under the modified accrual basis, property tax revenues are recognized only to the extent that they are collectible within 60 days.
- For budgetary purposes, investment income is recognized prior to the effect of changes in the fair value of investments. Under the modified accrual basis, the effects of such fair value changes have been recognized.
The following schedule is a reconciliation of the budgetary and GAAP fund balances (in thousands}:
Regional Fire Flood Park and
General Protection Control Public Open Space Fund District District Library District
Fund balance - budgetary basis $ 678,361 $ 27,338 $ 12,586 $ 7,284 $ 119,827 Reserves and designations 1,051,565 11,709 107,895 4,323 133,056
Subtotal 1,729,926 39,047 120,481 11,607 252,883 Adjustments: Reversal of estimated liability for
litigation and self-insurance claims 72,508 289 184
Reversal of accrued vacation and sick leave benefits 34,526
Deferral of unearned investment income (27,961) (1,381) (307)
Change in revenue accruals (111,269) (14,213) (4,407) (1,930) (811) Subtotal (32, 196) (15,305) (4,407) (2,053) (811)
Fund balance - GAAP basis $:1 69Z Z3Q $ 23 l42 $ 116,QZ4 $ 9 554 $ 252,QZ2

COUNTY OF LOS ANGELES NOTES TO THE BASIC FINANCIAL STATEMENTS-Continued
14. COMMITMENTS
Construction Commitments
At June 30, 2003, the LAC+USC Medical Center Hospital Enterprise Fund had contractual commitments of approximately $521,508,000 to provide for the construction of the LAC+USC Medical Center replacement facility. The construction is currently being financed by commercial paper and a grant from the Federal Emergency Management Agency.
At June 30, 2003, the Public Buildings Capital Projects Fund had contractual commitments of approximately $5,548,000 to provide for the construction of the Antelope Valley Courthouse. The construction is being financed by proceeds from certificates of participation. There were also contractual commitments for the West San Fernando Valley Court building and the Airport Branch Court building of approximately $1,616,000 and $1,255,000, respectively, which are being financed by lease revenue bonds.
LACERA Capital Commitments
At June 30, 2003, LACERA had outstanding capital commitments to various investment managers, approximating $1, 760,000,000. Subsequent to June 30, 2003, LACE RA funded $85,000,000 of these capital commitments.
Investment Purchase Commitments
At June 30, 2003, the County had open trade commitments {forward contracts) with various brokers to purchase investments approximating $350,000,000 with settlement dates subsequent to year end. These investment transactions had not been recorded as of June 30, 2003 since the County neither takes delivery of the securities nor earns interest on the investments until the settlement date. By July 9, 2003, the County had purchased such investments.
15. RISK MANAGEMENT
The County purchases insurance for certain risk exposures such as aviation, employee fidelity, boiler and machinery in certain structures, art objects, catastrophic hospital general liability, volunteer, special events, public official bond, crime, safety reserve employee death and disability, and fiduciary liability for the deferred compensation plans. There have been no settlements related to these programs that exceeded insurance coverage in the last three years. The County also has insurance on most major structures. Losses did not exceed coverage in 2001-2002 or 2002- 2003.
The County retains the risk for all other loss exposures. Major areas of risk indude workers' compensation and long-term disability, medical malpractice, law enforcement, theft and damage to property including natural disasters, errors and omissions, and torts. Expenditures are accounted fpr in the fund whose operations resulted in the loss. Claims expenditures and liabilities are reported when it is probable that a loss has been incurred and the amount of that loss, including those incurred but not reported, can be reasonably estimated. The County utilizes actuarial studies, historical data, and individual claims reviews to estimate these liabilities. The liabilities include estimable incremental claim adjustment expenses, net of salvage, and subrogation of approximately 10% of the total liabilities. They do not include other claim adjustment costs because the County does not believe it is practical or cost effective to estimate them.
91

92
COUNTY OF LOS ANGELES NOTES TO THE BASIC FINANCIAL STATEMENTS-Continued
15. RISK MANAGEMENT-Continued
As indicated in the following table, the County incurred a significant increase in workers' compensation liabilities during 2002-2003 and the balance as of June 30, 2003 was approximately $2.285 billion. This amount is undiscounted and is based on an actuarial study of the County's selfinsured program as of June 30, 2003. Workers' compensation benefits and their related costs are significantly influenced by State laws and regulations. State legislation and legal decisions have lengthened the duration of claims managed by the County. In addition, the County's program has experienced significant increases in medical and litigation expenses, as well as growth in utilization rates.
As of June 30, 2003, the County's best estimate of these liabilities is $3.018 billion. Changes in the reported liability since June 30, 2001 resulted from the following (in thousands):
Current Year Beginning of Claims and Balance At Fiscal Year Changes In Claim Fiscal
Liabilitv Estimates Payments Year-End 2001-2002
Workers' Compensation $ 1,659,836 $ 379,310 $ 335,526 $ 1,703,620 Other 502,600 205,855 114 415 594.040
Total 2001-2002 $ 2 162 436 $ 585165 $ 449 941 $ 2 297.660
2002-2003 Workers' Compensation $ 1,703,620 $ 855,142 $ 274,137 $ 2,284,625 Other 594,040 226.814 87,726 733,128
Total 2002-2003 $ 2 29Z 66Q $ :l,Q8:l 956 $ 36:1 863 $ 3 QH 753
In addition to the above estimated liabilities, the County has determined that claims seeking damages of approximately $301 million (including the $98 million discussed in Note 11) are possible of creating adverse judgments against the County. Because of the uncertainty of their outcome, no loss has been accrued for these claims.
16. PROPOSITIONS 218 AND 62
In November 1996, the voters approved the "Right To Vote on Taxes Act" (Proposition 218) which limits the County's ability to levy general and special taxes without voter approval and property related benefit assessments without property owner approval. In September 1998, the Board of Supervisors approved ordinance amendments to bring the County's general purpose taxes into conformance with Proposition 218.
In September 1995, the California Supreme Court upheld the constitutionality of Proposition 62, which requires voter approval of all new local taxes. Taxes imposed without voter approval after the 1986 effective date of Proposition 62 may be invalidated. The Court did not provide clarification about whether the decision would apply only prospectively to all new taxes or retrospectively to all taxes since the effective date of the Proposition. Accordingly, there is uncertainty about the validity of taxes currently being collected and as of June 30, 2003, the County established a general fund designation for approximately $188 million in such collections.

COUNTY OF LOS ANGELES NOTES TO THE BASIC FINANCIAL STATEMENTS-Continued
17. SUBSEQUENT EVENTS
Tax and Revenue Anticipation Notes ("TRANS")
On July 1, 2003, the County issued $600,000,000 in 2003-2004 TRANS which will mature on June 30, 2004. The TRANS are collateralized by taxes and other revenues attributable to the 2003-2004 fiscal year and were issued in the form of Fixed Rate Notes at an interest rate of 0.90%.
Tax-Exempt Commercial Paper
On October 14, 2003, the Los Angeles County Capital Asset Leasing Corporation issued an additional $35,000,000 in tax-exempt commercial paper. The proceeds are being used to fund capital requirements of the LAC+USC Medical Center Replacement Project.
The commercial paper, which was initially issued at an average rate of 1.413%, is secured by a longterm lease of County real estate and a letter of credit. The County pays debt service in the form of lease payments.
Capital Asset Leasing Corporation Bond Anticipation Notes
On October 29, 2003, the Corporation issued a $5,000,000 Bond Anticipation Note with an initial interest rate of 1.52%. The rate is adjustable on January 2 and July 1 of each year. The note was purchased by the Los Angeles County Treasury Pool and is due on June 30, 2006. Proceeds of the note are being used to purchase equipment. The note is to be repaid from the proceeds of lease revenue bonds.
State Budget
The State is confronted with a significant budget deficit for 2003-04. A new State Governor assumed office on November 17, 2003. There are various options that are under consideration to manage the budget deficit, including a proposal to issue State deficit bonds in conjunction with spending reductions.
The County has balanced its budget for 2003-04 and has used General Fund designations of $160 million to offset the partial loss of the County's annual share of State Vehicle License Fees. The County continues to closely monitor State actions to close its budget deficit. At this time, the impact of further State budget curtailments and their impact to the County have not been determined.
93

94
Actuarial Valuation
Date
06/30/00
06/30/01
06/30/02
REQUIRED SUPPLEMENTARY INFORMATION (Unaudited - See accompanying independent auditors' report)
Los Angeles County Employees Retirement Association Schedule of Funding Progress (Dollar amounts in thousands)
Actuarial Unfunded/ UAAU(OAAL) Actuarial Accrued (Overfunded) as a Percentage Value of Liability (AAL) AAL Funded Covered of Covered Assets - Entry Age [UAAU(OAAL)] Ratio Payroll Payroll
(a) (b) (b-a) (alb) (c) {{b-a)!c)
25,426,507 24,720,380 (706, 127) 102.9% 4,107,964 -17.2%
26,490,000 26,489,976 (24) 100.0% 4,398,443 0.0%
28,262,129 28,437,493 175,364 99.4% 4,744,340 3.7%

COUNTY OF LOS ANGELES
MAJOR GOVERNMENTAL FUND
GENERAL FUND
The General Fund is the general operating fund of the County. It is used to account for all financial resources except those accounted for in other funds. Revenues are derived from Taxes; Licenses, permits and franchises; Fines, forfeitures and penalties; Revenue from use of money and property; Intergovernmental revenues; Charges for services and Miscellaneous. Expenditures are expended for functions of General government; Public protection; Health and sanitation; Public assistance; Recreation and cultural services; Debt service and Capital outlay.

95
COUNTY OF LOS ANGELES GENERAL FUND SCHEDULE OF EXPENDITURES - BUDGET AND ACTUAL ON BUDGETARY BASIS FOR THE YEAR ENDED JUNE 30, 2003 (in thousands)
ORIGINAL FINAL ACTUAL ON VARIANCE FROM BUDGET BUDGET BUDGETARY FINAL BUDGET
BASIS OVER (UNDER)
GENERAL GOVERNMENT: Salaries and employee benefits $ 594,279 600,512 528,567 (71,945) Services and supplies 604,540 626,711 407,560 (219,151)
Other charges 83,478 93,311 62,334 (30,977)
Fixed assets 11,520 8,716 8,057 (659) lntrafund transfers (450,347) (451,055) (360,843! 90,212
TOTAL GENERAL GOVERNMENT 843,470 878,195 645,675 (232,520)
PUBLIC PROTECTION: Salaries and employee benefits 2,341,051 2,346,620 2,308,415 (38,205) Services and supplies 687,156 701,005 603,632 (97,373) Other charges 378,391 374,993 361,564 (13,429)
Fixed assets 9,934 10,826 6,867 (3,959)
lntrafund transfers (74,666) (74,884) (146,821) (71,937)
TOTAL PUBLIC PROTECTION 3,341,866 3,358,560 3,133,657 (224,903!
HEALTH AND SANITATION: Salaries and employee benefits 584,982 556,035 541,680 (14,355) Services and supplies 1,408, 167 1,356,406 1,318,859 (37,547)
Other charges 459,745 409,348 404,174 (5,174) Fixed assets 5,646 5,556 4,767 (789) lntrafund transfers (134,699) (140,523) (117,862) 22,661
TOTAL HEALTH AND SANITATION 2,323,841 2,186,822 2,151,618 (35,204)
PUBLIC ASSISTANCE: Salaries and employee benefits 1,162,014 1,165,701 1,115,553 (50,148)
Services an_d supplies 871,349 901,742 847,120 (54,622) Other charges 2,686,998 2,731,634 2,523,772 (207,862)
Fixed assets 1,509 2,007 1,133 (874)
lntrafund transfers (75,965) (80,211) (74,860) 5,351
TOTAL PUBLIC ASSISTANCE 4,645,905 4,720,873 4,412,718 (308, 155)
RECREATION AND CULTURAL SERVICES: Salaries and employee benefits 84,815 83,773 80,133 (3,640)
Services and supplies 77,883 79,881 75,223 (4,658)
Other charges 12,043 12,299 11,512 (787)
Fixed assets 1,112 1,135 947 (188)
lntrafund transfers (2,789) (2,789) (1,925) 864
TOTAL RECREATION AND CULTURAL SERVICES 173,064 174,299 165,890 (8,409)
DEBT SERVICE-Interest 11,076 11,076 11,076
CAPITAL OUTLAY 410,011 420,597 106,158 (314,439)
TOTAL GENERAL FUND $ 11,749,233 11,750,422 10,626,792 (1,123,630)

96

NONMAJOR GOVERNMENTAL FUNDS

COUNTY OF LOS ANGELES
NONMAJOR GOVERNMENTAL FUNDS
NONMAJOR SPECIAL REVENUE FUNDS
The Road Fund was established to provide for the maintenance and construction of streets, roads, highways, and bridges. Revenue consists primarily of the County's share of State highway use taxes as supplemented by Federal funds, vehicle code fines and charges for services provided to cities.
The Other Streets, Highways, Roads and Bridges Funds: Article 3-Bikeway, Off-Street Parking, Proposition C Local Return, Special Road Districts, Construction Fee Districts, Transit Operations, Paratransit Operations, and Off Highway License Fee were established to provide for transportation and road related services or functions. Revenues are derived from local sales tax revenue, parking meter receipts, districts' share of the Countywide tax levy, State revenues and service charges to parking lots.
The Street Lighting Districts Funds were established to provide for the installation and maintenance of street lighting systems. Revenues are derived primarily from the Countywide tax levy and benefit assessments.
The Garbage Disposal District Funds were established under the provisions of the Health and Safety Code to provide garbage and refuse collection and disposal services within the boundaries of each District. Revenues are mostly from charges for services and property taxes.
The Sewer Maintenance District Funds were established pursuant to the Health and Safety Code for the administration, maintenance, operation and repair of sanitary sewers, appurtenances, pumping plants, sewer treatment plants and related services. These Districts are financed through sewer service charges.
The Health & Sanitation Funds: Hospital Services, Physician Services, Statham Alcohol, Alcohol and Drug Problem, Proposition 36, Driving Under ·the Influence, AIDS Education, Air Quality Improvement, Bicycle Safety Helmet, Hazardous Waste Enforcement, and Solid Waste Management Funds were established to offset the cost of emergency services for the indigent, County alcoholism programs and services, AIDS education, air quality improvements, bicycle safety, hazardous waste enforcement and solid waste management. Revenues are from State tobacco taxes, patient collections, court fines, State-assessed vehicle fees, penalties assessed for hazardous waste violations, and sanitation services.
The Other Public Protection Funds: Jail Store, Inmate Welfare, Narcotic Enforcement, Vehicle Theft Prevention, Countywide Warrant System, Sheriffs Processing Fees, Training and Automation, Automated Fingerprint Identification System, District Attorney Asset Forfeiture, Fire Department Developer Fees, Children's Waiting Room, Oak Forest Mitigation, Information Systems Advisory Body, Drug Abuse Gang Diversion, Jury Operations Improvement, Dependency Court Facilities and Small Claims Advisor Program were established to provide certain services and supplies to inmates, to supplement the cost of various law enforcement and prosecutorial investigation activities, and to finance vehicle replacement, facilities improvement, equipment maintenance and automated systems. Revenues are derived from sale of minor supplies, fines related to controlled substance convictions, benefit assessments, forfeiture of assets used in connection with transportation or possession of a controlled substance and court revenues.
Continued ...

COUNTY OF LOS ANGELES
. NONMAJOR GOVERNMENTAL FUNDS
NONMAJOR SPECIAL REVENUE FUNDS
The Public Assistance Funds: Child Abuse/Neglect Prevention Program, Alternate Dispute Resolution Program, Alcohol and Drug Abuse Education Program, Domestic Violence Program, and Linkages Support Program were established to provide a variety of public assistance services. The programs are financed from special fees collected for birth certificates, marriage licenses, confidential marriage certificates, court fines for driving under the influence of alcohol or drugs, and disabled parking violation assessments.
The Recreation Funds: Golf Course, Recreation and Development, and Ford Theater were established to provide for maintenance and improvements to County golf courses, public recreation areas, and Ford Theater. Fish and Game was set up for the preservation and propagation of fish and wildlife. Revenues are derived from a percentage of golf course green fees, vehicle entrance fees collected from the regional parks, and local fish and game fines.
The Community Development Commission: The Housing Authority and Community Development Commission were established to increase the supply of affordable housing, effect community improvements under grant programs and to administer the County's Community Development Block Grant Funds, the County Redevelopment Agency and other County housing related functions. Revenues are derived principally from Federal grants.
The Courthouse Temporary Construction Fund was established to temporarily account for monies ultimately to be used for various courthouse construction projects. Revenues are derived principally from surcharges included in fines .tor criminal convictions.
The Criminal Justice Temporary Construction Fund was established to temporarily account for monies ultimately to be used for the improvement of criminal justice facilities and automated information systems. Revenues are derived principally from surcharges on criminal fines.
The Other Special Revenue Funds: Accumulative Capital Outlay ("ACO") was set up for the replacement of motor vehicles, printing and communications equipment, and helicopters. Productivity Investment was established to account for the start-up and incidental costs associated with productivity improvement projects. Civic Center Employee parking was established to provide parking services and alternative means of transportation for County employees. Energy Management provides for the replacement of inefficient energy equipment in County facilities and other energy cost reduction measures. Cable TV Franchise was established to fund cable-related activities. Revenues are derived from a percentage of cable franchise fees. Operating transfers are also made from the General Fund to support operations. Public Library Developer Fees were established to acquire land, construct library facilities, and purchase equipment and library materials. Various funds have been established to report resources that are legally restricted and the principal and earnings may be used for purposes that support recreation, cultural, education, and health and sanitation programs.
Continued ...

COUNTY OF LOS ANGELES
NONMAJOR GOVERNMENTAL FUNDS
NONMAJOR DEBT SERVICE FUNDS
The Detention Facilities and Flood Control District Debt Service Funds receive their funds from a voted indebtedness tax levy. The Flood Control District additionally receives operating transfers from the Flood Control District Special Revenue Fund. The Regional Park and Open Space District received long-term debt proceeds and also receives voter-approved benefit assessments. The Marina del Rey Fund receives rental revenues from the Marina del Rey Project area. Joint Powers Authorities and Public Buildings receive their funds primarily from the General Fund in the form of operating transfers.
Joint Powers Authorities
Public Works Financing Authority
Public Buildings
Antelope Valley Courthouse Project - Series 2000A Disney Parking Project 1998 Disney Parking Refunding Project Los Angeles County Museum of Art Los Angeles County Public Properties Project Multiple Capital Facilities Project IV Multiple Capital Facilities Project V - Series A Multiple Capital Facilities Project V - Series B Multiple Capital Facilities Project VI - Series A 1996 Master Refunding Project 1997 Master Refunding Project 2002 Master Refunding Project - Series A 2002 Master Refunding Project - Series B
Continued ...

COUNTY OF LOS ANGELES
NONMAJOR GOVERNMENTAL FUNDS
NONMAJOR CAPITAL PROJECTS FUNDS
The Capital Projects Funds were established to account for financial resources for the acquisition or construction of major capital facilities.
Accumulative Capital Outlay Funds have been established in accordance with Government Code Section 53730 for specific capital projects.
Flood Control District projects are financed by general obligation bonds and certificates of participation.
Improvement Districts are financed by contributions from property owners.
Public Buildings projects are financed by bonds and operating transfers.
Continued ...

COUNTY OF LOS ANGELES
NONMAJOR GOVERNMENTAL FUNDS
NONMAJOR PERMANENT FUNDS
Permanent funds have been established to report resources that are legally restricted to the extent that only earnings, and not principal, may be used for purposes that support various County programs.

97
COUNTY OF LOS ANGELES
COMBINING BALANCE SHEET
NONMAJOR GOVERNMENTAL FUNDS - SUMMARY
JUNE 30, 2003 (in thousands)
TOTAL
SPECIAL DEBT CAPITAL NONMAJOR
REVENUE SERVICE PROJECTS PERMANENT GOVERNMENTAL
FUNDS FUNDS FUNDS FUNDS FUNDS
ASSETS
Pooled cash and investments:
Operating $ 671,083 86,764 52,066 2,590 $ 812,503
Other 26,457 914 78 4 27,453
Total pooled cash and investments 697,540 87,678 52,144 2,594 839,956
Other investments 42,200 557,848 62,473 929 663,450
Taxes receivable 3,221 1,769 4,990
Interest receivable 1,444 215 145 21 1,825
Other receivables 75,304 10,723 2 86,029
Due from other funds 13,929 308 1,465 15,702
Advances to other funds 10,718 10,718
Inventories 34,813 34,813
TOTAL ASSETS $ 879, 169 658,541 116,229 3,544 $ 1,657,483
LIABILITIES AND FUND BALANCES
LIABILITIES:
Accounts payable $ 43, 124 2,008 $ 45,132
Accrued payroll 459 459
Other payables 1,023 2,342 3,365
Due to other funds 64,512 10,295 1,193 3 76,003
Deferred revenue 16,396 14,248 30,644
Advances payable 13, 121 13, 121
Third party payor liability 3,597 3,597
TOTAL LIABILITIES 142,232 26,885 3,201 3 172,321
FUND BALANCES:
Reserved for:
Encumbrances 100,680 10,865 111,545
Inventories 34,813 34,813
Housing programs 2,260 2,260
Debt service 631,656 631,656
Endowments & annuities 3,541 3,541
Other 21,194 7,364 28,558
Unreserved, designated for:
Program expansion 166,191 166,191
Unreserved, undesignated, repor1ed in:
Special revenue funds 411,799 411,799
Capital projects funds 94,799 94,799
TOTAL FUND BALANCES 736,937 631,656 113,028 3,541 1,485,162
TOTAL LIABILITIES AND FUND
BALANCES $ 879,169 658,541 116,229 3,544 $ 1,657,483

98
COUNTY OF LOS ANGELES
COMBINING STATEMENT OF REVENUES, EXPENDITURES AND CHANGES IN FUND BALANCES
NONMAJOR GOVERNMENTAL FUNDS - SUMMARY
FOR THE YEAR ENDED JUNE 30, 2003 (in thousands)
TOTAL
SPECIAL DEBT CAPITAL NON MAJOR
REVENUE SERVICE PROJECTS PERMANENT GOVERNMENTAL
FUNDS FUNDS FUNDS FUNDS FUNDS
REVENUES:
Taxes $ 62,472 15,082 $ 77,554
Licenses, permits and franchises 5,222 22 5,244
Fines, forfeitures and penalties 66,475 30 66,505
Revenue from use of money/property:
Investment income 15,935 29,000 3,460 171 48,566
Rents and concessions 6, 181 30,402 36,583
Royalties 5 5
Intergovernmental revenues:
Federal 95,485 95,485
State 215,925 82 216,007
Other 13,966 13,966
Charges for services 100,270 883 3,149 104,302
Proceeds from property owners 8,123 8,123
Miscellaneous 57,490 9 1,144 58,643
TOTAL REVENUES 639,426 75,510 15,876 171 730,983
EXPENDITURES:
Current:
General government 19,017 84 19, 101
Public protection 70,986 70,986
Public ways and facilities 287,853 287,853
Health and sanitation 82,367 82,367
Public assistance 132,608 132,608
Recreation and cultural services 4,638 4,638
Debt service:
Principal 6,073 143,247 149,320
Interest and other charges 1,691 130,831 132,522
Capital outlay 78,230 78,230
TOTAL EXPENDITURES 605,233 274,078 78,230 84 957,625
EXCESS (DEFICIENCY) OF REVENUES
OVER EXPENDITURES 34, 193 (198,568) (62,354) 87 (226,642)
OTHER FINANCING SOURCES (USES):
Transfers in 19,159 174,937 8,839 202,935
Transfers out (81,569) (18,586) (100,155)
Proceeds of refunding bonds 160,325 160,325
Payment to refunded bonds escrow agent (160,325) (160,325)
Bond premium proceeds 8,513 8,513
Sales of capital assets 49 7 56
TOTAL OTHER FINANCING SOURCES
(USES) (62,361) 164,864 8,846 111,349
NET CHANGE IN FUND BALANCES (28, 168) (33,704) (53,508) 87 (115,293)
FUND BALANCE, JULY 1, 2002 765,105 665,360 166,536 3,454 1,600,455
FUND BALANCE, JUNE 30, 2003 $ 736,937 631,656 113,028 3,541 $ 1,485, 162

99

100
COUNTY OF LOS ANGELES
COMBINING BALANCE SHEET
NONMAJOR GOVERNMENTAL FUNOS - SPECIAL REVENUE
JUNE 30, 2003 (in thousands)
Streets, Highways, Street Garbage Sewer
Roads and Bridges Lighting Disposal Maintenance
Roads Other Districts Districts Districts
ASSETS
Pooled cash and investments:
Operating $ 42,581 87,358 38,626 17,404 6,925
Other 15,997 209 271 216 245
Total pooled cash and investments 58,578 87,567 38,897 17,620 7,170
Other investments
Taxes receivable 362 1,440 774 599
Interest receivable 161 214 96 44 19
Other receivables 40,228 13,632 42 894 756
Due from other funds 9,147 426 321 742
Advances to other funds 8,825 395 1, 198
Inventories
TOTAL ASSETS $ 116,940 102,596 40,796 19,332 10.484
LIABILITIES AND FUND BALANCES
LIABILITIES:
Accounts payable $ 6,153 3,891 1,212 1, 124 120
Accrued payroll
Other payables 372
Due to other funds 25,756 2,653 482 58 2,022
Deferred revenue 5.485 357 1,009 1,242 952
Advances payable 13,121
Third party payor liability 2,142 1.455
TOTAL LIABILITIES 52,657 6,901 2,703 3,879 3,466
FUND BALANCES:
Reserved for:
Encumbrances 40,545 25,940 8 3 992
Inventories
Housing programs
Other 3,014 15, 120 1,582
Unreserved, designated for.
Program expansion 2.475 1,627 11,244
Unreserved, undesignated 20,724 52,160 36.458 4,206 4,444
TOTAL FUND BALANCES 64,283 95,695 38,093 15,453 7,018
TOTAL LIABILITIES AND FUND BALANCES $ 116,940 102,596 40,796 19,332 10.484

101
Health Other Community
and Public Public Development
Sanitation Protection Assistance Recreation Commission
ASSETS
Pooled cash and investments:
$ 74,653 107,404 7, 121 3,419 77,066 Operating
2,657 1,199 674 115 Other
77,310 108,603 7,795 3,534 77,066 Total pooled cash and investments
42,199 Other investments
45 Taxes receivable
186 257 6 4 Interest receivable
5,386 59 14,079 Other receivables
317 18 400 203 773 Due from other funds
300 Advances to other funds
34,813 Inventories
$ 83,544 108,878 8,201 3,800 168,930 TOTAL ASSETS
LIABILITIES AND FUND BALANCES
LIABILITIES:
$ 14,620 1,799 275 225 12,925 Accounts payable
Accrued payroll
572 35 44 Other payables
15,890 8,272 1,501 40 Due to other funds
620 6,731 Deferred revenue
Advances payable
Third party payer liability
31,130 10,071 2,348 300 19,700 TOTAL LIABILITIES
FUND BALANCES:
Reserved for.
9,374 13,654 156 154 Encumbrances
34,813 Inventories
2,260 Housing programs
300 1,178 Other
Unreserved, designated for:
34,052 916 2,271 1,108 110,979 Program expansion
8,988 83,937 3,426 2,238 Unreserved, undesignated
52,414 98,807 5,853 3,500 149,230 TOTAL FUND BALANCES
$ 83,544 108,878 8,201 3,800 168,930 TOTAL LIABILITIES AND FUND BALANCES
Continued ...

102
COUNTY OF LOS ANGELES
COMBINING BALANCE SHEET - Continued
NONMAJOR GOVERNMENTAL FUNDS - SPECIAL REVENUE
JUNE 30, 2003 (in thousands)
Criminal
Courthouse Justice Other
Temporary Temporary Special
Construction Construction Revenue Total
ASSETS
Pooled cash and investments:
Operating $ 104,579 26,784 77, 163 $ 671,083
Other 2,258 2,386 230 26,457
Total pooled cash and investments 106,837 29,170 77,393 697,540
Other investments 42,200
Taxes receivable 3,221
Interest receivable 261 70 126 1,444
Other receivables 228 75,304
Due from other funds 1,582 13,929
Advances to other funds 10,718
Inventories 34,813
TOTAL ASSETS $ 107,098 29,240 79,330 $ 879,169
LIABILITIES AND FUND BALANCES
LIABILITIES:
Accounts payable $ 621 159 $ 43,124
Accrued payroll 459 459
Other payables 1,023
Due to other funds 1,622 6,216 64,512
Deferred revenue 16,396
Advances payable 13, 121
Third party payor liability 3,597
TOTAL LIABILITIES 2,243 6,834 142,232
FUND BALANCES:
Reserved for:
Encumbrances 3,464 6,390 100,680
Inventories 34,813
Housing programs 2,260
Other 21,194
Unreserved, designated for:
Program expansion 1,519 166,191
Unreserved, undesignaled 107,098 23,533 64,587 411,799
TOTAL FUND BALANCES 107,098 26,997 72,496 736,937
TOTAL LIABILITIES AND FUND BALANCES $ 107,098 29,240 79,330 $ 879, 169

103

104
COUNTY OF LOS ANGELES
COMBINING STATEMENT OF REVENUES, EXPENDITURES AND CHANGES IN FUND BALANCES
NONMAJOR GOVERNMENTAL FUNDS - SPECIAL REVENUE
FOR THE YEAR ENDED JUNE 30, 2003 (in thousands)
Streets, Highways, Street Garbage Sewer
Roads and Bridges Lighting Disposal Maintenance
Roads Other Districts Districts Districts
REVENUES:
Taxes $ 3,565 29,022 11,777 3,012
Licenses, permits and franchises 1,976
Fines, forfeitures and penalties 24 121 243 173
Revenue from use of money/property:
Investment income 1,557 1,711 747 344 239
Rents and concessions 73 177
Royalties
Intergovernmental revenues:
Federal 11,537 3,780 23
State 153,584 1,026 151 38 99
Other 1, 106 11,281 364 15
Charges for services 23,431 17,174 3,474 9,176 17,105
Miscellaneous 6 8
TOTAL REVENUES 196,829 64,201 16,657 12,813 17,639
EXPENDITURES:
Current:
General government
Public protection
Public ways and facilities 216,203 54,148 17,502
Health and sanitation 14,906 18, 193
Public assistance
Recreation and cultural services
Debt service:
Principal
Interest and other charges
TOTAL EXPENDITURES 216,203 54,148 17,502 14,906 18, 193
EXCESS (DEFICIENCY) OF REVENUES
OVER EXPENDITURES (19,374) 10,053 (845) (2,093) (554)
OTHER FINANCING SOURCES (USES):
Transfers in
Transfers out (1,849) (69)
Sales of capital assets 32
TOTAL OTHER FINANCING SOURCES
(USES) (1,817) (69)
NET CHANGE IN FUND BALANCES (21,191) 10,053 (845) (2,093) (623)
FUND BALANCES, JULY 1, 2002 85,474 85,642 38,938 17,546 7,641
FUND BALANCES, JUNE 30, 2003 $ 64,283 95,695 38,093 15,453 7,018

105
Health Other Community
and Public Public Development
Sanitation Protection Assistance Recreation Commission
REVENUES:
$ 15,096 Taxes
31 1,346 Licenses, permits and franchises
14,192 6,057 1,519 37 Rnes, forteitures and penalties
Revenue from use of money/property:
1,613 1,899 11 19 4,147 Investment income
546 281 900 Rents and concessions
Royalties
Intergovernmental revenues:
49 80,096 Federal
48,533 12,494 State
1,200 Other
12,936 11,167 3,262 39 Charges for services
10 31,342 3,199 4,914 17,696 Miscellaneous
78.484 63,585 9,337 5,290 117,935 TOTAL REVENUES
EXPENDITURES:
Current
General government
41,924 Public protection
Public ways and facilities
49,268 Health and sanitation
7,514 125,094 Public assistance
4,638 Recreation and cultural services
Debt service:
6,073 Principal
1,691 Interest and other charges
49,268 41,924 7,514 4,638 132,858 TOTAL EXPENDITURES
EXCESS (DEFICIENCY) OF REVENUES
29,216 21,661 1,823 652 (14,923) OVER EXPENDITURES
OTHER FINANCING SOURCES (USES):
3,860 80 6, 114 Transfers in
(40,780) (9,802) (2,393) (1,741) Transfers out
17 Sales of capital assets
TOTAL OTHER FINANCING SOURCES
(40,780) (5,925) (2.393) 80 4,373 (USES)
(11,564) 15,736 (570) 732 (10,550) NET CHANGE IN FUND BALANCES
63,978 83,071 6,423 2,768 159,780 FUND BALANCES, JULY 1, 2002
$ 52,414 98,807 5,853 3,500 149,230 FUND BALANCES, JUNE 30, 2003
Continued ...

106
COUNTY OF LOS ANGELES
COMBINING STATEMENT OF REVENUES, EXPENDITURES AND CHANGES IN FUND BALANCES - Continued
NONMAJOR GOVERNMENTAL FUNDS - SPECIAL REVENUE
FOR THE YEAR ENDED JUNE 30, 2003 (in thousands)
Criminal
Courthouse Justice Other
Temporary Temporary Special
Construction Construction Revenue Total
REVENUES:
Taxes $ $ 62,472
Licenses, permits and franchises 1,869 5,222
Fines, forfeitures and penalties 20,383 23,576 150 66,475
Revenue from use of money/property:
lnvesbnent income 2,226 545 877 15,935
Rents and concessions 155 4,049 6,181
Royalties 5 5
Intergovernmental revenues:
Federal 95,485
State 215,925
Other 13,966
Charges for services 2,506 100,270
Miscellaneous 315 57,490
TOTAL REVENUES 22,764 24, 121 9,771 639,426
EXPENDITURES:
Current
General government 19,017 19,017
Public protection 14,645 14,417 70,986
Public ways and facilities 287,853
Health and sanitation 82,367
Public assistance 132,608
Recreation and cultural services 4,638
Debt service:
Principal 6,073
Interest and other charges 1,691
TOTAL EXPENDITURES 14,645 14,417 19,017 605,233
EXCESS (DEFICIENCY) OF REVENUES
OVER EXPENDITURES 8, 119 9,704 (9,246) 34,193
OTHER FINANCING SOURCES (USES):
Transfers in 9,105 19, 159
Transfers out (8,909) (8,226) (7,800) (81,569)
Sales of capital assets 49
TOTAL OTHER FINANCING SOURCES
(USES) (8,909) (8,226) 1,305 (62,361)
NET CHANGE IN FUND BALANCES (790) 1,478 (7,941) (28,168)
FUND BALANCES, JULY 1, 2002 107,888 25,519 80,437 765,105
FUND BALANCES, JUNE 30, 2003 $ 107,098 26,997 72,496 $ 736,937

107
COUNTY OF LOS ANGELES SCHEDULE OF REVENUES, EXPENDITURES AND CHANGES IN FUND BALANCES -BUDGET AND ACTUAL ON BUDGETARY BASIS NONMAJOR GOVERNMENTAL FUNDS - SPECIAL REVENUE FOR THE YEAR ENDED JUNE 30, 2003 On thousands)
TOTALS ORIGINAL FINAL ACTUAL ON VARIANCE FROM BUDGET BUDGET BUDGETARY FINAL BUDGET
BASIS OVER (UNDER)
REVENUES: Taxes $ 44,037 44,317 47,233 2,916 Licenses, permits and franchises 5,135 5,135 5,222 87 Fines, forfeitures and penalties 69, 115 68,853 66.475 (2,378) Revenue from use of money
and property: Investment income 25,624 25,672 12,261 (13.411) Rents and concessions 4,261 4,805 5,281 476 Royalties 5 5
Intergovernmental revenues: Federal 49,809 49,809 10,360 (39,449) State 158.454 171,379 215,078 43,699 Other 17,965 17,965 13,560 (4,405)
Charges for services 160,703 161,302 100.417 (60,885) Miscellaneous 54,673 54,682 39,710 (14,972)
TOTAL REVENUES 589,776 603,919 515,602 (88,317)
EXPENDITURES: Current:
General government 41.468 41,873 20,577 (21,296) Public protection 286,080 269,339 95,014 (174,325) Public ways and facilities 420,734 421,007 271,317 (149,690) Health and sanitation 79,712 93,876 84,206 (9,670) Public assistance 10,056 10,056 7,613 (2,443) Recreation and cultural services 8,298 8,388 4,754 (3,634)
TOTAL EXPENDITURES 846,348 844,539 483.481 (361,058)
EXCESS (DEFICIENCY) OF REVENUES OVER EXPENDITURES (256,572) (240,620) 32, 121 272,741
OTHER FINANCING SOURCES (USES): Sales of fixed assets 388 388 49 (339) Transfers in 15,662 17, 180 17,594 414 Transfers out (135,978) (155.416) (69,804) 85,612 Appropriation for contingencies (20,773) (20,998) 20,998 Changes in reserves and designations (5,664) (3,471) 28,217 31,688
OTHER FINANCING SOURCES (USES)- NET (146,365) (162,317) (23,944) 138,373
NET CHANGE IN FUND BALANCE (402,937) (402,937) 8,177 411,114
FUND BALANCE, JULY 1, 2002 402,964 402,964 402,964
FUND BALANCE, JUNE 30, 2003 $ 27 27 411,141 411,114
Continued ...
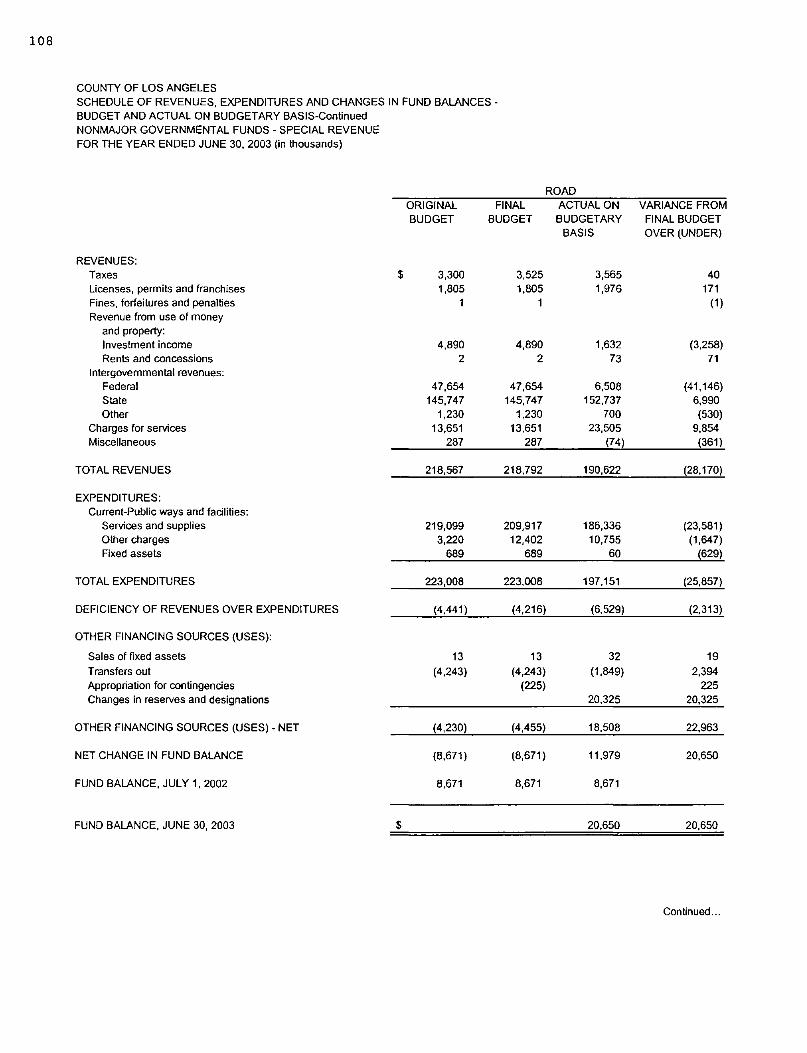
108
COUNTY OF LOS ANGELES SCHEDULE OF REVENUES, EXPENDITURES AND CHANGES IN FUND BALANCES -BUDGET AND ACTUAL ON BUDGETARY BASIS-Continued NONMAJOR GOVERNMENTAL FUNDS - SPECIAL REVENUE FOR THE YEAR ENDED JUNE 30, 2003 (in thousands)
ROAD ORIGINAL FINAL ACTUAL ON VARIANCE FROM BUDGET BUDGET BUDGETARY FINAL BUDGET
BASIS OVER (UNDER)
REVENUES: Taxes $ 3,300 3,525 3,565 40 Licenses, penllits and franchises 1,805 1,805 1,976 171 Fines, forfeitures and penalties 1 1 (1) Revenue from use of money
and property: Investment Income 4,890 4,890 1,632 (3,258) Rents and concessions 2 2 73 71
Intergovernmental revenues: Federal 47,654 47,654 6,508 (41, 146) State 145,747 145,747 152,737 6,990 Other 1,230 1,230 700 (530)
Charges for services 13,651 13,651 23,505 9,854 Miscellaneous 287 287 (74) (361)
TOTAL REVENUES 218,567 218,792 190,622 (28,170)
EXPENDITURES: Current-Public ways and facilities:
Services and supplies 219,099 209,917 186,336 (23,581) Other charges 3,220 12,402 10,755 (1,647) Fixed assets 689 689 60 (629)
TOTAL EXPENDITURES 223,008 223,008 197,151 (25,857)
DEFICIENCY OF REVENUES OVER EXPENDITURES (4,441) (4,216) (6,529) (2,313)
OTHER FINANCING SOURCES (USES):
Sales of fixed assets 13 13 32 19
Transfers out (4,243) (4,243) (1,849) 2,394 Appropriation for contingencies (225) 225 Changes in reserves and designations 20,325 20,325
OTHER FINANCING SOURCES (USES) - NET (4,230) (4,455) 18,508 22,963
NET CHANGE IN FUND BALANCE (8,671) (8,671) 11,979 20,650
FUND BALANCE, JULY 1, 2002 8,671 8,671 8,671
FUND BALANCE, JUNE 30, 2003 $ 20,650 20,650
Continued ...

109
COUNTY OF LOS ANGELES SCHEDULE OF REVENUES, EXPENDITURES AND CHANGES IN FUND BALANCES -BUDGET AND ACTUAL ON BUDGETARY BASIS-Continued NONMAJOR GOVERNMENTAL FUNDS - SPECIAL REVENUE FOR THE YEAR ENDED JUNE 30, 2003 (In thousands)
OTHER STREETS, HIGHWAYS, ROADS, AND BRIDGES ORIGINAL FINAL ACTUAL ON VARIANCE FROM BUDGET BUDGET BUDGETARY FINAL BUDGET
BASIS OVER (UNDER)
REVENUES: Taxes $ 27,488 27,488 28,997 1,509 Fines, forfeitures and penalties 29 29 24 (5) Revenue from use of money
and property: Investment income 5,007 5,007 1,748 (3,259) Rents and concessions 183 183 177 (6)
Intergovernmental revenues: Federal 2,127 2,127 3,780 1,653 State 1,271 1,271 1,026 (245) Other 15,097 15,097 11,281 (3,816)
Charges for services 60,898 60,898 17,174 (43,724) Miscellaneous 2,976 2,976 6 !2,970)
TOTAL REVENUES 115,076 115,076 64,213 !50,863)
EXPENDITURES: Current-Public ways and facilities:
Services and supplies 144,183 144,183 56,149 (88,034) Other charges 1,960 1,960 402 (1,558) Fixed assets 3,460 3,652 107 (3,545)
TOT Al EXPENDITURES 149,603 149,795 56,658 (93, 137)
EXCESS (DEFICIENCY) OF REVENUES OVER EXPENDITURES (34,527) (34,719) 7,555 42,274
OTHER FINANCING SOURCES (USES): Sales of fixed assets 375 375 (375) Transfers out (192) Appropriation for contingencies (3,977) (3,977) 3,977 Changes in reserves and designations (1,888) (1,888) 4,289 6,177
OTHER FINANCING SOURCES (USES) - NET (5,682) (5,490) 4,289 9,779
NET CHANGE IN FUND BALANCE (40,209) (40,209) 11,844 52,053
FUND BALANCE, JULY 1, 2002 40,209 40,209 40,209
FUND BALANCE, JUNE 30, 2003 $ 52,053 52,053
Continued ...

110
COUNTY OF LOS ANGELES SCHEDULE OF REVENUES, EXPENDITURES AND CHANGES IN FUND BALANCES -BUDGET AND ACTUAL ON BUDGETARY BASIS-Continued NONMAJOR GOVERNMENTAL FUNDS - SPECIAL REVENUE FOR THE YEAR ENDED JUNE 30, 2003 (in thousands)
STREET LIGHTING DISTRICTS ORIGINAL FINAL ACTUAL ON VARIANCE FROM BUDGET BUDGET BUDGETARY FINAL BUDGET
BASIS OVER (UNDER)
REVENUES: Taxes $ 10,211 10,266 11,673 1,407 Fines, forfeitures and penalties 107 112 121 9 Revenue from use of money
and property-Investment income 1,206 1,206 777 (429)
Intergovernmental revenues: Federal 23 23 State 147 147 151 4 Other 438 438 364 (74)
Charges for services 3,439 3,460 3,474 14
TOT AL REVENUES 15,548 15,629 16,583 954
EXPENDITURES: Current-Public ways and facilities-
Services and supplies 48,123 48,204 17,508 (30,696)
DEFICIENCY OF REVENUES OVER EXPENDITURES (32,575) (32,575) (925) 31,650
OTHER FINANCING SOURCES (USES): Transfers in 3,555 3,581 3,539 (42) Transfers out (3,555) (3,581) (3,539) 42 Appropriation for contingencies (4,877) (4,877) 4,877
Changes in reserves and designations (1,614) (1,614) (1,614)
OTHER FINANCING SOURCES (USES) - NET (6,491) (6,491) (1,614) 4,877
NET CHANGE IN FUND BALANCE (39,066) (39,066) (2,539) 36,527
FUND BALANCE, JULY 1, 2002 39,081 39,081 39,081
FUND BALANCE, JUNE 30, 2003 $ 15 15 36,542 36,527
Continued ...

COUNTY OF LOS ANGELES SCHEDULE OF REVENUES, EXPENDITURES AND CHANGES IN FUND BALANCES -BUDGET AND ACTUAL ON BUDGETARY BASIS-Continued NONMAJOR GOVERNMENTAL FUNDS - SPECIAL REVENUE FOR THE YEAR ENDED JUNE 30, 2003 (in thousands)
GARBAGE DISPOSAL DISTRICTS
REVENUES: Taxes Fines, forfeitures and penalties Revenue from use of money
and property-Investment income
Intergovernmental revenuesState
Charges for services
TOTAL REVENUES
EXPENDITURES: Current-Health and sanitation:
Services and supplies Other charges
TOTAL EXPENDITURES
DEFICIENCY OF REVENUES OVER EXPENDITURES
OTHER FINANCING SOURCES (USES): Appropriation for contingencies Changes in reserves and designations
OTHER FINANCING SOURCES (USES) - NET
NET CHANGE IN FUND BALANCE
FUND BALANCE, JULY 1, 2002
FUND BALANCE, JUNE 30, 2003
ORIGINAL BUDGET
$ 3,038 270
600
38 8,641
12,587
14, 111 2,390
16,501
(3,914)
(2,472) 2,540
68
(3,846)
3,846
$
FINAL BUDGET
3,038 270
600
38 8,641
12,587
14, 111 2,390
16,501
(3,914)
(2.472) 2,540
68
(3,846)
3,846
ACTUAL ON BUDGETARY BASIS
2,998 243
367
38 9,222
12,868
12,850 2,058
14,908
(2,040)
2,548
2,548
508
3,846
4,354
VARIANCE FROM FINAL BUDGET OVER (UNDER)
(40) (27)
(233)
581
281
(1,261) (332)
(1,593)
1,874
2,472 8
2,480
4,354
4,354
Continued ...
111

112
COUNTY OF LOS ANGELES SCHEDULE OF REVENUES, EXPENDITURES AND CHANGES IN FUND BALANCES -BUDGET AND ACTUAL ON BUDGETARY BASIS-Continued NONMAJOR GOVERNMENTAL FUNDS - SPECIAL REVENUE FOR THE YEAR ENDED JUNE 30, 2003 (in thousands)
SEWER MAINTENANCE DISTRICTS ORIGINAL FINAL ACTUAL ON VARIANCE FROM BUDGET BUDGET BUDGETARY FINAL BUDGET
BASIS OVER (UNDER)
REVENUES: Fines, forfeitures and penalties $ 160 160 173 13 Revenue from use of money
and property-Investment income 699 699 248 (451)
Intergovernmental revenues: Federal 28 28 (28) State 99 99 Other 15 15
Charges for services 16,972 16,972 17,134 162 Miscellaneous 6 6 8 2
TOTAL REVENUES 17,865 17,865 17,677 (188)
EXPENDITURES: Current-Health and sanitation:
Services and supplies 23,363 23,363 18,426 (4,937) Other charges 367 367 348 (19) Fixed assets 50 50 6 (44)
TOTAL EXPENDITURES 23,780 23,780 18,780 (5,000)
DEFICIENCY OF REVENUES OVER EXPENDITURES (5,915) (5,915) (1,103) 4,812
OTHER FINANCING SOURCES (USES):
Transfers out (337) (337) (69) 268 Appropriation for contingencies (226) (226) 226 Changes in reserves and designations 921 921 2,240 1,319
OTHER FINANCING SOURCES (USES) - NET 358 358 2,171 1,813
NET CHANGE IN FUND BALANCE (5,557) (5,557) 1,068 6,625
FUND BALANCE, JULY 1, 2002 5,557 5,557 5,557
FUND BALANCE, JUNE 30, 2003 $ 6,625 6,625
Continued ...

113
COUNTY OF LOS ANGELES SCHEDULE OF REVENUES, EXPENDITURES AND CHANGES IN FUND BALANCES -BUDGET AND ACTUAL ON BUDGETARY BASIS-Continued NONMAJOR GOVERNMENTAL FUNDS - SPECIAL REVENUE FOR THE YEAR ENDED JUNE 30, 2003 (in thousands)
HEALTH AND SANITATION ORIGINAL FINAL ACTUAL ON VARIANCE FROM BUDGET BUDGET BUDGETARY FINAL BUDGET
BASIS OVER (UNDER)
REVENUES: Fines, forfeitures and penalties $ 16,323 16,222 14,192 (2,030) Revenue from use of money
and property-Investment income 1,773 1,773 1,702 (71)
Intergovernmental revenues: State 3,102 16,027 48,533 32,506 Other 1,200 1,200 1,200
Charges for services 43,832 43,815 12,934 (30,881) Miscellaneous 63 63 10 (53)
TOTAL REVENUES 66,293 79,100 78,571 (529)
EXPENDITURES: Current-Health and sanitation:
Services and supplies 38,872 53,036 50,309 (2,727) Fixed assets 559 559 209 (350)
TOTAL EXPENDITURES 39,431 53,595 50,518 (3,077)
EXCESS OF REVENUES OVER EXPENDITURES 26,862 25,505 28,053 2,548
OTHER FINANCING SOURCES (USES):
Transfers out (46,435) (46,664) (40,780) 5,884 Appropriation for contingencies (95) (95) 95 Changes in reserves and designations (3,310) (1,724) (1,382) 342
OTHER FINANCING SOURCES (USES) - NET (49,840) (48,483) (42,162) 6,321
NET CHANGE IN FUND BALANCE (22,978) (22,978) (14,109) 8,869
FUND BALANCE, JULY 1, 2002 22,978 22,978 22,978
FUND BALANCE, JUNE 30, 2003 $ 8,869 8,869
Continued ...

114
COUNTY OF LOS ANGELES SCHEDULE OF REVENUES, EXPENDITURES AND CHANGES IN FUND BALANCES -BUDGET AND ACTUAL ON BUDGETARY BASIS-Continued NONMAJOR GOVERNMENTAL FUNDS - SPECIAL REVENUE FOR THE YEAR ENDED JUNE 30, 2003 (in thousands)
OTHER PUBLIC PROTECTION ORIGINAL FINAL ACTUAL ON VARIANCE FROM BUDGET BUDGET BUDGETARY FINAL BUDGET
BASIS OVER (UNDER)
REVENUES: Licenses, permits and franchises $ 30 30 31 1 Fines, forfeitures and penalties 7,915 7,915 6,057 (1,858) Revenue from use of money
and property: Investment income 4,393 4,441 1,997 (2,444) Rents and concessions 544 546 2
Intergovernmental revenues: Federal 49 49 State 6,149 8,149 12,494 4,345
Charges for services 8,991 9,586 11,167 1,581 Miscellaneous 41,408 41,417 31,342 (10,075)
TOTAL REVENUES 70,886 72,062 63,683 (8,399)
EXPENDITURES: Current-Public protection:
Services and supplies 84,678 67,471 33,576 (33,895) Other charges 3,987 5,145 3,653 (1,492) Fixed assets 31,900 31,900 16,333 (15,567)
TOTAL EXPENDITURES 120,565 104,516 53,562 (50,954)
EXCESS (DEFICIENCY) OF REVENUES OVER EXPENDITURES (49,679) (32,434) 10,121 42,555
OTHER FINANCING SOURCES (USES): Sales of fixed assets 17 17 Transfers in 3,666 4,668 4,870 2 Transfers out (25,820) (44,508) (7, 163) 37,345 Appropriation for contingencies (991) (991) 991 Changes in reserves and designations (1,075) (634) 2,199 2,833
OTHER FINANCING SOURCES (USES) - NET (24,020) (41,265) (77) 41,188
NET CHANGE IN FUND BALANCE (73,699) (73,699) 10,044 83,743
FUND BALANCE, JULY 1, 2002 73,699 73,699 73,699
FUND BALANCE, JUNE 30, 2003 $ 83,743 83,743
Continued ...

llS
COUNTY OF LOS ANGELES SCHEDULE OF REVENUES, EXPENDITURES AND CHANGES IN FUND BALANCES -BUDGET AND ACTUAL ON BUDGETARY BASIS-Continued NONMAJOR GOVERNMENTAL FUNDS - SPECIAL REVENUE FOR THE YEAR ENDED JUNE 30, 2003 (In thousands)
PUBLIC ASSISTANCE ORIGINAL FINAL ACTUAL ON VARIANCE FROM BUDGET BUDGET BUDGETARY FINAL BUDGET
BASIS OVER (UNDER)
REVENUES: Licenses, permits and franchises $ 1,400 1,400 1,346 (54) Fines, forleitures and penalties 1,712 1,546 1,519 (27) Revenue from use of money
and property-Investment income 33 33 17 (16)
Charges for services 3,323 3,323 3,262 (61) Miscellaneous 2,886 2,886 3,199 313
TOTAL REVENUES 9,354 9,188 9,343 155
EXPENDITURES: Current-Public assistance-
Services and supplies 10,056 10,056 7,613 (2,443)
EXCESS (DEFICIENCY) OF REVENUES OVER EXPENDITURES 17021 !868! 1,730 2,598
OTHER FINANCING SOURCES (USES): Transfers out (2,410) (2,410) (2,393) 17 Appropriation for contingencies (653) (653) 653 Changes in reserves and designations (496) (330) (187) 143
OTHER FINANCING SOURCES (USES) - NET (3,559) (3,393) (2,580) 813
NET CHANGE IN FUND BALANCE (4,261) (4,261) (850) 3,411
FUND BALANCE, JULY 1, 2002 4,261 4,261 4,261
FUND BALANCE, JUNE 30, 2003 $ 3,411 3,411
Continued ...

116
COUNTY OF LOS ANGELES SCHEDULE OF REVENUES, EXPENDITURES AND CHANGES IN FUND BALANCES -BUDGET AND ACTUAL ON BUDGETARY BASIS-Continued NONMAJOR GOVERNMENTAL FUNDS - SPECIAL REVENUE FOR THE YEAR ENDED JUNE 30, 2003 (in thousands)
RECREATION ORIGINAL FINAL ACTUAL ON VARIANCE FROM BUDGET BUDGET BUDGETARY FINAL BUDGET
BASIS OVER (UNDER)
REVENUES: Fines, forfeitures and penalties $ 26 26 37 11 Revenue from use of money
and property: Investment Income 41 41 19 (22) Rents and concessions 100 100 281 181
Charges for services 39 39 Miscellaneous 7,047 7,047 4,914 (2,133)
TOTAL REVENUES 7,214 7,214 5,290 (1,924)
EXPENDITURES: Current-Recreation and cultural services:
Services and supplies 8,204 8,212 4,605 (3,607) Other charges 35 36 35 (1) Fixed assets 59 140 114 (26)
TOTAL EXPENDITURES 8,298 8,388 4,754 ~3,634)
EXCESS (DEFICIENCY) OF REVENUES OVER EXPENDITURES (1,084) (1, 174) 536 1,710
OTHER FINANCING SOURCES (USES): Transfers in 90 80 (10) Appropriation for contingencies (506) (506) 506 Changes in reserves and designations (391) (391) (368) 23
OTHER FINANCING SOURCES (USES) - NET (897) (807) (288) 519
NET CHANGE IN FUND BALANCE (1,981) (1,981) 248 2,229
FUND BALANCE, JULY 1, 2002 1,981 1,981 1,981
FUND BALANCE, JUNE 30, 2003 $ 2,229 2,229
Continued ...

117
COUNTY OF LOS ANGELES SCHEDULE OF REVENUES, EXPENDITURES AND CHANGES IN FUND BALANCES -BUDGET AND ACTUAL ON BUDGETARY BASIS-Continued NONMAJOR GOVERNMENTAL FUNDS - SPECIAL REVENUE FOR THE YEAR ENDED JUNE 30, 2003 (in thousands)
COURTHOUSE TEMPORARY CONSTRUCTION ORIGINAL FINAL ACTUAL ON VARIANCE FROM BUDGET BUDGET BUDGETARY FINAL BUDGET
BASIS OVER (UNDER)
REVENUES: Fines, forfeitures and penalties $ 19,600 19,600 20,383 783 Revenue from use of money
and property: Investment income 5,000 5,000 2,307 (2,693) Rents and concessions 150 150 155 5
TOTAL REVENUES 24,750 24,750 22,845 (1,905)
EXPENDITURES: Current-Public protection:
Services and supplies 104,383 104,383 1,043 (103,340) Other charges 23,195 23,195 22,511 (684)
TOTAL EXPENDITURES 127,578 127,578 23,554 !104,024)
DEFICIENCY OF REVENUES OVER EXPENDITURES (102,828) (102,828) (709) 102,119
OTHER FINANCING SOURCES (USES): Transfers out (3,811) (3,811) 3,811 Appropriation for contingencies (478) (478) 478 Changes in reserves and designations 510 510
OTHER FINANCING SOURCES (USES) - NET (4,289) (4,289) 510 4,799
NET CHANGE IN FUND BALANCE (107, 117) (107,117) (199) 106,918
FUND BALANCE, JULY 1, 2002 107,117 107,117 107,117
FUND BALANCE, JUNE 30, 2003 $ 106,918 106,918
Continued ...

118
COUNTY OF LOS ANGELES SCHEDULE OF REVENUES, EXPENDITURES AND CHANGES IN FUND BALANCES -BUDGET AND ACTUAL ON BUDGETARY BASIS-Continued NONMAJOR GOVERNMENTAL FUNDS - SPECIAL REVENUE FOR THE YEAR ENDED JUNE 30, 2003 (in thousands)
CRIMINAL JUSTICE TEMPORARY CONSTRUCTION
REVENUES: Fines, forfeitures and penalties Revenue from use of money
and property-Investment income
TOTAL REVENUES
EXPENDITURES: Current-Public protection:
Services and supplies Other charges Fixed assets
TOTAL EXPENDITURES
EXCESS (DEFICIENCY) OF REVENUES OVER EXPENDITURES
OTHER FINANCING USES
Transfers out
NET CHANGE IN FUND BALANCE
FUND BALANCE, JULY 1, 2002
FUND BALANCE, JUNE 30, 2003
ORIGINAL BUDGET
$ 22,822
1,350
24,172
31,250 3,855 2,832
37,937
(13,765)
(9,684)
(23,449)
23,449
$
FINAL ACTUAL ON BUDGET BUDGETARY
BASIS
22,822 23,576
1,350 570
24,172 24,146
30,457 11,900 3,855 3,831 2,933 2,167
37,245 17,898
(13,073) 6,248
(10,376) (6,211)
(23,449) 37
23,449 23,449
23,486
VARIANCE FROM FINAL BUDGET OVER (UNDER)
754
(780)
(26)
(18,557) (24)
(766)
(19,347)
19,321
4,165
23,486
23,486
Continued ...

119
COUNTY OF LOS ANGELES SCHEDULE OF REVENUES, EXPENDITURES AND CHANGES IN FUND BALANCES -BUDGET AND ACTUAL ON BUDGETARY BASIS-Continued NONMAJOR GOVERNMENTAL FUNDS - SPECIAL REVENUE FOR THE YEAR ENDED JUNE 30, 2003 (in thousands)
OTHER SPECIAL REVENUE ORIGINAL FINAL ACTUAL ON VARIANCE FROM BUDGET BUDGET BUDGETARY FINAL BUDGET
BASIS OVER (UNDER)
REVENUES: Licenses, permits and franchises $ 1,900 1,900 1,869 (31) Fines, forfeitures and penalties 150 150 150 Revenue from use of money
and property: Investment income 632 632 877 245 Rents and concessions 3,826 3,826 4,049 223 Royalties 5 5
Charges for services 956 956 2,506 1,550 Miscellaneous 305 305
TOTAL REVENUES 7,464 7,464 9,761 2,297
EXPENDITURES: Current-General government:
Salaries and employee benefits 5,820 5,820 5,655 (165) Services and supplies 30,387 30,028 10,428 (19,600) Other charges 3,351 3,351 3,239 (112) F1Xed assets 1,910 2,674 1,255 !1 ,419)
TOTAL EXPENDITURES 41,468 41,873 20,577 (21,296)
DEFICIENCY OF REVENUES OVER EXPENDITURES {34,004) (34,409) p0,816) 23,593
OTHER FINANCING SOURCES (USES):
Transfers in 8,241 8,641 9,105 464 Transfers out (39,491) (39,486) (7,800) 31,686 Appropriation for contingencies (6,498) (6,498) 6,498 Changes in reserves and designations (351)· (351) (343) 8
OTHER FINANCING SOURCES (USES) - NET (38,099) (37,694) 962 38,656
NET CHANGE IN FUND BALANCE (72, 103) (72,103) (9,854) 62,249
FUND BALANCE, JULY 1, 2002 72,115 72, 115 72, 115
FUND BALANCE, JUNE 30, 2003 $ 12 12 62,261 62,249

120
COUNTY OF LOS ANGELES
COMBINING BALANCE SHEET
NONMAJOR GOVERNMENTAL FUNDS - DEBT SERVICE
JUNE 30, 2003 (in thousands}
ASSETS
Pooled cash and investments:
Operating
Other
Total pooled cash and investments
Other investments
Taxes receivable
Interest receivable
Other receivables
Due from other funds
TOTAL ASSETS
LIABILITIES AND FUND BALANCES
LIABILITIES:
Other payables
Due to other funds
Deferred revenue
TOTAL LIABILITIES
FUND BALANCES - reserved for debt service
$
$
$
TOTAL LIABILITIES AND FUND BALANCES $
Detention
Facilities
3,859
105
3,964
820
14
4,798
591
591
4,207
4,798
Regional
Flood Park and
Control Open Space Marina
District District Del Rey
4,305 66,632 11,968
86 47 676
4,391 66,679 12,644
25,973
949
11 90 23
10,723
308
5,351 66,769 49,671
422
10,295
697 12,960
697 23,677
4,654 66,769 25,994
5,351 66,769 49,671
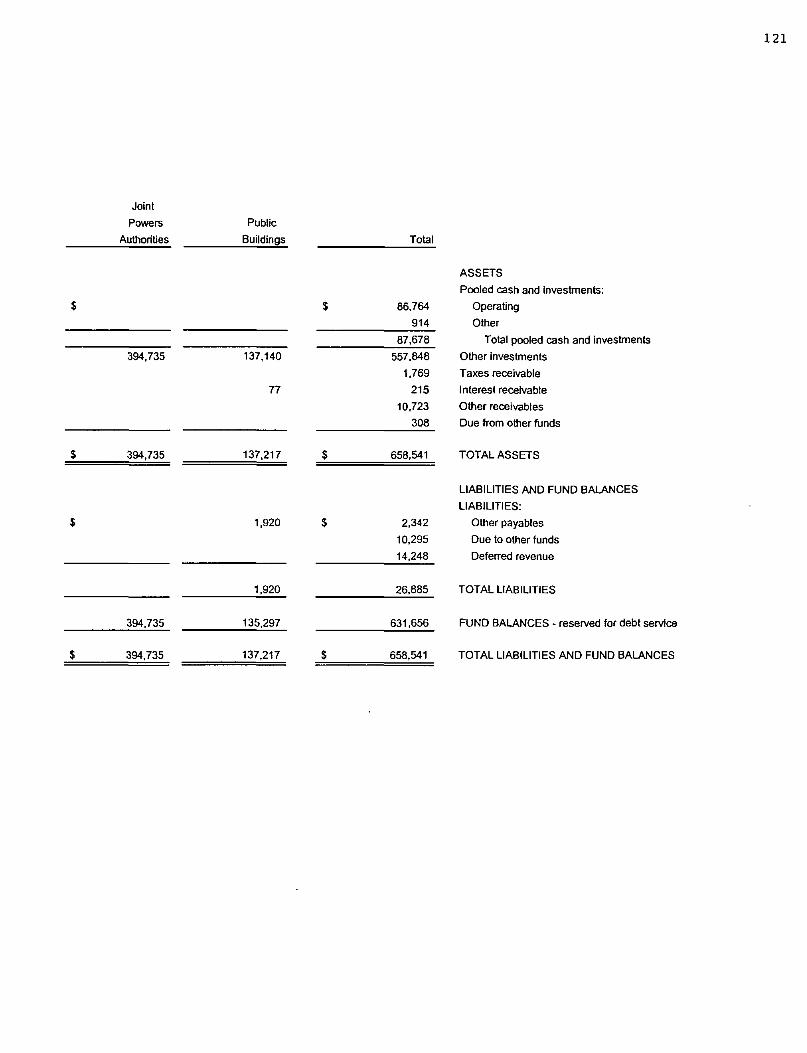
121
Joint
Powers Public
Authorities Buildings Total
ASSETS
Pooled cash and Investments:
$ $ 86,764 Operating
914 Other
87,678 Total pooled cash and Investments
394,735 137,140 557,848 Other investments
1,769 Taxes receivable
77 215 Interest receivable
10,723 Other receivables
308 Due from other funds
$ 394,735 137,217 $ 658,541 TOTAL ASSETS
LIABILITIES AND FUND BALANCES
LIABILITIES:
$ 1,920 $ 2,342 Other payables
10,295 Due to other funds
14,248 Deferred revenue
1,920 26,885 TOTAL LIABILITIES
394,735 135,297 631,656 FUND BALANCES - reserved for debt service
$ 394,735 137,217 $ 658,541 TOTAL LIABILITIES AND FUND BALANCES

122
COUNTY OF LOS ANGELES
COMBINING STATEMENT OF REVENUES, EXPENDITURES AND CHANGES IN FUND BALANCES
NONMAJOR GOVERNMENTAL FUNDS - DEBT SERVICE
FOR THE YEAR ENDED JUNE 30, 2003 (In thousands)
Regional
Flood Par1< and
Detention Control Open Space Marina
Facilities District District Del Rey
REVENUES:
Taxes $ 8,679 6,403
Licenses, permits and franchises 22
Fines, forfeitures and penalties 16 14
Revenue from use of money/property:
Investment income 123 81 361 746
Rents and concessions 29,079
Intergovernmental revenues:
State 82
Charges for services 883
Miscellaneous 9
TOTAL REVENUE 8,900 6,498 361 30,739
EXPENDITURES - Debt service:
Principal 6,280 24,026 17,560 13,857
Interest and other charges 2,880 9,587 21,185 6,297
TOTAL EXPENDITURES 9,160 33,613 38,745 20,154
EXCESS (DEFICIENCY) OF REVENUES
OVER EXPENDITURES (260) (27,115) (38,384) 10,585
OTHER FINANCING SOURCES (USES):
Transfers in 18,402 39,241
Transfers out (80) (609) (10,295)
Proceeds of refunding bonds 143, 195
Payment to refunded bonds escrow agent (143, 195)
Bond premium proceeds 8,513
TOTAL OTHER FINANCING SOURCES (USES) 26,835 38,632 (10,295)
NET CHANGE IN FUND BALANCES (260) (280) 248 290
FUND BALANCES, JULY 1, 2002 4,467 4,934 66,521 25,704
FUND BALANCES, JUNE 30, 2003 $ 4,207 4,654 66,769 25,994

123
Joint
Powers Public
Authorities Buildings Total
REVENUES:
$ $ 15,082 Taxes
22 Licenses, pennits and franchises
30 Fines, forfeitures and penalties
Revenue from use of money/property:
21, 184 6,505 29,000 Investment income
1,323 30,402 Rents and concessions
Intergovernmental revenues:
82 State
883 Charges for services
9 Miscellaneous
21,184 7,828 75,510 TOTAL REVENUES
EXPENDITURES - Debt service:
17,560 63,964 143,247 Principal
21, 184 69,698 130,831 Interest and other charges
38,744 133,662 274,078 TOTAL EXPENDITURES
EXCESS (DEFICIENCY) OF REVENUES
(17,560) (125,834) (198,568) OVER EXPENDITURES
OTHER FINANCING SOURCES (USES):
117,294 174,937 Transfers In
(7,602) (18,586) Transfers out
17,130 160,325 Proceeds of refunding bonds
(17,130) (160,325) Payment to refunded bonds escrow agent
8,513 Bond premium proceeds
109,692 164,864 TOTAL OTHER FINANCING SOURCES (USES)
(17,560) (16, 142) (33,704) NET CHANGE IN FUND BALANCES
412,295 151,439 665,360 FUND BALANCES, JULY 1, 2002
$ 394,735 135,297 $ 631,656 FUND BALANCES, JUNE 30, 2003

124
COUNTY OF LOS ANGELES SCHEDULE OF REVENUES, EXPENDITURES AND CHANGES IN FUND BALANCES -BUDGET AND ACTUAL ON BUDGETARY BASIS NONMAJOR GOVERNMENTAL FUNDS - DEBT SERVICE FOR THE YEAR ENDED JUNE 30, 2003 (in thousands)
TOTALS ORIGINAL FINAL ACTUAL ON VARIANCE FROM BUDGET BUDGET BUDGETARY FINAL BUDGET
BASIS OVER (UNDER)
REVENUES: Taxes $ 11,018 11,018 15,098 4,080 Licenses, permits and franchises 10 10 22 12 Fines, forfeitures and penalties 64 64 32 (32) Revenue from use of money
and property: Investment income 3,723 3,723 1,378 (2,345) Rents and concessions 30,513 30,513 29,079 (1,434)
Intergovernmental revenues: State 80 80 81 1
Charges for services 1,088 1,088 883 (205) Miscellaneous 10 10 9 (1)
TOTAL REVENUES 46,506 46,506 46,582 76
EXPENDITURES: Debt service:
Principal 44,317 44,317 44,317 (0) Interest 57,956 57,956 30,822 (27,134)
TOT AL EXPENDITURES 102,273 102,273 75,139 (27,134)
DEFICIENCY OF REVENUES OVER EXPENDITURES (55,767) (55,767) (28,557) 27,210
OTHER FINANCING SOURCES (USES): Transfers in 35,996 35,996 39,241 3,245 Transfers out (13,424) (13,424) (10,904) 2,520 Appropriation for contingencies (438) (438) 438 Changes In reserves and designations 847 847 847
OTHER FINANCING SOURCES (USES) - NET 22,981 22,981 29,184 6,203
NET CHANGE IN FUND BALANCE (32,786) (32,786) 627 33,413
FUND BALANCE, JULY 1, 2002 32,786 32,786 32,786
FUND BALANCE, JUNE 30, 2003 $ 33,413 33,413
Continued ...

125
COUNTY OF LOS ANGELES SCHEDULE OF REVENUES, EXPENDITURES AND CHANGES IN FUND BALANCES -BUDGET AND ACTUAL ON BUDGETARY BASIS-Continued NONMAJOR GOVERNMENTAL FUNDS - DEBT SERVICE FOR THE YEAR ENDED JUNE 30, 2003 ~n thousands)
DETENTION FACILITIES
ORIGINAL FINAL ACTUAL ON VARIANCE FROM
BUDGET BUDGET BUDGETARY FINAL BUDGET BASIS OVER (UNDER)
REVENUES:
Taxes $ 6,020 6,020 8,730 2,710 Fines, forfeitures and penalties 17 17 Revenue from use of money
and property-Investment Income 250 250 126 (124)
Intergovernmental revenues-
State 80 80 81
TOTAL REVENUES 6,350 6,350 8,954 2,604
EXPENDITURES:
Debt service: Principal 6,280 6,280 6,280
Interest 2,882 2,882 2,880 (2)
TOTAL EXPENDITURES 9,162 9,162 9,160 (2)
DEFICIENCY OF REVENUES OVER EXPENDITURES (2,812) (2,812) (206) 2,606
OTHER FINANCING SOURCES (USES): Appropriation for contingencies (229) (229) 229 Changes in reserves and designations 448 448 448
OTHER FINANCING SOURCES (USES) - NET 219 219 448 229
NET CHANGE IN FUND BALANCE (2,593) (2,593) 242 2,835
FUND BALANCE, JULY 1, 2002 2,593 2,593 2,593
FUND BALANCE, JUNE 30, 2003 $ 2,835 2,835
Continued ...

126
COUNTY OF LOS ANGELES SCHEDULE OF REVENUES, EXPENDITURES AND CHANGES IN FUND BALANCES -BUDGET AND ACTUAL ON BUDGETARY BASIS-Continued NONMAJOR GOVERNMENTAL FUNDS - DEBT SERVICE FOR THE YEAR ENDED JUNE 30, 2003 (in thousands)
FLOOD CONTROL DISTRICT ORIGINAL FINAL ACTUAL ON VARIANCE FROM BUDGET BUDGET BUDGETARY FINAL BUDGET
BASIS OVER (UNDER)
REVENUES: Taxes $ 4,998 4,998 6,368 1,370 Fines. forfeitures and penalties 64 64 15 (49) Revenue from use of money
and property-Investment income 177 177 85 (92)
TOTAL REVENUES 5,239 5,239 6,468 1,229
EXPENDITURES: Debt service:
Principal 6,020 6,020 6,020 Interest 760 760 759 Pl
TOTAL EXPENDITURES 6,780 6,780 6,779 (1)
DEFICIENCY OF REVENUES OVER EXPENDITURES (1,541) (1,541) (311) 1,230
OTHER FINANCING SOURCES (USES): Appropriation for contingencies (209) (209) 209 Changes in reserves and designations 399 399 399
OTHER FINANCING SOURCES (USES) - NET 190 190 399 209
NET CHANGE IN FUND BALANCE (1,351) (1,351) 88 1,439
FUND BALANCE, JULY 1, 2002 1,351 1,351 1,351
FUND BALANCE, JUNE 30, 2003 $ 1,439 1,439
Continued ...

COUNTY OF LOS ANGELES SCHEDULE OF REVENUES, EXPENDITURES AND CHANGES IN FUND BALANCES -BUDGET AND ACTUAL ON BUDGETARY BASIS-Continued NONMAJOR GOVERNMENTAL FUNDS - DEBT SERVICE FOR THE YEAR ENDED JUNE 30, 2003 On thousands)
REVENUES: Revenue from use of money
and property-Jnvestment income
EXPENDITURES: Debt service:
Principal Interest
TOT AL EXPENDITURES
DEFICIENCY OF REVENUES OVER EXPENDITURES
OTHER FINANCING SOURCES (USES): Transfers in Transfers out
OTHER FINANCING SOURCES (USES) - NET
NET CHANGE JN FUND BALANCE
FUND BALANCE, JULY 1, 2002
FUND BALANCE, JUNE 30, 2003
$
$
REGIONAL PARK AND OPEN SPACE DISTRICT ORIGINAL FINAL ACTUAL ON VARIANCE FROM BUDGET BUDGET BUDGETARY FINAL BUDGET
1,400 1,400
17,560 17,560 48,068 48,068
65,628 65,628
(64,228) (64,228)
35,996 35,996 (610) (610)
35,386 35,386
(28,842) (28,842)
28,842 28,842
BASIS OVER (UNDER)
410
17,560 21,185
38,745
(38,335)
39,241 (609)
38,632
297
28,842
29,139
(990)
(26,883)
(26,883)
25,893
3,245 1
. 3,246
29,139
29,139
Continued ...
127

128
COUNTY OF LOS ANGELES SCHEDULE OF REVENUES, EXPENDITURES AND CHANGES IN FUND BALANCES -BUDGET AND ACTUAL ON BUDGETARY BASIS-Continued NONMAJOR GOVERNMENTAL FUNDS - DEBT SERVICE FOR THE YEAR ENDED JUNE 30, 2003 (In thousands)
MARINA DEL REY
REVENUES: Licenses, permits and franchises Revenue from use of money
and property: Investment income Rents and concessions
Charges for services Miscellaneous
TOT AL REVENUES
EXPENDITURES: Debt service:
Principal Interest
TOTAL EXPENDITURES
EXCESS OF REVENUES OVER EXPENDITURES
OTHER FINANCING USES -Transfers out
NET CHANGE IN FUND BALANCE
FUND BALANCE, JULY 1, 2002
FUND BALANCE, JUNE 30, 2003
ORIGINAL BUDGET
$ 10
1,896 30,513
1,088 10
33,517
14,457 6,246
20,703
12,814
(12,814)
$
FINAL ACTUAL ON BUDGET BUDGETARY
BASIS
10 22
1,896 757 30,513 29,079
1,088 883 10 9
33,517 30,750
14,457 14,457 6,246 5,998
20,703 20,455
12,814 10,295
(12,814) (10,295)
0
0
VARIANCE FROM FINAL BUDGET OVER (UNDER)
12
(1,139) (1,434)
(205) (1)
(2,767)
(0) (248)
(248)
(2,519)
2,519
0
0

COUNTY OF LOS ANGELES
COMBINING BALANCE SHEET
NONMAJOR GOVERNMENTAL FUNDS - CAPITAL PROJECTS
JUNE 30, 2003 On thousands)
Accumulative
Capital
Outlay
ASSETS
Pooled cash and investments:
Operating $ 47,649
Other 77
Total pooled cash and Investments 47,726
Other investments 137
Interest receivable 114
Other receivables 2
Due from other funds 1.465
TOTAL ASSETS $ 49,444
LIABILITIES AND FUND BALANCES
LIABILITIES:
Accounts payable $ 609
Due to other funds 1,188
TOTAL LIABILITIES 1,797
FUND BALANCES:
Reserved for:
Encumbrances 2,481
Other 7,364
Unreserved-Undesignated 37,802
TOTAL FUND BALANCES 47,647
TOTAL LIABILITIES AND FUND BALANCES $ 49,444
129
Flood
Control Improvement Public
District Districts Buildings Total
100 4,317 $ 52,066
78
100 4,318 52,144
120 62,216 62,473
2 29 145
2
1.465
220 4,320 62,245 $ 116,229
1,399 $ 2,008
5 1,193
5 1,399 3,201
8,384 10,865
7,364
220 4,315 52,462 94,799
220 4,315 60,846 113,028
220 4,320 62,245 $ 116,229

130
COUNTY OF LOS ANGELES
COMBINING STATEMENT OF REVENUES, EXPENDITURES AND CHANGES IN FUND BALANCES
NONMAJOR GOVERNMENTAL FUNDS - CAPITAL PROJECTS
FOR THE YEAR ENDED JUNE 30, 2003 (in thousands)
Accumulative Flood
Capital Control Improvement
OuUay District Districts
REVENUES:
Revenue from use of money and property -
Investment income $ 980 23 26
Charges for services 3,149
Proceeds from property owners 8,123
Miscellaneous 1, 144
TOTAL REVENUES 5,273 23 8,149
EXPENDITURES - Capital ouUay 11,564 4,820
EXCESS (DEFICIENCY) OF REVENUES
OVER EXPENDITURES (6,291) 23 3,329
OTHER FINANCING SOURCES:
Transfers in 1,661 80
Sales of capital assets 7
TOTAL OTHER FINANCING SOURCES 1,668 80
NET CHANGE IN FUND BALANCES (4,623) 103 3,329
FUND BALANCES, JULY 1, 2002 52,270 117 986
FUND BALANCES, JUNE 30, 2003 $ 47,647 220 4,315
Public
Buildings Total
2,431 $ 3,460
3,149
8,123
1, 144
2,431 15,876
61,846 78,230
(59,415) (62,354)
7,098 8,839
7
7,098 8,846
(52,317) (53,508)
113,163 166,536
60,846 $ 113,028

COUNTY OF LOS ANGELES
COMBINING BALANCE SHEET
NONMAJOR GOVERNMENTAL FUNDS - PERMANENT FUNDS
JUNE 30, 2003 (in thousands)
ASSETS
Pooled cash and investments:
Operating
Other
Total pooled cash and investments
Other investments
Interest receivable
TOTAL ASSETS
LIABILITIES - Due to other funds
FUND BALANCES - Reserved for annuities and endowments
TOTAL LIABILITIES AND FUND BALANCES
Annuities
$ 285
285
929
16
$ 1,230
$
1,230
$ 1,230
131
Endowments Total
2,305 $ 2,590
4 4
2,309 2,594
929
5 21
2,314 $ 3,544
3 $ 3
2,311 3,541
2,314 $ 3,544

132
COUNTY OF LOS ANGELES
COMBINING STATEMENT OF REVENUES, EXPENDITURES AND CHANGES IN FUND BALANCES
NONMAJOR GOVERNMENTAL FUNDS - PERMANENT FUNDS
FOR THE YEAR ENDED JUNE 30, 2003 (In thousands)
REVENUES:
Revenue from use of money and property -
Investment income
EXPENDITURES - General government
EXCESS OF REVENUES OVER EXPENDITURES
FUND BALANCE, JULY 1, 2002
FUND BALANCE, JUNE 30, 2003
Annuities
$ 131
62
69
1, 161
$ 1,230
Endowments Total
40 $ 171
22 84
18 87
2,293 3,454
2,311 $ 3,541

NONMAJOR ENTERPRISE FUNDS

COUNTY OF LOS ANGELES
NONMAJOR ENTERPRISE FUNDS
The Aviation Enterprise Fund was established to provide for the maintenance and operations of the five airports which are owned by the County. Operating revenues are derived primarily from charges for services and rentals associated with airport operations.
The Waterworks Enterprise Funds were established to· provide for the administration, maintenance and operation and improvement of district water systems. Revenues are derived primarily from the sale of water and water service standby charges.
The Community Development Commission Enterprise Fund was established to provide for the operation, maintenance and management of certain housing developments. Revenues are derived primarily from tenant rentals and Federal grants.

133
COUNTY OF LOS ANGELES
COMBINING STATEMENT OF NET ASSETS
NONMAJOR ENTERPRISE FUNDS
JUNE 30, 2003 (in thousands)
Total
Community Nonmajor
Waterworks Development Enterprise
Aviation Funds Commission Funds
ASSETS
Current assets:
Pooled cash and investments:
Operating $ 4,674 21,444 $ 26,118
Other 338 338
Total pooled cash and investments 4,674 21,782 26,456
Other investments 16,756 16,756
Taxes receivable 1,501 1,501
Accounts receivable - net
Interest receivable 55 55
Other receivables 632 5,403 6,415 12,450
Due from other funds 2 607 609
Advances to other funds 772 772
Inventories 2,812 2,812
Total current assets 5,308 30,120 25,983 61,411
Noncurrent assets:
Capital assets:
Land 11,449 4,015 65,114 80,578
Buildings and Improvements 47,948 132,381 142,078 322,407
Equipment 927 201 948 2,076
Construction In progress 250 2,076 2,326
Less accumulated depreciation (29,174) (61,501) (121,179) (211,854)
Total capital assets - net 31,400 77,172 86,961 195,533
Total noncurrent assets 31,400 77,172 86,961 195,533
TOTAL ASSETS 36,708 107,292 112,944 256,944
LIABILITIES
Current liabilities:
Accounts payable 65 3,033 5,074 8,172
Other payables 1,320 411 1,731
Due to other funds 197 3,122 679 3,998
Deferred revenue 111 465 576
Current portion of long-term liabilities 58 546 604
Total current liabilities 1,582 6,324 7,175 15,081
Noncurrent liabilities -
Bonds and notes payable 239 7,269 7,508
TOTAL LIABILITIES 1,582 6,563 14,444 22,589
NET ASSETS
Invested In capital assets, net of related debt 31,400 76,875 79,255 187,530
Restricted 23,854 19,245 43,099
Unrestricted 3,726 3,726
TOTAL NET ASSETS $ 35,126 100,729 98,500 $ 234,355

134
COUNTY OF LOS ANGELES
COMBINING STATEMENT OF REVENUES, EXPENSES AND CHANGES IN FUND NET ASSETS
NONMAJOR ENTERPRISE FUNDS
FOR THE YEAR ENDED JUNE 30, 2003 (in thousands)
Total
Community Nonmajor
Waterworks Development Enterprise
Aviation Funds Commission Funds
OPERATING REVENUES:
Rentals $ 2,273 9,909 $ 12, 182
Charges for services 366 37,462 37,828
Other 3,912 3,912
TOTAL OPERATING REVENUES 2,639 37,462 13,821 53,922
OPERATING EXPENSES:
Services and supplies 3,245 38,584 208,267 250,096
Other professional services 50 634 684
Depreciation and amortization 1,323 3,000 6,624 10,947
TOTAL OPERATING EXPENSES 4,618 42,218 214,891 261,727
OPERATING LOSS (1,979) (4,756) (201,070) (207,805)
NONOPERATING REVENUES (EXPENSES):
Truces 2,772 2,772
Interest income 500 349 849
Interest expense (28) (376) (404)
Intergovernmental revenues:
State 250 32 282
Federal 967 713 198,508 200,188
TOTAL NONOPERATING REVENUES 1,217 3,989 198,481 203,687
LOSS BEFORE TRANSFERS (762) (767) (2,589) (4,118)
Transfers in 1,741 1,741
Transfers out (176) (6,114) (6,290)
CHANGE IN NET ASSETS (762) (943) (6,962) (8,667)
TOT AL NET ASSETS, JULY 1, 2002 35,888 101,672 105,462 243,022
TOTAL NET ASSETS, JUNE 30, 2003 $ 35, 126 100,729 98,500 $ 234,355

135
COUNTY OF LOS ANGELES
COMBINING STATEMENT OF CASH FLOWS
NONMAJOR ENTERPRISE FUNDS
FOR THE YEAR ENDED JUNE 30, 2003 (in thousands)
Total
Community Nonmajor
Waterworks Development Enterprise
Aviation Funds Commission Funds
CASH FLOWS FROM OPERATING ACTIVITIES:
Rentals received $ 2,273 14, 146 $ 16,419
Cash received from charges for services 787 37,770 38,557
Other operating revenues 3,912 3,912
Cash paid for services and supplies (2,208) (34,333) (211,054) (247,595)
Other operating expenses (50) (634) (684)
Net cash provided by (required for) operating
activities 802 2,803 (192,996) (189,391)
CASH FLOWS FROM NONCAPITAL FINANCING ACTIVITIES: Cash advances paid/returned to other funds (25) (25)
Transfers in 1,741 1,741
Transfers out (176) (6,114) (6,290)
Net cash required for noncapital financing activities (201) (4,373) (4,574)
CASH FLOWS FROM CAPITAL AND RELATED FINANCING
ACTIVITIES:
Proceeds from taxes 2,514 2,514
Intergovernmental receipts 1,217 745 198,508 200,470
Interest paid on capital borrowing (28) (376) (404)
Principal payments on bonds (85) (500) (585)
Acquisition and construction of capital assets (1,473) (6,324) (104) (7,901)
Net cash provided by (required for) capital and related
financing activities (256) (3,178) 197,528 194,094
CASH FLOWS FROM INVESTING ACTIVITIES -
Interest income received 445 349 794
Net Increase (decrease) in cash and cash
equivalents 546 (131) 508 923
Cash and cash equivalents, July 1, 2002 4,128 21,913 16,248 42,289
Cash and cash equivalents, June 30, 2003 $ 4,674 21,782 16,756 $ 43,212
Continued ...

136
COUNTY OF LOS ANGELES
COMBINING STATEMENT OF CASH FLOWS - Continued
NONMAJOR ENTERPRISE FUNDS
FOR THE YEAR ENDED JUNE 30, 2003 (in thousands)
Total
Community Non major
Waterworks Development Enterprise
Aviation Funds Commission Funds
RECONCILIATION OF OPERATING LOSS TO NET CASH
PROVIDED BY (REQUIRED FOR) OPERATING ACTIVITIES:
Operating loss $ (1,979) (4,756) (201,070) $ (207,805)
Adjustments to reconcile operating loss to net cash
provided by (required for) operating activities:
Depreciation and amortization 1,323 3,000 6,624 10,947
Other charges - net 1,131 3,643 30 4,804
(Increase) decrease in:
Other receivables 423 1,065 4,154 5,642
Due from other funds (2) (607) (609)
Inventories 610 610
Increase (decrease) in:
Accounts payable 49 43 (4,039) (3,947)
Other payables (60) 2 (58)
Due to other funds (83) 565 610 1,092
Deferred revenue (150) 83 (67)
TOTAL ADJUSTMENTS 2,781 7,559 8,074 18,414
NET CASH PROVIDED BY (REQUIRED FOR)
OPERATING ACTIVITIES $ 802 2,803 (192,996) $ (189,391)
RECONCILIATION OF CASH AND CASH EQUIVALENTS
TO THE STATEMENT OF NET ASSETS:
Pooled cash and investments $ 4,674 21,782 $ 26,456
Other investments 16,756 16,756
TOTAL $ 4,674 21,782 16,756 $ 43,212

INTERNAL SERVICE FUNDS

COUNTY OF LOS ANGELES
INTERNAL SERVICE FUNDS
The Public Works Fund was established to account for the cost of services provided by the Department of Public Works to the Road Fund, Flood Control District, County Engineer and various other special districts and agencies. Costs are recovered through billings for services.
The Equipment Acquisition Fund was established to account for the operations of the Los Angeles County Capital Asset Leasing Corporation. County departments are charged for equipment items acquired on their behalf. The charges represent recovery of equipment depreciation expense and bond interest expense. ·
The Community Development Commission Internal Service Fund was established to account for the accumulation of resources for, and the payment of, .services provided to various departments within the Commission. The charges for services are on a costreimbursement basis.

137
COUNTY OF LOS ANGELES
COMBINING STATEMENT OF NET ASSETS
INTERNAL SERVICE FUNDS
JUNE 30, 2003 (in thousands)
Community
Public Equipment Development
Wor1<s Acquisition Commission Total
ASSETS
Current assets:
Pooled cash and investments:
Operating $ 40,762 4,690 $ 45,472
Other 6,266 12 6,260
Total pooled cash and investments 47,050 4,702 51,752
Other investments 6,363 6,363
Interest receivable 91 27 116
Other receivables 59 24 63
Due from other funds 46,644 31 48,875
Inventories 6,236 210 6,446
Total current assets 102,282 4,760 8,597 115,639
Noncurrent assets:
Restricted assets 12,652 12,652
Net pension obligation 32,967 32,967
Capital assets:
Buildings and improvements 1,734 1,734
Equipment 105,700 99,890 4,187 209,777
Less accumulated depreciation (58,006) (48,397) (2,939) (109,342)
Total capital assets - net 49,426 51,493 1,248 102,169
Total noncurrent assets 82,395 64,145 1,246 147,788
TOTAL ASSETS 184,677 68,905 9,845 263.427
LIABILITIES
Current liabilities:
Accounts payable 1,562 2,769 1,346 5,677
Accrued payroll 17,567 17,567
Other payables 241 10 251
Accrued interest payable 195 195
Due to other funds 19,731 94 19,825
Advances from other funds 22,000 22,000
Deferred revenue 2,153 657 2,810
Current portion of long-term liabilities 23,516 18,255 1,249 43,022
Total current liabilities 86,772 21,229 3,346 111,347
Noncurrent liabilities:
Accrued vacation and sick leave 30,600 737 31,337
Bonds and notes payable 34,935 34,935
Pension bonds payable 86,317 86,317
Capital lease obligations 192 192
Wor1<ers' compensation liability 55,066 980 56,046
Litigation and self-insurance liability 13,717 2,515 16,232
Total noncurrent liabilities 185,700 34,935 4,424 225,059
TOTAL LIABILITIES 272,472 56, 164 7,770 336,406
NET ASSETS
Invested in capital assets, net of related debt 49,426 12,046 894 62,366
Restricted 695 1, 161 1,876
Unrestricted (137,223) (137,223)
TOTAL NET ASSETS (DEFICIT) $ (87,795) 12,741 2,075 $ (72,979)

138
COUNTY OF LOS ANGELES
COMBINING STATEMENT OF REVENUES, EXPENSES AND CHANGES IN FUND NET ASSETS
INTERNAL SERVICE FUNDS
FOR THE YEAR ENDED JUNE 30, 2003 (In thousands)
Community
Public Equipment Development
Works Acquisition Commission Total
OPERATING REVENUES:
Rentals $ 29,719 $ 29,719
Charges for services 305,663 13,748 319,411
TOTAL OPERATING REVENUES 305,663 29,719 13,748 349,130
OPERATING EXPENSES:
Salaries and employee benefits 263,536 263,536
Services and supplies 31,459 132 16,550 48,141
Other professional services 7,632 7,632
Depreciation and amortization 7,707 25,134 504 33,345
TOTAL OPERATING EXPENSES 310,334 25,266 17,054 352,654
OPERATING INCOME (LOSS) (4,671) 4,453 (3,306) (3,524)
NONOPERATING REVENUES (EXPENSES)
Interest income 271 350 621
Interest expense (8,564) (1,790) (28) (10,382)
Intergovernmental revenues - federal 3,328 3,328
TOTAL NONOPERATING REVENUES (EXPENSES) (8,293) (1,440) 3,300 (6,433)
INCOME (LOSS) BEFORE TRANSFERS (12,964) 3,013 (6) (9,957)
Transfers in 3,200 3,200
Transfers out (1,804) (1,804)
CHANGE IN NET ASSETS (9,764) 1,209 (6) (8,561)
TOTAL NET ASSETS (DEFICIT), JULY 1, 2002 (78,031) 11,532 2,081 (64,418)
TOTAL NET ASSETS (DEFICIT), JUNE 30, 2003 $ (87,795) 12,741 2,075 $ (72,979)

139
COUNTY OF LOS ANGELES
COMBINING STATEMENT OF CASH FLOWS
INTERNAL SERVICE FUNDS
FOR THE YEAR ENDED JUNE 30, 2003 ~n thousands)
Community
Public Equipment Development
Works Acquisition Commission Total
CASH FLOWS FROM OPERATING ACTIVITIES:
Rentals received $ 29,688 $ 29,688
Cash received from charges for services 283,252 14,819 298,071
Cash paid for salaries and employee benefits (244,655) (244,655)
Cash paid for services and supplies (13,361) (132) (15,436) (28,929)
Other operating expenses (7,632) (7,632)
Net cash provided by (required for) operating activities 17,604 29,556 (617) 46,543
CASH FLOWS FROM NONCAPITAL FINANCING ACTIVITIES:
Interest paid on pension bonds (8,564) (8,564)
Transfers in 3,200 3,200
Transfers out (1,804) (1,804)
Net cash required for noncapital financing
activities (5,364) (1,804) (7, 168)
CASH FLOWS FROM CAPITAL AND RELATED
FINANCING ACTIVITIES:
Intergovernmental receipts 3,328 3,328
Proceeds from bonds and notes 40,935 40,935
Interest paid on capital borrowing (1,903) (28) (1,931)
Principal payments on bonds and notes (52,080) (52,080)
Principal payments on capital leases (134) (134)
Acquisition and construction of capital assets (11,127) (15,441) (387) (26,955)
Net cash provided by (required for) capital and related
financing activities (11,127) (28,489) 2,779 (36,837)
CASH FLOWS FROM INVESTING ACTIVITIES -
Interest income received 370 370
Net increase (decrease) in cash and cash equivalents 1,113 (367) 2,162 2,908
Cash and cash equivalents, July 1, 2002 45,937 17,721 6,201 69,859
Cash and cash equivalents, June.30, 2003 $ 47,050 17,354 8,363 $ 72,767
Continued ...

140
COUNTY OF LOS ANGELES
COMBINING STATEMENT OF CASH FLOWS - Continued
INTERNAL SERVICE FUNDS
FOR THE YEAR ENDED JUNE 30, 2003 (in thousands)
Community
Public Equipment Development
Works Acquisition Commission Total
RECONCILIATION OF OPERATING INCOME (LOSS) TO
NET CASH PROVIDED BY (REQUIRED FOR)
OPERATING ACTIVITIES:
Operating income (loss) $ (4,671) 4,453 (3,306) $ (3,524)
Adjustments to reconcile operating income (loss) to net
cash provided by (required for) operating activities:
Depreciation and amortization 7,707 25,134 504 33,345
Other charges - net (197) 42 (155)
(Increase) decrease in:
Interest receivable 189 189
Other receivables (9) 414 405
Due from other funds (22,555) (31) (22,586)
Inventories (206) (63) (269)
Net pension obligation 6,502 6,502
Increase (decrease) in:
Accounts payable (1,230) 44 (1,186)
Accrued payroll 806 806
Other payables (43) (43)
Accrued vacation and sick leave 876 41 917
Due to other funds 19,731 50 19,781
Deferred revenue (36) 657 621
Pension bonds payable (6,295) (6,295)
Workers' compensation liability 15,659 15 15,674
Litigation and self-insurance liability 1,376 985 2,361
TOTAL ADJUSTMENTS 22,275 25,103 2,689 50,067
NET CASH PROVIDED BY (REQUIRED FOR) OPERATING
ACTIVITIES $ 17,604 29,556 (617) $ 46,543
RECONCILIATION OF CASH AND CASH EQUIVALENTS
TO THE STATEMENT OF NET ASSETS:
Pooled cash and investments $ 47,050 4,702 $ 51,752
Other investments 8,363 8,363
Restricted assets 12,652 12,652
TOTAL $ 47,050 17,354 8,363 $ 72,767
FIDUCIARY FUNDS

COUNTY OF LOS ANGELES
FIDUCIARY FUNDS
POOLED INVESTMENT TRUST FUND:
The Pooled Investment Trust Fund was established to account for net assets of the County's external investment pool. The fund primarily consists of deposits held on behalf of School Districts and Sanitation Districts.
SPECIFIC INVESTMENT TRUST FUND:
The Specific Investment· Trust Fund is used to account for the net assets of individual investment accounts, in aggregate. The related investment activity occurs separately from the County's investment pool and is provided as a service to external investors.
AGENCY:
Agency funds have been established to account for cash and other assets and related liabilities of such funds as temporary funds for deposits of unapportioned taxes, departmental funds, and clearing and revolving funds.

COUNTY OF LOS ANGELES
COMBINING STATEMENT OF FIDUCIARY NET ASSETS
FIDUCIARY FUNDS - INVESTMENT TRUST FUNDS
JUNE 30, 2003 (in thousands)
ASSETS
Pooled cash and investments
Other investments
Interest receivable
TOTAL ASSETS
NET ASSETS
Held in trust for investment trust fund participants
Pooled
Investment
Trust Fund
$ 9,376,421
37,723
9,414,144
$ 9,414,144
141
Specific
Investment
Trust Fund Total
$ 9,376,421
2,024,234 2,024,234
12,248 49,971
2,036,482 11,450,626
2,036,482 $ 11,450,626

142
COUNTY OF LOS ANGELES
COMBINING STATEMENT OF CHANGES IN FIDUCIARY NET ASSETS
FIDUCIARY FUNDS - INVESTMENT TRUST FUNDS
FOR THE YEAR ENDED JUNE 30, 2003 (in thousands)
Pooled
Investment
Trust Fund
ADDITIONS:
Contributions to investment trust funds $ 34,689,475
Interest income 132,095
TOTAL ADDITIONS 35,021,570
DEDUCTIONS -
Distribution from investment trust funds 33,630,597
CHANGE IN NET ASSETS 1,390,973
NET ASSETS HELD IN TRUST, JULY 1, 2002 8,023,171
NET ASSETS HELD IN TRUST, JUNE 30, 2003 $ 9,414,144
Specific
Investment
Trust Fund Total
5,832,994 $ 40,722,469
44,179 176,274
5,877,173 40,898,743
4,436, 113 38,066,710
1,441,060 2,832,033
595,422 8,618,593
2,036,482 $ 11,450,626

COUNTY OF LOS ANGELES
COMBINING STATEMENT OF CHANGES IN ASSETS AND LIABILITIES
FIDUCIARY FUNDS - AGENCY FUNDS
FOR THE YEAR ENDED JUNE 30, 2003 (in thousands)
Balance
July 1, 2002
TOTAL AGENCY FUNDS
ASSETS
Pooled cash and investments $ 1,070,726
Other investments 302
Taxes receivable 239,887
Interest receivable 10,024
TOTAL ASSETS $ 1,320,939
LIABILITIES
Due to other governments $ 1,320,939
TOTAL LIABILITIES $ 1,320,939
143
Balance
Additions Deductions June 30, 2003
85,415,399 85,378,440 $ 1,107,685
43,882 605 43,579
572,470 558,446 253,911
2,295 10,043 2,276
86,034,046 85,947,534 $ 1,407,451
2,122,224 2,035,712 $ 1,407,451
2,122,224 2,035,712 $ 1,407,451

144

CAPITAL ASSETS
USED IN THE OPERATION OF
GOVERNMENTAL FUNDS

COUNTY OF LOS ANGELES
CAPITAL ASSETS USED IN THE OPERATION OF GOVERNMENTAL FUNDS
SCHEDULE BY SOURCE'
JUNE 30, 2003 On thousands)
Governmental Funds Capital Assets:
Land
Buildings and improvements
Equipment
Infrastructure
Construction in progress-Buildings and improvements
Construction in progress-Infrastructure
Total governmental funds capital assets
Investments in governmental funds capital assets by source:
General fund
Special Revenue funds
Capital Projects funds
Total governmental funds capital assets
$
$
$
$
'This schedule presents only the capital assets balances related to governmental
funds. Accordingly, the capital assets reported in internal service funds are
exduded from the above amounts. The capital assets of internal service funds
are included within governmental activities in the statement of net assets.
145
Total
276,239
3,366,412
564,208
98,487
300,921
59,402
4,665,669
3,919,539
737,392
8,738
4,665,669

146
COUNTY OF LOS ANGELES CAPITAL ASSETS USED IN THE OPERATION OF GOVERNMENTAL FUNDS SCHEDULE BY FUNCTION' JUNE 30, 2003 (in thousands)
Buildings and
Land Improvements
Function: General government $ 29,948
Public protection 99,764
Public ways and facilities 2,237
Health and sanitation 6,380
Public assistance 23, 137
Education 7, 114
Recreation and cultural services 107,659
Total governmental funds capital assets $ 276,239
'This schedule presents only the capital assets balances related to governmental funds. Accordingly, the capital assets reported in internal service funds are excluded from the above amounts. The capital assets of internal service funds are Included within governmental activities In the statement of net assets.
279,332 2,267,622
13,893 58,535
183,533 49,382
514,115
3,366,412
Equipment Infrastructure
124,628 354,475 42,095
3,222 56,392
35,755 19,997
5,437
20,694
564,208 98,487

147
Construction in Progress Construction
Buildings and in Progress Improvements Infrastructure Total
Function:
$ 6,337.0 $ 440,245 General government 138,801 29,012 2,931,769 Public protection
224 30,390 106,358 Public ways and facilities 1,900 102,570 Health and sanitation
314 226,981 Public assistance 3,369 65,302 Education
149,976 792,444 Recreation and cultural services
$ 300,921 59,402 $ 4,665,669 Total governmental funds capital assets

148
COUNTY OF LOS ANGELES CAPITAL ASSETS USED IN THE OPERATION OF GOVERNMENTAL FUNDS SCHEDULE OF CHANGES BY FUNCTION' JUNE 30, 2003 (in thousands)
Balance July 1, 2002 Additions
Function: General government $ 433,829 Public protection 2,810,275 Public ways and facilities 31,605 Health and sanitation 94,417 Public assistance 225,965 Education 61,591 Recreation and cultural services 776,012
Total governmental funds capital assets $ 4,433,694
'This schedule presents only the capital assets balances related to governmental funds. Accordingly, the capital assets reported in internal service funds are excluded from the above amounts. The capital assets of internal service funds are included within governmental activities in the statement of net assets.
29,440 331,945 104,025
19,898 14,794 5,095
45,613
550,810
Balance Deductions June 30, 2003
(23,024) $ 440,245 (210,451) 2,931,769
(29,272) 106,358 (11,745) 102,570 (13,778) 226,981
(1,384) 65,302 (29, 181) 792,444
(318,835) $ 4,665,669

SSSTTTAAATTTIIISSSTTTIIICCCAAALLL SSSEEECCCTTTIIIOOONNN

14
12
10
8
6
4
2
0 93-94
Expenditures 9.9
Revenues 8. 7
COUNTY of LOS ANGELES General Governmental Expenditures & Revenues
Last 10 Fiscal Years
94-95 95-96 96-97 97-98 98-99 99-00 00-01
11 .1 9.8 9.7 9.8 10.5 11 11 .8
8.8 9.2 9.3 9.6 10.1 11 .2 11 .7
In Billions of Dollars
[ • Expenditures [] Revenues
01-02
11.7
12.2
02-03
11 .9
12.5

150
COUNTY OF LOS ANGELES GENERAL GOVERNMENTAL EXPENDITURES BY FUNCTION LAST TEN FISCAL YEARS (In Thousands)
FUNCTION 1993-94 1994-95
General government $ 396,997 415,219
Public protection 2,610,305 2,686,944
Public ways and facilities 190,600 218, 155
Health and san~ation 2, 133,835 1,758,178
Public assistance 3,799,275 3,973,040
Education 43,396 60,067
Recreation and cultural services 171,598 160,252
Debt service 336,986 1,686,047 (1)
Capital outlay 179,663 100,712
TOTAL $ 9,862,655 11,058,614
Source: Comprehensive Annual Financial Report
1995-96 1996-97 1997-98
478,680 415,241 408,378
2,749,821 2,718,755 2,857,944
188,590 173,072 182,829
1,659,727 1,731,003 2,013,821
4,007,782 3,915,607 3,703,503
51,691 55,594 56,553
179,324 204,064 190,758
344,233 340,482 368,897
167,031 108,848 64,967
9,826,879 9,662,666 9,847,650
Includes General Fund, Fire Protection, Flood Control District, Public Library, Regional Park and Open Space District, and Other Governmental Funds (Special Revenue Funds, Debt Service Funds, Capital Projects Funds, and Permanent Funds).
(1) In FY 94-95 the Debt service expenditures include one-time pension payments of $1,390,714,000,
related to the Issuance of 1994-95 pension bonds.

151
1998-99 1999-2000 2000-2001 2001-2002 2002-2003 FUNCTION
$ 436,520 520,740 639,527 589,281 652,393 General government
3,132,176 3,369,610 3,636,902 3,795,429 3,768,650 Public protection
209,190 248,166 279,703 261,679 287,853 Public ways and facilities
2,081,634 2,161,285 2,493,074 1,765,432 1,826,083 Health and sanitation
3,845,071 4,053,280 4,041,544 4,360,342 4,461,044 Public assistance
61,864 65,769 71,998 72,542 74,013 Education
217,544 227,318 238,071 235,188 225,329 Recreation and cultural services
454,489 329,688 337,017 470,758 489,813 Debt service
89,851 52,329 67,620 120,579 99,710 Capital outlay
$ 10,528,339 11,028, 185 11,805,456 11,671,230 11,884,888 TOTAL
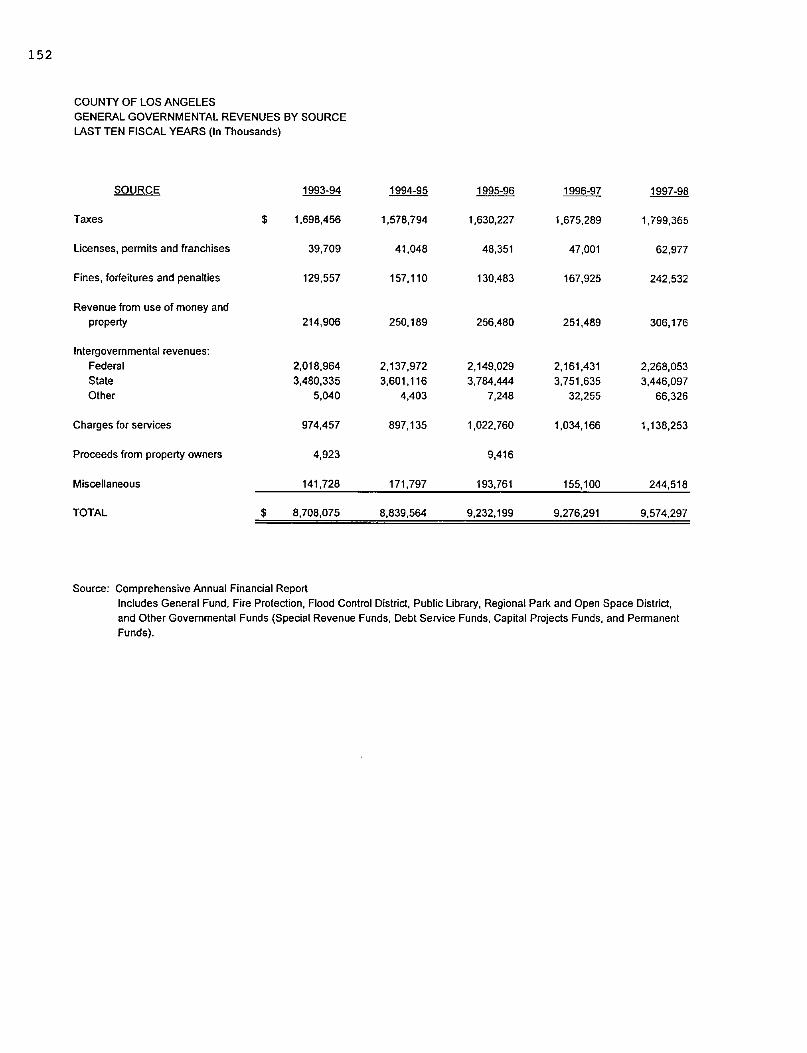
152
COUNTY OF LOS ANGELES GENERAL GOVERNMENTAL REVENUES BY SOURCE LAST TEN FISCAL YEARS (In Thousands)
SOURCE 1993-94
Taxes $ 1,698,456
Licenses, perrntts and franchises 39,709
Fines, forfeitures and penalties 129,557
Revenue from use of money and property 214,906
Intergovernmental revenues: Federal 2,018,964 State 3,480,335 Other 5,040
Charges for services 974,457
Proceeds from property owners 4,923
Miscellaneous 141,728
TOTAL $ 8,708,075
Source: Comprehensive Annual Financial Report
1994-95 1995-96 1996-97 1997-98
1,578,794 1,630,227 1,675,289 1,799,365
41,048 48,351 47,001 62,977
157,110 130,483 167,925 242,532
250, 189 256,480 251,489 306,176
2,137,972 2,149,029 2, 161,431 2,268,053 3,601,116 3,784,444 3,751,635 3,446,097
4,403 7,248 32,255 66,326
897, 135 1,022,760 1,034, 166 1, 138,253
9,416
171,797 193,761 155,100 244,518
8,839,564 9,232,199 9,276,291 9,574,297
Includes General Fund, Fire Protection, Flood Control District, Public Library, Regional Par1< and Open Space District, and Other Governmental Funds (Special Revenue Funds, Debt Service Funds, Capital Projects Funds, and Permanent Funds).

153
1998-99 1999-2000 2000-2001 2001-2002 2002-2003 SOURCE
$ 1,902,194 1,969,177 2,140,646 2,282,620 2,422,005 Taxes
52,532 58,611 58,986 59,712 67.478 Licenses, permits and franchises
252,201 262, 142 254,919 264,713 262,604 Fines, forfeitures and penalties
Revenue from use of money and 298,175 298,630 357,632 214,300 160.401 property
Intergovernmental revenues: 2,817,649 3, 113,281 3,006,474 3,252,597 3,198,572 Federal 3,274, 149 3,735,572 4,039,887 4,170,053 4,331,478 State
67,768 88,213 104, 169 98,051 107,337 Other
1,289,122 1,327,383 1,445,182 1,538,368 1,625,583 Charges for services
9,068 22,521 1,336 8,123 Proceeds from property owners
187,043 296,094 271,737 295,902 294,278 Miscellaneous
$ 10,141,033 11,158,171 11,702,353 12,177,652 12,477,859 TOTAL

154
COUNTY OF LOS ANGELES PROPERTY TAX LEVIES AND COLLECTIONS LAST TEN FISCAL YEARS (In Thousands)
Ratio of Ratio of Total Current Percent of Delinquent Total Total Tax Outstanding Del. Taxes
Fiscal Tax Tax Current Taxes Tax Tax Collections to Delinquent To Total Year lmci Collections Collected Collections Collections Total Tax Levv Taxes Tax Levv
1993-94 $ 5,404,312 $ 5,033,521 93.1 $ 351,572 $ 5,385,093 99.6 $ 1,147,941 21.2
1994-95 5,402,496 5,128,589 94.9 379,958 5,508,547 102.0 1,083,695 20.1
1995-96 5,468, 162 5,198,333 95.1 340,398 5,538,731 101.3 1,119,821 20.5
1996-97 5,505,658 5,252,253 95.4 312,632 5,564,885 101.1 1,099,594 20.0
1997-98 5,570,515 5,374,125 96.5 379,128 5,753,253 103.3 931,922 16.7
1998-99 5,760,686 5,549,836 96.3 317,984 5,867,820 101.9 927,526 16.1
1999-00 6,078,979 5,852,946 96.3 300,309 6,153,255 101.2 953,463 15.7
2000-01 6,441,176 6,228,309 96.7 283,004 6,511,313 101.1 987,721 15.3
2001-02 6,964,486 6,760,147 97.1 315,213 7,075,360 101.6 979,497 14.1
2002-03 7,415,691 7,182,974 96.9 290,775 7,473,749 100.8 1,046,059 14.1

COUNTY OF LOS ANGELES GROSS ASSESSED VALUE OF TAXABLE PROPERTY LAST TEN FISCAL YEARS (In Thousands)
Fiscal Year Secured
1993-94 $ 482,666,686
1994-95 489,979,385
1995-96 471,356,158
1996-97 474,306,711
1997-98 477, 145,025
1998-99 489,487,788
1999-00 517,855,790
2000-01 551,649, 114
2001-02 587,752,921
2002-03 626,278,005
155
Unsecured Total
$ 29,780,227 $ 512,446,913
29,153,172 519, 132,557
30,092,019 501,448, 177
31,412,568 505,719,279
32,644,992 509, 790,017
35,296,402 524, 784, 190
36,598,823 554,454,613
38,862,504 590,511,618
42,614,294 630,367,215
41,928,753 668,206,758

156
COUNTY OF LOS ANGELES PROPERTY TAX RATES - COMPUTATION OF DIRECT AND OVERLAPPING DEBT - TAX RATE AREA #4 (PER $100 OF ASSESSED VALUE) LAST TEN FISCAL YEARS
Los Angeles Los Angeles Los Angeles Fiscal County County City Tax School Metropolitan Year General Flood Control District District No. 1 Districts Water District General Total
1993-94 .001713 .004212 .018699 .003611 .008900 1.000000 1.037135
1994-95 .001993 .006041 .025211 .004036 .008900 1.000000 1.046181
1995-96 .001814 .000963 .038012 .003358 .008900 1.000000 1.053047
1996-97 .001604 .001991 .035969 .003338 .008900 1.000000 1.051802
1997-98 .001584 .002197 .031098 .012017 .008900 1.000000 1.055796
1998-99 .001451 .001953 .030161 .024749 .008900 1.000000 1.067214
1999-00 .001422 .001765 .031113 .031528 .008900 1.000000 1.074728
2000-01 .001314 .001552 .026391 .040765 .008800 1.000000 1.078822
2001-02 .001128 .001073 .040051 .064125 .007700 1.000000 1.114077
2002-03 .001033 .000881 .042312 .051571 .006700 1.000000 1.102497
Source: •secured Tax Rate and Ratios" Report from Auditor-Controller, Tax Division. The tax rate for Tax Rate Area #4, which applies to most property within the City of Los Angeles, is use to illustrate the breakdown of a tax rate within the County. Article XlllA (Proposition 13) lim~s the maximum ad valorem tax rate to 1 % of "full cash value" except for indebtedness
approved by the voters prior to July 1, 1978. An exception to the 1 % limit was provided by Proposition 46 which was approved in June, 1986, re-establishing authority of local governments to issue general obligation bonds for certain purposes.

COUNTY OF LOS ANGELES RATIO OF NET GENERAL BONDED DEBT TO ASSESSED VALUE AND NET BONDED DEBT PER CAPITA LAST TEN FISCAL YEARS (Dollars in Thousands)
Ratio of Net
Debt Bonded Gross Service Net Debt to
Fiscal Population Assessed Bonded Monies Bonded Assessed Year (1) Value Debt (2l Available (2! Debt Value
1993-94 9,230,599 $ 512,446,913 $ 3,108,489 $ 490,997 $ 2,617.492 .5108
1994-95 9,244,646 519, 132,557 5,090,012 529,595 4,560.417 .8785
1995-96 9,369,848 501,448, 177 4,900,582 467,357 4,433,225 .8841
1996-97 9,488,225 505, 719,279 4,804,391 460,399 4,343,992 .8590
1997-98 9,603,545 509,790,017 4,974,432 793,479 4,180,953 .8201
1998-99 9,757,535 524,784, 190 4,672,329 649,348 4,022,981 .7666
1999-00 9,884,350 554,454,613 4,466,999 633,082 3,833,917 .6915
2000-01 9,802,690 590,511,618 4,291,604 634,099 3,657,505 .6194
2001-02 9,825,045 630,367,215 3,930,381 593,905 3,336,476 .5293
2002-03 9,979,465 668,206, 758 3,699,715 560,233 3,139,482 .4698
Notes: (1) Source: California Department of Finance
(2) Long-term general obligation bonded debt outstanding includes, Detention Facilities, Nonprofit Corporations, Public Buildings Certificates of Participation, Pension Obligation Certificates, Marina Del Rey Certificates and Community Development Commission. The amounts do not include indebtedness and debt service monies
available which are less than County-wide (Regional Par!< and Open Space District, Flood Control and Waterworks Districts), for which population and assessed values vary.
157
Net Bonded Debt per Capita
$ 283.57
493.30
473.14
457.83
435.36
412.29
387.88
373.11
339.59
314.59

158
COUNTY OF LOS ANGELES COMPUTATION OF LEGAL DEBT MARGIN JUNE 30, 2003
Assessed valuation (net taxable) August 2002 (1) Applicable percentage in computing capacity
Total debt limlt
Less indebtedness, JUNE 30, 2003 (2)
Legal debt margin, JUNE 30, 2003
$ 660,255,040,874 1.25%
$ 8,253, 188,010
30,225,000
$ 8,222,963,010
Notes: (1) Net taxable valuation does not include homeowners' exemption of $7,951,716,626 which cannot be considered as part of the
valuation in computing legal debt margin.
(2) Represents County General Obligation Bonds only.
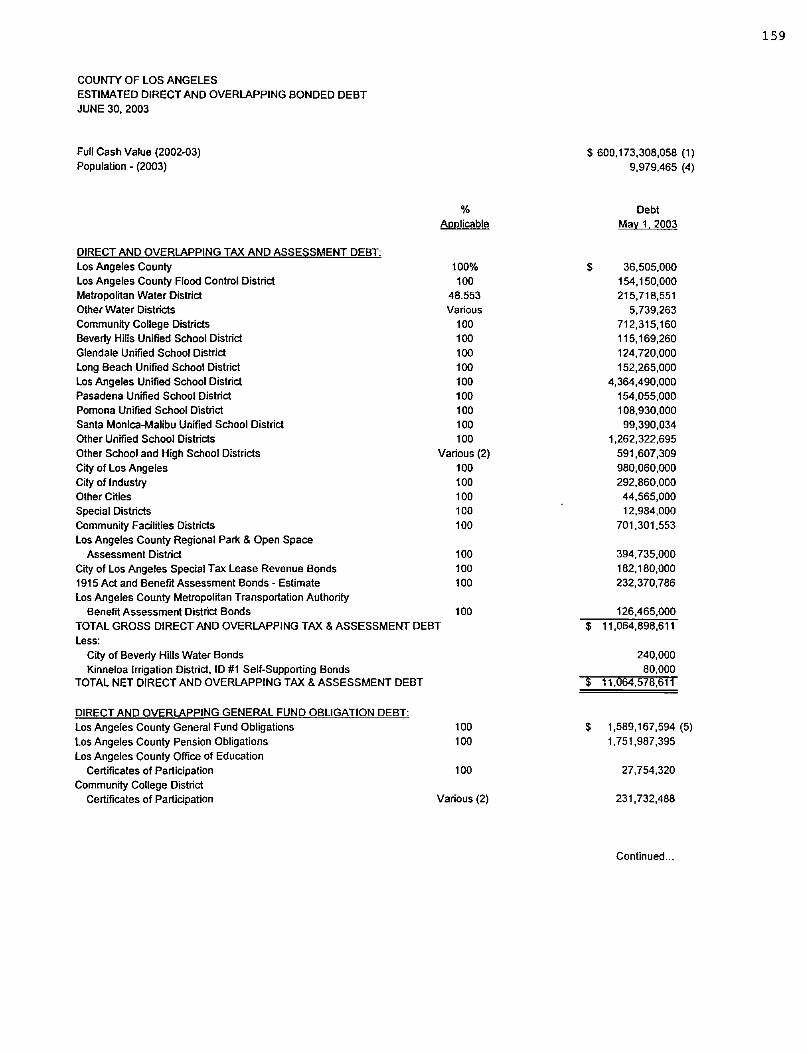
COUNTY OF LOS ANGELES ESTIMATED DIRECT AND OVERLAPPING BONDED DEBT JUNE 30, 2003
Full Cash Value (2002-03) Population - (2003)
DIRECT AND OVERLAPPING TAX AND ASSESSMENT DEBT: Los Angeles County Los Angeles County Flood Control District Metropolltan Water District other Water Districts Community College Districts Beverly Hills Unified School District Glendale Unified School District Long Beach Unified School District Los Angeles Unified School District Pasadena Unified School District Pomona Unified School District Santa Monica-Malibu Unified School District Other Unified School Districts Other School and High School Districts
City of Los Angeles City of Industry other Cities Special Districts Community Facilities Districts Los Angeles County Regional Park & Open Space
Assessment District City of Los Angeles Special Tax Lease Revenue Bonds 1915 Act and Benefit Assessment Bonds - Estimate Los Angeles County Metropolltan Transportation Authority
% Applicable
100% 100
48.553 Various
100 100 100 100 100 100 100 100 100
Various (2) 100 100 100
100 100
100 100 100
Benefit Assessment District Bonds 100 TOTAL GROSS DIRECT AND OVERLAPPING TAX & ASSESSMENT DEBT
Less: City of Beverly Hills Water Bonds Kinneloa Irrigation District, ID #1 Self-Supporting Bonds
TOTAL NET DIRECT AND OVERLAPPING TAX & ASSESSMENT DEBT
DIRECT AND OVERLAPPING GENERAL FUND OBLIGATION DEBT: Los Angeles County General Fund Obligations
Los Angeles County Pension Obligations Los Angeles County Office of Education
Certificates of Participation Community College District
Certificates of Participation
100 100
100
Various (2)
159
$ 600,173,308,058 (1)
9,979,465 (4)
Debt May 1 2003
$ 36,505,000 154, 150,000 215,718,551
5,739,263 712,315,160 115,169,260
124,720,000 152,265,000
4,364,490,000 154,055,000 108,930,000 99,390,034
1,262,322,695
591,607,309 980,060,000 292,860,000
44,565,000 12,984,000
701,301,553
394,735,000
182.180,000 232,370,786
126,465,000
$ 11,064,898,611
240,000
80,000 $ 11,064,578,611
$ 1,589, 167,594 (5)
1,751,987,395
27,754,320
231, 732,488
Continued ...

160
COUNTY OF LOS ANGELES ESTIMATED DIRECT AND OVERLAPPING BONDED DEBT-Continued JUNE 30, 2003
DIRECT AND OVERLAPPING GENERAL FUND OBLIGATION DEBT:-Con't.
Los Angeles Unified School District Certificates of Participation
Long Beach Unified School District Certificates of Participation
Other Unified School District Certificates of Participation
School and High School District General Fund Obligations
City° of Beverly Hills General Fund Obligations City of Los Angeles General Fund &
Judgement Obligations City of Long Beach General Fund Obligations City of Long Beach Pension Obligations City of Pasadena General Fund Obligations City of Pasadena Pension Obligations Other Cities' General Fund Obligations Los Angeles County Sanitation Districts
100
100
100
Various (2) 100
100 100 100 100 100 100
General Fund Obligations 100 Other Special Districts General Fund Obligations 100 TOTAL GROSS DIRECT AND OVERLAPPING GENERAL FUND OBLIGATION DEBT Less:
Los Angeles County Certificates of Participation (100% self-supporting from leasehold revenues on properties in Marina del Rey)
Pomona Unified School District Lease Revenue Bonds
Cities' self-supporting bonds Walnut Valley Water District General Fund Obligations
TOTAL NET DIRECT AND OVERLAPPING GENERAL FUND OBLIGATION DEBT
GROSS COMBINED TOTAL DEBT
NET COMBINED TOTAL DEBT
RATIOS TO 2002-03 ASSESSED VALUATION Direct Debi ($36,505,000) Total Gross Direct and Overlapping Tax and Assessment Debt Total Net Direct and Overlapping Tax and Assessment Debt
RATIOS TO FULL CASH VALUE (ADJUSTED ASSESSED VALUATION) Combined Direct Debt ($3,377,659,989) Net Combined Direct Debt ($3,294,429,989) Gross Combined Total Debt Net Combined Total Debt
STATE SCHOOL BUILDING AID REPAYABLE AS OF 6/30102:
(1) Excludes $68,033,449,442 redevelopment incremental valuation; includes unitary utility valuation.
$
675,540,000
71,315,000
288,948,283
228,010,231 200.115,000
1,286,838,000 267,800,000 110,825,000 252,650,000 100,655,000 742,726,660
322,730,000 19, 130,000
8,167,924,971
83,230,000 12,000,000
193,569,600 17,940,000
$ 7,861,185,371
$ 19,232,823,582 (3)
$ 18,925,763,982
.01% 1.66% 1.66%
.56%
.55% 3.20% 3.15%
$ 2,345,981
(2) AJl 100%, or almost 100%, except for Antelope Valley Joint UHSD, Fullerton UHSD and Community College District, and the schools and special districts included in them.
(3) Excludes tax and revenue anticipation notes, enterprise revenue, mortgage revenue and tax allocation bonds and non-bonded capital lease obligations.
(4) Source: California Department of Finance (5) Excludes tax and revenue anticipation notes to be sold.
Source: California Municipal Statistics

COUNTY OF LOS ANGELES RATIO OF ANNUAL DEBT SERVICE FOR GENERAL BONDED DEBT TO TOTAL GENERAL GOVERNMENTAL EXPENDITURES LAST TEN FISCAL YEARS (In Thousands)
Ratio of Debt Service
Total to Total Total General General
Fiscal Debt Governmental Governmental Year Principal Interest Service Expenditures 11 l Expenditures
1993-94 $ 121,185 $ 144,946 $ 266, 131 $ 9,862,655 2.70
1994-95 96,598 132,085 228,683 11,058,614 2.07
1995-96 137,068 142,261 279,329 9,826,879 2.84
1996-97 126,570 155,876 282,446 9,662,666 2.92
1997-98 174,478 128,883 303,361 9,847,650 3.08
1998-99 263,273 144,762 408,035 10,528,339 3.88
199~0 165,066 126, 164 291,230 11,028,185 2.64
2000-01 163,043 135,089 298, 132 11,805,456 2.53
2001-02 150,917 136,286 287,203 11,671,230 2.46
2002-03 149,320 132,522 281,842 11,884,888 2.37
Note: (1) Includes General Fund, Fire Protection, Flood Control District, Public Library, Regional Park and Open Space District, and
Other Governmental Funds (Special Revenue Funds, Debt Service Funds, Capltal Projects Funds, and Permanent Funds).
161

162
COUNTY OF LOS ANGELES SCHEDULE OF INSURANCE IN FORCE JUNE 30, 2003
Type of Coverage
Aviation: Airport/Aviation Hull Protection
On Ground & In Flight Boiler & Machinery Properties:
Over 500 Locations LAC-CAL equipment Public library books
Fidelity Insurance: Crime Public Official Bond
Fiduciary liability: Savings Plans, Deferred Compensation and Thrift Plan,
Deferred Earnings Plan, Pension Savings Plan Fine Arts:
At County Museums At Other Locations or in Transit
Hospital General liability Public Safety Employee:
Sheriff Reserve Disability
Aviation Personal Volunteer Workers (Accident)
Special Event liability Insurance Contractors liability (SPARTA)
Policy limits Per Occurrence
$ 50,000,000
Replacement Value 100,000,000
Replacement Value Replacement Value Replacement Value
10,000,000 Specified for each official
20,000,000
300,000,000 100,000,000 95,000,000
10,000
25,000 10,000
1,000,000 1,000,000
Aggregate
$ Unlimited
Unlimited
800,000,000 300,000,000 80,000,000
Unlimited
20,000,000
Unlim~ed
Unlim~ed
Unlim~ed
300/Week 2 year max. 1,000,000 1,000,000
250,000 2,000,000 2,000,000
All Risk, Flood, & Earthquake
All Risk & Earthquake
Per event Per Contract

COUNTY OF LOS ANGELES PUBLIC OFFICIAL BLANKET BOND
JUNE 30, 2003
OFFICIAL
Assessor
Audijor-Controller
Chief Medical Examiner
Coroner
County Clerk
District Attorney
Public Administrator
Registrar-Recorder
Sheriff-Civil
Sheriff-Criminal
County Engineer-Surveyor
Treasurer and Tax Collector:
Treasurer
Tax Collector
License Collector
Board of Supervisors (per Supervisor)
Superintendent of Schools
163
$ 50,000
50,000
50,000
50,000
50,000
50,000
50,000
50,000
50,000
50,000
50,000
300,000
50,000
50,000
50,000
50,000
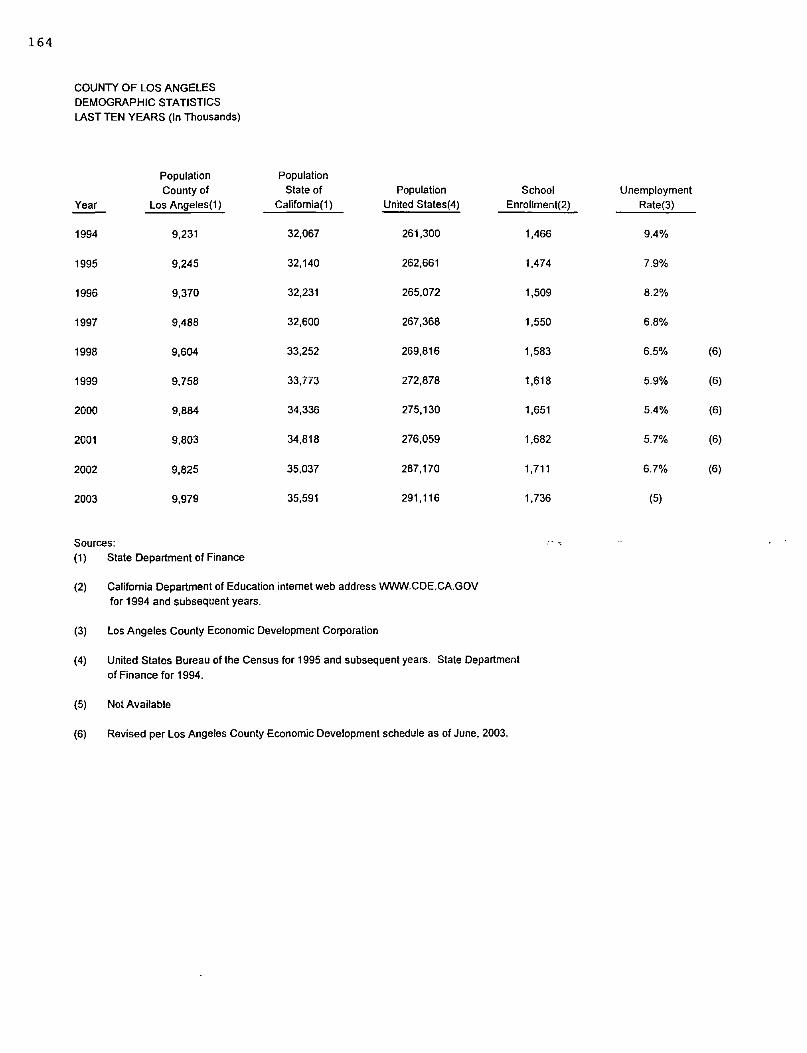
164
COUNTY OF LOS ANGELES DEMOGRAPHIC STATISTICS LAST TEN YEARS (In Thousands)
Population County of
Population State of Population School
Year Los Angeles(1) Califomia(1) United States(4) Enrollment(2)
1994 9,231 32,067 261,300
1995 9,245 32, 140 262,661
1996 9,370 32,231 265,072
1997 9,488 32,600 267,368
1998 9,604 33,252 269,816
1999 9,758 33,773 272,878
2000 9,884 34,336 275,130
2001 9,803 34,818 276,059
2002 9,825 35,037 287,170
2003 9,979 35,591 291, 116
Sources: (1) State Department of Finance
(2) California Department of Education internet web address WWW.COE.CA.GOV for 1994 and subsequent years.
(3) Los Angeles County Economic Development Corporation
(4) United States Bureau of the Census for 1995 and subsequent years. State Department of Finance for 1994.
(5) Not Available
(6) Revised per Los Angeles County Economic Development schedule as of June, 2003.
1,466
1,474
1,509
1,550
1,583
1,618
1,651
1,682
1,711
1,736
. ·.
Unemployment Rate(3)
9.4%
7.9%
8.2%
6.8%
6.5% (6)
5.9% (6)
5.4% (6)
5.7% (6)
6.7% (6)
(5)

COUNTY OF LOS ANGELES
PROPERTY VALUE, CONSTRUCTION AND BANK DEPOSITS
LAST TEN YEARS
Valuation (1) (In Millions) New Dwelling Untts(1) (In Thousands) Bank Non- Total Single Multiple Total Deposits (2)
Year Residential Residential Values Family Family Untts (In Thousands)
1993 ............ $ 1,910.1 2,176.5 4,086.6 4.4 2.9 7.3 $ 156, 101,482
1994 ............ 2, 154.5 2,263.0 4,417.5 4.6 3.0 7.6 151,449,736
1995 ............ 2,234.0 1,995.8 4,229.8 5.4 3.0 8.4 153,714,269
1996 ............ 2,087.0 2,082.2 4, 169.2 5.4 3.0 8.4 147,100,000
1997 ............ 2,476.0 2,200.0 4,676.0 6.8 3.6 10.4 129,308,848
1998 ............ 2,785.0 2,344.0 5,129.0 6.7 4.8 11.5 132,611,000
1999 ............ 3,282.0 3,650.0 6,932.0 7.8 6.4 14.2 131,996,000
2000 ............ 3,808.0 3,297.0 7, 105.0 8.3 8.6 16.9 138, 122, 000
2001 ............ 3,983.0 3,529.0 7,512.0 8.2 9.9 18.1 153,369,000
2002 ............ 4,285.0 2,895.0 7, 180.0 8.2 11.1 19.3 165,632,000
(1) Source: Construction Industry Research Board and Real Estate Research Council of Southern California for 1993 to 1997.
Real Estate Research Council of Southern California for 1998 and subsequent years.
(2) For 1996 and prior years, bank data is for Commercial Banks, Savings & Loans and Credtt Unions. Data was compiled by Sheshunoff Information Services, Inc., California, and is obtained from the L.A. Economic Development Corporation.
For 1997 and subsequent years, data is for Commercial Banks and Savings & Loans. Data is from the Federal Deposit Insurance Corporations (FDIC) Internet web address WWW.FDIC.GOV.
165

166
COUNTY OF LOS ANGELES PRINCIPAL TAXPAYERS JUNE 30, 2003
Taxpayers
Pacific Bell
Southern California Edison Company
Chevron USA, Inc.
Atlantic Richfield Company
Douglas Emmett Realty Fund
Verizon California, Inc.
Exxon Mobil Corporation
Southern California Gas Company
Arden Realty LTD Partnership
Tosco Corporation
Total
$
$
Source: Los Angeles County Treasurer and Tax Collector
Total Tax Levy
Fiscal Year 2002-03
32,846,775
32,467,659
24,467,562
21,314,956
19,262,669
19,224, 123
18,567,627
17,735,954
14,786,089
13,010,997
213,684,411
Percentage Percentage of Total Tax Levy
of Fiscal Year Total 2002-03
15.37 .44
15.19 .44
11.45 .33
9.98 .29
9.01 .26
9.00 .26
8.69 .25
8.30 .24
6.92 .20
6.09 .18
100.00 2.88

COUNTY OF LOS ANGELES COUNTY IMPROVEMENT DISTRICTS SPECIAL ASSESSMENT BILLINGS AND COLLECTIONS LAST TEN FISCAL YEARS (In Thousands)
FISCAL YEAR
1993-94
1994-95
1995-96
1996-97
1997-98
1998-99
1999-00
2000-01
2001--02
2002--03
(1) Includes prepayments and foreclosures.
167
SPECIAL ASSESSMENT SPECIAL ASSESSMENTS BILLINGS COLLECTED (1)
15,529 13,504
13,787 13, 149
14,748 10,744
16,797 11,360
15,100 12,219
17,083 12,971
9,929 8,777
12,388 11,502
10, 188 9,294
11,030 10,500

168
COUNTY OF LOS ANGELES
MISCELLANEOUS STATISTICAL DATA
JUNE 30, 2003
GEOGRAPHICAL LOCATION: The County of Los Angeles is located in the southern portion of California and is bordered on the east by
Orange and San Bernardino Counties, on the north by Kern County, on the west by Ventura County and on
the south by the Pacific Ocean.
ALTITUDE: 9 feet below sea level at Wilmington to 10,080 feet above sea level at Mt. San Antonio
AREA OF COUNTY: 4,083.21 square miles
COUNTY SEAT: Los Angeles, California
FORM OF GOVERNMENT: Chartered County, governed by five-member Board of Supervisors
DATE CHARTER ADOPTED: June 2, 1913
FISCAL YEAR: July 1 - June 30
REGISTERED VOTERS: 3,880,241 as of January 22, 2003
Estimated Population of the County of Los Angeles
As of January, 2003 (1)
INCORPORATED CITIES: Agoura Hills 21.950 Commerce
Alhambra 88,900 Compton
Arcadia 55,500 Covina
Artesia 17,000 Cudahy
Avalon 3,320 Culver City
Azusa 47,150 Diamond Bar
Baldwin Park 79,600 Downey
Bell 38,250 Duarte
Bellflower 76,400 El Monte
Bell Gardens 45,750 El Segundo
Beverly Hills 35,350 Gardena
Bradbury 920 Glendale
Burbank 104,500 Glendora
Calabasas 21,100 Hawaiian Gardens
Carson 94,800 Hawthorne
Cerritos 54,200 Hermosa Beach
Claremont 36,100 Hidden Hills
13,200
97,000
48,700
25,450
40,250
59,000
111,700
22,400
121,900
16,700
60,100
202,700
51,500
15,600
87,400
19,350
2,000
Continued ...

COUNTY OF LOS ANGELES
MISCELLANEOUS STATISTICAL DATA-Continued
JUNE 30, 2003
INCORPORATED CITIES-Continued:
Huntington Park
Industry
Inglewood
Irwindale
La Canada-Flintridge
La Habra Heights
Lakewood
La Mirada
Lancaster
La Puente
La Veme
Lawndale
Lomita
Long Beach
Los Angeles
Lynwood
Malibu
Manhattan Beach
Maywood
Monrovia
Montebello
Monterey Park
Norwalk
Palmdale
Palos Verdes Estates
Paramount
Pasadena
Pico Rivera
Pomona
(1) Source: California Department of Finance
64,000
800
117,000
1,490
21,200
6,075
82,300
48,900
126, 100
42,650
32,900
32,850
20,850
481,000
3,864,400
72,600
13,300
36,300
29,150
38,450
64,700
63,400
108,700
127,200
13,950
57,300
142,200
65,900
156,500
169
Rancho Palos Verdes 42,800
Redondo Beach 66,500
Rolling Hills 1,940
Rolling Hills Estates 8,050
Rosemead 56,100
San Dimas 36,450
San Fernando 24,500
San Gabriel 41,550
San Marino 13,450
Santa Clarita 162,900
Santa Fe Springs 17,100
Santa Monica 89,300
Sierra Madre 10,950
Signal Hill 10,300
South El Monte 21,950
South Gate 100,300
South Pasadena 25,250
Temple City 34,700
Torrance 144,400
Vemon 95
Walnut 31,400
West Covina 110,500
West Hollywood 37,300
Westlake Village 8,775
Whittier 86 400
Total 8,930,865
Unincorporated 1,048,600
Total Population 9 9Z9 !165
Continued ...

170
COUNTY OF LOS ANGELES
MISCELLANEOUS STATISTICAL DATA-Continued
JUNE 30, 2003
GOVERNMENT AGENCIES AND SPECIAL DISTRICTS
UNDER SUPERVISION OF THE BOARD OF SUPERVISORS:
General County
Construction Fee Districts
Drainage Fee District
Drainage Special Assessment Areas
Fire Protection
Flood Control
Garbage Disposal
LLAD-Landscape Districts and Zones
Street Lighting and Zones
LLAD-Street Lighting and Zones
Public Library
Recreation and Park
LLAD-Recreation and Park Districts
Regional Park-Open Space Districts
Sewer Maintenance Districts and Zones
Special Road
Waterworks
Total
UNDER SUPERVISION OF OWN GOVERNING BOARD:
SCHOOLS:
AGENCY ACCOUNTS:
Cemetery
Hospital
Irrigation and Zones
Library
Mosquito Abatement
Recreation and Park
Resource Conservation Districts
Sanitation
Total
Elementary
High
Community College
Unified
Total
Municipalities
General Purposes
Agencies
and
Districts
7
1
15
1
6 38
22
18
2
1 12
5
____fl_
~
5
10
2
4
3
2
____ll
___§Q
32
8
15
_§
---1Q1
Continued ...

COUNTY OF LOS ANGELES
MISCELLANEOUS STATISTICAL DATA-Continued
JUNE 30, 2003
CITY GOVERNED SPECIAL DISTRICTS:
WATER DISTRICTS:
Landscape Maintenance
Library Fund
Lighting Districts and Zones
Lighting Maintenance
Municipal Improvement
Municipal Maintenance
Municipal Water
Pedestrian Mall
Recreation and Park
Sewer
Vehicle Parking
Waterworks
Total
Metropol~an
Antelope Valley-East Kem Water Agency
Castaic Lake Water Agency
California Water Agency
Southern California Water Replenishment
County Water Districts and Zones
Total
TOTAL GOVERNMENT AGENCIES AND SPECIAL DISTRICTS
COUNTY EMPLOYEES:
1994 74,880 1999
1995 77,111 2000
1996 73,705 2001
1997 73,804 2002
1998 75,349 2003
Excludes temporary and seasonal employees.
10
1 20
17
2
5
8
3
1
12 __ 1
___fil
78,192
81,305
84,878
86,351
84,485
171

172


