Page 1
ASME J Gas Turb Pwr
GTP-15-1298 SUN 1 /56
Coupled Aero-Thermal Modeling of a
Rotating Cavity with Radial Inflow
Zixiang Sun1
Thermo-Fluid Systems UTC
Faculty of Engineering and Physical Sciences
University of Surrey
Guildford, Surrey, GU2 7XH, UK
Email: [email protected]
Dario Amirante
Thermo-Fluid Systems UTC
Faculty of Engineering and Physical Sciences
University of Surrey
Guildford, Surrey, GU2 7XH, UK
Email: [email protected]
John W. Chew
Thermo-Fluid Systems UTC
Faculty of Engineering and Physical Sciences
University of Surrey
Guildford, Surrey, GU2 7XH, UK
Email: [email protected]
Nicholas J. Hills
Thermo-Fluid Systems UTC
Faculty of Engineering and Physical Sciences
University of Surrey
Guildford, Surrey, GU2 7XH, UK
Email: [email protected]
ABSTRACT
Flow and heat transfer in an aero-engine compressor disc cavity with radial inflow has been studied using
computational fluid dynamics (CFD), large eddy simulation (LES) and coupled fluid/solid modelling.
Standalone CFD investigations were conducted using a set of popular turbulence models along with 0.2°
1 Corresponding author. Contributed by the International Gas Turbine Institute (IGTI) of ASME for publication in the JOURNAL OF ENGINEERING FOR GAS TURBINES AND POWER.
Page 2
ASME J Gas Turb Pwr
GTP-15-1298 SUN 2 /56
axisymmetric and a 22.5° discrete sector CFD models. The overall agreement between the CFD predictions
is good, and solutions are comparable to an established integral method solution in the major part of the
cavity. The LES simulation demonstrates that flow unsteadiness in the cavity due to the unstable thermal
stratification is largely suppressed by the radial inflow. Steady flow CFD modelling using the axisymmetric
sector model and the Spalart-Allmaras turbulence model was coupled with a finite element (FE) thermal
model of the rotating cavity. Good agreement was obtained between the coupled solution and rig test
data in terms of metal temperature. Analysis confirms that use of a small radial bleed flow in compressor
cavities is effective in reducing thermal response times for the compressor discs and that this could be
applied in management of compressor blade clearance.
Keywords: coupled aero-thermal modeling, aero-engine compressor disc cavity, radial inflow, thermal
response time, blade tip clearance control
1. Introduction
As described by Atkins [1], radial bleed of air (inflow) into an aero-engine high
pressure (HP) compressor rotating disc cavity has the potential to reduce disc thermal
response time, and consequently to facilitate tip clearance control. The idea was
supported by Ekong et al. [2] in their analysis of a HP compressor disc heat transfer
using the same test rig. It is known the mismatch of the thermal response time between
a high pressure compressor (HPC) casing and its rotating disc is one of the limiting
factors for minimizing the HPC blade tip clearance. This is particularly true for an
enclosed cavity case without radial bleed. In a sealed cavity, the cavity air is
approximately in “solid body rotation”, i.e., rotating at the disc angular speed, and the
disc heat transfer is dominated by buoyancy effects in the centrifugal force field under
the unstable thermal stratification resulting from a positive radial temperature gradient.
Page 3
ASME J Gas Turb Pwr
GTP-15-1298 SUN 3 /56
Hence, the flow and heat transfer in an enclosed rotating cavity is generally weak. As a
result, the disc thermal response time of a sealed rotating cavity is usually much longer
than its casing counterpart.
When a radial bleed is introduced from the cavity shroud, the flow and heat
transfer behavior inside the rotating cavity is fundamentally changed. This was
experimentally demonstrated by Firouzian et al. [3, 4] using a much simplified plane disc
cavity test rig with a purely radial inflow without the axial bore throughflow coolant. The
existence of the convective Ekman type boundary layers on the disc walls originating
from the radial inflow was clearly visualized, and the enhanced swirl ratio as the
imposed flow moves radially inwards was also confirmed by the experiments. Typical
flow features observed in their experiment are schematically summarized in Figure 1.
The radial inflow of air is entrained into the Ekman layers on the disc walls through the
source region at the outer radius of the cavity, and then confined fully within the Ekman
layers in the mid-part of the cavity. Together with the increasing swirl radially inwards
this results in a rotating core in the central region of the cavity, where the flow is
dominantly tangential. The radial inflow leaves the cavity from the sink region at the
inner radius.
Heat transfer measurements using the simplified plane disc cavities with purely
radial inflow were reported by Firouzian et al. [4] and Farthing et al. [5]. In their
experiments, Firouzian et al. focused on a de-swirled radial inflow case, while Farthing
et al. studied radial inflow with inlet swirl ratio Vθ/rΩ equal to unity. All these
experiments and findings were later systematically summarized by Owen and Rogers
Page 4
ASME J Gas Turb Pwr
GTP-15-1298 SUN 4 /56
[6]. A recent experimental investigation comparing heat transfer in a rotating cavity with
and without radial inflow was reported by Günther et al. [7], using a double cavity
system with one of the cavities subjected to a superposed radial inflow in addition to
the axial bore flow. The enhancement of the disc heat transfer due to the existence of
the convective Ekman layer under radial inflow was clearly demonstrated.
Open publications of CFD investigations of rotating cavities with radial inflow are
relatively limited. A numerical investigation of the radial inflow experiments using CFD
was recently published by Vinod et al. [8], and reasonable agreement with the
experiments was achieved. Stiffness of the CFD solutions associated with the radial
inflow, mostly due to a delicate balance between the thin Ekman layer flow and the
swirl velocity of the rotating core, was recognized.
A reduction in the disc thermal response time by introduction of radial inflow into
an aero-engine HP compressor rotating disc cavity was experimentally demonstrated by
Atkins [1] and Ekong et al. [2]. Their work indicated a potential method for improving
compressor blade tip clearance control. This approach is now considered to be of
particular importance for a contemporary high pressure compressor. With engine
pressure ratio increasing modern HP compressors tend to be relatively small. Thus their
tip clearances are large compared to blade heights, and consequently the tip clearance
losses become proportionally greater.
The present study is part of a broad effort to investigate the effect of radial inflow
on the HP compressor tip clearance control and disc temperature management. The test
rig under investigation for the HP compressor rotating cavity cooling system with a
Page 5
ASME J Gas Turb Pwr
GTP-15-1298 SUN 5 /56
superposed radial inflow in addition to the axial bore coolant is described in Section 2,
together with an explanation of the FE/CFD model employed in the study. The
standalone RANS CFD work is summarized in Section 3. An unsteady LES simulation
supporting the steady RANS investigation is briefly explained in Section 4. The coupled
FE/CFD investigation is explained and discussed in Section 5. This is followed by heat
transfer analysis and sensitivity studies in Sections 6 and 7, respectively. A transient
analysis of disc heat transfer behavior using the integral method coupled with a “thin”
disc approximation is discussed in Section 8. A summary of the research and conclusions
is given in section 9.
2. Problem Definition and FE/CFD Models
The test rig considered is shown in Figure 2. It is a multiple rotating cavity
configuration commissioned at Sussex University for the European NEWAC (NEW Aero-
engine core Concepts) project, modeling an aero-engine high pressure compressor
(HPC) disc cooling system. Interested readers are referred to Atkins’ paper [1] for
details. The test rig consists primarily of a four disc cavity drum, bounded by a hollow
shaft at the inner radius and a casing at the outer radius. The drum rotates and is
hereafter referred as the rotor, while both the shaft and casing are stationary. The rotor
was heated from its rim at the outer radius by an electric heater (not shown in the
figure), which was located in the annular space between the rotor and the casing. Radial
cooling inflow was introduced for the two middle cavities, Cav-2 and Cav-3 via channels
in the shroud, the downstream end disc and the hollow shaft. This supplements the
Page 6
ASME J Gas Turb Pwr
GTP-15-1298 SUN 6 /56
usual axial cooling flow in the annular bore path between the shaft and the disc hubs, as
illustrated in the figure. The two side cavities have axial throughflow only.
Experimental data were supplied by Atkins [9]. A section of the transient cycle at
the high power condition representing the maximum take-off (MTO) condition of the
engine in terms of the axial bore coolant and the radial inflow mass rates from the rig
test is shown in Figure 3. mbore and mRad denote the mass flow rates for the axial bore
coolant and the total radial cooling flow supply, respectively. Note that the radial mass
flow rate mRad here is for cavities, Cav-2 and 3 together. Both the mass flow rates are
normalized by the cavity outer radius b at the shroud and a reference viscosity µref. The
figure clearly shows a three step change in the radial mass flow rate for the high power
condition, while the bore mass flow is kept roughly constant from t=40 minutes
onwards. Oscillations associated with the manipulation of the flow conditions and other
unsteadiness can also be observed. These phenomena are typical for all the measured
parameters.
A simplified rig test cycle was generated by approximating the test data, as
illustrated with dashed lines in the figure. The ultimate goal of this coupling
investigation is to simulate this three-step approximated cycle. As a first step, a steady
high power ramp point, MTO-3 as shown in the figure was chosen to model the engine’s
maximum take-off condition with superposed radial inflow.
The finite element (FE) model employed for this coupled investigation is shown in
Figure 4. It contains the main part of the rotor only. The justification for this is that most
of the thermocouples in the experiment were installed on the middle disc-3. A 2D
Page 7
ASME J Gas Turb Pwr
GTP-15-1298 SUN 7 /56
axisymmetric FE model was adopted as a good approximation. The effects of the hollow
structures, including the discrete 3D radial inflow channels, the bore coolant inflow path
and outflow passages (all highlighted in color in the figure), were taken into account
considering their wetted areas and the hollow proportion of the component. The FE
model was solved using the Rolls-Royce inhouse code SC03. The fundamentals of the
SC03 solver were explained by Armstrong and Edmunds [10]. The baseline FE model
without coupling to CFD was roughly tuned to match the rig test data by adjusting the
wall thermal boundary conditions. These conditions take account of convective heat
transfer, radiation, and windage heating through various user-specified options.
Interested readers are referred to [10] for more details of the SC03 modelling.
When coupled with CFD, all the thermal boundary conditions for the FE modeling
on the wall interfaces between the FE and CFD models are provided by CFD. In this FE
model, the CFD domain covers the two middle cavities, Cav-2 and Cav-3, as highlighted
by the two mid-cavities’ inner outlines in Figure 4. As a result, the central heavily
instrumented disc is fully surrounded by the CFD field, and its wall heat transfer
employed in the coupled simulation for the FE model is purely generated by the CFD
simulation.
A 0.2° axisymmetric sector CFD model was employed for the coupled simulation.
The radial inflow channels were modeled by appropriate annular slots. This modeling
approach is fully supported by the standalone CFD investigation, as explained in Section
3. Cavity 2 and cavity 3 have exactly the same geometry. Some key dimensions of the
rotating cavity are illustrated in Figure-4. The inner and outer radii of the cavity at the
Page 8
ASME J Gas Turb Pwr
GTP-15-1298 SUN 8 /56
disc hub and shroud positions are denoted as a and b, respectively, with the radius ratio
being a/b=0.319. The width of the cavity is represented by s, with the gap ratio being
s/b=0.195. The shaft radius is characterized by rs, with the radius ratio of rs/b=0.236. The
resultant hydraulic diameter of the annular bore passage between the shaft and the disc
hubs is dh with the diameter ratio dh/2b=(a-rs)/b=0.082. A summary of the cavity
dimensions is given in Table 1.
There are three inlets and one outlet for the CFD model, as shown in Figure 4. Mass
flow rates were specified at all three inlets, and a radial equilibrium condition was used
at the flow exit in the bore passage. All mass flow rates, temperature and pressure
needed for the CFD model were supplied from the experiment. A summary of the
operating conditions for the MTO-3 case is given in Table 2. The angular speed of the
rotor is Ω=733.79 rad/s. The axial and radial mass flow parameters based on the axial
bore coolant and the radial inflow are Cw,bore=0.16x10⁶ and Cw,rad=0.62x10
4, respectively.
Note that the radial mass flow parameter Cw,rad is based on the radial cooling inflow
entering each cavity, either cavity-2 or cavity-3. As a reasonable approximation, the
radial inflow mass rate mrad entering either cavity-2 or cavity-3 was assumed to be equal
to half of the total radial inflow supply mRad. As a result, the mass flow ratio between the
radial inflow entering each cavity and the axial bore coolant mrad/mbore is approximately
4.3%. The rotational and axial Reynolds numbers based on the axial bore coolant are
ReΩ,b=0.84x10⁷ and Reax,bore=0.19x10
6, respectively. The Rossby number of the axial bore
coolant is Roax,bore=0.44. The radial Reynolds number based on the radial inflow at the
Page 9
ASME J Gas Turb Pwr
GTP-15-1298 SUN 9 /56
cavity shroud is Rerad,shroud=0.21x10⁴. These dimensionless operating parameters are
comparable to an industrial engine HP compressor.
3. Standalone RANS CFD Investigation
A single cavity, cavity-3 was considered in the standalone RANS CFD investigation, as
the two mid cavities have exactly the same geometry. The steady MTO-3 condition was
investigated using two single cavity CFD models and a set of popular turbulence models.
One of the single cavity CFD models employs a 22.5° sector including one of the 16
discrete 3D radial inflow channels which are evenly distributed circumferentially around
the cavity shroud. Another single cavity CFD model adopts a 0.2° sector with the radial
inflow channels being approximated as an annular slot. Cyclic periodicity was assumed
for both the sector CFD models. Appropriate meshes were carefully generated for the
two CFD models following previous experience and best practice. A mesh dependency
test following the ASME Fluids Engineering Division’s guidelines was conducted using
the smaller 0.2° sector model before the final mesh resolution was determined. The
bigger 22.5° sector model has about 1 million hexahedral mesh cells, and the smaller
0.2° sector with the slot approximation has around 30 thousand mesh cells. Obviously,
the smaller sector has significantly fewer mesh cells, and thus can be more
computationally efficient. This advantage is of particular importance for a coupled
FE/CFD simulation, if the smaller sector model is proven to be able to produce equally
good CFD solutions to the bigger sector model. It is known that over 99% of the
computational cost is usually devoted to CFD in a coupled FE/CFD simulation.
Page 10
ASME J Gas Turb Pwr
GTP-15-1298 SUN 10 /56
A set of popular turbulence models, including the Spalart-Allmaras (SA) turbulence
model, the standard k-ε turbulence model and a Reynolds-stress turbulence model,
were tested in order to find the most appropriate for this flow problem. For the near-
wall region treatment, both standard wall functions and near-wall layer resolved options
were used. For the resolved near-wall treatment, an appropriate local mesh refinement
was made. The resultant dimensionless wall distances y+ are about 1 for the wall
boundary layer resolved option and around 50 for the standard wall function treatment,
respectively. Two CFD codes were employed, the Rolls-Royce CFD code Hydra and the
commercial CFD software Fluent. The Reynolds stress turbulence model is available only
in Fluent, while the first two turbulence models are available in both the CFD codes. For
details of the two CFD codes, readers are referred to [11, 12].
An adiabatic CFD solution for the MTO-3 condition using the 22.5° sector model is
shown in Figure 5. It was obtained with the Hydra CFD code using the Spalart-Allmaras
turbulence model and the wall boundary layer resolved option. The walls were assumed
adiabatic. The numerical scheme employed is of 2nd
order accuracy. Convergence was
judged when all the monitors, such as the residuals and the disc torque were stabilized.
Due to the slow convergence associated with the radial inflow, over 30,000 iterations
were normally needed for a CFD simulation. To ensure adequate convergence, overall
balances were routinely checked. Typically, the mass, angular momentum and the
energy balances achieved in the present investigation are around 0.1%, 1% and 3% of
total inflow mass rate, the disc torque and the disc windage, respectively. These CFD
Page 11
ASME J Gas Turb Pwr
GTP-15-1298 SUN 11 /56
settings and convergence criteria were applied to all the CFD computations in this
investigation.
From Figure 5, it can be seen the swirl ratio increases in the main part of the cavity
as the radial inflow moves inwards. The swirl ratio reaches its maximum at the cob
region and then decreases rapidly due to the interaction between the radial inflow and
the axial bore coolant. The rotating core in the central part of the cavity is clearly shown
by the velocity contours. In this region the air flow is dominantly tangential with no
movement in the radial and axial directions. The radial inflow jets can be seen in the
source region close to the shroud. Ekman boundary layers on the disc walls were well
captured by the CFD, although these are too thin to be easily seen in this figure. The
Ekman layer velocity profiles are examined late in this section. Similar flow patterns
were obtained by all the other CFD simulations from either the 22.5° or 0.2° sector
models with the different turbulence models, using either Hydra or Fluent codes.
A quantitative comparison of the swirl ratio between the CFD solutions obtained
from the two sector CFD models is shown in Figure 6. To avoid overlay, only the CFD
solutions obtained with the Spalart-Allmaras turbulence model and the wall boundary
layer resolved option are presented. The abscissa represents the swirl ratio Vθ/rΩ. The
ordinate is the normalized radius. The sample position is located at the mid-axial plane
of the cavity. The dashed and dotted lines represent the predictions obtained from
Hydra and Fluent, respectively, using the 0.2° sector CFD model with the Spalart-
Allmaras turbulence model and the wall boundary layer resolved option. The solid
squares and light triangles denote the results obtained from Hydra and Fluent,
Page 12
ASME J Gas Turb Pwr
GTP-15-1298 SUN 12 /56
respectively, using the 22.5° sector CFD model with the same settings for turbulence
modelling. The CFD results presented in this paper are all circumferentially averaged. As
noted above, the swirl ratio reaches its maximum in the cob region and drops rapidly
due to the interaction between the radial inflow and the axial bore throughflow. The
results obtained from the 0.2° sector CFD model agree well with their counterparts from
the 22.5° sector CFD model. Good agreement can also be observed between the Hydra
and Fluent CFD predictions in the main part of the cavity.
Some difference between the Hydra and Fluent solutions in the cob and bore
regions is apparent. A separate investigation into the root causes of the difference was
conducted. It was understood that part of the difference was caused by the different
bore inflow boundary conditions between the Hydra and Fluent CFD simulations. A bore
inlet boundary condition with a “solid body rotation” swirl velocity was applied in
Fluent. However, this boundary condition was not used in Hydra due to occurrence of
reverse flow at the bore inlet during the iterative simulation. As an alternative, the bore
mass flow inlet was specified with an appropriate flow angle in Hydra. As a result, the
swirl ratio in the bore flow path obtained from Hydra is no longer uniform, as shown in
Figure 6. It is lower than the “solid body rotation” on the hub side of the bore flow
passage. Another probable cause for the difference was understood to be the different
implementations of the turbulence models between the Fluent and Hydra CFD codes. It
is known that Fluent is a cell-based solver, while Hydra is a node-based code. The wall-
distance related terms in a turbulence model may contribute to the difference in the
turbulence field between the two CFD codes, which eventually affect the CFD solutions.
Page 13
ASME J Gas Turb Pwr
GTP-15-1298 SUN 13 /56
Some regions of the flow, such as the cob area in the present test case where the
geometry curvature is large and flow gradient is significant, may be particularly sensitive
to this kind of turbulence variation. This limited difference in the flow field is far away
from shroud and the cavity central region, and was expected to have limited effect on
the coupled solution for the present radial-inflow dominated applications. This was
confirmed by the sensitivity study described in Section 7.
For reference, a semi-analytical solution (solid line) obtained from an established
integral method is also presented in Figure 6. A description of the integral method for
rotating cavity with radial inflow or outflow was reported by Chew and Rogers [13]. It
can be seen that all the CFD solutions are comparable to the integral method solution in
the major part of the cavity, where the boundary layer approximation is valid. The
integral method and the CFD solutions all predict rapid entrainment of the radial inflow
into the disc boundary layers. In the source region (1.0<r/b<~0.95) where the disc
boundary layers are entraining flow, the integral method assumes free vortex flow
outside the boundary layers. Radially inboard of this to the outer edge of the cob region,
all radial inflow occurs in the disc boundary layers and the swirl in the core continues to
increase, but at a much lower rate than for a free vortex.
Swirl and radial velocity distributions inside the Ekman layer against the wall
distance y are shown in Figure 7. For clarity, only two CFD solutions using Hydra and
Fluent along with the 0.2° sector model and the Spalart-Allmaras model are presented,
and the sample positions are limited to 3 radii, as illustrated in the figure. The solid and
dashed lines represent the radial and swirl velocity profiles obtained by Hydra, while the
Page 14
ASME J Gas Turb Pwr
GTP-15-1298 SUN 14 /56
light and solid symbols denote those obtained by Fluent, respectively. Three different
colors distinguish the three radial positions at r/b=0.864, 0.659 and 0.500. It can be seen
that magnitudes of both the swirl ratio and the radial velocity increase as the imposed
inflow moves radially inwards. Away from the wall into the rotating core, the radial
velocity component at all the three radii approaches zero. The agreement between the
Hydra and Fluent solutions is again satisfactory, although the difference becomes a bit
larger at the inner radius of the disc close to the cob region.
The effect of turbulence modeling on the CFD solutions is shown in Figure 8, again
in terms of swirl ratio in the cavity. To avoid overlay, only the Hydra CFD solutions
obtained with the 0.2° sector model using the Spalart-Allmaras turbulence model and
the standard k-ε turbulence model are presented. The plot settings and the sample
position are the same as in Figure 6. The dashed and dot-dashed lines represent the
Hydra predictions obtained from the Spalart-Allmaras turbulence model and the k-ε
turbulence model, respectively, with the near-wall layer resolved option. The solid
squares and light circles denote the Hydra results obtained from the Spalart-Allmaras
turbulence model and the k-ε turbulence model, respectively, with the standard wall
functions. The integral method solution (solid line) is again presented for reference. It
can be seen that the overall agreement between the CFD predictions remains good, and
they are all comparable to the integral method solution in the main part of the cavity.
The differences in the cavity cob region are thought mainly due to an interaction
between the radial inflow and the axial bore throughflow. The standard wall function
treatment resulted in a slightly higher swirl prediction than the wall boundary layer
Page 15
ASME J Gas Turb Pwr
GTP-15-1298 SUN 15 /56
resolved option. The Fluent solutions repeated a similar story, together with Reynolds
stress turbulence modelling.
The disc torque coefficients obtained from different CFD solutions, using either
Hydra or Fluent codes, along with either 0.2° or 22.5° sector CFD models were
inspected. It was found that the disc torque coefficient obtained by the CFD solutions
fell into a narrow range of Cm=Mdisc/0.5ρradΩ2b
5= (0.56~0.59) x10
-3, with the Hydra
Spalart-Allmaras model yielding a middle value Cm=0.57x10⁻³
. Further inspection showed
that the cob region contributes less than 10% towards the total disc torque, although
the swirl ratio reaches its maximum there. The small radius of the cob region may
account for this. Hence, the difference in CFD solutions in the cob region has only a
small effect on the total disc torque. The integral solution gave a slightly higher moment
coefficient (0.63x10⁻³
) than the CFD solutions. Note that the total disc torque Mdisc was
calculated on the basis of one-side surface of the disc. The radial inflow density ρrad was
employed in estimating the disc torque coefficient.
Standalone CFD solutions of the two cavity CFD model at the MTO-3 condition
were prepared in advance of the coupled FE/CFD simulations. Examination showed
similar results to the single cavity solutions. Furthermore, heat transfer was found to
have a negligible effect on the flow field by comparing the swirl ratio profiles and the
disc torque coefficients between the coupled CFD solution and its adiabatic counterpart.
Considering all the above investigations, the use of the 0.2° sector CFD model and
the Spalart-Allmaras turbulence model, together with the Hydra code was judged
appropriate for the present FE/CFD coupling simulation of the MTO-3 condition. The
Page 16
ASME J Gas Turb Pwr
GTP-15-1298 SUN 16 /56
choice for the Spalart-Allmaras model was also supported by previous studies,
particularly Vinod et al.’s [8] paper, where good agreement with some purely radial
inflow experiments was reported for the Spalart-Allmaras model.
4. Large Eddy Simulation
To get more insight into the flow physics and to further examine the validity of the
steady CFD approach for the coupled FE/CFD analysis, a wall-resolved LES was
performed for the MTO-3 condition. The LES simulation was carried out on the 22.5°
sector model, using a mesh of 12 million hexahedral cells and employing the
Smagorinsky subgrid scale model.
To limit the computational time, a substantial number of mesh nodes were
concentrated in the cob region, while a coarser resolution was adopted within the
cavity. In fact, small scale turbulence is expected to develop predominantly in the cob
region, due to the interaction between the bore flow and cavity flow. Based on the
average shear stress along disc obtained in the CFD, the normalized axial grid spacing in
the cavity falls in the range ∆S+
ax~[1.5-100]. The resolutions measured for the radial and
tangential directions are ∆S+
r~[10-250] and ∆S+
θ ~[11-300], respectively, with the
minimum values occurring at the interface (r=a) for ∆S+
r and on the shaft (r=rs) for ∆S+
θ.
The numerical method is based on a MUSCL scheme implemented into Hydra, with a
linear reconstruction of the flow variables and flux integrals evaluated by a second-
order Gauss quadrature formula [14]. Compared to the standard low-order version of
Hydra, the method is rather slow, but it has been demonstrated to provide an effective
Page 17
ASME J Gas Turb Pwr
GTP-15-1298 SUN 17 /56
a third order numerical dissipation by an a posteriori analysis conducted on a turbulent
rotor-stator test case [14].
The time simulated corresponds to 22 disc revolutions, with a partially converged
RANS solution assumed as the initial flow field. It is important to emphasize that the
main objective of the LES analysis was the evaluation of the temperature field, to detect
possible buoyancy driven effects which RANS models may fail to capture.
Snapshots of instantaneous air temperature are shown in Figure 9. Note that here
the temperature is normalized by a reference temperature Tref. The unsteady
interaction between the radial inflow and the axial bore coolant is clearly visible. The
mid-axial contours indicate the formation of structures due to thermal stratification. In
the absence of radial inflow, radial arms of cold fluid are expected to penetrate inside
the cavity and a circumferential pressure gradient would be formed to satisfy the
angular momentum balance. The introduction of sufficient radial bleed confines the
thermal effects to a narrow region at inner radii. Away from the cob regions, the flow
remains in an almost quiescent state, with a stratified core with zero axial gradients,
almost zero radial and axial velocity components, and very small oscillations.
A comparison of the LES solution with its RANS counterparts in terms of swirl ratio is
shown in Figure 8. Throughout the cavity, the LES gives a slightly greater swirl than the
RANS solutions. At inner radii, the difference becomes more pronounced. As indicated
by the linear Ekman equations [6], the swirl level in the core is proportional to the radial
shear on the discs. It is possible that the limited resolution near the wall prevents the
flow from becoming fully turbulent in the LES. This results in a more slender radial
Page 18
ASME J Gas Turb Pwr
GTP-15-1298 SUN 18 /56
velocity profile in the boundary layer, and a higher swirl in the core. Based on the bulk
radial velocity Wr (=mrad/ρ2πrs), the radial Reynolds number of the Ekman boundary
layer flow was estimated to be Rer (=ρ2sWr/µ=mrad/πrµ) is in a range between 2100 and
5100 for the present test case. Following a suggestion of the experimental
measurements by Firouzian at al. [3, 4], flow transition in the Ekman layer occurs at a
value of Rer=360. Hence, the flow in the Ekman layer for the present test case appears
to be turbulent. This suggests that the over-prediction of swirl seems to be a numerical
effect, probably excessive numerical dissipation deriving from inadequate wall
resolution. Note that hybrid RANS/LES models may circumvent the issue for this specific
case, but difficulties would arise at lower radial flow rates where the Ekman layers may
actually become laminar or transitional.
Examination of radial temperature profiles at the mid-axial position, for both RANS
and LES solution showed overall agreement. This suggests that the amount of axial
throughflow penetrating into the cavity is essentially the same. Based on these
considerations, the use of a steady CFD approach for the coupled FE/CFD simulations of
the present condition was considered justified.
5. Coupled FE/CFD Results
The coupled FE/CFD simulation for the stabilized MTO-3 condition was conducted
using an established coupling procedure between transient FE and a series of steady
CFD simulations. Detailed description of the coupling procedure can be found in [15,
Page 19
ASME J Gas Turb Pwr
GTP-15-1298 SUN 19 /56
16], and its validations and verifications have been reported for a number of
engineering applications [16-21].
A metal temperature history (the solid line through crosses) at the monitor MP20
obtained from the coupled simulation for the MTO-3 condition is shown in Figure 10.
The monitor MP20 is located at the mid-radius on the right hand side wall of disc-3, as
illustrated in the figure. It can be seen that the coupled simulation started at time
t=3522 s for the MTO-3 condition and ended at time t=5322 s, covering a total time
period of 1800 s in the extended MTO-3 cycle. The initial solution at the starting time
point for the coupled simulation was provided by a SC03 standalone solution. The
coupled solution exhibited some oscillations at the beginning of the coupling simulation,
and stabilized from about t=4300s onwards. This behavior is representative of other
monitors.
The choice of the steady extended MTO-3 cycle in the present coupled simulation is
a step towards a full transient investigation of the MTO cycle covering all three step
changes in the radial mass inflow. The line with solid circles in the figure represents the
transient cycle from MTO-1 to MTO-3, plus the extended MTO-3 part in terms of the
total radial mass flow rate. For reference, the measured metal temperature (the line
with high frequency oscillations) at the monitor MP20 is also plotted in the figure. It can
be seen the measured metal temperature was almost stabilized from the coupling start
point in the rig test. The experiment data is cut short soon after the coupling start point
in the figure as it went into a deceleration ramp in the rig test.
Page 20
ASME J Gas Turb Pwr
GTP-15-1298 SUN 20 /56
In the coupled simulation, the FE model was solved by the SC03 FE code, and the 2-
cavity CFD model by the Hydra CFD code using the Spalart-Allmaras turbulence model,
as explained before. The FE computation was transient while all the CFD solutions were
assumed steady. The convergence of the transient FE computation was controlled by
the so-called time stepping accuracy ΔT, which was set to be about 1.5% of the driving
temperature difference ΔTref between the disc-3 shroud and the bore inflow
temperatures (ΔTref =Tshroud–Tbore) in this study after an initial test. This setting is stricter
than normally recommended for industrial applications. The convergence of each CFD
solution for the coupled simulation was judged when its residual was reduced by two-
orders, which was achieved normally over 4000 CFD iterations. These requirements for
solution convergence were considered adequate as a change of the cavity flow between
two consecutive time steps was expected to be small, reducing to zero for the steady
solution. On the other hand, these measures were found necessary to take account of
the slow convergence of the CFD solution associated with the radial inflow. On the
coupled wall interfaces between the FE and CFD models, the FE computation passes the
wall temperatures to the CFD simulations, and the CFD returns the wall heat flux to the
FE. An iterative coupled loop is thus established between the FE and CFD simulations.
Convergence of the coupled iteration at each time step is reached when the maximum
temperature difference between two consecutive coupled iterations over all the
coupled walls is less than a preset criterion. In this coupled simulation, the coupling
convergence δT was set to be a quarter of the time stepping accuracy, i.e. δT=0.25ΔT.
Page 21
ASME J Gas Turb Pwr
GTP-15-1298 SUN 21 /56
The metal temperature contours of the coupled solution obtained at the end of the
simulation t=5322s are also shown in Figure 10. Positive temperature gradients in the
radial direction across the rotor are clearly visible, as the rotor was heated on the rim
wall at the outer radius and cooled by the axial bore coolant at the inner radius. The two
middle cavities were subject to radial inflow. As the radial inflow was hotter than the
axial bore coolant, the temperature of disc-3 is higher than its neighboring discs. In
addition, the axial temperature gradient of disc-3 is apparently very small over most of
the disc radius. This is because the wall heat transfer is dominated by the radial inflows,
and the differences between the radial inflows entering the two mid cavities are small.
The predicted wall temperatures for the MTO-3 condition at the end of the coupled
simulation are compared with the rig test data. Figure 11 shows the wall temperature
distributions on disc-3. The diamonds and solid circles represent the measured wall
temperatures on the left hand side (LHS) and the right hand side (RHS) of disc-3,
respectively. The two colored solid lines denote the predicted wall temperatures on the
LHS and RHS surfaces of disc-3, respectively. It can be seen the agreement between the
coupled solution and measurements is good. In addition, the temperature plot confirms
that the disc wall temperatures on the both wall surfaces are almost equal over most of
the disc, i.e., the disc temperature gradient in the axial direction is close to zero.
Apparent differences in the disc wall temperature between the RHS and LHS surfaces of
disc-3 can only be identified in the vicinity of the cavity shroud and disc cob regions.
Results from the integral method coupled to a “thin disc” thermal model of the disc
are also shown in Figure 11 (the dashed line). In this model, the outer disc temperature
Page 22
ASME J Gas Turb Pwr
GTP-15-1298 SUN 22 /56
is specified and a heat transfer coefficient for the inner cylindrical hub surface is chosen
to give the required hub temperature. Convective heat transfer on the disc faces is
obtained by coupling the thin disc conduction solution with the integral method
solution, which includes an energy equation. The model does not reproduce the
measured temperature profiles as well as the CFD. This is attributed to the simplified
treatment of heat transfer around the disc cob and illustrates the importance of the
flow in that region in determining disc temperature.
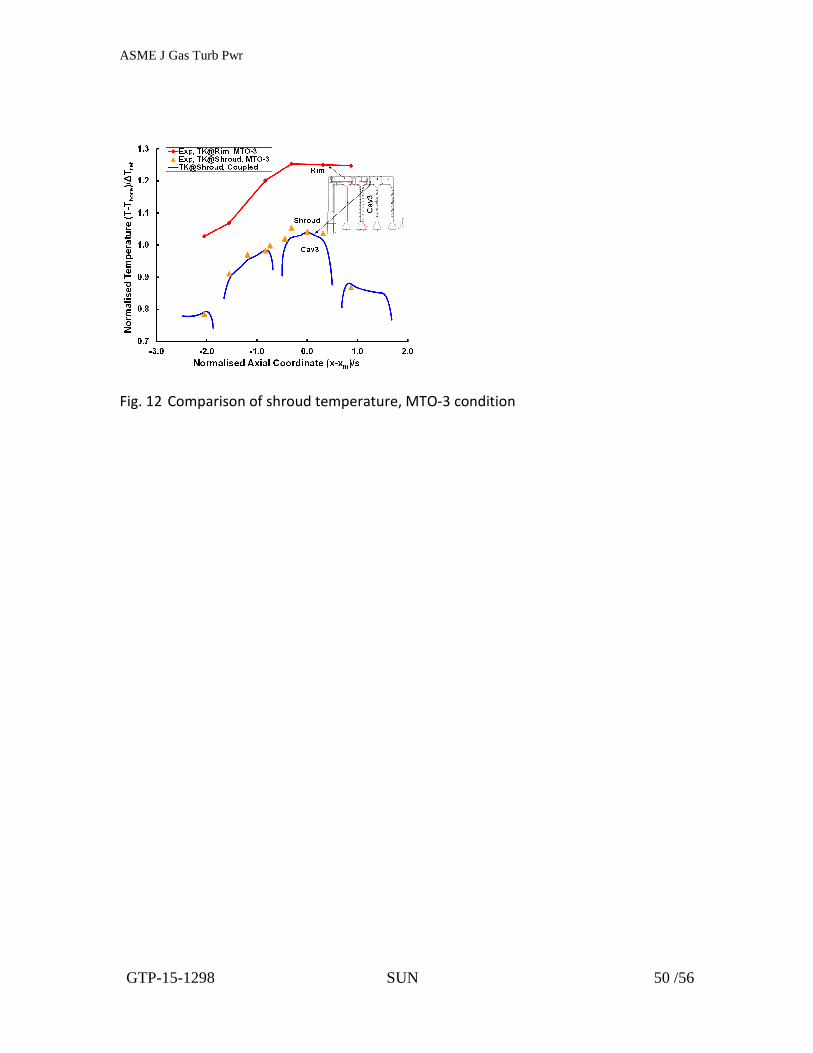
Figure 12 shows a comparison of wall temperatures between the prediction and
measurements on the cavity shroud. The triangles and solid line again represent the rig
test data and the coupled solution, respectively. The x coordinate is normalized by the
cavity width s with its origin at the middle axial position of cavity-3. Again, it can be seen
the agreement is satisfactory. The diamonds and the associated line in the top part of
the figure denote the rig test data on the rotor rim and its corresponding rim wall
temperature specification for the FE modeling. The specified rim wall temperature
profile is a known thermal boundary condition in the present FE modeling.
Figure 13 shows a comparison of wall temperatures between the prediction and
measurements on the disc hub. The solid line represents the coupled solution, and the
diamonds and solid squares stand for the rig test data. Again, it can be seen the
agreement is generally good.
Page 23
ASME J Gas Turb Pwr
GTP-15-1298 SUN 23 /56
6. Disc Heat Transfer
Figure 14 shows the heat flux distribution on the right hand side surface of disc-3
obtained at the end of the coupled simulation. The heat flux qw is normalized by qav,
which is an area-weighted average over the disc surface. The heat flux qw is set to
positive when the air absorbs heat from the metal. It can be seen that the disc is cooled
by air near the shroud, as the radial inflow is cooler than the metal there. As the fluid
moves radially inwards, it becomes hotter and quickly reaches the metal temperature
near the point r/b=0.9. From there radially inwards, the inflow heats the disc diaphragm
at a modest rate. As this is a steady state solution, the convective heat transfer must be
balanced by the radial heat conduction associated with the temperature profile in
Figure 11.
From a point r/b=0.5 close to the edge of the cob, the region of modest negative
disc wall heat flux comes to an end. The magnitude of the flux increases rapidly there,
and reaches a maximum close to the edge of the neck within the cob region. It is
interesting to note that the swirl ratio also reaches its peak magnitude close to this
point. Further inboard, as the cold axial bore coolant interacts with the hotter radial
inflow, the air temperature reduces rapidly within a very short distance down to the
hub. As a result, the air once again absorbs heat from the metal roughly from the middle
radius of the neck, and heat transfer increases rapidly towards the hub, where the cold
bore coolant dominates. Standalone heat transfer CFD simulations with wall
temperatures being specified from the thermal-couple test data reproduced the same
phenomena.
Page 24
ASME J Gas Turb Pwr
GTP-15-1298 SUN 24 /56
A comparison of Nusselt number distributions on the right hand side surface of disc-
3 is shown in Figure 14. The results were obtained using the Spalart-Allmaras model
with either 0.2° or 22.5° sector CFD models. The Nusselt number was estimated by using
a pair of CFD solutions with their wall temperatures offset by a small difference ΔTw in
analogy to qw=hf(Tw-Tf) and Δqw=hfΔTw. Hence, Nusselt number can be derived as Nu=
rΔqw/κΔTw, where Δqw is the disc wall heat flux difference between the pair of the CFD
solutions with a wall temperature difference ΔTw between them; hf and κ stand for the
heat transfer coefficient and the thermal conductivity of air, respectively. Use of this
definition avoids difficulty in specifying a reference temperature where two or more
inlets exist and spurious results in estimating the Nusselt number when the temperature
difference (Tw-Tf) between metal and fluid approaches zero, as occurs in the present
case. It can be seen from the figure that the Nusselt number exhibits a peak around the
edge of the source region at r/b=0.95. From there it decreases radially inwards over
most of the disc. This behavior is similar to the observation of Farthing et al.’s [5]
experiment. The Nusselt number is lowest in the cob region. It then increases rapidly
inside the neck region as the radial inflow interacts with the cold axial bore coolant, and
reaches its peak at the hub where the bore coolant dominates. All the CFD solutions
showed similar behavior. A comparison of Nusselt number with a sealed cavity heat
transfer experiment reported by Alexiou [22] using similar test rig is not straight forward
as the definitions of the Nusselt number are different. However, a crude examination
shows that the mean Nusselt number for the present disc under radial inflow is
Page 25
ASME J Gas Turb Pwr
GTP-15-1298 SUN 25 /56
estimated to be close to one order higher than its counterpart without radial inflow
(axial bore flow only).
7. Sensitivity Study
In order to gain insight into the effects of the oscillations of flow parameters in the
experiment and possible measurement uncertainty on the FE/CFD coupled solution, a
sensitivity study was conducted. Small variations in some key flow parameters were
tested. For each test, only one parameter was altered while keeping all others
unchanged. The tested parameters include the mass flow rates and the cooling air
temperatures for the radial inflow and the axial bore throughflow, the swirl ratio of the
axial bore throughflow and the operating pressure of the cavity. The mass flow rates for
the radial inflow and the axial bore coolant were altered by two times their typical
fluctuations. The inflow temperatures at the radial and axial bore inlets were increased
as well by two times their typical oscillations. A coupled simulation with the k-ε model
was also included in the sensitivity study.
A summary of the sensitivity study results is given in Table 3. It can be seen that the
effect of the alteration of a flow parameter on the temperature of the middle disc-3
given by the coupled FE/CFD simulation is generally relatively small. For most cases the
sensitivity index /ΔTref indicates that changes are limited to 1% or less, which is
comparable to temperature measurement uncertainty. These cases include the bore
coolant inlet temperature and swirl perturbations, coolant mass flow variations, and
Page 26
ASME J Gas Turb Pwr
GTP-15-1298 SUN 26 /56
uncertainty of the temperature in neighboring cavities. The use of averaged test data, as
employed in the present study, should help to reduce these uncertainties.
The highest sensitivities shown in Table 3 result from changes in inlet temperature
for the radial inflow and the use of the k-ε turbulence model. Given the importance of
the inflow in determining disc temperatures the sensitivity to inlet temperature could
be expected. The sensitivity index indicates disc temperature changes corresponding to
about half the change in inlet temperature. Closer examination of the k-ε model results
showed significant differences with the Spalart-Allmaras model in predictions of the
shroud heat transfer, with consequent downstream effects on the air and disc
temperature level. As both these CFD models approximate the inflow channels with an
axisymmetric slot, some approximation and uncertainty in modeling for this region must
be recognized.
8. Disc Thermal Response Time
As stated above, the motivation for Atkins’ experiments was to investigate whether a
relatively small degree of radial inflow in compressor cavities could reduce the thermal
response time of the discs and hence be used in improving compressor clearances. His
measurements confirmed this concept and indicated time constants for the disc
response of 2 to 3 minutes for an acceleration to running conditions similar to those
considered here. To investigate this further, the coupled integral method/thin disc
model outlined above was run in transient mode starting with a uniform disc
temperature. Apart from the disc temperature all other model parameters were the
Page 27
ASME J Gas Turb Pwr
GTP-15-1298 SUN 27 /56
same as for the steady state solution presented above. A step change in the outer disc
temperature was imposed and the heat transfer coefficient deduced from the steady
analysis was used in modelling the convection from the axial throughflow to the inner
hub surface. The results are shown in Figure 15. Each line shows the temperature at a
different radial position. As expected the outer part of the disc generally heats up
quicker than the inner parts. At the hub (r/b=0.32) the initial fast response is driven by
the convective heat transfer on the inner surface. The response slows as the hub
temperature increases towards that of the axial throughflow. As defined by Atkins, the
time constant corresponds to the period for the temperature to change by 63.2% of the
difference between its initial and final values. Figure 15 indicates time constants varying
from less than 30s at the disc tip to approaching 100s at the hub. Further examination
of the measurements indicates that the thermal inertia of the shroud, that is neglected
in the calculations, has a significant effect in the experiment. Atkins noted that although
the disc cob and diaphragm were fully representative of an engine, the shroud in the
test rig was thicker than that in an engine and that this would affect the results.
The present calculations confirm Atkins’ conclusions that a small radial inflow can
reduce the thermal response time for the disc diaphragm. The thin Ekman layers are
effective in promoting heat transfer between the radial inflow and the disc, tending to
even out disc temperatures in the diaphragm. Estimating the thermal capacity of the
disc as ~3kJ/K and the thermal capacity of the radial air flow as ~30W/K indicates a
thermal response time for the disc of about 100s, as is consistent with the results in
Figure 15. Calculations with double and half the radial inflow rate used here confirm the
Page 28
ASME J Gas Turb Pwr
GTP-15-1298 SUN 28 /56
relevance of this time scale, although it should be noted that the integral method does
not attempt to capture the effects of buoyancy expected at low flow rates.
9. Conclusions
Aero-thermal analysis of an aeroengine HP compressor rotating disc cavity with radial
cooling inflow was conducted as part of a broad effort to investigate the effect of a
small radial inflow on compressor tip clearance control and disc temperature
management. In previous experimental studies radial inflow was introduced into the
cavity from the outer shroud and was limited to a small percentage of the axial bore
coolant. Here, a test condition representing the engine’s MTO condition was selected,
and both standalone CFD and coupled FE/CFD simulations were performed for a radial
inflow rate of 4.3% of the axial bore flow. Results were compared with stabilized disc
temperature measurements and transient response of the disc following an acceleration
was considered.
Standalone CFD studies and LES showed the distinct flow features associated with
radial inflow, such as the Ekman layers, enhanced swirl in the cavity, and a quiescent,
rotating core flow. Good overall agreement was obtained between the CFD solutions,
from either a small axisymmetric 0.2° sector model or a 3D 22.5° sector model using the
different RANS turbulence models, and these results were consistent with an
established integral method solution and the LES. Buoyancy effects, as expected in the
absence of the radial flow, appeared to be suppressed. The Spalart-Allmaras turbulence
produced the best overall agreement with the integral method. Some sensitivity of the
Page 29
ASME J Gas Turb Pwr
GTP-15-1298 SUN 29 /56
flow field to turbulence modelling and inlet conditions was observed in the interaction
between the radial inflow and the axial bore coolant. The LES showed some laminar
flow in the disc boundary layers. Although this was not expected at this inflow flow rate,
and was possibly due to numerical effects, it is noted that there is considerable
uncertainty about the nature of the flow at low and zero radial inflow rates and that this
is an area needing further investigation.
Stabilized disc temperatures predicted by a coupled FE/CFD simulation using an
axisymmetric CFD model with the Spalart-Allmaras turbulence model agreed well with
rig measurements. This confirms a radial inflow dominated regime in the cavity for this
inflow rate. Strict convergence criteria were needed in the coupled simulation to take
account of slow convergence associated with CFD for radial inflow. Sensitivity studies
were performed to give insight into the effects of flow parameter oscillations, rig test
uncertainty and turbulence modelling on the FE/CFD coupled solution. These show that
variations in the flow parameters equivalent to 2 times their typical fluctuations only
results in a relatively small change in the FE/CFD solution, comparable to the rig test
uncertainty. Some sensitivity to turbulence modelling, particularly in the shroud region,
where the CFD model used in the coupled solution approximated the inlet as an
axisymmetric slot, was identified.
Transient thermal modelling using the integral method and a thin disc
approximation confirmed that the radial inflow effectively reduces the thermal response
time of the disc diaphragm. Confinement of the inflow to the thin Ekman layers
promotes heat transfer between the flow and disc and the thermal response time for
Page 30
ASME J Gas Turb Pwr
GTP-15-1298 SUN 30 /56
the disc diaphragm depends largely on the thermal capacities of the disc and the
imposed radial flow.
ACKNOWLEDGMENT
Funding from Rolls-Royce plc and the Technology Strategy Board (TSB, UK) is gratefully
acknowledged. The project is part of the Strategic Investment in Low-carbon Engine
Technology 2 (SILOET-2) program. The work was coordinated by Andy McCallum and
Nick Baker from Rolls-Royce plc. The test data were kindly provided by Dr Nick Atkins
from Cambridge University. The authors would also like to thank Christopher Barnes
from Rolls-Royce for his advice on the SC03 model.
Page 31
ASME J Gas Turb Pwr
GTP-15-1298 SUN 31 /56
NOMENCLATURE
A area (m2)
a cavity inner radius at disc hub (m)
b cavity outer radius at shroud (m)
Cm disc torque coefficient = Mdisc/(0.5ρradΩ2b
5)
Cw, bore axial mass flow parameter based on the axial bore
coolant =mbore/bµbore
Cw, rad radial mass flow parameter based on the radial cooling
inflow =mrad/bµrad
dh hydraulic diameter of the bore annular passage
= 2(a-rs) (m)
hf heat transfer coefficient (W/m2K)
Mdisc disc torque (Nm)
mbore bore flow mass rate (kg/s)
mRad radial cooling inflow mass rate for 2 cavities (kg/s)
mrad radial inflow mass rate per cavity =0.5mRad (kg/s)
Nu Nusselt number =r*Δqw/κΔTw
pout outlet pressure (N/m2)
qw disc wall heat flux (W/m2)
qav
average heat flux of disc wall (W/m2)
r radius (m)
Reax,bore axial Reynolds number based on the axial bore flow
Page 32
ASME J Gas Turb Pwr
GTP-15-1298 SUN 32 /56
=ρboredhUax,bore/µbore
Rer radial Reynolds number =mrad/(πrµ)
Rerad,shroud radial Reynolds number based on the radial cooling
inflow at shroud =ρrad2sWrad,shroud/µrad
ReΩ,b rotational Reynolds number based on the axial bore
flow =ρboreΩb2/µbore
Roax,bore Rossby number based on the axial bore flow
=Uax,bore/aΩ
r radius (m)
rs shaft radius (m)
s cavity width (m)
T temperature (K)
Tbore bore inflow temperature (K)
Tcav cavity air temperature (K)
TMTO3 disc wall temperature from the coupled solution
at the MTO-3 condition (k)
Trad radial inflow temperature (K)
Tref reference temperature (K)
Tsen disc wall temperature obtained in a sensitivity study (K)
Tshroud shroud temperature (K)
Tw wall temperature (K)
t time (s)
Page 33
ASME J Gas Turb Pwr
GTP-15-1298 SUN 33 /56
Uax axial velocity component (m/s)
Uax,bore bulk axial velocity of the axial bore flow
=mbore/ρboreπ(a2-rs
2) (m/s)
Vθ circumferential velocity component (m/s)
Wr radial velocity component (m/s)
Wrad, shroud bulk radial velocity of the radial cooling inflow at
shroud (r=b) =mrad/ρrad2πbs (m/s)
x axial coordinate (m)
xm middle axial position of cavity-3
y distance from wall (m)
y+ dimensionless wall distance = ρ(τw/ρ)
0.5yp/µ
yp wall distance for the first mesh node (m)
Greek
Δqw wall heat flux difference (w/m2)
ΔT time stepping accuracy (K)
ΔTref driving temperature = Tshroud – Tbore (K)
ΔTsenRMS
sensitivity index to be normalized by ΔTref (K)
ΔTw wall temperature offset (K)
Δs+ normalized grid spacing
δT maximum temperature difference between two
consecutive coupling iterations over all coupled
walls (K)
Page 34
ASME J Gas Turb Pwr
GTP-15-1298 SUN 34 /56
θ the circumferential direction
κ thermal conductivity of air (W/mK)
µ dynamic viscosity (kg/ms)
ρ density (kg/m3)
τw wall shear stress (N/m2)
Ω rotor angular velocity (rad/s)
Sub & Superscripts
ax axial
bore bore flow
out outlet
rad radial cooling inflow
shroud shroud
Page 35
ASME J Gas Turb Pwr
GTP-15-1298 SUN 35 /56
REFERENCES
[1] Atkins, N.R., 2013, “Investigation of a Radial-Inflow Bleed as a Potential for
Compressor Clearance Control”, Proc. of ASME Turbo Expo 2013, ASME Paper No.
GT2013-95768.
[2] Ekong, Godwin Ita, Long, Christopher A. and Childs, Peter R.N., 2013, “The Effect of
Heat Transfer Coefficient Increase on Tip Clearance Control in H.P. Compressors in
Gas Turbine Engine”, Proc. of ASME 2013 International Mechanical Engineering
Congress and Exposition (IMECE), Vol. 1, 2013, ISBN-13: 9780791856178; DOI:
10.1115/IMECE2013-64958.
[3] Firouzian, M., Owen, J.M.; Pincombe, J.R.; Rogers, R.H, 1985, “Flow and Heat
Transfer in a Rotating Cavity with a Radial Inflow of Fluid. Part 1: the Flow
Structure”, International Journal of Heat and Fluid Flow, 6(4), pp. 228-234.
[4] Firouzian, M.; Owen, J.M.; Pincombe, J.R.; Rogers, R.H, 1986, “Flow And Heat
Transfer in a Rotating Cylindrical Cavity with a Radial Inflow of Fluid, Part 2:
Velocity, Pressure and Heat Transfer Measurements”, International Journal of Heat
and Fluid Flow, 7(1), pp. 21-27.
[5] Farthing, P.R.; Long, C.A.; Rogers, R.H.; “Measurement and Prediction of Heat
Transfer from Compressor Discs with a Radial Inflow of Cooling Air”, Proc. of ASME
International Gas Turbine and Aeroengine Congress and Exposition, ASME Paper no.
91-GT-53.
Page 36
ASME J Gas Turb Pwr
GTP-15-1298 SUN 36 /56
[6] Owen, J. M., and Rogers, R. H., 1995, “Flow and Heat Transfer in Rotating-Disc
Systems. Volume 2: Rotating Cavities”, Research Studies Press Ltd., London.
[7] Günther, André; Uffrecht, Wieland; Odenbach, Stefan. 2012, “Local Measurements
of Disk Heat Transfer in Heated Rotating Cavities for Several Flow Regimes”, ASME
Journal of Turbomachinery, 134(5), pp.051016/1~9.
[8] Vinod Kumar, B.G.; Chew, John W.; Hills, Nicholas J. , 2013, “Rotating Flow and Heat
Transfer in Cylindrical Cavities with Radial Inflow”, ASME Journal of Engineering for
Gas Turbines and Power, 135(3), pp.032502/1~11.
[9] Atkins, N.R., 2014, “Passive Tip Clearance Control: NEWAC Data Summary”, private
communication, 2014.
[10] Armstrong I. and Edmunds T.M., 1989, “Fully Automatic Analysis in the Industrial
Environment”, Proceedings of 2nd International Conference on Quality Assurance
and Standards, NAFEMS.
[11] Moinier P., 1999. “Algorithm Developments for an Unstructured Viscous Flow
Solver”, PhD thesis, Oxford University.
[12] Fluent User’s Guide, http://www.ansys.com/.
[13] Chew, J. W., and Rogers, R. H., 1988, “An Integral Method for the Calculation of
Turbulent Forced Convection in a Rotating Cavity With Radial Outflow,” Int. J. Heat
Fluid Flow, 9(1), pp. 37–48.
Page 37
ASME J Gas Turb Pwr
GTP-15-1298 SUN 37 /56
[14] D. Amirante and N. J. Hills, 2014, “Large-Eddy Simulations of Wall Bounded
Turbulent Flows Using Unstructured Linear Reconstruction Techniques'”, Proc. Of
ASME Turbo Expo 2014, ASME Paper no. GT201426119.
[15] Illingworth, J.B., Hills, N. J. and Barnes, C.J., 2005, “3D Fluid-Solid Heat Transfer
Coupling of an Aero Engine Pre-Swirl System”, Proc. of ASME Turbo Expo 2005,
ASME Paper No. GT2005-68939.
[16] Sun, Z., Chew, J., Hills, N., Volkov, K. and Barnes, C., 2010, “Efficient FEA/CFD
Thermal Coupling for Engineering Applications”, ASME Journal of Turbomachinery,
132(3).
[17] Sun, Z., Chew, J. and Hills, N.J., Lewis, L. and Mabilat, C., 2012, “Coupled Aero-
Thermo-Mechanical Simulation for a Turbine Assembly”, ASME Journal of
Turbomachinery, 134(1).
[18] Amirante, J., Hills, N. and Barnes, C., 2010, “An Extension of FEA/CFD Coupling to
Include Thermo-Mechanical Distortion”, Proc. of ASME Turbo Expo 2010, ASME
Paper No. GT2010-22684.
[19] Amirante, D., Hills, N.J. and Barnes, C.J., “Thermo-Mechanical Finite Element
Analysis/Computational Fluid Dynamics Coupling of an Interstage Seal Cavity Using
Torsional Spring Analogy”, ASME, Journal of Turbomachinery, 134(5).
[20] Ganine, V., Javiya, U., Hills, N. and Chew, J., 2012, “Coupled Fluid-Structure
Transient Thermal Analysis of a Gas Turbine Internal Air System with Multiple
Cavities”, Proc. of ASME Turbo Expo 2012, ASME Paper No. GT2012-68989.
Page 38
ASME J Gas Turb Pwr
GTP-15-1298 SUN 38 /56
[21] Sun, Z., Chew, J., Hills, N., Barnes and Valencia, A. G., 2012, “3D Coupled Fluid-Solid
Thermal Simulation of a Turbine Disc through a Transient Cycle”, Proc. of ASME
Turbo Expo 2012, ASME Paper No. GT2012-68430.
[22] Alexiou, A.; Hills, N.J.; Long, Christopher; Turner, A.B.; Millward, J.A, 2000, “Heat
Transfer in High-Pressure Compressor Gas Turbine Internal Air Systems: A Rotating
Disc-Cone Cavity with Axial Throughflow”, Experimental Heat Transfer, 13(1-4), pp.
299-328.
Page 39
ASME J Gas Turb Pwr
GTP-15-1298 SUN 39 /56
Figure Captions List
Fig. 1 Schematic diagram of flow in rotating cavity with radial inflow
Page 40
ASME J Gas Turb Pwr
GTP-15-1298 SUN 40 /56
Fig. 2 Sectional view of the test rig
Page 41
ASME J Gas Turb Pwr
GTP-15-1298 SUN 41 /56
Fig. 3 The transient cycle
Page 42
ASME J Gas Turb Pwr
GTP-15-1298 SUN 42 /56
Fig. 4 The axisymmetric FE model and CFD domain
Page 43
ASME J Gas Turb Pwr
GTP-15-1298 SUN 43 /56
Fig. 5 Flow features associated with radial inflow, MTO-3, 22.5° sector, Hydra, SA, y+~1
Page 44
ASME J Gas Turb Pwr
GTP-15-1298 SUN 44 /56
Fig. 6 Comparison of swirl ratio between the sector models, the mid-axial plane, MTO-
3
Page 45
ASME J Gas Turb Pwr
GTP-15-1298 SUN 45 /56
Fig. 7 Comparison of swirl ratio and radial velocity at three radial positions, MTO-3
Page 46
ASME J Gas Turb Pwr
GTP-15-1298 SUN 46 /56
Fig. 8 Comparison of swirl ratio between turbulence models, the axial mid-plane, MTO-
3
Page 47
ASME J Gas Turb Pwr
GTP-15-1298 SUN 47 /56
Fig. 9 Instantaneous fluid temperature on periodic and mid-axial planes, LES, MTO-3
condition
Page 48
ASME J Gas Turb Pwr
GTP-15-1298 SUN 48 /56
Fig. 10 Typical metal temperature histories, TK@MP20, r/b=0.653, MTO-3
Page 49
ASME J Gas Turb Pwr
GTP-15-1298 SUN 49 /56
Fig. 11 Comparison of disc temperature, Disc-3, MTO-3 condition
Page 50
ASME J Gas Turb Pwr
GTP-15-1298 SUN 50 /56
Fig. 12 Comparison of shroud temperature, MTO-3 condition
Page 51
ASME J Gas Turb Pwr
GTP-15-1298 SUN 51 /56
Fig. 13 Comparison of hub temperature, MTO-3 condition
Page 52
ASME J Gas Turb Pwr
GTP-15-1298 SUN 52 /56
Fig. 14 Distributions of heat flux and Nusselt number on the right hand side surface of
Disc-3, MTO-3
Page 53
ASME J Gas Turb Pwr
GTP-15-1298 SUN 53 /56
Fig. 15 Transient disc metal histories, the integral method solution coupled with a “thin
disc” model, MTO-3 condition
Page 54
ASME J Gas Turb Pwr
GTP-15-1298 SUN 54 /56
Table Caption List
Table 1 Key dimensions of the cavity
Cavity Radial Ratio a/b Cavity Gap Ratio s/b Shaft Radial Ratio rs/b
0.319 0.195 0.236
Page 55
ASME J Gas Turb Pwr
GTP-15-1298 SUN 55 /56
Table 2 Key operating parameters, MTO-3 condition
Axial bore flow parameter
Cw,bore=mbore/bµbore=0.16x106
Radial inflow Parameter
Cw,rad=mrad/bµrad=0.62x104
Mass flow ratio
mrad/mbore = 4.3%
Angular speed
Ω=733.79 rad/s
Axial Reynolds number
Reax,bore=ρboredhUax,bore/µbore= 0.19x10⁶
Radial Reynolds number
Rerad,shroud=ρrad2sWrad,shroud/µrad= 0.21x10⁴
Rotational Reynolds number
ReΩ,b=ρboreΩb2/µbore=0.84x10
7
Rossby number
Roax,bore=Uax,bore/aΩ=0.44
Page 56
ASME J Gas Turb Pwr
GTP-15-1298 SUN 56 /56
Table 3 Summary of sensitivity study results
No. Altered Parameters for the sensitivity study *
Sensitivity Index /ΔTref
1 Radial inflow temperature Trad+8%ΔTref 3.9 %
2 Radial inflow mass-rate mrad+5%mrad 0.3 %
3 Bore coolant temperature Tbore+8%ΔTref 0.8 %
4 Bore coolant mass-rate mbore+5%mbore 0.4 %
5 Bore coolant inlet swirl ratio Vθ/rΩ=0.5 1.0 %
6 Bore outlet pressure pout+10ρbore(aΩ)2 0.2 %
7 Neighboring cavity air temperature Tcav+8%ΔTref 0.8 %
8 Coupled with k-ε model 5.0 %
* Note: is an area weighted root-mean-
square (RMS) temperature difference over disc-3 between the coupled solution with an
altered parameter for the sensitivity study Tsen and its baseline counterpart TMTO3