Professional Development Programme on Enriching Knowledge of the Business, Accounting and Financial Studies (BAFS) Curriculum <Elective Part> Course Title: Cost Accounting for Decision Making 1
Transcript
Professional Development Programme on Enriching Knowledge of the Business, Accounting and Financial Studies
(BAFS) Curriculum <Elective Part>
Course Title: Cost Accounting for Decision Making
1
Learning OutcomesUpon completion of this course, teacher participants should be able to:
•apply cost‐volume‐profit analysis techniques to ascertain the inter‐relationships among costs, selling price, units sold, breakeven point, target profit and margin of safety;
•state the assumptions and limitations of cost‐volume‐profit analysis;
•identify and differentiate relevant costs and irrelevant costs in different business scenarios; and
•make recommendation to short‐term business decisions.
2
Syllabus in HKDSE Examination• Identify the nature of various cost items and their
relevance to decision‐making: sunk costs, incremental costs and opportunity costs.
• Apply costing concepts and techniques in business decisions, e.g. “hire, make or buy”, “accept or reject an order at a special price”, “retain or replace equipment”, “sell or process further” and “eliminate or retain an unprofitable segment”.
• Conduct cost‐volume‐profit analysis to assess the effects of changes in costs, selling price and units sold on the breakeven point and target profit.
• Identify the nature of various cost items and their relevance to decision‐making: sunk costs, incremental costs and opportunity costs.
• Apply costing concepts and techniques in business decisions, e.g. “hire, make or buy”, “accept or reject an order at a special price”, “retain or replace equipment”, “sell or process further” and “eliminate or retain an unprofitable segment”.
• Conduct cost‐volume‐profit analysis to assess the effects of changes in costs, selling price and units sold on the breakeven point and target profit.
3
What‐if analysis
Contents• Breakeven point
• Sale level required to achieve target profit
• Margin of safety
• What‐if analysis (Illustrations 1 & 2)
• Sales mix (Illustration 3 & 4)
• Relevant costs vs. irrelevant costs (Illustrations 5 & 6)
• Accept or reject an order (Illustration 7)
• Hire decision (Illustration 8)
• Make or buy (illustration 9)
• Retain or replace equipment (Illustration 10)
• Sell or process further (Illustration 11)
• Eliminate or retain an unprofitable segment (Illustration 12)
4
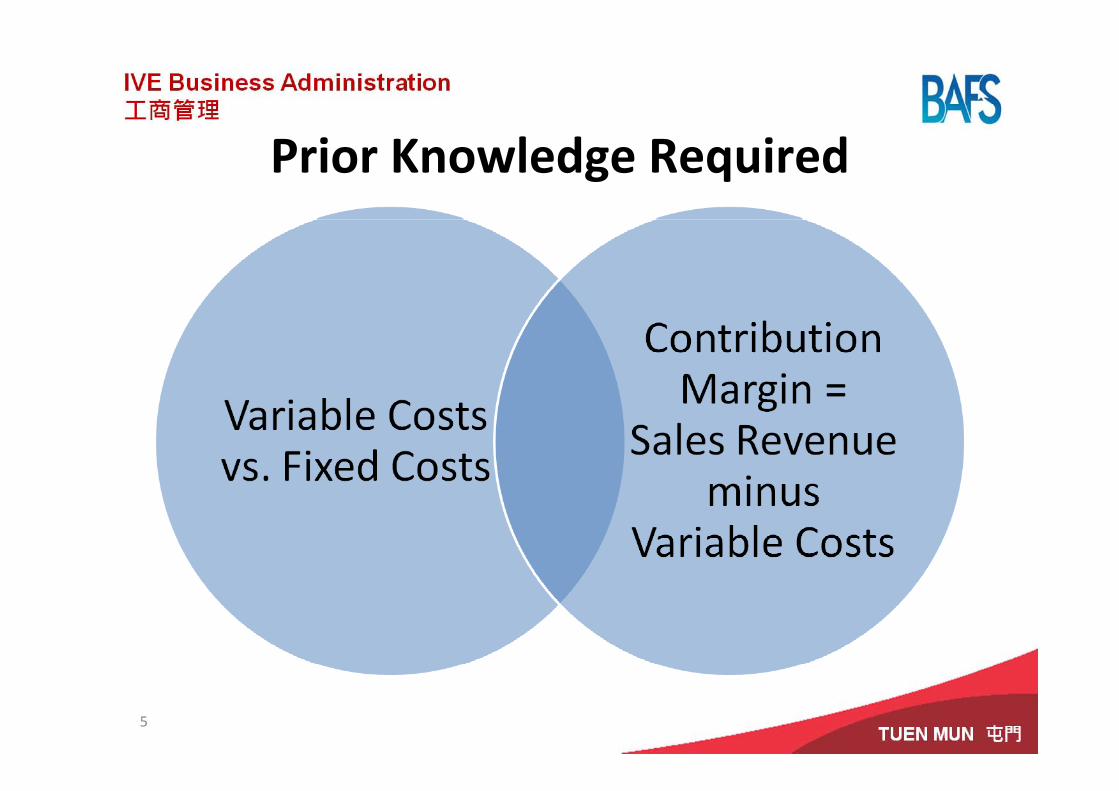
Prior Knowledge Required
5
Cost‐Volume‐Profit Analysis (C‐V‐P Analysis)
(Breakeven Analysis)
6
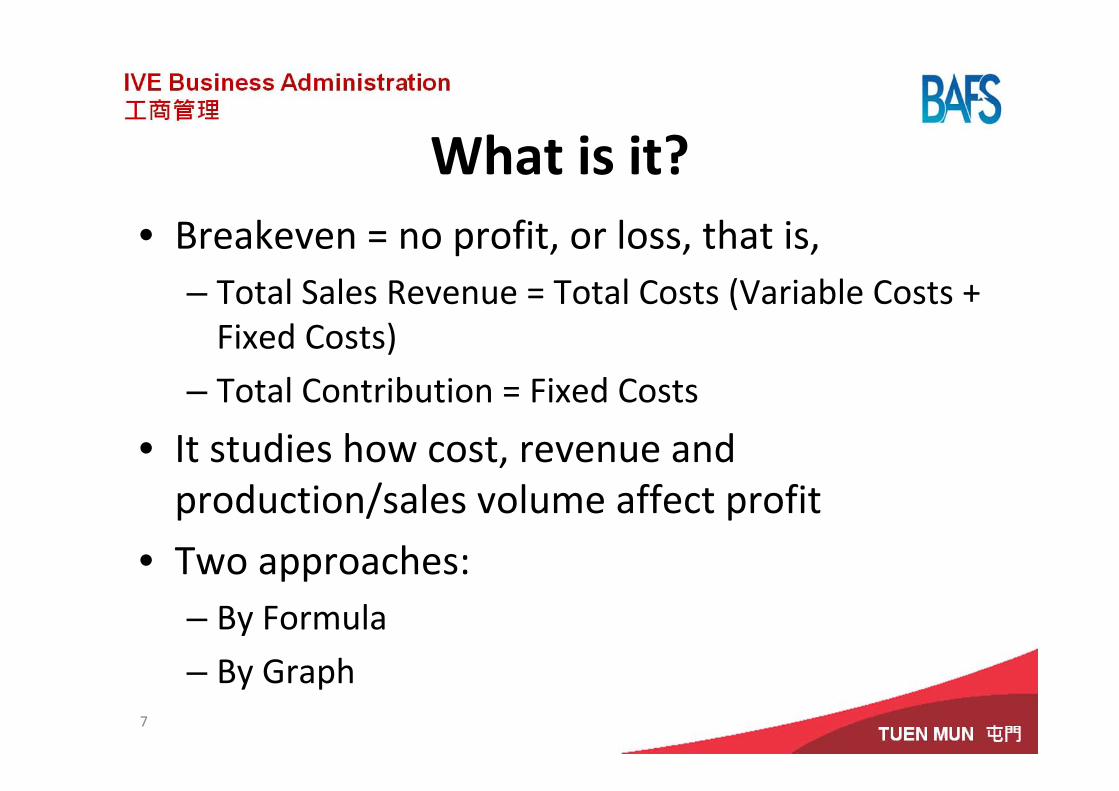
What is it?• Breakeven = no profit, or loss, that is,
– Total Sales Revenue = Total Costs (Variable Costs + Fixed Costs)
– Total Contribution = Fixed Costs
• It studies how cost, revenue and production/sales volume affect profit
• Two approaches:– By Formula
– By Graph7
Breakeven Point – By Formula
8
or
where
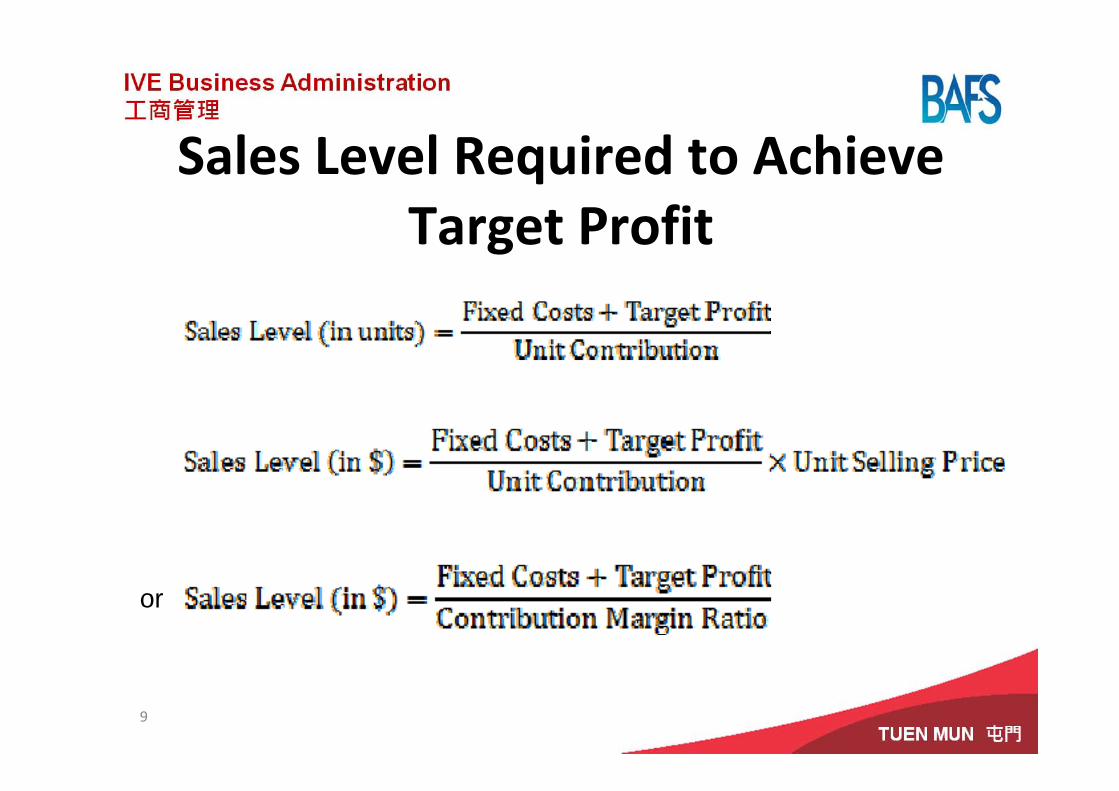
Sales Level Required to Achieve Target Profit
9
or
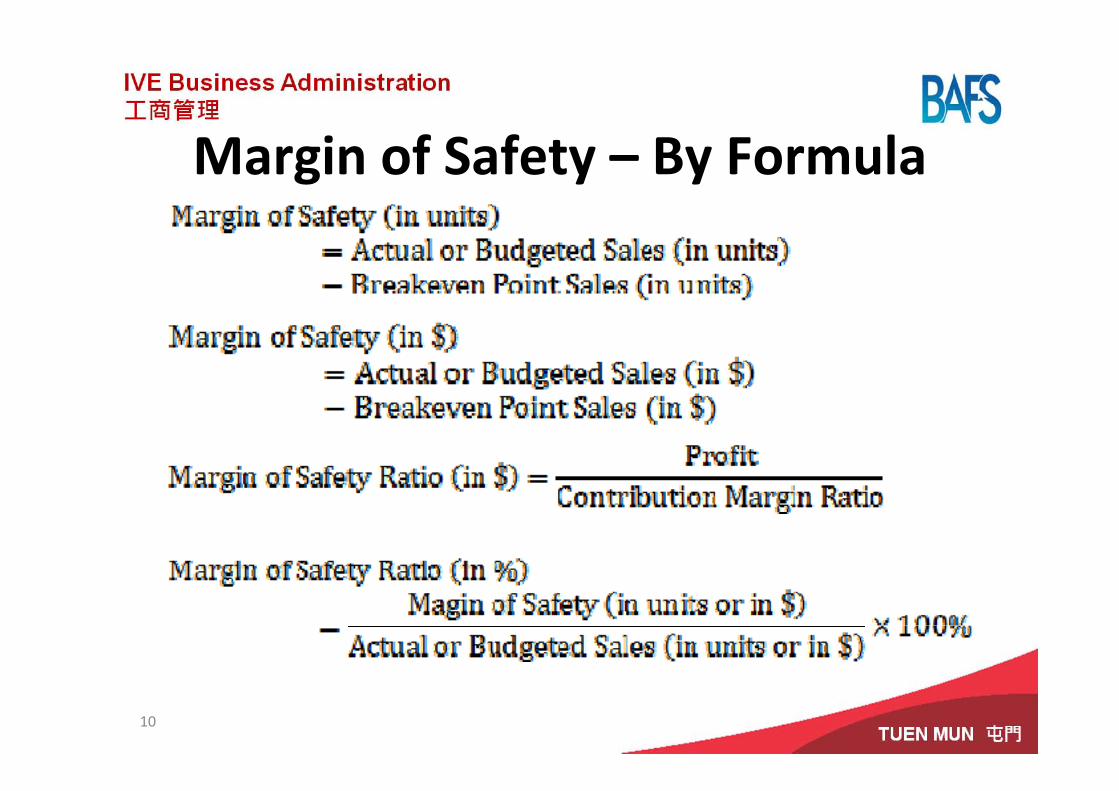
Margin of Safety – By Formula
10
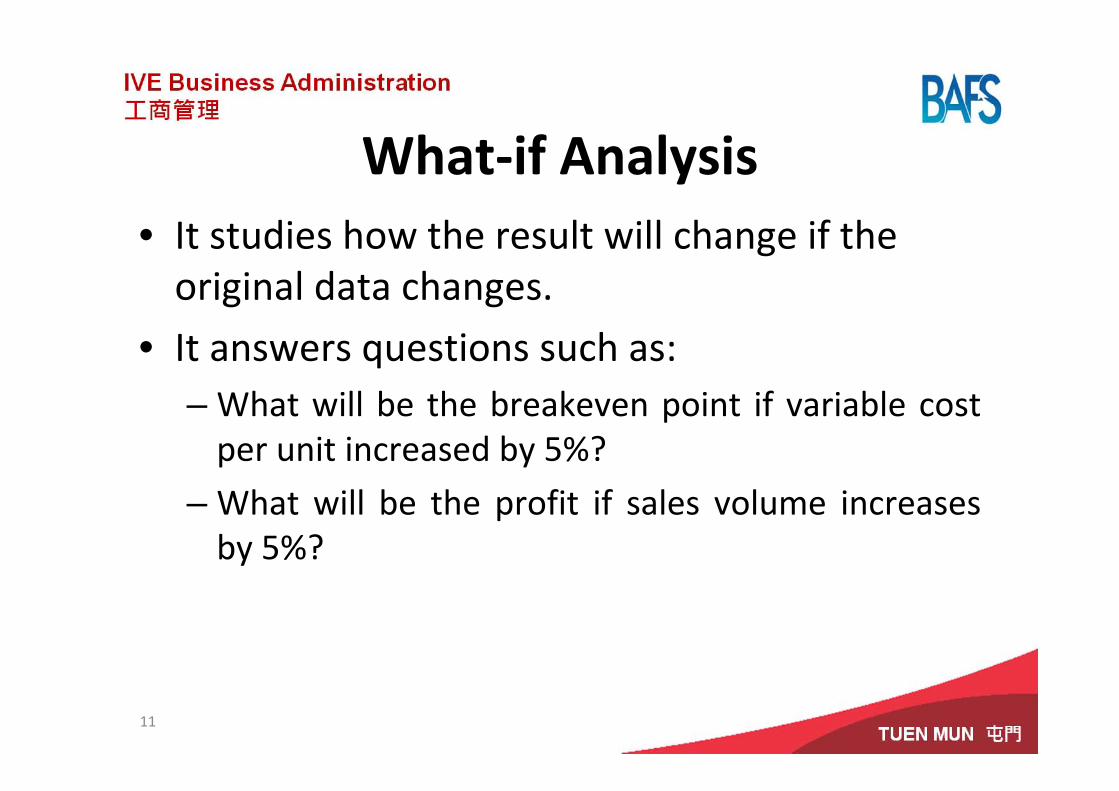
What‐if Analysis• It studies how the result will change if the original data changes.
• It answers questions such as:– What will be the breakeven point if variable cost per unit increased by 5%?
– What will be the profit if sales volume increases by 5%?
11
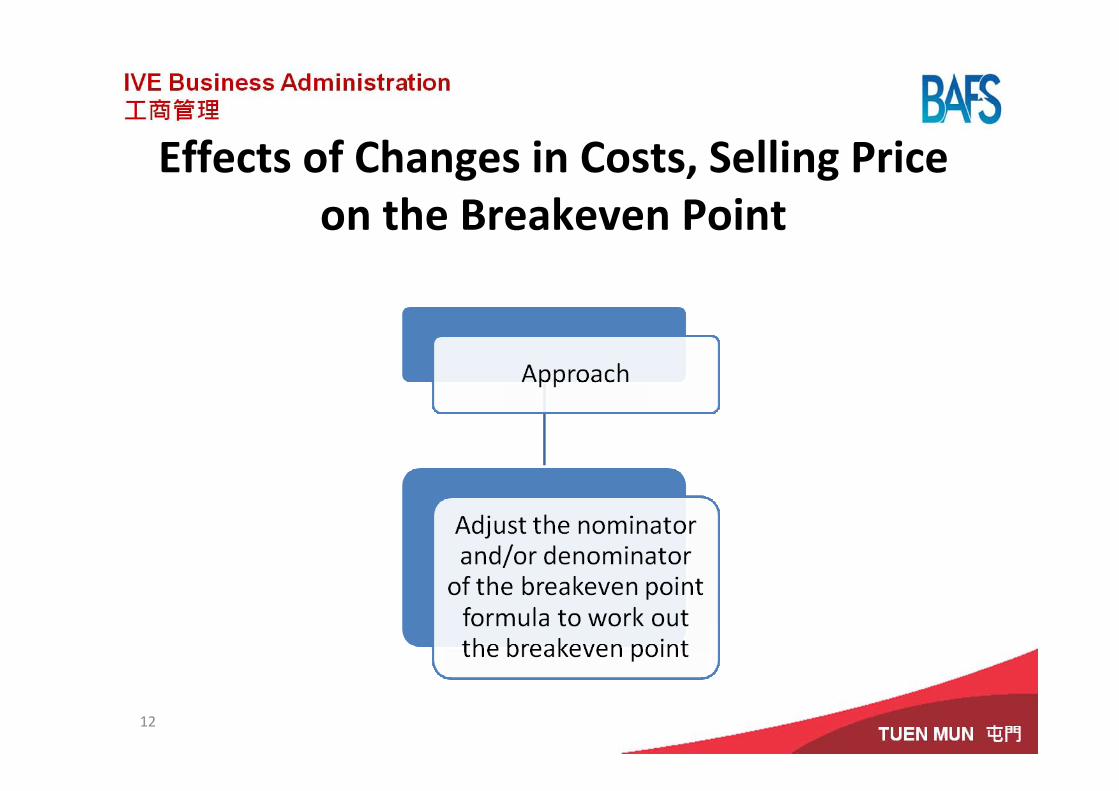
Effects of Changes in Costs, Selling Price on the Breakeven Point
12
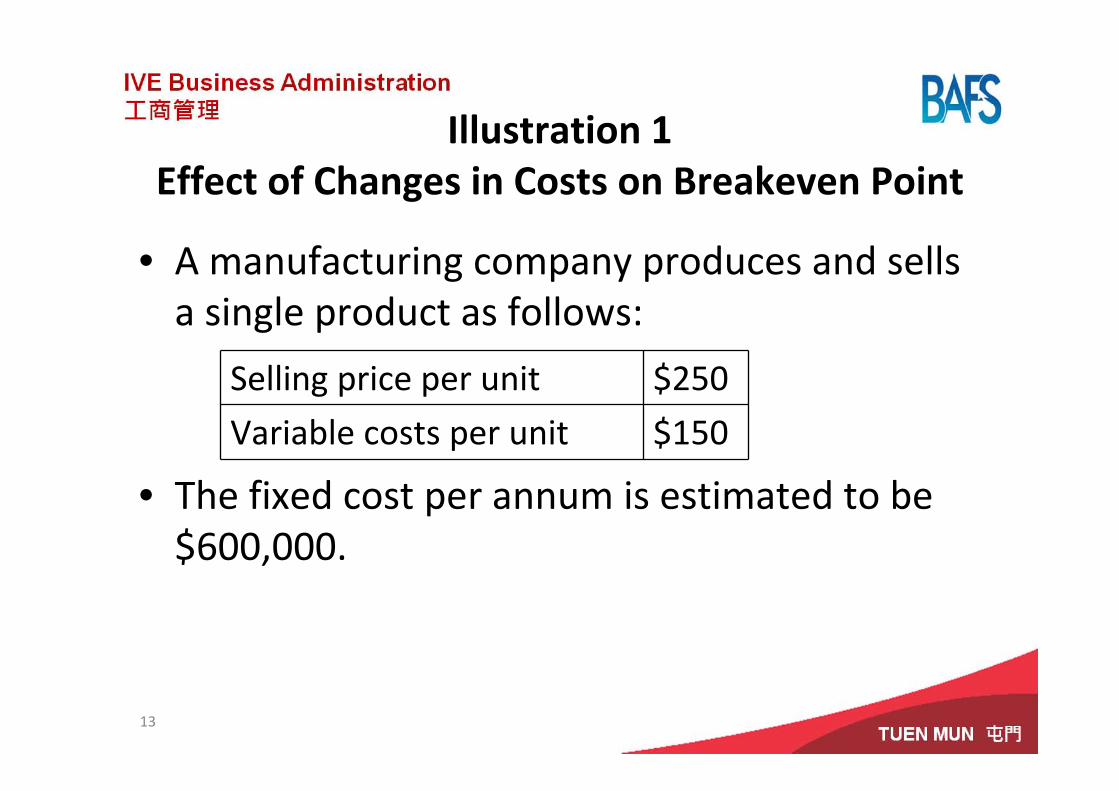
Illustration 1Effect of Changes in Costs on Breakeven Point
• A manufacturing company produces and sells a single product as follows:
• The fixed cost per annum is estimated to be $600,000.
13
Selling price per unit $250
Variable costs per unit $150
Illustration 1Effect of Changes in Costs on Breakeven Point
• The sales manager would like to propose a change to pay a salesman on commission basis of $10 per unit sold rather than on fixed monthly salaries of $8,000 per month.
• What would be the breakeven points in units for the situations before and after the change?
14
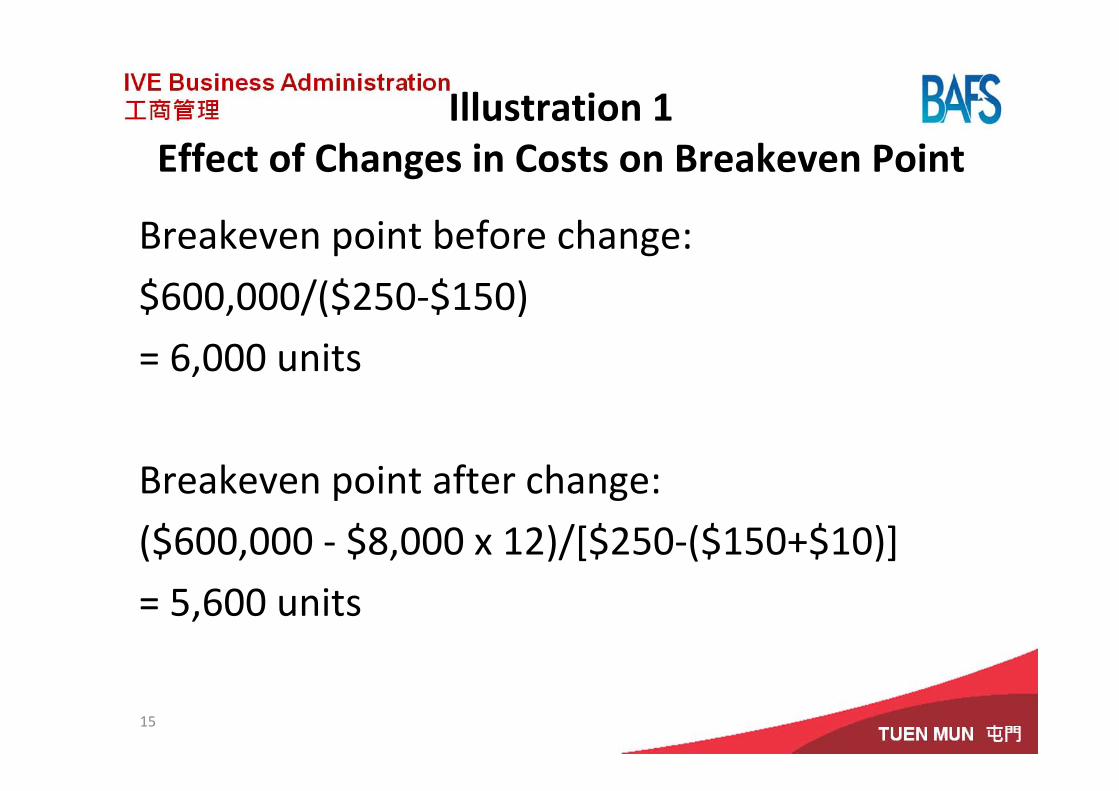
Illustration 1Effect of Changes in Costs on Breakeven Point
Breakeven point before change:
$600,000/($250‐$150)
= 6,000 units
Breakeven point after change:
($600,000 ‐ $8,000 x 12)/[$250‐($150+$10)]
= 5,600 units
15
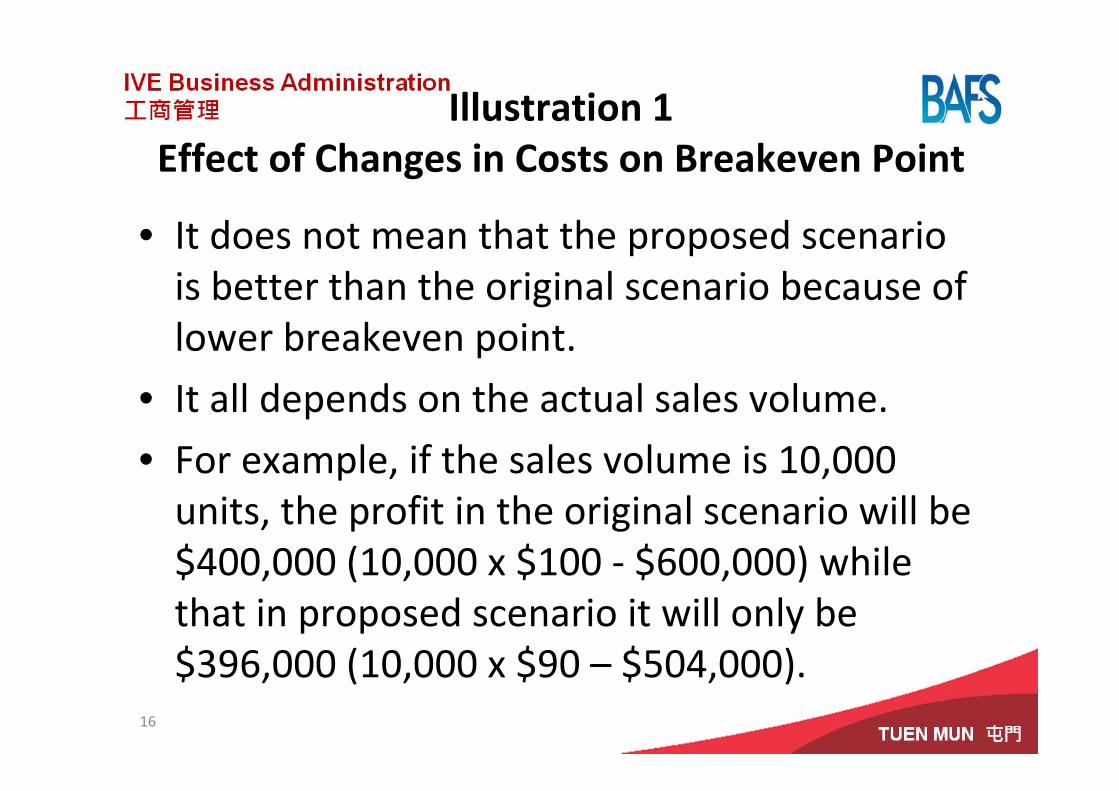
Illustration 1Effect of Changes in Costs on Breakeven Point
• It does not mean that the proposed scenario is better than the original scenario because of lower breakeven point.
• It all depends on the actual sales volume.
• For example, if the sales volume is 10,000 units, the profit in the original scenario will be $400,000 (10,000 x $100 ‐ $600,000) while that in proposed scenario it will only be $396,000 (10,000 x $90 – $504,000).
16
Effects of Changes in Costs, Selling Price and Units Sold on the Profit
17
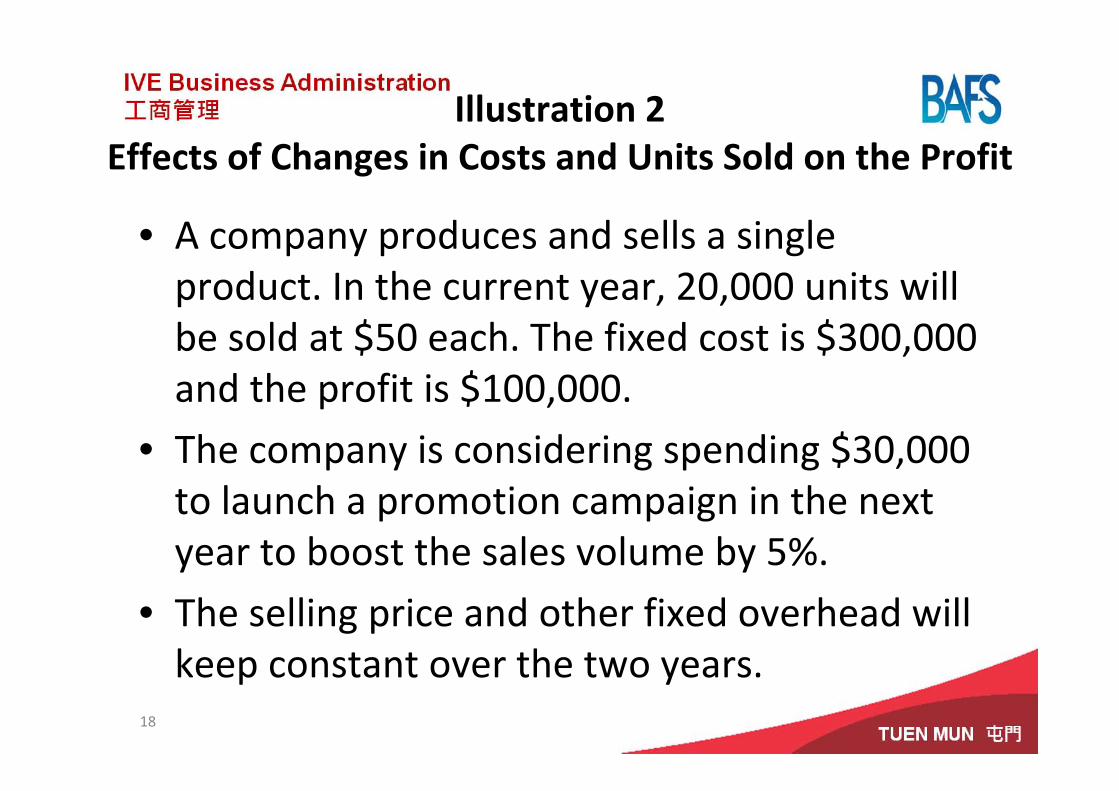
Illustration 2Effects of Changes in Costs and Units Sold on the Profit
• A company produces and sells a single product. In the current year, 20,000 units will be sold at $50 each. The fixed cost is $300,000 and the profit is $100,000.
• The company is considering spending $30,000 to launch a promotion campaign in the next year to boost the sales volume by 5%.
• The selling price and other fixed overhead will keep constant over the two years.
18
Illustration 2Effects of Changes in Costs and Units Sold on the Profit
Required
1)For the current year, calculate:
a) the breakeven point in units, and
b) the margin of safety in %
2)Prepare the income statements for both current year and next year.
3)Explain whether the promotion campaign should be launched.
19
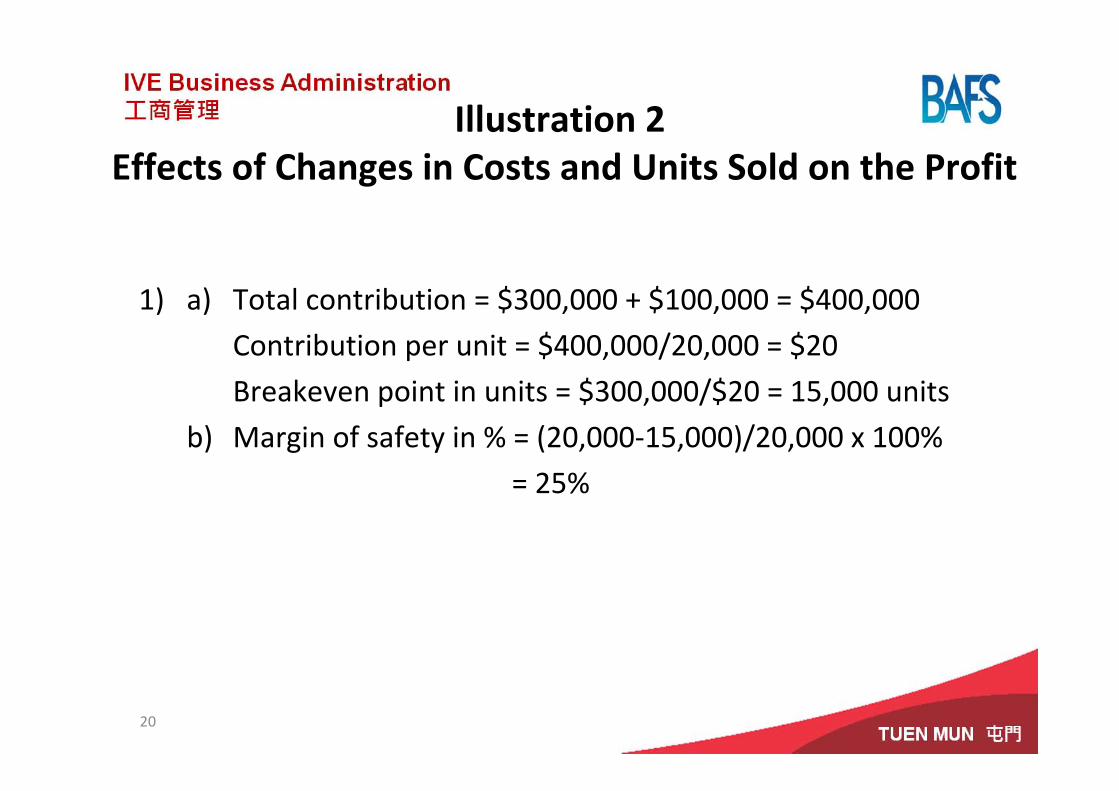
Illustration 2Effects of Changes in Costs and Units Sold on the Profit
1) a) Total contribution = $300,000 + $100,000 = $400,000
Contribution per unit = $400,000/20,000 = $20
Breakeven point in units = $300,000/$20 = 15,000 units
b) Margin of safety in % = (20,000‐15,000)/20,000 x 100%
= 25%
20
Illustration 2Effects of Changes in Costs and Units Sold on the Profit
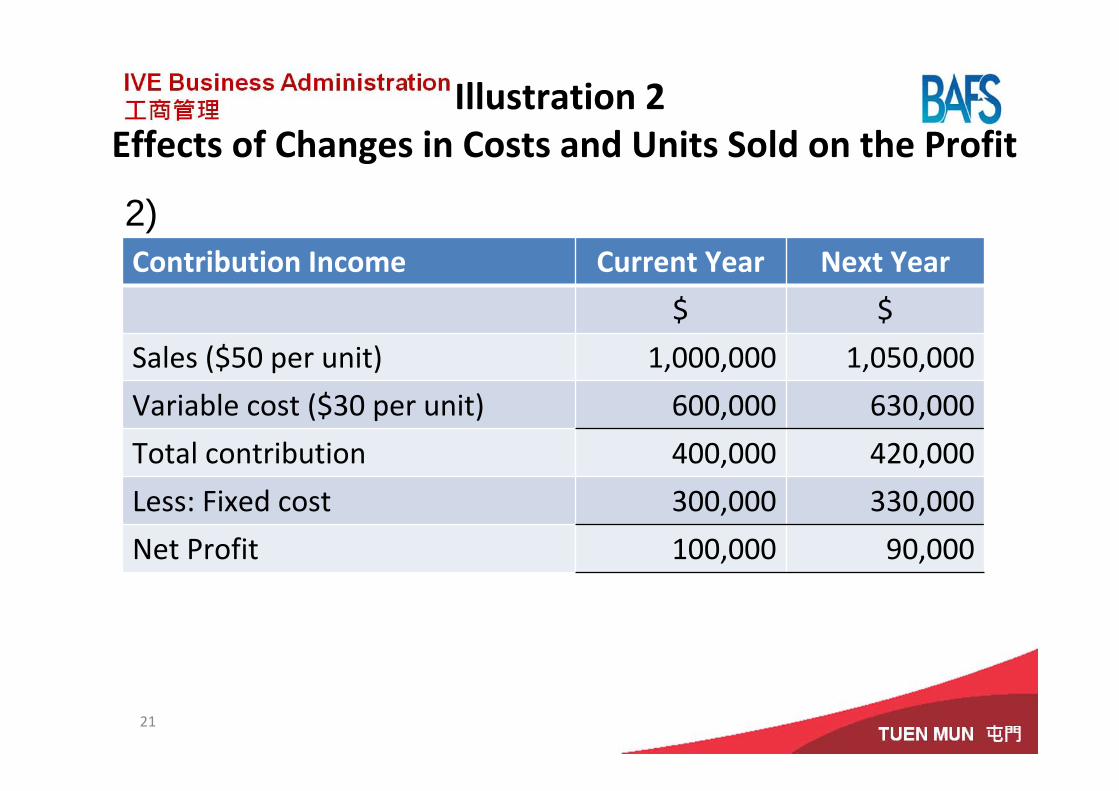
Contribution Income Statements
Current Year Next Year
$ $
Sales ($50 per unit) 1,000,000 1,050,000
Variable cost ($30 per unit) 600,000 630,000
Total contribution 400,000 420,000
Less: Fixed cost 300,000 330,000
Net Profit 100,000 90,000
21
2)
Illustration 2Effects of Changes in Costs and Units Sold on the Profit
3) The promotion should not be launched as it would lower the net profit.
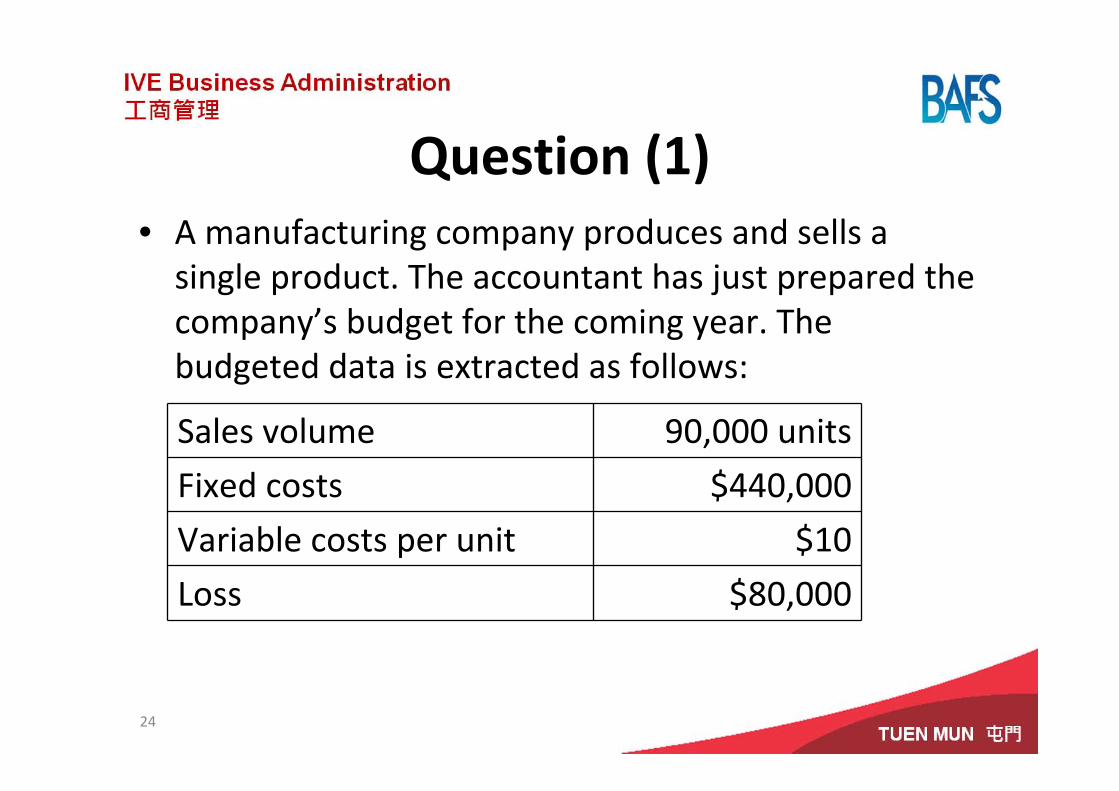
Question (1)• A manufacturing company produces and sells a single product. The accountant has just prepared the company’s budget for the coming year. The budgeted data is extracted as follows:
24
Sales volume 90,000 units
Fixed costs $440,000
Variable costs per unit $10
Loss $80,000
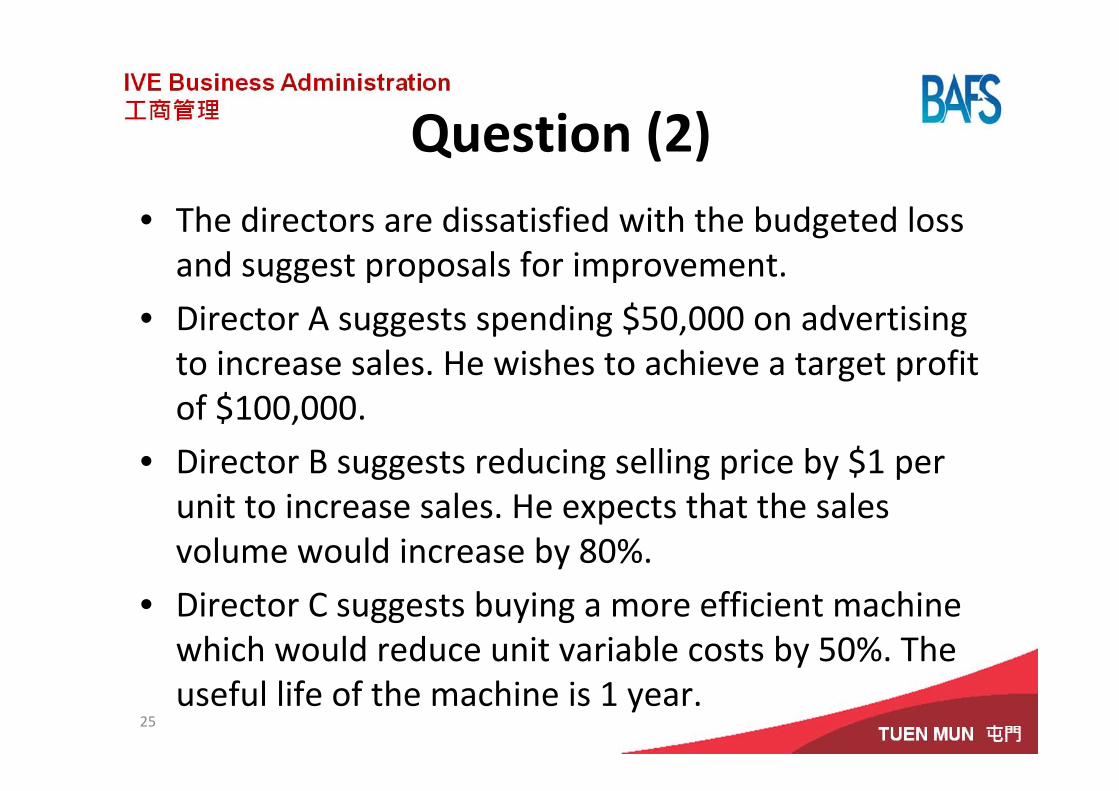
Question (2)• The directors are dissatisfied with the budgeted loss and suggest proposals for improvement.
• Director A suggests spending $50,000 on advertising to increase sales. He wishes to achieve a target profit of $100,000.
• Director B suggests reducing selling price by $1 per unit to increase sales. He expects that the sales volume would increase by 80%.
• Director C suggests buying a more efficient machine which would reduce unit variable costs by 50%. The useful life of the machine is 1 year.
25
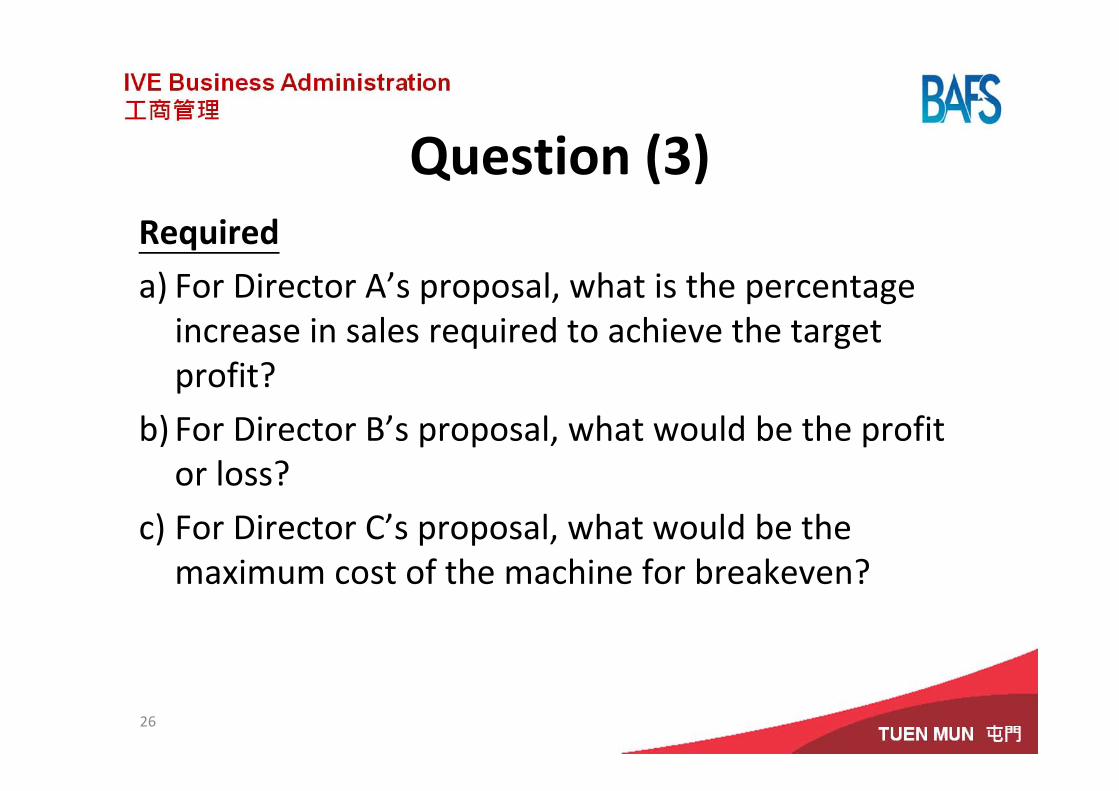
Question (3)Required
a) For Director A’s proposal, what is the percentage increase in sales required to achieve the target profit?
b) For Director B’s proposal, what would be the profit or loss?
c) For Director C’s proposal, what would be the maximum cost of the machine for breakeven?
26
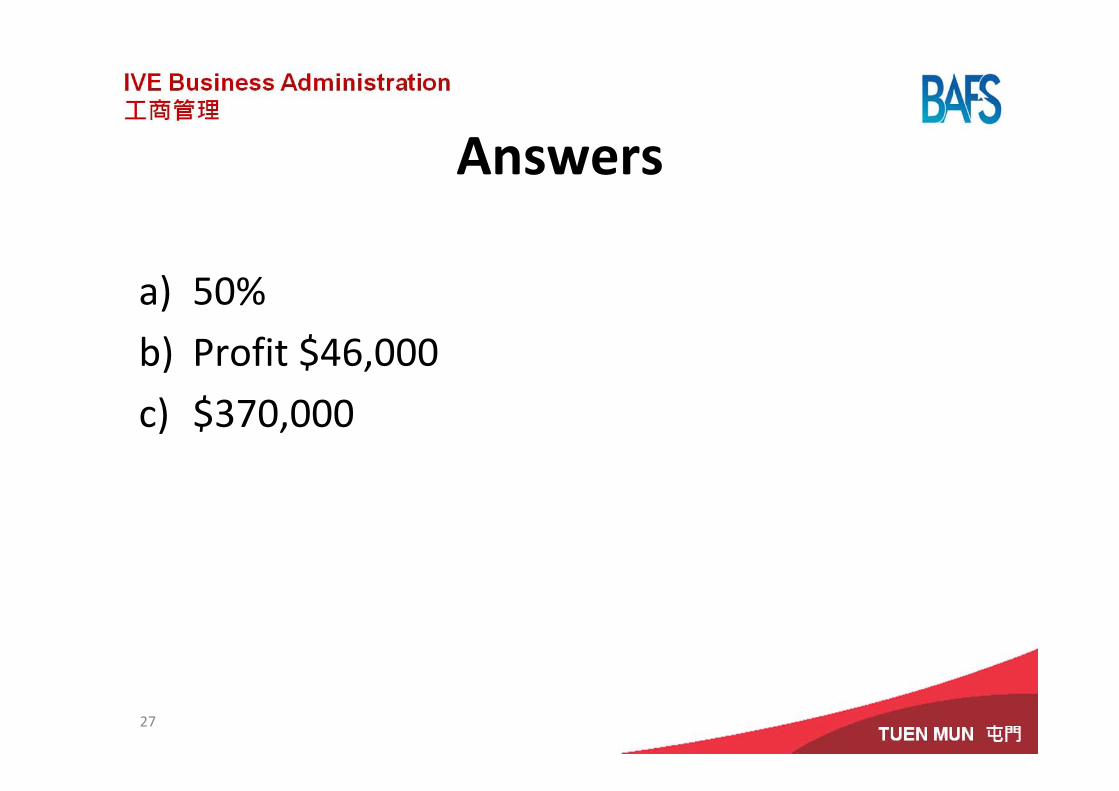
Answers
a) 50%
b) Profit $46,000
c) $370,000
27
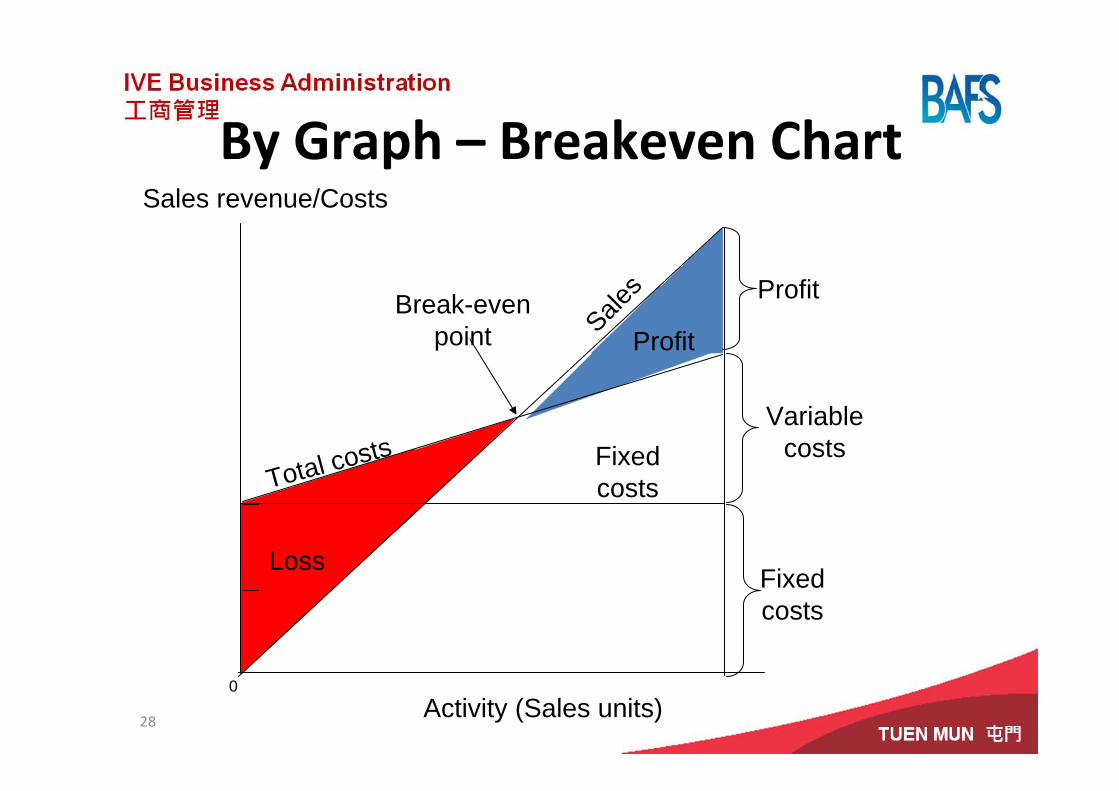
By Graph – Breakeven Chart
28
0Activity (Sales units)
Sales revenue/Costs
Total costsVariable
costs
Fixed costs
Profit
Loss
ProfitSales
Fixed costs
Break-even point
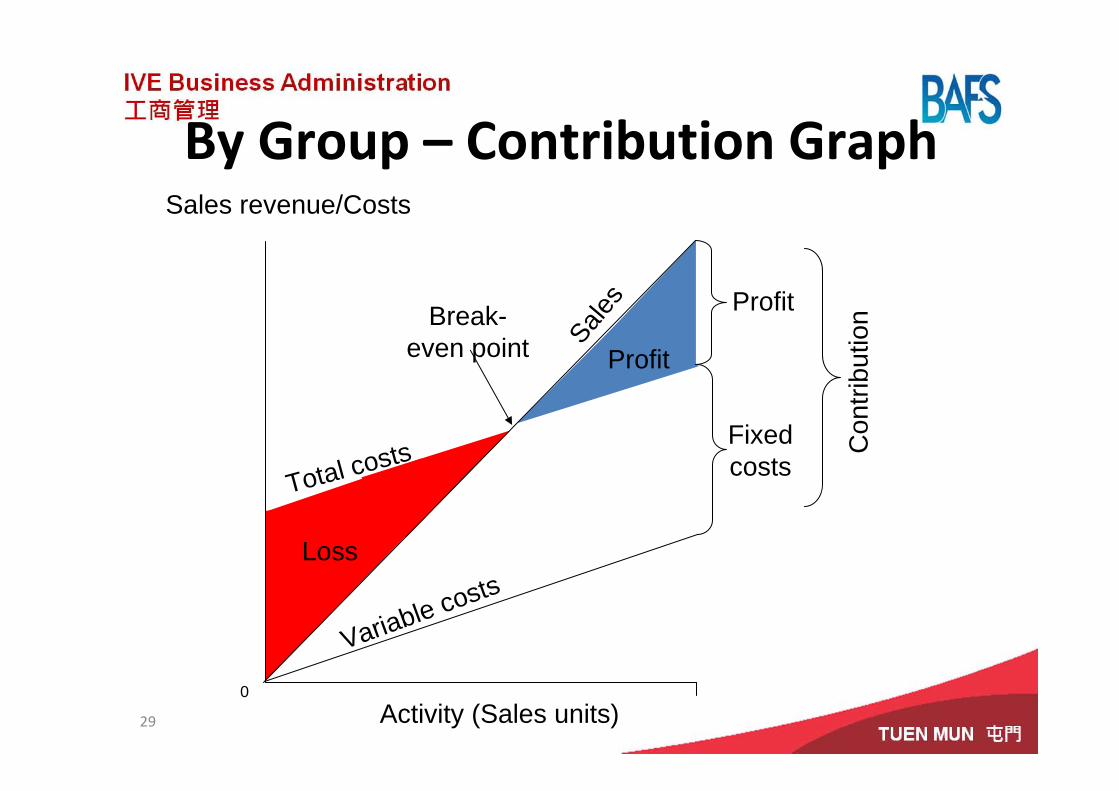
By Group – Contribution Graph
29
0
Total costs
Profit
Loss
Profit
Sales
Con
tribu
tion
Activity (Sales units)
Sales revenue/Costs
Break-even point
Fixed costs
Variable costs
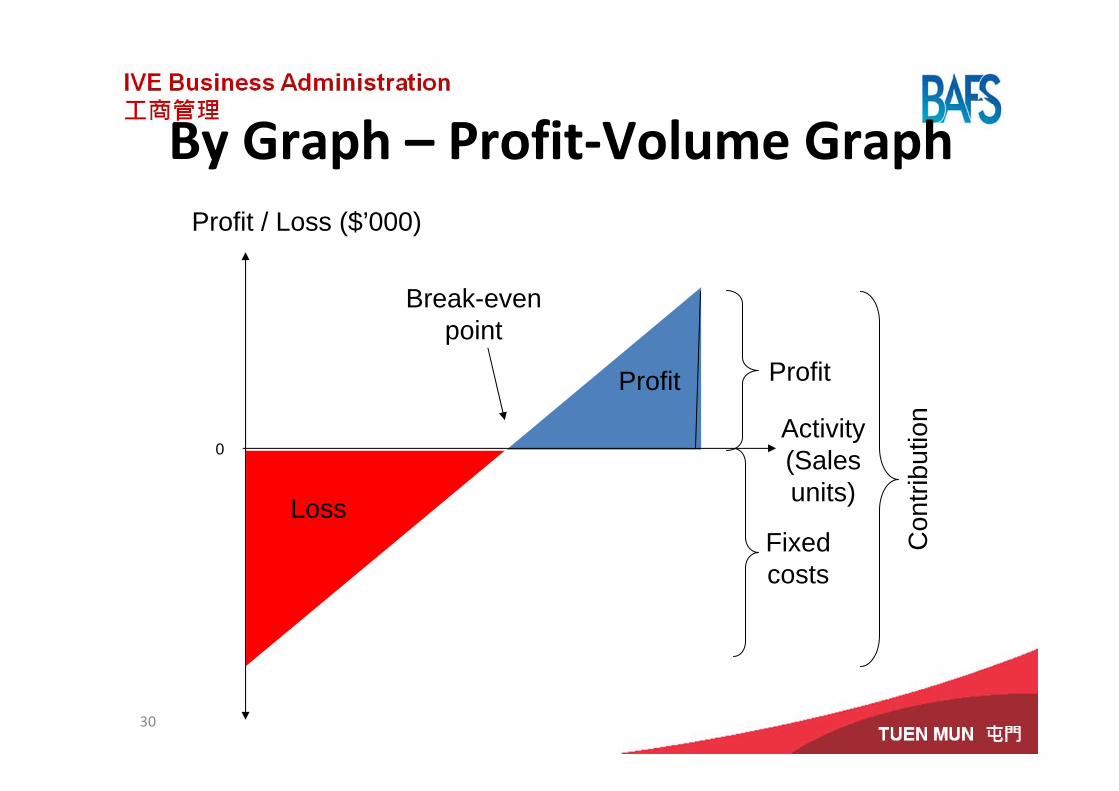
By Graph – Profit‐Volume Graph
30
0
Profit / Loss ($’000)
Loss
Profit
Break-even point
Fixed costs
Profit
Con
tribu
tionActivity
(Sales units)
Breakeven Point for Sales Mix
When a company produces multiple products, it is assumed that the relative combination of the products sold (sales units) will be constant.
31
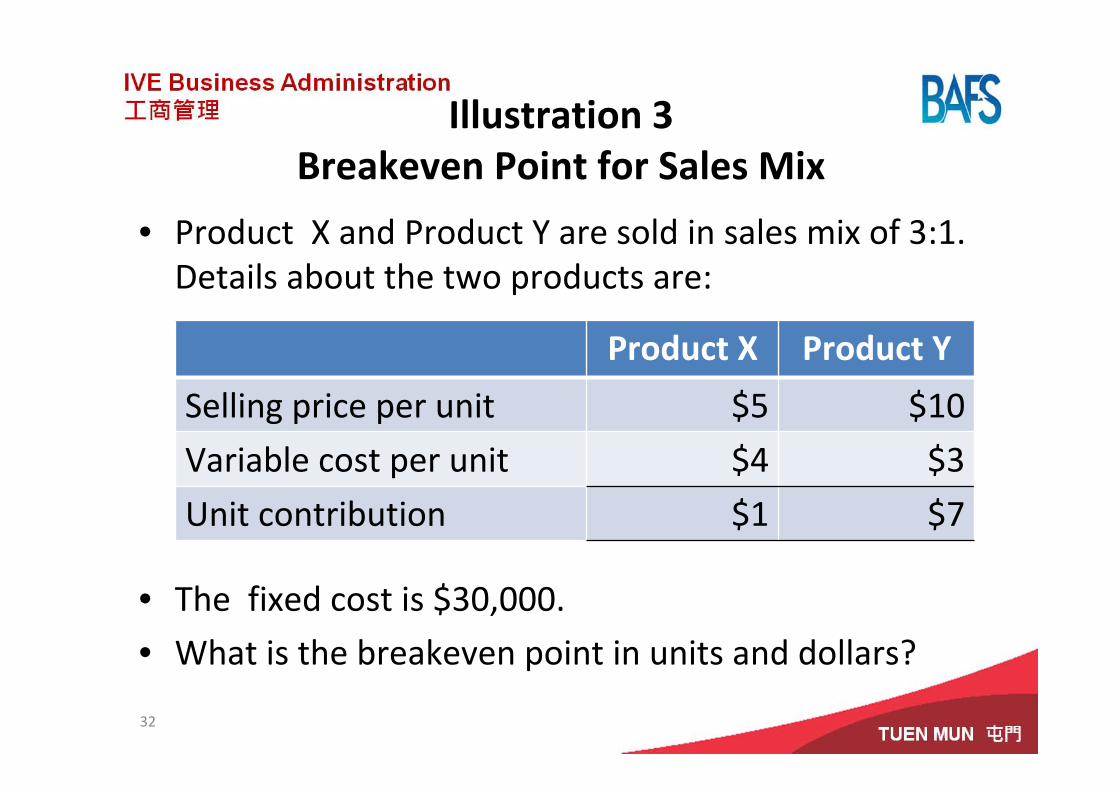
Illustration 3Breakeven Point for Sales Mix
• Product X and Product Y are sold in sales mix of 3:1. Details about the two products are:
• The fixed cost is $30,000.
• What is the breakeven point in units and dollars?
32
Product X Product Y
Selling price per unit $5 $10
Variable cost per unit $4 $3
Unit contribution $1 $7
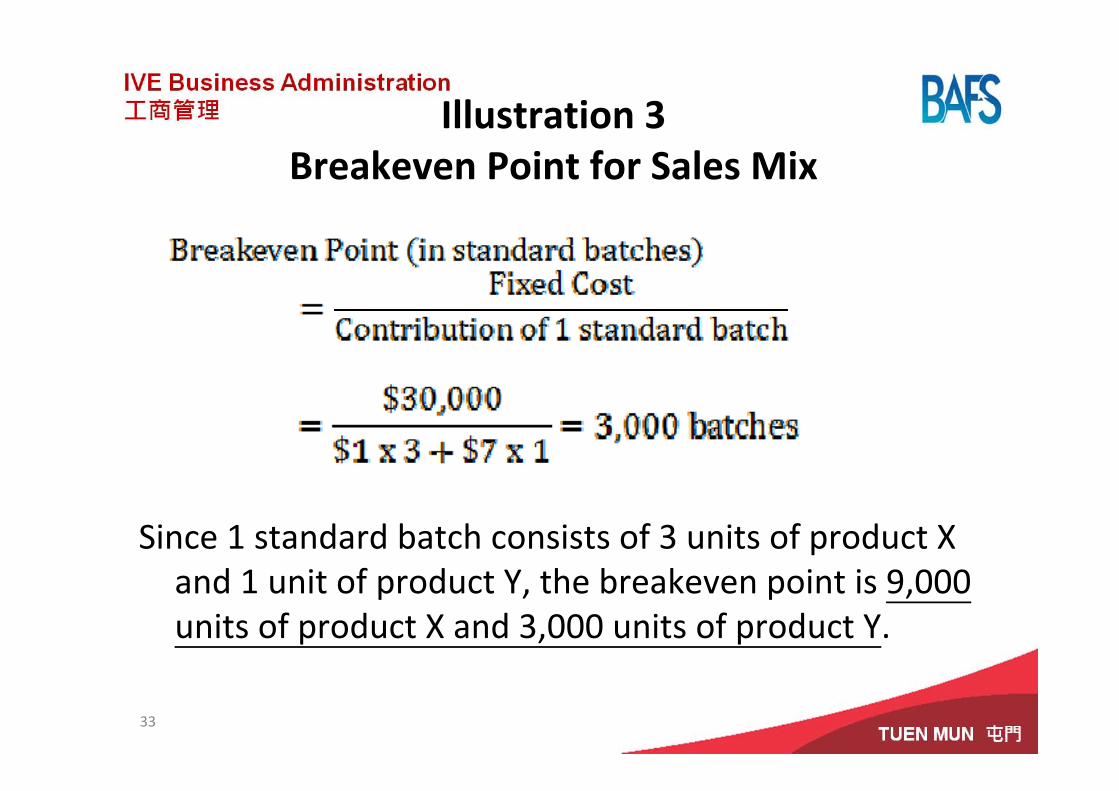
Illustration 3Breakeven Point for Sales Mix
Since 1 standard batch consists of 3 units of product X and 1 unit of product Y, the breakeven point is 9,000 units of product X and 3,000 units of product Y.
33
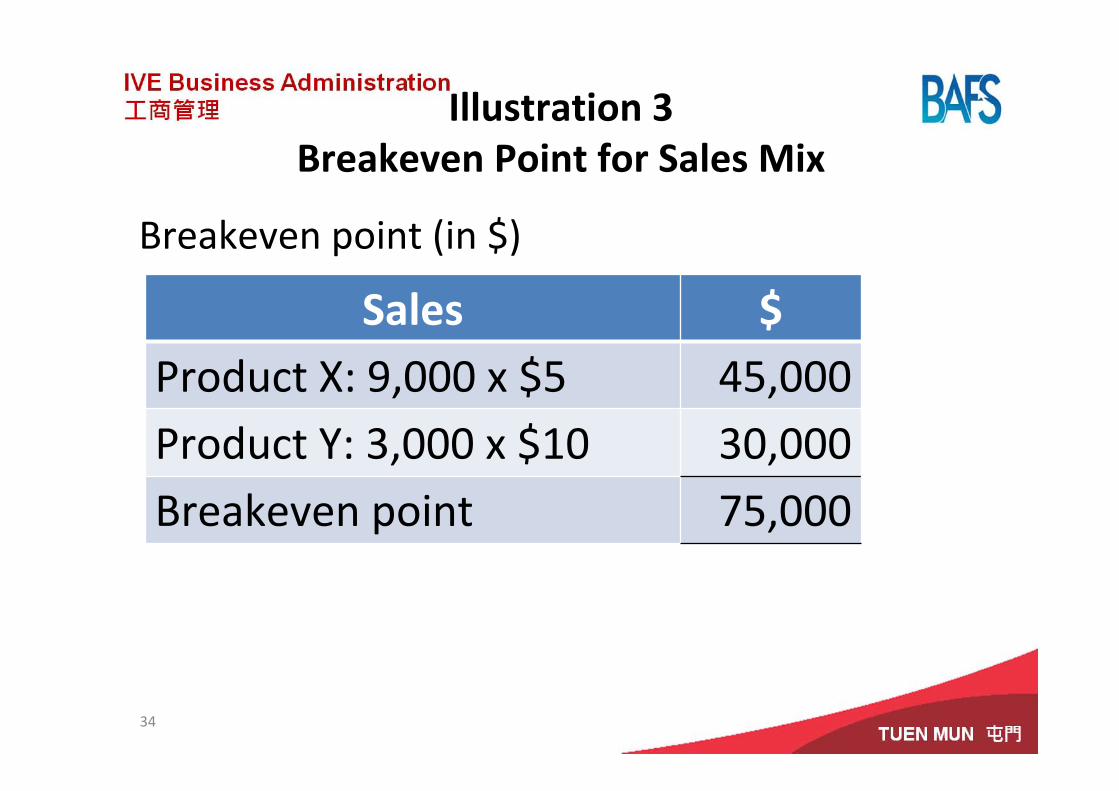
Breakeven point (in $)
34
Sales $Product X: 9,000 x $5 45,000Product Y: 3,000 x $10 30,000Breakeven point 75,000
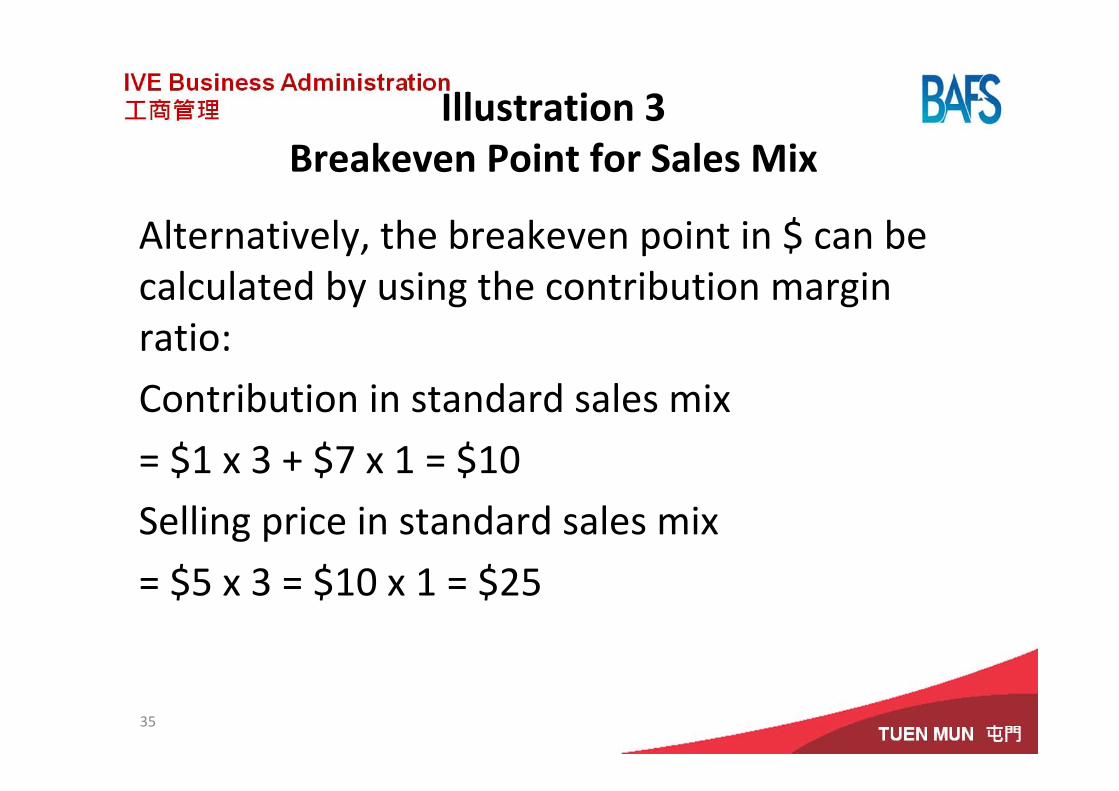
Illustration 3Breakeven Point for Sales Mix
Alternatively, the breakeven point in $ can be calculated by using the contribution margin ratio:
Contribution in standard sales mix
= $1 x 3 + $7 x 1 = $10
Selling price in standard sales mix
= $5 x 3 = $10 x 1 = $25
35
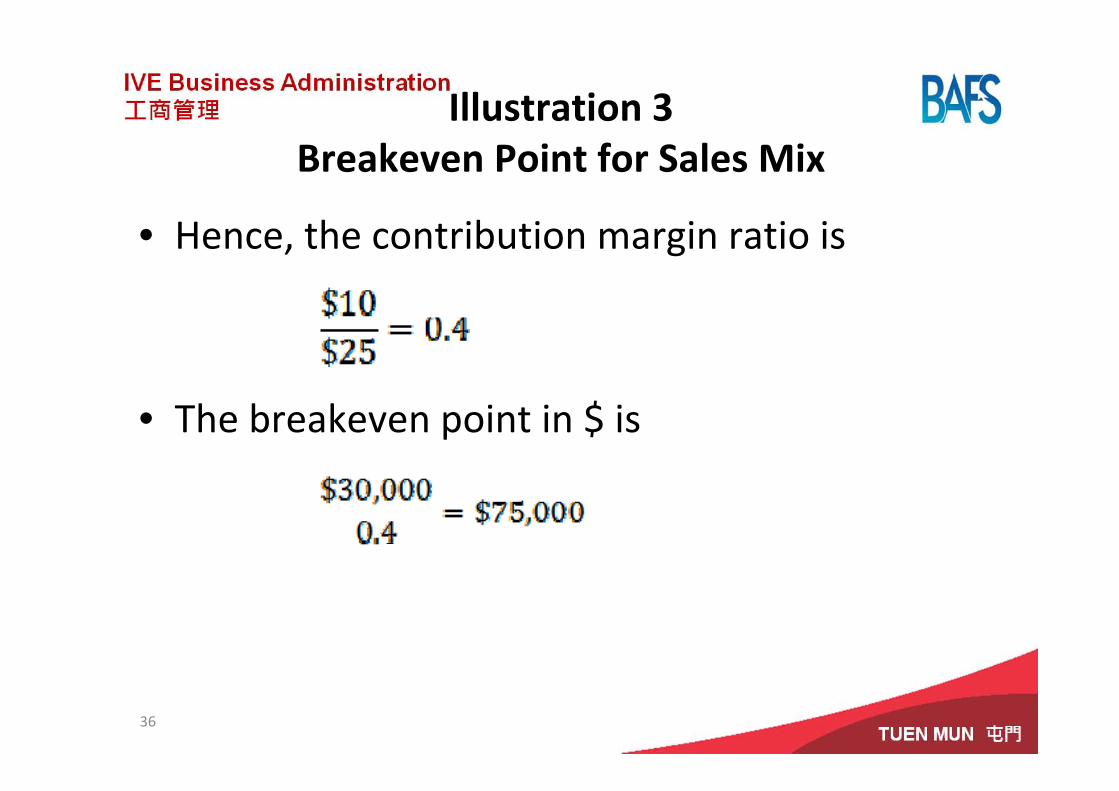
Illustration 3Breakeven Point for Sales Mix
• Hence, the contribution margin ratio is
• The breakeven point in $ is
36
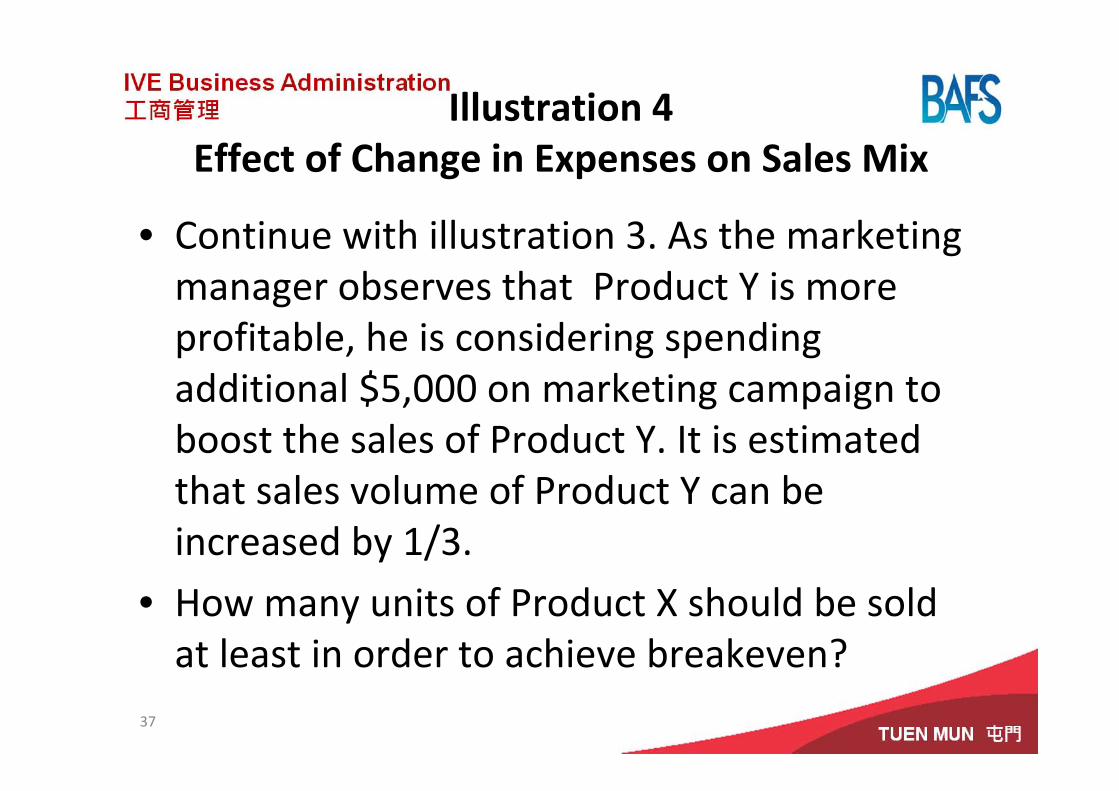
Illustration 3Breakeven Point for Sales Mix
• Continue with illustration 3. As the marketing manager observes that Product Y is more profitable, he is considering spending additional $5,000 on marketing campaign to boost the sales of Product Y. It is estimated that sales volume of Product Y can be increased by 1/3.
• How many units of Product X should be sold at least in order to achieve breakeven?
37
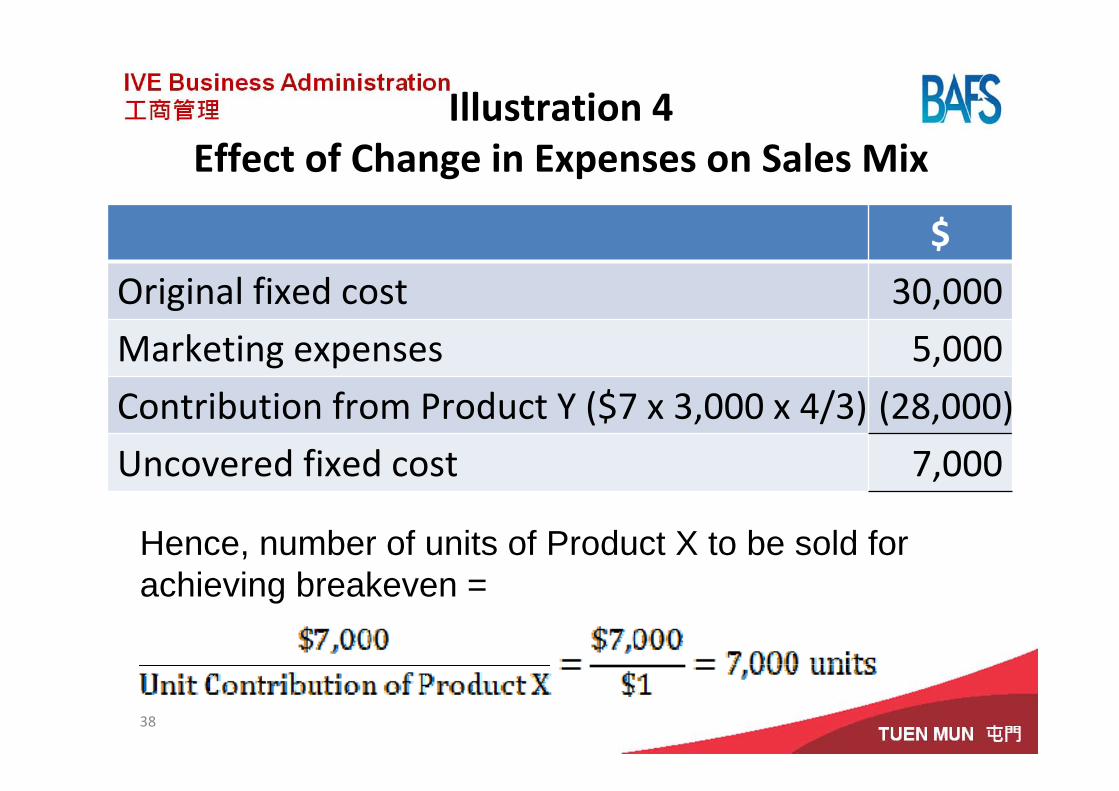
Illustration 4Effect of Change in Expenses on Sales Mix
$
Original fixed cost 30,000
Marketing expenses 5,000
Contribution from Product Y ($7 x 3,000 x 4/3) (28,000)
Uncovered fixed cost 7,000
38
Illustration 4Effect of Change in Expenses on Sales Mix
Hence, number of units of Product X to be sold for achieving breakeven =
Assumptions of C‐V‐P Analysis
• Selling price per unit and variable cost per unit are constant.
• Fixed cost per period is constant.
• Production units equal sales units.
• A single product is sold or the sales mix is constant.
39
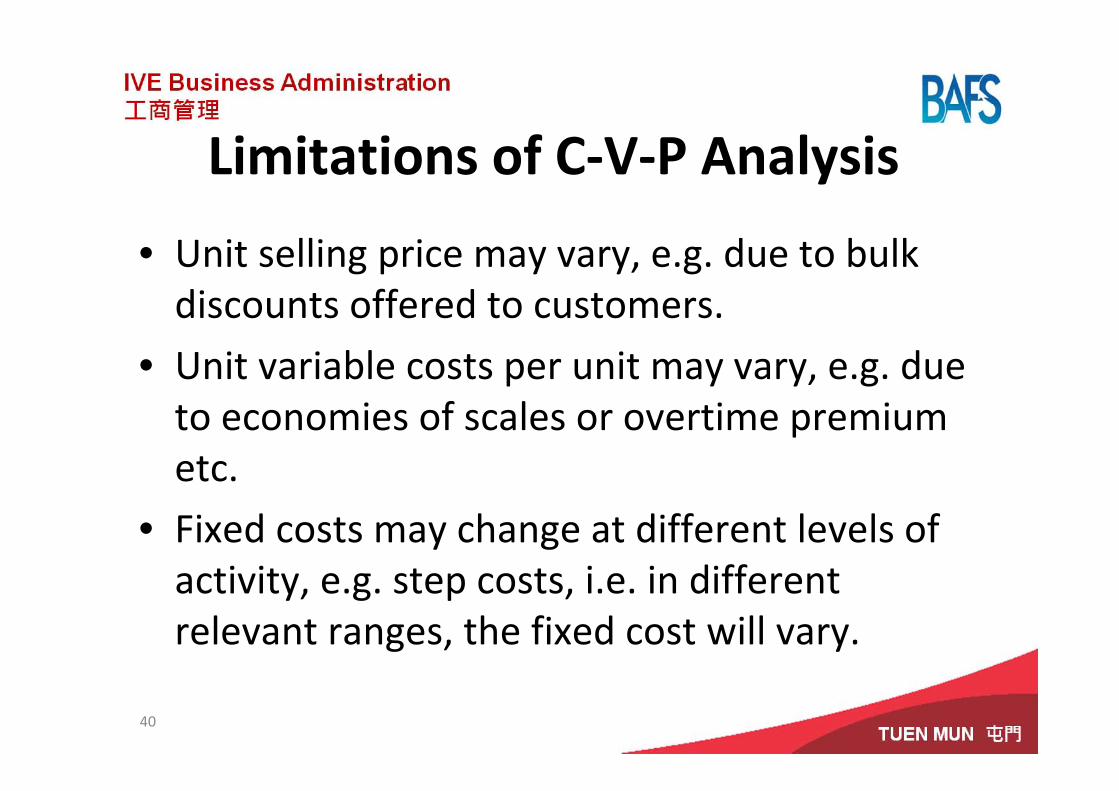
Limitations of C‐V‐P Analysis
• Unit selling price may vary, e.g. due to bulk discounts offered to customers.
• Unit variable costs per unit may vary, e.g. due to economies of scales or overtime premium etc.
• Fixed costs may change at different levels of activity, e.g. step costs, i.e. in different relevant ranges, the fixed cost will vary.
40
Cost Classification & Items
41
42
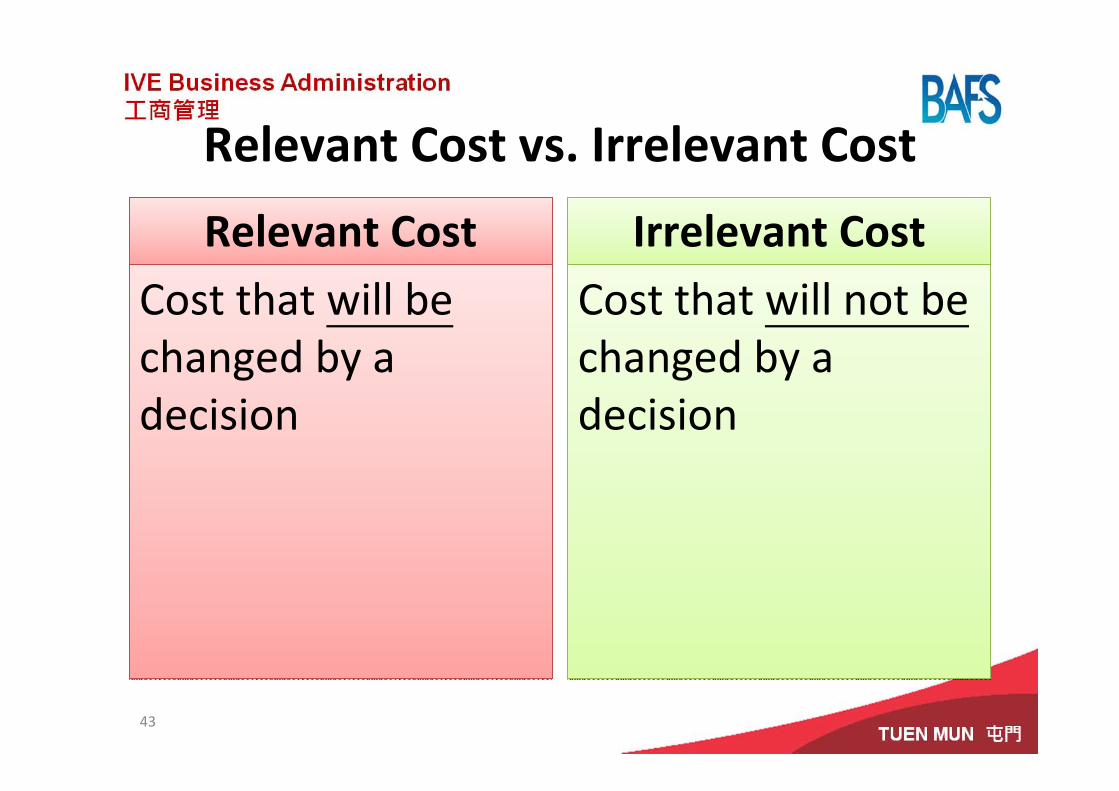
Relevant Cost vs. Irrelevant Cost
Relevant CostRelevant Cost
Cost that will be changed by a decision
Cost that will be changed by a decision
Irrelevant CostIrrelevant Cost
Cost that will not be changed by a decision
Cost that will not be changed by a decision
43
Relevant Costs
Incremental CostIncremental CostAdditional cost which will be specifically incurred because of a decision
Additional cost which will be specifically incurred because of a decision
Opportunity CostOpportunity CostBenefit which will be forgone when the choice of one course of action requires an alternative course of action be given up
Benefit which will be forgone when the choice of one course of action requires an alternative course of action be given up
44
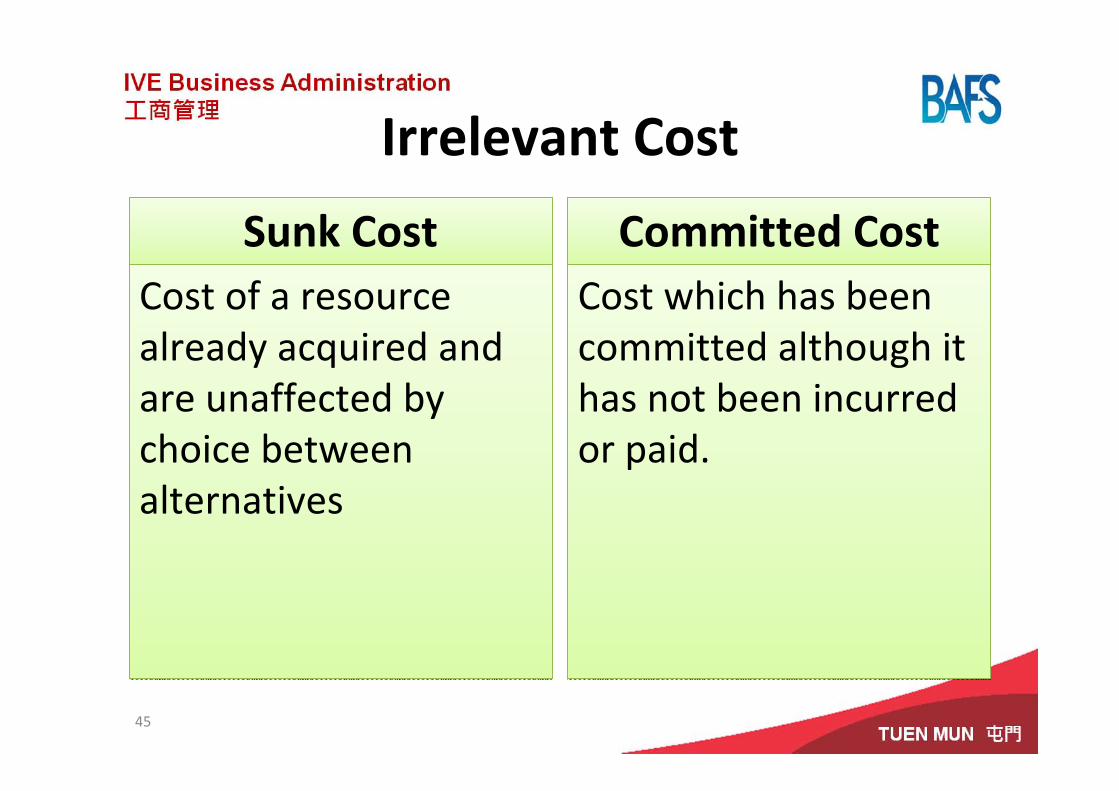
Irrelevant Cost
Sunk CostSunk CostCost of a resource already acquired and are unaffected by choice between alternatives
Cost of a resource already acquired and are unaffected by choice between alternatives
Committed CostCommitted CostCost which has been committed although it has not been incurred or paid.
Cost which has been committed although it has not been incurred or paid.
45
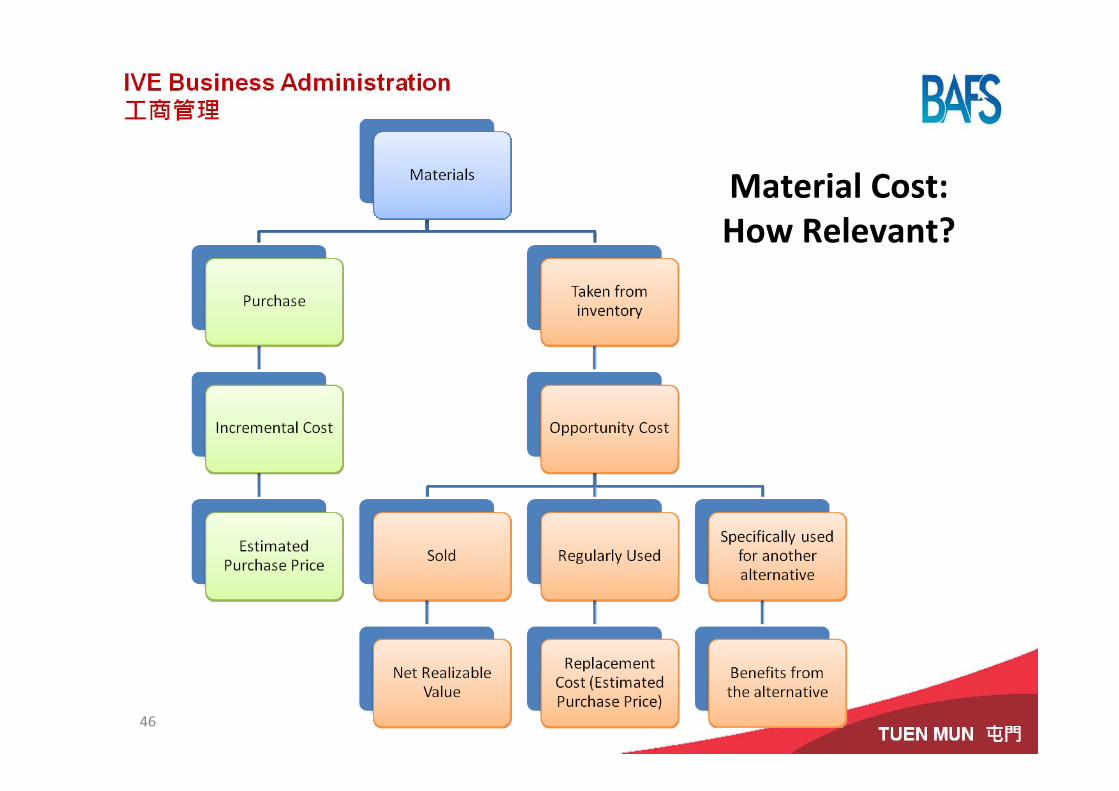
Material Cost: How Relevant?
46
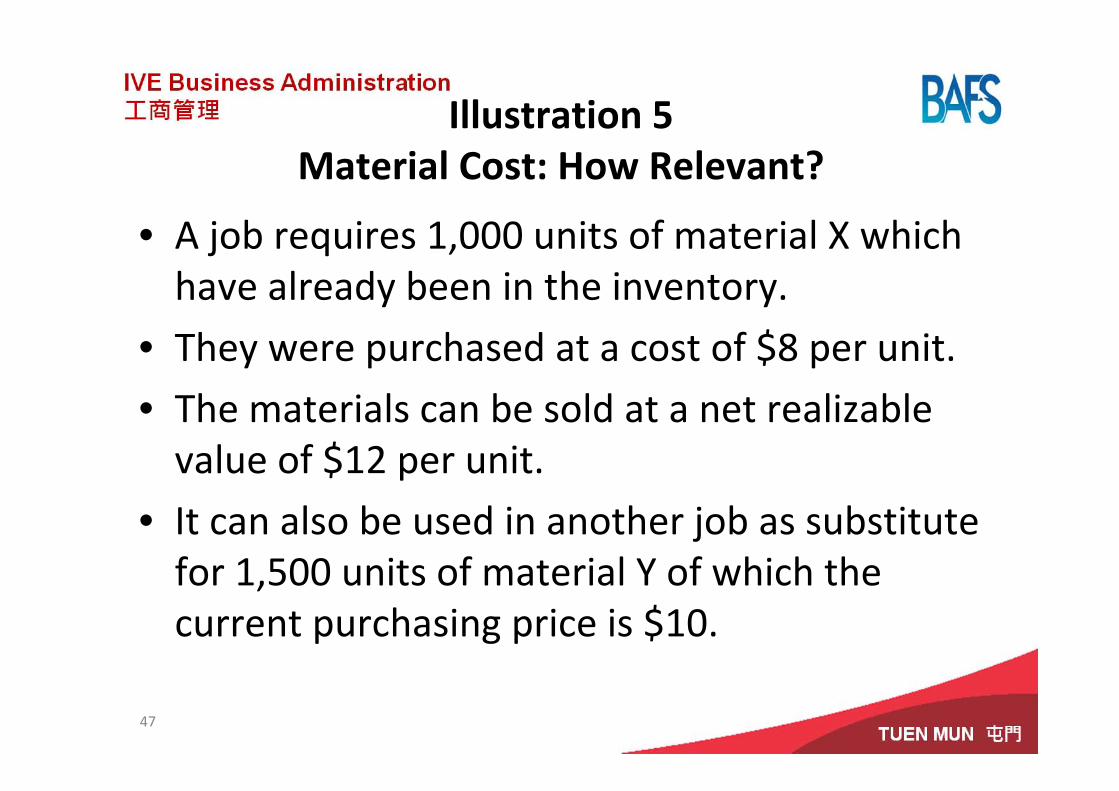
Illustration 5Material Cost: How Relevant?
• A job requires 1,000 units of material X which have already been in the inventory.
• They were purchased at a cost of $8 per unit.
• The materials can be sold at a net realizable value of $12 per unit.
• It can also be used in another job as substitute for 1,500 units of material Y of which the current purchasing price is $10.
47
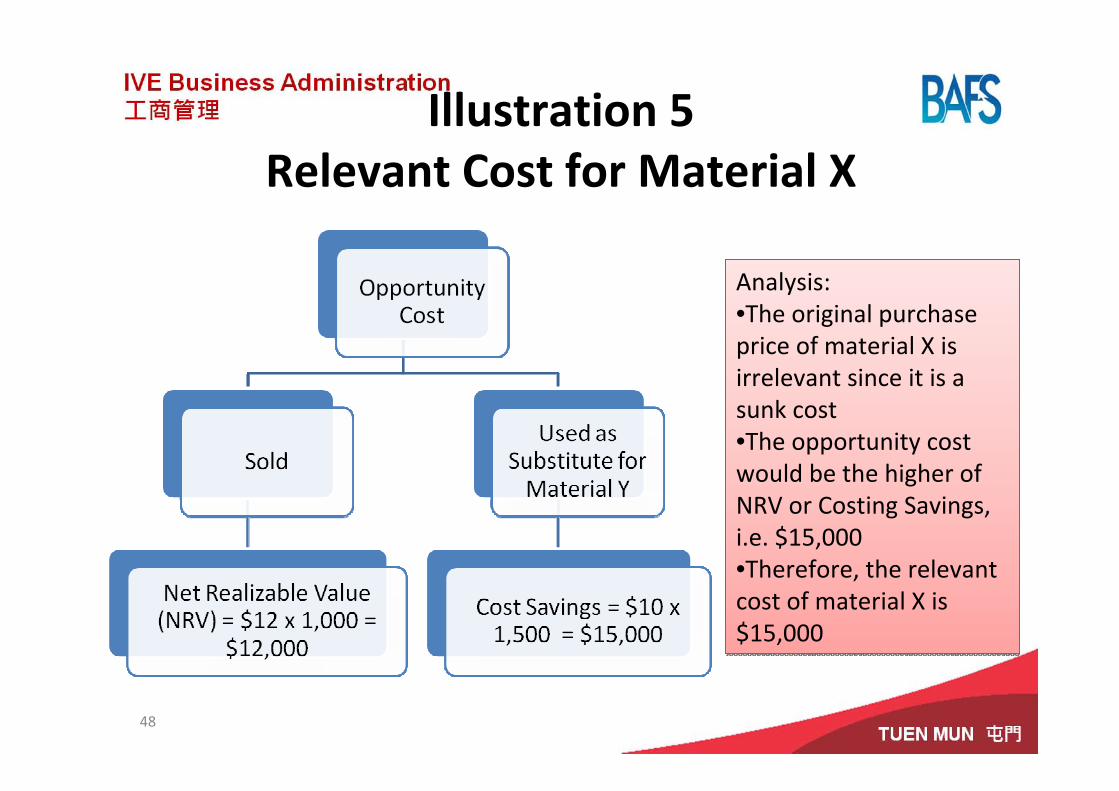
Illustration 5Relevant Cost for Material X
48
Analysis:•The original purchase price of material X is irrelevant since it is a sunk cost•The opportunity cost would be the higher of NRV or Costing Savings, i.e. $15,000•Therefore, the relevant cost of material X is $15,000
Analysis:•The original purchase price of material X is irrelevant since it is a sunk cost•The opportunity cost would be the higher of NRV or Costing Savings, i.e. $15,000•Therefore, the relevant cost of material X is $15,000
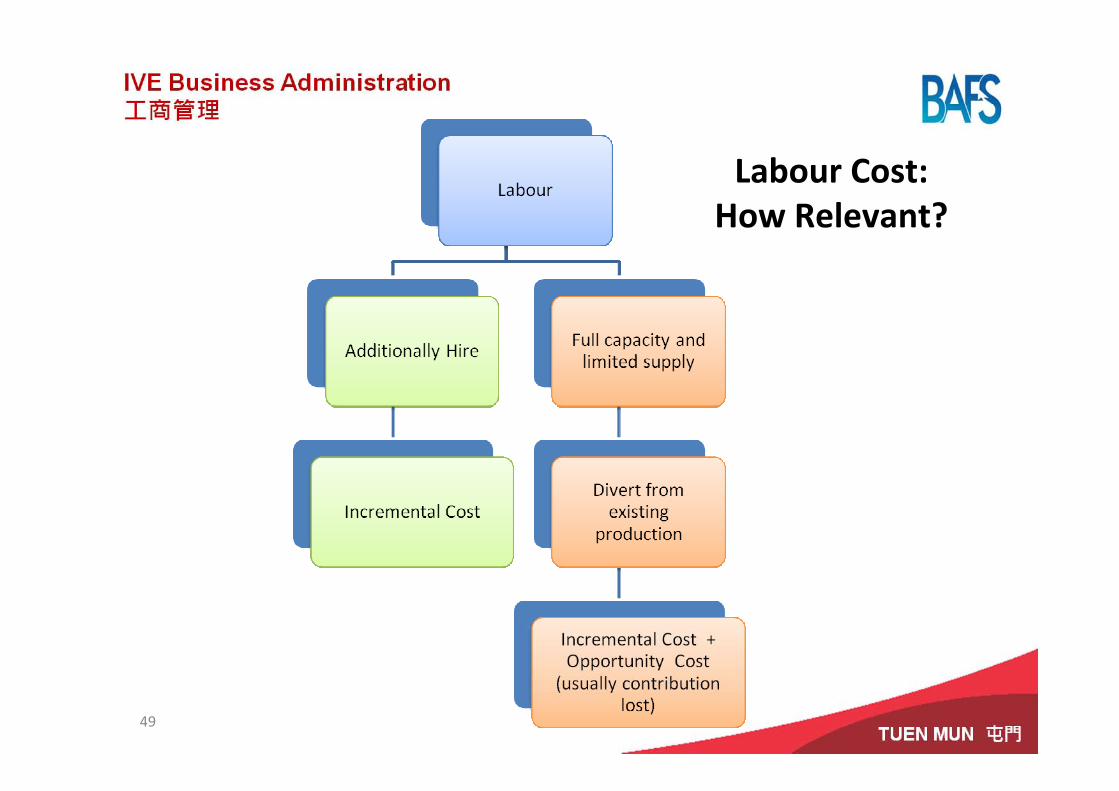
Labour Cost: How Relevant?
49
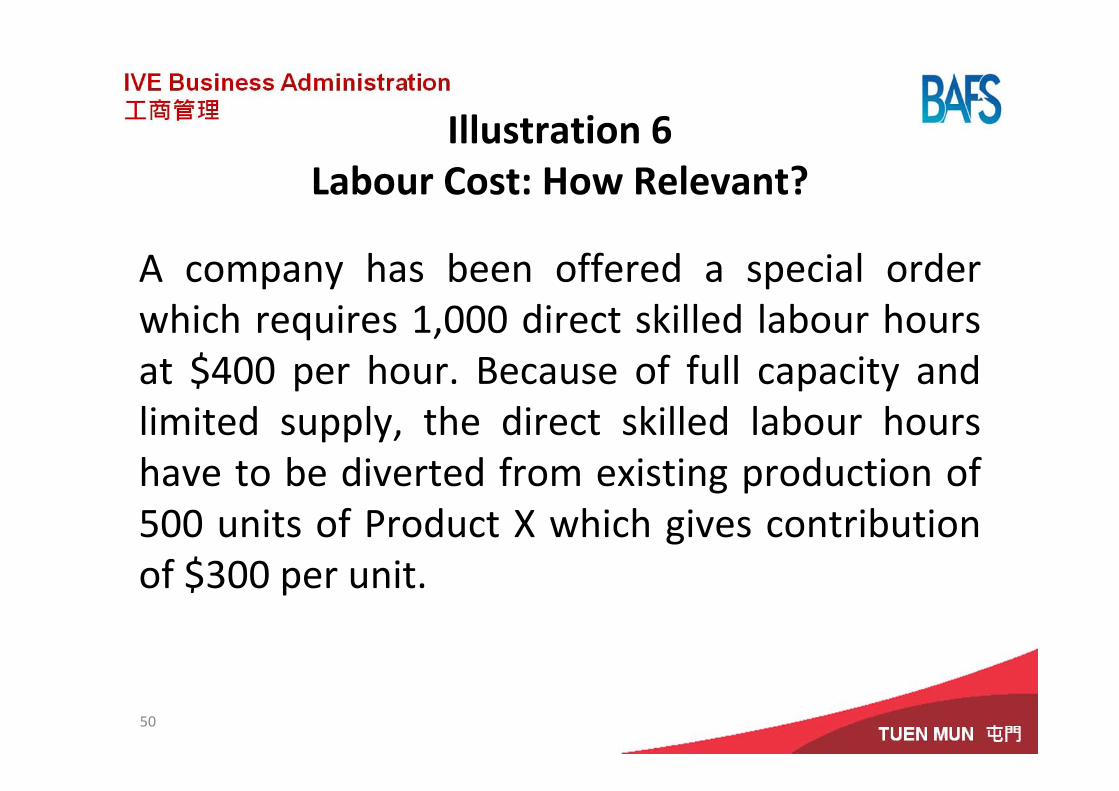
Illustration 6Labour Cost: How Relevant?
A company has been offered a special order which requires 1,000 direct skilled labour hours at $400 per hour. Because of full capacity and limited supply, the direct skilled labour hours have to be diverted from existing production of 500 units of Product X which gives contribution of $300 per unit.
50
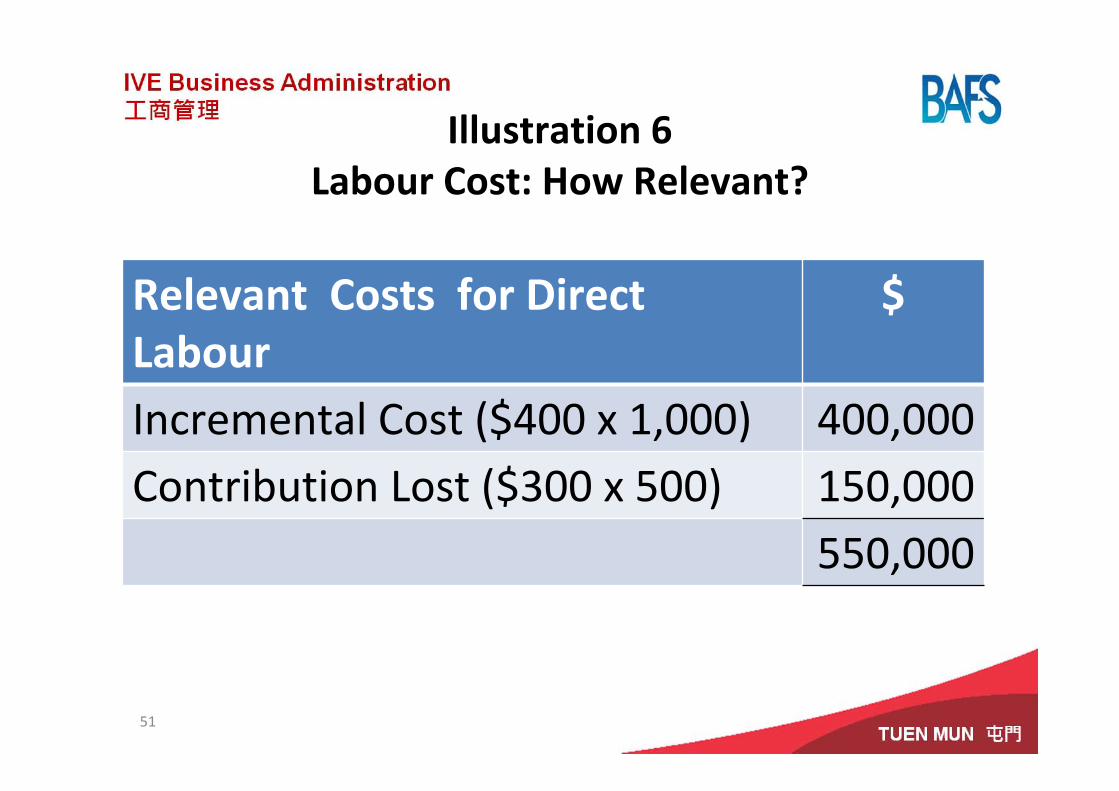
Illustration 6Labour Cost: How Relevant?
Relevant Costs for Direct Labour
$
Incremental Cost ($400 x 1,000) 400,000Contribution Lost ($300 x 500) 150,000
550,000
51
Short‐Term Business Decisions
52
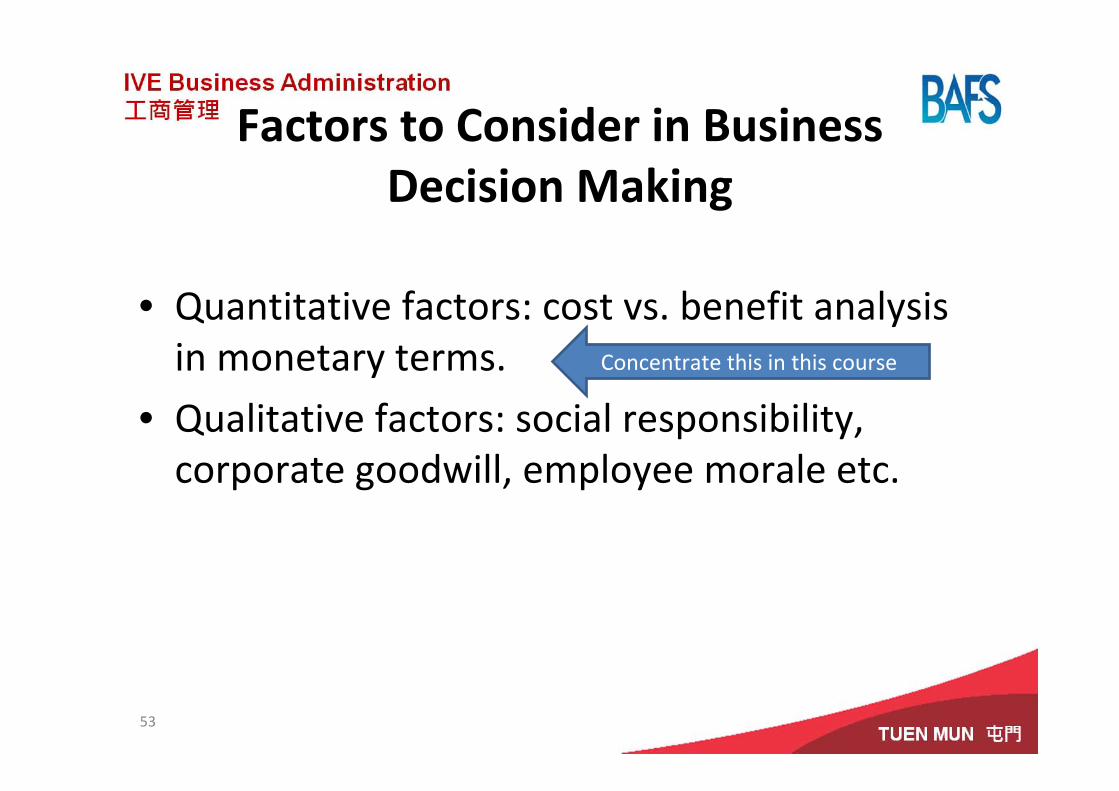
Factors to Consider in Business Decision Making
• Quantitative factors: cost vs. benefit analysis in monetary terms.
• Qualitative factors: social responsibility, corporate goodwill, employee morale etc.
53
Concentrate this in this course
54
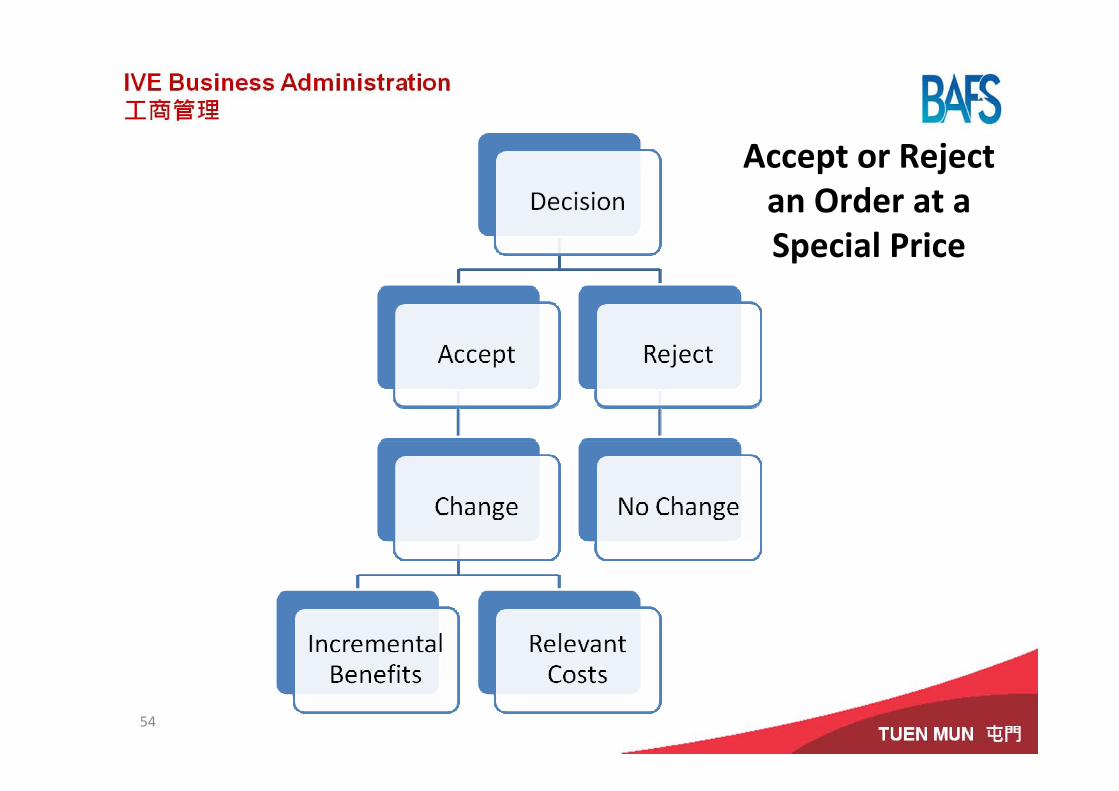
Accept or Reject an Order at a Special Price
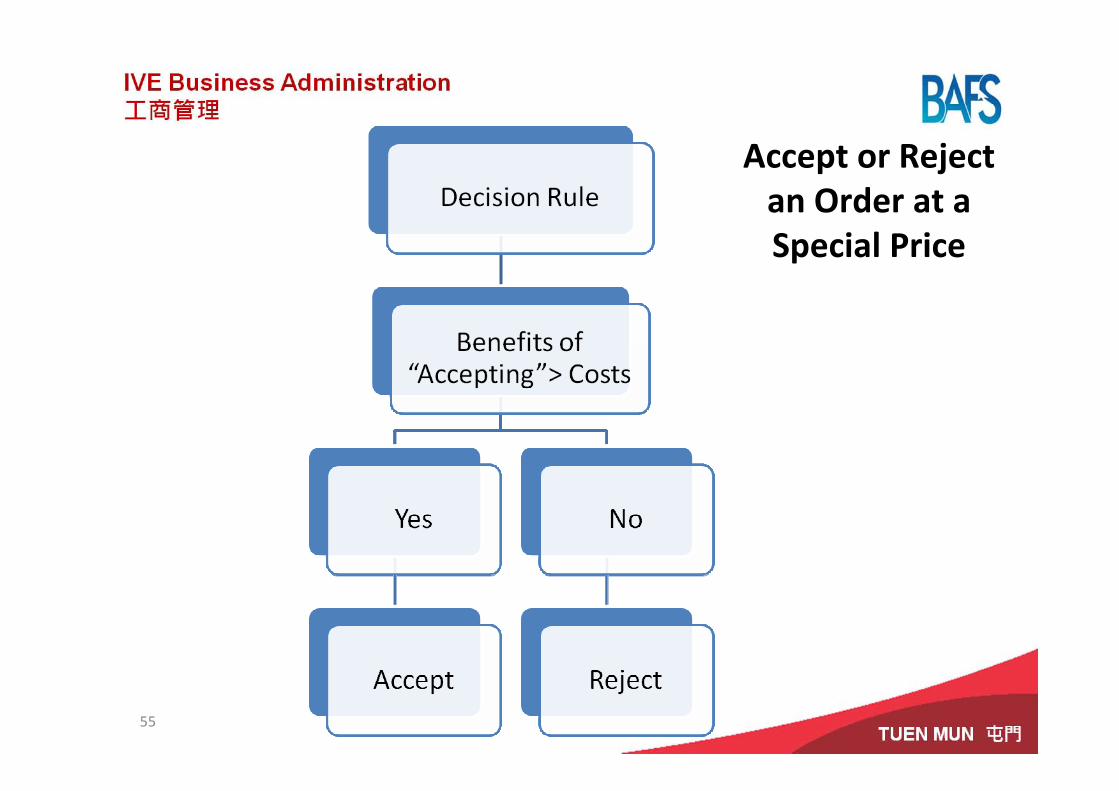
55
Accept or Reject an Order at a Special Price
56
Accept or Reject an Order at a Special Price
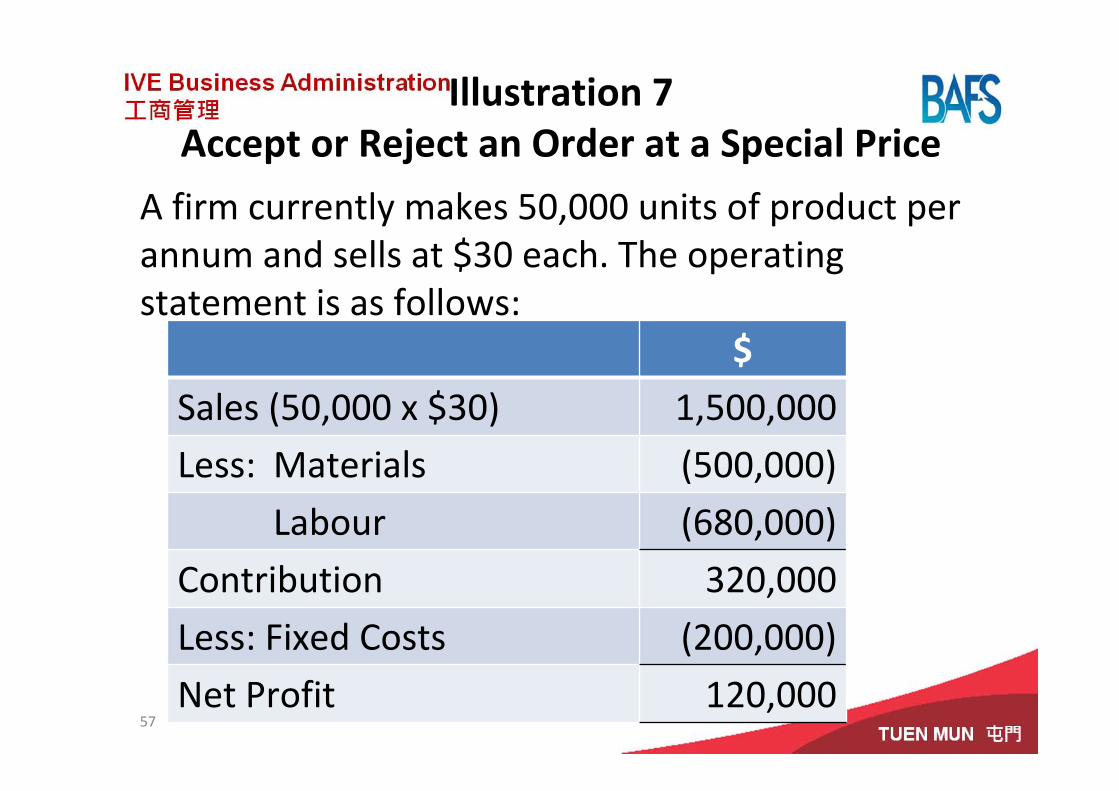
Illustration 7Accept or Reject an Order at a Special Price
A firm currently makes 50,000 units of product per annum and sells at $30 each. The operating statement is as follows:
57
$
Sales (50,000 x $30) 1,500,000
Less: Materials (500,000)
Labour (680,000)
Contribution 320,000
Less: Fixed Costs (200,000)
Net Profit 120,000
Illustration 7Accept or Reject an Order at a Special Price
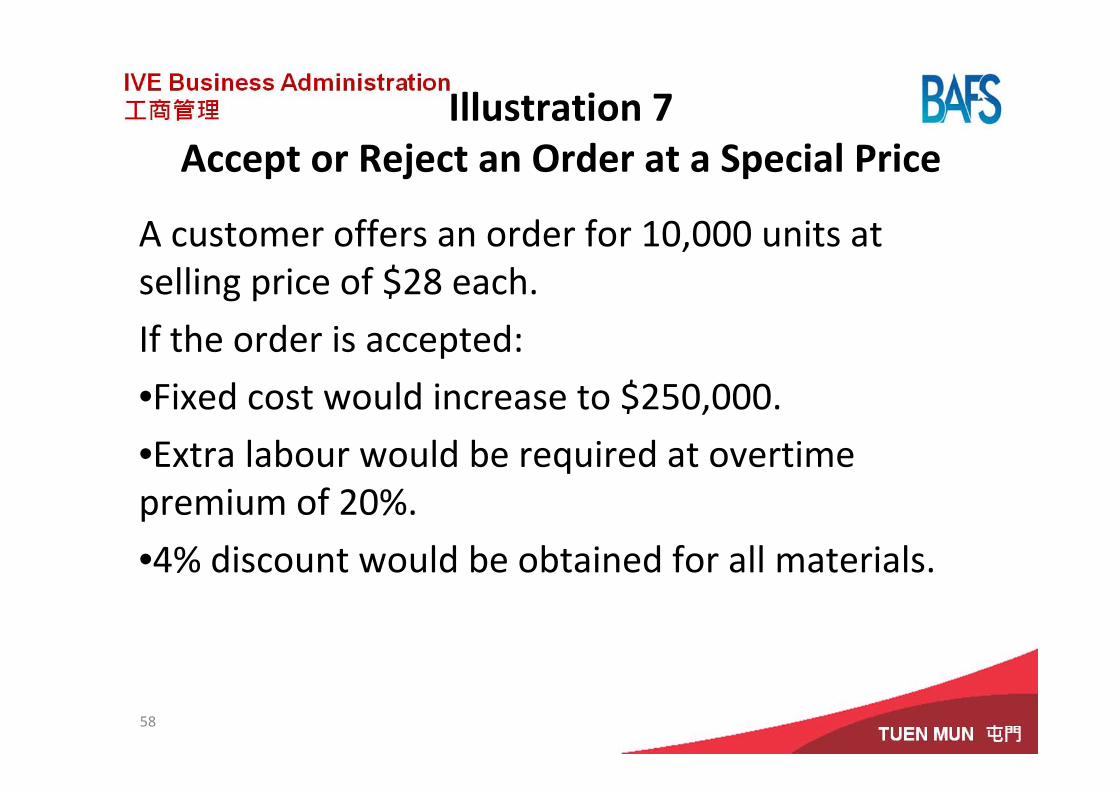
A customer offers an order for 10,000 units at selling price of $28 each.
If the order is accepted:
•Fixed cost would increase to $250,000.•Extra labour would be required at overtime premium of 20%.
•4% discount would be obtained for all materials.
58
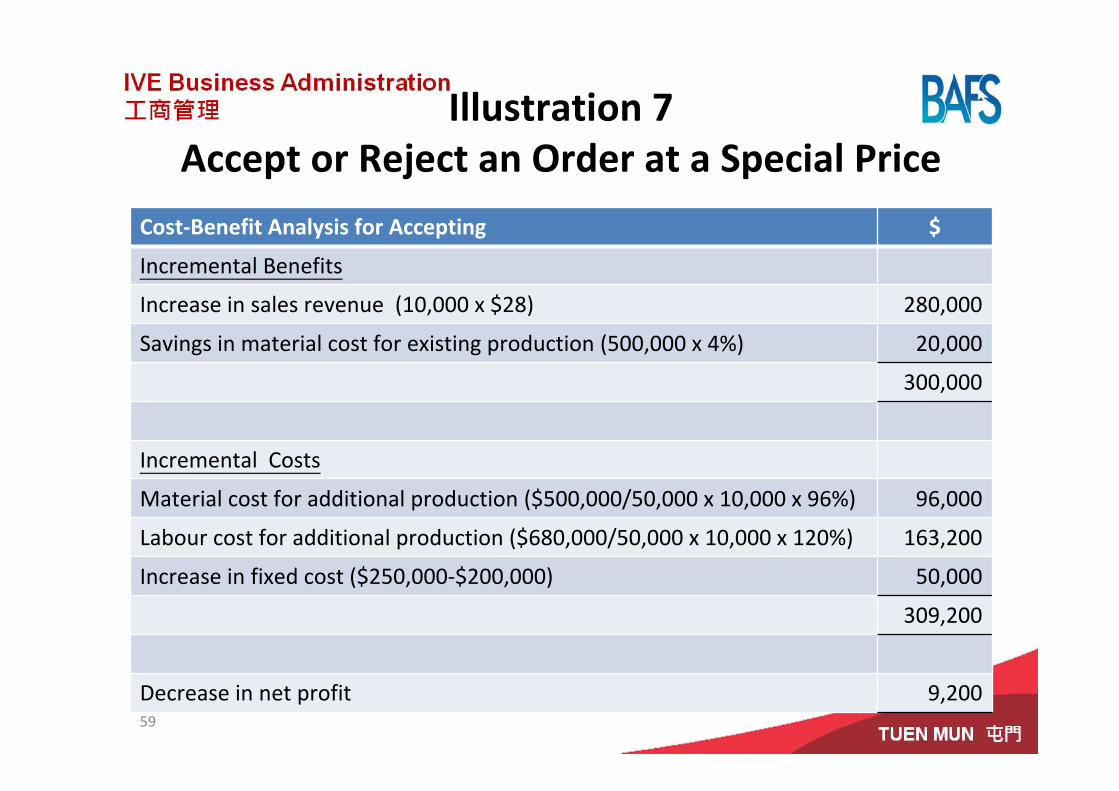
Illustration 7Accept or Reject an Order at a Special Price
Cost‐Benefit Analysis for Accepting $
Incremental Benefits
Increase in sales revenue (10,000 x $28) 280,000
Savings in material cost for existing production (500,000 x 4%) 20,000
300,000
Incremental Costs
Material cost for additional production ($500,000/50,000 x 10,000 x 96%) 96,000
Labour cost for additional production ($680,000/50,000 x 10,000 x 120%) 163,200
Increase in fixed cost ($250,000‐$200,000) 50,000
309,200
Decrease in net profit 9,20059
Illustration 7Accept or Reject an Oder at a Special Price
• Conclusion: As the incremental benefit is less than the increment cost, the order should be rejected.
60
61
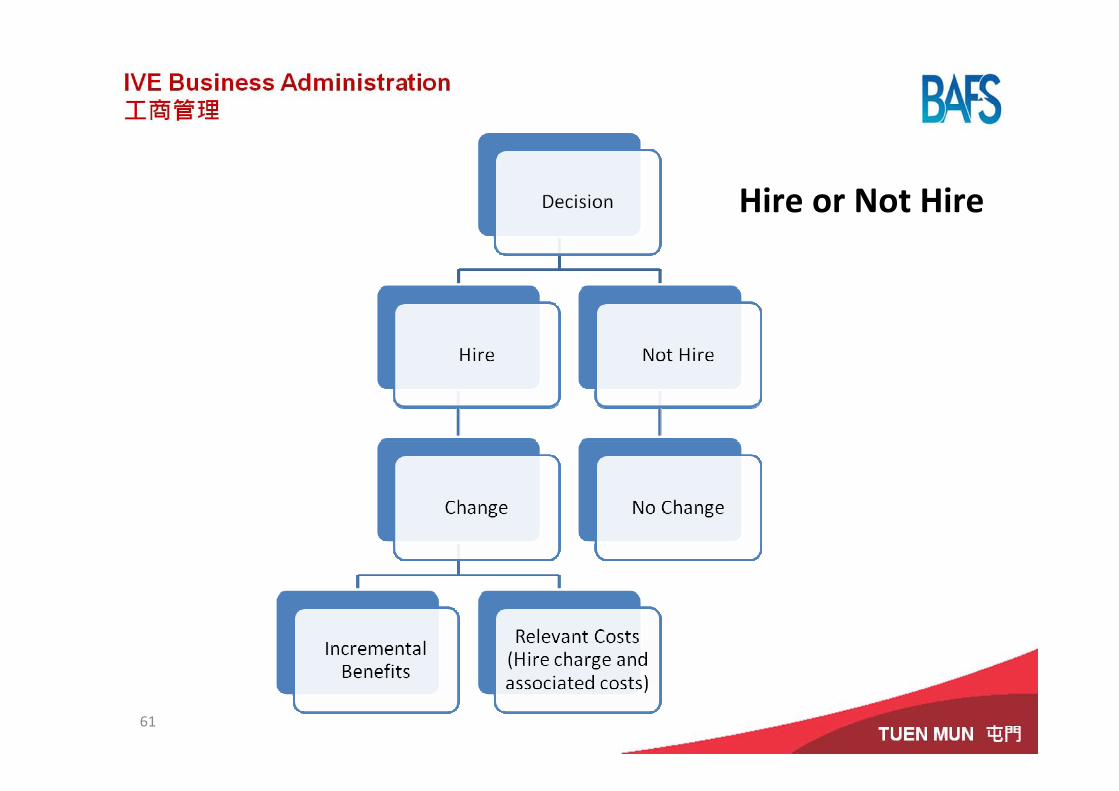
Hire or Not Hire
62
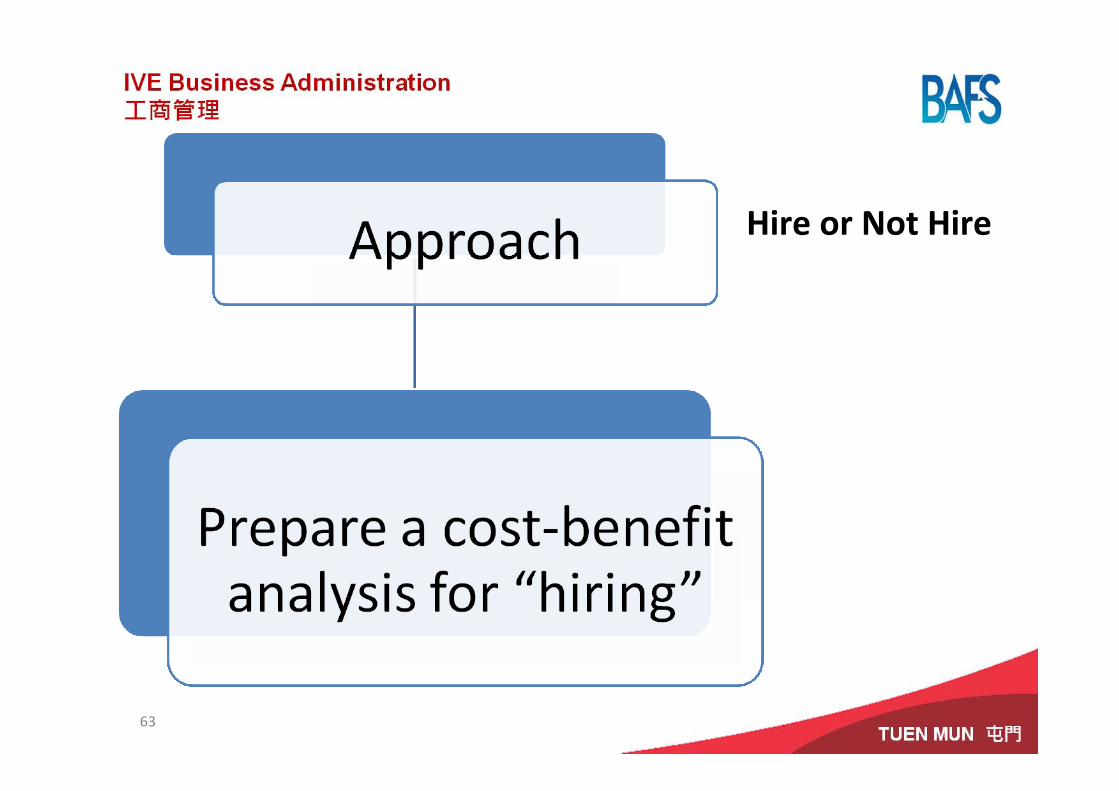
Hire or Not Hire
63
Hire or Not Hire
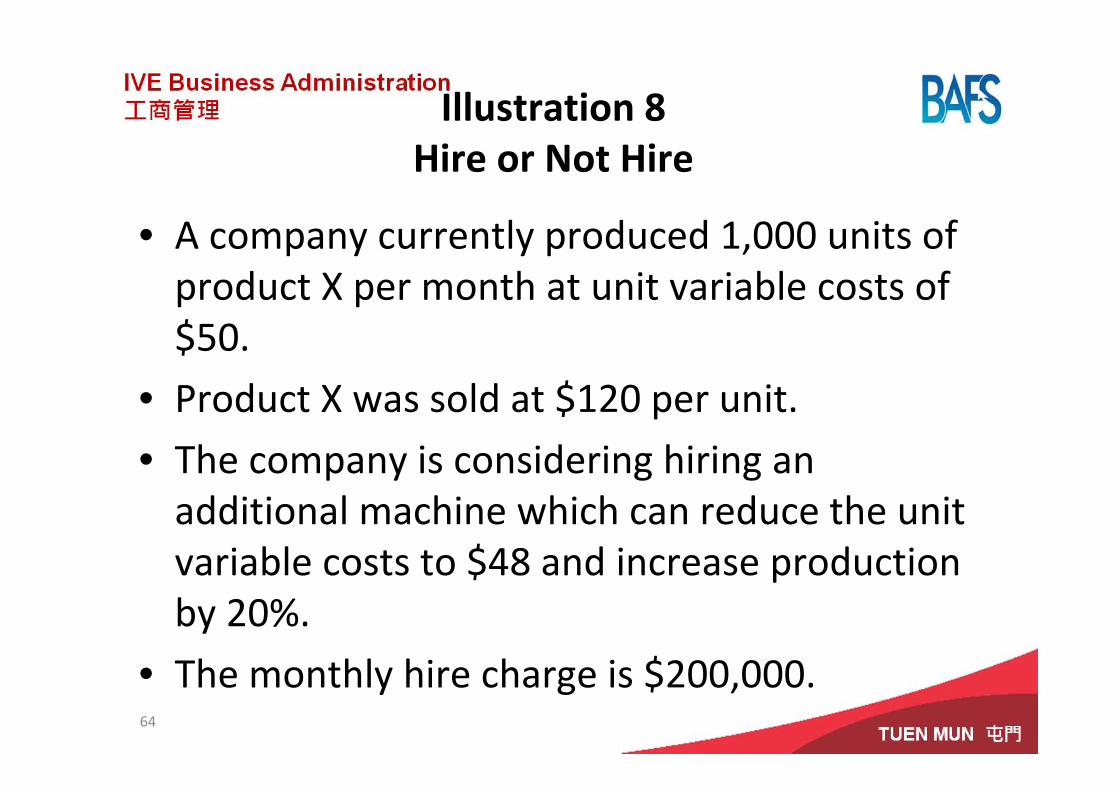
Illustration 8Hire or Not Hire
• A company currently produced 1,000 units of product X per month at unit variable costs of $50.
• Product X was sold at $120 per unit.
• The company is considering hiring an additional machine which can reduce the unit variable costs to $48 and increase production by 20%.
• The monthly hire charge is $200,000.64
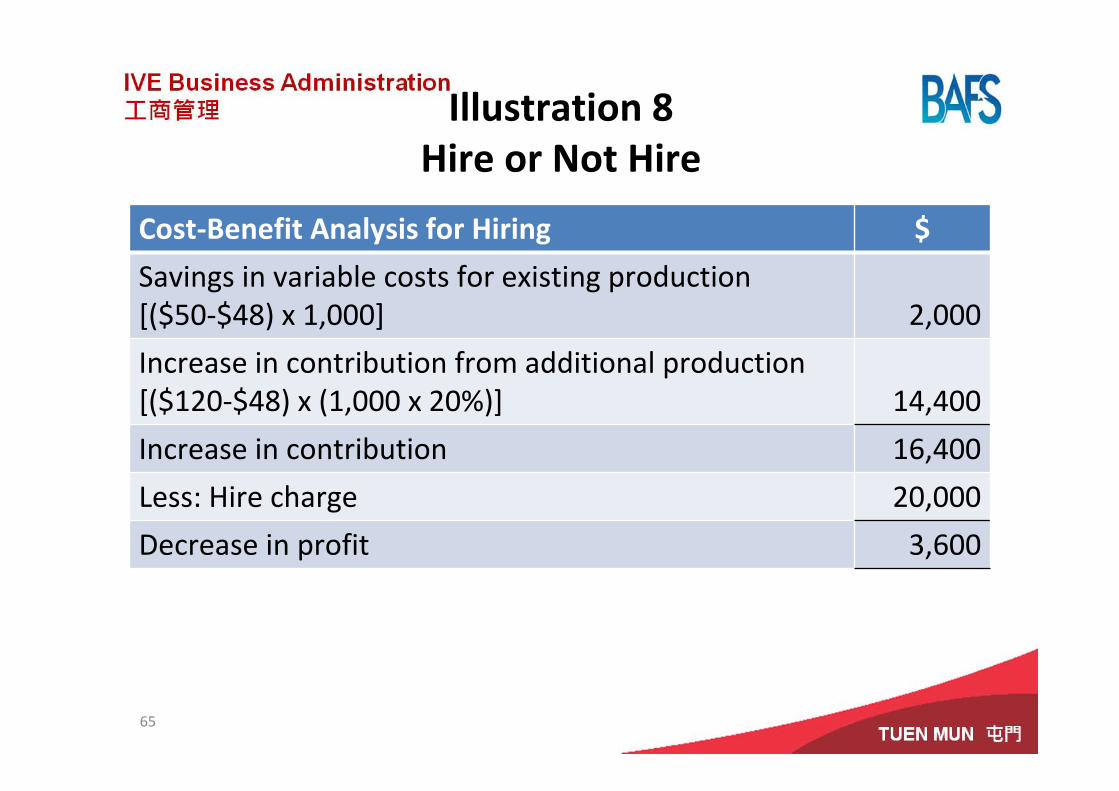
Illustration 8Hire or Not Hire
Cost‐Benefit Analysis for Hiring $
Savings in variable costs for existing production[($50‐$48) x 1,000] 2,000
Increase in contribution from additional production[($120‐$48) x (1,000 x 20%)] 14,400
Increase in contribution 16,400
Less: Hire charge 20,000
Decrease in profit 3,600
65
Illustration 8Hire or Not Hire
• Conclusion: Since hiring would lead to a decrease in profit, it should not be hired.
66
67
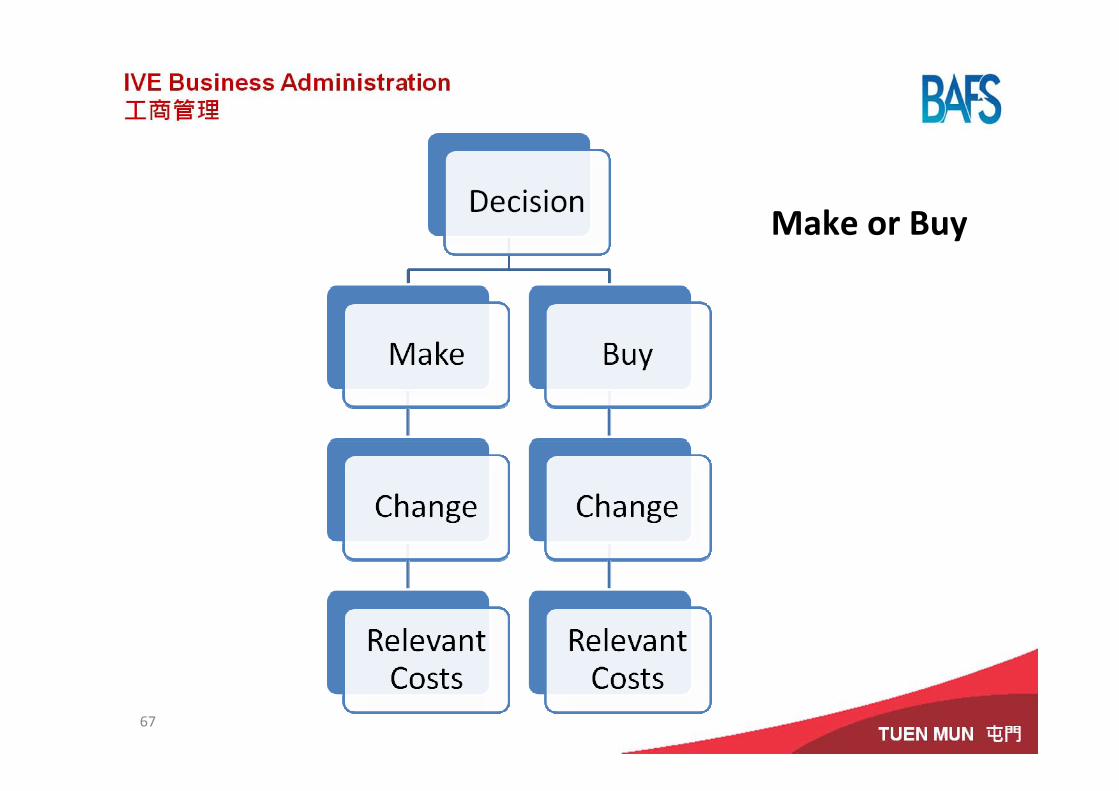
Make or Buy
68
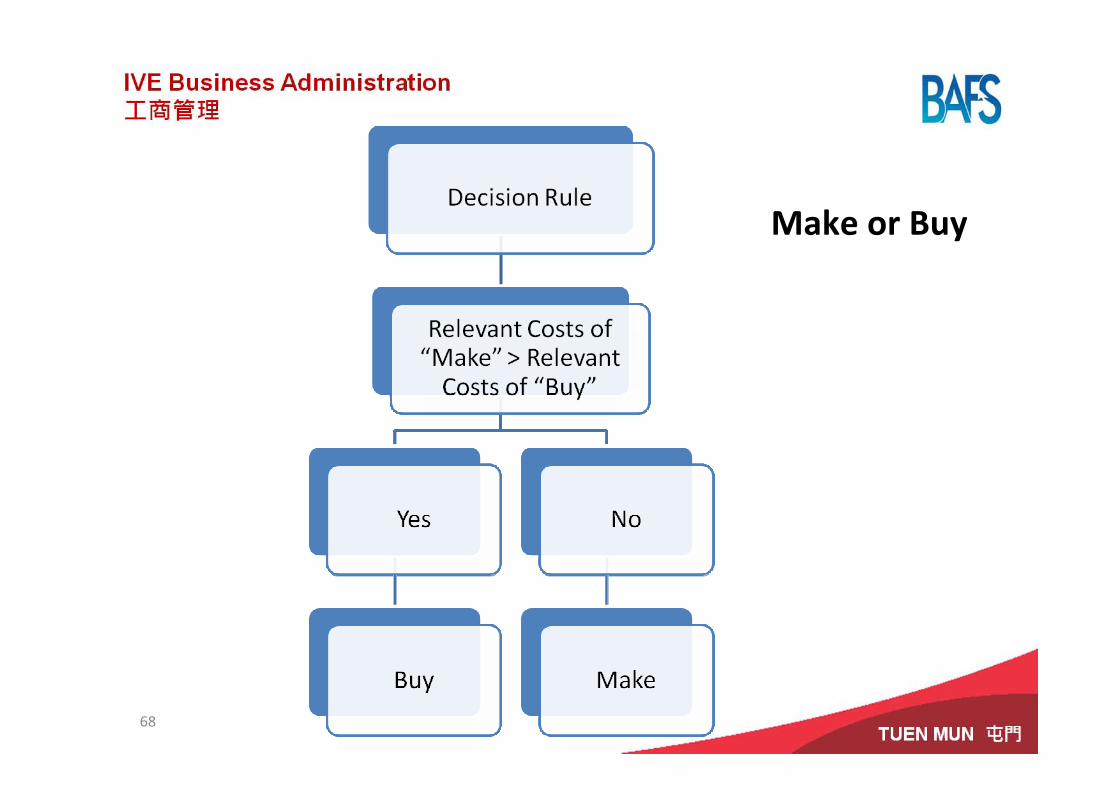
Make or Buy
69
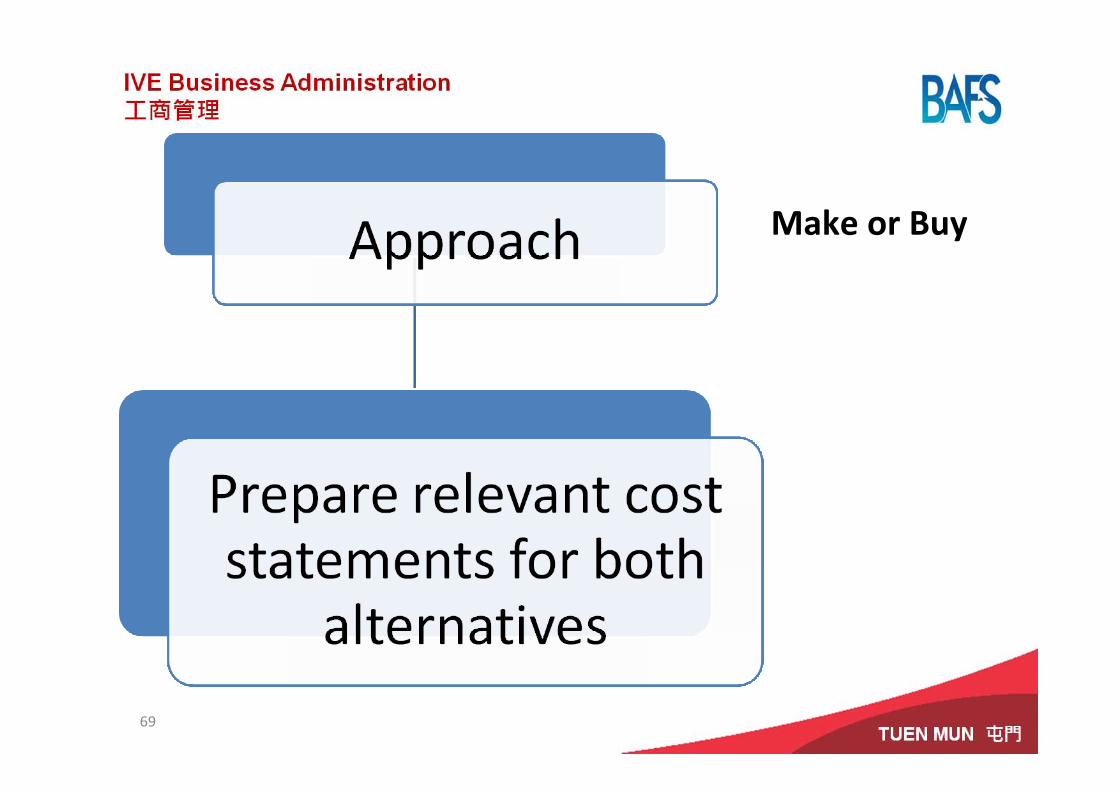
Make or Buy
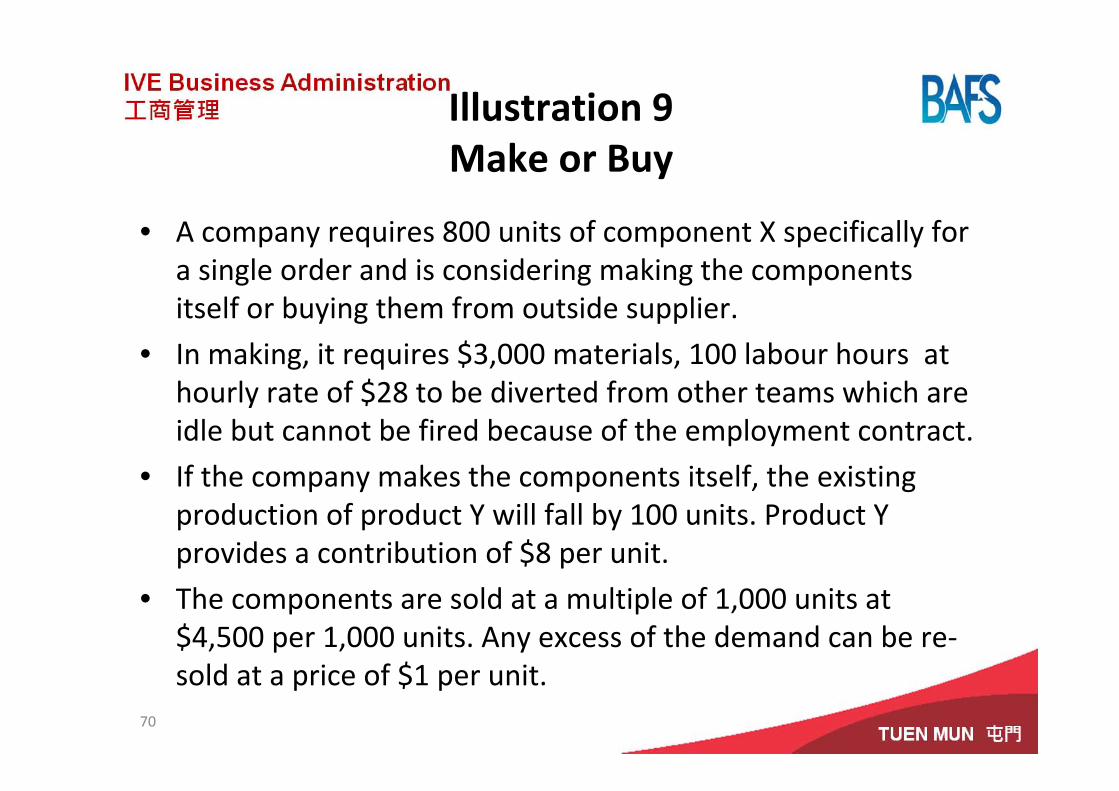
Illustration 9Make or Buy
• A company requires 800 units of component X specifically for a single order and is considering making the components itself or buying them from outside supplier.
• In making, it requires $3,000 materials, 100 labour hours at hourly rate of $28 to be diverted from other teams which are idle but cannot be fired because of the employment contract.
• If the company makes the components itself, the existing production of product Y will fall by 100 units. Product Y provides a contribution of $8 per unit.
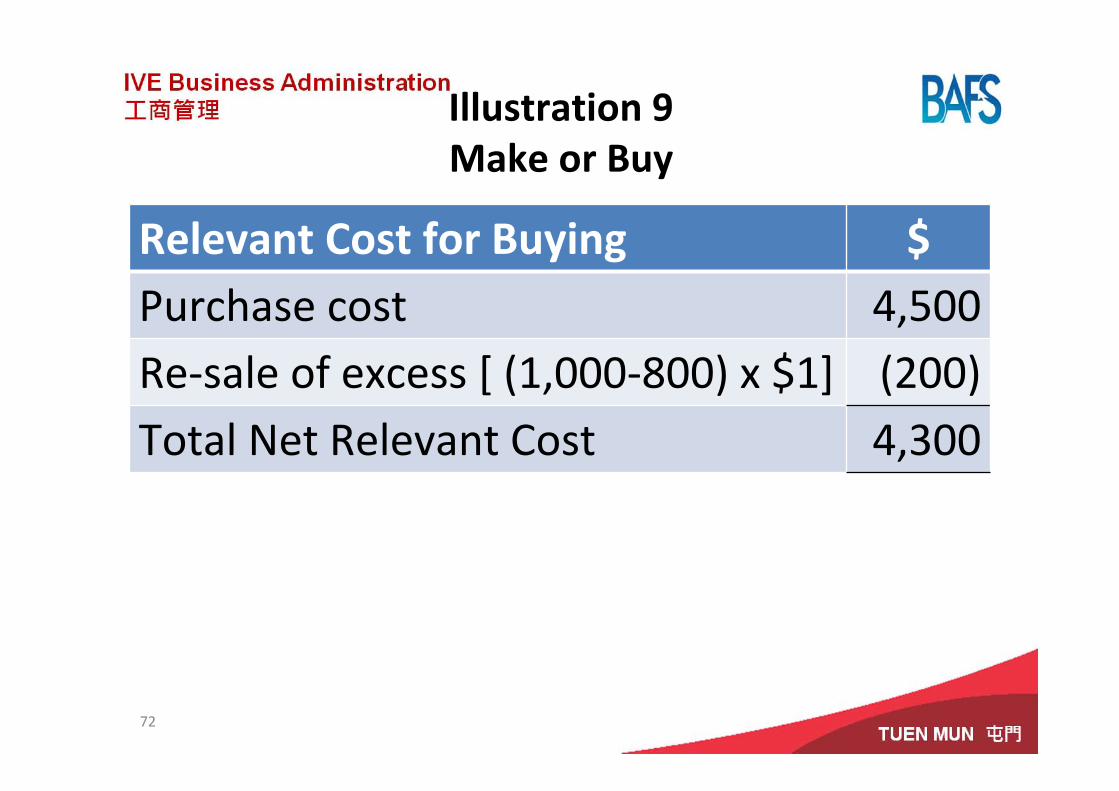
• The components are sold at a multiple of 1,000 units at $4,500 per 1,000 units. Any excess of the demand can be re‐sold at a price of $1 per unit.
70
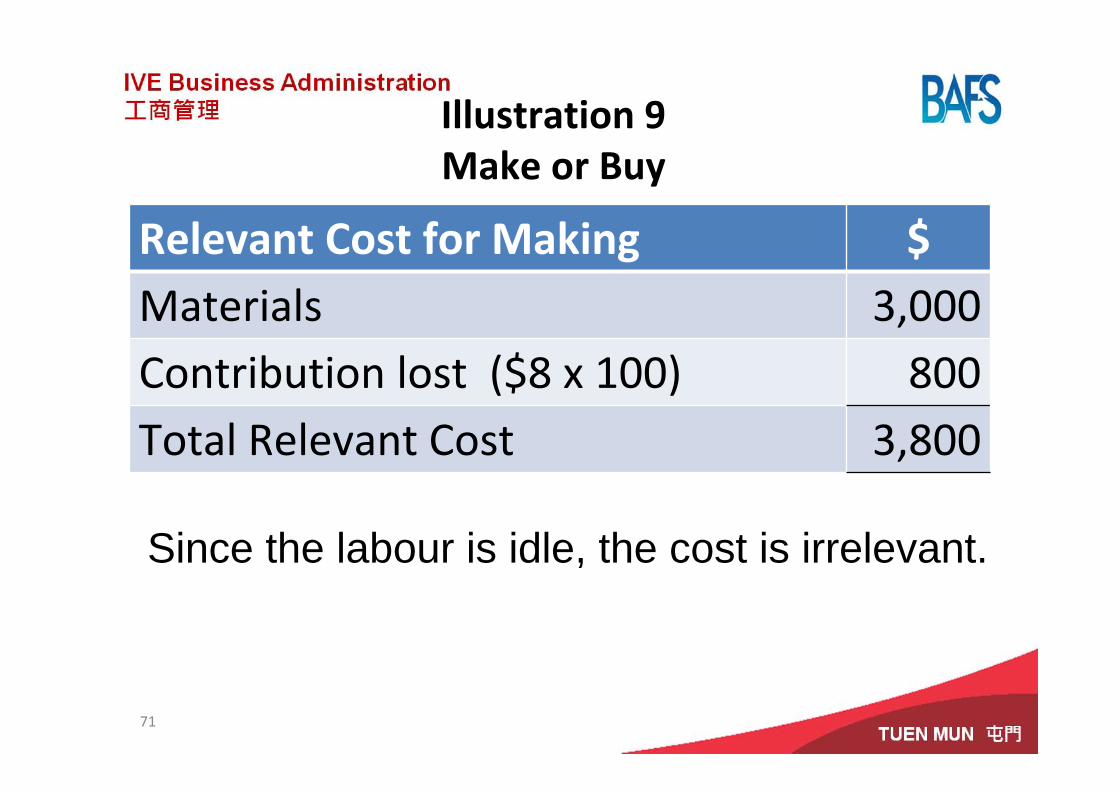
Illustration 9Make or Buy
Relevant Cost for Making $Materials 3,000Contribution lost ($8 x 100) 800Total Relevant Cost 3,800
71
Since the labour is idle, the cost is irrelevant.
Illustration 9Make or Buy
Relevant Cost for Buying $Purchase cost 4,500Re‐sale of excess [ (1,000‐800) x $1] (200)Total Net Relevant Cost 4,300
72
Illustration 9Make or Buy
• Conclusion: Since the relevant cost for making is lower than that of buying, the components should be made.
73
74
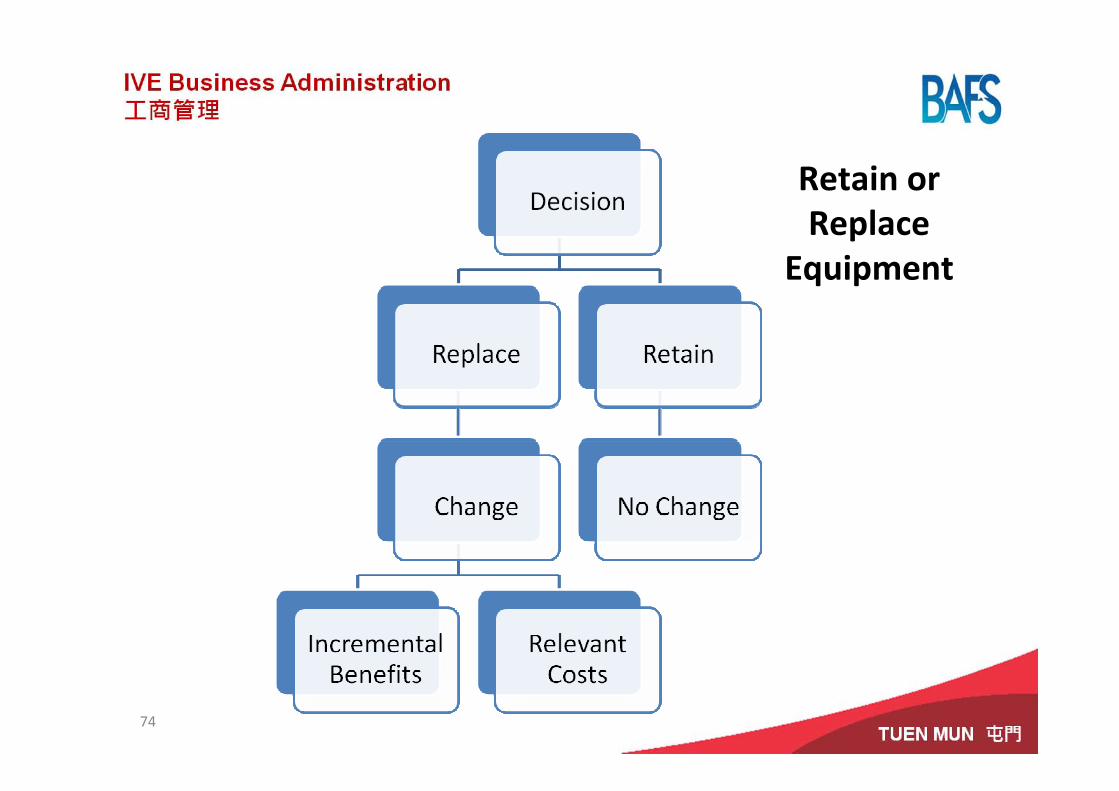
Retain or Replace
Equipment
75
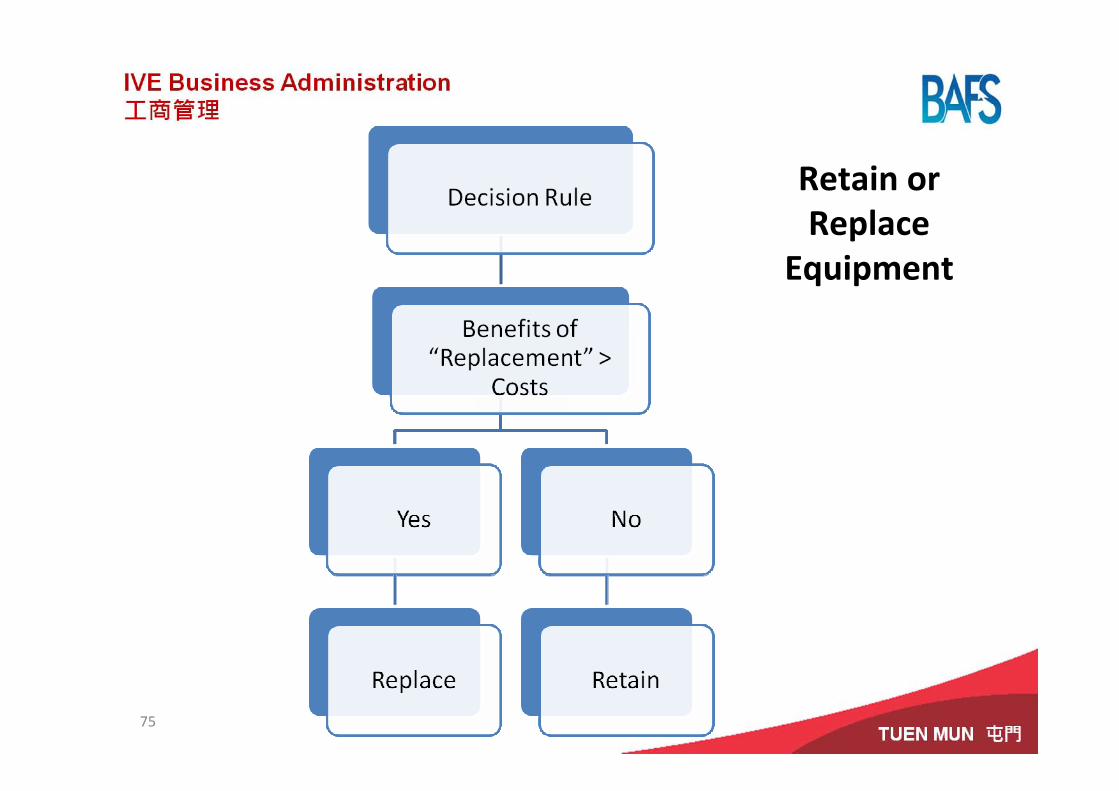
Retain or Replace
Equipment
76
Retain or Replace
Equipment
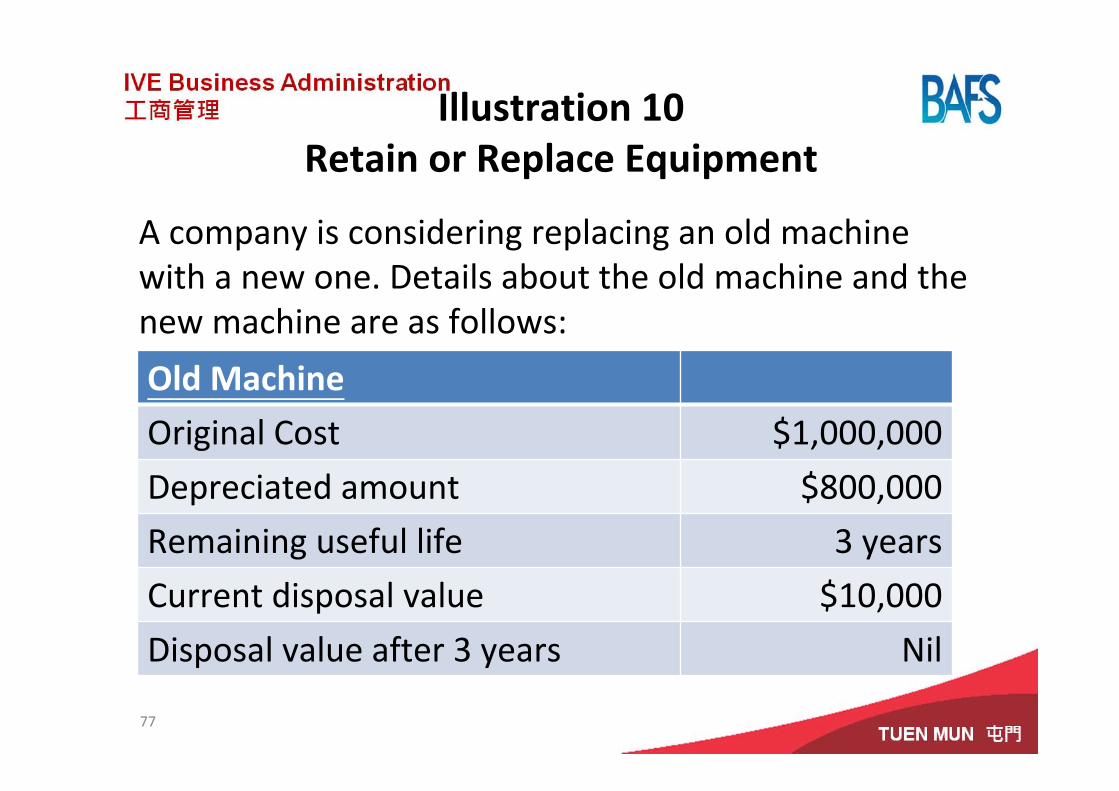
Illustration 10Retain or Replace Equipment
A company is considering replacing an old machine with a new one. Details about the old machine and the new machine are as follows:
77
Old Machine
Original Cost $1,000,000
Depreciated amount $800,000
Remaining useful life 3 years
Current disposal value $10,000
Disposal value after 3 years Nil
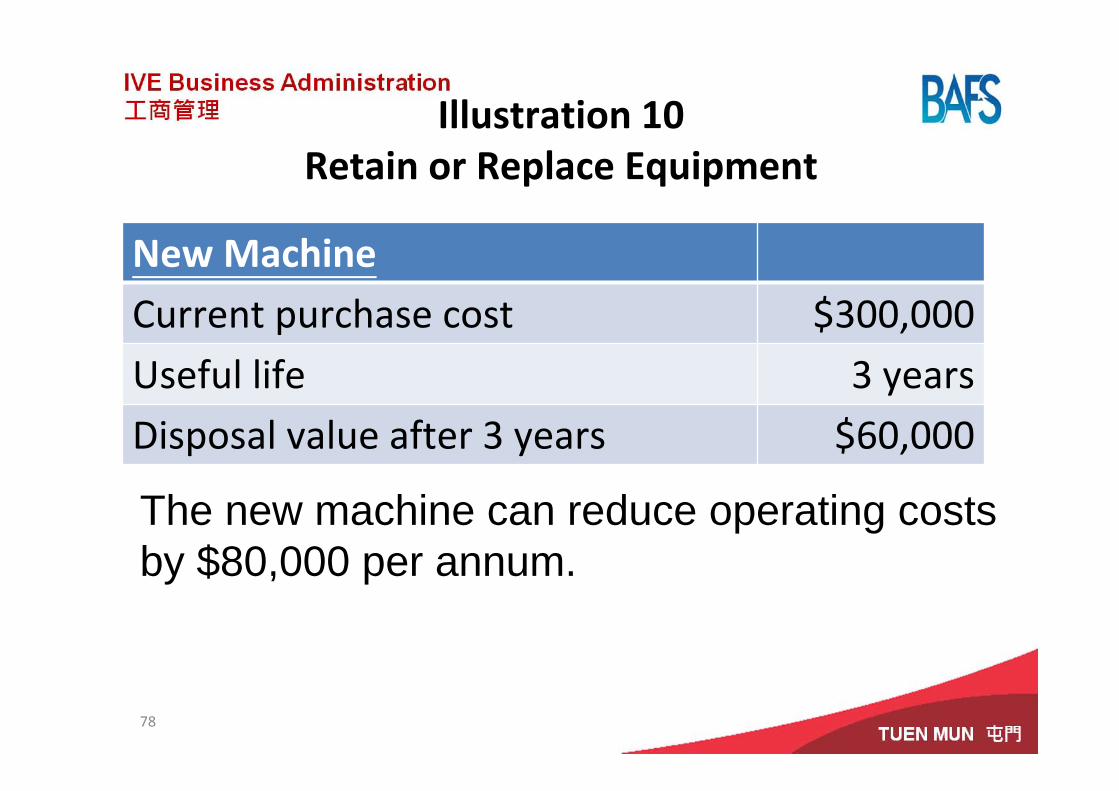
Illustration 10Retain or Replace Equipment
New MachineCurrent purchase cost $300,000Useful life 3 yearsDisposal value after 3 years $60,000
78
The new machine can reduce operating costs by $80,000 per annum.
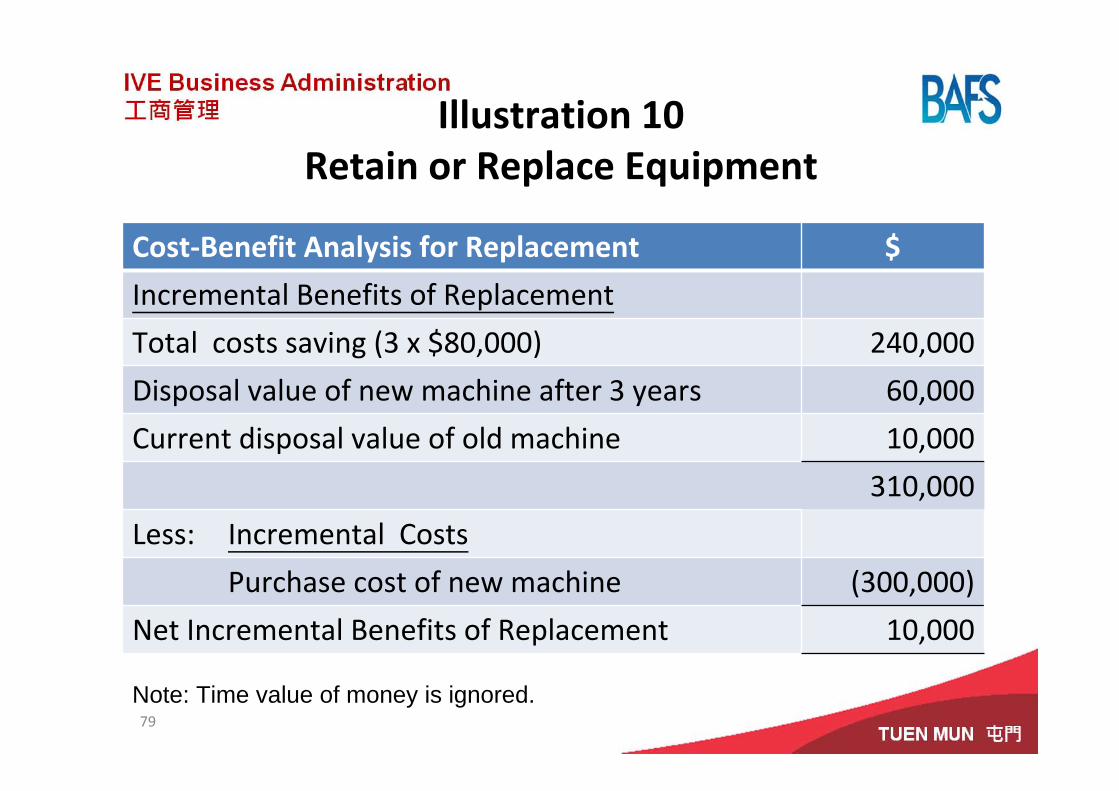
Illustration 10Retain or Replace Equipment
Cost‐Benefit Analysis for Replacement $
Incremental Benefits of Replacement
Total costs saving (3 x $80,000) 240,000
Disposal value of new machine after 3 years 60,000
Current disposal value of old machine 10,000
310,000
Less: Incremental Costs
Purchase cost of new machine (300,000)
Net Incremental Benefits of Replacement 10,000
79
Note: Time value of money is ignored.
Illustration 10Retain or Replace Equipment
• Conclusion: Since replacement would make a net incremental benefit, it should be replaced.
80
81
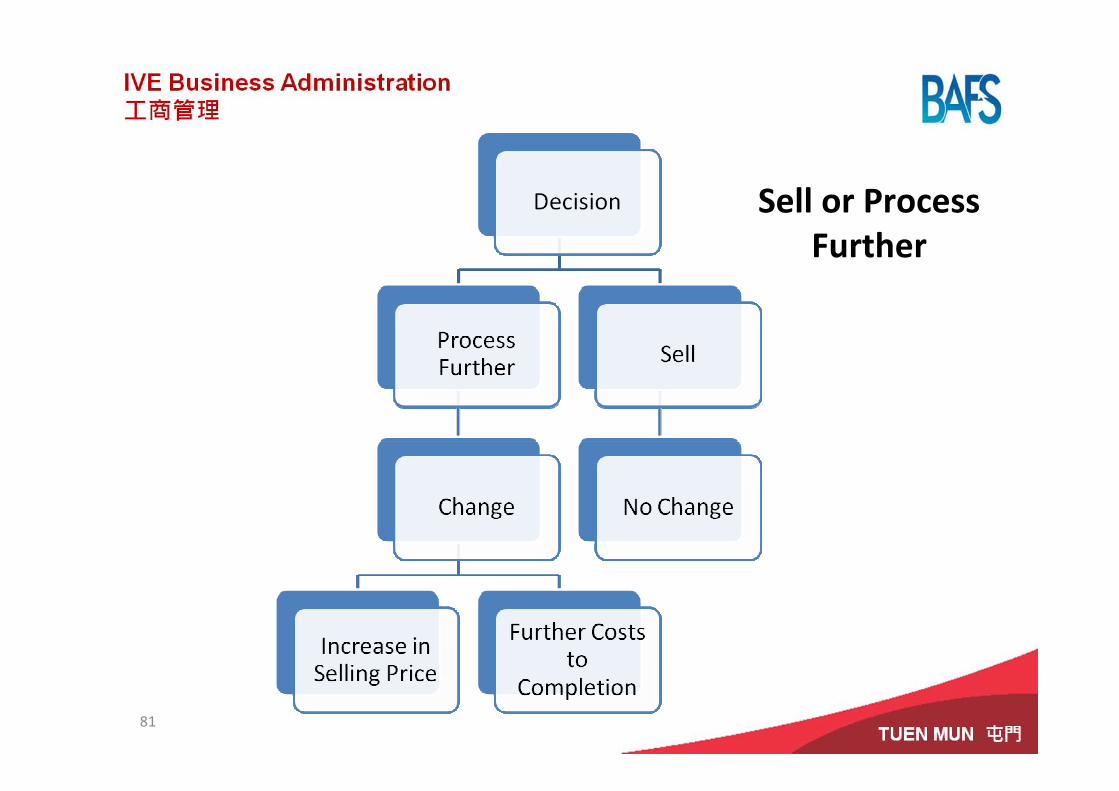
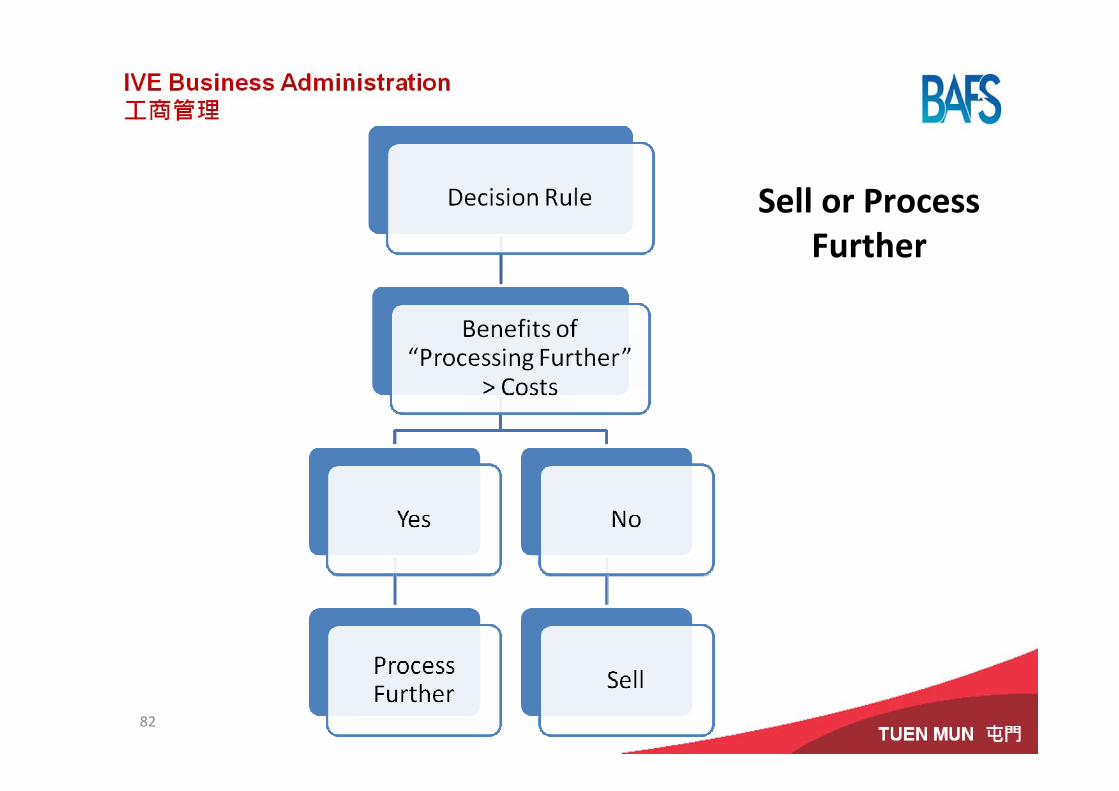
Sell or Process Further
82
Sell or Process Further
83
Sell or Process Further
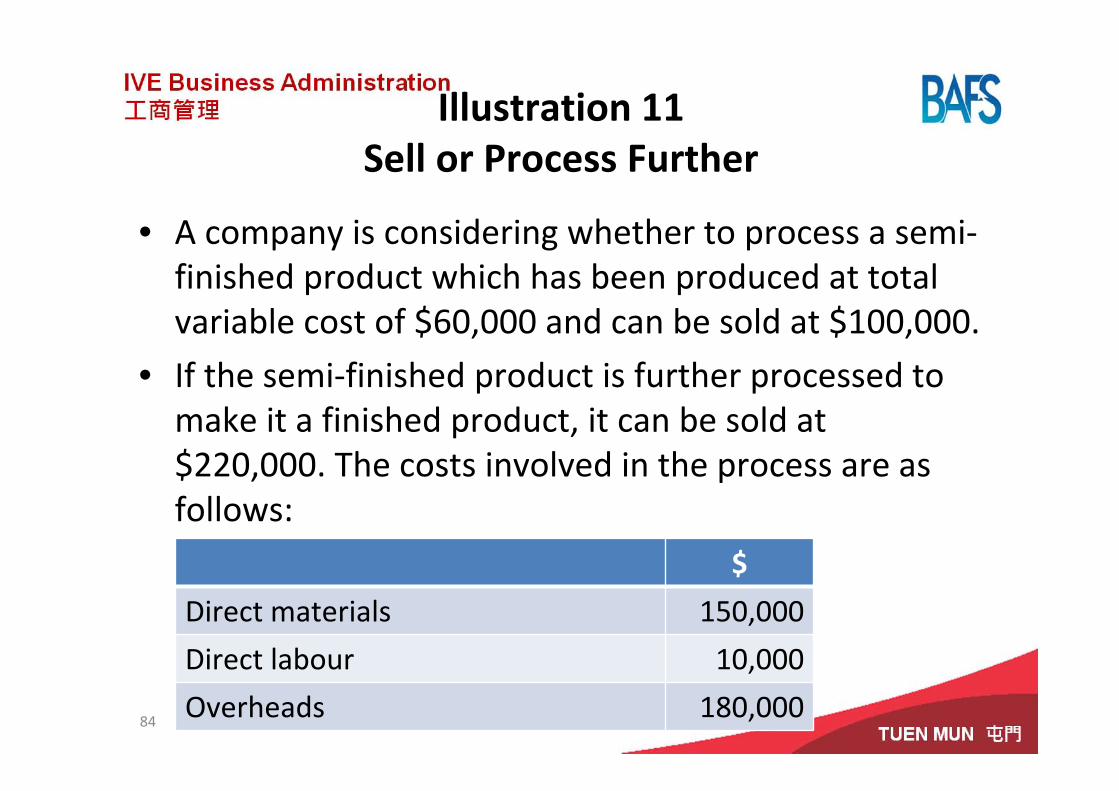
Illustration 11Sell or Process Further
• A company is considering whether to process a semi‐finished product which has been produced at total variable cost of $60,000 and can be sold at $100,000.
• If the semi‐finished product is further processed to make it a finished product, it can be sold at $220,000. The costs involved in the process are as follows:
84
$
Direct materials 150,000
Direct labour 10,000
Overheads 180,000
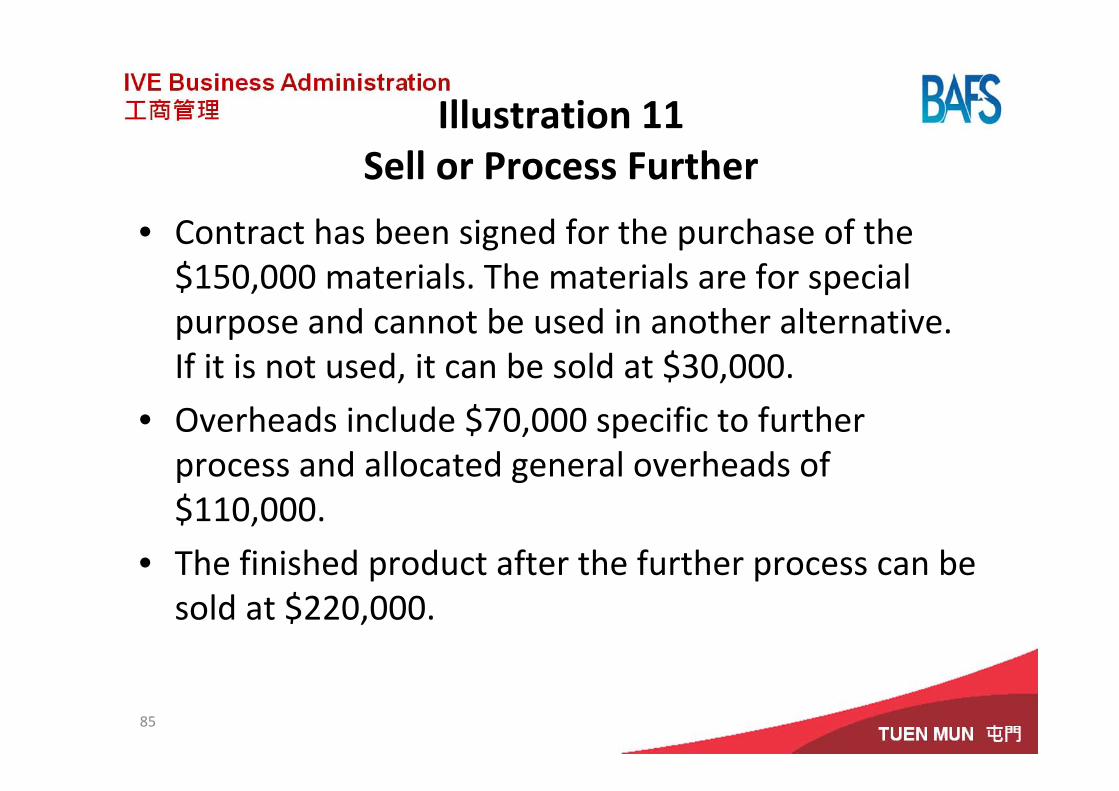
Illustration 11Sell or Process Further
• Contract has been signed for the purchase of the $150,000 materials. The materials are for special purpose and cannot be used in another alternative. If it is not used, it can be sold at $30,000.
• Overheads include $70,000 specific to further process and allocated general overheads of $110,000.
• The finished product after the further process can be sold at $220,000.
85
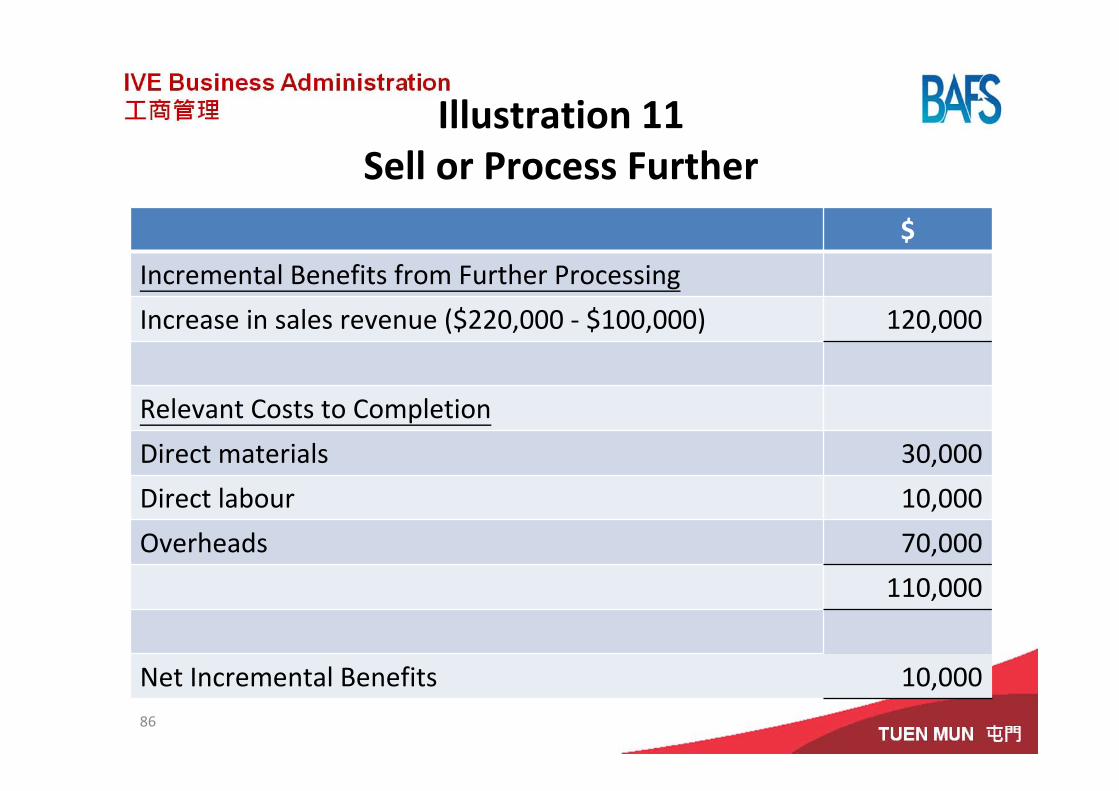
Illustration 11Sell or Process Further
$
Incremental Benefits from Further Processing
Increase in sales revenue ($220,000 ‐ $100,000) 120,000
Relevant Costs to Completion
Direct materials 30,000
Direct labour 10,000
Overheads 70,000
110,000
Net Incremental Benefits 10,00086
Illustration 11Sell or Process Further
• Conclusion: Since the benefit of further processing is greater than the costs, further processing is recommended.
87
88
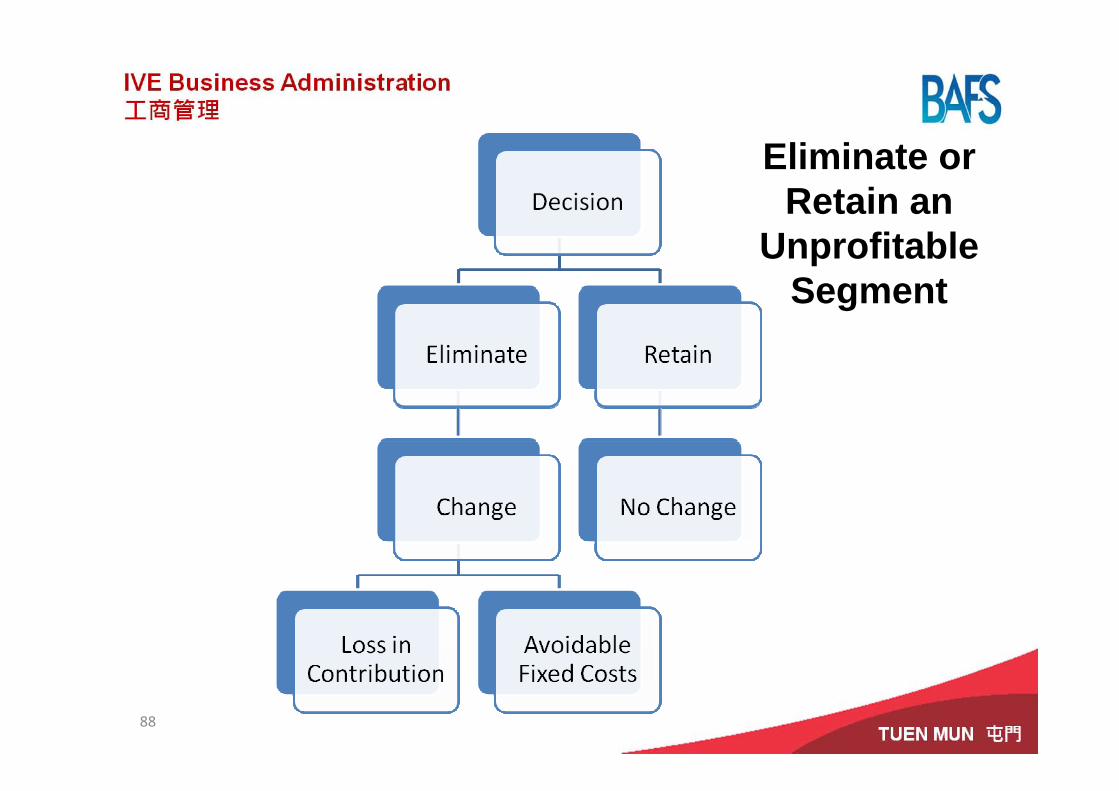
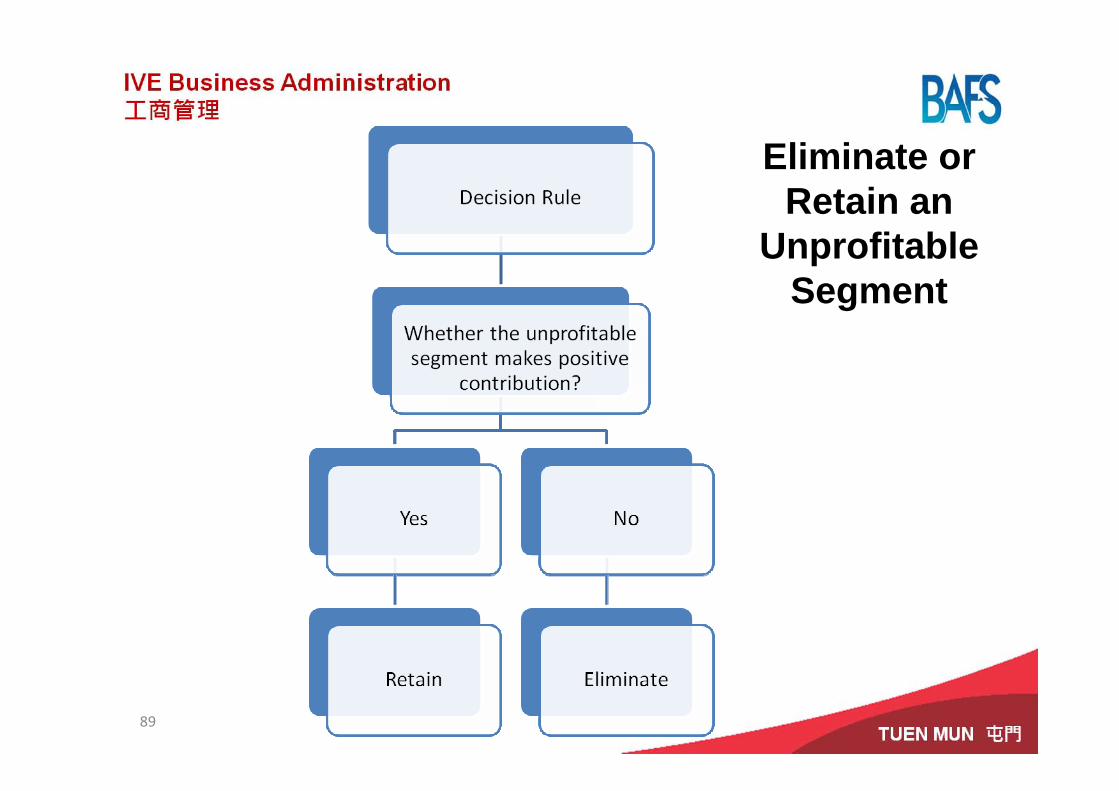
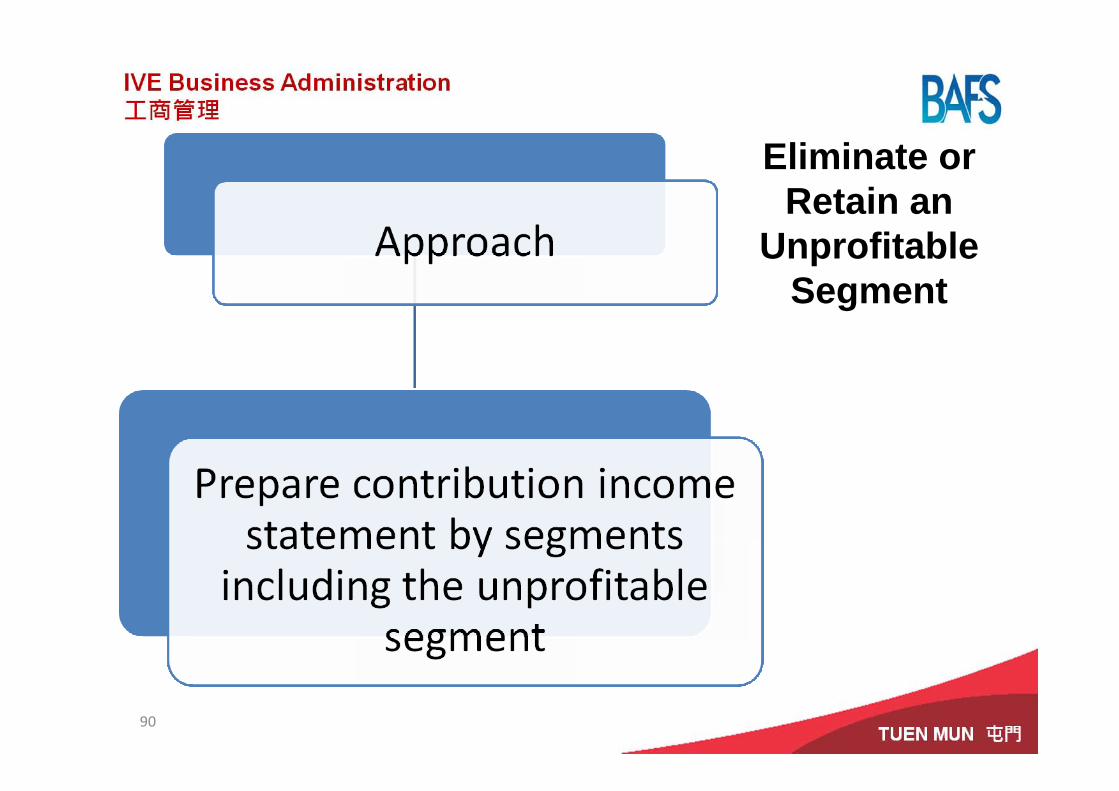
Eliminate or Retain an
Unprofitable Segment
89
Eliminate or Retain an
Unprofitable Segment
90
Eliminate or Retain an
Unprofitable Segment
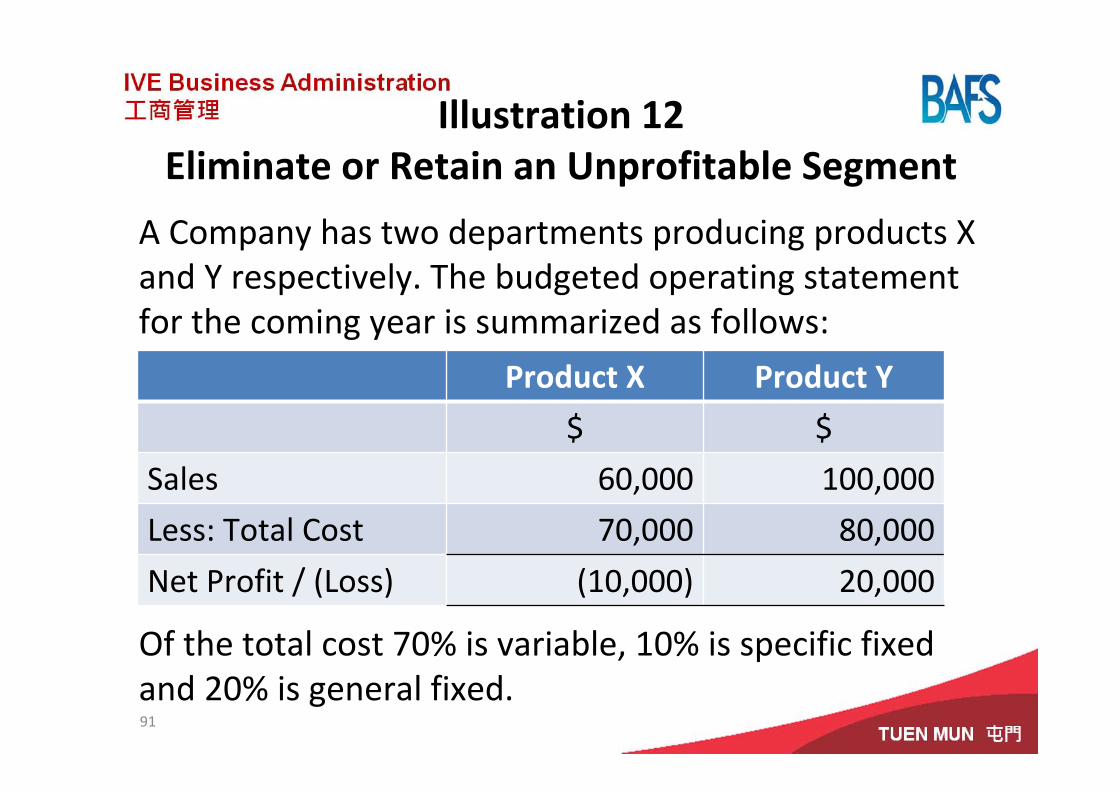
Illustration 12Eliminate or Retain an Unprofitable Segment
A Company has two departments producing products X and Y respectively. The budgeted operating statement for the coming year is summarized as follows:
Of the total cost 70% is variable, 10% is specific fixed and 20% is general fixed.91
Product X Product Y
$ $
Sales 60,000 100,000
Less: Total Cost 70,000 80,000
Net Profit / (Loss) (10,000) 20,000
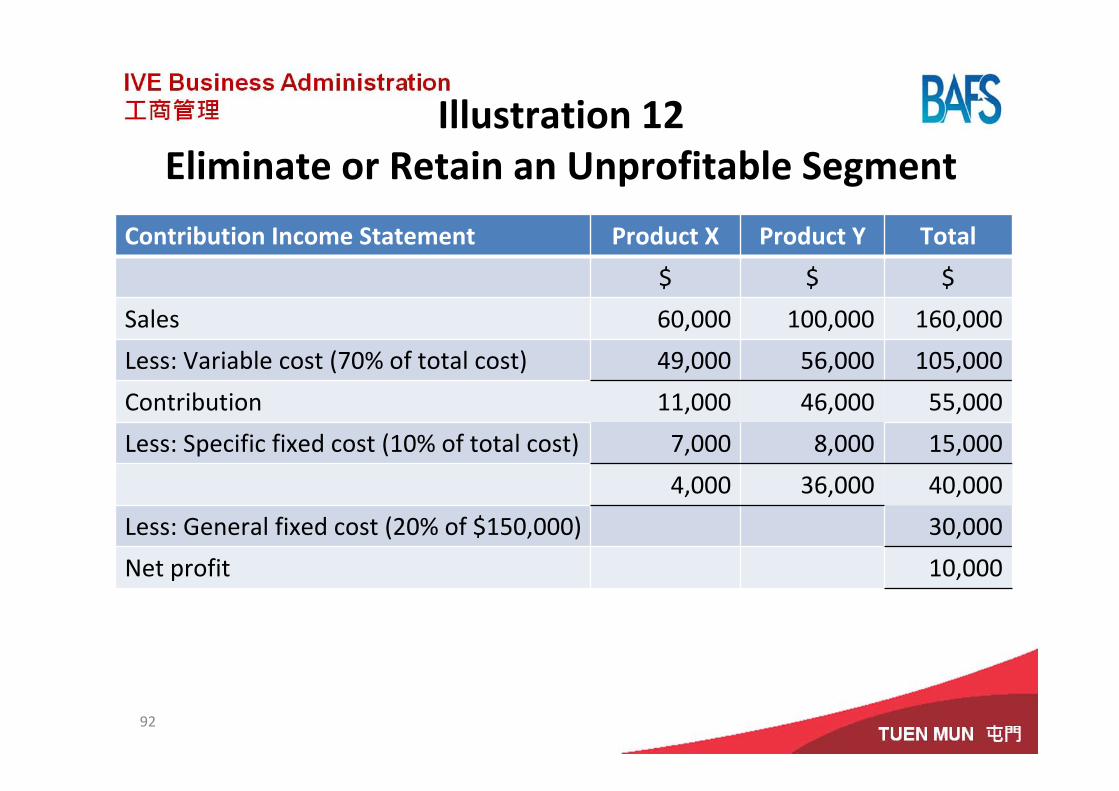
Illustration 12Eliminate or Retain an Unprofitable Segment
Contribution Income Statement Product X Product Y Total
$ $ $
Sales 60,000 100,000 160,000
Less: Variable cost (70% of total cost) 49,000 56,000 105,000
Contribution 11,000 46,000 55,000
Less: Specific fixed cost (10% of total cost) 7,000 8,000 15,000
4,000 36,000 40,000
Less: General fixed cost (20% of $150,000) 30,000
Net profit 10,000
92
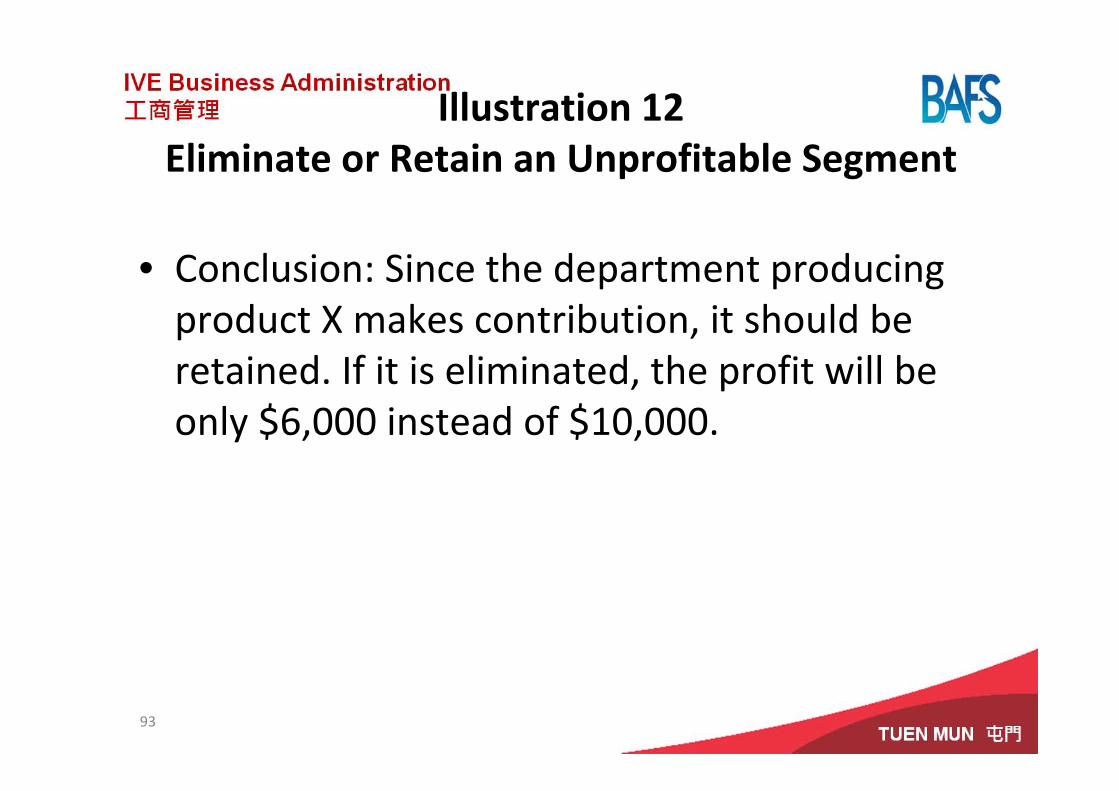
Illustration 12Eliminate or Retain an Unprofitable Segment
• Conclusion: Since the department producing product X makes contribution, it should be retained. If it is eliminated, the profit will be only $6,000 instead of $10,000.
93
Activity 2Integrated Illustrative Question
94
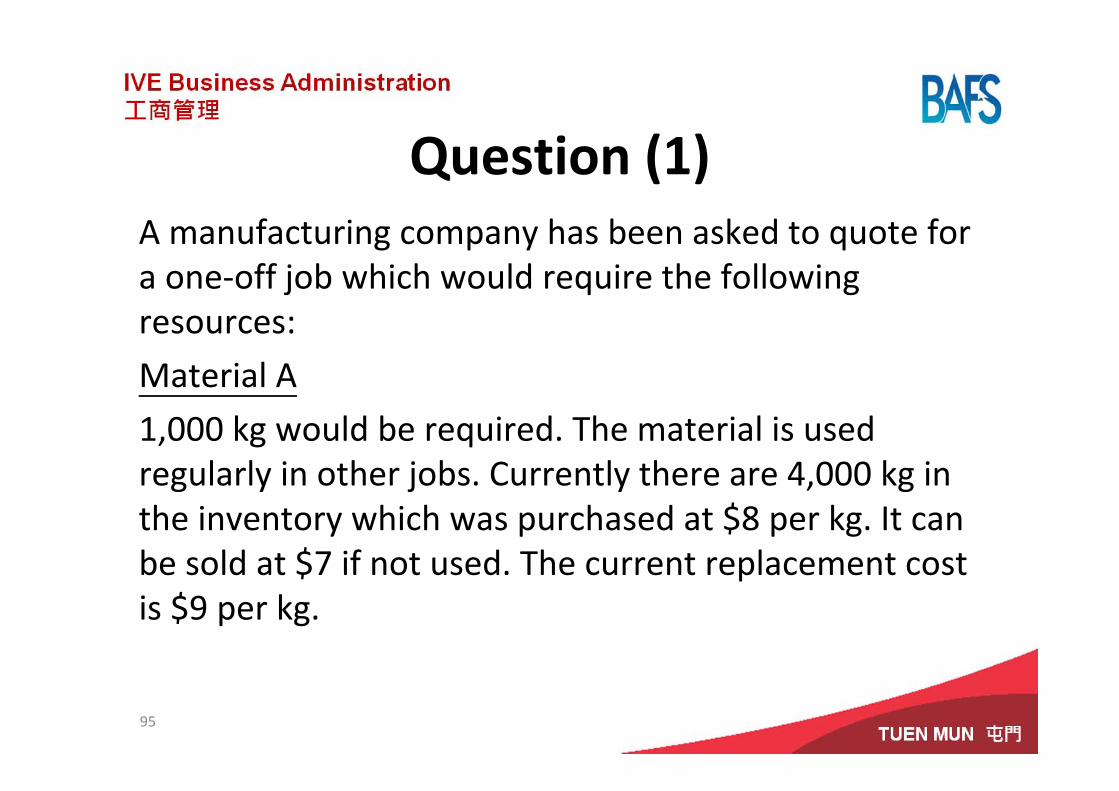
Question (1)A manufacturing company has been asked to quote for a one‐off job which would require the following resources:
Material A
1,000 kg would be required. The material is used regularly in other jobs. Currently there are 4,000 kg in the inventory which was purchased at $8 per kg. It can be sold at $7 if not used. The current replacement cost is $9 per kg.
95
Question (2)Material B or Material C
100 kg would be required. Material B is not in the inventory and has to be ordered at a current price of $15 per kg. However, material C can be used to substitute material B. Material C is in inventory and has been purchased at a cost of $20 per kg. It was specifically purchased for use in a product line which has now been discontinued. It can be sold at a net realizable value of $8 per kg. If it is used to substitute material B, additional conversion cost of $6 per kg has to be incurred.96
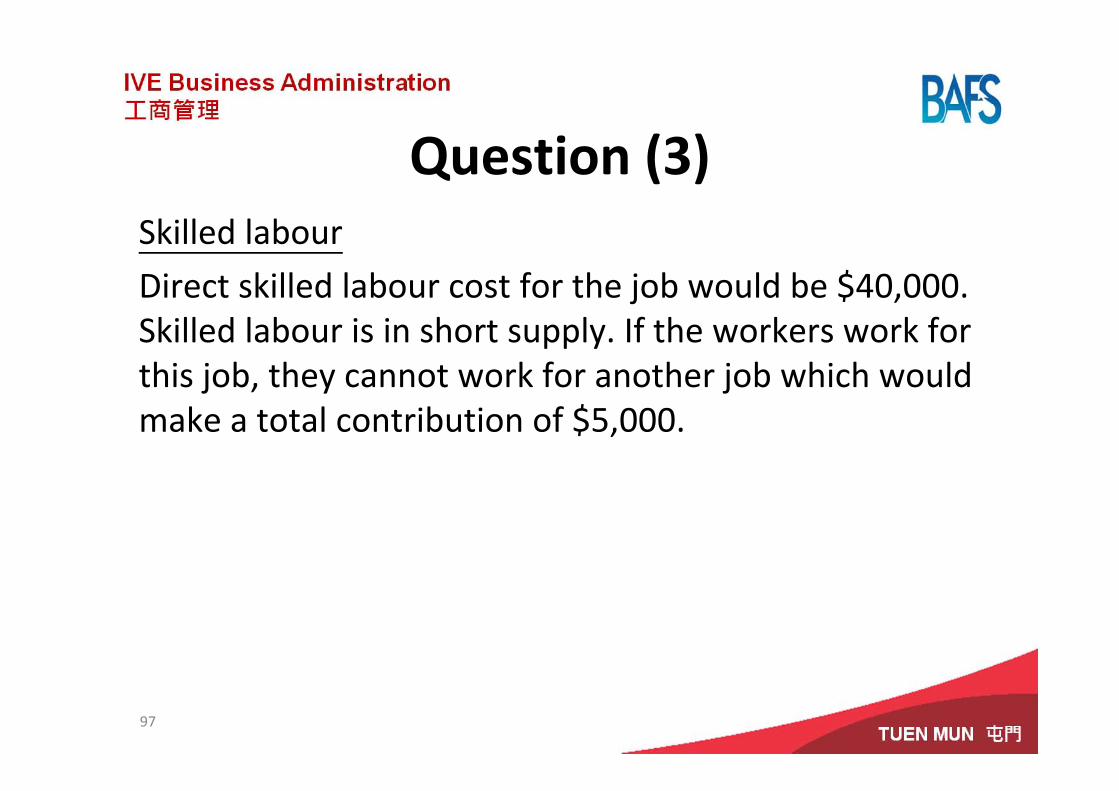
Question (3)Skilled labour
Direct skilled labour cost for the job would be $40,000. Skilled labour is in short supply. If the workers work for this job, they cannot work for another job which would make a total contribution of $5,000.
97
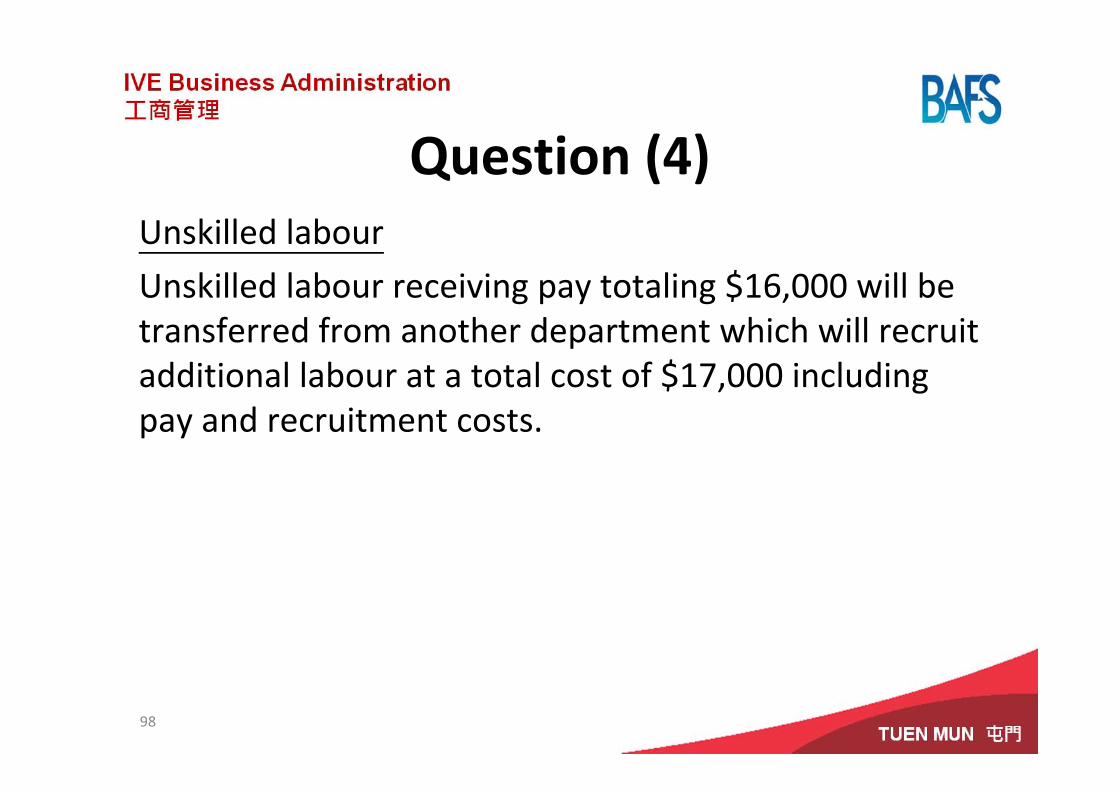
Question (4)Unskilled labour
Unskilled labour receiving pay totaling $16,000 will be transferred from another department which will recruit additional labour at a total cost of $17,000 including pay and recruitment costs.
98
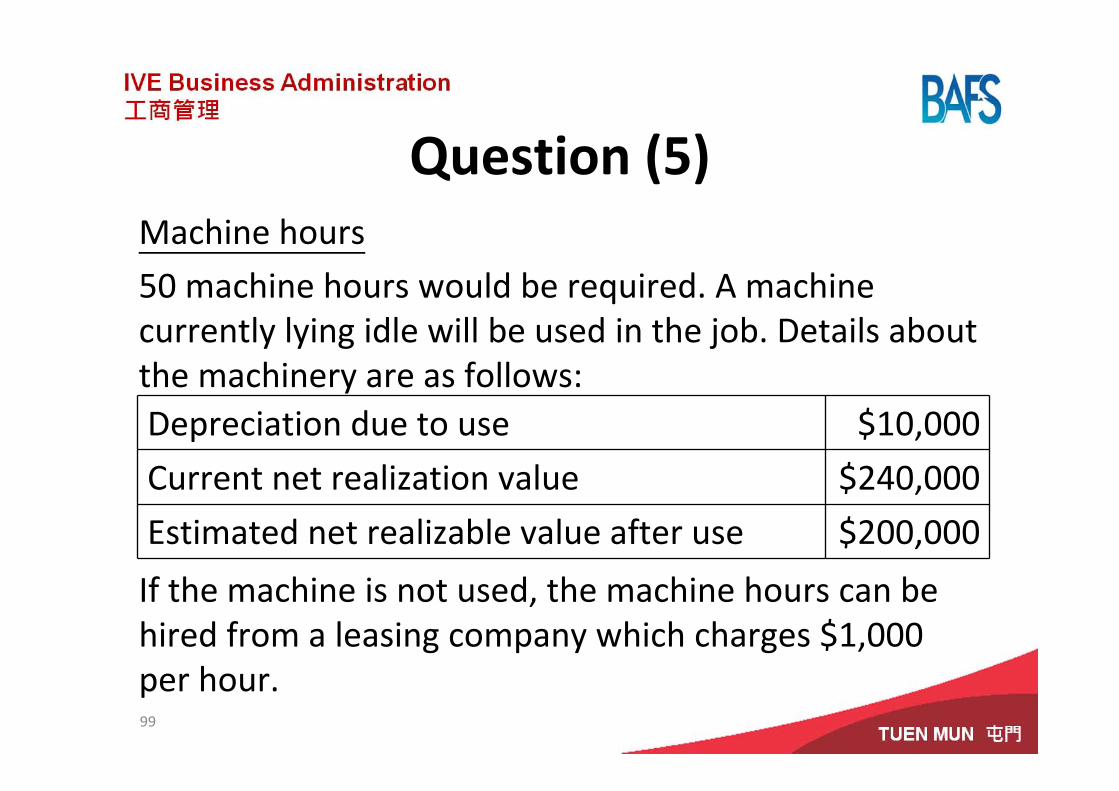
Question (5)Machine hours
50 machine hours would be required. A machine currently lying idle will be used in the job. Details about the machinery are as follows:
If the machine is not used, the machine hours can be hired from a leasing company which charges $1,000 per hour.99
Depreciation due to use $10,000
Current net realization value $240,000
Estimated net realizable value after use $200,000
Question (6)Required
Calculate the minimum price that should be quoted for the job.
100
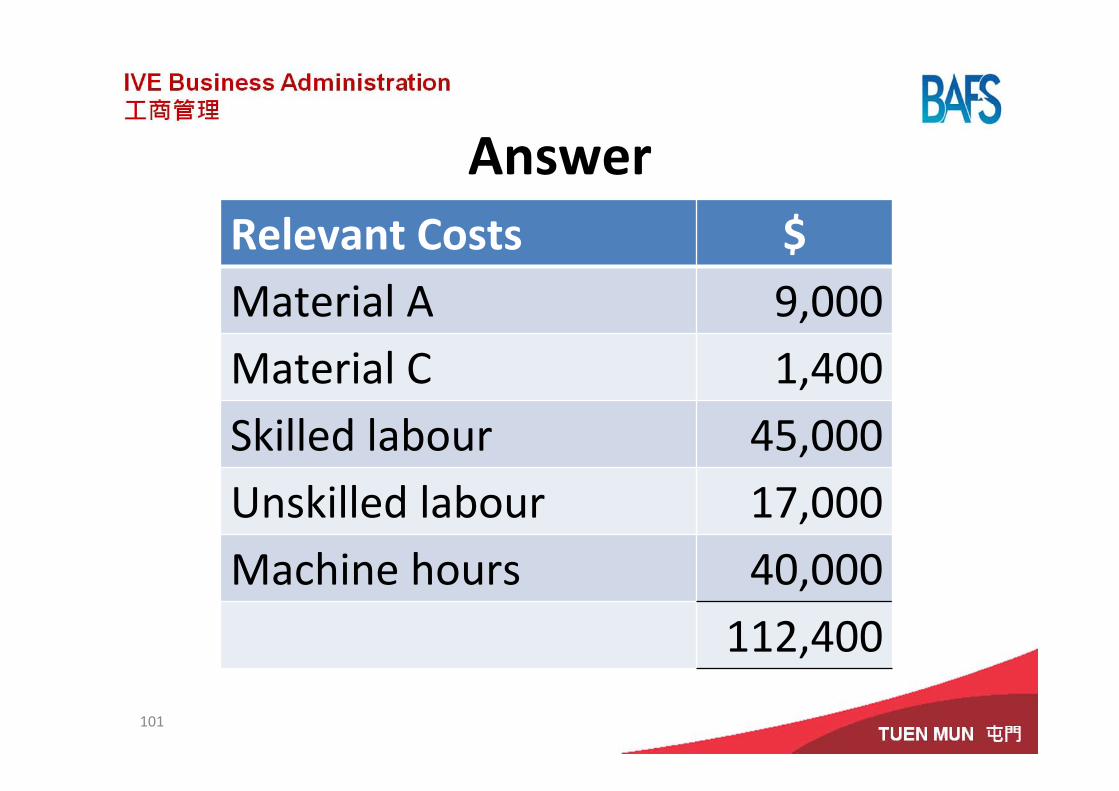
AnswerRelevant Costs $Material A 9,000Material C 1,400Skilled labour 45,000Unskilled labour 17,000Machine hours 40,000
112,400
101
Further ReadingsBurgstahler, D., Horngren, C., Schatzberg, J., Stratton, W., & Sundem,
G. (2008). Introduction to Management Accounting, 14th ed. Upper Saddle River: Prentice Hall. Chapters 2 & 5‐6.
Drury, C. (2008). Management and Cost Accounting, 7th ed. London: South‐Western Cengage Learning. Chapters 8‐9 & 11‐12.
Horngren, C. T., Datar, S. M., Foster, G., Raian, M. & Ittner, C. (2009). Cost Accounting: A Managerial Emphasis, 13th ed. Upper Saddle River: Prentice Hall. Chapters 3 & 11.