207
PAPER PRESENTATIONS

PAPER PRESENTATIONS

TOPIC 1
FOREST FOR PEOPLE

1
INAFOR A-0006
THE SECOND INTERNATIONAL CONFERENCE OF INDONESIA FORESTRY RESEARCHERS
THE 2nd INAFOR, 27-28 AUGUST 2013
Agroforestry Bambang Lanang: Farmers’ Perception and Behaviour in Supporting The Development of Community Forest in Empat Lawang Regency-South Sumatera Province
Ari Nurlia1, Bondan Winarno2 and Edwin Martin3
1,2,3Forestry Research Institute of Palembang Jl. Kol.H.Burlian Km. 6,5 Puntikayu Palembang
Corresponding email: [email protected]
Paper prepared for The Second International Conference of Indonesia Forestry Researcher (INAFOR)
27-28 August 2013
INAFOR SECRETARIAT Sub Division of Dissemination, Publication and Library
FORESTRY RESEARCH AND DEVELOPMENT AGENCY Jl. Gunung Batu 5, Bogor 16610

2
Agroforestry Bambang Lanang: Farmers’ Perception and Behaviour in Supporting The Development of Community Forest in Empat Lawang
Regency-South Sumatera Province
Ari Nurlia1, Bondan Winarno2 and Edwin Martin3
1,2,3Forestry Research Institute of Palembang Jl. Kol.H.Burlian Km. 6,5 Puntikayu Palembang
Corresponding email: [email protected]
ABSTRACT
Development of community forest using local species is one of solutions to overcome lack of wood supply for the community. Local species selected are the species that already tested to produce high-quality wood and well known by the community. Bambang lanang (Michelia campaka L) is a local wood species from Empat Lawang Regency that has been developed traditionally over generations. Bambang lanang timber is a medium growth species that ideally start to harvest over 10 years. This research is a survey using questionnaire to collect primary data and Focus Group Discussions (FGD) to verify the data and explore the information obtained. The results showed that farmers’ perception of agroforestry bambang lanang is good which farmers realize that bambang lanang have not only economic value but also a high ecological value. Economically, bambang lanang is used as a mean of farmer investment with minimal input but high return. Bambang lanang can also be used as a farmer’ savings for providing unpredictable needs such as for married needs, building a house and the school cost. While ecologically aware farmers’ by planting bambang lanang can withstand erosion and maintain existing water resources in their area. Farmers’ perception of bambang lanang positively correlated with their behavior, where the majority of farmers had planted in their farm. Limited land ownership is not an obstacle to plant bambang lanang, it is seen from farmers interest in planting bambang lanang increase every year. Farmers hope government's support in development of community forests bambang lanang.
Keywords: Bambang lanang, agroforestry, perception, behaviour.
1. INTRODUCTION Development of community forests is one of the solutions to overcome the lack of wood production from natural forests and plantations forest. Community forests can increase the number of trees on private land (Adhikari, et al., 2007). Community forest is expected to provide local and regional timber demand in community. To develop a community forest requires support from not only policy makers but also the actors in the field, specifically farmer. Local species used in the development of community forests is expected to increase farmer’s motivation in planting timber trees in their farm. Local species selected are local species that have been tested to produce high-quality wood and familiar to the community.
Bambang lanang (Michelia campaka L) is a local species selected to plant in Empat Lawang Regency. Bambang lanang is a local timber tree from Empat Lawang Regency that had been developed traditionally over generations. Bambang lanang as one type of constituent community forests is expected to increase farmer interest to continue planting timber tree. Agroforestry is the dominant planting system that can be applied to develop bambang lanang in private land. In addition due to the limited land, agroforestry patterns can also ensure the sustainability of farmer revenue.

3
To develop community forests of bambang lanang, it is necessary to study farmers’ perception of bambang lanang, because the perception will affect farmer’s planting behavior. There is no specific behavior without perception, and behavior is the result of perception (Harihanto, 2001). Perception is the first impression to achieve a success. It will affect the learning process (interest) and encourage individuals to learn something (Ahmad, et al., 2012). Perception gives a meaning to something and perception is the basis of behavior (Zimbardo and Floyd, 1975). Good perception tends to form good behaviors and negative perceptions tend to form negative behavior. The purpose of this research is to analyze and explain farmers’ perception and behavior in supporting the development of bambang lanang community forest in Empat Lawang Regency, South Sumatera Province.
2. EXPERIMENTAL METHODS 2.1. Location and Research Time The survey was conducted in two village in Empat Lawang Regency, i.e. Kemang Manis Village and Ulak Mengkudu Village, South Sumatera Province. Site selection is done intentionally based on criteria of the village which is bambang lanang’s habitat and the place that most of community plant it. Kemang Manis Village was selected to represent the down-hill and Ulak Mengkudu Village was selected to represent the up-hill region (Figure 1). The research was conducted on April-September 2012.
Figure 1: Map of site research
2.2 Data Collecting and Analysis This research is a survey using descriptive research method. Descriptive research is a research method that uses observation, interviews and questionnaires to describe the present situation at the time of research. Method is done by several stages, namely preliminary study (pre-survey) to explore and identify future research sites, and field surveys to collect overall information through interviews (primary data) and secondary data collection supporting

4
research purposes. Interview was done by using questionnaire both a structured and semi-structured.
Respondents were selected randomly with amount number of respondents were 40 households in Kemang Manis Village and 41 households in Ulak Mengkudu Village, bringing the total number of respondents in this study as many as 81 households.
Primary data were analyzed using social analyzes which are tabulation analysis, descriptive analysis and quantitative analysis. Tabulation analysis is done by grouping data based on multiple criteria for the purposes of further analysis. Tabulation analysis results in the form of data tables that illustrate relationships or joint research variables. Descriptive analysis is used to analyze and describe the qualitative data.
3. RESULTS AND DISCUSSION 3.1. Famers Perception of Agroforestry Bambang Lanang According to Surya (2004) perception is one form of cognitive behavior that is a process to get know environment with using senses. Perceptions are formed based on observations which in naturally society in daily life-day who influenced by experience, information and environment. Perceptions about the environment may provide a framework for forest conservation, and inform future efforts in forest education (Dolisca, et al., 2007). In general farmers’ perceptions against bambang lanang already classified as good, whereby they sighted bambang lanang is type of plants who easy obtained seedlings, easy planted, easy maintained, suitable with land condition and has a nice selling price. Value of bambang lanang perception of Kemang Manis Village higher than Ulak Mengkudu Village (41.0% than 23.4%). Those are presented on Table 1.
Table 1. Farmers’ perception of Bambang Lanang
Perception
Percentage of responses (%)
Average
(%)
Kemang Manis Village
N=40
Ulak Mengkudu
Village
N=41
Bambang lanang’s as seeds are easy to obtain, easy to plant and easy to maintain
62.5 26.8 44.6
Bambang lanang is suitable with land condition 62.5 31.7 47.1
Bambang lanang can be quickly harvested 10.0 2.4 6.2
Bambang lanang have wood straight and the canopies not disturb other plant
7.5 21.9 14.7
Bambang lanang have a good selling price 62.5 34.1 48.3
Average value of perception 41.0 23.4 32.2
Source: Primary data research Even though farmers know that bambang lanang is a long term harvest crop, they are still interested to plant bambang lanang. Martin et al., (2010) found that in the past three years,

5
500,000 of bambang lanang seedling were prepare by seed breeder in Jarai and Muara Payang in Lahat Regency each year that cannot provide farmers’ demand on bambang lanang.
Some farmer argue, bambang lanang’s canopy blocking the light, causing the plant to die underneath. However, this does not discourage farmer to plant it because the losses by planting bambang lanang is not worth comparing to bambang lanang’s high selling price. To reduce losses of staple crops that hindered by bambang lanang’s canopy, some people plant it as a land boundary.
Generally, farmer planted bambang lanang along with staple crops in their farm, or well known as a mixed pattern or agroforestry. According to Lundgreen and Raintree (1982) in Rianse and Abdi (2010) agroforestry is a collective term for systems and technologies in a planned land use conducted on a unit of land by combining woody plants (trees, shrubs, palms, bamboo, etc.) with agricultural crops and/or animals (livestock) and/or fish, which is done at the same time or take turns forming ecological and economic interactions between the various components. Bambang lanang agroforestry models developed by farmer in Kemang Manis Village and Ulak Mengkudu Village are a bambang lanang-coffee agroforestry model and bambang lanang-rubber agroforestry model (Figure 2). This is because the main crops that plant in their farm are coffee and rubber. The more diverse types of plants in the ecosystem, the more ecological system are getting stable (Leakey and Simon, 1998).
(a) (b) Figure 2: (a) Agroforestry model of bambang lanang-coffee, and (b) agroforestry model of bambang
lanang-rubber Farmers realize bambang lanang is not economically beneficial only, but also ecologically beneficial. Bambang lanang economically used as a farmer investment with minimal input but it possess a good selling price. Bambang lanang can also be used as a farmer savings in times when unpredictable needs come such as marital needs, building a house and school needs. While ecologically aware farmer by planting bambang lanang can withstand erosion and maintain existing water resources in their area. Benefit of bambang lanang can be seen in Table 2.

6
Table 2. Benefit of Bambang Lanang for farmers
Benefit of Bambang Lanang
Percentage of responses (%)
Average Kemang Manis Village
N= 40
Ulak Mengkudu
Village
N= 41
Economic Benefits
Investment 62.5 46.3 54.4
Providing unpredictable needs (married) 22.5 29.2 25.8
Build and repair houses 52.5 19.5 36.0
School needs 22.5 12.2 17.3
Ecological Benefits
Withstand erosion 57.5 0.0 28.8
Maintain existing water resources in their area
60.0 0.0 30.0
Source: Primary data research From the table above, Ulak Mengkudu Village farmer is not response about bambang lanang’s ecological benefits. This is because the Ulak Mengkudu Village located in the up-hill region so that the presence of water is still guaranteed. Unlike the Kemang Manis Village located in the downs-hill region that often felt the lack of water when the dry season comes, so by planting bambang lanang they hope to keep the existence of their water sources.
3.2. Farmers’ Behavior in Supporting of Bambang Lanang Community Forest
Behaviour is an action caused by perception while perceptions formed by environmental influences, information, and community experiences. Correct perception of an object is necessary because the perception is the basis for the formation of behaviour (Nurlia, 2006). Formation schemes of public perception can be seein in Figure 3.
Figure 3: Formation schemes of public perception
Farmers’ behaviour toward bambang lanang in both village positive compared with their perception. Farmers in Kemang Manis Village and Ulak Mengkudu Village have a positive perception of bambang lanang agroforestry and they apply it in their daily activities to plant in
Experience PERCEPTION
Environment
Information
BEHAVIOUR

7
their farm (Table 3). With limited land area, they will continue to plant bambang lanang in among of other plants or just as a land barrier crop.
Table 3. Characteristic of land ownership
Characteristic of land
Kemang Manis
Village
N=40
Ulak Mengkudu
Village
N=41
The average number of land 2 plot 2 plot
The average of land area 1.7 Ha 2.0 Ha
The average number of bambang lanang/area
38 trees 21 trees
the average distance of land with house 4.0 Km 2.0 Km
Selling price/m3 IDR 1.7 million IDR 1.5 million
Source: Primary data research Although the average land area in Kemang Manis Village is less than Ulak Mengkudu Village, the average number of bambang lanang at Kemang Manis Village is more than the average amount in the Ulak Mengkudu Village. This is consistent with the average value perception bambang lanang in Kemang Manis Village greater the amount of 41.0% compared with the average value perception in Ulak Mengkudu Village by 23.4%. Thus, it reflected the influence of the real behaviour perception of the farmer in planting bambang lanang.
Distance from house to farm in Kemang Manis Village is farther than in Ulak Mengkudu Village, but Kemang Manis Village position that is closer to the center of the regency make the selling price of bambang lanang woods at Kemang Manis Village is more expensive than selling price of wood in Ulak Mengkudu Village. High selling price of Kemang Manis Village also affect the interest of the farmer to plant bambang lanang.
The entire farmer aware, by planting bambang lanang in among their staple crops will affect to production of staple crops. However, farmers do not feel the loss due to bambang lanang’s selling price is higher than of loss of reduced harvest. Additionally bambang lanang also have other benefits besides the wood as fire wood, hold the soil from erosion and maintain water sources.
3.3. Constraints in Developing Community Forests of Bambang Lanang Lack of government attention to the development of community forest of bambang lanang causes various problems in forest management in community. Constraints are the lack of information regarding the breeding, pests and cultivation of bambang lanang’s timber correctly. Constraints experienced by farmers as described in detail in Table 4.

8
Table 4. The constraints in the development of bambang lanang community forests
The constraints
Percentage of responses (%)
Kemang Manis Village
N= 40
Ulak Mengkudu
Village
N= 41
Nurseries (breeding, difficulty of getting a good seed) 47.5 43.9
Plant spacing 5.0 2.4
Pests 5.0 43.9
Limited of land 40.0 0.0
Source: Primary data research
Nursery and limited of land to be a constraints in Kemang Manis Village, while breeding and pests become an obstacle in Ulak mengkudu Village. Farmers expect the government to help them resolve these constraints
So far the government has not played an active role in development of bambang lanang community forests. Socialization or training regarding the cultivation of bambang lanang have never been done. Hence, it led to a lack of information while farmer interest in bambang lanang currently high.
The farmers expect the government to facilitate them by providing socialization and extention. So the farmers know the correct information about bambang lanang technique cultivation, and their also expect the assistance of seeds in order to produce good quality timber.
4. CONCLUSIONS
Farmers’ perception of agroforestry bambang lanang is good which farmers realize that bambang lanang have not only economic value but also a high ecological value. Economically, bambang lanang is used as a mean of farmer investment with minimal input but high return. Bambang lanang can also be used as a farmer savings for providing unpredictable needs such as for married needs, building a house and the school cost. While ecologically aware farmers’ by planting bambang lanang can withstand erosion and maintain existing water resources in their area.
Farmers’ perception of bambang lanang positively correlated with their behaviour, where the majority of farmers had planted in their farm. Limited land ownership is not an obstacle to plant bambang lanang, it is seen from farmers interest in planting bambang lanang increase every year.
The lack of government attention to the development of community forest of bambang lanang causes various problems in forest management in community. The farmers’ hopes the government to facilitate by providing socialization and counseling to get the correct information about the cultivation bambang lanang. Farmers’ are also hoping for help such as assistance seeds in order to produce quality wood.
5. REFERENCES
Adhikari, B, Frances W. and Jon C Lovett JC (2007): Local benefits from community forests in the middle hills of Nepal. Forest Policy and Economics 9: 464– 478.

9
Ahmad, B, Hasanu S, Dian D, dan Tri S W (2012): Persepsi Petani Terhadap Pengelolaan dan Fungsi Hutan Rakyat di Kabupaten Ciamis. Jurnal Bumi Lestari, Volume 12 No. 1, Februari 2012, hlm. 123 – 136.
Dolisca, F, Josh M McDaniel, Lawrence D and Teeter (2007): Farmers’' perceptions towards forests: A case study from Haiti. Forest Policy and Economics 9: 704–712.
Harihanto (2001): Persepsi, Sikap dan Prilaku Masyarakat Terhadap Air Sungai: Kasus di DAS Kaligarang Jawa Tengah. Disertation. Program Pascasarjana IPB, Bogor. 389 halaman.
Leakey, R R B and Simons A J (1998): The domestication and commercialization of indigenous trees in agroforestry for the alleviation of poverty. Agroforestry systems 38 : 165-176.
Martin, E, Bambang T P, Armellia P Y, Ari N, dan Agus B.H (2010) Budidaya Jenis Bambang lanang Aspek Status Pembudidayaan di Masyarakat. Laporan Hasil Penelitian. Balai Penelitian Kehutanan Palembang. 27 halaman.
Nurlia, A (2006): Persepsi dan Perilaku Masyarakat dalam Pengelolaan Ekosistem Sub DAS Cikundul. Skripsi. Jurusan Manajemen Hutan. Fakultas Kehutanan IPB. Bogor. 82 halaman.
Rianse, U dan Abdi (2010): Agroforestri: Solusi Sosial dan Ekonomi Pengelolaan Sumberdaya Hutan. Alfabeta. Bandung. 327 halaman.
Surya, M (2004): Psikologi Pembelajaran dan Pengajaran. Pustaka Bani Quraisy. Bandung. 112 halaman.
Zimbardo, P G and Floyd L R (1975): Psychology and life. United States of America. Scott, Foresman Company. 782 pp.

10

11
INAFOR A-0013
THE SECOND INTERNATIONAL CONFERENCE OF INDONESIA FORESTRY RESEARCHERS
THE 2nd INAFOR, 27–28 August 2013
Bee Management and Productivity of Two Local Honeybees (Apis dorsata Fabr. and Apis cerana Fabr.)
in Riau Province
Avry Pribadi1 and Purnomo2
1,2 Forestry Research Institute for Fiberwood Technology
Jl. Raya Bangkinang-Kuok km. 9 Bangkinang Kab. Kampar-Riau 28401, Indonesia Corresponding email: [email protected]
Paper prepared for The Second International Conference of Indonesian Forestry Researchers INAFOR
27-28 August 2013
INAFOR SECRETARIAT Sub Division of Desimination, Publication, and Library
FORESTRY RESEARCH AND DEVELOPMENT AGENCY Jl. GunungBatu 5, Bogor 16610

12
Bee Management And Productivity Of Two Local Honeybees (Apis dorsata Fabr. And Apis cerana Fabr.)
in Riau Province
Avry Pribadi1 and Purnomo2
1,2 Balai Penelitian Teknologi Serat Tanaman Hutan
Jl. Raya Bangkinang-Kuok km. 9 Bangkinang Kab. Kampar-Riau 28401, Indonesia Corresponding email: [email protected]
ABSTRACT Forest degradation over to plantation forest and oil palm invasion are not only affect on Sialang tree reduction, that causes the reduction of Apis. dorsata colony, but also provide unique phenomenon. The growth of Plantation Forest Industry (PFI) in Riau also affects the development of Apis. cerana. The lack of pollen source becomes one of the problem of beekeeping in PFI.This paper studies the bee management of Apis dorsata and Apis cerana in term of honey productivity and harvesting methods. The study was took place in Plantation Forest Industry of Acacia. Mangium and Acacia. crassicarpa in Riau Province. The results show that species dominate the deployment of Sialang tree are Makeluang (n=361), Kayu Ara (n=325) dan Acacia mangium (n=253). The highest density of A. dorsata colony was found in Kempas and Julang trees, with the average of 100 colonies/tree). The sustainableA. Dorsata harvesting method showed that 28 days afte r honey harvesting, the A. Dorsata colony had established about 1,050 cm2honey cell and about 264 cm2 pollen cell in each colony. The average of honey productivity in Acacia mangium PFI is about 1.17 litres/month(in 2 years) and 1.18 litres/month(in 3 years) derived from A. cerana colonies. Meanwhile, honey produce from Acacia crassicarpa PFI were about 1.18 litres/month (in 2 years) and 1.22 litres/month (in 3 years) from A. cerana colonies.The honey productivity production decreases by about 61.4%, which is caused by the lack of pollen production in PFI. Keywords: Apis dorsata, Apis cerana, Sialang tree, Plantation Forest Industry (PFI), bee management
1. INTRODUCTION
Riau is a province with the largest forest honey potency compared to other provinces in Indonesia, even to West Nusa Tenggara (NTB) and Danau Sentarum (West Kalimantan). As comparations the productivity of forest honey in Riau from 2006 to 2007 reached more than 400 tons (Purnomo et al., 2007) and became the highest productivity if it compare to forest honey productivity in NTB (reached only 125 tons/year (Julmansyah, 2007)) and in Danau Sentarum that only reached about 20 – 25 tons/year (Riak Bumi Foundation, 2012). But NTB and Danau Sentarum is more popular as honey production areas than Riau. This is mainly due to the campaign that carried out by each local government. The opposite effort happened to Riau government that had no effort to introduce their forest honey potency. Whereas the Riau forest honey had more advantages than NTB and Danau Sentarum, not only by its quantity but also by its availability that abundance along the year. This superiority is not happened in forest honey production in NTB and Danau Sentarum that is only available in certain seasons (Purnomo et al., 2006). In Riau, there are at least two species from Apis genus that produce honey, i.e Apis dorsata (wild/forest honeybee) and Apis cerana (Hadisoesilo, 2001). Asiatic giant honeybee (A. dorsata)

13
is the most productive honeybee producing honey which has the percentage of honey production nearly 70% of all honey produced in Indonesia (RLPS, 2006). The main characteristic of Asiatic giant honeybee is its hive with one stroke that hangs in a branch and a twig of a sialang tree (Starr et al., 1987). Sialang is a term for a big, tall tree which has diametre reached 100 cm or more, and the height can reach 25 to 30 meter and is hosted by A. dorsata. In Riau, it has at least 52 species (most of them registered on CITES Apendix II) of the biggest sialang trees which spread in peat and mineral soil. Sialang tree is a kind of plant which is protected by law, both government law and community law. For the some people who lives near the forest, the forest honey from sialang tree used to be additional income. Another bee species, A. cerana, is a local honeybee, that has been producing honey in Indonesia commercially especially in Central and West Java for a long time. Although the productivity is low if it compared to A. mellifera (European honeybee). Traditionally, honeybees grows in the old coconut log and hive box where bee keepers can derive honey from it.. A. cerana is a good pollinator, and high in survival capacity due to the co-evolution of native floral sources, pests and predators accustomed to the same climatic conditions. In early of year 1990`s, land clearing activity happened to the natural forest to accommodated the Plantation Forest Industry (PFI) and Oil Palm Plantation. This deforestation activity are not only giving negative effect to Sialang tree but also giving a unique phenomenon to the A. dorsata. Before deforestation activity was done, A. dorsata colony was never found in high buildings and bridges. But while deforestation was being done, reduction of the number of sialang trees resulted in A. dorsata colony hive that migrated to nesting in buildings and bridges. However, after the oil palm plantation and PFI are well established, A. dorsata is re-nesting in tall tree bordering the two areas (natural forest and the plantation). It can be seen from the tendency of A. dorsata colonies is more getting closed to the forest boundary of PFI (that planted by Acacia crassicarpa, Acacia mangium, and Eucalyptus sp.) for example that happened in Pelalawan district, even today A. mangium become one of the species of sialang tree because nested by A. dorsata (happened in Rokan Hulu district) (Purnomo et al., 2007). This issue was related to the availability of A. dorsata forage that is abundance in Acacia plantation (Sihombing, 1997). The potency of extra floral nectar that secreted by A. crassicarpa and A. mangium are about 60 litres/day/hectare in average based on the age of the tree (Purnomo et al., 2009). In term of honey production sustainability, the destruction method by cutting off all of the A. dorsata hive to get the forest honey reduces the forest honey production. This destructive technique happened before year 2000. Most of the bee keeper used the cut the all nest (brood, bee bread, and honey) off method and it caused the reduction of honey bee production as the A. dorsata bee colonies reduced significantly because of the life cycle of A. dorsata is interrupted. But after year 2000`s, the new technique had been introduced to the forest bee keeper. This new technique had increased the honey harvesting frequency from only 2-3 times in one year (before year 2000) become every month after year 2000`s. The other problem to A. cerana, the honey production of A. cerana has been reported to decrease significantly although there is abundant of extra floral nectar in Acacia plantation. Acacia plantation only provide the nectar that used for energy, but lack of pollen source because there is no flower blooming of Acacia before 4-5 years. Pollen that unavailable on Acacia flower plantation reduces the honeybee health and honey production siginificantly. Based on many problems, this paper studies the bee management of Apis dorsata and Apis cerana in term of honey productivity and harvesting methods in Riau province.

14
2. METHODS
2.1 Time and location The research about the management of A. dorsata was done in year 2008 to 2009 at 10 district of Riau provinces (figure 1). Meanwhile the research about management of A. cerana in was done in year 2009 to 2011 at A. mangium and A. crassicarpa plantation in Arara Abadi concession area (Siak district).
Figure 1: Riau province
2.2 Observations on Management of A. dorsata and Ssialang Tree Determining the vegetation distribution and the number of Sialang trees, colony distribution, honey productivity, and A. dorsata preference to sialang tree at Riau province (1° 15’ S - 4° 45 N and 100° 03’ E - 109° 19’ E). The bee keeper behaviour was also documented to compare the sustainable A. dorsata harvesting method (Purnomo et al., 2008). 2.3 Observations on Management of A. cerana in A. mangium and A. crassicarpa
Plantation Preliminary studies indicate that the potential forage in the A. crassicarpa plantation is sourced from the extra floral nectar. Observations of potential nectar ekstra floral was done by measuring the volume of secretions by using a micro pipette. Each selected stands were selected and then determined based on the leaf canopy strata (upper, middle, and bottom). Observations were done in each hour, started at 06:30 to 18:30.
A total of 20 A. cerana colonies placed on the A. crassicarpa and A. mangium, as many as 10 colonies placed in the A. crassicarpa and A. mangium plantation that introduced sorghum and remaining 10 colonies placed on A. crassicarpa and A. mangium plantation that not introduced with sorghum. Observations were made by measuring the honey productivity and crude protein of worker bee.

15
2.4 Data Analysis Data volumes of nectar secretions was calculated by calculating the amount of secretion for each stand then for every hectare. Data analysis was done by descriptive quantitative comparison between the potential A.crassicarpa nectar at the age of 12 and 50 months, honey productivity, and crude protein of A. cerana worker. Mean while the data of A. dorsata was evaluated to compare the honey quality and quantity before and after the sustainable harvest method (Purnomo et. al., 2008) was introduced.
3. RESULTS AND DISCUSION
3.1 Current Management of A. Dorsata and Sialang tree
Firstly, identification and observation of forest honey harvesting in each districtobtain an information about the equipment that commonly used by forest bee keeper those were: (1) “latak” and wooden bat, (2) smoke, (3) cutting tool nest, (4) containers for honey collection (ubol) and rope to lower and raise the ubol, (5) strokes container, (6) tool filters and (7) lighting equipment. This part of the sequence/procedur below; the sialang tree is reached by used”latak” made of wood or bamboo, with a dimension of 20 cm length and 5 cm width and used them as stairs to build nest in the beehive tree. “Latak” amount used depends on tree height, the height of the tree where the nest colony “latak” needed more and more. Traditional smoker used to relieve hives by the honeybees. Traditional smokeris made of wood or roots of coconut coir can also bound form of bars. The ideal time for honey harvesting is 07:00 pm to05:00 am and also at noon. Harvesting was normally carried out after 20-25 days from its arrival. The ideal duration to harvest all the hives in a sialang tree is about 2-3 days in average.
The honey utilization procedure is described as follows: Firstly, “latak” was installed on main stem of sialang tree by the handler, then the bundle of honeybee that hangon the hive was released using smoke. Then, the nests were cut using bamboo knife and strokes by containerreel (ubol) that made of rattan. The honey was then squeezed by sterile hand (glove) and then filtered manually used stainless filter. After extraction by squeezing technique, the honey produced will be in mixture of brood/larvae, wax, pollens, and even with other waste. Honey produced in various quality based on its cleanliness. The quality also refers to the durability of the honey as low quality honey will ferment rapidly.
In 2000s, forest honey harvesting method was carried out by cutting off all of A. dorsata nest. As a result, not only honey comb that was taken, but also the brood cell. In this method, there was no selection treatment to separate between immature to mature honey comb. This immature honey will easily ferment by yeast because the water content is still high (more than 25%) and it can be seen by honey comb that had not covered by bee wax yet.
In the years after 2000, the quality improvement efforts with regard wild honey harvesting techniques and improved post-harvest handling (Purnomo et al., 2008) showed that there was an improvement in the quality and sustainability of life honey A. dorsata which then have an impact on increasing the intensity of forest harvesting honey 2-3 times a year to once every month.In the years after 2000s, the efforts to improve the quality and quantity of forest honey were done by stressed on honey harvesting techniques that based on sustainable forest honey harvesting and improved the post-harvest handling (Purnomo et al., 2008). The results showed that there was an improvement in the quality and sustainability of life cycle of A. dorsata which then have an impact on increasing the intensity of harvesting honey by 2-3 times in a year to 12 times in a year.In general, the test resultsshow that according to the forest honey quality standard, forest honey produce from Riaucomply with SNI standard. Parameters tested were lower than value stated in the SNI 01-3545, 2004. Following the

16
analysis of the quality of forest honey than honey quality requirements (SNI 01-3545 2004) before and after the treatment was done (Table 1).
Tabel 1. Requirements of honey quality by SNI 01 – 3545 years 2004
No Parameter Requirement
Before treatment After treatment
1. Diastase enzyme activity (DN) Min 3 2.10 3.2 2. Hidroksi metal furfural (HMF) (mg/kg) Max 50 51.30 38.00 3. Water content (%) Max 22 24.10 23.10 4. Reduction sugar (% w/w) Min 65 69.1 69.3 5. Sucrose (% w/w) Max 5 1.20 1.20 6. pH (ml Na OH1 N/kg) Max 50 52.40 37.00 7. Solids that unsolved in water (% w/w) Max 0.5 Negative Negative 8. Ash (%,w/w) Max 0.5 0.70 0.60 9. Metal contamination - Lead (Pb) (mg/kg) Max 1.0 <0.005 <0.005 - Copper (Cu) (mg/kg) Max 5.0 1.11 1.11
10. Arsen contamination (As) (mg/kg) Max 0.5 NegativeGutzeit NegativeGutzeit
The function of diastase enzyme is to break down the oligosaccharides into monosaccharide compound. The small amount of diastase enzyme activity due to diastase enzyme that theoretically available in honeybee stomach will be denatured by the presence of yeast that secrete the phenol compounds. The presence of yeast allegedly as a result of the high water content in honey (Table 1) and the micro-flora of honey have not inhabit the yeast yet. The high levels of water content happened when the treatment of forest honey was done in younger cells (immature). Moreover, the existence of A. dorsata nest in the open air isallegedly to be the only factor of the high water content of forest honeybee (Purnomo, et. al., 2008).
Treatments for increasing honey productivity was applied by cleaning treatmentfor the rest of honey comb that was still attached to the stem after honey harvesting and by not doing cleaning treatment (the rest of comb left tobe attached). Based on the observation, it showed on the first day, after honey stroke harvesting,both trials were still made a crowd of A. dorsata. After 28 days since the cleaned the old honey comb treatment, the cleaning of honey comb shows that the part had reformed and bulged. Oppositely, the hive whose hive/comb was uncleaned which change the function of the comb (which was the comb for brood become honey) (Table 2). In addition, the cleaning process of the rest of the honey comb had higher value of 1260 cm2, compared to the uncleaned honey combwhich was 960 cm2. The similar trend could be seen in the pollen comb and brood which had higher values to the cleaning treatment compared to the uncleaned one (Table 2).
Table 2.Wide average of each hive stroke (honey, pollen, brood) on the 28th day after the process
The low trend of comb wide of each hive to the uncleaned treatment was predicted because of the existence of rotten comb rest, so it lured the decomposing organisms (fungi or decomposer) to come, and it made the old hive becoming humid and rotten. This such
Part of hive comb Honey (cm2) Pollen (cm2) Brood (cm2) Cleaned Uncleaned Cleaned Uncleaned Cleaned Uncleaned
comb of previously harvested honey (point part/farthest part of main stem/harvested part)
1050 0 264 0 0 0

17
condition was probably not favored by the bees, specifically it was because of the high humidity of the comb which raised disease caused by fungi and bacteria. According to Renich et al. (2011), some bee diseases are caused by the existence of microorganisms such as roten larvae rot (caused by bacteria Bacillus larvae).
The total number of sialang trees in Riau province in year 2008 were 2011 trees, with 52 species of sialang trees and 46,875 of A. dorsata colony. The preferency of A. dorsata to nest at sialang tree showed that the highest tree species are Makeluang (Heritiera Tarrieta) (n = 361), Kayu Ara (n = 325), and Acacia mangium (n = 253). According to districts, the highest number of sialang tree species are Rokan Hulu (20 trees species), Pelalawan (14 trees species), and Kuantan Singigi (14 trees species). In general, sialang trees in Riau were widely distributed in the middle and west districts and rarely in district that closed to the coast. Indragiri Hilir and Rokan Hilir districts that close to the coast grow only 6 species of sialang trees which number of 54 and 26 sialang trees. District located in the middle and west showed the high number of sialang trees, such as Rokan Hulu districts (515 trees), Pelalawan (424 trees), and Kuantan Singingi (378 trees). Similar trends occurred to the observation number of A. dorsata colonies. The results show that the highest number of colony was on Pelalawan (11,517colonies), Rokan Hulu (10,412 colonies), and Kuantan Singingi (9,636colonies). Districts near the coastgrows fewer number of colonies, such as Indragiri Hilir (1,143 colonies) and Rokan Hilir (545 colonies) (Table 3).
Table 3. Distribution of sialang tree and the colony of A. dorsata
District Number of species that found
Total of sialang tree
Amount of A. dorsata colony
Rokan Hulu 20 515 10,412 Pelalawan 12 424 11,517 Kuantan Singingi 12 378 9,636 Indragiri Hilir 6 54 1,143 Rokan Hilir 6 26 545
This is caused due to effect in the presence of Plantation Forest Industry (PFI) that planted by A. mangium, A. crassicarpa, and Eucalyptus spp. that abundance at Kuantan Singingi and Pelalawan. The forest plantation of Acacia sp. provides extra flora nectar as bee forage about 40 to 75 litres/ha/day (Purnomoet al., 2009). The existences of forest protected areas that grows surrounding the PFI were so petrified that the A.dorsata nesting and finding sources of pollen from the flowers of the forest (because of there are very low pollen source at PFI area).
There is many factor influenced the high and low of colony preference for honeybee A. dorsata i.e amount of horizontal branchings and microclimate. The tree height reaching about 27 meters and become dominant (there is no found vegetation/ another tree which is as big as the sialang tree, and branching that is far from plants of epifit and liana (Starr et al., 1987) and located around the sustainable forest (Purnomoet al., 2007). It can be seen from sialang trees located in the center of concession area of PFI and oil palm plantation were not nested by A. dorsata and even most of sialang tree is died (Purnomoet al., 2007).
3.2 A. dorsata Honey Productivity
Two districts that produce forest honey more than 100 tons/year are Pelalawan (108.5 tons/year) and Kuantan Singigi (106.6 tons/year) (Table 3). Overall the total forest honey productivity in Riau were about 438.75 tons in 2008. Similar trends happened on the district

18
that closed to the coast. In this district the forest honey productivity is low (under 10 tons/year) (Table 4).
Table 4. Potency of forest honey production in regencies of Riau province (2007 – 2008)
Honey production in every district
Forest Honey Production Kg/month Ton/year
Kab. Pelalawan : 9,064.69 108.5 Kab. Siak : 4,677.23 55.8 Kab. Rokan Hulu : 2,416.17 49.01 Kab. KuantanSingingi : 8,893.07 106.6 Kab.Kampar 7,073.21 53.55 Kab. Indragiri Hulu 5,368 52.82 Kab. Indragiri Hilir 1,568.62 9.2 Kab. RokanHilir 682.2 3.27
Purnomo et al. (2008) mentioned that the plantations forest of A. mangium and A. crassicarpa are good sources of nectar for honeybee species that continuously available. The nectar is secreted from the plant age of 3 months. Based on the calculation of the potential nectarof A.mangium and A.crassicarpa the nectar potency in such area is about 40-75 litres/hectare/day depend on the standing age. Acacia nectar existence can be seen by the presence of reddish forest honey which is a hall mark of honey derived from then nectar of Acacia (Purnomo et al., 2007). While the low productivity of honey in the forest are near the coast is may be caused by several factors such as, the lack of beeforage plants that produce nectar and physic influence ssuch as exposure tothe strong winds that disrupt the bee flying activity and its communication system(Murphy and Robertson, 2000).
Harvesting of forest honey is also influenced by the rainy and dry seasons. Based on the observation of forest honey showed higher value in the rainy season (148,996 tons) compared to those of dry season (134,420 tons). The differences are probably caused by the improvement need of carbohydrate by A.dorsata colony in the dry season that cannot be full filled by the available nectar by forest plant. So, in the dry season the initial allegations made effect to the low of amount of honey obtained is mainly due to the small number of flowers grows and bloom so as directly proportional effect to the amount of nectar that honeybees can be taken. The influence of the wind and solar radiation intensity also affects to the amount of nectar secretion. It is happened because the nectar will easily dry out with an exposure to sunlight and constant strong winds. According to Anonymous (2012), the amount of flowering formed will decrease during the dry season in the tropics. Most ofthe flowering occurs during the transition from the dry to the rainy season. In the rainy season, the plants will absorb more nutrients and water.
4. HONEY PRODUCTIVITY OF A. CERANA FARMED ON A. crassicarpa AND A. Mangium PLANTATIONS
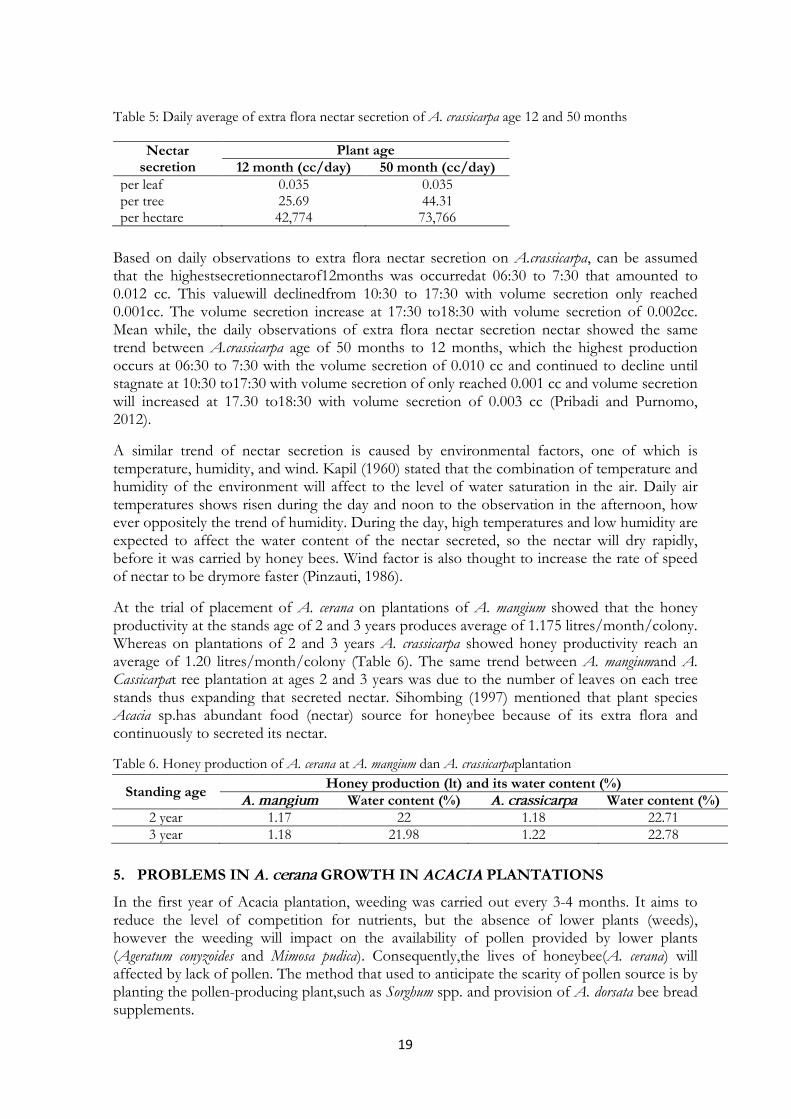
The potency of extra flora nectar secretion of A. crassicarpa showsthat the same value in the whole observed stand age of 12 and 50 months which was about 0.035 cc/day (Table 4). However, in single stand, the nectar volume produce 25.69 cc/day for 12 months and 44.31 cc/day for 50 months. This happen due to the difference in the average of young leaves per stands(734 pieces of leaf/plant for ages 12 months and leaves 1266 / plants to age 50 months).In calculation, 1 hectare extra flora reach about 42.774 cc/day for ages 12 months and 73.766 cc / day for age 50 months (Table 5).
19
Table 5: Daily average of extra flora nectar secretion of A. crassicarpa age 12 and 50 months
Nectar
secretion Plant age
12 month (cc/day) 50 month (cc/day) per leaf 0.035 0.035 per tree 25.69 44.31 per hectare 42,774 73,766
Based on daily observations to extra flora nectar secretion on A.crassicarpa, can be assumed that the highestsecretionnectarof12months was occurredat 06:30 to 7:30 that amounted to 0.012 cc. This valuewill declinedfrom 10:30 to 17:30 with volume secretion only reached 0.001cc. The volume secretion increase at 17:30 to18:30 with volume secretion of 0.002cc. Mean while, the daily observations of extra flora nectar secretion nectar showed the same trend between A.crassicarpa age of 50 months to 12 months, which the highest production occurs at 06:30 to 7:30 with the volume secretion of 0.010 cc and continued to decline until stagnate at 10:30 to17:30 with volume secretion of only reached 0.001 cc and volume secretion will increased at 17.30 to18:30 with volume secretion of 0.003 cc (Pribadi and Purnomo, 2012).
A similar trend of nectar secretion is caused by environmental factors, one of which is temperature, humidity, and wind. Kapil (1960) stated that the combination of temperature and humidity of the environment will affect to the level of water saturation in the air. Daily air temperatures shows risen during the day and noon to the observation in the afternoon, how ever oppositely the trend of humidity. During the day, high temperatures and low humidity are expected to affect the water content of the nectar secreted, so the nectar will dry rapidly, before it was carried by honey bees. Wind factor is also thought to increase the rate of speed of nectar to be drymore faster (Pinzauti, 1986).
At the trial of placement of A. cerana on plantations of A. mangium showed that the honey productivity at the stands age of 2 and 3 years produces average of 1.175 litres/month/colony. Whereas on plantations of 2 and 3 years A. crassicarpa showed honey productivity reach an average of 1.20 litres/month/colony (Table 6). The same trend between A. mangiumand A. Cassicarpat ree plantation at ages 2 and 3 years was due to the number of leaves on each tree stands thus expanding that secreted nectar. Sihombing (1997) mentioned that plant species Acacia sp.has abundant food (nectar) source for honeybee because of its extra flora and continuously to secreted its nectar.
Table 6. Honey production of A. cerana at A. mangium dan A. crassicarpaplantation
Standing age Honey production (lt) and its water content (%) A. mangium Water content (%) A. crassicarpa Water content (%)
2 year 1.17 22 1.18 22.71 3 year 1.18 21.98 1.22 22.78
5. PROBLEMS IN A. cerana GROWTH IN ACACIA PLANTATIONS
In the first year of Acacia plantation, weeding was carried out every 3-4 months. It aims to reduce the level of competition for nutrients, but the absence of lower plants (weeds), however the weeding will impact on the availability of pollen provided by lower plants (Ageratum conyzoides and Mimosa pudica). Consequently,the lives of honeybee(A. cerana) will affected by lack of pollen. The method that used to anticipate the scarity of pollen source is by planting the pollen-producing plant,such as Sorghum spp. and provision of A. dorsata bee bread supplements.

20
Colony health parameter of A. cerana can be seen by the percentage of crude protein (CP) of bee worker’sbody. The result shows that the A. cerana placed on the area of the A. mangium plantation which intercropped with sorghum showshigher value of CP by 58% and significantly different from A.cerana which are not intercropped with sorghum (31.90%) (Table 7).
Table 7. The content of crude protein (CP) of A. cerana that placed on Sorghum spp. plantation and without Sorghum spp. plantation.
Observations Percentage of crude protein of A. cerana worker Place on Sorghum spp. No Sorghum spp.
1 2 3 4
56.76 57.00 58.44 59.80
31.60 33.20 31.30 31.50
Averages 58.00* 31.90
A standardof healthy honeybee by Kleinschmidt and Kondos (1976) was the body of worker bee should contains 40% to 67% CP. Getting a range of over 40%, honeybee colonies should consume a minimum quality of pollen that contains at leastof 18% protein. Pollen from sorghum based on proximate analysis content of 18.68%.
According Mourizio (1975), pollen is protein forage that is needed by brood growth and development adult honeybees. In addition, pollen also contains fats, vitamins and minerals which are essential nutrients for the honeybees. According to Dietz (1975), the protein in pollen serves as the material for the formed of hypopherengeal gland located at the caput of workerhoneybee that serve a shaper of royal jelly for the queen.Cale andR uthenbuhler (1975) stated that for young honeybee, the protein will affected to hypopharengeal gland which then affects the bee's ability to form food for the larvae and queen bees.
The low productivity of honey in the lack location of pollen source will result in less eager to move to find the source of nectar. Furthermore, the pollen also affects the number of honeybee colony (due to the lack of abilityto lay eggs for queen). This will result in low production of honey produced from A. cerana which fell into 61.4% when compared to colonies that were given supplements such as bee bread of A. dorsata.
6. CONCLUSIONS
1. Forest honey harvesting techniques that used in Riau are (1) the “latak” installation conducted by the handler, (2) releasing the bee hive using traditional smoker, (3) cutting all strokes nests using bamboo knife, (4) dropping off the honey comb using container (ubol) that made of rattan, and (5) extracting and filtering.
2. After harvesting (on 28th day observation), the rest of honey stroke done through the cleaning process had a higher value (1260 cm2) if compared to the honey stroke which was uncleaned (960 cm2). The similar trend was seen in pollen and brood strokes which had higher values through the cleaning process compared to the uncleaned process.
3. The phenomenon of sialang tree in Riau instant tends to widely distribute to rural areas (middle to west district in Riau province) and the other wise distribution of sialang tree on the district closed to the coast is low. Similar trends occurred in the distribution of A. dorsata colony and forest honey productivity.

21
4. There are two districts that have highest forest honey productivity over 100 tons/year, there are Pelalawan (108.5 tons/year) and Kuantan Singingi (106.6 tons/year). Overall total honey productivity forest honey in Riau reached 438.75 tons in year 2008.
5. Placement of A.cerana on A. mangium plantations at the age of 2 and 3 years showed that honey productivity is 1.175liters/month/colony. Mean while honey productivity at A. crassicarpa plantation at age 2 and 3 years reach 1.20liters/month/colony.
6. Scarcity of pollen on plantation forest of A.mangium and A.crassicarpa result in lower CP of worker bees that will impact to the low productivity of honey produced by A.cerana to 61.4%.
7. REFERENCES
Anonymous.2012. Pembungaan (flowering). http:/ www.sanoesi.wordpress.com. Acces at July 13rd, 2012 . Cale, G.H and Ruthenbuhler, W.C. 1975. Genetics and Breeding of the Honey Bee. Dadant and Sons Hamilton, Illonois. Dietz, A. 1975. Nutrition of the Adult Honey Bee. Dadant and Sons Hamilton, Illonois Ditjen RLPS, 2001.Data Produksi Madu Indonesia tahun 1997 s.d 2000. http://www.dephut.go.id/informasi/Statistik/2001. Kapil, R.P. 1960. Observations of Temperature and Humidity to Apisindica. Journal of Apic Italy (27); pg 79-83 . Kleinschmidt, G.J. and Kondos, A.C. 1976. The influence of crude protein levels on colony production. Australian Beekeeping 80. pp: 251-257. Mujetahid, M.A. 2007. Technique of Forest Honeybee Harvesting Praticed by Local Community around the Forest Area in District of Mallawa, Regency of Maros.Jurnal Perennial, 4(1) : 36-40. Murphy, C and Robertson, A. 2000. Preliminary study of the effects of honey bees (Apis mellifera) in Tongariro National Park. Department of Conservation, Wellington Pinzauti, M. 1986. The Influence of the Wind on Nectar Secretion from the Melon and on the Flight of Bees: The Use of an Artificial Wind Break. J. Apidologie 17 (1); pp: 63-72. Pribadi, A dan Purnomo. 2012. Introduksi Lebah Apis cerana pada Hutan Tanaman Industri jenis Acacia crassicarpa di Provinsi Riau. Prosiding Seminar Nasional HHBK: Peranan Hasil Litbang HHBK dalam Mendukung Pembangunan Kehutanan, Mataram. Purnomo, Rochmayanto, Y., Junaedi, A., Aprianis, Y., dan Suhendar. 2007. Peta Sebaran Koloni Lebah Hutan (Apis dorsata) dan Data Produksi Madu di Riau ed 1. Laporan Hasil Penelitian Balai Penelitian Hutan Penghasil Serat, Kuok. Tidak dipublikasikan.

22
Purnomo, Rochmayanto, Y., Junaedi, A., Aprianis, Y., dan Suhendar 2008. Peta Sebaran Koloni Lebah Hutan (Apis dorsata) dan Data Produksi Madu di Riau ed 2. Laporan Hasil Penelitian Balai Penelitian Hutan Penghasil Serat, Kuok. Tidak dipublikasikan. Purnomo. 2010. Potensi Nektar Pada Hutan Tanaman Jenis Acacia crassicarpa untuk Mendukung Perlebahan. Laporan Hasil Penelitian Balai Penelitian Hutan Penghasil Serat, Kuok (tidak dipublikasikan). Rennich, K., Petitis, J., 2, Vanengelsdrop, D. and Hayes J., 2011. National Honey Bee Pests and Diseases Survey Report. Pennsylvania State University, Pennsylvania. Riak Bumi Foundation, 2012.Forest Honey.http://www.riakbimi.or.id. Acces on June 6th 2013 Sihombing, D.T.H., 1997. Ilmu Ternak Lebah Madu. Gajah Mada University Press, Yogyakarta. Starr K. C., Schmidt, J.P., and Schimdt, J.O. 1987. Nest-site Preference of Giant Honey Bee, Apis dorsata (Hymenoptera: Apidae), in Borneo. Pan-Pasific Entomologist 63(1); pp: 37-42. Thomas, D., Pal, N. and Rao, K.S. 2002. Bee Management and Productivity of Indian Honeybees. Journal of Apiculture in Tropical Climates (Apiacta) vol:3.
23
INAFOR A-0016
THE SECOND INTERNATIONAL CONFERENCE OF INDONESIA
FORESTRY RESEARCHERS
THE 2nd INAFOR, 27-28 AUGUST 2013
Farmers Participation in Land and Forest Rehabilitation: A Case Study of Upstream Ciliwung Watershed
Heru Permana1, Bondan Winarno2, Takao Katsuki3 and Saut Sagala4
1 Kahayan Watershed Management Unit; Directorate General of Watershed Management and Social
Forestry, Ministry of Forestry; 2 Forestry Research Institute of Palembang
3Graduate School of Policy Science; Ritsumeikan University 4School of Architecture, Planning, and Policy Development; ITB
Coresponding email: [email protected] and [email protected]
Paper prepared for The Second International Conference of Indonesian Forestry Researches (INAFOR)
27-28 August 2013
INAFOR SECRETARIAT Sub Division of Dissemination, Publication and Libarary
FORESTRY RESEARCH AND DEVELOPMENT AGENCY Jl. GunungBatu 5, Bogor 16610

24
Farmers Participation in Land and Forest Rehabilitation: A Case Study of Upstream Ciliwung Watershed
Heru Permana1, Bondan Winarno2, Takao Katsuki3, and Saut Sagala4
1 Kahayan Watershed Management Unit; Directorate General of Watershed Management and Social Forestry, Ministry of Forestry;
2 Forestry Research Institute of Palembang 3Graduate School of Policy Science; Ritsumeikan University
4School of Architecture, Planning, and Policy Development; ITB Coresponding email: [email protected] and [email protected]
ABSTRACT The aims of Land and Forest Rehabilitation (LFR) are to maintain forest functions and to reach welfare for community surrounding forest area which consists mainly of farmers. Consequently, the main actor of LFR is dominated by the farmers. Therefore, farmers participation is essential to implement LFR programs. The purpose of the research is to describe farmers participation in conducting LFR activities and to improve farmers participation in preserving and maintaining forest functions in upstream Ciliwung Watershed, West Java, Indonesia. The research examines about facts and figures in the study location and correlation among social economic variables related with farmers’ participation. Megamendung and Tugu Utara Village are selected as the sample to collect data regard to farmers’ participation. This research use qualitative and quantitative analysis. In order to define level of farmers’ participation, scoring methods are used. Moreover, questionnaire and interviews are used to collect data about farmers’ involvement in every stage of land and forest rehabilitation activities. The result reveals that farmers have high participation due to their involvement in all stages of LFR (Planning, Implementation, Monitoring-Evaluation, and Utilization). The study is expected to be input for supporting strategies to enhance farmer participation in developing LFR considering socio economic aspects and to increase people awareness in preserving forest as well. Keywords: Farmers Participation, Land and Forest Rehabilitation, Upstream Ciliwung Watershed
1. INTRODUCTION
Recently, the conditions of the forests in Indonesia have been deteriorating, because of the human need for land and natural resources. However, forests play important role in human life mainly due to their function as production forests, protection forest, and conservation forest (Act No. 41/1999). Indonesia has suffered degraded forest land caused by illegal logging, forest fires, forest conversion, unplanned agricultural expansion, and social conflict over forest resources (Nawir et al., 2007). Related with these conditions, Government of Indonesia (GoI) has issued many policies in land and forest rehabilitation such as Forest Community, Social Forestry, National Movement of Land and Forest Rehabilitation (GERHAN), One Man One Three (OMOT), One Billion Indonesian Trees (OBIT), etc. In addition Perhutani (as a State Owned Enterprise) also has applied forest management based community.
The approach of the programs has been shifted from top-down to bottom-up as response for the improvement of the programs. Top down-approach has shown the failed of the programs

25
to solve the problem in forest development and social economics. Therefore, participative planning was built based on bottom up approaches (Nawir et al., 2007; Nomura, 2008). As one of the effective approaches, participation of local communities is required in forest management (Faham et al., 2008). In term of bottom-up planning, the community as the subject of land and forest rehabilitation programs is very important. This is because the aims of land and forest rehabilitation are to maintain forest functions and to obtain welfare for the community in the surrounding forest area (Government Rules No. 76/2008, Ministry of Forestry Regulation No. P. 70/Menhut-II/2008). Further, the community around forest area consists mainly of farmers and their participation is needed as the main actors of land and forest rehabilitation. Participation is known as one of the principles in ecosystem-based approaches to river rehabilitation (Hilman et al., 2005).
In Indonesia, the Ciliwung River is one of the biggest rivers in West Java which has important roles in supporting a variety of human and economic activities. Water pollution, lack of fresh water, flood, and critical land in Ciliwung River are becoming the main issues. Moreover, the capacity of this river tends to decline. In several researches indicated that land use changes are the main problem affecting the flooding of the Ciliwung River. The forest area in Ciliwung Watershed was 9 % of total area; meanwhile housing and plantation are 23.80% and 19.28% respectively (Rusdiana et al., 2003). The forest area in Ciliwung Watershed which was merely 9% may cause floods and landslides (Surat Kabar Pikiran Rakyat, 2010). However, according to Spatial Plan regulation (Act No. 26/2007) and Forestry regulation (Act No. 41/1999) a watershed must cover at least 30% of green area including forest area in order to avoid disasters such as floods, landslides, drought, etc.
Mainly, forests are located in upstream areas functioning as flood control for downstream (Sherman, 1928; Asdak, 2002). To maintain forests functions in the upstream and to minimize forest conversion, the role of farmers is very essential. Farmers living in the upstream of Ciliwung Watershed should participate in preservation and rehabilitation of forest areas. In addition, land and forest rehabilitation is related with long-term activity, so that it requires a strong commitment in conducting this activity and it also depends on social economic aspects. Furthermore, the farmers perspective always wants to get benefits instantly, therefore there must be alternative livelihoods to support their life (Zhang et al., 2009). Farmers participation is reflected as one of the most critical principles in forest development projects (Blay et al., 2008). Without participation from them, the government will be immobilized. In Ciliwung context, no study has identified the factors influencing farmers participation in conducting land and forest rehabilitation.
Conflict may occur when participation and willingness of the farmers to rehabilitate land and forest are decrease. In this case, social and economic aspect can be the main cause (Zhang et al., 2009; Faham et al., 2008). Since land and forest rehabilitation program has not considered social and economic aspects, its objectives will not be reached. Moreover, farmers are often neglected in decision making process regarding land and forest rehabilitation program (BPDAS Citarum-Ciliwung, 2003). Although, initially they propose to government institutions to involve in land and forest rehabilitation, they are only asked to participate when implementation has just begun. Thereby, the farmers are not interested in participating in land and forest rehabilitation. Based on the condition in the Ciliwung Watershed, the objective of this research are to identify and analyze level of farmers’ participation in upstream Ciliwung watershed in planning, implementation, monitoring and evaluation, and utilization stage in land and forest rehabilitation.
26
2. METHODS 2.1. Location of Study
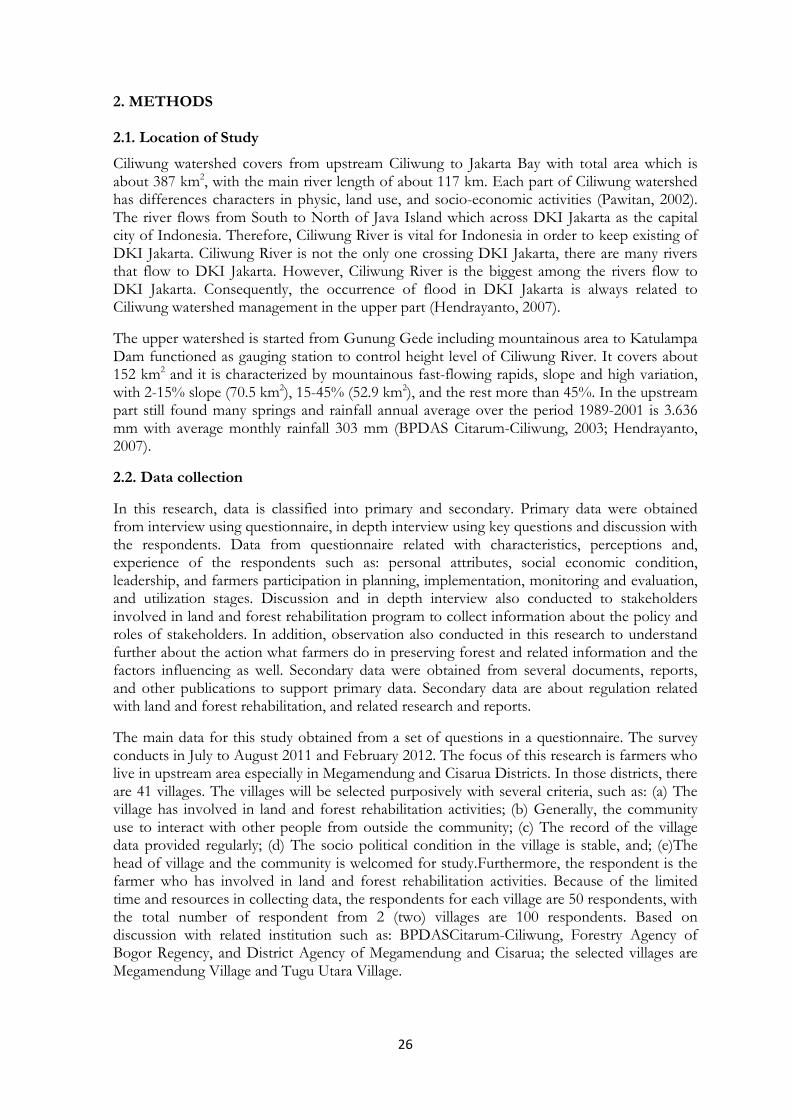
Ciliwung watershed covers from upstream Ciliwung to Jakarta Bay with total area which is about 387 km2, with the main river length of about 117 km. Each part of Ciliwung watershed has differences characters in physic, land use, and socio-economic activities (Pawitan, 2002). The river flows from South to North of Java Island which across DKI Jakarta as the capital city of Indonesia. Therefore, Ciliwung River is vital for Indonesia in order to keep existing of DKI Jakarta. Ciliwung River is not the only one crossing DKI Jakarta, there are many rivers that flow to DKI Jakarta. However, Ciliwung River is the biggest among the rivers flow to DKI Jakarta. Consequently, the occurrence of flood in DKI Jakarta is always related to Ciliwung watershed management in the upper part (Hendrayanto, 2007).
The upper watershed is started from Gunung Gede including mountainous area to Katulampa Dam functioned as gauging station to control height level of Ciliwung River. It covers about 152 km2 and it is characterized by mountainous fast-flowing rapids, slope and high variation, with 2-15% slope (70.5 km2), 15-45% (52.9 km2), and the rest more than 45%. In the upstream part still found many springs and rainfall annual average over the period 1989-2001 is 3.636 mm with average monthly rainfall 303 mm (BPDAS Citarum-Ciliwung, 2003; Hendrayanto, 2007).
2.2. Data collection
In this research, data is classified into primary and secondary. Primary data were obtained from interview using questionnaire, in depth interview using key questions and discussion with the respondents. Data from questionnaire related with characteristics, perceptions and, experience of the respondents such as: personal attributes, social economic condition, leadership, and farmers participation in planning, implementation, monitoring and evaluation, and utilization stages. Discussion and in depth interview also conducted to stakeholders involved in land and forest rehabilitation program to collect information about the policy and roles of stakeholders. In addition, observation also conducted in this research to understand further about the action what farmers do in preserving forest and related information and the factors influencing as well. Secondary data were obtained from several documents, reports, and other publications to support primary data. Secondary data are about regulation related with land and forest rehabilitation, and related research and reports.
The main data for this study obtained from a set of questions in a questionnaire. The survey conducts in July to August 2011 and February 2012. The focus of this research is farmers who live in upstream area especially in Megamendung and Cisarua Districts. In those districts, there are 41 villages. The villages will be selected purposively with several criteria, such as: (a) The village has involved in land and forest rehabilitation activities; (b) Generally, the community use to interact with other people from outside the community; (c) The record of the village data provided regularly; (d) The socio political condition in the village is stable, and; (e)The head of village and the community is welcomed for study.Furthermore, the respondent is the farmer who has involved in land and forest rehabilitation activities. Because of the limited time and resources in collecting data, the respondents for each village are 50 respondents, with the total number of respondent from 2 (two) villages are 100 respondents. Based on discussion with related institution such as: BPDASCitarum-Ciliwung, Forestry Agency of Bogor Regency, and District Agency of Megamendung and Cisarua; the selected villages are Megamendung Village and Tugu Utara Village.

27
2.3. Data Analysis
This research use qualitative and quantitative analysis. Qualitative analysis use to explain the quantitative result. In order to define level of farmers‟ participation, scoring methods will be used. Farmers participation in land and forest rehabilitation is divided into 4 (four) activities which are (1) Planning Activities; (2) Implementation Activities; (3) Monitoring-Evaluation Activities; and (4) Utilization Activities. To define the level of farmers’ participation, a set of questions in the form of a statement will be used, then the answer will be rated on a five-point scale from 1 to 5. Thus, the score will be calculated based on the activities. The score then is converted into percentage; based on the percentage, the level of farmers participation will be classified into 3 (three) levels: (1) High Participation; (2) Medium Participation; and (3) Low Participation.
0% 33.3% 66.6% 100%
Low Medium High
The tools to justify the level of farmers’ participation in case studies are shown in
Table 1.
Table 1. Explanations of level of farmers’ participation in land and forest rehabilitation
Stages Activities Level of Farmers Participation
Planning Stage 1. Making Proposal/Plans 2. Forming groups 3. Electing committee 4. Selecting site 5. Selecting plants 6. Having a vote in decision
making 7. Influencing decision
Low Not involve in all activities
Medium Only involve in several activities , have a vote but cannot influence decision
High Involve in all activities, have a vote and can influence decision
Implementation Stage 1. Preparing site 2. Delivery seedling to the
site 3. Planting the seedling 4. Maintaining trees 5. Having a vote in decision
making 6. Influencing decision
Low Not involve in all activities
Medium Only involve in several activities, have a vote but cannot influence decision
High Involve in all activities, have a vote and can influence decision
Monitoring-Evaluation Stage
1. Protecting site 2. Monitoring growth of trees 3. Monitoring and evaluation
of planting and maintenance activities
4. Having a vote in decision making
5. Influencing decision
Low Not involve in all activities
Medium Only involve in several activities, have a vote but cannot influence decision
High Involve in all activities, have a vote and can influence

28
Stages Activities Level of Farmers Participation
decision
Utilization Stage 1. Involving in harvesting 2. Involving in marketing 3. Having a vote in decision
making 4. Influencing decision
Low Not involve in all activities
Medium Only involve in several activities, have a vote but cannot influence decision
High Involve in all activities, have a vote and can influence decision
3. RESULTS AND DISCUSSION
3.1. Locations Situation and Respondents Profile
Megamendung Village is located in Megamendung District. The Distance to the capital city of Bogor Regency is 38 Km. Megamendung coversabout 1,200 Ha. In terms of population, the number of residents by gender in 2010 consist of male 3,309 people and female 3,016 people. The total population are 6,325 people with total household 1,833 Families. The population density in Megamendung is 527 people/km2. Livelihoods in Megamendung consist of private sector (850 people/26.23%), carpenter (769 people/23.73%), farmer (545 people/16.82%), farm worker (376 people/11.60%), services (317/9.78%) and, therest are others source of livelihoods. Land use in Megamendung is dominated by Others including forest area owned by Perhutani (668.5 Ha/ 58.11%), and Housing (300 Ha/26.08%). Paddy field and farm area are only 150 ha (13.04%).
Tugu Utara Village is located in Cisarua District. The distance to the capital city of Bogor Regency is 44 Km. Tugu Utara covers about 1,703 Ha. In terms of population,the number of residents by gender in 2011 consist of male 5,338 people and female 4,901 people. The total population is 10,239 people with total household 3,072 Families. The population density in Tugu Utara is 601 people/km2. Livelihoods in Tugu Utara is dominate by entrepreneur/merchant (2,871 people/34.4%) and plantation worker (2,556/30.4%). Farmer, Farm Workers and Plantation Workers are associated with planting activities in tea plantation, agriculture, and forestry sector. Therefore, the total livelihoods related with planting activities are 2,776 people (32.89%). The others work as government officer (7.47%), carpenter (7.46%) and the rest are others livelihoods. land use in Tugu Utara is dominated by forest area (713.6 Ha/41.90 %) and it is followed by tea plantation (531 Ha/31.18 %).
Profiles of the respondents in Megamendung and Tugu Utara Village based on questionaire present in the table below. The total respondents in Megamendung Village and Tugu Utara Village are 100 respondents. Profile respondents include characteristics respondents, socio economics respondents and, resource endowments feature.

29
Table 2. Respondents profile in Megamendung and Tugu Utara Village
No. Aspects / Classification Megamendung Village Tugu Utara Village
Frequency Percent Frequency Percent
1 Amount of Cultivated-Land
<0.25 Ha 6 12.0 8 16.0
0.25 - 0.5 Ha 12 24.0 7 14.0
0.5 - 1.0 Ha 18 36.0 12 24.0
>1.0 Ha 14 28.0 23 46.0
Total 50 100.0 50 100.0
2 Land Status
State Land 21 42.0 38 76.0
Borrowed Land 23 46.0 3 6.0
Rented Land 3 6.0 3 6.0
Owned Land 3 6.0 6 12.0
Total 50 100.0 50 100.0
3 Main Occupation
Vegetable Farmers 18 36.0 25 50.0
Tea Farmers 0 0.0 1 2.0
Forest Farmers 32 64.0 24 48.0
Total 50 100.0 50 100.0
4 Household Monthly Income
<Rp. 1.2 million 45 90.0 32 64.0
Rp. 1.2 - 2.0 million 5 10.0 14 28.0
Rp. 2.001 - 5.0 million 0 0.0 4 8.0
Total 50 100.0 50 100.0
5 Source of Income
Others 18 36.0 3 6.0
Agriculture 17 34.0 26 52.0
Forest 15 30.0 21 42.0
Total 50 100.0 50 100.0
6 Household Monthly Expenditure
<Rp. 1.2 million 21 42.0 30 60.0
Rp. 1.2 - 2.0 million 29 58.0 20 40.0
Total 50 100.0 50 100.0
7 Use of Expenditure
Tertiary Needs (Entertainment) 2 4.0 1 2.0
Secondary Needs (Education) 5 10.0 8 16.0
Daily Needs (Foods) 43 86.0 41 82.0
Total 50 100.0 50 100.0
8 Family Members / Household Size
> 5 persons 6 12.0 12 24.0
3-4 persons 38 76.0 35 70.0
2 persons 6 12.0 3 6.0
Total 50 100.0 50 100.0

30
No. Aspects / Classification Megamendung Village Tugu Utara Village
Frequency Percent Frequency Percent
9 Number of productive members in the family
1 person 25 50.0 29 58.0
2-3 persons 25 50.0 18 36.0
> 3 persons 0 0.0 3 6.0
Total 50 100.0 50 100.0
10 Level of Education
No formal education 9 18.0 1 2.0
Elementary School 29 58.0 20 40.0
Junior High School 10 20.0 23 46.0
Senior High School 2 4.0 5 10.0
University 0 0.0 1 2.0
Total 50 100.0 50 100.0
11 Distance to the LFR location
> 1,000 meter 17 34.0 3 6.0
500 - 1,000 meter 7 14.0 7 14.0
200 - 500 meter 10 20.0 31 62.0
< 200 meter 16 32.0 9 18.0
Total 50 100.0 50 100.0
12 Topographic condition
Extremely Steep 1 2.0 1 2.0
Steep 17 34.0 14 28.0
Moderately Steep 23 46.0 32 64.0
Plain 9 18.0 3 6.0
Total 50 100.0 50 100.0
Based on the above table, there are many similiraities and differences between Megamendung and Tugu Utara Village. The majority of farmers (18 respondents/36%) in Megamendung cultivate land 0.5 Ha to 1.0 Ha due to limited cultivated land, while in Tugu Utara mostly the 46% farmers (23 respondents) cultivate land more than 1.0 Ha. Main job of the farmers in Megamendung mostly forest farmers (32 respondents /64%); however the farmers in Tugu Utara the majority is vegetable farmers (25 respondents/50%) and it is followed by forest farmers (24 respondents /48%). Forest farmers always depend on non timber forest products such as fire wood, etc; while vegetable farmers depend on agricultural products such as tomato, corn, cabbage, etc. Source of income from others sectors (36%) such as merchant, ojeg (motorcycle rent), and villa (rest house/cottage) guard happen in Megamendung and it is followed by agriculture (34%) and forest (30%); in Tugu Utara the income generates from agriculture sectors (52%) and followed by forest (42%).
3.2. Respondents Perception about Land and Forest Rehabilitation
This section will elaborate the perception and knowledge of the respodents which are connected with land and forest rehabilitation. Data about environmental knowledge of the farmers focus on the farmers understanding through several statements regarding the significance of land and forest rehabilitation, its definition, its impact, forest condition in upstream Ciliwung, the reason to involve in land and forest rehabilitation, and land and forest

31
rehabilitation expectation in the future. Table 3 gives details of the results regarding environmental knowledge of the farmers.
Table 3: Environmental knowledge aspect in Megamendung and Tugu Utara Village based on perceptions of the farmers
No. Statements Megamendung Village Tugu Utara Village
Frequency Percent Frequency Percent
1 LFR is very important Neither Agree Nor Disagree 6 12.0 1 2.0 Agree 31 62.0 44 88.0 Strongly Agree 13 26.0 5 10.0
Total 50 100.0 50 100.0
2 Recognize what is LFR
Disagree 1 2.0 0 0.0
Neither Agree Nor Disagree 10 20.0 4 8.0 Agree 34 68.0 41 82.0 Strongly Agree 5 10.0 5 10.0 Total 50 100.0 50 100.0
3 Know the impacts in upstream Ciliwung to the middle and downstream Neither Agree Nor Disagree 9 18.0 1 2.0 Agree 31 62.0 42 84.0 Strongly Agree 10 20.0 7 14.0
Total 50 100.0 50 100.0
4 Deforestation in upstream Ciliwung is severe and worse Disagree 3 6.0 0 0.0
Neither Agree Nor Disagree 7 14.0 7 14.0 Agree 26 52.0 38 76.0 Strongly Agree 14 28.0 5 10.0
Total 50 100.0 50 100.0
5 LFR is one of efforts to recover environment Neither Agree Nor Disagree 2 4.0 0 0.0
Agree 38 76.0 44 88.0 Strongly Agree 10 20.0 6 12.0 Total 50 100.0 50 100.0
6 Involve because the benefits in the future Neither Agree Nor Disagree 8 16.0 1 2.0
Agree 34 68.0 44 88.0 Strongly Agree 8 16.0 5 10.0 Total 50 100.0 50 100.0
7 LFR will grow in the future
Neither Agree Nor Disagree 8 16.0 2 4.0 Agree 35 70.0 44 88.0
Strongly Agree 7 14.0 4 8.0

32
No. Statements Megamendung Village Tugu Utara Village
Frequency Percent Frequency Percent
Total 50 100.0 50 100.0
According to Table 3, most of the farmers agree and strongly agree that land and forest rehabilitation is very important to maintain forest function. The majority of the farmers recognize the land and forest rehabilitation activities, only 10 respondents (20%) in Megamendung and 4 respondents (8%) neither agree nor disagree in Tugu Utara due to merely know several parts of land and forest rehabilitation activities. Moreover, they know the impacts of land and forest rehabilitation in upstream of Ciliwung to middle and downstream such as flooding in downstream can be caused by forest condition in upstream area.Their views regarding forest condition are getting worse and severe because of landuse change into other uses such as housing and agriculture area. Therefore, they realize that land and forest rehabilitation is one of the efforts to recover environment including forest function. Most of the farmers involve because the advantages of land and forest rehabilitation in the future, as a result they expect that it will grow in the future due to economic and ecology benefits.
3.3. Farmers Participation Level The nature and level of farmers participation was determined by their involvement in every stage(planning, implementation, monitoring-evaluation, and utilization); their vote in decision making and their influences in changing the decision.
3.3.1. Planning Stage At planning stage, the activities consists of making proposal, plans, forming groups, electing committee, selecting site, selecting plants, having a vote, and influencing decision making. The result can be seen in Figure 1.
Figure 1: Participation level at planning stage in Megamendung and Tugu Utara Village
According to Figure 1, farmers in Tugu Utara have higher participation than Megamendung. Almost all the farmers in Tugu Utara (98%) involve in all planning activities, have a vote in decision making, and can influence the decision, while in Megamendung only 72% of farmers. It is because the farmers in Tugu Utara has more experience in government project and more understanding in preparing land and forest rehabilitation.
3.3.2. Implementation stage The first activities start with preparing the site based on design and technical planning. Then, it is followed by delivering seedling to the site and planting the seedling afterward. Maintaining the trees including providing fertilizer and pesticides, and replanting the decease trees is one of the important activities in implementation stage. In decision making, the farmers also have
Medium 28%
14 Resp High 72%
36 Resp
Participation Level at Planning Stages in Megamendung Village

33
a vote and to extent the farmers can influence the decision. The results of farmers participation at implementation stage is performed in Figure 2.
Figur
Figure 2: Participation level at implementation stage in Megamendung and Tugu Utara Village
This figure demonstrates the level of farmers participation at implementation stage which is identified that farmers participation in Tugu Utara is higher than Megamendung. The 94% of the farmers in Tugu Utara involve in all activities at implementation, whereas in Megamendung is 70% farmers. The rest of farmers are medium participation due to can not influence the decision and only involve several activities of implementation.
3.3.3. Monitoring-evaluation stage
At monitoring-evaluation stage, the activities consists of protecting site and the plants, monitoring growth of trees, monitoring and evaluation of planting and maintenance activities, having a vote in decision making and influencing decision making in the groups. The comparison between Megamendung and Tugu Utara can be seen in Figure 3.
Figure 3: Participation level at monitoring evaluation stage in Megamendung and Tugu Utara Village
The majority of farmers has high participation in monitoring-evaluation stage with 84 % in Tugu Utara and 62% in Megamendung. Both of them has only 1 respondent (2%) who has low participation. The rest of the farmers has medium participation. Overall, the farmers protect the site and the plants, monitor the growth of trees, and monitor and evaluation the implementation of planting and maintaining activities. Since the government provide the seedling and the others tools, it has to monitor and evaluate the result of implementation stage whether together with the farmers or not. This means government has resposibility to monitor and evaluate in order to measure the realization of implementation activities and continuousness for budgeting in maintenance activity in the following year. The budget for
Medium 30%
15 Resp
High 70%
35 Resp
Participation Level at Implementation Stages in Megamendung
Medium 6%
3 Resp
High 94%
47 Resp
Participation Level at Implementation Stages in Tugu Utara
Low 2%
1 Resp
Medium 36%
18 Resp
High 62%
31 Resp
Participation Level at Monitoring-Evaluation Stages in Megamendung
Low 2%
1 Resp
Medium 14%
7 Resp
High 84%
42 Resp
Participation Level at Monitoring-Evaluation Stages in Tugu Utara

34
maintenance from the government is merely maximum for two years after implementation activities and it depends on the monitoring-evaluation result conducted by government.
3.3.4. Utilization stage
The involvement in utilization stage is measured by farmers participation in harvesting and marketing land and forest rehabilitation products, and a vote existence in decision making and the extent of farmers can influence in the decision. Figure 4 provides the details of farmers participation level at utilization stage in Megamendung and Tugu Utara.
Figure 4: Participation level at utilization stage in Megamendung and Tugu Utara Village
From this figure, the farmers in Tugu Utara has higher participation in exploiting land and forest products. While the trees not yet produce timber, fruits, and other products, the farmers can generate income from annual crops planted sidelines of the trees. Land and forest rehabilitation not only plant trees but also plant annual crops such as vegetables in order to provide the farmers alternative livelihood to fullfill their needs.
3.5. Discussion
The findings reveal that commonly the farmers living in upstream area of Ciliwung watershed are poor with low level education (elementary and junior high school). They are lack of information and job opportunities. Most of them are vegetable and forest farmers with income below wage minimum regional in Bogor Regency and West Java Province. The farmers merely cultivate land less than 2 Ha with 1-2 person productive members in family.
There are five types in land utilization in Megamendung and Tugu Utara Village:
a. Land is owned by the farmers and the benefits are from agricultural crops and the profits are for the owner.
b. Land is owned by outsiders but the local farmers is allowed to use the land called as borrowed land. The profits is for the farmer; and the land owner may give incentives for the farmer because the land is maintained and secured by the farmer.
c. Land is owned by other farmers or outsiders and the farmer rent the land for farming called as rented land. The benefits and profits are for the farmers and/or sharing with the land owner.
d. Land is owned by the state, the farmers can utilize the land based on particular regulations and get the benefits from the land as well. However they cannot have the land and change the land status.
Low 4%
2 Resp Medium
40% 20 Resp
High 56%
28 Resp
Participation Level at Utilization Stage in Megamendung Low
2% 1 Resp
Medium 12%
6 Resp High 86%
43 Resp
Participation Level at Utilization Stage in Tugu Utara

35
e. Land is owned by unknown called as unmanaged land or lahan tidur / gontai, the farmers use the land without permission.
According data of Counseling Agency of Agriculture, Fisheries and Forestry (BP3K : Badan Penyuluhan Pertanian, Perikanan, dan Kehutanan) 2010 in Suwarno (2011), there are arround 7,607 Ha which is divided into 7,228 Ha land owned and 379 Ha ex tea plantation area can be managed by people in Upstream Ciliwung area. Further, the cultivated land area which is4,637 Ha (60.96% of 7,607 Ha) consists of cultivated land for agriculture 3,221 Ha (42,34%), livestock 56 ha (0,01%), fishery 48 ha (0,01%), farming 1.312 ha (17,24%), and the remaining 2.970 ha (39,04%) in form of unmanaged land (lahan tidur/gontai) and river banks area. The data present that unmanaged land area are almost 40%. It is opportunities for the government to implement land and forest rehabilitation in such area. However, it is difficult because the land could be owned by outsiders who live in other areas. Those conditions make land cultivation for the farmers are limited. The limited land cultivation due to 70% to 80% owned by outsiders create access to the land restricted and difficult to be controlled and coordinated in performing land and forest rehabilitation (BPDAS Citarum-Ciliwung, 2003).
Consequently, some of the farmers try to find another source as additional income to fullfill theirs basic needs. Foods as basic needs are essential for them. As a result, some of the farmers also work as merchant, motorcyle rent (ojeg), villa guard and so on. In addition, the other farmers sell their land located near their home to other people to fullfill the needs. Hence, most of lands surrounding the farmers are owned by outsiders. The remaining cultivated lands are usually far from their home range from 200 -500 meters in Tugu Utara and more than 1 km in Megamendung with moderately steep condition. However, their understanding regards to land and forest rehabilitation is important in order to obtain better life economically, socially, and ecologically in the future. It means that, they do not expect only ecological benefits but also socio-economic benefits from land and forest rehabilitation.
The comparison of farmers participation levelof all stages indicate that the level participation in planning stage are the highest. It is followed by participation in implementation stage and monitoring-evaluation stage. The lowest precentage is participation level at utilization stage. Those arise both in Megamendung and Tugu Utara.
Many of people are not willing to participate in government projects because they do not see the benefits of developments and do not have incentive to maintain the project (Mirghani et al., 1995). Based on this argument, the farmers in Megamendung and Tugu Utara has already identify the advantages of land and forest rehabilitation, therefore they are willing to involve in the activities shown by high participation in all stages. However, there are no sufficient incentives to sustain the project due to limited budget from government and also forest need long term to produce its products. This become challenges in forestry sector, how to maintain land and forest rehabilitation outcomes can be sustained and give the welfares for the farmers.
At planning stage, the farmers are very interested to involve due to their expectation that the activities can make better their life in the future both in economic and ecology aspects. The activities consists of making proposal, plans, forming groups, electing committee, selecting site, selecting plants, having a vote, and influencing decision making. The findings show that the majority has involved in the planning stage activities especially in Tugu Utara (Figure 1). It is because Tugu Utara becomes the focus of attention for government and researchers due to its location at the most upper part of Upstream Ciliwung Watershed. So that, the farmers often interact with government officer and researchers, thus it improves their knowledge and information regard to environmental issues.

36
Based on interview, at planning stage the farmers construct proposal together and propose to government in order to obtain several supports such as physical (ie. wage, seedling, tools, etc.) and non physical (ie. policies, suation, etc.). They have a tentative plan regarding land and forest rehabilitation. Basically, the plan is made based on bottom-up approaches. They propose the groups, committee, site, type of plants. After the proposal is accepted by government, the farmers have to sign agreement to distribute rights and responsibilities. Sharing information and knowledge through socialization, discussion and negotiation related with land and forest rehabilitation programs and projects is conducted by government and the farmers.
The implementation activities are performed afterward. The activities are divided into several actions such as preparing the site based on design and technical planning made by government accommodated planning from the farmers groups; delivering seedling to the site; planting the seedling; maintaining the trees by giving fertilizer and pesticides; and replanting the decease trees; having a vote and influencing decision making related with implementation mechanism. The farmers have to responsible for the plants. Therefore, there are willing to do implementation activities. For instance, when the government provides the seedling, the farmers must plant the seedling in their areas based on the technical plan. Usually, some of the farmers do the implementation activities together and the others conduct individually. Though, there is time table and schedule that they have to finish the implementation activities.
The next stage is monitoring-evaluation stage. In this stage, the farmers should take care the trees which planted before by protecting and monitoring the site and the plants either individually or groups. In addition, the government also implement monitoring-evaluation regarding the results of implementation stage. Based on the government evaluation and monitoring results, it will be determined whether the maintenance in the following year can be implemented or not.
Farmers participation level at utilization stage is related with harvesting and marketing the products of land and forest rehabilitation. The government should provide information regarding land and forest rehabilitation products and its uses. If the products can be sold, how to harvest and where the location of the markets. At this stage, the farmers have high participation because they know they can obtain the benefit from the products. The farmers in Megamendung and Tugu Utara usually sell vegetable and fruits in traditional markets directly or sell to the collectors.
From the evidence depict that farmers involvement in all activities begun from planning to utilization stage can enhance farmers participation in land and forest rehabilitation due to understanding the conditions. By knowing the condition and farmers be included in decision making procesess, open and transparents discussions would be followed. As a result, it lead to increasing of farmers participation in land and forest rehabilitation activities.
Most of the farmers groups participate by taking initiatives independently regarding land and forest rehabilitation (LFR). They realize that LFR is important for their future, not only for economic reasons but also for ecological reasons. They develop contacts with external institutions for resources and technical advice they need such as Government -Local and Central Government; and State Owned Enterprise –Perhutani. Their participation can implement if a frame work to support exist due to related with government policies. Based on Pretty (1995), the farmers participation in this context can be categorized in Self-Mobilization.In fact, the farmers cannot participate totally indepedently because they need structure and programs from the government to facilitate their participation particularly in implementing land and forest rehabilitation.

37
Lise (2000) argued that the government should take the initial actions because of possessing resources including policies and frameworks. It does not mean that top-down approach should be applied. The process should occur from the farmers where high participation is most likely take place (as shown in the results). The interaction between government and farmers should create win-win situation as well as the important of transparency and legal rights for the people in obtaining success.
Additionally, based on Arnstein (1969), it is can be seen from sharing responsibilities –partnership-, a negotiation -delegated power- as well between the farmers and government in terms of land and forest rehabilitation activities such as compromise in deciding types of plants, deciding site for project, managing the project, etc. Further, power is in fact rearrangedthrough negotiation between the farmers and government.They agree to share planning and decision-makingresponsibilities in performing land and forest rehabilitation.
However, farmers still can not controls everything, the farmers cannot decide in planning stage regarding design and scale of project, type of plants, and site for the project; and evaluation stage regarding the successful level of project. It means citizen controls would not be seen, because the farmers does not have full power to manage all aspects especially in technical aspects. For instance, they are not free to choose the types of forestry plants due to suitability climate and land condition, therefore there was a negotiation between government and the farmers at planning stage. The government will establish the forestry plants according to study results and regulations considering farmers aspirations and local knowledge.
On the other hand, the farmers can decide nontechnical aspects in such as selecting the members of farmers groups, deciding rules in the groups, deciding on sanctions for those who not participate actively, raising internal funds, distributing labor work, protecting plants activities, etc. In other wordsthese decisions are likely to involve less technical/engineering input and a local knowledge of the community (Khwaja, 2004). At implementation stage, the role of local knowledge is crucial because the farmers know their capacity in administering implementation activities.
Some conditions could be as obstacles to achieve citizen control, such as the unwillingness to distribute power from government and the lack of skills and knowledge of the have nots –The Farmers (Arnstein, 1969). This happen both in Megamendung and Tugu Utara, the government have more power than the farmers in technical aspects in order to make the outcomes of land and forest rehabilitation be achieved because the farmers have limited resources and skills.
In the future, it is expected that the farmers can make decision not only in nontechnical aspects but also in technical aspects. By increasing their ability and knowledge through training, assistance, and technology supports toward empowerment of farmers institutions as the grass roots, the bottom-up planning can be implemented totally to achieve the successfully of land and forest rehabilitation.
Overall, this means that farmers participation can affect land and forest rehabilitation outcomes. The farmers involvement and their willingness to participate have effect to the outcomes. Since government do not provide incentives for long term, the outcomes depend on the willingness from the farmers to maintain and preserve the trees as the outcomes; it happens in Tugu Utara case. The derived motivation from the farmers in Megamendung and Tugu Utara is not only economic benefits but also ecological benefits.
Participation level according to Arnstein (1969) are built based on the distribution of power between the powerholders and the have-not. The highest level is that citizen can control and

38
manage all aspects in development activities. However, based on the findings and analysis, citizen controls will not occur in Ciliwung context due to the government has more ability and capacity to carry out land and forest rehabilitation. It means that the government is the driver of land and forest rehabilitation while the farmers are the engine who have high participation and power to involve in land and forest rehabilitation. Therefore, the implication is that this is good opportunities for the government to facilitate the farmers in rehabilitating land and forest by considering socio-economic aspects in order to achieve forest sustainability and farmers welfare.
4. CONCLUSIONS
a. The level of farmers participation in implementing land and forest rehabilitation in
upstream Ciliwung especially in Megamendung and Tugu Utara Village are High. This condition can increase the accelaration of land and forest rehabilitation programs, so that it is good opportunities for the government to be more facilitate the farmers in conducting land and forest rehabilitation. It means that the governmentperforms as “the driver”and “the facilitator”while the farmers act as “the engine” and “the executor”.
b. Farmers involvement in all stages (Planning, Implementation, Monitoring-Evaluation, and Utilization) can enhance farmers participation in land and forest rehabilitation due to they know and understand the story and the condition from the beginning until the end of project within open and transparancy atmosphere.
c. Eventhough the farmers have high participation, they cannot control everything due to resources limitations, therefore they cannot decide in several activities of planning regarding design and scale of project, type of plants, and site for the project; and evaluation stage regarding the successful level of project. However, they can decide non-technical aspects which need more a local knowledge of the community. The local knowledge is crucial in managing and organizing the groups due to the farmers know their environments and capabilities.
5. REFERENCES
Act No. 26/2007 about Spatial Plan
Act No. 41/1999 about Forestry
Anonimous (2003): Laporan Akhir: Rencana Pengelolaan DAS Terpadu DAS Ciliwung. Kerjasama BPDAS Citarum-Ciliwung dan Fakultas Kehutanan Institut Pertanian Bogor. Bogor.
Anonimous(2010): Hutan di DAS Ciliwung Kritis. Surat Kabar Pikiran Rakyat, 30 Maret 2010. Pikiran Rakyat Online accesed 11th January 2011. Bandung.
Arnstein, S., R. (1969): A ladder of citizen participation. Journal American Institut of Planners. Vol. 35. Pp. 216-224.
Asdak, Chay (2002): Hidrologi dan Pengelolaan Daerah Aliran Sungai. Gadjah Mada University Press. Yogyakarta.
Bappenas (2007): Laporan Perkiraan Kerusakan dan Kerugian Pasca Bencana Banjir Awal Februari 2007 di Wilayah JABODETABEK. Bappenas. Jakarta.
39
Blay, D., Appiah, M., Damnyag, L., Dwonoh, KF., and Luukkanen, O. (2008): Involving local farmers in rehabilitation of degraded tropical forests: some lessons From Ghana. Journal Environment Development Sustainability. Vol. 10. Pp. 503-518.
BPDAS Citarum-Ciliwung (2003): Rencana Pengelolaan DAS Terpadu DAS Ciliwung. Bogor: Kerjasama BPDAS Citarum-Ciliwung dan Fakultas Kehutanan IPB.
BPDAS Citarum-Ciliwung (2007): Monitoring dan Evaluasi Daerah Aliran Sungai Ciliwung untuk Pengendalian Banjir Tahun 2007. BPDAS Citarum-Ciliwung. Bogor.
BPDAS Citarum-Ciliwung (2009): Statistik BPDAS Citarum-Ciliwung Tahun 2008. BPDAS Citarum-Ciliwung. Bogor.
BPDAS Citarum-Ciliwung (2010): Data Lahan Kritis DAS Ciliwung 2009. BPDAS Citarum-Ciliwung. Bogor.
Faham, E., Rezvanfar, A., and Shamekhi, T. (2008): Analysis of socio-economic factors influencing forest dwellers’ participation in reforestation and development of forest areas (The case study of West Mazandaran, Iran). American Journal of Agricultural and Biological Sciences.Vol 3 (1): Pp. 438-443.
Government Rules No. 76/2008 about Forest Rehabilitation and Reclamation. Indonesia.
Hendrayanto (2007): Transboundary watershed management: a case study of upstream-downstream relationship in Ciliwung Watershed. International Workshop on Integrated Watershed Management For Sustainable Water Use in A Humid Tropical Region (pp. 8-11). Tsukuba: JSPS-DGHE Joint Research Project. .
Hilman, M., and Brierley, G. (2005): A critical review of catchment-scale stream rehabilitation programmes. Journal Progress in Physical Geography. Vol. 29. Pp. 50-70.
Khwaja, I. A. 2004. Is increasing community participation always a good thing? Journal of The European Economic Association. Vol. 2 (2-3). Pp. 50-70.
Lise, Wietze (2000): Factors influencing people’s participation in forest management in India. Journal Ecological Economics. Vol. 34. Pp. 379-392.
Megamendung Village Office (2011) : Profile of Megamendung Village 2011. Megamendung Village. Bogor Regency.
Ministry of Forestry (2008): Minister of Forestry Regulation No. P. 70/Menhut-II/2008 about Technical Guidances of Land and Forest Rehabilitation. Jakarta.
Ministry of Forestry (2009): Executive Data Strategis Kehutanan. Ministry of Forestry. Jakarta.
Ministry of Forestry (2009): Minister of Forestry Decree No. SK. 328/Menhut-II/2009 about Watershed Priority of Mid-term Development Planning 2010 to 2014. Ministry of Forestry. Jakarta.
Ministry of Forestry (2009): Minister of Forestry Regulation No. P.42/Menhut-II/2009 about General Pattern, Criteria and Standard of Integrated Watershed Management. Ministry of Forestry. Jakarta.
Mirghani, MMO., Savenije, HHG. 1995: Incorporation of people’s participation in planning and implementation of water resources projects. Journal Physical, Chemical, Earth. Vol. 20 No. 3-4. Pp. 229-236.
Nawir, A., Ani, Murniati, and Rumboko, Lukas (2007):Forest Rehabilitation in Indonesia; Where to After More Than Three Decades?. Center for International Forestry Research (CIFOR). Jakarta.
Nomura, Ko (2008): The politics of participation in forest management: A Case from Democratizing in Indonesia. The Journal of Environment and Development. Volume No. 17 Number 2. Pp. 166-191. June 2008. Sage Publications.

40
Pawitan, H (2002): Hidrologi DAS Ciliwung dan Andilnya Terhadap Banjir di Jakarta. Makalah. Lokakarya Pendekatan DAS dalam Menanggulangi Banjir Jakarta. Lembaga Penelitian IPB bekerjasama dengan Andersen Consult, Jakarta, 8 Mei 2002.
Pretty N., J., Guijt I., Scoones, I. and Thompson, J (1995): A Trainers' Guide to Participatory Learning and Interaction. IIED Training Materials Series No. 2.IIED, London.
Pretty, N., J(1998): Participatory Learning for Integrated Farming. Sustainable Agriculture Program, International Institute for Environment and Development. London.
Rusdiana, Omo., Sudaryanto., Ichwandi, Iin., Arifjaya, M., Nana., Hendrayanto., and Soekmadi, Rinekso (2003): Hubungan Kerjasama Institusi dalam Pengelolaan Daerah Aliran Sungai; Kasus: DAS Ciliwung. Fakultas Kehutanan IPB. Institut Pertanian Bogor.
Sherman, E. A. (1928): What forests can do for the Mississipi River. American Academy of Political and Social Science. Vol. 135. Pp. 45-49.
Statistical Agency of Bogor Regency (2010):Bogor Regency in Figure 2009. Cibinong, Bogor.
Suwarno, J (2011): Pengembangan Kebijakan Pengelolaan Berkelanjutan DAS Ciliwung Hulu Kabupaten Bogor. Disertasi. Sekolah Pascasarjana. Institut Pertanian Bogor.
Tugu Utara Village Office (2012): Monografi of Tugu Utara Village 2012. Tugu Utara Village. Bogor Regency.
West Java Province (2010): West Java Governor Decree No. 561/Kep. 1564-Bangsos/2010 about Minimum Wage of Regencies and Cities in West Java 2011. Bandung.
Zhang, Chunli., Robinson, Daniel., Wang, Jing., Liu, Jibin., Liu, Xianohui., and Tong, Lianjun (2009): Factors Influencing Farmers’ Willingness to Participate in The Conversion of Cultivated Land to Wetland Program in Sanjian National Nature Reserve, China. Springer Science and Business Media.
41
INAFOR A-0027
THE SECOND INTERNATIONAL CONFERENCE OF INDONESIA FORESTRY RESEARCHERS
THE 2nd INAFOR, 27-28 AUGUST 2013
Environmental Wisdom of Local Communities Malind Anim Tribes in Natural Resources Management at Merauke Region
Papua Province
Dendy Sofyandy
USAID-IFACS Jalan. Dendeuw, No. 2
99772, Asmat-Papua, Indonesia
Paper prepared for The Second International Conference of Indonesian Forestry Researchers (INAFOR)
27-28 August 2013
INAFOR SECRETARIAT Sub Division of Dissemination, Publication and Library
FORESTRY RESEARCH AND DEVELOPMENT AGENCY

42
Jl. Gunung Batu 5, Bogor 16610
Environmental Wisdom of Local Communities Malind Anim Tribes in Natural Resources Management at Merauke Region Papua Province
Dendy Sofyandy
USAID-IFACS
Jalan. Dendeuw, No. 2 99772, Asmat-Papua, Indonesia
Corresponding email: [email protected] ABSTRACT
This paper was conducted in the area of Local Communities Malind Anim Tribe in Merauke Region. Based on Republic of Indonesian Law No. 32/2009; about Protection and Environment Management that the preservation of environmental functions can be done by developing and maintaining the culture and local wisdom of local communities. Merauke is one of the national investment goals and plans for the establishment of South Papua Province will have an impact on environmental conservation. Study uses survey methods to technique literature study, observation, interviews and documentation, and then combined with the method of PRA and FGD. Processing and analyzing the data using qualitative analysis. Malind Anim recognize local communities customary zoning in the legend of the creation of human beings based on four cardinal directions, namely; customary "Sosom", "Imoh", "Mayo" and "Ezam" and handed down this knowledge passed on from generation to generation. Malind Anim can be divided into sub-tribes based on language use is a sub tribe Marind, Kanume, Yeinan, Khima-ima, Maklew, and Marory Men-Gey. Understanding the environment is known in the teachings of Totemism where there kinship between nature, humans, plants and animals. Areas that are considered include the preservation of sacred sites, ancestor transits and routes, where the mythology, the old village, sago areas, hunting and forest springs. Distribution landscape of Local Communities includes, mangrove areas, swamp forest, and forests.
Keywords: Malind Anim, Environmental Wisdom, Local Community, Totemism, Landscape
1. INTRODUCTION
Special autonomy granted to Papua Province and the planned establishment of South Papua Province which swore in 2007 and which includes the Merauke, Asmat, Mappi and Bouven Digoel regency give a big determining the rapid development in Merauke. Based on the Law of the Republic of Indonesia Number 32 of 2009 on the Protection and Management of the Environment, said that developing and maintaining culture and local wisdom in order to preserve the environment.
Cultures of indigenous peoples have had knowledge of environmental management long time before the concept of conservation or ecological introduced scientifically. Cultural wisdom of local communities in environmental management is a basic knowledge that when combined with the concepts of environmental management science, will be produce a new model of environmental management for more effective. Indigenous discourse goes with the history of modern colonialism around the sixteenth century ago. Since that time they inhabit a territory and then dominated and colonized. By the colonialists was referred to as indigenous, native or aboriginal. In today's view of indigenous development more broadly refers to the heir who

43
inhabits the region, namely the view to an area that has been inhabited long before colonized or dominated by a foreign nation, which now has been dominated by foreign nations or other tribes.
Approximately 6,000 cultures in the world, 4000-5000 are including the indigenous peoples. This means that they constitute 70-80 percent of all people in the world cultures. It's a big number amount that should not be underestimated, although within the framework of economic domination and advancement of science and modern technology, indigenous people are always marginalized and ignored (The World Conservation Union, 1997).
Local people are groups of people who for generations lived in a particular geographic area because of the ties to ancestral origin, the existence of a strong relationship with the environment, as well as a system of values that determine economic institutions, political, social, and legal, (Act Law of the Republic of Indonesia Number 32 of 2009).
Physical and emotional closeness people with knowledge of the natural resources spawned its own natural resources, which in turn gave birth to the knowledge of traditional wisdom. Traditional knowledge is cultural knowledge possessed certain population groups include models of sustainable natural resource management, including how to maintain a relationship with nature, through use and responsible wise (Zakaria 1994; Widjono 1998).
Knowledge of the characters including the management and utilization of resources for generations practiced in everyday, this kind of knowledge is often referred to by local knowledge or indigenous knowledge systems. Local knowledge is dynamic, interacting with external factors with a set of information and knowledge that has a different value system. As far as the two interact balanced and dialectical then the local geniuses can adopt and innovate for the enrichment of local knowledge. But what actually happened was beyond even displace the dominance of local knowledge so that it appears that a drastic change (Baiquni, 2007).
In Indonesia there is a wide range of knowledge system about the of natural resource management. Nearly, every tribe or ethnic group has its own traditional knowledge systems has even spawned innovation environment management and utilization of natural resources based on typical local custom. Generally, traditional communities to manage natural resources to achieve ecological balance or ecological equilibrium. The usual management is conducted through the social and cultural institutions and religious (Iskandar, 1992). Cultural environment includes a variety of activities are conditions of human society (social, economic, political, psychological and cultural) which are based on (1) a complex of certain values, (2) certain norms, (3) the customs certain habits and (4) a pattern of thought that is approved by a group called the non-material aspects of culture. (Ritohardoyo, 2006).
Merauke regency is one of regencies in Papua Province, which became one of the national investment, exspecially related investments plantation and Plantation Industries. National programs that make agropolitan as the center in district Merauke. The types of crops will be developed through an alternative program with a view to the solution of food and energy crisis the nation. Efforts will be made to move and invite parties to participate in growing food and energy in Merauke.
Developments in all sectors are a benchmark for the rise of regional economic system. Clear concept of development and the main goal for the prosperity of communities it will be a lot of positive and negative impacts arising from the development implications. Negative impacts likely to arise concerning indigenous peoples are the erosion of the values of the forest landscape and its environmental wisdom as his identity. Pursuant to the problems above, the formulation of the problem in this paper are: How is environmental wisdom Malind Anim

44
indigenous, associated with the utilization of forest resources? The goal this paper is to determine the role and functions of forests in maintaining the rules of environmental wisdom of Malind Anim indigenous.
2. METHODS
Location of research is customary Malind Anim Indigenous in Merauke regency in Papua province. Materials and tools used are: (1) Merauke Regency Landscape Map, scale 1: 250,000, (2) Distribution Rights of Malind Anim Indigenous Peoples Map, scale 1: 250,000, (3) Research Module, (4) Camera and (6) Voice Recorder.
Primary data collection includes the functions of forests in maintaining the rules of wisdom environment. The data was collected using survey methods with techniques of literary studies, observations, interviews and documentation, and then combined with the methods of Participatory Rural Appraisal (PRA) technique with Focus Group Discussion. To facilitate the processing and analysis of data refers to the qualitative analysis developed by Strauss and Corbin (2003).
3. RESULTS AND DISCUSSION
3.1. Ecological and Social Characteristics
Merauke district consists of four types of landscapes, namely New Guinea Manggroves, Southern New Guinea Lowland Rain Forest, Southern New Guinea and Freshwater Peat Swamp Forest and Transfly Savanna and Grassland (WWF Indonesia Region Sahul Papua, 2005).
Based on administrative data Malind Anim territory included in the district of Merauke is located at the South of the Papua island. Astronomically layout Merauke is 137 ° 30 '- 141 ° 00' East Longitude and 5 ° 00 '- 9 ° 00' South Latitude and directly adjacent to:
1. Northern border with the Digoel and Mappi District. 2. Eastern borders with Papua Newguinea 3. South border with the Arafura Sea 4. Western borders with the Mappi District and the Arafura Sea.
According Bappeda Merauke District (2006), that the Merauke district has an area of approximately 14.22% of the area of Papua province, or about 45.071 km2. Merauke district has a climate very firmly between rainy and dry season. According Oldeman (1975), that the Merauke region located in Zone C Agroclimate zone which has a wet period between 5-6 months. Merauke district has four major rivers that also serve as a transportation lines because it all boils down to the Arafura Sea. Major rivers include Digoel, Kumbe, Maro and the Bian River, are all influenced by the tide and sea water intrusion up to 40-60 km from the sea during the dry season.
Diversity of vegetation in the area of Malind Anim, generally dominated by endemic species such as Melaleuca lecadendron, Planconia sp, Vaccinium sp, Lithocarpus sp, Acacia auriculiformis, Acacia mangium, Acacia microcarpa, deglupta Eucalyptus, Eucalyptus lamp, Eugenia sp, Dillenia allata, and Planchonella sp, Avicennia sp, Bruguiera sp, Terminalia sp and Asteriomirtus symphocarpa.
Number of 403 and 74 species of them are endemic to Papua, as well as an estimated 114 species are protected. Mammalia has been identified as many as 34 species of which there are an estimated 80 species. 32 species of them are endemic in Papua. Freshwater fish species have not been studied but are often found approximately 39 species of fish from 72 species

45
are thought to exist, such as Papua Arowana (Scleropages jardinii) and Lates calcarifer, (WWF Indonesia Region Sahul Papua, 2006).
According to the Statistics Agency of Merauke Regency (2011), that the Merauke district has a total population of 174.710 inhabitants. The total population is divided into 94.104 men and 83.606 women with 40.618 households. Based on these data the population density is low the average was 3.88 people/km2.
3.2. Social Structure of Malind Anim Indigenous
Hunting wild animals such as deer (Cervus timorensis), kangaroo (Macropus agilis) and pigs (Sus scrofa) is a major livelihood of life while sago (Metroxylon sp) is the main food Malind Anim. Looking for fish in the river, swamp or in the ocean that are often performed around the resettlement site. The types of fish caught include Amniataba affinis, Anabas testunedeus, and Oreochromis mossambica.
Anim Malind comunities kinship system is built based on clans and can be divided into four levels, namely:
1. Men's House Community is the smallest group in the system of tribal society organizations Malind Anim. This is the nuclear family and the smallest unit of society consisting of the father, mother and the children who live in one house.
2. The Hamlet is a collection of men's house group community. Grouping based on ownership of communal land or the same clan, or clan based on similarity.
3. The Village is a collection of several groups hamlet consisting of several clans and formed a settlement.
4. The Territorial Group is a collection of some village and form a region and a collection of the four groups in the Malind Anim tribal clan.
Created of the universe is will occur appropriate up to the first created of man "Dema". In addition to the first man something else called "Guul" namely Satan. A moment "Guul" perfidious trick "Dema" to make a transgression. The consequences of the transgression then “Dema” get a punishment to be curses. "Dema" transformed into plants and animals exist according to clan.
Customs territory division Anim Malind indigenous is based on historical custom dating from the story of creation and generations of knowledge passed from generation to generation. Customs territory map is given below (Figure 1). The ancestors have shared this clear customs territory with boundaries based on cardinal, namely:
1. Custom "Sosom": in the East or "Sendawi" 2. Custom "Imoh": in the Western or "Muri" 3. Custom "Mayo": in the South or "Duf" 4. Custom "Ezam": in the North or "Timan"

46
Figure 1: Regional Distribution Map Malind Anim Indigenous
3.3. Forest and Environment Wisdom
Traditional beliefs also believe that humans Malind Anim now referred to as the real man "Animha" because in ancient times humans have ever lived Malind called "Dema". Also believed that "Dema" this also created and transformed itself into a plants, animals and objects that can become food for the next generations. Every clan will be very angry if it may the tribal totem ancestors treated not in accordance with the customary rules.
Understanding about environment in Malind Anim culture is "Unam". The universe has a kinship with each other. This kinship totem’s appear in between the plants to humans, animals to humans, plants with plants, animals with animals, plants to animals, plants with natural elements, animals with natural elements, human with the elements of nature and so on. Totemism Relationship between Malind Anim and Plants or Animal is given below (Table 1). Table 1: Totemism relationship between Malind Anim and plants or animal
No Clan Totem Name Status Science Indonesian Malind Anim
I MAMALIA 1 Gebze Spilcuscus
maculates Kuskus Bangga PP N0. 7 th 99/
Endemic 2 Mahuze Canis familiaris Anjing Nggat Endemic 3 Kaize Thylogale brujnii Kanguru Coklat Sikah PP N0. 7 th 99/
Endemic 4 Basikbasik Sus scrofa Babi Hutan Basik Endemic 5 Balagaize Echymipera
rufescens Bandikut Hidung Panjang
Opiau Endemic
6 Samkakai Macropus agilis Kanguru dada putih
Saham PP N0. 7 th 99/ Endemic
II AVES 1 Gebze Lorius lory Kasturi Kepala
Hitam Karari PP N0. 7 th 99/
Endemic 2 Seleucidis
melanoleuca Cenderawasih Kawat
Baten PP N0. 7 th 99/ Endemic
3 Mahuze Paradiseae apoda ♂
Cenderawasih Besar
Sakil PP No. 7 th 99/ Endemic
4 Paradiseae apoda ♀
Cenderawasih Besar
Koream PP N0. 7 th 99/ Endemic
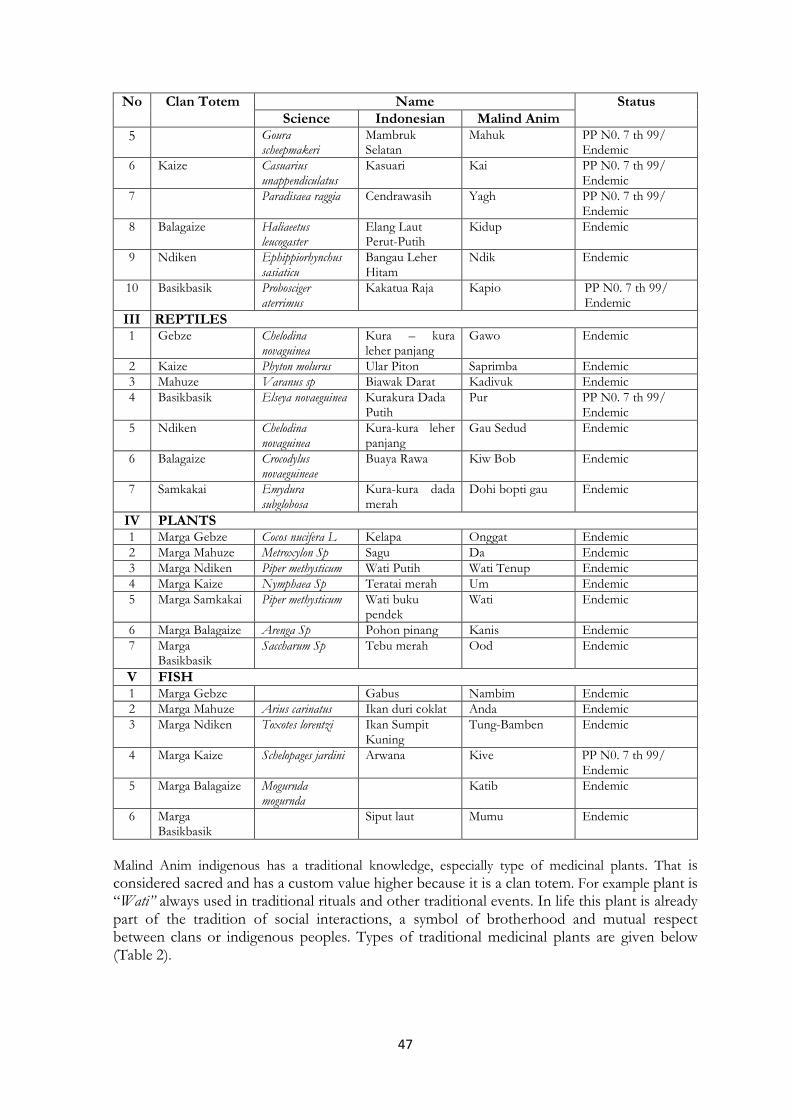
47
No Clan Totem Name Status Science Indonesian Malind Anim
5 Goura scheepmakeri
Mambruk Selatan
Mahuk PP N0. 7 th 99/ Endemic
6 Kaize Casuarius unappendiculatus
Kasuari Kai PP N0. 7 th 99/ Endemic
7 Paradisaea raggia Cendrawasih Yagh PP N0. 7 th 99/ Endemic
8 Balagaize Haliaeetus leucogaster
Elang Laut Perut-Putih
Kidup Endemic
9 Ndiken Ephippiorhynchus sasiaticu
Bangau Leher Hitam
Ndik Endemic
10 Basikbasik Probosciger aterrimus
Kakatua Raja Kapio PP N0. 7 th 99/ Endemic
III REPTILES 1 Gebze Chelodina
novaguinea Kura – kura leher panjang
Gawo Endemic
2 Kaize Phyton molurus Ular Piton Saprimba Endemic 3 Mahuze Varanus sp Biawak Darat Kadivuk Endemic 4 Basikbasik Elseya novaeguinea Kurakura Dada
Putih Pur PP N0. 7 th 99/
Endemic 5 Ndiken Chelodina
novaguinea Kura-kura leher panjang
Gau Sedud Endemic
6 Balagaize Crocodylus novaeguineae
Buaya Rawa Kiw Bob Endemic
7 Samkakai Emydura subglobosa
Kura-kura dada merah
Dohi bopti gau Endemic
IV PLANTS 1 Marga Gebze Cocos nucifera L Kelapa Onggat Endemic 2 Marga Mahuze Metroxylon Sp Sagu Da Endemic 3 Marga Ndiken Piper methysticum Wati Putih Wati Tenup Endemic 4 Marga Kaize Nymphaea Sp Teratai merah Um Endemic 5 Marga Samkakai Piper methysticum Wati buku
pendek Wati Endemic
6 Marga Balagaize Arenga Sp Pohon pinang Kanis Endemic 7 Marga
Basikbasik Saccharum Sp Tebu merah Ood Endemic
V FISH 1 Marga Gebze Gabus Nambim Endemic 2 Marga Mahuze Arius carinatus Ikan duri coklat Anda Endemic 3 Marga Ndiken Toxotes lorentzi Ikan Sumpit
Kuning Tung-Bamben Endemic
4 Marga Kaize Schelopages jardini Arwana Kive PP N0. 7 th 99/ Endemic
5 Marga Balagaize Mogurnda mogurnda
Katib Endemic
6 Marga Basikbasik
Siput laut Mumu Endemic
Malind Anim indigenous has a traditional knowledge, especially type of medicinal plants. That is considered sacred and has a custom value higher because it is a clan totem. For example plant is “Wati” always used in traditional rituals and other traditional events. In life this plant is already part of the tradition of social interactions, a symbol of brotherhood and mutual respect between clans or indigenous peoples. Types of traditional medicinal plants are given below (Table 2).
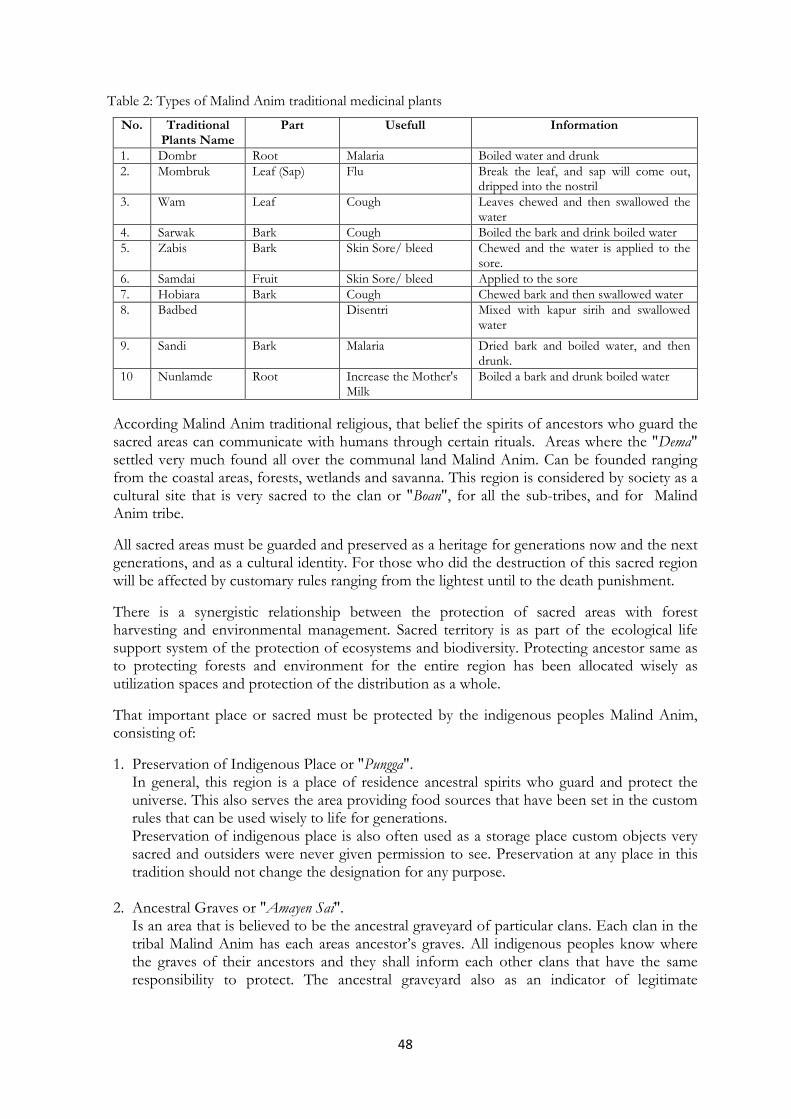
48
Table 2: Types of Malind Anim traditional medicinal plants
No. Traditional Plants Name
Part Usefull Information
1. Dombr Root Malaria Boiled water and drunk 2. Mombruk Leaf (Sap) Flu Break the leaf, and sap will come out,
dripped into the nostril 3. Wam Leaf Cough Leaves chewed and then swallowed the
water 4. Sarwak Bark Cough Boiled the bark and drink boiled water 5. Zabis Bark Skin Sore/ bleed Chewed and the water is applied to the
sore. 6. Samdai Fruit Skin Sore/ bleed Applied to the sore 7. Hobiara Bark Cough Chewed bark and then swallowed water 8. Badbed Disentri Mixed with kapur sirih and swallowed
water
9. Sandi Bark Malaria Dried bark and boiled water, and then drunk.
10 Nunlamde Root Increase the Mother's Milk
Boiled a bark and drunk boiled water
According Malind Anim traditional religious, that belief the spirits of ancestors who guard the sacred areas can communicate with humans through certain rituals. Areas where the "Dema" settled very much found all over the communal land Malind Anim. Can be founded ranging from the coastal areas, forests, wetlands and savanna. This region is considered by society as a cultural site that is very sacred to the clan or "Boan", for all the sub-tribes, and for Malind Anim tribe.
All sacred areas must be guarded and preserved as a heritage for generations now and the next generations, and as a cultural identity. For those who did the destruction of this sacred region will be affected by customary rules ranging from the lightest until to the death punishment.
There is a synergistic relationship between the protection of sacred areas with forest harvesting and environmental management. Sacred territory is as part of the ecological life support system of the protection of ecosystems and biodiversity. Protecting ancestor same as to protecting forests and environment for the entire region has been allocated wisely as utilization spaces and protection of the distribution as a whole.
That important place or sacred must be protected by the indigenous peoples Malind Anim, consisting of:
1. Preservation of Indigenous Place or "Pungga". In general, this region is a place of residence ancestral spirits who guard and protect the universe. This also serves the area providing food sources that have been set in the custom rules that can be used wisely to life for generations. Preservation of indigenous place is also often used as a storage place custom objects very sacred and outsiders were never given permission to see. Preservation at any place in this tradition should not change the designation for any purpose.
2. Ancestral Graves or "Amayen Sai". Is an area that is believed to be the ancestral graveyard of particular clans. Each clan in the tribal Malind Anim has each areas ancestor’s graves. All indigenous peoples know where the graves of their ancestors and they shall inform each other clans that have the same responsibility to protect. The ancestral graveyard also as an indicator of legitimate

49
customary rights of ownership. Ancestral graves have distinctive characteristics such as existing big tree, like a bayan trees. At this ancestral graves prohibited to undertake major activities that directly interfere with the existence of ancestors such as gardening, hunting and cutting down trees. Utilization of natural resources in the areas was limited to ancestral graves to meet the needs of the traditional rituals alone.
3. Anchestors Route "Dema Kay" and Ancestors Transit or "Demadap Mir". This sacred area is closely associated with the preservation of indigenous territories which became the home of the ancestors. However, this area is more of a transit places and route paths or the souls of ancestors who had died on his way to world eternal or "Haindun Miolah". This area function as a cultural identity that should not be lost so that the path of route, in this ancestor is not allowed to decide land use activities. Use of natural resources should be done but is limited only to the needs of the family.
4. Mythology Place "Dema Say". Sacral region which describes the place where there is the origin of something good that the origin of man and animals. Place with regard to the incidence of half-human origin are still believed to be the resurrection of the human being. In the mythology of the place is allowed to conduct limited use of natural resources as something to do with in the live areas ancestral spirits.
5. Old village or "Tamna Miraf". The old village area is an eks village which has left the community because something has happened in the past such as disease and tribal warfare so that people on the move looking for new residential areas. Old village is considered as one of the places that need to be guarded and preserved as a community gathering place first of many clan. The old village at one time will be visited by the people just to commemorate life in the past or to take in the surrounding natural resources.
6. Sago Hamlets or "Dapta". The area is so sacred and important to people's lives because in addition to being the area of forest that provide food this place is also considered to have a mental relationship between customary owners with ancestors who lived around the sago hamlets. This is a major reason why people do not want at all to change the function of the sago hamlets.
7. Forest Hunting or "Aweawe Say". This area is a gathering place for the animals hunted because many provide food resources. At the beginning of the rainy season in each a forest hunting this year would be met not only by animals such as deer, kangaroos and pigs, but also filled by different species of birds and other wildlife. Different types of grass will sprout as animal feed, various kinds of flowers and trees, small swamp will be filled with water so that the area is a concentration of biodiversity. Customary rules are made Malind Anim to protect the area as it is with the utilization of resources as possible to meet the needs of family life while still holding the principle of sustainability. Society does not want any changes to the function of this region and will be a region that is considered sacred because it provides a source of life for them.

50
8. Spring Water Sources or "Awamadka".
Springs are considered sacred and must be protected by Malind Anim are places during the long dry season still function provides a source of clean water for life. Swamps and rivers should be protected because it provides natural products for the necessities of life. Several swamps that are considered sacred is usually very broad and there are many totem animals belong to the clan who live. This water source is usually close to the hamlet of sago and large trees, on the field or savannah areas and in forest areas.
3.4. Traditional Rules of Malind Anim Tribe
Traditional rules of Malind Anim indigenous related to the utilization of forest resources and environmental wisdom can be distinguished based on clans. Each clan has its own customary rules relating to totems. This clan rules in order for the management and utilization of natural resources of indigenous peoples unselfish but also attention to the preservation of nature as the abode of the ancestors and other animals and plants.
Traditional values that used to be used for the protection of natural resources are now beginning to shift. Formerly the Malind Anim not cares value for money which is important to get enough food to live on nature and nature can properly maintain. Now this value as it was considered old because the Malind Anim communities has come to know a lot of money so sometimes destructive use of natural resources such as excessive logging.
In general it can be said that it is an obstacle for Malind Anim communities to apply the customary rules are: the influence of foreign cultures, indigenous peoples have known the value of the money system, the regional development and a lack of education and cultural traditions to the younger generation Malind Anim.
4. CONCLUSIONS
Livelihoods of Malind Anim indigenous mostly gatherers who inhabited the suburbs except Merauke. Gathering activities are still done hunting, fishing in the swamp, in the river or in the ocean, tapping sago, selling timber and non-timber products such as orchids, ornamental plants, some species but this does not take place in each year. In addition, people familiar with the traditional farming systems create family gardens.
Be aware, all of components of Malind Anim indigenous peoples should be involved in forest protection system based environmental wisdom. Strengthening the traditional institutions ranging from village level to district level and followed by an increase in the capacity of human resources. Continuously re-enable customs and customary rules that exist in life, especially concerning the use and protection of nature. Actively embrace regional governments and the private sector to jointly supervise the use of natural resources.
Areas that are considered sacred and must be protected by the Malind Anim indigenous peoples have the relationship and mutual dependency between the mythological story of creation or cultural identity, the spread of flora and fauna or ecological forests as a source of life.
Should be established Regional Cooperation Agency, consisting of local government as the ultimate authority in the area in collaboration with the private sector as an equity holder, the NGOs as an independent party and in every area of development should involve indigenous peoples as groups of people traditionally understand about utilization of natural spaces as both protection and utilization areas.

51
5. REFERENCES
Baiquni M. (2007): Strategi Penghidupan di Masa Krisis. Belajar dari Desa. Yogyakarta : IdeAS Media Yogyakarta.
BAPPEDA Kabupaten Merauke. (2011): E-Book; Tata Ruang Kabupaten Merauke 2007 – 2027. Merauke.
Bosko, RE. (2006): Hak-hak Masyarakat Adat dalam Konteks Pengelolaan Sumberdaya Alam. ELSHAM – Lembaga Studi dan Advokasi Indonesia. Jakarta.
Daeng H.J. (2008): Manusia, Kebudayaan dan Lingkungan. Pustaka Pelajar. Yogyakarta.
Gebze., YB (2005): Pelestarian Alam dalam Budaya Malind. Lembaga Masyarakat Adat Malind Anim “Anim Ha” Kabupaten Merauke. Merauke.
Ritohardoyo S. (2006): Ekologi Manusia. Program Studi Ilmu Lingkungan, Sekolah Pascasarjana Universitas Gadjah Mada Yogyakarta.
Suwardi. E (2006): Metodologi Penelitian Kebudayaan. Gadjah Mada University Press. Yogyakarta.
Yayasan WWF Indonesia Region Sahul Papua. (2005): Booklet Global 200 Ecoregion.

52

53
INAFOR A-0031
THE SECOND INTERNATIONAL CONFERENCE OF INDONESIA FORESTRY RESEARCHERS
THE 2nd INAFOR, 27-28 AUGUST 2013
Forest Management Factors Determining The Quality of Life Measured by Human Development Index in Java, Indonesia
Dwiko B. Permadi 1, Rohman1 and Ahmad Maryudi1 1Faculty of Forestry, UGM, Yogyakarta-Indonesia
Jl. Agro No. 1, Bulaksumur, Yogyakarta
INAFOR SECRETARIAT Sub Division of Dissemination, Publication and Library
FORESTRY RESEARCH AND DEVELOPMENT AGENCY Jl. Gunung Batu 5, Bogor 16610

54
Forest Management Factors Determining The Quality of Life Measured by Human Development Index in Java, Indonesia
Dwiko B. Permadi 1, Rohman1 and Ahmad Maryudi1
1Faculty of Forestry, UGM, Yogyakarta-Indonesia Jl. Agro No. 1, Bulaksumur, Yogyakarta
ABSTRACT
This paper aims to answer the question whether forest management activities affect the level of quality of life, as measured by the human development index (HDI). Revealing this linkage can help decision-makers to improve the effectiveness of forest management and increase the role of forest management unit to achieve sustainable development. Ten variables as predictors were examined as represention of forest management factors from plantation to production (3 variables), areas management (3 variables), financial (1 variable), and social (3 variables). Using panel data from 43 state forest management units (FMUs) in East and Central Java, HDI at FMU level were proportionally adjusted based on 79-regency-HDIs as dependant variable. Multiple linear regression analysis with backward method was used to determine which factors significantly determine HDI. It is found that factors determining HDI at FMU level, i.e.: the harvesting areas (production factor), the number of forest user groups (social factors), and total areas of FMU (areas management factor). The first two significant factors positively influence HDI, while the last factor negatively affected the HDI. The effect of each variable and coefficient of determination (R2) of the model is relatively low, meaning that the level of quality of life at FMU is largely determined by factors outside the forest management factors, which are not mentioned in this model. Some explanations of this limited role of forest management factors are outlined. This research suggests sorts of forest policy to enhance quality of life from technical intervention, such as applying multiple rotations and pre-commercial thinning, reorganization of FMU whose areas larger than 40.000 ha. Lastly, participation intervention should be promoted by increasing the number of forest farmer groups based on sub villages or hamlets to increase equitable benefit shares.
Keywords: forest management, human development index, forest policy, Java
1. INTRODUCTION
That forest development sector is a part of regional development has been recognized by many scholars and practitioners. This implies that forest management should contribute to increasing social welfare, by providing basic needs in terms of food security, shelter (timber) energy (fuelwood), alleviate poverty, employment and encourage participation to increase productivity and forest sustainability in longer terms (Simon 2006). Schlaepfer and Elliot (2000) say that putting sustainable management of forests in the context of the wider landscape management urge forest managers to adapt to outside of forestry interests, such as the role of forests in mitigating climate change, forest certification and community participation. This is very important call in the underlying change in the way forest managers

55
view the forest as a separate system to be part of the sub-systems more broadly. The spirit of this change is also reflected in collaborative forest management since the last decade to manage plantation forests in java by state forest enterprise (Perhutani) and community of forest villages (Perhutani 2001).
This change is also in line with millennium development goals, in which one of the targets to be achieved is reducing poverty and food insecurity to 7.5% in 2015, in the same time is also able to maintain or increase forest covers more than that at this time (about 40.9%) (Stalker 2008). However, the relationship between forest cover and social welfare is not always positively linear (Sunderlin, Angelsen et al. 2005). Some developments that improve human well-being may be in the expenses of forest cover loss (Kartodihardjo and Supriono 2000) or the other way around (Peluso 1992). This causes difficulties to measure the impact of forest management toward quality of life of the community, despite not impossible.
Measure of societal well-being of certain regions can be determined in many ways, one of which uses the human development index (HDI), which is used both by the United Nations Development Programme (UNDP) as well as the national government and local governments to evaluate the developmental progress each year. In 2010, for example, Indonesia has HDI 0.60, aligning Indonesia rank 108 out from 169 countries. This rank is under the Singapore, Brunei, Malaysia, Vietnam and the Philippines (UNDP 2010).
HDI measure quality of life based on three composite indexes, that is, (UNDP 2010): 1) living a long and healthy life, indicated by life expectancy which is reflecting healthiness, 2) being educated, measured by literate number and length of education, and 3) decent standard of living, indicated by income per capita or purchasing of power parity. Many people considered that the HDI is a superior instrument to measure because it considers the development of economic and social indicators as well. Nonetheless, there is criticism of the use of HDI as it is still considered to be not fully able to comprehensively measure of human development, because it does not incorporate aspects of gender inequality and others that are difficult to measure, such as human rights and political freedom.
Research on the factors influencing human development index in Indonesia have been carried out by various disciplines outside the field of forestry. The study includes some focuses, among others, on statistical methods to determine which factors most influencing on the HDI. This type of research is done by statistics researchers (Faidah and Purhadi 2010, Nur and Purhadi 2010). Winarni (2010) also conducted such study to determine the latent variables that influence endogenous and exogenous HDI value, especially health, education and the economy factors (Rizki and Saleh 2007, Roza 2007). Those past researches have also recommended to examining the relationship between HDI and policies in agriculture and other developmental sectors. This study is intended to fill the lack of knowledge about the relationship between the HDI and sector of forestry development as part of regional development.
This paper aims to answer the question whether forest management activities affect the level of quality of life, as measured by the HDI, in surrounding forest management unit administration in Java. Revealing this linkage can help decision-makers to improve the

56
effectiveness of forest management and increase the role of the FMU to the achievement of sustainable development and MDGs.
2. METHODS
2.1. Conceptual Model
In this study, the determinant factors include forest management activities associated with social, production, financial, and areas management factors. These four categories can be broken down into ten measurable variables, that is, number of LMDH (village community groups), amount of benefit shares (Rp), and number of illegal logging (trees theft per year), planting areas (ha), harvesting areas (ha), timber production (m3), expenditure of the forest management unit (Rp), total areas (ha), productive areas (ha), and protected areas.
The dependant factor is quality of life measured by HDI. In this study, HDI is converted from HDI at district level into HDI at Forest Management Unit (FMU) level where forest operations are managed. To convert HDI at district level into HDI at FMu level can be performed with the following procedures: if an FMU whose forest areas located in one district alone, the HDI of the FMU equals to HDI at district level. If forest areas located in two or more regencies, the HDI at FMU level is defined as a weighted average of the proportion of its forest areas times HDIs at each districts level.
The relationship between both dependent and independent factors is presented in figure 1.
As can be seen from figure 1, there are two signs in each variable: positive and question mark, indicating assumed relationship between independent variables and quality of life that need to be tested in this research. Positive signs indicate that the factors will positively influence the quality of life. Some factors with question marks indicate unclear relationship whether the effect of those factors negative or positive to the achievement of quality of life.
Illegal logging (?)
Number of LMDH (+)
Benefit shares (+)
Planting areas (+)
Timber production (+)
Productive areas (+)
Social factors
Area management factors
Expenditure (+)
Protected areas (?)
Quality of life measured by HDI
Production factors
Financial factor
Total areas (?)
Harvesting areas (+)
Figure 1: Conceptual model relationship between forest management factors and quality of life measured by HDI

57
2.2. Study Materials and Sites
This study is a desk study using panel data form Perum Perhutani Unit I and II of Central Java and East Java. Total FMUs in the above areas are 43 out of 57 FMUs in Java and Madura islands. The 43 FMUs locate and correspond with 79 districts in both provinces. The number of FMUs in Unit I and Unit II are 20 and 23, respectively.
Data collected from various sources. Data from Perum Perhutani Unit I and Unit II Central Java, East Java include: forestry statistics from 2005 to 2010, forest management unit database, PHBM section, and annual reports of each FMU. These sources are mainly to find out the information regarding independent variables, as shown in figure 1.
In addition, HDI data per district are derived from the Central Statistics Agency of Central Java and East Java for the year 2010 to define dependent variables. HDI at FMU level is a shadow HDI of one or more district(s)’s HDI, which is defined by considering the proportion of forest areas in the district areas where FMU is located. For example, Blora FMU is located at Blora district, so the HDI of Blora FMU is the same as HDI of Blora district. However, Surakarta FMU consists of 6 districts, thus the HDI of Surakarta FMU is proportionally determined by the weighted average of forest areas in the six districts times the HDI of each district.
Table 1: Average HDI of FMU based on forest type enterprise in both Central Java and East Java
Forest enterprise type Unit I Central Java Unit II East Java Total (both units) Average
HDI Nr. of FMU
Average HDI
Nr. of FMU HDI Nr. of
FMU Service-Timber-Non Timber 70.9 5 68.0 7 69.2 12 Service-Timber - - 69.3 2 69.3 2 Timber 70.9 13 69.0 13 69.9 26 Service-Non Timber - - 70.4 1 70.4 1 Timber-Non-Timber 71.0 2 71.0 2 Average 70.9 20 68.8 23 69.8 43.0 Source: data processing from Statistic Bureau of Central Java and East Java Provinces 2010
Tabel 1 shows the average of HDI and number of FMUs of State Forest Company based on location (Unit I and Unit II) and forest enterprise types. Generally speaking, average HDI of FMUs in Unit I Central Java province is higher than that in Unit II (East Java province), that is, 70.9 compared to 68.8. While in central java there is no big discrepancy of HDI among different forest enterprise type, in East Java, there is a tendency that combination of Services & Non-Timber forest enterprise type and combination of Non Timber & Timber had HDI higher than other types, but the variations are relatively small and include only two FMU in Unit I and one FMU in Unit II. The forest enterprise type of Timber only is the dominant type of FMU in Central Java (13 FMU or 60%) and East Java (13 FMU or 51%). Their HDI figures revolve around the middle rank, i.e.: 70.9 and 69.8 in Central Java and in East Java, respectively. This range of HDI (66-80), based on BPS criteria, can be categorized as moderate quality of life.

58
2.3. Data Analysis
Data analysis is done using multiple linear regressions with Stata software version 12. As the nature of this research is exploratory, backward method is used to eliminate variables whose probability is greater than 5% to find out the factors that are only significant in explaining HDI. Several assumptions tests were conducted to find the appropriate model, that is normality, heteroscedacity, multicolinearity, and regression error specification test.
3. RESULTS AND DISCUSSION
3.1. The Signs of Variable Estimates
From table 2 which illustrate the result of statistic test of initial model including ten variables, it can be seen that some variables have negative signs of the estimates while some others have positive estimate signs (see table 2). The positive estimate signs indicate that the factors can increase HDI, whereas the negative estimates explain factors can decrease the HDI. Expenditure, total areas and benefit sharing show negative relationship with HDI. Although expenditure and benefit sharing are not significant variables, the negative relationship of both factors with HDI are surprising findings. Benefit sharing is expected to increase quality of life as its direct benefits in term of cash money to farmer groups can be used to increase household income or induce economic activities in forest villages. Likewise, expenditure factor, that is, company budget for forest management activities from planting to harvesting and administrative costs is expected to influence economic activities that can be captured in HDI.
Table 2: Estimates of forest management factors determining HDI in initial model
Factors Estimates SE Planting (ha) 0.000474 0.0004827 Harvesting (ha) 0.000837 0.0004336 * Timber (m3) 3.26E-05 0.0000363 Expenditure (xRp1 Million) -6.2E-05 0.0000605 Productive (ha) 0.000179 0.0000939 . Protected (ha) 0.000138 0.0000908 Total areas (ha) -0.00014 0.0000547 ** LMDH (N of farmer groups) 0.020231 0.0063186 *** Sharing (xRp 1 Million) -2.5E-05 0.0008637 Illegal logging (N trees theft) 0.00016 0.0002521 Constanta 67.61178 1.070208 ***
Note: * significant at 10%, ** sig at 5%, *** sig at 1%, R2 = 0.496
The positive variable estimates are those related to plantation activities, harvesting, timber production, productive areas, protected areas, the number of farmer groups, benefit sharing and illegal logging. The positive signs of these variables are expected since the beginning of the research as they are potentially contributing factors for economic activities that in turn influencing the quality of life measured in HDI. However, protected area factor is still unclear because it has strong positive correlation with total areas, indicating the bigger the total areas are the more the protected areas. This also can be inferred that protected areas may have negative effect toward HDI. When the total areas factor is replaced by protected areas, this

59
results in negative relationship with HDI (shown in the other model, but not presented in this paper). It is concluded that protected areas is still a questionable factor in determining HDI.
As the probability of significant value of the variables is mostly greater than 10%, except for harvesting, areas, and LMDH, most variables can be interpreted as having no relationship with HDI value. Those variables that are representing direct activities of forest management in the field, such as plantation, timber production, benefit sharing and illegal logging tends to be categorized as non influential factors. This is also surprising findings indicating that, for example, those FMUs spending more profit for sharing benefits to LMDH have no different effect on quality of life from those FMUs spending less profit sharing to LMDH. Also plantation activities that are expected to generate direct incomes for forest farmers cannot be proven by this model.
3.2. Factors Significantly Determining HDI
Having flaws in the initial model, such as autocorrelation between protected areas and total areas, and meeting error specification variable, the model is not good enough to explain the relationship in the variables. Backward method is used to improve the model and to find out the significant explanatory factors by eliminating variables that have probability value greater than alpha at 10%. The final parsimonious model consists of three variables that significantly influence the HDI, namely harvesting areas, the number of LMDH and total areas (see table 3) and this infact has significant value at below 1%.
Table 3: The final parsimonious model that contains significant factors of forest management determining HDI
Factors Estimates Std. Err. Harvesting (ha) 0.0010282 0.0003282 *** Total areas (ha) -0.0000427 0.0000152 *** LMDH (N) 0.0216721 0.0055539 *** Constanta 68.01241 0.8928136 ***
Note: * significant at 10%, ** sig at 5%, *** sig at 1%, R2 = 0.396
The individual effect of each variable toward HDI can be seen from the estimate numbers shown in table 3. For example, to increase HDI by 1 point within one year, forest manager should harvest about 1000 ha, regardless changing in other variables. This harvesting areas include the final harvesting (type A, B, C, and D of harvesting) and commercial thinning (type E of harvesting). The later harvesting type is contributing more significant to the total number of harvesting areas. This harvesting variable, regardless how much timber can be produced, indicates that this activities contributing to quality of life.
Furthermore, every increase by 100 numbers of LMDH will positively affect the HDI by 2.17 points. The more farmer groups founded are the better the quality of life of the forest villagers. This indicates that activities of forest management are better off when the participation of farmer groups can be increased in terms of the number of groups that are not only one village one LMDH. Currently, the policy of social forestry is just limiting only one formal farmer group founded in one village. This tends to limit the participation and the delivery of benefits sharing is dominated by village elites at village level.

60
In addition, from total areas, whose sign is negative, it can be interpreted that every decrease by around 25.000 ha of FMU areas will increase HDI by about one point. This explains that the more intensive forest areas are managed is the more forest management increases the quality of life. Those areas of FMUs greater than 40.000 ha tend to have low level of quality of life. The greater FMUs have a strong correlation with protected areas indicating the more protected areas FMUs have, the bigger the FMU areas and the less the quality of life of the community. This areas factor should be of concerns of policy makers to restructure the FMUs and to increase livelihood options in protected areas.
These all variables together can explain the variance of observed HDI about 39.6% as indicated by R2. Having fewer variables that significantly determine the HDI, one can raise several questions about the limited role of forest management activities toward social welfare. The limitation of forest development sector in Java can be shown by the fact that the effects of each significant variable on HDI are quiet small and only 39,6% of HDI can be explained by three significant variables of forest management. About 61.3% of HDI’s variability, therefore, is explained by other variables not mentioned in this model.
2.3. Discussion
If this finding is valid, this research supports other studies indicating that the spirit of collaborative forest management is still inadequate to alleviate poverty and other developmental sectors may replace the household livelihood portfolios in forest villages. Maryudi and Krott (2013), for example, found that implementation of collaborative forest management in several FMUs in Java has not yet fulfilled its high promises on providing forest users with genuine escape routes from their poverty-laden life. It is expected that forest users gain access from social forestry programs and have economic outcomes, such as food crops, non timber forest products, wages from employment, and shares from main products. Furthermore Maryudi and Krott argue that instead of alleviating the poverty of the forest users, this community forestry scheme creates only subsistent economy. This may explain why the effect of sharing benefits, planting areas, and timber products are not significant and only fewer variables of forest management that determine the quality of life.
Another explanation about low contribution of forest management factors can also be attributed to changing in livelihood portfolios. Peluso (2011) indicates that since the last three decades, there has been changing in the way forest villagers earn their income, shifting from forest products dependency to more off-farm jobs, such as working in urban and distant industrial areas. This transforms the livelihood portfolios of the households living in surrounding forest areas.
As this research is to explore the use of HDI to measure quality of life by relating it to the forest development sector, the findings should be carefully examined. This means there is internal problems in FMU organization in delivering the spirit social forestry in the fields. The evidence unluckily cannot be captured in this model. Study using more qualitative approach will complement this study. One can further reinforce the use of HDI by researching whether calculating HDI at regency level covers forest village sample proportionally or bias in selecting more urban sample households. Also, research to validate whether HDIs for forest villages are significantly different from HDIs at agricultural villages or urban areas that less dependent on

61
forest products.However, it is still promising to use HDI to assess the effectiveness of forest management factors in improving community welfare as it is simple and viable criteria that can be done to diagnose the effectiveness of FMU.
Despite required further validity of the model, this final model may suggest that increasing quality of life measured by HDI through forest management intervention can be done using combination of technical forestry, reorganization of FMU, and participation interventions.
First, the technical forestry intervention can be done by designing harvesting areas more intensively based on thinning frequency and degree of thinning hardness. The harvesting area is not merely the final clear-cutting; even the more importance is applying optimal thinning regimes. Multiple rotation technique can be seen as the management of thinning regimes in optimal ways (Setyarso 1985, Simon 1985). This is potential technique to be applied as, currently, more than half of age classes are in young and middle-ages that require thinning intervention as usually prescribed in traditional forest management. Forest stand improvement using hard-geometric thinning and multiple rotations can potentially be implemented to increase both forest company profit and social welfare functions.
Second, given the fact the larger the FMU is the lower the HDI, one can propose to reorganize FMU especially those whose areas bigger than 40.000 ha. This will be related to how to optimize protected forests and manage the forest more intensive, for example by dividing into two FMUs, increase the field staff of RPH (forest development unit), increase non timber forest products, such as resin from limited protected pine forests. This will require additional fieldworkers and laborers that in turn affect the quality of life of the community.
Third, increasing participation is required by putting forest farmer organization not monopolized by village elites, but this institution should be built to accommodate farmer groups who really work and rely on forest products. This organization can be expanded up to sub village levels. Therefore, if the village has four sub villages, the LMDH should be established in those four sub villages with their own organization structures. Even, it is better if it is based on hamlet levels, so the program can widely capture the participation of community. This is to improve that the sharing benefits do not just go to elite as indicated by (Maryudi and Krott 2012), but can be distributed evenly to the community.
4. CONCLUSIONS
It can be concluded that forest management factors have positive and negative influences on the quality of life, measured by human development index. Measuring human development index is a simple and viable tool to evaluate the effectiveness of forest management unit performances. There are only three variables of forest management activities that significantly determine the quality of life, namely harvesting areas (+), numbers of LMDH (+), and management areas (-). The low effect of forest development sectors toward quality of life may be explained by the nature of subsistent economy of the collaborative forest management programs in Java, so it is not adequate to achieve poverty alleviation yet. On the other hand, changing in livelihood portfolios is reducing villagers’ dependency on forest sectors and more relying on off-farms. Despite this limitation, if the model is valid, this research recommends optimizing harvesting activities by applying multiple rotations and pre-commercial thinning

62
for young and middle stand age classes. Also, it suggests reorganizing FMUs whose areas more than 40.000 ha, so FMU can be managed more intensively. Lastly, increasing the number of LMDH into lower levels (sub villages or hamlets) is required in order to distribute the benefit shares to forest farmers more equitably.
5. REFERENCES
Faidah, D. Y. dan Purhadi (2010). Pemodelan Regresi Probit Ordinal Pada Indeks Pembangunan Manusia Provinsi Sumatera Utara, Jawa Barat, Jawa Tengah, dan Jawa Timur S1, Institut Teknologi Surabaya.
Kartodihardjo, H. and A. Supriono (2000). The Impact of Sectoral Development on Natural Forest Conversion and Degradation: The Case of Timber and Tree Crop Plantations in Indonesia. Bogor, CIFOR.
Maryudi, A. and M. Krott (2012). "Poverty Alleviation Efforts through a Community Forestry Program in Java, Indonesia." Journal of Sustainable Development 5(2): 43-53.
Nur, C. dan Purhadi (2010). Pemodelan IPM Provinsi Jawa Timur, Jawa Tengah, Jawa Barat dan Sumatera Utara dengan Metode Regresi Logistik Ordinal. S1, Institute Technology Surabaya.
Peluso, N. L. (1992). Rich forest poor people: Resource Control and Resistance in Java. Barkeley, University of California Press.
Peluso, N. L. (2011). "Emergent forest and private land regimes in Java." The Journal of Peasant Studies 38(4): 811-836.
Perhutani (2001). Sistem Pengelolaan Sumberdaya Hutan. SK No. 136/Dir/KPTS/2001. Indonesia.
Rizki, B. and Saleh (2007). "Keterkaitan akses sanitasi dan tingkat kemiskinan: studi kasus di Provinsi Jawa Tengah." Jurnal Ekonomi Pembangunan 12(3): 223 - 233.
Roza, P. (2007). "Pendidikan dan mutu manusia." Jurnal Sosioteknologi 12(6).
Schlaepfer and Elliot (2000). Sustainable Forest Management. Netherlands, Kluwer Pubslisher.
Setyarso, A. (1985). Strategi Simultan : Penjarangan dan Rotasi Tebang. Proceeding Seminar Daur Jati, PERSAKI Cabang Yogyakarta, 5 Januari 1985. Seminar Daur Jati, Yogyakarta, PERSAKI.
Simon, H. (1985). Penerapan daur ganda untuk pengaturan hasil hutan jati. Seminar Daur Jati, Yogyakarta, PERSAKI.
Simon, H. (2006). Hutan Jati dan Kemakmuran: Problem dan Strategi Pemecahannya. Yogyakarta, Pustaka Pelajar.
Stalker, P. (2008). Millenium Development Goals. Jakarta, UNDP.
Sunderlin, W. D., A. Angelsen, B. Belcher, P. Burgers, R. Nasi, L. Santoso and S. Wunder. (2005). "Livelihoods, Forests, and Conservation in Developing Countries: An Overview." World Development Retrieved 9, 33.
UNDP. (2010). "Human Development Index." Retrieved 20 April 2012, from http://www.undp.org.bz/human-development/the-human-development-index-hdi/.

63
Winarni (2010). Indikator-Indikator yang Mempengaruhi Komponen-Komponen IPM dengan Menggunakan Model Persamaan Struktural (Studi Kasus di Kabupaten Sukabumi). S2, Institut Pertanian Bogor.

64

65
INAFOR A-0035
THE SECOND INTERNATIONAL CONFERENCE OF INDONESIA FORESTRY RESEARCHERS
THE 2nd INAFOR, 27-28 AUGUST 2013
Local Perception on Land Use Systems and Biodiversity in a Rubber Plantation of North Sumatera
Elok Mulyoutami1, Hesti L. Tata1,2, and Janudianto1
1 World Agroforestry Centre (ICRAF), Jalan CIFOR, Sindangbarang Jero, Bogor. Email: [email protected]; [email protected]
2 Forest Research and Development Agency (FORDA), Jalan Gunung Batu 5, Bogor. Email: [email protected]
Paper prepared for The Second International Conference of Indonesian Forestry Researchers (INAFOR)
27-28 August 2013
INAFOR SECRETARIAT Sub Division of Dissemination, Publication and Library
FORESTRY RESEARCH AND DEVELOPMENT AGENCY Jl. Gunung Batu 5, Bogor 16610

66
Local Perception on Land Use Systems and Biodiversity in a Rubber Plantation of North Sumatera
Elok Mulyoutami1, Hesti L. Tata1,2, and Janudianto1
1 World Agroforestry Centre (ICRAF), Jalan CIFOR, Sindangbarang Jero, Bogor Corresponding email: [email protected]; [email protected]
2 Forest Research and Development Agency (FORDA), Jalan Gunung Batu 5, Bogor. Email: [email protected]
ABSTRACT
Forest area in North Sumatera has declined since many years ago and have changed to more intensive land use systems, e.g. oil palm plantation, rubber monoculture plantation and smallholder. The study of local perception on land use systems and biodiversity was conducted in six villages in Simalungun district, Asahan district, and Serdang Berdagai district, North Sumatera province, to understand local preferences for land-use systems, local perceptions on land-use functions, and values on biodiversity, using Multidisciplinary Landscape Analysis (MLA) approach. The study showed that smallholder rubber and oil palm were the main sources of livelihoods in almost every village, since the two land use systems were important as cash income source. All participants perceived that rubber agroforest was the most important land use, as it could provide sources of income, food and environment values. People’s understanding on biodiversity was closely associated with livelihood patterns and social life, as biodiversity contributed to their daily needs, and related to specific knowledge. All rubber plots under mixed and monoculture systems were perceived as good value in preventing erosion, while oil palm plots were of relatively low value. Interestingly, people also understood that forest had the highest function as an erosion control as these area are prone to soil erosion due to topography. Local people classified flora and fauna diversity based on their functions, such as food, source of income, fuelwood, construction, medicine, fodder, handycraft and tools, and erosion control. They noticed different biodiversity occured in different land-use types. Rubber agroforests provide all needs, e.g. goods and services, for local communities.
Keywords: agroforestry, rubber agroforest, Multidisciplinary Landscape Analysis (MLA)
1. INTRODUCTION
Deforestation owing to over-exploitation, over-population and changing forests to more intensive land-use systems has caused habitat loss for animals and many other living organisms. Loss of biodiversity should be considered as the greatest economic problem (Helm and Heppburn 2012). Human is always regarded as the major threat to biodiversity, although natural disturbance can also be as main factor. Through knowledge, people can manage their environment to live together with the animals and plants.
It is important to take into account human and environmental aspects in biodiversity conservation. The value of land-use systems in a landscape is not only captured by its physical aspects but also the cultural and social aspects embedded in it. This also reflects on how to measure biodiversity, that is, it need not always be based on a natural science approach. The relative importance of biodiversity to humans can be assessed through understanding the socio-cultural aspects of local communities. Natural scientific methods define the ‘level of biodiversity’, making it possible to compare sites or to provide data that can be used for

67
comparisons (Sutherlands 2000, Jennings 2000). On the other hand, the socio-cultural approach reveals how local people measure biodiversity and the importance of maintaining it for the sustainability of their livelihoods. This is particularly important when biodiversity conservation is linked to poverty alleviation (Huq 2000, Solis-Rivera 2000) through rewards for environmental services’ schemes. Judging the value of what is important for local communities helps them to capitalise on opportunities for biodiversity conservation.
Objective of the research aimed to study (i) local perceptions of land-use systems and their functions, and (ii) importance of biodiversity for their livelihoods, which reflected through the most valuable plants and animals in each land use.
2. METHODS
2.1 Location and Village Selection
The study was conducted in Dolok Merangir of Simalungun district, Serdang Berdagai district and Asahan district, North Sumatera province. The area encompassed of large area of rubber estate plantation, smallholder rubber and secondary forest (Figure 1). Some villages were selected purposively within some sub-districts that were statistically well known as producers of high quality and quantity of rubber latex. This is important since most of the villages in the three districts are main producer of rubber latex and oil palm as it could also help to minimize village selection.
Figure 1: Study sites in the areas of the Bridgestone Sumatera Rubber Estate (BSRE) company and six villages in surroundings
Six villages surrounding the plantation were selected taking into consideration the village’s position (inside or outside the plantation area), distance to the forest and rubber as one of the main livelihood sources.
The sample villages were grouped into three clusters based on the distance to the forest. Cluster 1, is the furthest distance to the forest villages and inside the area of the BSRE, represented by Batu Silangit. Cluster 2, the villages with moderate distance (5 – 10 km) to the forest, represented by Naga Raja and Aek Bamban,— and, Cluster 3, villages close to the

68
forest—Huta Rao, Silau Padang and Merjanji Aceh villages. Selected villages are presented in Table 1.
Table 1: Characteristics of selected villages
Cluster Distance to forest
Distance to rubber
plantation
Village Administrative location Main Livelihood
Source
1 > 10 km Enclave Batu Silangit Tapian Dolok sub- district, Simalungun district
Rubber
2 5 – 10 km Bordering Naga Raja Sipispis sub-district, Serdang Berdagai district
Oil palm, rubber
> 10 km Aek Bamban Aek Songsongan sub-district, Asahan district
Rubber
3 < 5 km Bordering Huta Rao Bandar Pulau sub-district, Asahan district
Oil plam, rubber
> 10 km Merjanji Aceh
Aek Songsongan sub-district, Asahan district
Oil palm, rubber
> 10 km Silau Padang Sipispis sub-district, Serdang Berdagai district
Rubber
2.2 Multidisciplinary Landscape Analysis (MLA)
Multidisciplinary Landscape Analysis is an approach used to understand local people’s perspectives of their surrounding landscape. Information is collected through multidisciplinary and collaborative methods, primarily related to environmental impact and local people’s perspectives (Sheil et al., 2002).The MLA was adapted to highlight the values and preferences of local people in the context of biodiversity and its utilisation. Whilst MLA was designed to explore forest values as a core of assessment and other land uses as complementary, we treated landscape as a continuum and positioned community in the centre of the system.
Perception of the local community was assessed through focus group discussion (FGD). Two groups, differentiated by men and women with 3-11 people in each group. Every groups discussed on the value of land-use and function of flora and fauna diversity. Weight ranking or pebble distribution methods were employed as practical methods to assess the importance of biodiversity for the people in each village. While doing the ranking, discussions with participants were also captured, in particular, to obtain more information about valuable plants and animals.
3. RESULTS AND DISCUSSION
3.1. Classification and Value of Land-use Types
During discussions with farmers, questions about land-use values referred to the use and importance of the land in people’s lives, while questions on biodiversity values referred to the importance of a high of variety species in each land-use system. Knowing the value or the

69
importance of land use and biodiversity was important for understanding people’s preferences and priorities (Sheil et al., 2002).
Land-use classification in this study was defined based on local people’s perspectives. People were asked for the main land-use system in their village and surrounding areas. The classification and availability of each land use in each village are illustrated in Table 2. The majority mentioned the productive and economically important land uses, while fallow and shrubs land were not mentioned in the discussion, since the land was not high value and was considered unused.
Smallholder rubber and oil palm were the main sources of livelihoods in almost every village, since the two systems were important as cash income source. Smallholder rubber plots appeared as monoculture plantation as well as agroforestry systems with some important timber trees or fruit trees and shrubs.
Smallholder rubber agroforests and home gardens existed in each village. Home gardens were perceived as the plot surrounding the house, used for basic needs. The gardens consisted of some fruit trees, light timber trees, flowers and sometimes rubber trees. Smallholder rubber agroforests were usually somewhat further from the house and consisted of some economically important trees such as rubber combined with fruit trees. Rubber monoculture plots were also common within the surveyed villages; they occurred surrounding houses and also far from settlements. Forest was defined as dense vegetation that grow naturally, multi-strata, of different ages with a multilayer canopy. It may occur beside rivers, called riparian forest. All farmers perceived that rubber agroforest was the most important land use, as it could provide sources of income, food and environment values (Figure 2). The second important land use was smallholder oil palm, followed by smallholder rubber monoculture, as the main cash income for the household.
Table 2: Land use and its availability in each cluster
Land use type Cluster 1 Cluster 2 Cluster 3
Rice field √
Dry rice field √ √ √
Home garden √ √ √
Smallholder oil palm √ √
Oil palm estate √
Smallholder rubber monoculture √ √
Rubber monoculture estate √ √ √
Rubber agroforest √ √ √
Forest √
Each cluster, however, showed different description of land-use value, as shown in Figure 3. Rubber agroforest was most prioritized in Cluster 1, on the other hand, it was less prioritized in Cluster 2. The value of rubber agroforest in Batu Silangit village (Cluster 1) was very high, since they cultivated rubber within their systems. Batu Silangit was an enclave village and most

70
people who lived there had a close relationship with the rubber plantation, however, interestingly, they preferred to cultivate rubber trees in mixed systems. The main reason for this was limited land ownership: on average, farmers had 0.5–2 ha. Therefore, they had to optimise the use of their plots, not only for income but also for subsistence needs, by planting food and fruit trees and other useful trees.
In Cluster 2, which consisted of Naga Raja and Aek Bamban villages, the highest value land use was smallholder oil palm followed by irrigated paddy field. Previously, in Aek Bamban village, cultivation of irrigated paddy rice and rubber played a leading role in the village’s livelihood. Currently, paddy rice farming is slowly vanishing owing to erratic water supply for irrigation. Most of the irrigated paddy lands have been converted to oil palm plantations, such as the two big private company oil palm plantations close to Aek Bamban village. Naga Raja village is located close to the BSRE, but river water flow in the area is influenced by a private oil palm plantation in Sipispis sub-district.
2.67
5.32
5.77
8.06
9.16
9.33
9.53
10.90
10.99
0 2 4 6 8 10 12
Rubber estateOil Palm estate
Home gardenDry rice fields
Irrigated rice fieldForest
Smallholder monoculture rubberSmallholder Oil palm
Rubber agroforest
Value (%)
Figure 2: Farmers’ descriptions of land-use value
Rubber and oil palm plots in Cluster 3 had the highest value, followed by smallholder oil palm plots and rubber agroforestry systems. Rubber had higher value than oil palm, but the difference was not significant.
Figure 3: Farmers’ descriptions of land-use value per cluster
1
2
5.38
1,25
7.69
3.92
2,75
1,5
3,5
9.16
3.33
0
4,375
9.33
7.58
10.83
2,5
12.01
10.17 9
0 2 4 6 8 10 12 14
Cluster 1
Cluster 2
Cluster 3
Value (%)
Forest
Rubber estate
Smallholder monoculturerubberHome garden
Rubber agroforest
Smallholder Oil palm
Oil Palm estate
Dry rice field
Irrigated rice field

71
3.2. Biodiversity Functions
Biodiversity provides ecosystem services, such as provisioning, regulating, cultural and supporting services (Pagiola et al., 2004). Our study showed rural communities who have direct dependence on diverse local natural resources have various perceptions on the value of biodiversity. People’s understanding of biodiversity was closely associated with livelihood patterns and social life, as biodiversity contributed to their daily needs, and related to their knowledge. Perceptions of different user groups (for example, farmers, hunters) varied and there was a noted difference depending on distance to natural resources, access to markets, etc.
Table 3: Functions of each land-use type relative to function of biodiversity
Row Labels Forest Home garden
Rubber agroforest
Rubber estate
Smallholder monoculture rubber
Oil palm estate
Smallholder oil palm
Irrigated rice field
Dry rice field
A. Direct functions:
Source of income High High High Medium High Medium High High High
Source of food Medium High Low No Low No Low High High
Source of fuel wood Low Low Low High Medium Low Low No Low
Raw material for house building High Low Low No Low Low Low No Low
Material for handicraft Medium Low Low No Low Medium Low Low Low
Medicinal plants Medium High Low No Low No Low Low Medium
Raw material for tools Low No Low No Low No Low No Low
B. Indirect functions:
Grazing land or source of fodder Low Low Low High Low High Low Medium Low
Animal habitat High No Low No Low No Low No No
Erosion prevention High Low Low Low Low Low Low Low Low
Note: High, Medium and Low indicated the diversity of plants and animals within each land-use systems
Table 3 shows the relational function of biodiversity in the different land-use systems. Forests were perceived as an important habitat for wild animals, such as monkey, snake, wild boar, bat, squirrel, civet cat, trenggiling (scaly anteater), reptiles, bear, peacock, deer, kancil (mouse deer), tiger, gibbon, hornbill, crow, magpie and parrot. Rubber agroforestry systems have medium-to-low value in terms of wild animal habitat, even though the systems are not significantly different from smallholder monoculture rubber and smallholder oil palm. The participants mentioned that wild boar, snake and bat were often found in the systems. Although local people during the scoring exercise consistently said other land uses were not important as animal habitat. They mentioned that they still found some bird species, bat, rat, snake, etc. Forests and rubber agroforestry performed the highest biodiversity value, followed by homegarden, dry rice field and smallholder monoculture rubber and irrigated paddy systems.
People also understood that forest had the highest function as erosion control, as these area are prone to soil erosion due to topography. Most villagers in each area mentioned this. All rubber plots under mixed and monoculture systems were perceived as good value in

72
preventing erosion, while oil palm plots were of relatively low value. Interestingly, in Cluster 3, in particular in Huta Rao village, farmers agreed that the use of the rubber estate for erosion control was good, as the village was in a mountainous area. They mentioned that rubber monoculture functioned as erosion control better than that of oil palm plantation. Oil palm expansion in this area was relatively high. The villagers mentioned some species as erosion control, such as bamboo, rattan, betel nut, mahogany, Erythrina, lemon grass, Hibiscus tree (‘waru’), ‘glagah’ (a family of Cyperaceae) and ‘jati putih’ (Gmelina). Hibiscus tiliaceus, bamboo and Gmelina were good in preventing landslides and erosion in riparian areas.
1
2
2.15
1.25
1.5
2.5
2.75
1.5
3.5
4.20
3.33
4.37
5.5
4.40
4.33
2.5
129
0 2 4 6 8 10 12 14
Cluster 1
Cluster 2
Cluster 3
Value (%)
Forest
Rubber estate
Smallholder monoculture rubberHome garden
Rubber agroforest
Smallholder Oil palm
Oil Palm estate
Dry rice field
Irrigated rice field
Figure 4: People perception on erosion function of each land use type
People usually used the rubber or oil palm plantations for grazing. ‘Rumput paitan’ (Paspalum conjugatum), ‘rumput babi’ (Leptaspis urceolata) and ‘rumput putihan’ (Clibadium surinamense), that grew wild in the plots, were used as fodder, in particular, for cows and goats. Villagers also mentioned ‘rumput gajah’ (Panicum maximum). Actually, grazing was not allowed inside the plantation but because people didn’t have other alternatives they still used the area since animal husbandry had become an important livelihood source. There was no alternative pasture nearby.
Rubber agroforests provided sources of raw materials for handicrafts and farming equipment for three groups of villages. Oil palm plots remained important for handicrafts as they could provide palm midribs for brooms, in particular, in Aek Bamban village. Old trunks oil palm can be used as handles for machete and plaited leaves can be used as house walls. Irrigated and dry paddy areas were important for grass that could be used for floor mats. Villagers also used leaves of palm sugar (Arenga pinnata) for brooms and raw material for roofs.
Connection of biodiversity and health is multifaceted, intrinsic and dynamics. Agroforest system provide biodiversity with some of the diversity is valuable for medicine and nutrition (Heywood 2013). Our study showed, home gardens, dry rice fields and rubber agroforests were three important land-use systems for medicinal plants. Naga Raja village was one step ahead of other villages as there was a demonstration plot at the village office for many kinds of medicinal plants. The main species that were used as medicine were ginger (Zingiber officinale Rosc.), turmeric (‘kunyit’; Curcuma domestica Val.), java turmeric (‘temulawak’; Curcuma

73
xanthorriza Roxb.), ‘lempuyang’ (Zingiber spp.), ‘laos’ (galangal; Alpinia galangal), ‘bengle’ (Zingiber cassumunar), sand ginger (‘kencur’; Kaemferia galangal), ‘jeringo’, ‘payang’ (Mangifera payang), betel nut (‘pinang’; Areca catechu), ‘andi lotung’, sugar palm (‘aren’; Arenga pinnata), ‘pasak bumi’ (Eurycoma longifolia), bark of ‘maibung’ (Millettia atropurpurea), leaves of ‘jarak’ (Ricinus communis Linn.), ‘bunga raya’ (Hibiscus rosa sinensis), ‘setawar’ leaves (Costus speciosus), ‘kelundang’ root, ‘kulit manis’ (Cinnamomum sp.) and ‘sambiloto’ (Andrographis paniculata).
Raw materials for housing and construction, such as timber, mainly came from the forest. However, poor families used palm midribs and leaves as house walls. Therefore, oil palm plots have become an important source of building materials. Home gardens and rubber agroforests were also important land uses as source of raw materials for building in every cluster of villages. The main species for constructions were meranti (Shorea sp.), durian (Durio zibhetinus), coconut tree (Cocos nucifera), white teak (Gmelina arborea), ‘rambai’ (Baccaurea motleyana), mangosteen (Garcinia mangostana L.), stinky bean (Archidendron jiringa), Indian devil tree (Alstonia scholaris), paraserianthes (Paraserienthes falcataria), candle nut (Aleuritus moluccana), jackfruit (Artocarpus integra), ‘kayu losa’, mahogany (Swietenia macrophylla), ‘dadap’ (Erythrina variegate), ‘kayu raja’ (Endospermum sp.), ‘kayu laban’ (Vitex sp.), ‘kayu johar’ (Senna sp.), and ‘cempedak’ (Artocarpus champedan).
Traditional agricultural landscape that leads to maintenance diversity crops in a landscape can provide 20% of world medicinal and food crops (Heywood 2013). In the study sites of North Sumatera, irrigated paddy and croplands were very important land uses for food production. Home gardens, followed by rubber agroforests, were tree-based land-use systems that were also important for food production. In some villages, smallholder oil palm was important as a food source, because some villagers occasionally consumed oil palm tubers and shoots (edible topmost frond). The main species known as important food sources were durian (D. zibhetinus), champedan (Artocarpus integer), ‘bedaro’ (Canarium littorale), ‘duku’ (Lansium domesticum), Parkia speciosa, stinky bean (A. jiringa), ‘kabau’ (Pithecelobium lobatum), rambutan (Nephelium lappaceum), B. motleyana, ‘langsat’ (Lansium sp.). Most of the plants were not deliberately planted, but they mostly naturally grow. The trees were not maintained with fertiliser or insecticide applications.
People in the surveyed villages mostly used fuel wood for cooking (70–80% of participants). Rubber wood was the main source of fuel wood since it can be easily found in local rubber plots as well as in rubber plantations nearby. The villagers collected fallen branches or dead trees. In the villages near to rubber plantations, residents preferred to collect fuel wood from the plantations. Rubber agroforests were also important as sources of fuel wood because they contained some important fuel wood species such as P. speciosa, A. jiringa, candle nut (A. moluccana), rambutan (N. lappaceum), cocoa (Theobroma cacao) and Syzigium sp.
Most of the land uses functioned as sources of income; some tree species grown in the plots produced marketable products, which could be sold for cash. Table 3 shows that the estate plantation plots provided little value as income sources because villagers had no access for profit-making ventures. The most important source of income was from smallholder oil palm plots followed by smallholder rubber monoculture plots. Smallholder oil palm and monoculture rubber provided the highest values as sources of income, contributing the highest proportion of household income. Other important saleable products came from dry rice fields, rubber agroforests and home gardens, derived from durian, ‘jengkol’, ‘petai’, banana and cocoa. Forest also considered high in terms of income source, as it could provide timber. Mahogany and teak are the main timber products from the forest area. Eventhough extraction of timber from the forest area is not formally allowed, some of them were still produce. A list of useful plants and animals in each land use type is shown in Table 4.

74
4. CONCLUSIONS
This study revealed some local knowledge of biodiversity issues. People’s perceptions on biodiversity were mostly based on direct use values which related to their daily life. People usually only focussed on phenotype characteristics or observable qualities, such as source of food and income. Rubber and oil palm were the most important species as source of income for the local communities. Fruit trees, such as petai (P. speciosa), jengkol (A. pauciflorum), and durian (D. zibethinus) were the most important species as source of food.
Home gardens and rubber agroforests remained important as sources of particular livelihoods for people in the three groups of villages. The two land uses had high values for subsistence and marketing purposes, which was expressed in every discussion.

75
Table 4: List of valuable plants and animals in each land use type Functions Smallholder oil
palm Rubber agroforest Irrigated paddy field Dry rice field Homegarden Rubber
monoculture Animal Bat, snake
perkutut/ turtledove (Geopelia sp.) quail (puyuh/ gemek), squirrel
Bat, perkutut/turtledove (Geopelia sp.), squirrel monkey, wild boar, snake
Keong (Pomacea canaliculata Lamarck), rat (Rattus argentiventer), jangkrik (cricket; Gryllus sp.), wereng (Nilaparvata lugens), kepinding (Scotinophora coarctata), walang sangit (Leptocorisa acuta)
Wild pig (Sus scrofa), monkey snake, squirrel
Rat, jangkrik (cricket; Gryllus sp) centipede (kelabang) scorpion, chicken duck,
Bat, wild boar, snake squirrel
Food Petai (Parkia speciosa) jengkol (Archidendron pauciflorum), durian (Durio zibhetinus) Candle nut (Aleuritus moluccana)
Paddy, soy bean Maize, eggplant, cassava, banana, long bean, petai, jengkol (Archidendron pauciflorum), chilli, candle nut (Aleuritus moluccana), sweet potato, taro (caladium)
Banana, rubber, rambutan (Nephelium sp.) jambu air (Eugenia aquea Burm), jambu klutuk (Syzigium sp.), papaya
Fuel wood Oil palm fruit Rubber, jengkol, petai - Petai, jengkol, candle nut (Aleuritus moluccana)
Rambutan (Nephelium lappaceum),Cocoa (Theobroma cacao),Jambu (Syzigium sp.)
Rubber
Source of income
Rubber (sap and wood), durian (fruit and wood), jengkol (fruit and wood), petai, candle nut
Paddy, soy bean Durian, jengkol, petai
Cocoa, jambu air, rambutan, jambu klutuk
Rubber: latex, wood and fruit for seed
Construction Palm midrib for traditional house walls
Durian, petai (Parkia speciosa), jengkol (Archidendron pauciflorum) mahogany, teak
- Jengkol,Candle nut, Durian Rumput paitan Rumput paitan, rumput gajah
Medicinal plants
- Sirih, candle nut, Rumput artisan , Suwawa (rumput tai babi)
Daun ekor anjung (scientific name unknown), Tapu arang (scientific name unknown)
Andi lotung (white flower) (scientific name not known) jeruk purut (Citrus aurantifolia)
Ginger, kencur, kunyit, lengkuas, bengle, jeringo sirih (Piper betle), sereh (Cymbopogon winterianus), kembang sepatu/daun bunga raya (Hibiscus rosa-sinensis),pinang (Areca catechu)
Sirih, sambiloto (Andrographis paniculata), ciplukan (Physallisa angulata)
Fodder Gelagah (Sacharum spontaneum)
Gelagah (Sacharum spontaneum) Gelagah (Sacharum spontaneum) Gelagah (Sacharum spontaneum) - Rumput Markani Korok korok
Handicraft and tools
Arenga pinnata Durian, jengkol, Rubber wood
Pandanus Banana leaves (Musa sp.), Jengkol wood, candle nut, durian wood
-
Erosion prevention
Pinang (Areca catechu), bamboo, rumbia (Metroxylon sp.), waru (Hibiscus tiliaceus)
Rattan, bamboo Pinang
Waru (Hibiscus tiliaceus) Rambutan, jambu Legumes
Bamboo, pinang

76
Oil palm and rubber plantations where grasses were abundant for fodder played a role as grazing areas. These areas held potential for greater production of livestock but, on the other hand, could cause some problems for the main commodity production of the estate companies. Extension services and community development are necessary to improve the awareness of villagers in livestock management, for example, building a cattle pen and introducing compost processing of cattle dung for manure, and bio-gas. These approaches could create a win-win solution beneficial for both the company and local people.
5. ACKNOWLEDGEMENTS
The study was financially funded by the Bridgestone company through PT. Bridgestone Sumatera Rubber Estate, under project of “Toward a biodiverse rubber estate: Quick biodiversity survey of Bridgestone Sumatera Rubber Estate, North Sumatera” for the World Agroforestry Centre (ICRAF) Southeast Asia Regional Office.
6. REFERENCES
Helm, D., and Hepburn, C (2012): The economic analysis of biodiversity assessment. Oxford Review of Economic Policy. 28(1):1-21.
Heywood V H (2013): Overview of agricultural biodiversity and it’s contribution to nutrition and health.. In: Diversifying Food and Diets: Using Agricultural Biodiversity to Improve Nutrition and Health, ed. J. Fanzo, D. Hunter, T. Borelli, F. Mattei . Routledge. 35 – 60p.
Huq, M F (2000): Biodiversity-based rural strategy for poverty alleviation. In: search for insight and element from the experience of Nayakhrishi Andolon (new agricultural movement) in Bangladesh. Paper presented in Workshop on Biodiversity for Poverty Alleviation, Nairobi 12-14 May 2000. Jennings, M D (2000). Gap analysis: concepts, methods, and recent results. Landscape ecology, 15(1):5-20.
Pagiola, S, von Ritter, K, Bishop, J (2004): Assessing the economic value of ecosystem conservation. Environment Department Paper No. 101. The World Bank. Washington, USA.
Sheil, D, Puri, R K, and Basuki, I, van Heist, M, Wan, M, Liswanti, N, Rukmiyati, Sardjono, M A, Samsoedin, I, Sidiyasa, K, Chrisandini, Permana, E, Angi, E M, Gatzweiler, F, Johnson, B, and Wijaya, A (2002): Exploring Biological Diversity, Environment and Local People’s Perspectives in Forest Landscape; Methods for Multidiciplinary Landscape Assessment. CIFOR, Bogor.
Solis-Rivera, V (2000) Poverty alleviation and environmental services in Costa Rica. Paper presented in Workshop on Biodiversity for Poverty Alleviation, Nairobi 12-14 May 2000.
Sutherland, W J: (2000) The Conservation Handbook: Research, Management and Policy. Blackwell Science, Oxford.

77
INAFOR A-0061
THE SECOND INTERNATIONAL CONFERENCE OF INDONESIA FORESTRY RESEARCHERS
THE 2nd INAFOR, 27-28 AUGUST 2013
Impact of Open Access Roads to Deforestation of Tesso Nilo Forest, Sumatera, Indonesia
Sri Mariati1, Jatna Supriatna1,2, Raldi Hendro Koestoer1, and Haryoto Kusno Putranto1
1 Graduate Program on Environmental Science, and 2 Department of Biology and Research Center for Climate Change, University of Indonesia Corresponding email: [email protected] or [email protected]
Paper prepared for The Second International Conference of Indonesian Forestry Researchers (INAFOR)
27-28 August 2013
INAFOR SECRETARIAT Sub Division of Dissemination, Publication and Library
FORESTRY RESEARCH AND DEVELOPMENT AGENCY Jl. Gunung Batu 5, Bogor 16610

78
Impact of Open Access Roads to Deforestation of Tesso Nilo Forest, Sumatera, Indonesia
Sri Mariati1, Jatna Supriatna1,2, Raldi Hendro Koestoer1, and Haryoto Kusno Putranto1
1 Graduate Program on Environmental Science, and 2 Department of Biology and Research Center for Climate Change, University of Indonesia Corresponding email: [email protected] or [email protected]
ABSTRACT
Tesso Nilo forest (377,387 hectares), is located in the Riau province of Sumatera island, Indonesia. It is home to endemic and charismatic wildlife species including Sumateran elephants, Sumateran tigers, and many other mammals, birds and reptiles. This forest block consists of Taman Nasional Tesso Nilo (Tesso Nilo National Park), Production Forest areas belong to 2 companies, and a small Recreation Park. It is also one of the most important mixed peat swamp forest that has been degraded requently with burned forests and peats during dry season. The smoke from forest fire in Tesso Nilo has spread into several countries such as Malaysia and Singapore on yealy bases. For that reason, Indonesia Government has been trying to manage this forest block from forest destruction, encroachment and forest fire. Those problems were started because of several weakness on regulation such as uncertainty on laws related to the forest governance, weak on law enforcement, unclear on the gazetment of the park and forest block borders, uncoordinated in planning among those who manage the forest, and open access roads. The encroachment and forest burning has changed the forest rapidly especially when road development crisscrossing adjacent of the park. Here we track changes in forest cover before and after road construction using GIS and remote sensing imagery. The criscrossed roads in the Tesso Nilo Forest had been developed by private sectors from South to North (Baserah road along 50 km built in 2001-2002 with average 20 meters wide), and from East to West (Ukui road along 28 km built in 2004-2005 with average 20 m). Those roads have been used to transport forest products from the pulp and paper companies that reside around the park. Based on our study is confirmed that deforestation in 2000 (1-5.7%) and increased significantly in 2012 (>91%). Deforestation has occurred in the former logging concession area of Nanjak Makmur, in the current logging companies of Siak Raya Timber and Hutani Sola Lestari, and also in the Tesso Nilo National Park. Some suggestions are made for lowering this rate and by doing so slowing rate of forest loss and reducing the frequency of forest fire and haze off shore.
Keywords: Roads Impact, Deforestation, Tesso Nilo Forest, Riau, Sumatera, Indonesia,
1. INTRODUCTION
Sumatera’s lowland tropical forests, the richest in timber resources and biodiversity, are most at risk since development come into force in early 70, the rate of forest loss is accelerating by then. Sumatera is the second after Kalimantan that has the highest forest loss with 6.6 million ha or about 557 thousands ha per year during year 70s to early 90s. Deforestation of those two big islands are among the highest in Indonesia (Sunderlind and Resosudarmo 1996). Purnama (2004) stated that Indonesia deforestation was 1.6 million per ha in 1997-2000 then becomes double up to 3.8 million ha per year from 2000 to 2003 due to uncontrolled illegal logging, illegal smuggling and land conversion. For two decades, Sumatera forest has lost 7.5 millions and 2.6 millions were natural tropical rain forest (Margono, et al., 2012). From this total forest

79
area, the biggest potion or about 30% (5 million ha) of it located in Riau Province. In this province, although has relatively extensive forest, approximately 8.6 million ha (Pemerintah Provinsi Riau 2010) and highest lost counted to about 42% destroyed between 1990 and 2010 (Margono et al., 2012). Within Riau province, the Tesso Nilo Forest block is the largest block of forest left (377,387 ha) with most of them are lowland tropical rain forest, heat forest and peat swamp forest (Mariati, 2004 ).
As similar pattern everywhere in other forest areas in Sumatera, the major problems of forest lost in this island were primarily logging activities either legal and illegal, conversion of natural forests to industrial plantations, and forest encroachment by communities. Although Indonesia’s forest law allows selective logging under a system that would leave the forest 35 years to recover, companies seem to over-log the area deliberately. After that an application is submitted to the government to have the over-logged area declared “degraded”, which implies that the area is no longer fit to be called a forest and should be converted to a plantation. This change in status requires an official reclassification of the forest land. Once that change of status is approved, another company – often a sister belonging to the same conglomerate–applies for a license to convert that new “wasteland” forest to either oil palm or acacia pulp wood plantation. Whichever plantation it will be, the remaining trees are removed and go to a pulp mill. Then either oil palm or acacia plantations are established, the products of which go to the respective mills, likely to be members of the same conglomerate (WWF 2004).
Information on forest lost in Riau has been gathered by government agencies, NGOs and scientists, but it has not been used yet to predict accurately rates and total amounts of forest lost. Here we describe the rate of deforestation in the Tesso Nilo Forest by mapping changes in its extent and by calculating the rate of deforestation post road construction. We also describe possible impacts on wildlife especially elephants and the interactions between companies, communities and government agencies and propose some policies and actions to help mitigate forest loss.
2. MATERIALS AND METHODS
The Tesso Nilo Forest covers an area of 377,387 ha and is located in the Pelalawan, Kuantan Singingi, Kampar and Indragiri Hulu Districts, in the province of Riau in the central part of Sumatera (ca. 102°E and equator). The forest block is surrounded by Acacia plantations (80%) and by oil palm estates (13%) and by the forest borders village gardens (5%). This forest is about 3.0 hours drive south of Pekanbaru, the capital of the Sumateran province of Riau. Riau is one of the richest provinces in Indonesia, yet more than 40% of the population lives below the poverty line.
The Tesso Nilo Forest harbors humid tropical lowland forests and some peat swamp forests and its altitude ranges from 0 to 125 meters above sea level. With annual rainfalls of 2000-3000 mm, this lowland tropical rainforest classifies as super humid. During the occurrence of the El Niño phenomenon, however, many trees may be defoliated and some eventually die off. Episodic droughts of this kind facilitate forest removal by human-induced fire, as has been the case in recent years.
In the late 70s, Tesso Nilo Forest, formerly name Langgam Forest, was set aside for limited forest production. However, in early 80s, the nearby forest block was cleared for planting acacia trees for plywood industry, oil palm plantation and resettlement. In 2004, Ministry of Forestry declared the former log-over area of Inhutani company into a new established Tesso Nilo National Park (38,576 ha). In 2009, Ministry of Forestry added more land for the national park by converting the Nanjak Makmur logging concession (44,492 ha ), so the total

80
area of the park is about 83,018 ha. The remnant forest block along with National park are logging concessions of Siak Raya (40,600 ha), and Hutani Sola Lestari (36,185 ha).
The crisscrossed roads at the Tesso Nilo forest were built by Pulp and Paper industry because their plantation sites are located in west and east side of the forest block. In 2002-2004, the Basarah road was built north to South crossing 50 km, while Ukui road was built in west to east for 30 km in 2004-2006, with both average wide is 20-25 m.
In order to understand the rates of deforestation, overlaying technique Landsat imagery interpretation and calculation of the average deforestation rate using the formula Puyravaud (2003) has been the primary used. Percentage calculations deforestation (P) of the concession area /National Park was using the formula (Ministry of Forestry, 2008). We are using a Land Use and Land Use Change Cover on the analog format at the scale of 1:250,000 from 2000-2012. This source originally came from Satellite images and then was validated using Google map and ESRI online base map. Database was analyzed by software Arc GIS 10.
3. RESULTS AND DISCUSSION
Riau province originally has more than 8.6 million hectares of forested land but it has been deforested by mid 1990s, and still remains only 29% most of them are in Tesso Nilo forest. This Tesso Nilo lowland and peat forests are heavily threatened by small and large-scale forest conversion. Between 1990 and 2002, Tesso Nilo lost their forest through conversion of legal and illegal logging, settlements, oil palm and pulp wood plantations and other forms of agriculture. At this stage, deforestation according to our research site in the Tesso Nilo Forest, concentrated mostly in the logging concessions. This highly deforestation is primarily
Ukui Road
Baserah Road
Figure 1: Tesso Nilo research sites, boundary of companies and national park and new roads built

81
due to the demand for timber of all types that has put enormous pressure on Tesso Nilo forest.
The results of our study showed that the biggest impact toward the Tesso Nilo forest besides those above activities it came from the opening access in the middle of the forest, building the roads Baserah and Ukui. These two roads have significantly increased in the percentage of deforestation rates of Tesso Nilo Forest. Changes in natural forest cover showed mostly in the abandoned logging concessions through illegal logging activities. In general the deforestation from 2000-2012 with an average annual deforestation is 9.28% per year or 8,156.97 ha.
If we look into yearly bases deforestation rates, the highest occurred after those 2 roads were built. The average rate of deforestation between 2000 and 2002 was 2.40% per year (before Baserah road built). The average rate of deforestation between 2002 and 2004 almost double up to 4.06% per year (after Baserah road construction) and triple after Baserah and Ukui roads were completed between 2005 and 2012 that was 13.88% per year (Fig 2).
From our analysis, it seems that the two roads corridor which transporting goods and products from pulp and paper industry, has induced the encroachment and forest conversion. Yearly deforestation rates between 2000-2012 was 9.28% or the forest cover lost was 8,156.97 ha.
Figure 2 shows that the deforested area in PT Hutani Sola Lestari, a logging company that crossed by Baserah road in its concession, increased significantly from 1.70% (2000) to 17.66% (2002) after the Baserah was built. After Baserah and Ukui roads established, deforestation rates increased at Hutani Sola Lestari Logging company approx. 38.79% of the concession area (2007). Therefore, overall the deforestation at this company in the year of 2000-2012 was 72.63% of concession area (Fig 2).
Figure 2: Deforestation in logging concession and National Park 2000-2012
Figure 2. Graphs of deforestation of companies and national park from 2000-
2012

82
At the Nanjak Makmur logging company the average deforestation rate before 2000 was about 1.01 %, which is lower than any other company. Deforestation rate increased a little bit up to 3.43% at 2002. It then jumped up significantly in 2005 after roads were built up to 8.08%, which is more than 2 times increased. If we calculated overall deforestation of concession area in Nanjak Makmur was about 73.15% in 2012. This increased rates even were still happening when the whole forest of Nanjak Makmur was converted into Tesso Nilo National Park (phase 2) in 2009, with the decree based on Ministerial Decree (663/Menhut-II/2009).
Deforestation rates at Siak Raya originally was only 5.71% in 2000 but then it becomes double (9.52%) in 2002 and increased significantly up to 91.12% in 2012. In comparison to other companies in Tesso Nilo, Siak Raya Timber overall 12 years calculation of deforestation rates are higher at 19.69% per year. The reversed of the trend was on the Tesso Nilo National Park phase 1, which showed deforestation rates it becomes lower than when this forest status was a logging concession. This area was logged over forest but then it recovered and reforested up to 2.69% from 2000 to 2002 per year and 1.28% in 2002 to 2004 before this forest declared national park. This first phase national park was equipped with a management unit in 2007, so the gaps between 2004 to 2007 was getting help and managed by WWF Indonesia. If we calculate the overall deforestation rates at the park in 12 years from 2000 to 2012, included with the company status in 2000-2004, it seems that deforestation is very low, approximately only 1.74 per year but then increased significantly in 2012 up to 41.84%.
From our finding that the roads were built across the Tesso Nilo Forest block have significantly increased deforestation rates at the logged over area but very little to the forested area managed by the park authority. Roads were giving access to the pulp and paper company to transport their goods but at the same time also induced the free raiders either community leaders or illegal loggers from other places to encroach the forest. These more than 80 km access roads were used by encroachers not only following the existing roads to cut the trees but also with the existing community around the forest and making a new small access deep into the forest. Therefore, the picture of deforested area looks like a comb, with the roads as an axis plus many new small huts and small house selling encroachers need along the main roads. These patterns were found in many other tropical countries. Etter et al., (2006) found that accessibility toward forest area is the important variable in pattern of the deforestation. In general, the cause of deforestation is the land use change due to the conversion of the forested land for agriculture, plantation and timber activities (Geist and Lambin, 2001).
The roads were built by pulp paper industry in order to transport their products have been done in many places in Sumatera. The pulp and paper industry causes very challenging problems in Sumatera, especially in Riau and Jambi. Indah Kiat, one of Sumatera's largest pulp and paper companies, used 6.8 million cubic meters of pulpwood in 1999, about 87% of which was developed from mixed tropical hardwoods, or wood generated from cutting forests, not from its plantations. In Riau, there are two big pulp and paper mills, which are Riau Andalan Pulp and Paper or under its international entity, Asia Pacific Resources International Holdings (APRIL) and the Indah Kiat pulp mill, owned by Asia’s largest paper and pulp company outside of Japan, Asia Pulp and Paper (APP), located in Perawang. Riau Andalan Pulp and Paper is estimated to convert four million cubic meters of wood into 750,000 tones of pulp each year while Indah Kiat mill convert 790,000 tones per year. According to study by Barr (2000), Indah Kiat mill is slated to consume 200 square km of old growth forest per year until its plantations mature and conducted by research the Center for International Forestry Research (CIFOR) found that Indah Kiat has deforested about 278,000 hectares over the past 12 years.
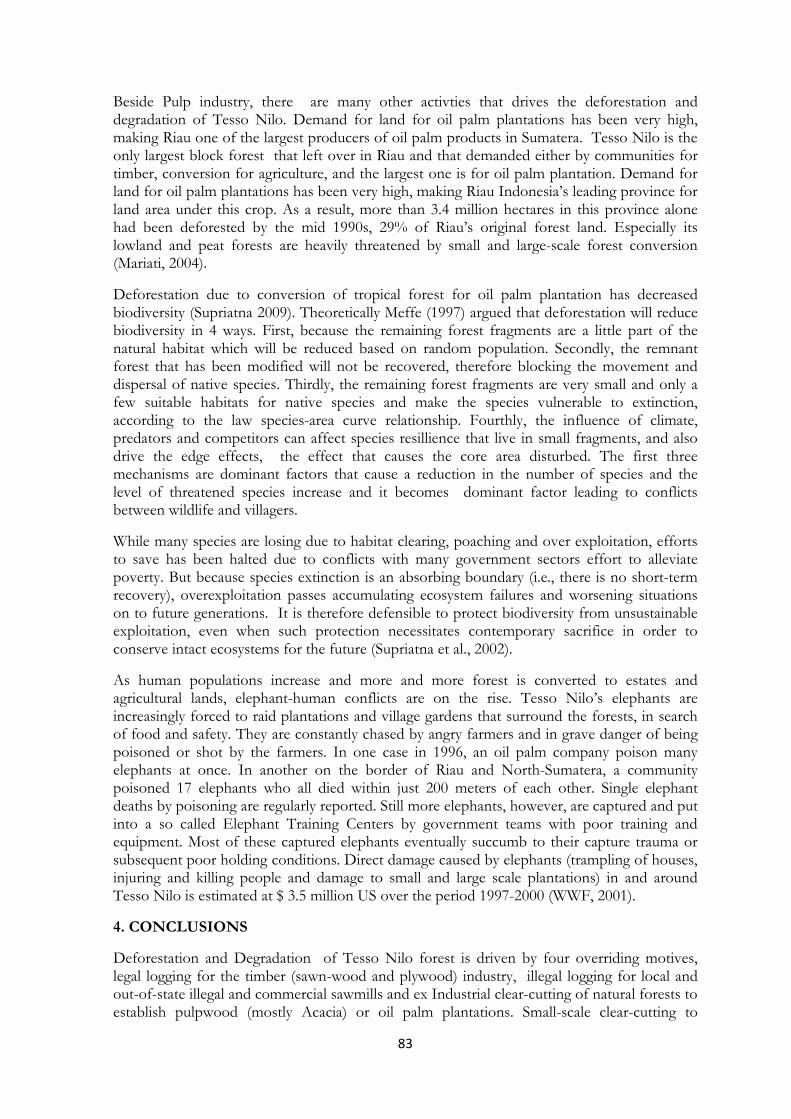
83
Beside Pulp industry, there are many other activties that drives the deforestation and degradation of Tesso Nilo. Demand for land for oil palm plantations has been very high, making Riau one of the largest producers of oil palm products in Sumatera. Tesso Nilo is the only largest block forest that left over in Riau and that demanded either by communities for timber, conversion for agriculture, and the largest one is for oil palm plantation. Demand for land for oil palm plantations has been very high, making Riau Indonesia’s leading province for land area under this crop. As a result, more than 3.4 million hectares in this province alone had been deforested by the mid 1990s, 29% of Riau’s original forest land. Especially its lowland and peat forests are heavily threatened by small and large-scale forest conversion (Mariati, 2004).
Deforestation due to conversion of tropical forest for oil palm plantation has decreased biodiversity (Supriatna 2009). Theoretically Meffe (1997) argued that deforestation will reduce biodiversity in 4 ways. First, because the remaining forest fragments are a little part of the natural habitat which will be reduced based on random population. Secondly, the remnant forest that has been modified will not be recovered, therefore blocking the movement and dispersal of native species. Thirdly, the remaining forest fragments are very small and only a few suitable habitats for native species and make the species vulnerable to extinction, according to the law species-area curve relationship. Fourthly, the influence of climate, predators and competitors can affect species resillience that live in small fragments, and also drive the edge effects, the effect that causes the core area disturbed. The first three mechanisms are dominant factors that cause a reduction in the number of species and the level of threatened species increase and it becomes dominant factor leading to conflicts between wildlife and villagers.
While many species are losing due to habitat clearing, poaching and over exploitation, efforts to save has been halted due to conflicts with many government sectors effort to alleviate poverty. But because species extinction is an absorbing boundary (i.e., there is no short-term recovery), overexploitation passes accumulating ecosystem failures and worsening situations on to future generations. It is therefore defensible to protect biodiversity from unsustainable exploitation, even when such protection necessitates contemporary sacrifice in order to conserve intact ecosystems for the future (Supriatna et al., 2002).
As human populations increase and more and more forest is converted to estates and agricultural lands, elephant-human conflicts are on the rise. Tesso Nilo’s elephants are increasingly forced to raid plantations and village gardens that surround the forests, in search of food and safety. They are constantly chased by angry farmers and in grave danger of being poisoned or shot by the farmers. In one case in 1996, an oil palm company poison many elephants at once. In another on the border of Riau and North-Sumatera, a community poisoned 17 elephants who all died within just 200 meters of each other. Single elephant deaths by poisoning are regularly reported. Still more elephants, however, are captured and put into a so called Elephant Training Centers by government teams with poor training and equipment. Most of these captured elephants eventually succumb to their capture trauma or subsequent poor holding conditions. Direct damage caused by elephants (trampling of houses, injuring and killing people and damage to small and large scale plantations) in and around Tesso Nilo is estimated at $ 3.5 million US over the period 1997-2000 (WWF, 2001).
4. CONCLUSIONS
Deforestation and Degradation of Tesso Nilo forest is driven by four overriding motives, legal logging for the timber (sawn-wood and plywood) industry, illegal logging for local and out-of-state illegal and commercial sawmills and ex Industrial clear-cutting of natural forests to establish pulpwood (mostly Acacia) or oil palm plantations. Small-scale clear-cutting to
84
generate wood for the pulp industry and to establish community oil palm plantations. Roads built crisscrossed the forest in Tesso Nilo Forest were triggering more high deforestation rates due to free raiders, encroachers by local communities and by irresponsible companies to get more grabbed land. Those problems are facilitated by four overriding factors: first, poor “interpretation” of laws and regulations when licenses are issued. Secondly, construction of roads and corridors facilitate legal log extraction. Thirdly, poor enforcement of laws and regulations. Fourthly, willingness of the legal industry to accept illegally harvested timber.
ACKNOWLEDGEMENTS
We thank to our colleagues who help in training, formulating and letting the GIS equipment was used, especially Weda and Samsuardi from WWF Indonesia, Hendi Sumantri from Conservation International, Chris Margules from James Cook University, Grace Wong from CIFOR, our colleagues at the University of Indonesia’s Post Graduate Study on Environment and many other people in Tesso Nilo and Riau provinces that we cannot put their names due to the limited space.
6. REFERENCES
Barr, C. (2001). The Political economy of the fiber and finance in Indonesia’s pulp and paper industry. In: Banking on Sustainability: Structural adjustment and foretsry reform in post-Suharto Indonesia. CIFOR and WWF, Washington DC, 70-95.
Etter, A., Mcalpine, C., Wilson, K., Phinn, S., & Possingham, H. (2006). Regional patterns of agricultural land use and deforestation in Colombia. Agric. Ecosyst. Environ. 114: 369–386.
Forest Watch Indonesia. (2001). Expert Review Workshop ‘The State of The Indonesian Forest Report. Bogor 29-30 June 2001. FWI. Bogor.
Geist, H., & Lambin, E. (2001). What drives tropical deforestation? A meta‐analysis of proximate and underlying causes of deforestation based on subnational case study evidence. LUCC Report Series 4, CIACO, Lou- vain‐la‐Neuve, Belgium.
Holmes, D.A. (2002). The Predicted Extinction of Lowland Forests in Indonesia. Page 7-13 in E. Wicakramanayake, E. Dinesstein, C.J. Loucks, D.M. Olson, J. Morrisa, J. Lamornux, M. McKnight & P. Heclao Eds Terresterial Ecoregions of the Indo Pacific: a Conservation Assessment. Island Press, Washington. DC (USA): 643 hlm
Margono, B. A., Turubanova, S., Zhuravieva, S., Potapov, P., Tyukavina, A., Baccini, A., Goetz, S., & Hansen. M.C. (2012). Mapping and Monitoring Deforestation and Forest Degradation in Sumatera (Indonesia) using landsat time series data sets 1990 to 2010. Environ. Res. Lett 7: 034010 doi: 10.1088/1748-9326/7/3/0341010.
Mariati, S. (2004). Analisis Kebijakan Pengelolan Hutan Studi Kasus di Hutan Tesso Nilo Kabupaten Pelalawan Provinsi Riau. Thesis. Padang.
Ministry of Forestry (2002). Statistik Kehutanan Indonesia. Jakarta.
Meffe, G. (1997). Principles of Conservation Biology. Sinauer Assosiates, Inc. Sunderland, Massachusetts.
Pemerintah Provionsi Riau (2010). Riau Dalam Angka. http://riau.bps.go.id/publikasi-online/%5Bbook-raw%5D/riau-dalam-angka-2010.html.

85
Purnama, B.M. (2004). Pengelolaan Hutan Lestari Sebagai Dasar Peningkatan Peran Sektor Kehutanan. Ministry of Forestry, Jakarta
Puyravaud, J.P. (2003). Standardizing the Calculation of the Annual Rate of Deforestation. Forest Ecology and Management 177: 593-596.
Sunderlind, W.D. & Resosudarmo, I. A. P. (1996). Rates and Causes of Deforestation in Indonesia: Towards a Resolution of the Ambiguities. CIFOR. Bogor.
Supriatna, J. (2009). Melestarikan Alam Indonesia. Yayasan Obor Indonesia, Jakarta.
Supriatna, J., Wijayanto,I, Manullang, B.O., Anggraeni, D., Wiratno, & Ellis, S. (2002). The state of siege for Sumatera’s forest and protected areas: Stakeholders view during devolution, and political plus economic crises in Indonesia. Proc. IUCN/WCPA-East Asia, Pp. 439-456, Taipei, Taiwan.
World Bank. (2001). Indonesia-Environment and Natural Resource Management in a Time of Transition. February 2001, Washington, D.C.
World Resource Institute (WRI). (2002). The State of the Forest Indonesia. Forest Watch Indonesia (FWI), World Resources Institute (WRI) and Global Forest Watch (GFW).
World Wide Fund for Nature. (2001). Analisa Konflik Gajah Dengan Manusia dan Persepsi Tentang Gajah di Hutan Tesso Nilo di Provinsi Riau. Pekanbaru, Indonesia.

86

87
INAFOR A-0063
THE SECOND INTERNATIONAL CONFERENCE OF INDONESIA FORESTRY RESEARCHERS
THE 2nd INAFOR, 27-28 AUGUST 2013
Diffusion of Knowledge: the Patterns of Policy Adoption of Protection Forest Management Unit of Kotaagung Utara in
Tanggamus Regency, Lampung Province
Julijanti1, Bramasto Nugroho2, Hariadi Kartodihardjo2 and Dodik Ridho Nurrochmat2
1Department of Forest Management, Faculty of Forestry, Bogor Agricultural University
Jl. Raya Darmaga, Kampus IPB Darmaga Bogor 16680, INDONESIA Corresponding email: [email protected]
2Department of Forest Management, Faculty of Forestry, Bogor Agricultural University
Jl. Raya Darmaga, Kampus IPB Darmaga Bogor 16680, INDONESIA
Paper prepared for The Second International Conference of Indonesian Forestry Researchers (INAFOR)
27-28 August 2013
INAFOR SECRETARIAT Sub Division of Dissemination, Publication and Library
FORESTRY RESEARCH AND DEVELOPMENT AGENCY Jl. Gunung Batu 5, Bogor 16610

88
Diffusion of Knowledge: the Patterns of Policy Adoption of Protection Forest Management Unit of Kotaagung Utara in Tanggamus Regency
Lampung Province
Julijanti1, Bramasto Nugroho2, Hariadi Kartodihardjo32 and Dodik Ridho Nurrochmat42
1Department of Forest Management, Faculty of Forestry, Bogor Agricultural University Jl. Raya Darmaga, Kampus IPB Darmaga Bogor 16680, INDONESIA
Corresponding email: [email protected]
2Department of Forest Management, Faculty of Forestry, Bogor Agricultural University Jl. Raya Darmaga, Kampus IPB Darmaga Bogor 16680, INDONESIA
Corresponding email: [email protected]
ABSTRACT Forest Management Unit (FMU) is a management unit of forest on site level, that is considered as an institution to realize the ideals of the Ministry of Forestry, i.e. sustainable forest and prosperous society. Building a FMU (i.e. the Protection FMU Kotaagung Utara) requires a decision making process of policy, involving stakeholders. This process can describe the pattern of diffusion of knowledge that occurs among stakeholders, so it will be known the progress of its adoption. This diffusion process will describe the progress of its adoption. The objective of this study are identifying and analyzing the developmental pattern of the Protection FMU Kotaagung Utara establishment in Tanggamus Regency through the progress of its adoption. This study uses both qualitative and quantitative approaches, with primary and secondary data sources. Analyses were performed by using: (1) numerical analysis, which is a technique of table facet and graphs; (2) socio-spatial analysis, which is a logical diffusion with considering the element of space (the social context) and time. The results showed that (1) diffusion of knowledge in the decision-making processes of establishment policies of Protection FMU Kotaagung Utara in Tanggamus Regency has reached 100 percent; (2) factors influencing the success of the policy adoption, among others are: (i) diffusion of knowledge is influenced by networking among stakeholders, (ii) role of opinion leaders, which is influencing the other stakeholders to adopt FMU, (iii) a willingness of stakeholders in knowing and understanding of the FMUs concept, (iv) clarity of management rights; (3) support of stakeholders to the policy decision makers is essential, especially if it is followed by legality (regional policy) and action; (4) confirmation toward the establishment policies of FMU is about 27 percent for the Protection FMU Kotaagung Utara. This confirmation can be a limiting factor to the success in the policy implementation, among others, namely legitimacy of management rights, leadership ability of the Head of Protection FMU Kotaagung Utara, and sufficient authority.
Keywords: Diffusion of knowledge, decision-making processes of policy, FMU
1. INTRODUCTION
Sustainable Forest Management is a dream to be realized by the Ministry of Forestry, in addition to public welfare in and around forests. In the forest management in order to realize a prosperous society in line with the forests, it is needed forest management units on site level and thus the Forest Management Unit (FMU) is formed. Lack of manager on site level is
89
considered as the main factors of forest management failure and disconnection of information between reality on the ground with the decisions that have been made, either at the municipal governments, provincial governments and central government (Kartodihardjo et al. 2011).
FMU is an area of forest which can be managed efficiently and sustainably based on its basic function and purpose, consisting of conservation forest, protection forest and production forest. The presence of FMUs is expected to provide the optimal role for the realizing forest sustainability and people prosperity as well as, minimizing conflicts among forestry sector.
The Protection FMU Kotaagung Utara (PFMU Kotaagung Utara) is one of the FMUs, shaped from the Working Units of Regional Devices (SKPD/WURD), through a long process. During the development process of PFMU Kotaagung Utara, many factors have influenced in the decision-making process. Policy is an innovation, which is used as a communication tool to achieve institutional goals, which can be in the form of ideas, knowledge, perception or frame of mind.
The innovation decision process is the process through which an individual (or other decision making process unit) passes from gaining initial (1) knowledge of an innovation, (2) to forming an attitude toward the innovation (persuasion), to making a (3) decision to adopt or reject, (4) to implementation of the new idea, and (5) to confirmation of this decision (Rogers 2003). Knowledge; occurs when an individual (or other decision-making unit) is exposed to an innovation's existence and gains an understanding of how it functions. Persuasion; occurs when an individual (or other decision-making unit) forms a favorable or an unfavorable attitude towards the innovation. Decision; takes place when an individual (or other decision-making unit) engages in activities that lead to a choice to adopt or reject the innovation. Implementation; occurs when an individual (or other decision-making unit) puts a new idea into use. Confirmation; takes place when an individual seeks reinforcement of an innovation-decision already made, but he or she may reverse this previous decision if exposed to conflicting messages about the innovation.
The decision-making process of policy can be understood through its diffusion process, so that can be known the progress level of its adoption (Rogers 2003; Bellanca without year; Spilsbury and Nasi 2004; Julijanti 2005). Diffusion is the process in which an innovation is communicated through certain channels over time among the members of a social system (Rogers 2003). Policy change is strongly influenced by the presence of both the diffusion process of knowledge based on theories that are relevant to policy and empirical experiences (learning process) that takes place iteratively, and it will affect the behaviour of stakeholders in interacting as responding to certain situations (Naf and Bisang 2001).
The objective of this research is: to know and to analyze the pattern of development progress of PFMU Kotaagung Utara in Tanggamus Regency through the progress of its adoption.
2. RESEARCH METHODOLOGY
This study uses both qualitative and quantitative approaches following Creswell (2010) and Patton (2002). The research site is the PFMU Kotaagung Utara in Tanggamus Regency. Both primary and secondary data were taken. Data were collected by conducting in-depth interviews, direct observation and document study (Patton 2002). Respondents were selected purposively, while the interviews were conducted through the snowball technique.
The patterns of policy adoption of the FMU development will be analyzed by using: (1) numerical analysis, which is a technique of table facet and graphs, (2) socio-spatial analysis, which is a logical diffusion with considering the element of space (the social context) and time (Bintarto dan Hadisumarmo 1987; Rogers 2003; Julijanti 2005). Stakeholders in this study

90
included: Regional Secretary, Parliament, related agencies, Head of Protection FMU Kotaagung Utara, professionals, NGOs, academics, media, and society.
The stages of analysis were performed by means:
1. Tabulation analysis: to obtain information about the position of stakeholders for each stage of adoption by time. Then, it made tabulation in percentage.
2. Charts analysis: to see the progress of decision-making processes based on final value of tabulation, so it will be discovered the points of changes at each stage of its adoption.
3. Analysis of the progress of policy adoption of FMU (particularly the Protection FMU Kotaagung Utara) will be done by accumulating all stages of adoption for each year adoption based on the final value of tabulation. This result is poured into a graph.
4. Socio-spatial analysis: to see the progress patterns of developement policy adoption of Protection FMU Kotaagung Utara based on time and space of its social interaction. The analysis was carried out to show diffusion of knowledge in the decision-making processes of the development policies of the Protection FMU Kotaagung Utara, based on direction of its propagation.
The fourth of analysis will be analyzed descriptively to explain the pattern of its relationship. The research outputs are: (1) information about the development progress of Protection FMU Kotaagung Utara; (2) information about the development history of Protection FMU Kotaagung Utara; (3) information about diffusion of knowledge (the adoption of the FMU policy) among stakeholders.
3. RESULTS AND DISCUSSION
3.1 Decision Making Process of Development Policies of the Protection FMU
Kotaagung Utara
Diffusion of knowledge in the decision-making processes of development policies of Protection FMU Kotaagung Utara is not to be separated from the history of its formation. The progress of decision-making processes of development policies of Protection FMU Kotaagung Utara is presented in Table 1.
Table 1: Progress of decision-making processes of development policies of Protection FMU Kotaagung Utara
No. Year Stages [percent] Knowledge Persuasion Decision Implementation Confirmation
1. 2004 9.09 0.00 0.00 0.00 0.00 2. 2007 27.27 9.09 0.00 0.00 0.00 3. 2009 36.36 18.18 0.00 0.00 0.00 4. 2010 63.64 36.36 9.09 0.00 0.00 5. 2011 81.82 63.64 45.45 0.00 0.00 6. 2012 100.00 63.64 45.45 81.82 0.00 7. 2013 100.00 63.64 45.45 81.82 2727
Source: Analysis of the interviews and the documents of Regional policy
The five steps in the decision making process of development policies of Protection FMU Kotaagung Utara are shown in Figure 1.

91
Figure 1: Decision making process of policy of Protection FMU of Koataagung Utara
The five steps in decision making process are described as follows:
1. Knowledge Stage
The policy of FMUs development is clearly stated since the Law No. 41/1999 regarding Forestry. However, the understanding of stakeholders about "the essence of FMUs policy" itself, is generally took place in 2007 with issuance of the Government Regulation No.6/2007 about Forest System and Forest Management Planning, and Forest Utilization.
The results of analysis showed that the percentage of stakeholders knowledge on the FMUs establishment policies began seen in 2004 by 9.09% or one stakeholder. He is a professional, who was working as the Head of Security and Protection Forest of Forestry Service in Lampung Province formerly. This knowledge is further strengthening in line with the process of internalizing of the FMUs idea in Ministry of Forestry.
The stakeholders knowledge in Tanggamus Regency toward the development policy of the Protection FMU Kotaagung Utara reaches 27.27 percent in 2007. At that time, the FMUs concept was known partially by stakeholders in the Regency of Forestry and Plantation Services, academics and professionals. This indicated that the FMUs concept was not known by non -forestry stakeholders. Diffusion of knowledge about the FMUs concept is still linear, not spreading to non-forestry stakeholders. Communication among stakeholders has not been going well.
In 2009, the knowledge of the FMUs concept reached of 36.36 percent. The FMUs concept began to be known by other stakeholders, namely the Head of Business and Institutional of Forestry and Plantation Services of Tanggamus Regency.
FMU development was done through the design process, reserve direction, formation and its stipulation. The series of activities were largely facilitated by the Directorate General of Forestry Planning, which has a goal as a precondition of the FMU formation, but it is also as

92
one way of understanding to the FMUs concept. Governor of Lampung responded by sending the letter No. 522/4577/III.16/2009 dated December 14, 2009, which proposed the formation of 16 units of FMUs in Lampung Province. Two of them are in Tanggamus Regency, namely: (a) Protection FMUs Kotaagung Utara, and (2) Protection FMUs Pematang Neba.
The first inflection point occurred in 2010 (63.64 percent), where the FMUs concept has been recognized by the Regent of Tanggamus Regency c.q. Regional Secretary, Head of Forestry and Plantation Services, as well as NGOs. The FMU concept was already known by non-forestry stakeholders.
The second inflection point of 90.91 percent, occurred in 2011. In this condition, knowledge about the FMUs concept has spread throughout most of the stakeholders in Tanggamus Regency. The parliament of Tanggamus Regency and the people is living around the Protection FMUs Kotaagung Utara began to know the FMUs. This is understandable because the Head of the Protection FMUs Kotaagung Utara has already started disseminating to decision makers and society. The introduction of the FMUs concept to stakeholders of Tanggamus Regency was done intensively by the Head of the Protection FMU Kotaaggung Utara, both formally and informally.
The knowledge diffusion continued until 2012, it is reaching up to 100 percent (the third inflection point). At this point, all stakeholders who involved and concerned with the formation of the Protection FMU Kotaaggung Utara have been familiar with the FMUs concept. Last stakeholders who knows the FMUs concept, they are staff and exntension e in the Extensuion Agency of Agricultural, Fisheries and Forestry of Tanggamus Regency (BP3K)/EAAFF)and media.
Formerly, the extension workers of forestry are a staff in the Forestry and Plantation Services of Tanggamus Regency. Since the formation of EAAFF in 2008 in the Tanggamus Regency, all counselor workers in the Regency are an authority of EAAFF. It is one of obstacles for the Head of the Protection FMU Kotaagung Utara when he will be disseminating the FMUs, especially to the society. Since 2012, the Protection FMU Kotaaagung Utara has been coordinating in the counseling activities with EAAFF.
Starting in September 2012, both media in Lampung province and Tanggamus Regency have named "the Protection FMU Kotaaagung Utara" as the title and main topics. Previously, any news which is related with the Protection Forest of Tanggamus Regency, "the name of FMUs" is never mentioned. It shows that: (1) an interest of media on the presence of the Protection FMU Kotaagung Utara is still low, (2) presence an agenda setting which is directing on issues besides the Protection FMUs Kotaagung Utara.
2. Persuasion Stage
A deep understanding of the FMUs concept has been begun in 2007 by professional. They were trying to understanding the FMUs concept and communicating it to the other stakeholders in Lampung province including Tanggamus Regency. The next understanding occurred in 2009. At that time, there is a delegation of tasks from the Head of Forestry and Plantation Services of Tanggamus Regency to the Head of Business and Institutional of Forestry and Plantation Services of Tanggamus Regency, who is taking care of FMUs. The delegation of tasks is a consequence of the letter of the Governor of Lampung Province on Zoning Proposal of Forest Management Unit (FMU) of Lampung province, as many as 16 units of FMUs. The proposal was approved by the Minister of Forestry in 2010, namely the
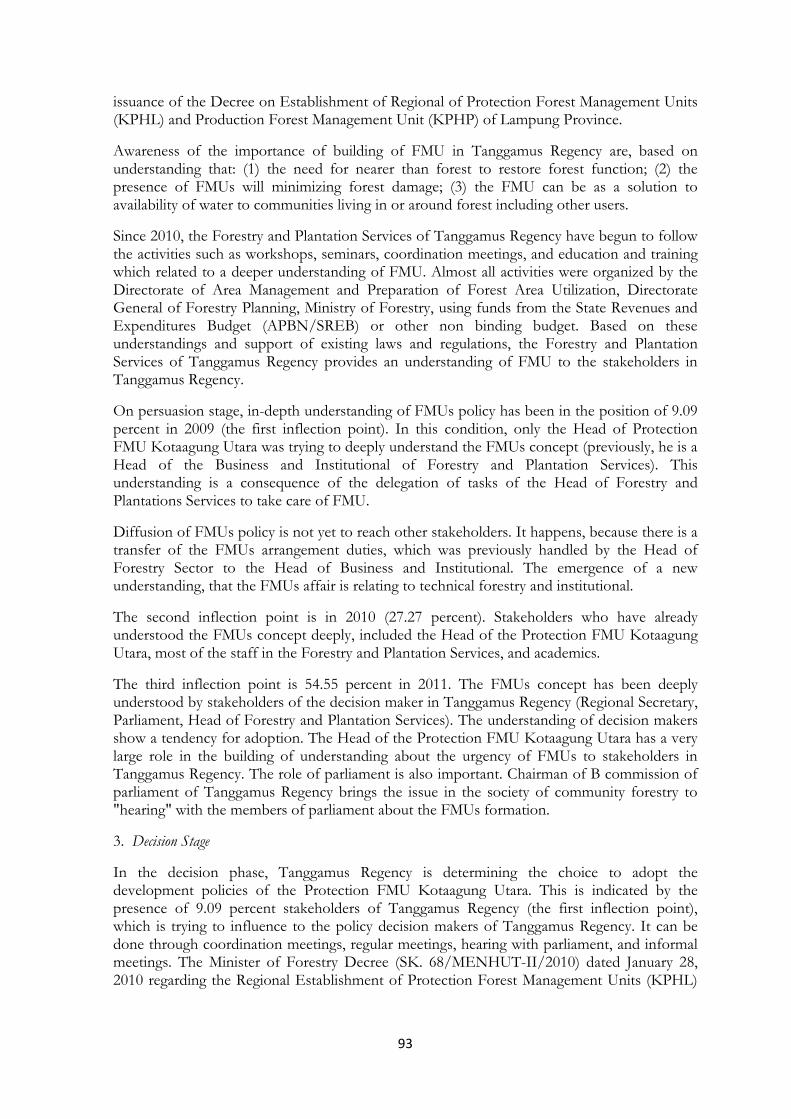
93
issuance of the Decree on Establishment of Regional of Protection Forest Management Units (KPHL) and Production Forest Management Unit (KPHP) of Lampung Province.
Awareness of the importance of building of FMU in Tanggamus Regency are, based on understanding that: (1) the need for nearer than forest to restore forest function; (2) the presence of FMUs will minimizing forest damage; (3) the FMU can be as a solution to availability of water to communities living in or around forest including other users.
Since 2010, the Forestry and Plantation Services of Tanggamus Regency have begun to follow the activities such as workshops, seminars, coordination meetings, and education and training which related to a deeper understanding of FMU. Almost all activities were organized by the Directorate of Area Management and Preparation of Forest Area Utilization, Directorate General of Forestry Planning, Ministry of Forestry, using funds from the State Revenues and Expenditures Budget (APBN/SREB) or other non binding budget. Based on these understandings and support of existing laws and regulations, the Forestry and Plantation Services of Tanggamus Regency provides an understanding of FMU to the stakeholders in Tanggamus Regency.
On persuasion stage, in-depth understanding of FMUs policy has been in the position of 9.09 percent in 2009 (the first inflection point). In this condition, only the Head of Protection FMU Kotaagung Utara was trying to deeply understand the FMUs concept (previously, he is a Head of the Business and Institutional of Forestry and Plantation Services). This understanding is a consequence of the delegation of tasks of the Head of Forestry and Plantations Services to take care of FMU.
Diffusion of FMUs policy is not yet to reach other stakeholders. It happens, because there is a transfer of the FMUs arrangement duties, which was previously handled by the Head of Forestry Sector to the Head of Business and Institutional. The emergence of a new understanding, that the FMUs affair is relating to technical forestry and institutional.
The second inflection point is in 2010 (27.27 percent). Stakeholders who have already understood the FMUs concept deeply, included the Head of the Protection FMU Kotaagung Utara, most of the staff in the Forestry and Plantation Services, and academics.
The third inflection point is 54.55 percent in 2011. The FMUs concept has been deeply understood by stakeholders of the decision maker in Tanggamus Regency (Regional Secretary, Parliament, Head of Forestry and Plantation Services). The understanding of decision makers show a tendency for adoption. The Head of the Protection FMU Kotaagung Utara has a very large role in the building of understanding about the urgency of FMUs to stakeholders in Tanggamus Regency. The role of parliament is also important. Chairman of B commission of parliament of Tanggamus Regency brings the issue in the society of community forestry to "hearing" with the members of parliament about the FMUs formation.
3. Decision Stage
In the decision phase, Tanggamus Regency is determining the choice to adopt the development policies of the Protection FMU Kotaagung Utara. This is indicated by the presence of 9.09 percent stakeholders of Tanggamus Regency (the first inflection point), which is trying to influence to the policy decision makers of Tanggamus Regency. It can be done through coordination meetings, regular meetings, hearing with parliament, and informal meetings. The Minister of Forestry Decree (SK. 68/MENHUT-II/2010) dated January 28, 2010 regarding the Regional Establishment of Protection Forest Management Units (KPHL)

94
and Production Forest Management Unit (KPHP) Lampung province, has also given a strong encouragement to build of FMU.
Based on the Regulation of the Minister of Home Affairs No. 61/2010 and other supporting regulations, the Head of Business and Institutional of Forestry and Plantation Services of Tanggamus Regency followed up with a Local Regulation about the Formation of Organization and Administration of Protection FMU Kotaagung Utara. Head of Business and Institutional of Forestry and Plantation Services of Tanggamus Regency had intensive meetings with:
a. Regional Secretary of Tanggamus Regency, which was attended by First Assistant of Regent, Head of Legal Bureau, and Head of organization division of Organization Bureau
b. Parliament
Before Parliament of Tanggamus Regency can approve the concept of local regulation, they have done a dialogue with the Secretary of the Directorate General of Forestry Planning, Ministry of Forestry, so they can better understand the concept of FMU. The decision-making process of policy of the Protection FMU Kotaagung Utara was continued, and finally, the parliament approved it in 2011. Upon approval of Parliament, the Regent of Tanggamus Regency decided to make the Protection FMU Kotaagung Utara as a Working Units of Regional Devices (SKPD/WURD) separately. Stakeholders who supported this decision is about 45.45 percent (the second inflection point).
4. Implementation Stage
On implementation stage, the development policy of the Protection FMU Kotaagung Utara took place in 2012 (81.82 percent). Its means, the policy is generally acceptable and there is a local "interest" to the development of the Protection FMU Kotaagung Utara. The support of stakeholders of Tanggamus Regency to the Protection FMU Kotaagung Utara is also very good.
Stakeholders of the Protection FMU Kotaagung Utara strongly support to the formation of Protection FMU Kotaagung Utara and acknowledge its presence. This is proved by the issuance Regional Regulation of Tanggamus Regency regarding the Formation of Organization and Working Arrangement of the Protection FMU Kotaagung Utara of Tanggamus Regency. The local regulation is a form of "concern" of the government of Tanggamus Regency toward the existence of Protection FMU. It is as a strengthening of the Protection FMU Kotaagung Utara, which is believed and recognized to be the Working Units of Regional Devices (SKPD) separately. The Local Regulation of Tanggamus Regency was signed and ratified on December 30, 2011. Its consequence, the Protection FMU Kotaagung Utara have been got ration of Revenue and Expenditure Budget (APBN) to finance its activities since 2012.
5. Confirmation Stage
About 27.27 percent of stakeholders are still hesitant that FMU (such as the Protection FMU Kotaagung Utara) will be able to optimalize its role to resolve the conflicts in forestry sector. Stakeholders who have confirmed the FMU development policies are professionals, NGOs and communities. This distrust arises as a result of handling the problems is not optimal in most of working areas of FMU in Indonesia, both related to the management rights and the other matters.
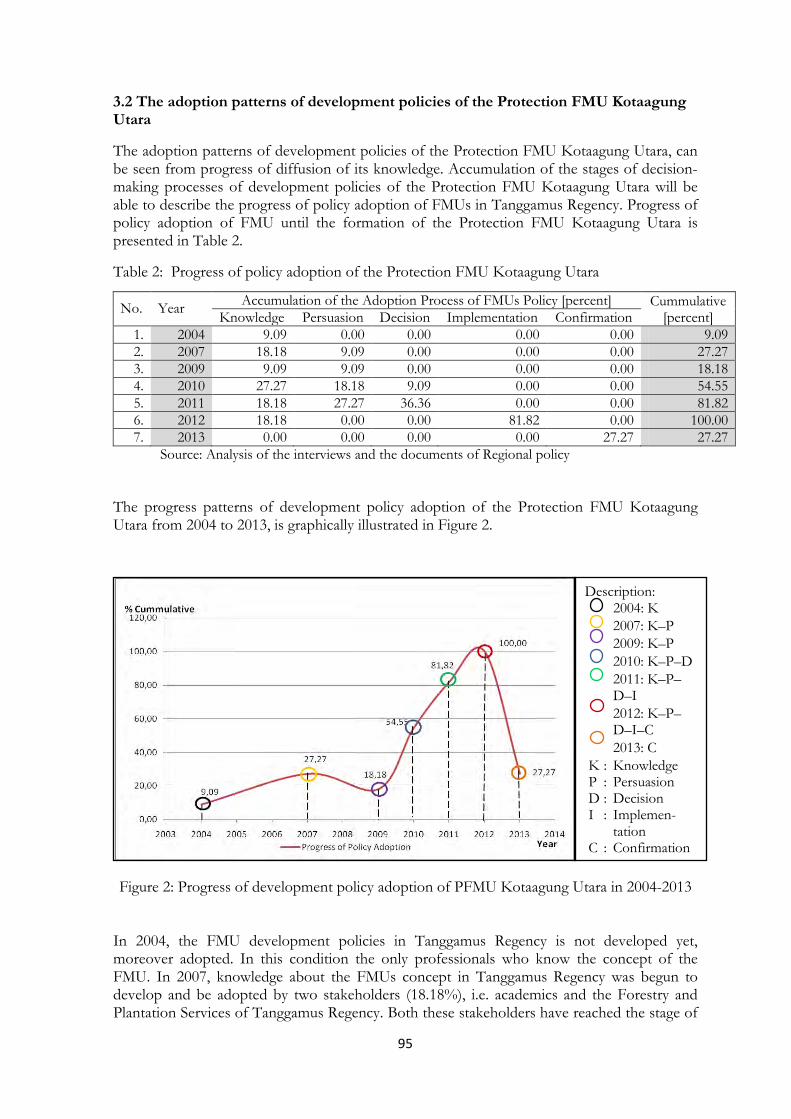
95
3.2 The adoption patterns of development policies of the Protection FMU Kotaagung Utara
The adoption patterns of development policies of the Protection FMU Kotaagung Utara, can be seen from progress of diffusion of its knowledge. Accumulation of the stages of decision-making processes of development policies of the Protection FMU Kotaagung Utara will be able to describe the progress of policy adoption of FMUs in Tanggamus Regency. Progress of policy adoption of FMU until the formation of the Protection FMU Kotaagung Utara is presented in Table 2.
Table 2: Progress of policy adoption of the Protection FMU Kotaagung Utara
No. Year Accumulation of the Adoption Process of FMUs Policy [percent] Cummulative [percent] Knowledge Persuasion Decision Implementation Confirmation
1. 2004 9.09 0.00 0.00 0.00 0.00 9.09 2. 2007 18.18 9.09 0.00 0.00 0.00 27.27 3. 2009 9.09 9.09 0.00 0.00 0.00 18.18 4. 2010 27.27 18.18 9.09 0.00 0.00 54.55 5. 2011 18.18 27.27 36.36 0.00 0.00 81.82 6. 2012 18.18 0.00 0.00 81.82 0.00 100.00 7. 2013 0.00 0.00 0.00 0.00 27.27 27.27
Source: Analysis of the interviews and the documents of Regional policy
The progress patterns of development policy adoption of the Protection FMU Kotaagung Utara from 2004 to 2013, is graphically illustrated in Figure 2.
Figure 2: Progress of development policy adoption of PFMU Kotaagung Utara in 2004-2013
In 2004, the FMU development policies in Tanggamus Regency is not developed yet, moreover adopted. In this condition the only professionals who know the concept of the FMU. In 2007, knowledge about the FMUs concept in Tanggamus Regency was begun to develop and be adopted by two stakeholders (18.18%), i.e. academics and the Forestry and Plantation Services of Tanggamus Regency. Both these stakeholders have reached the stage of
Description: 2004: K 2007: K–P 2009: K–P 2010: K–P–D 2011: K–P–D–I 2012: K–P–D–I–C 2013: C
K : Knowledge P : Persuasion D : Decision I : Implemen-
tation C : Confirmation

96
04
04 04
04 07
07
09 10
10
10
11
12 12
11
Lampung Province
Tanggamus Regency
Ministry of Forestry
knowing, whereas the professionals have reached the stage of understanding the FMUs concept. Diffusion of knowledge about the FMUs concept can not affecting the other stakeholders to adopting of FMU. This indicates that the FMUs concept is not understood fully by the other stakeholders, thus it implies a different perspective on the FMUs concept. Dissimilar understanding is able to inhibit the process of its policy communication. The rules about the FMU realized in January 2007 i.e. the issuance of Government Regulation No. 6/2007.
In 2009, the adoption was growing up, but it led toward adoption of only 18.18 percent of stakeholders. The stages achieved by stakeholders is to know and in depth to understand. However, this understanding has begun towards to choice for adopting or not adopting.
The diffusion continues, and there were 54.55 percent of stakeholders in 2010, who were adopting. After passing through the persuasion stage, stakeholders are making a choice to adopt or reject the policy. In the implementation phase, as many as 81.82 percent of stakeholders have adopted a development policy of the Protection FMU Kotaagung Utara. The development policies of the Protection FMU Kotaagung Utara has finally been adopted fully (100 percent) in 2012.
The pattern of diffusion of knowledge of the development policies of the Protection FMU Kotaagung Utara can be explained through Figure 3.
Figure 3: The patterns of knowledge diffusion of stakeholders in Tanggamus Regency
This pattern of diffusion of knowledge describes the diffusion of stakeholders mindset in Tanggamus Regency in the decision making process of development policies of the Protection FMU Kotaagung Utara, which is known from 2004 to 2012. Diffusion of knowledge of the FMU concept in Tanggamus Regency was not affected by administrative boundaries (distance factor), but it was influenced by networking. Interpersonal relationships as foresters have triggered the diffusion of knowledge from the Ministry of Forestry towards professionals in Lampung Province. Although in 2004 and 2007, the diffusion did not running well, but in 2010, the diffusion of knowledge was growing up. Two years later, the FMU concept was accepted.
Description: Ministry of Forestry Forestry and Plantation Services Protection FMU Kotaagung Utara Parliament of Tanggamus Regency Regional Secretary of Tanggamus Regency Professionals Academics Community Media NGOs BP3K/CCAFF Direction of Diffusion

97
Response of stakeholders on a policy is strongly influenced by his knowledge of the policy. The rate of adoption of innovation (policy) in a social system is influenced by the involvement of opinion leaders, namely the individuals who lead in influencing the opinions of others (Rogers 2003). The rate of adoption of FMU policy in Tanggamus Regency has reached 100 percent. It is inseparable from the role of the Head of the Protection FMU Kotaagung Utara and a strong support from the parliament of Tanggamus Regency. They are responding and learning with enthusiasm, and finally, the Regent of Tanggamus and the parliament of Tanggamus Regency are accepting the policy.
However, on its way there are stakeholders who are "cast doubt on" the existence of the Protection FMU Kotaagung Utara as an institution that can handle conflicts in the forestry sector mainly in Tanggamus Regency. The perception of stakeholders reaches 27.27 percent in 2013. The following chart describes the pattern of adoption progress of development policies of the Protection FMU Kotaagung Utara started in 2004 to 2013. An authority granted, which considered not quite been able to make the FMUs operates. This is related to the lack of legal protection as an operationalization basic of the FMU and clarity of task division and authority in its management.
4. CONCLUSIONS
a. Diffusion of knowledge in the decision-making processes of development policies of Protection FMU Kotaagung Utara of Tanggamus Regency has reached 100 percent.
b. The factors influencing the success of the policy adoption, among others: (1) diffusion of knowledge is influenced by networking among stakeholders; (2) role of opinion leaders (the Head of Protection FMU Kotaagung Utara and parliament of Tanggamus Regency); (3) willingness of stakeholders to know and to understand the FMUs concept; (4) clarity of management rights.
c. Support of stakeholders to the policy decision makers is essential, especially if it is followed by legality (regional policy) and action (action).
d. Confirmation toward the development policies of FMU is 27.27 percent for the Protection FMU Kotaagung Utara. This confirmation can be a limiting factor to the success in the policy implementation, among others, namely legitimacy of management rights, leadership ability of the Head of Protection FMU Kotaagung Utara, and sufficient authority.
5. REFERENCES
Creswell JW. 2010. Research Design: Pendekatan Kualitatif, Kuantitatif, dan Mixed. Penerjemah: Ahmad Fawaid. Edisi Ketiga. Yogyakarta: Pustaka Pelajar.
Julijanti. 2005. Perubahan Pemanfaatan Lahan di Kawasan Dataran Tinggi Dieng: Studi Kasus Difusi Spasial Usaha Tani Kentang (UTK) di Desa Batur dan Desa Dieng Kulon Kecamatan Batur Kabupaten Banjarnegara. [Tesis]. Yogyakarta: Sekolah Pascasarjana Universitas Gadjah Mada.
Kartodihardjo H, Nugroho B, Putro HR. 2011. Pembangunan Kesatuan Pengelolaan Hutan (KPH): Konsep, Peraturan dan Implementasi. Jakarta: Direktorat Wilayah Pengelolaan dan Penyiapan Areal Pemanfaatan Kawasan Hutan. Direktorat Jenderal Planologi Kehutanan. Kementerian Kehutanan.

98
Naf IK, Bisang K. 2001. Rethinking recent changes regimes in Europe through property–rights theory and policy analysis. Forests Policy and Economic Journal. Switzerland: Elsevier.
Patton MQ. 2002. Qualitative Research & Evaluation Methods. Third Edition. California: Sage Publication Inc.
Peraturan Menteri Dalam Negeri No. 61/2010 tentang Pedoman Organisasi dan Tata Kerja Kesatuan Pengelolaan Hutan Lindung dan Kesatuan Pengelolaan Hutan Produksi di Daerah.
Peraturan Menteri Kehutanan Nomor: P. 6/Menhut-II/2009 Tentang Pembentukan KPH.
Peraturan Pemerintah Nomor PP. 6/2007 Jo P. 3/2008 tentang Tata Hutan, Penyusunan Rencana Pengelolaan Hutan, serta Pemanfaatan Hutan.
Rogers EM. 2003. Diffusion of Innovations. Fifth Edition. New York: Free Press.
Spilsbury MJ, Nasi R. 2004. The Interface of Policy Research and The Policy Development Process: Challenges Posed to The Forestry Community. Forest Policy and Economics. pp. 193–205.
Undang – Undang No. 41 Tahun 1999 Tentang Kehutanan.
World Wide Fund for Nature. (2004). Aktivitas Penebangan dan Pasokan Kayu Dari Hutan Alam Kawasan Hutan Tesso Nilo. Pekanbaru, Indonesia.

99
INAFOR A-0070
THE SECOND INTERNATIONAL CONFERENCE OF INDONESIA FORESTRY RESEARCHERS
THE 2nd INAFOR, 27-28 AUGUST 2013
Optimising Community-Based Commercial Forestry: Lessons from The Farmers and Forests of Indonesia
Digby Race
The Fenner School of Environment and Society
The Australian National University, Canberra, ACT, Australia The Faculty of Forestry – Universitas Gadjah Mada, Yogyakarta, Indonesia.
Paper prepared for The Second International Conference of Indonesian Forestry Researchers (INAFOR)
27-28 August 2013
INAFOR SECRETARIAT Sub Division of Dissemination, Publication and Library
FORESTRY RESEARCH AND DEVELOPMENT AGENCY Jl. Gunung Batu 5, Bogor 16610
100
Optimising Community-Based Commercial Forestry: Lessons from The Farmers and Forests of Indonesia
Digby Race
The Fenner School of Environment and Society – The Australian National University, Canberra, ACT, Australia; and The Faculty of Forestry – Universitas Gadjah Mada, Yogyakarta, Indonesia.
ABSTRACT The global trajectory of community-based forestry indicates it is of increasing importance to the wider forestry sector. Indications of this importance are that: nearly 1 billion people rely on some form of forest products for their daily livelihoods, an increasing area of forest is under community-based control or management (more than twice the area of industrial forests), and an increasing array of policy and administrative mechanisms focus on community-based forestry. The experience of community-based forestry in Indonesia reflects many of the broad international trends. This paper will report on research that has explored the socio-economic dimensions of community-based commercial forestry in Indonesia since 2005, and will present findings that relate to the importance of forestry to rural livelihoods, yet of uncertain commercial value; the link between silvicultural options and commercial returns; and the implications for advisory and support services for farm families when men focus on forest silviculture and women manage the commercial transactions. Results from this research are informing local strategies to enhance the viability of community-based forestry, so that commercial forestry can be viewed as a desirable mainstream enterprise by more of Indonesia’s farmers.
Keywords: community forestry, farmers, community based commercial forestry
Note: This paper draws on research conducted with a large number of research colleagues from ANU, FORDA Bogor and Makassar, CIFOR, UGM, UQ, Trees-4-Trees, WWF Indonesia, and several staff from Provincial and District forest agencies. The research team is grateful for the interest and support for this research expressed by the many farmers in the field locations. This research has an operating period of 2011-2014, and receives considerable financial support from the Australian Centre for International Agricultural Research.
1. BACKGROUND
While rural communities have historically had a strong dependence on forests in most parts of the world (Charnley & Poe 2007, Sands 2005), it was in the 1970s that community forestry was articulated as a strategy to address the detrimental impacts of deforestation on the livelihoods of rural communities in some developing countries in Asia (e.g. India, Nepal & the Philippines) (Gilmour & Fisher 1991, Hobley 1996, Malla 2000). The concept was soon popularised by international aid agencies and governments in many other countries in Asia, Africa, and Central and South America, and later expanded to include options for commercialisation of forest products as a means of addressing rural poverty (Alden Wiley 2002, Gilmour et al. 2004, Hobley 2007, Pagdee et al. 2006).

101
Although it is difficult to accurately define the exact area of community forestry and the number of people now involved – for example, due to informal use of forests by some communities, incomplete databases of all recognised community forests, poor definition of forest boundaries and the communities involved, and differences in opinion as to the extent communities have ‘control’ over forests – the area of forests and the number of people involved is believed to be vast and increasing. While nearly 400 million hectares of forest was estimated to be under community control or management in 2001 (including areas not necessarily formally recognised as community forestry), this area is expected to increase to about 740 million hectares by the year 2015 – directly involving about 300 million people (Bull & White 2002). This area is more than 5 times the total area of the world’s industrial forest plantations.
Despite the enormous global scale of community forestry, several experienced analysts have expressed doubt over time about the magnitude of the social benefits that have been achieved (Cernea 1991, Fisher 2003, Gilmour et al. 2004, Hobley 2007). Lessons from Indonesia and other countries indicate that community participation in the commercial forestry sector alone is insufficient to guarantee ‘successful’ community-based forestry for participants, with a major concern being when inexperienced farmers are drawn into unfair long-term contracts (Race et al. 2009). Other research has also identified that the financial returns from commercial forestry for farmers often falls a long way short of the potential, commonly due to:
• lack of market knowledge (e.g. uncertain about prices for different species & timber grades);
• selling into constrained markets (e.g. lack of viable transport can restrict sales within uncompetitive local markets);
• limited capacity to achieve economies of scale (e.g. often selling small discontinuous supplies);
• low levels of silvicultural skills (e.g. failure to implement ‘best practice’ thinning of planted trees); and
• use of poor genetic plant stock (e.g. planting of poor quality seedlings).
The levels of commercial experience and social capital within local farmer forest groups have an important influence on the success of community-based commercial forestry (CBCF). Earlier research indicated that farm families could increase their income from by as much as 50% by negotiating fairer agreements (Race et al. 2009). Improved prices for farmers would lead to substantial livelihood benefits, as many rural families in the project’s field locations in Eastern Indonesia (Southern Sulawesi, Sumbawa) can derive as much as 30% of household income from forestry.
In many parts of the world, community forestry has evolved from subsistence (household) forestry into CBCF via a range of business models. This situation is reflected in Indonesia, where a wide variety of CBCF models have emerged since the late-1990s, with there being numerous CBCF initiatives led by both the government (e.g. Ministry of Forestry’s HTR program) and private (e.g. farmers’ supply contracts with pulp, paper and plywood processors) sectors. CBCF has rapidly grown in importance in Indonesia, as a strategy to attract capital investment and generate employment in rural areas, increase the livelihood benefits for farmers and the rural communities, and to manage the transition of the forestry sector away from a reliance on natural forests to planted commercial forests. While Indonesia has a plantation forest estate of about 2 million hectares, the rate of deforestation is estimated to be about 1 to 2 million hectares per year – with the Indonesian government eager to quickly shift

102
the forestry sector to a largely community-based plantation industry to reduce the loss of natural forests.
The Indonesian government has recently re-stated CBCF as a high priority, devoting considerable human and economic resources to assist the HTR program achieve its ambitious targets (allocated budget of about US$6 billion). The HTR program aims to involve 360,000 rural families, with each allocated up to 15 hectares of forest to manage for a maximum of 100 years. However, scaling-up community involvement in CBCF – in public and private sector programs – is not always viewed as straightforward nor desirable, with the concept of CBCF being challenged by some (e.g. van Noordwijk et al 2007). These authors have identified a range of issues that will influence the degree to which models of CBCF will achieve the stated goals of economic, social and environmental progress, with uncertainty about:
• the capacity of the various levels of government to be able to facilitate widespread participation of rural communities in desirable models of CBCF; and
• the capacity of rural communities to make informed business and livelihood decisions in regard to their involvement in varying models of CBCF.
While the HTR program is one of the major community forestry initiatives in Indonesia led by government, the private sector also has its own CBCF initiatives – established and refined over the past 20 years (Mayers & Vermeulen 2002; Nawir & Santoso 2005; Race & Desmond 2002). An example of the private sector’s enthusiasm and innovation for forging joint-venture partnerships with local farming communities are the agreements to produce fast-grown timber from Acacia and Albizia species for commercial markets (Mendham & Hardiyanto 2011). Similarly, a private company operating in South Sulawesi sources fast-grown timber from farmers (via market brokers) for the domestic plywood market. Another more recent entity – Trees 4 Trees (www.trees4trees.org), was recently established in Indonesia by furniture manufacturers and their global network of retailers, which sources all of its supply from smallholders in an integrated supply chain that connects small growers with global markets.
However, the commercial prospects for smallholders and their surrounding communities from forestry are challenging – with more profitable returns from oil palm and rubber in some districts, and considerable deficiencies in local institutional capacity – that limit the benefits from forestry. This is the context in which the research project – ‘Overcoming constraints to community-based commercial forestry in Indonesia’, is operating, and is the focus of this presentation.
2. RESEARCH EXPLORING COMMUNITY FORESTRY IN INDONESIA
The overall aim of this project is to undertake in-depth analytical research of some selected business models that are commonly used in CBCF in Indonesia, so to better understand the effectiveness of the existing models and underpin approaches to better inform farmers about their livelihood investment decisions. Seeking to understand the characteristics and potential of CBCF in different settings in Indonesia, the research has focused on understanding experiences across five locations: Gunung Kidul, Pati, Bulukumba, Konawe Selatan and Sumbawa (in Central & Eastern Indonesia).

103
The purposeful selection of a multi-disciplinary research team with expertise including forest silviculture, socio-economic science, forest policy, forest industry analysis and community development, drawn from a range of research and development organisations, appears to have been effective for this research. The research team has also adopted a participatory research approach – deliberately engaging a wide range of smallholders, community leaders, commercial market brokers (middlemen), industry processors, forest agency staff, local NGO staff, and other analysts, to deeply understand the range of experiences and views of CBCF in Indonesia.
An important starting point for this research was to understand the local community context in which CBCF operates (documented as a Social Dimensions Analysis, van de Fliert et al. 2013), acknowledging that there is often a range of experiences of CBCF across a diverse country such as Indonesia. Three of the key findings emerged from the Social Dimensions Analysis (van de Fliert et al. 2013), which are presented and discussed below.
CBCF: An important role, but of uncertain value
As documented elsewhere, our research found that CBCF plays an important role in the livelihoods of many farm families in the five study locations. While the commercial sale of timber and NTFPs are rarely the largest source of the annual income for farm families, commercial forestry fulfils a vital function as a ‘living savings account’ (accumulating in commercial value over several years), rather than as a regular component of their day-to-day income. Farm families, as with most families, occasionally need access to relatively large amounts of finance, to cover medical or education expenses, to purchase of expensive capital items (e.g. a vehicle), or to expand and upgrade housing. Many of these large expenses may be relatively predictable, yet the timing and amount of finance required may be far less certain – with commercial harvests from farmers’ forest appearing to be largely sporadic and opportunistic.
Our research has found that even for farmers who have many years of practical forestry experience, most have a relatively limited understanding of the commercial value of their ‘living savings account’. Compounding this limitation is that farmers rarely feel confident in their ability to measure and calculate the quality and volume of different products in their forests (e.g. timber matching different market specifications), and so commonly defer to valuations calculated by market brokers (middlemen). These limitations undermine farmers investing in commercial forestry with confidence, and perpetuate the view that forestry is more suited to being an irregular and opportunistic part of farmers’ livelihoods.
Disconnection between silviculture and markets
Our research also found a generally low level of understanding amongst forest farmers about how different approaches to silviculture correspond to trees/forests of different composition and product potential. That is, few farmers appeared confident in their understanding of how different approaches to thinning forests (rate & timing of thinning) would affect their forests. As such, farmers typically use traditional approaches to silviculture, or approaches recommended by ‘outsiders’ (e.g. forest agency staff, company staff). Unfortunately this can leave farmers in a compromised position, either following erstwhile approaches that may no longer suit contemporary conditions (bio-physical or commercial), or increasingly dependent on ‘outsiders’ for advice on silviculture over an extended period of a forest’s rotation.
An emerging topic of interest – for many forest farmers and forestry advisors – is the commercial implications of different approaches to silviculture. For instance, how pruning the lower branches of trees or thinning of forests affects the commercial potential of the overall

104
forest. Maximising the growth of a forest, or the yield of timber, may not be advantageous for farmers if the effort required or costs incurred exceed the value at harvest. Also, it is well reported throughout the literature that farmers (especially smallholders) often seek to integrate trees into a prevailing farming system, whereby maximising timber production may not be the primary objective. Understanding how different approaches to silviculture, and the ensuing commercial potential, appears to be an important knowledge gap that is constraining Indonesia’s farmers being informed about how they can grow the forests of their choice.
Forest men, market women
Local institutions are important, so building the capacity of farmer forest groups makes good sense. Much of the information and training for community forestry is being delivered via the extensive network of farmer forest groups operating across Indonesia. However, in many parts of Indonesia women play a very limited role in local farmer forest groups, so are not commonly firsthand recipients of the information and training relating to community forestry. This may not appear a large impediment to the development of CBCF as men usually undertake much of the silviculture on behalf of a farm family. However, our research revealed that it is often women of the farm family that negotiate the sale prices and have oversight of the commercial transactions for CBCF. This is an important finding, as there appears to be a widespread social disconnect in how information and support is provided for CBCF (i.e. to men via local farmer forest groups), and how farm families interact with forestry markets (i.e. by women).
Government and other organisations (e.g. local NGOs, private companies) should reconsider their strategies for supporting community forestry, to ensure that both those undertaking the silviculture (e.g. often men) and those negotiating the commercial transactions (e.g. often women) have opportunities to participate in relevant capacity building activities, and are networked more broadly into CBCF expertise. Given that men dominate most local farmer forest groups, it may require initiating a parallel network for farming women yet with a focus on understanding market dynamics and emerging commercial opportunities.
3. DISCUSSION AND CONCLUSIONS
There remains much work to be done throughout Indonesia, as in many other countries, to enhance our understanding of how to enhance the value of commercial forestry for farm families, who need to make daily decisions about resource allocation – with complex and profound implications in terms of the opportunity costs and trade-offs. Growing forests to maximise timber production is rarely the sole or primary objective of forest farmers, rather most farm families seek to optimise the co-benefits of integrated farm-forest systems. The challenge for development organisations aiming to promote sustainable resource/farm management is to be able to provide accurate and relevant information that has the ‘co-benefit’ approach of farm families at its core. Our research suggests this challenge is considerable and should not be under-estimated, with capacity building required equally within the development organisations as within the forest farmer communities.
There is an increasing knowledge across a menu of silvicultural options, which is assisting forest farmers to make better informed decisions about forest management. The research underpinning this increase in knowledge needs to continue and be embedded within a commercial and livelihood context. That is, forest farmers need to know how different silvicultural options translate to the commercial potential of their forests, and the livelihood implications (e.g. how tree spacing will affect the growth of fodder grasses, the labour required for branch pruning or tree thinning). Building on the existing foundation will be important so
105
that Indonesia’s forest farmers develop a strong understanding of how to grow the forests that best suit their personal situation.
Another important finding emerging from our research is the apparent social disconnect in the development support for community-based commercial forestry (CBCF), in that much of the assistance is provided through the extensive network of village-based farmer forest groups. On one level this appears logical, as farmer forest groups are often dominated by men (as the member representing the farm family), who in turn undertake much of the silviculture. However, a social disconnect emerges when women can often be responsible for negotiating the commercial sales of products from the families forests – yet they don’t receive the same level of face-to-face information and support provided via the local farmer forest group. As our research, and by others, shows that the livelihood benefit for farm families from CBCF is dependent on optimising the silvicultural management and the commercial transactions. That is, improved silvicultural management may achieve little livelihood benefits if it is not translated into commensurate financial gains. As such, a much greater focus needs to be given to supporting the women that negotiate the commercial forestry markets on behalf of their families, so that improved forest management translates into improved financial returns.
While our research is still on-going, we believe the emerging findings presented in this article offer some valuable insights as to how the support for community forestry in Indonesia can be strengthened. Commercial forestry has the potential to make an important contribution to the livelihoods of farm families, district and national economies, and sustainable forest management – yet it is a complex equation. Further research will assist to identify the components of this equation, with benefits for Indonesia and many other countries.
4. REFERENCES
Alden Wiley, L. 2002. From meeting needs to honouring rights: the evolution of community forestry. Invited paper submitted to the XII World Forestry Congress. Quebec, Canada.
Bull, G. and White, A. 2002. Global forests in transition: Challenges and opportunities. Proceedings of Global Perspective on Indigenous Forestry: Linking Communities, commerce and conservation, 4-6 June 2002, Vancouver, Canada.
Cernea, M.M. 1991. The social actors of participatory afforestation strategies. In: M.M. Cernea (ed) Putting People First: Sociological variables in rural development. 2nd edition. Oxford University Press, UK. Pp. 340-393.
Charnley, S. and Poe, M.R. 2007. Community forestry in theory and practice: Where are we now? Annual Review of Anthropology, 36: 301-336.
Fisher, R.J. 2003. Innovations, persistence and change: Reflections on the state of community forestry. In: RECOFTC and FAO (eds) Community forestry: current innovations and experiences. Regional Community Forestry Training Centre, Bangkok, Thailand.
Gilmour, D.A. and Fisher, R.J. 1991. Villagers, Forests and Foresters. Sahayogi Press, Kathmandu, Nepal.
Gilmour, D.A. and Fisher, R.J. 1997. Evolution in community forestry: Contesting forest resources. In: M. Victor (ed) Community forestry at the cross road: Reflection and future directions in the development of Community Forests. Regional Community Forestry Training Centre (RECOFTC), RECOFTC Report #16, Bangkok, Thailand.

106
Gilmour, D., Malla, Y. and Nurse, M. 2004. Linkages between community forestry and poverty. Regional Community Forestry Training Centre, Bangkok, Thailand.
Hobley, M. 2007. Forests – the poor man’s overcoat: foresters as agents of change? Paper presented at the Australian National University (3rd April), Canberra, Australia.
Hobley, M. 1996. Participatory forestry: the process of change in India and Nepal. Overseas Development Institute, London, UK.
Malla, Y. 2000. Impact of community forestry policy on rural livelihoods and food security in Nepal. Unasylva, 51 (202): 37-45.
Mayers, J. and Vermeulen, S. 2002. Company-community forestry partnerships: from raw deals to mutual gains? International Institute for Environment and Development, London, UK.
Mendham, D. and Hardiyanto, E. 2011. Realising genetic gains in Indonesia and Australian plantations through water and nutrient management. Final report for project FST/2004/058, Australian Centre for International Agricultural Research, Canberra, Aust.
NAWIR, A.A. and SANTOSO, L. 2005. Mutually beneficial company-community partnerships in plantation development: emerging lessons from Indonesia. International Forestry Review 7 (3): 177-192.
Pagdee, A., Kim, Y. and Daugherty, P.J. 2006. What makes community forest management successful: A meta-study from community forests throughout the world. Society and Natural Resources, 19: 33-52.
Race, D. and Desmond, H. 2002. Forestry outgrower schemes: a review from selected countries. Journal of Sustainable Forestry 15 (4): 79-98.
Race, D., Bisjoe, A.R., Hakim, R., Hayati, N., Julmansyah, Kadir, A., Kurniawan, Kusumedi, P., Nawir, A.A., Nurhaedah, Perbatasari, D.U., Purwanti, R., Rohadi, D., Stewart, H., Sumirat, B. and Suwarno, A. 2009. Partnerships for involving small-scale landholders in commercial forestry: lessons from Australia and Indonesia. International Forestry Review, 11 (1): 87-95.
Sands, R. 2005. Forestry in a Global Context. CABI Publishing, Wallingford , UK.
Van De Fliert, E., Oktalina, S.N. Et Al. 2013. Social Dimensions Analysis of Community-based Forestry in Indonesia: Report of a study conducted in Gunung Kidul, Pati, Bulukumba, Konawe Selatan and Sumbawa. ACIAR Project FST/2008/030 – Overcoming constraints to community-based commercial forestry in Indonesia.
Van Noordwiik, M., Suyanto, S., Budidarsono, S., Sakuntaladewi, N., Roshetko, J., Tata, H., Galudra, G. and Fay, C. 2007. Is Hutan Tanaaman Rakyat a new paradigm in community based tree planting in Indonesia? ICRAF Working Paper No. 45.
107
INAFOR A-0091
THE SECOND INTERNATIONAL CONFERENCE OF INDONESIA FORESTRY RESEARCHERS
THE 2nd INAFOR, 27-28 AUGUST 2013
Solving “Tebang Butuh” Problem Through Web-Based Information Systems
Purwoko
Senior Researcher at the Ministry of Finance, Republic of Indonesia
Fiscal Policy Office
RM. Notohamiprodjo Building
Jl. Dr Wahidin no. 1, Jakarta 10710
Paper prepared for The Second International Conference of Indonesian Forestry Researchers (INAFOR)
27-28 August 2013
INAFOR SECRETARIAT Sub Division of Dissemination, Publication and Library
FORESTRY RESEARCH AND DEVELOPMENT AGENCY Jl. Gunung Batu 5, Bogor 16610

108
Solving “Tebang Butuh” Problem Through Web-Based Information Systems
Purwoko
Senior Researcher at the Ministry of Finance, Republic of Indonesia Fiscal Policy Office
RM. Notohamiprodjo Building Jl. Dr Wahidin no. 1, Jakarta 10710
Corresponding e-mail: [email protected] [email protected]
ABSTRACT
The purpose of conserving community forests and improving the farmers’ welfare can be disturbed when they facing funding problems. Farmers usually cut down and sell the growing trees before the harvest period to solve funding problems, known as “tebang butuh”. This pattern is not only disrupt the forest conservation, but also detrimental to the owner, because the timber is usually sold at below market price. The purpose of this descriptive study is to solve “tebang butuh” problems with the support of information systems (IS). This web-based IS putting forest farmer groups as the main entity in the system. They responsible for managing forest trees planted by its members. Farmer groups periodically update the forest trees data to represent the progress of trees growth. The system also records every timber trading transaction made by farmer groups, as the basis data of timber market price. With the IS support, the ownership of forest trees can be transferred to another person, through an on-line trading transactions, without having to cut down the trees. The web-based IS broadens the buyers, not only forest farmers community, but also urban community and foreigners. This method enables the farmers to continue growing the trees until the harvest time. Wider communities are able to own forest trees without having land. Farmers can solve their fund problem when they need it. The profit gained at harvest time is shared between the new trees owners, farmers, and farmer groups. This system enables all stakeholders to enjoy additional revenue at the harvest time. In addition, the government does not need to allocate budget for solving tebang butuh problems.
Keywords: “tebang butuh”, funding problems, conservation, web-based information systems
1. INTRODUCTION
1.1. Background
Community Forests are forests planted and owned by the community. Based on land ownership, community forests can be classified into farmer forests, indigenous forests, and community forests. Farmer forest is a forest that is planted on land owned by the community (Gadas, no year). Indigenous forest or village forest is a forest planted on communal land, for example, the village land. Usually these forests are managed for a common goal, for the benefit of the local community (Charnley 2007). Community forest is a forest planted on state-owned land, generally on state forest land. Community forest management is done by a particular group of citizens.

109
Alviya (2007) stated that community forest management involve several activities including land preparation, nurseries, plantations, cultivations, harvestings, and log marketing. For a forest farmer, growing a forest tree is a long investment. Activities to grow forest trees are long time processes. To fulfil the daily needs of foods, they usually raise a short harvested product such as cassava, corn, or soy bean, which is planted as ‘tumpang sari’ between the forest trees, meanwhile the forest trees are kept growing. When the forest tree canopy growing wider, however, the farmer can not plant short term product as ‘tumpang sari’ any longer. Some farmers prefer to cut the forest trees branch to enable them growing the short term plants. This practice may hinder the forest trees to grow optimally (Waskitho 2010).
Community forest management in the southern limestone area of Java Island has provided a significant contribution to secure the watershed environment (Wicak 2010). In the context of climate change mitigations, community forests are expected to be a good forest conservation. If managed properly, community forest will have a good forest cover, and will have a good capabilities to absorb the CO2 in the atmosfer. On the other hand, a bad management of community forest will result a low density forest cover, that have a low capabilities in absorbing the CO2. Farmers may cut their forest trees to fulfil a fund problem. To help forest farmers keeping their forest trees to grow until the harvest time, an appropiate amount of incentive is required. Implementation of payment of enfironmental services (PES) systems may become a good solution to provide the incentive for community forest management (Prasetya, no year).
From the economic point of view, community forest is expected to be able to increase the farmer welfare. It is expected that the farmer can sell the log at the harvest time in a good market price, so that it can provide a significant income for the farmer. Community forestry in Gunung kidul has been proofed to be able to increase the farmers welfare, though, it does not eradicate the poverty totally (Grehenson 2009). Community forestry in Langkat District is not only improve the farmer welfare, but also secure the critical land (Tarigan 2009). The study in Cilacap District, on the other hand, showing that community forest provide a low contribution to farmers income. The forest trees contribute 4,49%, and the short term plants contribute 12,06% to farmers income (Widyaningsih, Diniyati 2010).
The most common problem facing by forest farmers is that farmers do not know the log market price, and they often sell the log at bellow market price. This evidence may lower the goal of increasing the farmer welfare. To avoid tebang butuh case, Ministry of Forestry has assigned Forest Development Funding Center, a public service agency in the Ministry of forestry, to alocate an amount of fund (three trillion rupiah) that can be accessed by farmers who have funding problems (Pitakasari, 2012). This fund is a low rate and long grace period loan. The problem of this funding system is that the government has to set up institution and provide all resources required to manage the fund. More funds may need to be allocated when the community forest grows. It means additional burden for the government budget.
1.2. Problems
Forest farmers are usually poor family. They expect that their growing forest tree will be able to increase their welfare at the harvest time. Unfortunately, sometime they need extra fund for a special purpose, such as for tuition fees for their children, wedding seremony for the family, or hajj fee, while the forest tree is in the growing periods. Cutting down the forest trees before the harvesting time and sell the log, known as tebang butuh, can be alternative to solve the funding problem. The log is usually sold at below the market price (Alviya at al., 2007).

110
Tebang butuh is now become a major solution for forest farmer when they facing a funding problem. Unfortunately, tebang butuh carry out some problems. The purpose of community forest to increase the farmer welfare can not be optimally achieved. In additions, the forest cover density decreases, the ability to absorb the CO2 will also decrease, and the purpose of community forest to conserve the forest will also be disturbed.
1.3. Purpose
This study is expected to solve the tebang butuh problem through web-based information systems. Using this system, the ownership of a forest tree can be easily transferred from someone to another. The system enables the farmer to sell their trees before the harvest time without having to cut down the trees. It just change the ownership from the farmer to the buyer. The buyer will be the new trees owner until the harvest time, while the farmer can continue cultivating the trees. The web enables the system to be accessed by broader user, such as urban community and foreigners. They are expected to be potential investor or potential buyer for tebang butuh cases.
2. METHODOLOGY
The study uses secondary qualitative data collected from the literature review, and qualitative primary data which is gathered through a direct conversation with the forest farmers in the Gunung Kidul District. The data is analysed through the following steps:
a. Identify the farmers funding problems in tebang butuh case; b. Identify the stakeholders of community forest, their roles, and their information
requirement; c. Mapping the information needed by stakeholders and summarized the information to
make a better understanding about what kind of information sould be produced by the information systems;
d. Analyzing how the information system can help solving the tebang butuh problem. e. Designing the macro systems through the following activities:
• Designing information required by stakeholders; • Designing database to keep all data required by the systems; • Identifying event or transaction should be recorded, and who should record it • and designing the process that enable the sistem to produce the outputs
f. Analyzing the advantages of using the information systems to solve the tebang butuh problem
3. RESULT AND DISCUSSION
3.1 Information Systems Analysis
Commonly, there are four steps of activities that should be done in information systems analysis, involving the activities of identifying problems; identifying stakeholders, their roles, and information requirements; mapping the information required by stakeholders; and analyzing how the information can solve the problems. The next sub chapters provide detail information of the activities.

111
3.1.1 Identifying Forest Farmers Problems on Tebang Butuh Case.
Tebang butuh is an alternatif solution to solve the forest farmers’ urgent funding problems, such as for tuition fees, wedding ceremony, or hospital cost for the family. The forest trees are cut down before the harvest time and are sold to solve the urgent funding problems. The buyers usually people from the same community, and the log are usually sold at below the market price.
There are some disadvantages of the existing tebang butuh practices, such as:
• Buyers in the existing tebang butuh case are limited. They lives in the same community, in the surrounding community forest area;
• There are no additional money circulated in the economy of surrounding forest area community;
• The trees are usually sold at below market price. The goal of community forest development to increase the farmer welfare is not successfully achieved.
• Cutting the forest trees before the harvest period will disturb the sustainable forest conservation.
An alternative solution to solve tebang butuh problem is in discussion now. The farmers are suggested to establish a cooperation. The cooperation is expected to be a buyer in tebang butuh case and has sufficient funding to buy the trees. The cooperation will keep the trees growing until the harvest time, so that the forest can provide more economic value for the farmers. It is expected that the cooperation will buy the trees at an appropriate market price. Nevertheless, this ideas has some disadvantages, such as:
• The cooperation members are forest farmers who live in the surounding area of the forest. They mostly have limited financial capabilities. The cooperation, therefore, has limited capabilities to solve tebang butuh problems faced by its members;
• There are possibilities for the cooperation to get financial support from the third parties. The interest fee, however, may produce additional burden for the cooperation and its members;
• The transaction is between cooperation and the farmers who live in the surrounding area of the forest. There is no buyers from the outside of the forest. The local economy may not optimally grow, since there is no additional money circulated in the local economy.
3.1.2 Identify Stakeholders of Community Forest, Their Roles, and Their Information Requirement
Based on the discussion with forest farmers in Gunung Kidul District, it can be identified the stakeholders of community forest, thir roles, and their information requirements, as follow:
• Forest Farmers. Most of them are owners and workers of the land, who cultivate the forest tree. They need information related to their forest trees. In addition, the also need the current market price of logs and forest trees.

112
• Forest farmers group. It is an organization with forest farmers as its members. The forest farmer group manages a certain forest area in which its members owning forest land. This organization performs some activities for the benefits of its members. The management of forest farmers group needs information about forest trees planted in the forest land in a certain forest area. They need to know the progress of the forest trees, and the current ownership of the forest trees;
• Forestry Units. It is a forestry institution at the district or province level, which informing the government policies on forestry, providing guidance for forest farmers on how to manage a community forest, and monitoring the progress of community forest in its territory. This institution needs information related to the progress of forest trees in the community forest area within its territory.
• Ministry of Forestry. It is a forestry institution at state level, which set up policies for community forest. This institution needs to know about the progress of community forest nationally.
• Investors. It can be companies, institutions, or individuals who invest their funds to develop community forest. They may plant their own land or buy forest trees from farmers in tebang butuh cases;
• Others. They are individuals or institutions who have special interest on community forest, such as academicians, environmentalists, or international organization who pay attention on community forest.
3.1.3 Mapping the Stakeholders Information Requirement.
Based on information requirement needed by all stakeholders, it can be summarized what kind of information information should be produced by the information systems, including information of:
• forest farmer group; • community forest area; • forest farmers; • land ownership in the community forest area; • investors and potential investors; • forest trees planted in farmers lands; • logs and its origin;
3.1.4 Analyzing How the Information System Can Help Solving the Tebang Butuh Problem.
Forest farmer group is the main stakeholders in the systems. They responsible for managing information related with their forest area, including data recording of:
• Community forest area managed by the group; • Farmers as the members of the association; • Land ownerships of the community forest area; • Trees planted in farmers land;
In addition, the forest farmer group is also responsible for data updating, representing the progress or changing information of the data.

113
When there is a forest farmer who want to sell his forest trees before the harvesting period (tebang butuh case), the forest farmer expresses his idea to the forest farmer group staff. The staff will update the trees status as to be offered for sale.
Investors has facilities to search forest trees to be offered for sale, analize them, and decide to buy selected trees. Negotiation and payment process between investor and group representative are conducted offline. After finishing the transaction, the forest farmer group staff will update the ownership of trees transacted, from the seller to the buyer.
3.2 Information Systems Design
A study on Information system management for community forest using web GIS has been proposed by Munandar (2012). This system provides information for stakeholders related to land ownership, the dispersion of forest trees, the potential volume of forest trees and the total area of community forest in a region. This information system can be accessed via internet or local area network.
Solving “tebang butuh” problem through web-based information systems is a study aimed to provide information for stakeholders of community forestry. The systems provides information related to forest area, land ownership, the detail information on every single tree in the community forest land, and the current owner of forest tree. In addition, the system enables stakeholders to buy or sell individual tree in the community forest, via internet.
The information system design consists of macro systems design, database design including data base content, and system process to produce output for appropriate stakeholders. The following sub chapters provide more detail information about those processes.
3.2.1 Macro design
Community forest information system is a web-based information system, which can be access by public through internet facilities. People can see the current condition of community forest when the current condition of the data has been recorded by farmer group. Information that can be accessed involving forest region, forest area, location, farmer group, number of forest trees, detailed infomation about forest trees, and information about trees sold by the farmers.
People who want to buy forest trees in tebang butuh case should register themselves in to the systems before they can do the transaction.
Figure 1 provides illustrations on how the data are collected into community forest database. The data stored in the database consists of district code, farmer groups, forest region managed by farmer group, members of farmer groups, forest area managed by the members of forest farmer group, and forest trees planted in the forest area. These data are recorded by forest farmer group, who responsible for community forest management.

114
Figure 1: Data flow into database
Figure 2 illustrates information flows from the community forest data base to appropriate stakeholders. Each type of stakeholder needs specific information that may differ from one to another.
Figure 2: Information flows from the database to stakeholders

115
3.2.2. Database structure
Community forest database consists of a group of integrated data tables containing information about community forest. Figure 3 shows the relationship among tables in the database.
Figure 3: Database structure
PROVINCE / DISTRICT
FOREST FARMER GROUP
FOREST FARMER
FOREST AREA
FOREST LAND
FOREST TREE INVESTOR / CUSTOMER
LOGS
1
1 1
1 1
1
1
1
1
M M
M
M
M M
M
M
M
FOREST TREE TRANSACTION
1 M
1
1
M
M

116
The first table is the province and district table. It contains code and description of province and district in Indonesia. In one district can be established one or more forest farmer groups. A forest farmer group can manage one or more community forest areas. Many community forest areas may be developed in one district. A forest farmer group consists of a group of forest farmers, who may have one or more forest lands. A community forest area consists of a group of forest lands owned by forest farmers in a certain farmer group. A lot of forest trees can be cultivated in a certain forest land. When a forest tree is cut down, it can be cut into several logs. Figure 4 illustrates the detail data stored in each table in the database.
Figure 4: Database content
PROVINCE / DISTRICT Province / district Id Province / District name
FOREST FARMER GROUP Forest Farmer Group Id Forest Farmer Group Name Province / district Id Forest Farmer Total
FOREST AREA Province / district Id Forest Area Id Forest Area Location Forest Farmer Group Id Forest Area Width Land Ownership Status
FOREST FARMER
Province / district Id Forest Farmer Group Id Forest Farmer Id Forest Farmer Name Address Identity number Phone E-mail
FOREST LAND Province / district Id Forest Area Id Forest Land Id Forest Land Location Forest Farmer Id Forest Land Width Land Ownership Status
INVESTOR / CUSTOMER Province / district Id Investor Id Investor Name Address Identity number Phone E-mail
FOREST TREE Forest Tree Id Forest Tree Type Province / district Id Forest Area Id Forest Land Id Forest Farmer Id Current Forest Status Plantation Date Harvest Time Scheduled Status
0 - normal 1 – Advertised for Sale 2 – Transaction in Process 3 – Cutting at Harvest Time 9 – Cutting before Harvest Time
LOGS Forest Tree Id Logs Id Forest Tree Type Forest Tree Volume Logs Location
FOREST TREE TRANSACTION Forest Tree Id Forest Farmer Id Investor Id Transaction Date Transaction Value

117
3.2.3. Process design
Activities involved in community forest information system basically can be classified into three major activities: reference data preparation, basic data recording and updating, and transaction data recording.
Reference Data Preparation Reference data should be prepared by system administrator. Two reference data should exist when the system is implemented, consist of province and district table and status code table. Status code data is used to identify forest tree status. The status code value and its description are as follow: • Code 0 – normal data • Code 1 – the tree is advertised for sale • Code 2 – Trading Transaction in process • Code 3 – the tree is cut at harvest time • Code 9 – the tree is dead or cut before the harvest time
Basic Data Recording and updating
Basic data recording is done by forest farmer group. The data needs to be recorded including forest farmer group, forest farmer, forest area, forest land, and forest tree. In addition, the forest farmer group is also responsible for updating those data to represent the current progress of the trees.
• Registration of Forest Farmer Group
To make a forest farmer group able to operate the community forest information systems, a forest farmer group should register itself in to the system. Registration is done online, attached with supported document. The web administrator will check the document legality, before confirming the registration.
• Registration of Forest Farmer Group Member Registration of forest farmer group member is done by forest farmer group staff. Information recorded in this activity including the farmer name, address, identity number, phone, e-mail of the forest group members
• Registration of Forest Area When registration of forest farmer group is successfully done, the forest farmer group may record the forest area under management of this forest farmer group. Forest area is an aggregation of forest land owned by the forest farmers. Forest trees in this forest area are managed by the forest farmer group. A forest farmer group may manage one or more forest area. Information recorded in this activity comprises of forest area location, the district, forest farmer group, the size of forest area, and land owner status. When the data has been recorded, the system will provide identity number for the forest area.
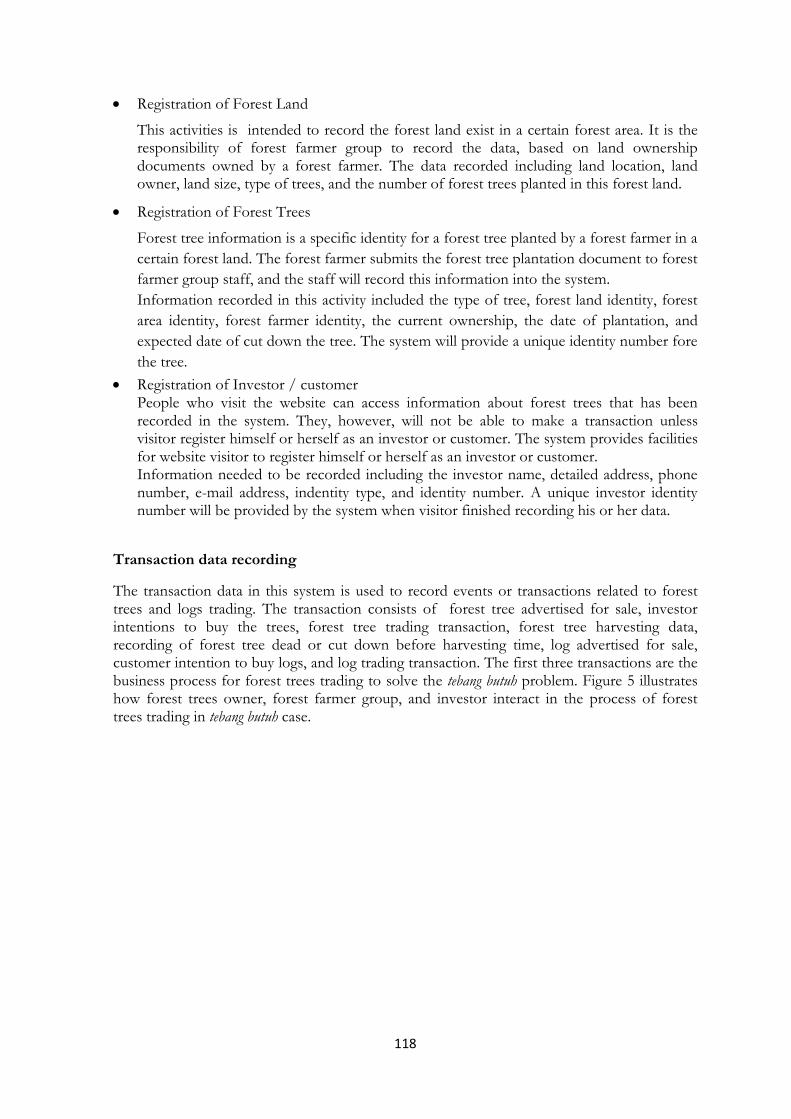
118
• Registration of Forest Land
This activities is intended to record the forest land exist in a certain forest area. It is the responsibility of forest farmer group to record the data, based on land ownership documents owned by a forest farmer. The data recorded including land location, land owner, land size, type of trees, and the number of forest trees planted in this forest land.
• Registration of Forest Trees
Forest tree information is a specific identity for a forest tree planted by a forest farmer in a certain forest land. The forest farmer submits the forest tree plantation document to forest farmer group staff, and the staff will record this information into the system. Information recorded in this activity included the type of tree, forest land identity, forest area identity, forest farmer identity, the current ownership, the date of plantation, and expected date of cut down the tree. The system will provide a unique identity number fore the tree.
• Registration of Investor / customer People who visit the website can access information about forest trees that has been recorded in the system. They, however, will not be able to make a transaction unless visitor register himself or herself as an investor or customer. The system provides facilities for website visitor to register himself or herself as an investor or customer. Information needed to be recorded including the investor name, detailed address, phone number, e-mail address, indentity type, and identity number. A unique investor identity number will be provided by the system when visitor finished recording his or her data.
Transaction data recording
The transaction data in this system is used to record events or transactions related to forest trees and logs trading. The transaction consists of forest tree advertised for sale, investor intentions to buy the trees, forest tree trading transaction, forest tree harvesting data, recording of forest tree dead or cut down before harvesting time, log advertised for sale, customer intention to buy logs, and log trading transaction. The first three transactions are the business process for forest trees trading to solve the tebang butuh problem. Figure 5 illustrates how forest trees owner, forest farmer group, and investor interact in the process of forest trees trading in tebang butuh case.

119
Figure 5: Business process for forest trees trading in Tebang Butuh Case
The followings are detail activities for each transaction, showing who involve in the transaction, what they are doing, and what the impact of transaction in the systems is.
• Data Recording for Forest Tree Advertised for Sale
This transaction happens when the owner of forest tree wants to sell the tree before the harvest time, which is known as tebang butuh. The owner informs the forest farmer group staff about the trees that he wants to sell. The staff will search the trees data, and mark them as advertised to be sold. The data recording will change the status of the forest tree data from 0 to 1. The user of the system will recognize it as advertised for sale.
• Data Recording for Investors Who Have Intentions to Buy Forest Tree
Using this information system, investors can search forest trees advertised for sale by the owner. If investors interested to buy some forest trees, they can make an order for the trees they want to buy. This activity will change the forest tree status from 1 to 2, meaning that the tree is in the process of selling transaction, and no one can make make an order for the same trees. After paying the price of the trees, investors will send the payment receipt to forest farmer group staff for further process.
• Data Recording for Forest Tree Selling Transaction
Based on payment receipt received from the investors, the forest farmer group staff will entry the selling transaction data into the system. This activities will change the forest tree record status from 2 to 0, and change the the buyer as the new owner of the trees. It means that the transaction has been done successfully and the forest trees owner has been switch over from the seller to the buyer. The new owner will keep the trees grow, until the time of cutting date, or he can sell the trees before the cutting date, when he need money before the cutting date. The transaction data is also recorded at the forest tree transaction data. It is important to make a note that the investor buys only the trees, and not includes the land in which the trees grow. The land is still owned by the farmer.

120
• Data Recording for Forest Tree Harvesting
This activities is intended to record the the activities of forest trees harvesting when the harvest time comes. The trees are cut into several logs, that are ready for sale. The logs are recorded to identify the origin of logs and identify what part of the trees are the log came from. The log are stored at farmer group log stockpile.
The data recording is done by forest farmer group staff, based on forest trees harvesting document submitted by the trees owner. The data recorded including the forest tree identity, log identity, type of log, log volume, and log stockpile identity. This activitiy will cause the number of log stockpile to increase, meanwhile the number of forest tree to decrease. The forest tree status is set to 3, meaning the tree is cut at harvest time.
• Data Recording for Forest Tree Cut Down Or Death Before Harvesting Time
This activities is intended to record the the activities of forest trees harvesting or forest tree death before the harvest time. The data recording is done by forest farmer group staff, based information from the trees owner that has been confirmed by forest farmer group auditor. The data recording will change the forest tree status from 0 to 9, indicating that the tree is diminishing before the harvest time.
• Data Recording for Log Advertised for Sale
This transaction happens when the logs owner wants to sell their logs. The owner informs the forest farmer group staff about the logs he want to sell. The staff will search the log data, and mark the log data as advertised for sale.
The transaction recording will change the status of the log data from 0 to 1. The user of the system will recognize it as advertised for sale.
• Data Recording for Customer Intention to Buy Logs
Customer can search logs that are advertised for sale through the information system, and identify which logs he or she wants to buy. This activity will change the status of logs data from 1 to 2, meaning that the logs are in the process of trading transaction, and not any other one can order the same log.
After paying the price of logs, the customer sends the payment receipt to forest farmer group staff for further process.
• Data Recording for Logs Trading Transaction
This activity is intended to record the logs trading transaction. Forest farmer group staff will record the data after he or she receiving payment receipt sent by the customer who buy the log. The data recorded including transaction date, customer id, forest tree identity, log identity, type of log, volume, price, and place of delivery. This transaction will cause the number of logs in the stockpile to decrease.
• Data Recording for Distribution of Benefits
There are some stakeholders who involved in the community forest business. A forest farmer group, a group of forest farmers in a certain community forest area, is responsible for the development of community forest. A Forest farmer is the forest land owner and responsible for cultivating the forest trees. An Investor, who buys the forest tree in tebang

121
butuh case, is investing his or her money and expects some benefits at the harvest time. An investor, who spends his time and money for development and operation of the information system, is also expects some benefits from this activities. They deserve to get some benefits from the community forest business. The profit of this business will be distributed among the stakeholders, with the proportion agreed by all stakeholders.
3.3 Analysis of Information Systems Roles in Solving the Tebang Butuh Case
Community forest information system is designed to record the detail information of forest trees in a certain community forest, and its related activities. In addition to detail information of forest trees, the system also records the forest tree ownership, the forest land in which the trees are planted, the forest area in which the forest land are located. The community forest information system is a web based information system, that enable the community to access the information. The users of the system are not only community from the surrounding forest area, but also community from urban area and foreign countries.
A forest farmer who wants to sell his forest trees before the cutting date, which is known as tebang butuh, can advertise and sell his forest trees, without having to cut down their trees before the harvest time. He can earn money from this transaction, and continue growing the trees until the harvest time. In addition, he can earn additional money at the harvest time when the logs from this forest trees are sold. A proportion of the profit will flow to him as a forest landowner and forest trees grower.
Investor, who buys forest trees before the cutting date, can invest his money in an efficient way. He can buy forest trees when the trees have grown up, without having to buy the forest land. This is really a cheap way to invest. He can wait until the harvest time to get his investment back with additional profit. Besides, he can also sell his forest trees any time before the harvest time, if he wants to do so.
The information system enables the community to search forest trees advertised for sale before the harvest time. The community can buy the forest trees and keep the trees growing until the harvest time, under the management of the origin forest farmers. The community, who act as investor in this case, is not limited from people who live in the surrounding forest area. It can be people who live in the city, and also people from foreign countries. It means that the information system has capabilities to broaden the investor, scale up the number of potential investors, and bring additional fund from outside forest area into the economy of surrounding forest area. It can be expected that the circulation of addition fund can accelerate the growth of the local economy.
Interestingly, it does not need government fund to help forest community to solve the tebang butuh problem. It does not need a lot of resources to set up the systems. The government, therefore, can allocate the budget and resources for other beneficial programs to accelerate the community’s welfare. In addition, the system provides business opportunities that enable the economy in the forest community grow faster.
4. CONCLUSIONS
The community forest information system records detail information of forest trees in a certain community forest area. This web based information system can be accessed by broader communities, not only people who live in the surrounding community forest area, but also people who live in the cities and in foreign countries. They can buy forest trees sold before harvest time, known as tebang butuh case, and keep the trees grow until the harvest time. The profit earned at the harvest time are shared to stakeholders, including the current trees owner,

122
farmer as forest land owner and forest tree grower, farmer group as community forest adminitrator, and information system developer and operator.
The system has capability to solve the tebang butuh problem, with the following advantages:
a. The government does not need to allocate fund to solve the tebang butuh problem. The allocated budget can be shift for any other beneficial activities.
b. The system creates business opportunities for investors. The potential investors are not only people who live in the surrounding community forest area, but also people who live in the cities and foreign countries;
c. The forest farmers funding problem can be solved on time and at the trees are sold at the market price. The information system broadens the potential investors who want to buy forest tree, and make competition among investors are thougher; and make the price equilibrium shift higher
d. The forest trees transacted in this information system can be cultivated until the harvest time. The forest farmer will continue keeping the trees grow, and earn additional income at the harvest time;
e. Investors can invest their fund in an efficient way. The can own forest trees without having to buy the forest land. They can earn the yield of the investment at the harvest time, or the can sell the trees before the harvest time if he want to do so;
f. Cutting down the trees can be done as scheduled, whoever the current owner of the trees. It means that forest conservation can be managed carefully, that enable the forest to absorb the CO2 as it was planned.
g. This system provides additional income for stakeholders at harvest time. The profit of the investment can be shared using a certain agreed proportion amongs:
• The current owners of the forest trees; • Farmer as forest land owners and forest trees grower; • Farmer group as community forest administrator; and • Information systems administrators as systems developer and operator.
5. REFERENCES
Alviya, I, N., Sakuntaladewi, and I., Hakim (2007): Development of System on Community Forest Management in Pandeglang Distrik. Info Sosial Ekonomi (7) 1, 45-58
Charnley, S and P R, Melissa (2007): Community Forestry in Theory and Practice: Where Are We Now? In: Annual Reviews Vol. 36: 301-336 In: http://www.annualreviews.org /doi/abs/10.1146/annurev.anthro.35.081705.123143?journalCode=anthro accessed on April 8, 2013 at 17.35
Gadas, S.R (----): Pengembangan Hutan Tanaman oleh Rakyat. In: www.puslitsosekhut.web.id. Accessed on June 15, 2013 at, 9.29
Grehenson, G. (2009): Hutan Rakyat Dukung Kesejahteraan Petani Gunung Kidul. In: http://www.ugm.ac.id/index.php?page=rilis&artikel=2251 accessed on March 19, 2013 at 10.41

123
Munandar, A.W (2012): Sistem Informasi Manajemen Hutan Rakyat dengan WEBGIS. Thesis. Program Pascasarjana Fakultas Kehutanan Universitas Gadjah Mada Yogyakarta.
Pitakasari, A.R (2012): Cegah Tebang Butuh, Menhut Siapkan Dana Talangan. In: http://www.republika.co.id/berita/nasional/lingkungan/12/06/06/m575yk-cegah-tebang-butuh-menhut-siapkan-dana-talangan accessed on June 15, 2013 at 13.35
Prasetya, R.D (no year): Insentif Ekonomi Karbon Hutan Rakyat : REDD + Sukses, Lingkungan Hijau, Masyarakat Sejahtera. Departemen Manajemen Hutan Institut Pertanian Bogor
Tarigan, I.K (2009): Sistem Pengelolahan Hutan Rakyat dan Pengaruhnya Terhadap Pendapatan Masyarakat. Thesis. Departemen Kehutanan Fakultas Pertanian Universitas Sumatera Utara.
Waskitho (2010): Konflik Pengelolaan Hutan Kemasyarakatan (HKm) Di Kawasan Gunungkidul. In: http://crackbone.wordpress.com/2010/01/27/konflik-pengelolaan-hutan-kemasyarakatan-hkm-di-kawasan-gunungkidul/ accessed on March 19, 2013 at 11.17
Wicak (2010): Pengelolaan Hutan Rakyat Lestari Sebagai Upaya Penyelamatan Daerah Aliran Sungai. In: http://petanitangguh.blogspot.com/2010/01/pengelolaan-hutan-rakyat-lestari.html accessed on March 19, 2013 at 10.48
Widyaningsih, T.S and D., Diniyati (2010): Economic Contribution and Marketing System of Wanafarma Pattern in Privately Owned Forest Products at Majenang, Cilacap. Jurnal Penelitian Sosial dan Ekonomi Kehutanan ( 7) 1, 55 – 71

124
125
INAFOR A-0092
THE SECOND INTERNATIONAL CONFERENCE OF INDONESIA FORESTRY RESEARCHERS
THE 2nd INAFOR, 27-28 AUGUST 2013
Financial and Institutional Analysis of the Value Chain of Jepara Teak Furniture in Indonesia
Rachman Effendi1
1Research and Development Center for Climate Change and Policy, Jl. Gunung Batu No.5, Bogor 1660, Indonesia,
Tel: + 62 0251 8633944, [email protected]
Paper prepared for The Second International Conference of Indonesian Forestry Researchers (INAFOR)
27-28 August 2013
INAFOR SECRETARIAT Sub Division of Dissemination, Publication and Library
FORESTRY RESEARCH AND DEVELOPMENT AGENCY Jl. Gunung Batu 5, Bogor 16610

126
Financial and Institutional Analysis of the Value Chain of Jepara Teak Furniture in Indonesia
Rachman Effendi1 1Research and Development Center for Climate Change and Policy,
Jl. Gunung Batu No.5, Bogor 1660, Indonesia, Tel: + 62 0251 8633944, [email protected]
ABSTRACT
Most of furniture industries in Indonesia especially in Jepara District iare categorized as small and medium enteprises. Which have been contributing foreign exchange and create job opportunities. The existence of principal-agent relationship among actors in the chain has affected on imbalanced value added distribution which is the situation dis-incentive for actors. This study aims to identify the institutions along the teak furniture value chain and determine the policy scenarios that can encourage the sustainability of teak furniture industries in Jepara. The primary data was collected through interviews in Jepara. The analyses of data involve identification of actors and institutions in the chains and benefit cost analysis consisting of NPV, BCR and IRR. The results showed that (1) Actors who are involved in Jepara teak furniture consists of a few actors who are in or outside Jepara. Partnerships that occur in the Jepara teak furniture industry is a principal-agent relationship. (2) The craftsmen (agent) to produce his furniture more based on the buyer's order (principal), In such situation asymmetric information happens causing the position of craftsman and teak growers as price takers. (3) All business activities along the value chain of teak furniture by any actor to be developed and are effective as indicated by the value of NPV> 0. BCR> 1 and IRR> interest rate (12%). The policies that can be applied is the policy incentives for private forest farmers, promoting products and capacity building of craftsmen, building cooperative among the furniture producers. Keywords: Value chain, teak furniture, principal-agent, value added, benefit cost analysis
1. INTRODUCTION
The activities in the field of furniture not only produces income, but is also grow the industry and creating job opportunities for the people among other forest management sector (crops and natural), trade logs, sawmill industry, furniture industry, finishing company, and exports. According Roda et al. (2007), in 2005 the furniture industry in Jepara, as the center of the furniture industry, at least there were 15,271 industrial units by absorbing 176,470 workers. BPS district of Jepara (2007) reported that in 2006, the number of exporters of furniture as much as 265 units which includes 68 countries of export destination.
The competition in furniture industry does not only occur between firms in the cluster, but the competition is also occurs with other companies in different clusters. Thus, the success in competition is not only determined by the company itself, but is also determined by its supporting systems, including policies issued by the government, the policy of the company leaders, and policies issued by other parties such as the demand for certification (according to Kaplinsky and Morris (2000) function is included in the legislative function). These policies affect the relationship (partnership) between actors in the chain to form an institution and the map strength is in the chain.
To maximize the benefits the actors involved, the company experienced problems in the network contract between capital owners and managers, and managers and subordinates,

127
while out firms face problems of connection or nertwork contract between the company and partner suppliers and the buyer (Nugroho, 2003). One approach used to study the theory of partnership is an approach that gives a relationship of trust (principal) and who earned the trust (agents) or generally referred to as a principal or agent relationship. This study aims to identify the institutional agencies along the teak furniture value chain and analyze the financial feasibility of each institution and formulate policies to encourage sustainable teak furniture industries in Jepara, West Java, Indonesia
2. RESEARCH METHODS
The approach used to study patterns of partnership in this research is an approach that gives a relationship of trust (principal) and who earned the trust (agent) or generally called the principal-agent relationship. Approach is used to describe hierarchical relationships relationships, and is commonly used to describe the levels in the process of exchange (Eggertsson, 1980 in Nugroho, 2003). In the hierarchy of a complex relationship, one can play both roles simultaneously as an agent under a principal and as principal to an agent at the bottom (Whynes, 1993). Financial analysis is used to measure the profitability of an activity is the Net Present Value (NPV), Benefit Cost Ratio (BCR), and internal rate of return (IRR) (Davis et al., 2001)
3. RESULTS AND DISCUSSION
3.1. Furniture Industry Value Chain Furniture industry is an industry that has an important role in foreign exchange income and revenue, especially the district of Jepara, in addition to its role in employment. In terms of raw materials (supply of raw materials), continuity of the furniture industry is strongly influenced by the price and continuity of the raw material itself. The raw material comes from Perhutani apart also from community forests. From the sales side, the purpose of selling furniture products can be either the domestic market and export markets.
The partnership that may occur in the value chain between buyers, manufacturers, and between the logs traders and farmers. The relationship between the principal (the giver of trust) and agencies (trust beneficiaries) always raises the issue of mismatch of information between sellers and buyers are prone to behaviour resulting partnership opportunity (Nugroho, 2003).
The number of furniture industry in Jepara has resulted in competition between actors. The existence of principal-agent relationships that occur between actors in the chain determines the distribution of profits earned by each actor along the value chain. This happens because each actor wants to maximize the benefits gained. Nugroho (2003) argued that the emergence of mismatch of information between sellers and buyers resulting in partnerships vulnerable to oportunitis behaviour. This condition will determine the institution yng occurs within the value chain, so it will affect the competitiveness of furniture products in global trade.
3.2. Identification of Institutional Value Chain Business in Jepara teak furniture involves many actors (actor) both located in Jepara or that are outside Jepara. Actors involved is a timber grower (farmer and Perhutani), timber merchants in Jepara and outside Jepara, sawmill owners, craftsmen, owners of finishing services, domestic reatailer, exporters, and global buyers. As for domestic flow, and the power to control that occurs in Jepara teak furniture value chain as presented in Figure 1.

128
Figure 1: Jepara teak furniture value chain
From the Figure 1 can be seen that the flow of production to produce wooden furniture starting from the farmers and growers Perhutani. Furthermore, a log of wood that has been bought and sold by timber merchants. Before the wood is processed into semi-finished by furniture craftsmen, experience the process of sawing logs first. The next stage is the process of finishing the production of furniture, and then marketed to consumers and users. In addition to products produced by craftsman furniture, furniture products are is also produced by industries throughout the series production of furniture has been integrated within the company.
In terms of production, furniture products are generally controlled by the buyer (buyer driven). Buyers determine the specifications of the product design and quality of furniture that will be generated. In other words, furniture products produced by artisans in order buyers, both domestic buyers (domestic retailers) as well as exporters. In addition to furniture product specifications are determined by the buyer, the price of furniture products are also more controlled by the buyer. In this case, the craftsman is a determinant of price to sales price furniture products it produces. Likewise, the prices of raw materials in the form of logs, which is a determinant of price craftsmen.
Overseas Market
Global Buyer
Eksportir + Finishing/Mechanized
Domestic Retailers
Collector
Craftsmen
Domestic Market
Finishing
Sawmill
Trader of Wood
Perhutani Forest Public Forest
Production flows Power to drive

129
3.3. Institutional Analysis and a Partnership.
3.3.1. Farmers and timber merchants
Sale of timber level of farmers (principal) in Jepara to timber merchants (agent) is generally done when the tree stand, so that the entire cost of logging and harvesting permits the responsibility of the agent. The system is a payment made by cash system. If the amount of timber sold a lot, then the payment system is done by assigning a deposit in advance. Payment is then performed on the tree to be felled. Generally, when the farmer will sell the timber, it must first be offered to the nearest merchant. If the price offered is suitable then the transaction occurs, whereas if the agreement is not the price, the farmers offer timber to another merchant. One of the factors that influence the occurrence of sales transactions is the level of funding needs of farmers. Subsistent farmers generally, and thus have a lower bargaining position because of necessity.
The sale price of teak in Jepara in the form of standing trees an average of Rp 600,000 - Rp 250,000 per tree with the diameter between 30 - 35 cm or the average price of teak is of Rp 900.000,- per m3. Although at the time the transaction occurs negotiation process, but the price of wood is more determined by the agent. This happened because there is no balance of information about the timber market and timber quality. Information about the market and quality of timber in the more controlled by the merchant trade buyers. This resulted in the bargaining position of higher merchant and prone to taking greater profit by the agent. The wood teak collection point from forest community in Jepara as presented in Figure 2
Figure 2: Wood teak collection points
3.3.2. Merchant supplier and collecting timber merchant in Jepara
Timber sales between merchant supplier (principal) and collecting timber merchant (agent) occurs in the form of logs that have been classified based on the quality and size of the timber. Information on quality and price of timber owned by the principal and the agent can be said to be balanced, so that each has an equal bargaining position. Transportation costs to deliver the timber to traders issued by merchant suppliers outside Jepara in shared responsibility. As for trader suppliers that are outside Jepara, wood prices are mostly bought by collectors in Jepara already include shipping. Method of payment made in cash. Cooperation is performed only on the basis of trust. The average selling price of teak from merchant suppliers is Rp 2,100,000 per m3.

130
Timber traded by collector merchants are teak wood from community forest and a little bit of wood from Perhutani. The increase in selling price of logs from community forests following the rise in timber prices from Perhutani. Difference in the selling price of teak wood from community forest and Perhutani for diameter 30-35 cm is of Rp 800,000 per m3.
3.3.3. Perhutani and wood trader
Timber sales conducted by Perhutani can be done through contracts, direct sales, auction sales and sales through the wooden stalls. Prices of wood who wear including basic sales price, surcharge and differentiation. Imposition of surcharge set by the board of directors, while the differentiation determined by the general manager. Timber sales conducted in plots. Average price of teak from Perhutani for diameter 30-35 cm is of Rp 3.7 million per m3.
3.3.4. Jepara wood traders, craftsmen and sawmill services
To obtain wood as raw materials, craftsmen usually come to timber merchant (principal). Craftsmen purchasing decisions of timber are usually determined by consideration of the type, size and suitability of the price and distance to the site of craftsmen. Considerations related to economic factors. Purchasing of wood by craftsmen in the merchant can be done in units of log or m3. Purchases per m3 can be done by his own choice or a way of buying plots. Both are implications for timber purchase price difference. To purchase a system wood lots, the wood price is much cheaper than a system of m3, but information of wood quality is controlled by the seller. For example, the price of teak wood for diameter of 30 - 35 cm is Rp 2.600.000 per m3 by plots system, whereas in the election system itself is Rp 2.900.000 per m3. Tranportation and loading and unloading cost are responsible by the buyer. Teak furniture of craftsman production in Jepara as presented in Figure 3.
Figure 3: Teak furniture of craftsman production
3.3.5. Craftsmen and sawmill industry and finishing services
The relationship between craftsmen and sawmills, craftsmen and finishing services only in the form of service. In the sawmill services, calculation of payment is calculated based on the volume of sawn timber. The amount of services per m3 saws vary start from Rp 100,000 to Rp 150,000. Service owners of these mills can be private property and there is also a cooperative owned by craftsmen. In some places there are services sawmill owner who will also have a business selling logs in the same location, so the transportation can reduced.

131
Finishing services are usually calculated based on units (pieces) of furniture will be finished or set of furniture. The amount of finishing costs varies based on the model and size of furniture. In addition, for items of furniture the same model and size, the price of finishing is vary depending on the type of finishing desired. The types of finishing including finishing burn, natural finishing, and finishing antiques. More complex finishing process is done, then more and more expensive finishing services to be paid. All costs incurred for finishing process are the responsibility of finishing services provider. For any payments made in cash, some are done with the transfer after finishing done and delivered. Various types of teak furniture of craftsman production in Jepara as presented in Figure 4.
Figure 4: Various types of teak furniture of craftsman production
3.3.6. Craftsmen and domestic retailers and exporters
For furniture with the goal of the domestic market, craftsmen (agent) usually produces furniture by order, where prices and product specifications have been determined by the buyer (principal). The Buyer may take the form of raw furniture is a retailer (showroom) or a furniture collector who would sell his furniture back to the retailer outside of Jepara. Payments generally provided with a system down payment in the amount varies. Subsequent payments made after the furniture are shipped with the system of payment back. While the payments made by the collector is usually cash, but the price offered is cheaper. Craftsman also produces furniture based on orders with common furniture design. The reason for producing furniture with a common design is easy in sales
For export markets, which generally have access or deal directly with overseas buyers are exporters. Orders from overseas buyers usually subcontracted to the craftsmen. With the sub-contract system, then the principal-agent relationship occurs at two levels. Firstly, among buyers with exporters by craftsmen. At the first level of relationship, the buyer acts as the principal who gives orders to the specifications of furniture that has been determined, while exporters acting as the agent who receives the order. At the second level of relationship, as the principal exporter to give some of this authority in the resolution to order furniture craftsmen who have a subscription because of the quality of work is known. Recruitment of new craftsmen only done when the number of orders a high quantity units.
Giving orders from exporters to the craftsmen are given in the form of a work order as the basis for the manufacture of type, size, model, and the quality of furniture that will be made.
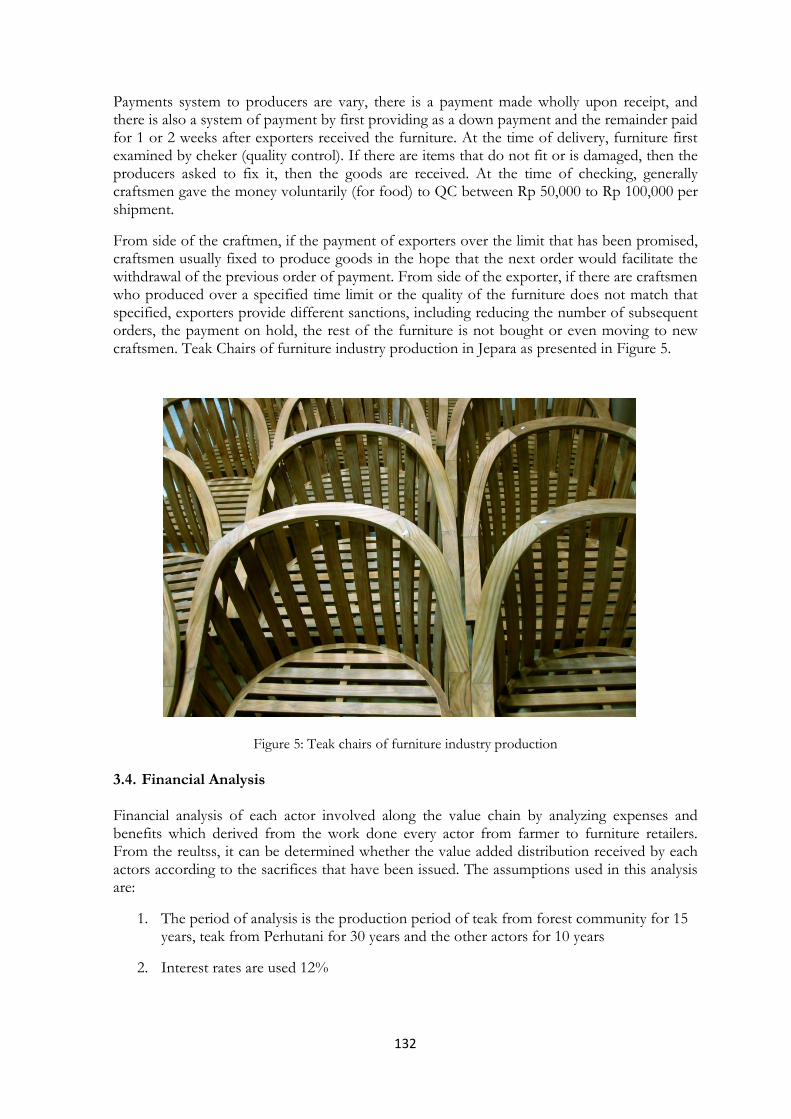
132
Payments system to producers are vary, there is a payment made wholly upon receipt, and there is also a system of payment by first providing as a down payment and the remainder paid for 1 or 2 weeks after exporters received the furniture. At the time of delivery, furniture first examined by cheker (quality control). If there are items that do not fit or is damaged, then the producers asked to fix it, then the goods are received. At the time of checking, generally craftsmen gave the money voluntarily (for food) to QC between Rp 50,000 to Rp 100,000 per shipment.
From side of the craftmen, if the payment of exporters over the limit that has been promised, craftsmen usually fixed to produce goods in the hope that the next order would facilitate the withdrawal of the previous order of payment. From side of the exporter, if there are craftsmen who produced over a specified time limit or the quality of the furniture does not match that specified, exporters provide different sanctions, including reducing the number of subsequent orders, the payment on hold, the rest of the furniture is not bought or even moving to new craftsmen. Teak Chairs of furniture industry production in Jepara as presented in Figure 5.
Figure 5: Teak chairs of furniture industry production
3.4. Financial Analysis
Financial analysis of each actor involved along the value chain by analyzing expenses and benefits which derived from the work done every actor from farmer to furniture retailers. From the reultss, it can be determined whether the value added distribution received by each actors according to the sacrifices that have been issued. The assumptions used in this analysis are:
1. The period of analysis is the production period of teak from forest community for 15 years, teak from Perhutani for 30 years and the other actors for 10 years
2. Interest rates are used 12%

133
3. Cropping pattern of teak from forest community are intercropping system with peanut crops to plant teak 4 years old
4. Potential teak from forest community which an area of 2 hectare estimated timber volume of 875 m3, a number of plants is of 1,250 and stumpage price of Rp 900,000, - per m3.
5. Potential teak Perhutani which an area of 2 hectare is estimated timber volume of 2000 m3 of wood, a number of plants is of 1,250 and the price of log is of Rp 4.7 million per m3.
The analysis of each actors along the furniture value chain presented in the following table :
Table 1: Results Analysis of NPV, BCR and IRR of each actor along the furniture value chain
No. Actor NPV (x 1.000 IDR)
BCR IRR (%)
Remarks
1. Farmer 134,748 3.33 35,5 Area 2 Ha, 15 years 2. Traders Supplier 328,891 1.29 64,4 3. Traders collectors 285,878 1.16 31.50 4. Perhutani 288,643 4.14 18.98 Area 2 Ha, 30 years 5. Sawmill industry 38,230 1.32 55.70 6. craftsman Furniture 13,947 1.11 63.00 7. Medium Scale Industries 685,916 1.08 45.05 8. Large Scale Industries 9,317,588 1.30 64.25 9. Retailer 33,479 1.11 72.00
The result shows that all activities along the furniture value chain of each actor is to be developed. This is indicated that the value of Net Present value (NPV)> 0. Benefit Cost Ratio (BCR)> 1 and Internal Rate of return (IRR)> interest rate 12%. Therefore the partnership this is effective because any work done by each actor along the chain is feasible to be labored. If the BCR and IRR criteria used to compare any business activities conducted by each actor, the cultivation of teak from Perhutani more profitable because the ratio of income and expenses is the greatest (4,14), but this business needs 30 years. However if the IRR is used as a criterion rate of return on investment, the efforts retailers have the highest rate of return which the value of IRR of 72% compared to other business activities, but the scale is relatively small.
3.5. Policy Scenario The government is expected to further increase in real attention to development of small scale industries (craftsmen) because of the results obtained by the largest value added along the value chain of furniture for the domestic market retailers. This shows that small scale industry only received orders from retailers or exporters for export markets or it can be said that the furniture industry is buyer driven. The driven is not only the model and quality of the furniture, but the price too. This is due to asymmetric information between retailers and buyers (domestic and export), so the small scale industry (craftsmen) is price takers. In order to increase efficiency and incentives that government policy urgently required.
Governments need to consistently and actively promote the products of small scale furniture industries and open outlets in every marketing abroad, so that Indonesian furniture products have a highly competitive market both domestic and international. To improved efficiency, the government needs to develop policies that can reduce the cost, such as high economic cost, the complexity of licensing, etc. Central and local government support for the furniture

134
industry is absolutely necessary to reduce regulations which lead to extra costs for the industry causes the lack of competitiveness of the industry. In other side, the synergy between actors along the value chain need to be improved such as build the furniture industry cluster.
4. CONCLUSIONS AND RECOMMENDATION
4.1. Conclusions
1. Actors who are involved in Jepara teak furniture consists of a few actors who are in or outside Jepara, namely timber growers (farmers and Perhutani), timber merchants in and outside Jepara, sawmill owners, craftsmen, owners finishing services, reatailer domestic, exporters and global buyers. Partnerships that occur in the value chain of institutions in the Jepara teak furniture industry is a principal-agent relationship.
2. The craftsmen (agent) to produce his furniture more based on the buyer's order (principal). Asymetric presence information between timber merchants and farmers resulted in the position of farmers as price takers
3. All business activities along the value chain of teak furniture by any actor is to be developed and it is being effective. This is indicated by the value of financial indicators that NPV> 0. BCR> 1 and IRR> interest rate (12%).
4.2. Recommendation
Central and local government policies that can be applied is the policy incentives for private forest farmers, to promote the products of small scale industries (craftmens) and development of marketing, capacity building of craftsmen
5. REFERENCES
BPS Kabupaten Jepara (2007): Jepara Dalam Angka 2006. Jepara. Badan Pusat Statistik Kabupaten Jepara.
Davis, L.S., K.N. Johnson, P.S. Bettinger, T.E. Howard (2001): Forest Management: To Sustain Ecological, Economic, and Social Values [Forth Edition]. Boston:McGrawHill.
Haris, U. dan Gonarsyah, I (1999): Struktur Pasar dan Kinerja Kelembagaan Tataniaga Bahan Olah karet Rakyat (BOKAR). Jurnal Sosial Ekonomi Pertanian 12 (2):56-78.
Kaplinsky R and Morris M (2000): A Handbook for Value Chain Research. http:www.ids.ac.uk/ids/global/pdfs/VchNov)1.pdf. [3 September 2007].
Nugroho, B (2003): Kajian Institusi Pelibatan Usaha Kecil-Menengah Industri Pemanenan Hutan untuk Mendukung Pengelolaan Hutan Produksi Lestari [Disertasi]. Program Pascasarjana, Institut Pertanian Bogor.
Parlinah, N. , Punomo H, dan Nugroho B (2011) Analisis Finansial Dan Kelembagaan Rantai Nilai Mebel Mahoni Jepara. Jurnal Analisis Kebijakan Kehutanan (8)3, 245 - 260
Purnomo H (2006): Teak Furniture and Business Responsibility: A Global Value Chain Dynamics Approach. Economics and Finance in Indonesia 54(3), 411-443.
Roda JM, Cadene P, Guizol P, Santoso L, dan Fauzan AU (2007): Atlas Industri Mebel Kayu di Jepara, Indonesia. Bogor. CIRAD dan CIFOR.

135
INAFOR A-0099
THE SECOND INTERNATIONAL CONFERENCE OF INDONESIA FORESTRY RESEARCHERS
THE 2ND INAFOR, 27-28 AUGUST 2013
Tengkawang Product Diversification to Improve the Livelihood Quality of Local People
Rizki Maharani and Andrian Fernandes
Dipterocarps Research Center Jl. A.W. Syahranie 68 Samarinda, 75119
Kalimantan Timur, Indonesia Corresponding email: [email protected]
Paper prepared for The Second International Conference of Indonesian Forestry Researchers (INAFOR)
27-28 August 2013
INAFOR SECRETARIAT Sub Division of Dissemination, Publication and Library
FORESTRY RESEARCH AND DEVELOPMENT AGENCY Jl. Gunung Batu 5, Bogor 16610

136
Tengkawang Product Diversification to Improve the Livelihood Quality of Local People
Rizki Maharani and Andrian Fernandes
Dipterocarps Research Center
Jl. A.W. Syahranie 68 Samarinda, 75119 Kalimantan Timur, Indonesia Corresponding email: [email protected]
ABSTRACT
Tengkawang fruit business only exists in Kalimantan, particularly in West Kalimantan. Unfortunately, trading monopsony results in extremely low price of tengkawang fruit, Rp 1,000 to Rp 2,000/kg of fresh fruit. Tengkawang product diversity is one of possible way to enhance tengkawang fruits value. This paper studies possible tengkawang fruit product diversity in order to increase local people income. Tengkawang fruits as the raw material for this research were taken from Sanggau, West Kalimantan. The result show that the low quality of tengkawang fruit can be utilized as handycraft, and better quality of tengkawang fruit can be processed into several kinds of food such as ice cream topping, brownies and tengkawang crackers. Tengkawang fruit contains only about 1.36% of free fat acid (FFA), which is meet the FFA content for food (less than 5%). Accordingly, local people can produce and sell these various kind of products diversification directly to customers and reduce the dependence to the merchants.
Keywords: Tengkawang, diversification product, improve livelihood, local people, free fat acid
1. INTRODUCTION
Utilization of non-timber forest products (NTFPs) has been developed to reduce timber exploitation (Rist et al., 2012). The existence of NTFPs is not only to maintain forests, but also as the source of food, medicine, and income as well as to preserve the local culture. One NTFP from West Kalimantan is tengkawang fruits. Tengkawang belongs to Shorea genus of Dipterocarpaceae family. Its fruit is known as Borneo illipe nut that is used as raw material of high value green fat. Moreover, utilization of NTFPs provides significant contribution to the economy of forest communities (Jensen, 2009). On mass-harvest, productive trees around 30 to 100 years old is able to produce about 250 - 400 kg fruit per tree (Sumarhani, 2007). Tengkawang fruit mass-harvest season occurs once every 4 years naturally and the price of Tengkawang fruit during the season is very cheap (Rp 1,000 – Rp 2,000). Meanwhile, people is not collecting tengkawang fruits during non mass-harvesting time as there is no one will buy the fruit.
Based on the information from local communities in Sanggau, tengkawang fruit can only be sold in the form of peeled fresh seed and dried seed (smoked seed). Product diversification is one alternative for local communities to adapt with the global economic changing (Mertz et al., 2005). One alternative product that has been developed is the utilization of tengkawang fat as wax substitute on lipstick manufacturing (Hambali et al., 2002). Lipstick manufacturing tends to be developed only in large-scale industry. To improve the livelihood of the owners and farmers of tengkawang, it is necessary to make tengkawang product diversification using simple equipments. This study aims to create diversification of tengkawang product with

137
simple equipments for household level with long term expectation is to improve the livelihood of local people as tengkawang owner and farmer.
2. MATERIALS AND METHOD
Tengkawang fruits were collected from Sanggau, West Kalimantan. The process of product diversification begins with the study of tengkawang seed content. Further tests carried out include the initial moisture and Free Fat Acid (FAA) contents which were conducted in The Non Timber Forest Products laboratory, Faculty of Forestry, Gadjah Mada University.Tengkawang products diversification grouped into two kinds of raw materials: unpeeled tengkawang fruit with wings and dried seed from traditional process (smoked seed). Unpeeled tengkawang fruit with wings is used as raw material for handicraft and smoked seed is used as raw materials for ice cream topping, brownies and tengkawang crackers.Diversification of tengkawang products have been introduced to the public, particularly in the training of appropriate technology for tengkawang seed processing in Sanggau, West Kalimantan. Some of the training participants were local people as tengkawang owner and farmer, stakeholders and local NGOs.
3. RESULTS AND DISCUSSION
The research results show that tengkawang fruit has an average of 35.73% of seed pericarp. For comparison, cocoa seed consists of 85% of cotyledon and 15% of pericarp (Jahurul et al., 2012).Traditional fruit drying process or “smoking process” that was conducted by local people showed that small tengkawang seed is about 7.54% moisturecontent, while large tengkawang seed is only 8.26%. Okwelogu (1969) stated that in storing process at 27oC and 70% of relative humidity, seed of S. gysbertsiana and S. seminis is about 7.1% moisture content, while S. stenoptera is about 7.9% and S. palembanica is 8.6 % moisture content.
The valuable content of tengkawang seed is the fat. Lipp and Anklam (1998) stated that Free Fat acid (FFA) is an essential role in nutrition functions. The test result showed that the FFA of tengkawang seed fat is 1.36. As the FFA is less than 5%, tengkawang seed fat can be used as food and safe for consumption.Some of tengkawang product diversifications are handycraft, ice cream topping, tengkawang brownies, tengkawang crackers. In general, the main material for the handycraft is low quality of tengkawang fruit. Other materials are dried pandan leaves, rubber plant seed, glue, paint or other coating materials. The handycraft has been introduced to the local people who have been long involved in arts, such as sculptor and weaver.
(A) (B) Figure 1: (A) Handycraft from tengkawang seed and rubber seed ; (B) ice cream with roasted
tengkawang seed topping

138
For food, tengkawang fruit diversification products include ice cream topping, brownies, and crackers which are usingtengkawang smoked seed as one of the ingredients. Firstly, boiling tengkawang smoked seed in boiling water twice. After that, blending or grinding the seed and roasting it for about 3 minutes. Roasted tengkawang seed produce specific flavor aroma, which is ready to be used as ingredient of ice cream topping, brownies and crackers.
Economically, the minimum selling price for each handycraft is Rp 1,000 for handycraft which use at least 2 pieces of low quality tengkawang fruits as raw material. Ice cream topping, brownies, and crackers need some pieces of tengkawang smoked seed depending on its necessity. The price of tengkawang brownies is Rp 10,000 – Rp 20,000 and the price of one packing of 10 L tengkawang crackers is Rp 30,000 – Rp 40,000. The selling price of ice cream with tengkawang seed topping is depend on the ice cream price and flavor. The advantage of tengkawang seed ice cream topping is the specific unique and distinctive taste of West Kalimantan through tengkawang seed.
A B Figure 2: (A) Tengkawang brownies and (B) crackers
There were some gained information from the meeting between some parties such as Forestry Service, Department of Industrial Trade and Cooperatives, Agricultural Extension Agents and local people as tengkawang tree owners and farmers in Sanggau. The local people were interested to develop tengkawang fruit handycraft. The officer from of Forestry Service of Sintang was interested in developing tengkawang ice cream topping. Tengkawang diversification product hopefully shall support the government programme, “one village one product”. In addition, the local people who are the owner and farmer of tengkawang can sell the other more valuable product beside fresh fruit or smoked seed.
4. CONCLUSIONS
Tengkawang product diversification is an important model of NTFPs development for local people and improving tengkawang value by introducing models of intregrated technology. There will be less wasted products of tengkawang with more efficient technology. It is not only introducing the appropriate technology for tengkawang seed processing, but also offering new diversification products with higher value than just raw tengkawang seed or intermediate product that has low price in mass-harvest season. Tengkawang diversification product is predicted to provide 10 times benefits than intermediate product. It certainly will improve

139
local people's income to get assured life quality. To achieve definite benefits still requires further research to improve the product quality. Accordingly, the support from all parties is very important, especially when the product want to be produced in large-scale and enter the industrial or manufacture level. Furthermore, prospective market is also a very important supporting parameter to be developed.
ACKNOWLEDGEMENTS
Authors gratefully acknowledge the financial support from the International Tropical Timber Organization (ITTO) PD586/10 Rev.1 (F). Authors also thank all colleagues from Dipterocarps Research Center (Direc), Laboratory of Forest Products Technology of Forestry Faculty of Gadjah Mada University, People Resources and Conservation Foundation (PRCF) Indonesia and other institutes that kindly helped us in collecting data and reponding all questions.
5. REFERENCES
Arnold, J E M and M R Perez. 2001. Can Non-timber Forest Product Match tropical Forest Conservation and Development Objectives? Ecological Economics Journal. Vol. 39. Hal 437-447. Elsevier.
Bolland, L P, E A Ellis, M R Guariguata, I R Mallen, S N Yankelevich and V R Garcia. 2012. Community Managed Forest and Forest Protected Areas : An Assessment of Their Conservation Effectiveness Across the Tropics. Forest Ecology and Management Journal. Vol. 268. Hal. 6-17. Elsevier.
Byron, N and M Arnold. 1999. What Futures for the People of the Tropical Forest? World Development Journal. Vol. 27. No. 5. Hal 789-805. Elsevier.
Dewi, S., B Belcher and A Puntodewo. 2005. Village Economic Opportunity, Forest Dependence, and Rural Livelihood in East Kalimantan, Indonesia. World Development Journal. Vol. 33. No. 9. Hal 1419-1434. Elsevier.
Hambali, R., Jamaran, I., Saeni, M S., Irawadi, T T., Suryani, A., dan Mas’ud, Z A. 2002. Pemanfaatan Lemak Tengkawang sebagai Substituen Malam pada Pembuatan Lipstik. Bogor Agricultural Institute. Paten No. P00200200546. Adopted in http://repository.ipb.ac.id/handle/123456789/4138 on 17 July 2013.
Gardingen, P R, M J McLeish, P D Phillips, D Fadilah, G Tyrie, and I Yasman. 2003. Financial and Ecological Analysis of Management Options for Logged-over Dipterocarp Forest in Indonesian Borneo. Forest and Ecology Management Journal. Vol. 183. Hal 1-29. Elsevier.
Jahurul, MHA, ISM Zaidul, NAN Norulaini, F Sahena, S Jinap, J Azmir, KM Sharif, AKM Omar. 2013. Cocoa Butter Fats and Possibilities of Substitution in Food Products Concerning Cocoa Varieties, Alternative Source, Extraction Methods, Composition, and Characteristics. Journal of Food Engineering. Vol 117. Hal. 467-476. Elsevier.
Jensen, A. 2009. Valuation of Non-timber Forest Product Value Chain. Forest Policy and Economics Journal. Vol. 11. Hal 34-41. Elsevier.
Lipp, M. and E. Anklam. 1998. Review of Cocoa Butter and Alternative Fats for Use in Chocolate – Part A. Compositional Data. Food Chemistry Journal. Vol. 62 (1) : 73-97. Elsevier.

140
Mertz, O, R L Wadley and A E Christensen. 2005. Local Land Use Strategies in a Globalizing World : Subsistence Farming, Cash Crops and Income Diversification. Agricultural Systems Journal. Vol. 85. Hal 209-215. Elsevier.
Okwelogu, T. N. 1969. Maximum Safe Moisture Content for Storing Teff (Eragrostis abyssinica Scahrad.) and Sarawak Illipe Nut (Shorea gysbertsiana Burck). Journal of Stored Product Resource. Vol. 5. Hal. 169-172. Pergamon Press.
Rist, L., P Shanley, T Sunderland, D Sheil, O Ndoye, N Liswanti and J Tieguhong. The Impacts of Selective Logging on Non-timber Forest Products of Livelihood Importance. Forest Ecology and Management Journal. Vol. 268. Hal 57-69. Elsevier.
Sumarhani. 2007. Pemanfaatan dan Konservasi Jenis Meranti Merah Penghasil Tengkawang. Info Hutan Vol IV (2) : 177-185.

141
INAFOR A-0100
THE SECOND INTERNATIONAL CONFERENCE OF INDONESIA FORESTRY RESEARCHERS
THE 2nd INAFOR, 27-28 AUGUST 2013
Success Story of Buffer Zone Management at Kerinci Seblat National Park: Lesson Learnt from Jorong Pincuran Tujuah Village, West Sumatera
Rozza Tri Kwatrina1, M. Bismark2, and Reny Sawitri3
1,2,3Research and Development Center of Conservation and Rehabilitation Jl. Gunung Batu No. 5,16610,Bogor, Indonesia
Paper prepared for The Second THE SECOND INTERNATIONAL CONFERENCE OF INDONESIA
FORESTRY RESEARCHERS 27-28 August 2013
INAFOR SECRETARIAT Sub Division of Dissemination, Publication, and Library
FORESTRY RESEARCH AND DEVELOPMENT AGENCY Jl. Gunung Batu 5, Bogor 16610

142
Success Story of Buffer Zone Management at Kerinci Seblat National Park: Lesson Learnt from Jorong Pincuran Tujuah, West Sumatera
Rozza Tri Kwatrina1, M. Bismark2, and Reny Sawitri3 1,2,3Research and Development Center of Conservation and Rehabilitation
Jl. Gunung Batu No. 5, 16610 Bogor, Indonesia Corresponding email: [email protected],
ABSTRACT
Forest communities are often blamed as the cause of forest destruction. Kompas data on October 2012 said as many as 42,000 hectares of land degraded due to encroachment made by people in Kerinci Seblat National Park. It has lasted more than ten years, and even began to involve large investors. However, the Jorong Pincuran Tujuah Village, one of the buffer zone villages, shows that not all of people cut the forest trees, even they successfully manage natural resources and actively protect the forest. This paper described the concept of buffer zone management, and an example of success story of buffer zone management in Kerinci Seblat National Park. Jorong Pincuran Tujuah Village is a picture of community that have high awareness to manage and to conserve natural resources. In 1998, the Jorong Pincuran Tujuah Village got assistance from the World Bank through the Integrated Conservation Development Program (ICDP), and the Department of Animal Husbandry. Awareness and efforts of the community to meet the needs of living independently in twin, lead them to get theKalpataru award in 2012. Infact, policy of conservation village model in the Ministry of Forestry also strongly supports the conservation village development. There should be supported by strong commitment, applicative programs, and fostering sustainable land management in the form of agroforestry, livestock and alternative products as biogas and organic fertilizer. Some key points of the successof Jorong Pincuran Tujuah Village in buffer zone of Kerinci Seblat National Park are consciousness to be away from forest dependence, economic independence, as well as active in conservation efforts.
Keywords: buffer zone, ICDP, conservation agreement, Kerinci Seblat National Park
1. INTRODUCTION
Kerinci Seblat National Park (KSNP) is the largest national park in Indonesia, covering an area of 1.368.000 ha. This park has an important role as a life support and environmental services for people in more than 350 villages in 13 counties and 2 cities in 4 provinces in Sumatera (BKSNP 2010).
As a conservation area for ensuring protection of habitat and biodiversity, KSNP confronted many problems that threatened the integrity and functions such as encroachment, illegal logging, poaching, theft of non-timber forest products, mining, settlement, clearing roads and regional boundaries (BKSNP 2010).
Local communities that lived there before the area is designated as a conservation area often blamed as the cause of forest destruction. Meanwhile, the coming society also fallowed to open the forest. They got variety of needs such as food, clothing and building materials from

143
the areal conservation. They also do gardening and even live in the conservation area. Manullang (1999) stated that quite a lot of cases where the squatters are people who are paid by the capital owners in town for the opening of new plantations in the area. In the case of KSNP, Kompas data on October 2012 said as many as 42,000 hectares of land degraded due to encroachment made by people in national park. It has lasted more than ten years, and even began to involve large investors.
Development of buffer zone is an important strategy to reduce the pressure on KSNP and to strengthen the conservation and integrity of regional ecosystems.The strategy has spectrum for activities and area of buffer zone development that aplicated by the project ofIntegrated Conservation and Development Program (ICDP). This program was expected to solve conflict interest between production and conservation by linking biodiversity conservation with economic and social concern. The project of ICDP in buffer zone of KSNP arranged in 78 villages of four regions Jambi, West Sumatera, Palembang and Bengkulu. In West Sumatera, there were 14 villages which got this project as Conservation Agreement (KKD)-ICDP (Abbas, 2010).
Subsequently, the approaching of ICDP project also expected to realize management and development of buffer zone through collaborative and supported by the local communities and local government, because of using of the forest resources and limitation of income sources. Therefore, one of the recommendations in the ICDP project was to improve the welfare of local communities with alternative activities in the buffer zone (Anonymous, 1997). However, the assessment of ICDP project at 24 conservation areas in Indonesia stated that the success of this project was still limited, because of many reasons i.e a). The programs often did not address to primary threat of the conservation areas, b) The legal economic activities of the government (construction roads, mining, conversion of natural forests) often became the primary threat of conservation areas, and c). The development programs didn't change people's behaviour for exploiting natural resources and encroachment of conservation areas. (Wells, et al. 1999).
Besides the limited success of ICDP project in KSNP, there was the unique fact about Jorong Pincuran Tujuah Village in the buffer zone of KSNP that received and successed to realize the ICDP programs. This paper describes the community success that located seven kilometers from boundary of national park to participate in the conservation of flora and fauna, management and participatory economic activities of the buffer zone in the form of Village Conservation Agreement. Finally this paper is expected to be an inspiration for other communities in the buffer zone of national parks, as well as park managers in managing conservation areas.
2. RESEARCH METHODOLOGY
The research was conducted in Jorong Pincuran Tujuah Village, Sangir Sub-District South Solok County, West Sumatera Province in October 2012. Geographically, this village include in Resort Sungai Lambai, Section IV Sangir, KSNP. The study site selection based on people who have close links with the park, both economic and social interests in terms of development and management of bufferzone.
Materials used in this study is forest community, woody plants, and livestocks. And, equipment that used recording, camera, and calculator. The study was done with descriptive method, by combining quantitative and qualitative analysis. The approach that used are survey approach, observation and interviews using questionnaires or in –depth interviews with selected respondents. The selection of respondents were intentionally (purposive sampling),

144
as many as 20 respondents as membering groups of Village Conservation Agreement (KKD)-ICDP-KSNP.
Types of data that collected in this study consist of primary dan secondary data. Primaray data were obtained from observation and collection data such as socio-economic data of communities were obtained through questionnaires and direct interview that included ethnic region, main occupations, land use, perception of communities to KSNP, forest community, agroforestry and livestocks. While, secondary data were obtained from the literatures and stakeholders. Then, data were analyzed descriptively
3. AGRICULTURAL LAND AND LOCAL RESOURCE USE
Initially, JorongPancuranTujuah Village was formed by 400 acres of the forest concession in 1997. This village had a total population of around 2,287 people (600 families) and their livelihood classified as farmers (75%), merchants (10%), civil servants (1%) and employees (9%). And, community welfare conditions can be classified as poor (40%), pre-prosperous (35%) and prosperous (25%) (Abbas, 2010). The agricultural commodities were rubber, coffee, upland rice, betel nuts, cinnamon, banana, and chocolate. Meanwhile, the livestocks were beef cattle, sheep and alternative products as biogas and organic fertilizer.
The community also planted forestry species such as teak (Tectona grandis) and surian (Toona sureni) in form of agroferestry system, that associated with oil palm and coffee. Furthermore, teak was abandoned due to poor quality and attacked by termite, so they prefered to plant the surian. It can be seen from the community forest of surian that owned by almost every household, about ± 500 plants. Surian can be harvested at the age of 14 years and produced 1 m3per tree. This surian wood can be sold Rp. 1.5 to 2 million/m3. Seed is obtained with collecting seedlings. Seedling sold for Rp. 3000, - per plantation.
The community forest in this village has the distance seven kilometer from the national park boundary. Cropping pattern is arranged in a spacing of 10 m x 10 m for each crop like rubber, while for surian is planted at a spacing of 10 m x 20 m. Then, kapol and upland rice are planted under rubber trees until 15 years. Another plantation as cinnamon plant was grown specifically, however this plantation tended to be abandoned by community, because of low price about Rp. 9000, -/tree/year and unbalance production time per year.
Integrated Conservation Development Program (ICDP), which has been implemented since 1996 until 2002, aimed to improve the welfare of the community together with conservation interests. The funding program from ICDP project used to develop livestocks, especially beef cattle.There were 16 groups of beef cattle that had membered 10-20 people per group. The joining of six groups in Kelompok Karya Muda showed good progress in terms of the number of cows around 40-60 cows per group. In addition, the Animal Husbandry Department provided guidance and assistance in the form cattle breeders and cage management amounted to Rp. 2 Billion. Farmers will also get an incentive of Rp. 500,000, - for every pregnant cow.The amount of aid received can not be separated from the development of the cattle livestock. Alternative production from cow waste were organic fertilizer and biogas (Figure 1). Organic fertilizer is sold around Rp. 20,000/30 kg. Currently, there were the programs to make pools and ruminant feed about Rp. 187,500,000, -.

145
Figure 1: Alternative production of cow waste by Kelompok Karya Muda
Meanwhile, the kinggrasses as fodder of cows were available planted in the garden and bare land (Figure 2).
Figure 2: Scheme of land use at Jorong Pincuran Tujuah Village
4. CONSERVATION PERCEPTIONS AND ACTIVITIES
The distribution of villages that are within and boundary the area of KSNP were 400 villages. These villages have a direct or indirect interaction with KSNP region. According to Helmi (2004), there were two major types of interaction between local community and KSNP that tended to have negative impacts on the sustainability of the park. Firstly, they cultivated land inside the park border and/or the expansion of plantation by clearing up the forest, and the second is harvesting forest products (i.e timber, other products, and hunting /catching wildlife). So, the local community would be threatened the existence of KSNP management.
However, the facts in Jorong Pincuran Tujuah Village indicated different conditions. In accordance KKD-ICDP-KSNP, then a working group of conservation through the Village Conservation Agreement was formed, so the community should be conserve the national park areas. Establishment of Village Conservation Agreement (KKD) in KSNP is one of the standard activities in the ICDP Project for developing KSNP (Manullang 1999). The commitment of the community was shown by an agreement to leave the encroachment areas in KSNP.In addition, the Conservation Working Group consisted of 16 groups was actively and regularly patrol the park for once a month together with staffs from Resort Sungai Lambai, Section Sangir IV. Moreover, the Working Group has warned its citizens not to work on as far as 200 m from the boundaries of the land and trade bussines around the area boundary.
Settlement
Holticulture
Swamp
Natural forest
King grass garden
Fiber forest
Agroforestry
Cinnamon garden
Farming

146
Public perception of the conservation area of KSNP was high, it could be seen from the greening of boundery land and the area along the road by themselves. To support this green barrier activities, KSNP has provided assistances as seedling and development of flagship species, event of joint patrols and daily guidance (Abbas 2010).
Figure 3: Green belt at the boundary of park area
Institutions and organizations of the KKD-ICDP-KSNP in Jorong Pincuran Tujuah still runs like when the firstly formed. The structure of KK-ICDP-KSNP were coordinator, manager, secretary, and treasurer as active management. The group consisted of a group of economic work and the work of conservation groups.The conservation perceptions and activities are presented as follows (Based on criteria for Kalpataru Award at Ministry of Environment, 2012):
a. Spontaneous patrols were performed at second week of each month, coordinated by the head of the group in the region along the border with staffs of KSNP ellipse (± 7 km). Patrol officers tasked to warn, cast out and catch the perpetrators of forest destruction in coordination with stakeholders. The group also regularly consulted with the officers about legal and technical issues.
b. Surian and durian nursery planted by communities themselves in their garden without any guidance from the group and government agencies. Surian and durian was chosen, because of the growth and the sufficiently abundance, so it is easy for sowing in a polybag. Subsequently, the seedlings were planted in the community land and the boundary of KSNP in three line patterns
c. Planting and the plant location was definited and done by communities themselves at the area with length of 7 km and width of 10 m (for the third line).The first pathway was directly adjacent to border line of KSNP. The second pathway will be used by this village, and the third pathway will be used used to fufill the needs of community. From the plannning 7 ha, it has been realized 1 ha at 2011 (1 km x 10 m). The main constraint at that time was the inadequate number of seedlings due to the limited ability of the group and the lack of assistance from the stakeholders.
d. There was economic improvement connected with changing in the public perception of dependence and regional forest products TNKS which integrated into sustainable agriculture. Assistance funds provided by the ICDP-KSNP in 2001 for conservation purposed for development livestocks, savings and loans. This is a condition of granting the aid for community commitment of Jorong Pincuran Tujuah Village to conserve the environment and leaving KSNP areas.

147
e. Socialization and extension was done by attaching a notice on the notice boards of the KKD –ICDP-KSNP Office, held a meeting at the office or home residents, as well as announcements through mosques funnel and incidental independently in the field (usually for those coming society who do not know the agreement of Jorong Pincuran Tujuah Village).
If the activities are broken down into indicators of success, there are several indicators of success in developing KKD-ICDP-KSNP programs(Based on criteria for Kalpataru Award at Ministry of Environment , 2012):
a. The successfully of changing perceptions and livelihoods from the dependency and/or rely on forest products to farmers, ranchers and furniture craftsmen that conserve the forests
b. Public awareness in conservation forest was realized with a routine patrol without pay (salary) and even fined when not doing patrol duty as on schedule;
c. The community independently replaced the palm seedlings at the boundary of KSNP with Pinang along the seven km as boundary line. Furthermore, since Pinang not to be sufficient, the community initiated plant three lines of trees corresponding to mark the boundary
d. Community forest consists of economically valuable plants such as trees, oil palm, coffee, rubber, and medicinal plants such as upland rice and kapol and the garden was planted with fruits plant and surian nursery.
e. Loan activities that previously only Rp. 250.000.000,- then grown and increased to Rp. 350,000,000,- in the past 10 years since 2001, eventhough coaching and assistance from the Bappeda Solok had ended in 2003;
f. Received several awards such as from Head of KSNP, from FEATI at 2010 as successful in the cattle breeding programs and food security, Kalpataru categories of environmental leaders by the Governor of West Sumatera in June 2012.
Jorong Pincuran Tujuah Village is a unique village profiles that have a high awareness of natural resource management and conservation. The impact of their perception to environment can be followed as:
a. The majority people of the Jorong Pincuran Tujuh Village are Javanese and fraction of Minang, but no social friction. Society always uphold a sense of kinship and deliberation in policy making, so that environmental conditions remain conducive and calm;
b. Related to environmental management that was initiated by the leadership of Jorong and KKD- ICDP-KSNP, the society so organized and disciplined in roles and duties;
c. Meeting activities, mutual cooperation, and joint patrols have made the strong bond in communities. The good socio-cultural and economic life really support the emergence of local wisdom to preserve the environment;
d. KSNP officers have been greatly assisted by community in surveillance and security region (Figure 6);
e. Sustainable nature can be maintained

148
f. The Jorong has been an example and a place for education and research in environmental and socio-cultural aspects.
(Based on criteria for Kalpataru Award at Ministry of Environment, 2011)
ICDP project consisted three programs, namely the conservation of fauna and flora in national park, setting of buffer zone management and participatory economic development in the buffer zone. From the aspect of the conservation of flora and fauna management, community forest of Jorong Pincuran Tujuah Village is part of the habitat for some wildlife species. Wildlife that are seen or passed around village are tigers, bears, and hoops. This is proven by the trajectory of tigers and prey species in the former national park boundary around the green belt.
5. LESSON LEARNT
From 12 villages that involved in ICDP project, Jorong Pincuran Tujuh Village is portrait of a successful village that developed the grant of ICDP in 2001. This village has an active organization structure, a working program, credit development, livestocks and forest community in terms of agroforestry/mixed garden.
As succesful village, Jorong Pincuran Tujuah Village was supported by community empowerment and management KSNP. Community empowerment is all efforts made by group members with or without external supports, for developing their capacity or potency to the improvement of their quality of life, independent and sustainable (PHKA, 2007). Sunkar (2013) interpreted that it’s empowerment is a process the development of human or community capacity, changed people’s attitude, and community organization. The three elements were held by community of Jorong Pincuran Tujuah Village.
Furthermore, there is internal factor of the social aspect that encouraged community to do the sustainable use of natural resource because of strong social linkages among them as the coming society from Java. The strong social linkages was raising a strong commitment towards a common goal to realize economic independence, and proactive in conservation activities. This character is similar to the character and goal of community empowerment as described by Sunkar (2013) that the three main objectives of community empowerment are developing the ability of society, changing people’s attitude, and self-organizing community.
What has been achieved by communities of Jorong Pincuran Tujuah Village, it’s were very important in the management of the buffer zone KSNP. The establishment and management of a buffer zone were to be very important considering the high pressure of community who not understanding the policy, retardation conservation, land tanurial conflict and economic orientation. From Law No. 5, 1990 of Conservation of Natural Resources and Ecosystems has been mentioned that the buffer zone is an area that is outside the conservation areas, either as forests, state land, or the land burdened necessary rights and able to maintain the integrity of the region.
Development of buffer zone is an integral part of regional development in which integrated from many sectors that the characteristics of the problems and needs of the region related with the objective development targets. Thus, the development of the buffer zone is one of alternative solutions to the problem of poverty alleviation particularly forest villagers, as well as the effort to increase community participation in conservation areas through the development of eco-tourism,conservation buffers, cultivation areas, and industries of plant potential with high economic value(Sawitri 2010).

149
Learning from Jorong Pincuran Tujuah Village and buffer zone management concept, and so, the buffer zone should be managed based on three interrelated aspects i.e. ecology, economy, and social culture. Bismark et al. (2007) stated that the development and management of buffer zone were done through the division of land into zoning. This zoning aimed to managing wildlife habitat and populations as well as socio-economic and cultural conditions of local communities. Technically, Setyawati and Bismark (2002) divide the development and management of buffer zone into three zones, namely:
a. Green zone
Green zone is supported function of the physical area from disturbance and the influence of exotic of plant species and home range of wildlife. These areas can be managed according to the function as the production forest, protected forest, and community forest which bordering with conservation areas.
b. Interaction zone
Interaction zone function is supporting the conservation areas and the green zone from drastic changing ecosystem, wildlife disturbance to the cultivated areas and effort the increasing of socio-economic community. Management of interaction zone was done by the development of community forest with agroforestry systems, secondary vegetation or abandoned public areas.
c. Cultivated areas
Cultivated area in buffer zone has many functions to support the improvement of social culture, regional development and ecotourism. Development of an integrated agricultural program was done through land clearing without burning, using eco-friendly herbicide, setting of community settlements that avoided wildlife conflict between community and conservation areas.
6. CONCLUSIONS
The development and management of buffer zone Kerinci Seblat National Park in Jorong Pincuran Tujuah Village wer done through the division of land use into green zone, interaction zone and cultivated areas, and intended to support the economic, social, cultural of community, and conservation of wildlife habitat and populations. Some key points of success story of this is village based on social linkages to achieve common goals were consciousness away from forest dependence, economic independence, as well as active in conservation efforts.
7. REFERENCES
Abbas RB (2010): Profil Jorong Pincuran Tujuh (Bangun Rejo) Kanagarian Lubuk Gadang Selatan Kecamatan Sangir Kabupaten Solok Selatan - Sumatera Barat. Laporan Kegiatan TNKS Seksi IV. Anonymous (1997): Integrated Conservation and Development Projects in Java and Sumatera: A Traveling Workshop Report. BAPPENAS-PHPA-The World Bank.
Bismark M, R Sawitri, dan NM Heriyanto (2007). Zonasi dan Karakteristik Hutan Rakyat di Daerah Penyangga Taman Nasional Gunung Halimun. Info Hutan 4(2), 187-199.
Bismark M, R Sawitri, NM Heriyanto, dan RT Kwatrina. Ujicoba Model Pengelolaan Daerah Penyangga. Laporan Hasil Penelitian Tahun 2012. Badan Litbang Kehutanan. Bogor.

150
BBTNKS (2010): Rencana Strategis Balai Besar Taman Nasional Kerinci Seblat, Tahun 2010-2014. BBTNKS, PHKA, Kemenhut. Jambi.
Dirjen PHKA (2007): Pedoman Kriteria dan Indikator Pemberdayaan Masyarakat di Sekitar Kawasan Konservasi. Departemen Kehutanan, Direktorat Jenderal PHKA. Bogor.
Erwin AP, ES Wododo, AH Lubis dan AR Pasaribu (2011): Mengarustamakan pengelolaan dan pengembangan daerah penyangga dalam konservasi Taman Nasional Batang Gadis.http://bitra.or.id/2012/2011/06/15/mengarustamakan-pengelolaan-dan pengembangan-daerah penyangga -dalam kons. Access by 18th of July 2013.
Helmi (2004): Balancing Conservation and Development: a Sosioeconomic study of Farmers Interaction With Kerinci Seblat National Park (KNSP). Stigma 3(3), 360-374.
Kompas.com (2012): Kerinci Seblat Rusak Akibat Perambahan. http://regional.kompas.com/read/2012/10/18/18391139/Kerinci.Seblat.Rusak.Akibat.Perambahan. Access by 18th of June 2013.
KemenLH (2012). Matrik Ringkasan Kegiatan Nominasi Calon Penerima Penghargaan Kalpataru Tahun 2012. Kementerian Lingkungan Hidup.
Manullang S (1999): Kesepakatan Konservasi Masyarakat Dalam Pengelolaan Kawasan Konservasi. Discussion Paper. Dephutbun-Natural Resources Management Program. Jakarta.
Sunkar A (2013): Positive Environmental Deviance: A Valuable Community Empowerment Tool In Protected Area Management. Paper Presentation in International Seminar on Forest and Biodiversity. Manado, 5-6th of July 2013.
Sawitri (2010): Pemanfaatan Keragaman Hayati dan Pengelolaan Lahan di Daerah Penyangga Taman Nasional. Presentasi Karya Ilmiah Peneliti Madya Bidang Pelestarian Sumber Daya Alam. Badan Litbang Kehutanan. Bogor.
Setyawati T dan M Bismark (2002): Prioritas Konservasi Keanekaragaman tumbuhan di Indonesia. Buletin Penelitian dan Pengembangan Kehutanan 3(2), 131-144.
Wells, M, Guggenheim, S, Khan, A, Wardoyo, W dan Jepson P (1999): Investing in Biodiversity : A Review Indonesia’s Integrated Conservation and Development Projects. The World Bank East Asia Region. Washington DC.

151
INAFOR A-0105
THE SECOND INTERNATIONAL CONFERENCE OF INDONESIA FORESTRY RESEARCHERS
2nd INAFOR, 27-28 AUGUST 2013
The Emergence Issue of Understory Management in Community Forest
Silvi Nur Oktalina1) and San Afri Awang2)
1) Lecturer of Vocational School The University of Gadajah Mada, Graduate student of Forestry Faculty The University of Gadjah Mada
2) Lecturer of Forestry Faculty The University of Gadjah Mada
Paper prepared for The Second International Conference of Indonesian Forestry Researchers (INAFOR)
27-28 August 2013
INAFOR SECRETARIAT Sub Division of Dissemination, Publication and Library
FORESTRY RESEARCH AND DEVELOPMENT AGENCY Jl. Gunung Batu 5, Bogor 16610

152
The Emergence Issue of Understory Management in Community Forest
Silvi Nur Oktalina1) and San afri Awang2)
1) Lecturer of Vocational School The University of Gadajah Mada, Graduate student of Forestry Faculty The University of Gadjah Mada
2) Lecturer of Forestry Faculty The University of Gadjah Mada
ABSTRACT
Long rotation of community forest is one of constraint to develop community forestry. Farmer needs income every year even everyday to fulfill their daily needs. Multi Purpose of Trees Species (MPTS) selection that produce not only woods is one of strategy for the famer. Another strategy is agroforestry technique that combines trees and crops or tolerant understory in one land. This combination can produce more products so farmer can diversify the product and yield into several times. The crops produce for short rotation while trees yield for long rotation. The objectives of this research are to identify land use system of community forest and to calculate the understory contribution in community forest for farmer income in Kulon Progo. By knowing the understory contribution we can analyze the importance of understory to the farmer. The method of this research is survey. Data collection was done in 2012 by observation, household interview with 30 respondents and indepth interview with key informants. Results of the research show that land use system of community forest in Kulon Progo is agroforestry using mixture random technique that combines agriculture crops and trees. Understory combinations consist of agricultural crops, herbs, timber estate that dominated by cloves and trees that dominanted by albizia. The farmer income structure consist of 23 % from timber estate, 22% from wood, 14% from understory, 11% from livestock and 30% from others. The high number of contribution from understory and shorter harvesting periode of understory compare to trees or timber estate is the benefit for the farmer to fullfill the farmer needs in the short term. Based on research finding we can conclude that recently management and optimizing of understrory is very importance strategy for the farmer to diversify the product and income managment from community forest so their livelihood will increase.
Keywords: community forest, contribution, understory, agroforestry, livelihood, Kulon Progo
1. INTRODUCTION
Community forest in the type of home garden and dry fields is very important for people, especially those living in rural areas. Contribution of community forest to the community livelihood is not in doubt. In Gunungkidul, the community forest can contribute 20% to total income (Nuroktalina, 2011). Community forest can produce many types of commodities including timber and fuel wood, non-timber forest products such as bamboo, crops, and fruits. The rotation of trees in community forest varies, from about 5-8 years for trees with short rotation to 15-20 years for trees with long rotation. The long rotation of trees is one of the obstacles to developing a community forest because farmers need income to fullfill daily needs.
Selection of trees that does not only produce wood but also Multi Purpose Trees Species (MPTS) is one strategy that can be done. Another strategy is agroforestry technique that combines forestry crops with food crops or crops that are tolerant to grow in understory to

153
obtain a short term result. According to Nurhadi (2000), in community forest farmers typically use agricultural products to meet their routine needs; while their medium-and long-term needs are met from livestock and felling trees from community forest. Understory planting with agroforestry techniques in community forest is a local knowledge of the indigenous communities in Yogyakarta including the utilizeation of narrow land in Kulon Progo. Land ownership in Java on average is only 0.25 ha per family. Farmers have to make a strategy to optimize a narrow land so the results can be used to meet the needs of short term, medium and long terms. Strategies are commonly used by farmer to meet short-term needs derived from agricultural products, while the medium-term needs are met from livestock products and the long-term needs are met from timber (Nuroktalina, 2011). In the case of small land holdings, the land use management becomes very important. Utilization of community forest with tolerant understory that produce short term products is important as part of the farmers’ livelihood strategies in Kulon Progo. Understory crops in addition to bringing economic benefits also provide ecological benefits. Understory contribute to the content of biomass. The content of this biomass can be used to measure the carbon content stored on it. According to Gonzales et.al (2013) undersotry contributed 6.8% content of forest biomass that is on the surface. While the contribution of biomass plants in the understory of the total forest ecosystem on the surface is around 27.4%. The understory plants also potentially store large amounts of carbon and has a very important role in the storage and nutrient cycles (Chastainet al, 2006). This paper discusses community forest land use patterns that do community forest farmers in Kulon Progo and understory contribution to income. By looking at the pattern of community forest and understory contribution it will be known the role understory to community forest farmers livelihood strategy in Kulon Progo and strategies that can be done to raise the role of understory in community forest. 2. METHOD
Selection of study site is done purposively with criteria that the location has community forest development. The study site is Keceme hamlet, Gerbosari village Samigaluh Sub District, Kulon Progo District. The basic method used in this study is a survey. Data was collected through observation and interviews with questionnaires to 30 respondents were selected based on land ownership strata. The strata of land ownership is divided into three, namely starum 1 with an area of less than 0.5 ha, stratum 2 is land ownership from 0.5 to 1 ha and stratum 3 for area more than 1 ha. In addition to in-depth interviews conducted subject matter expert in the management of community forests and local community leaders. Data analysis uses a mixed method which combines a quantitative method to calculate the contribution of forests to the income of farmers and a qualitative method to provide a more in-depth explanation.
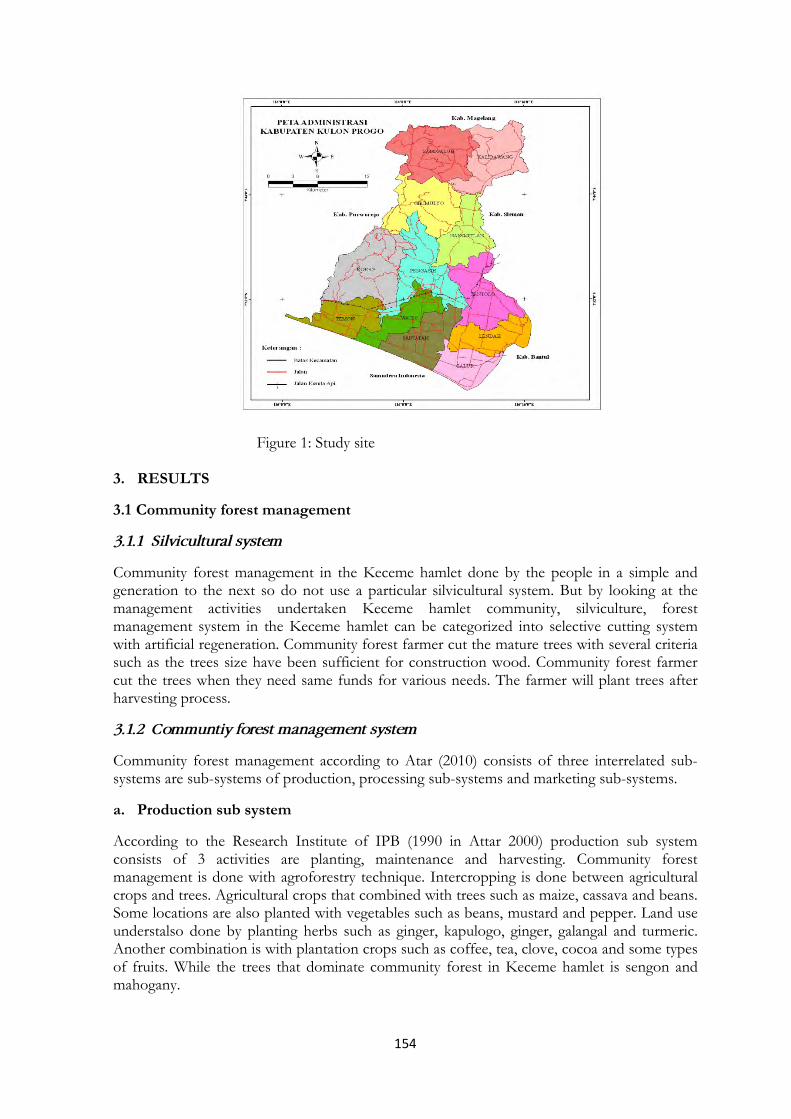
154
Figure 1: Study site 3. RESULTS
3.1 Community forest management
3.1.1 Silvicultural system
Community forest management in the Keceme hamlet done by the people in a simple and generation to the next so do not use a particular silvicultural system. But by looking at the management activities undertaken Keceme hamlet community, silviculture, forest management system in the Keceme hamlet can be categorized into selective cutting system with artificial regeneration. Community forest farmer cut the mature trees with several criteria such as the trees size have been sufficient for construction wood. Community forest farmer cut the trees when they need same funds for various needs. The farmer will plant trees after harvesting process.
3.1.2 Communtiy forest management system
Community forest management according to Atar (2010) consists of three interrelated sub-systems are sub-systems of production, processing sub-systems and marketing sub-systems.
a. Production sub system
According to the Research Institute of IPB (1990 in Attar 2000) production sub system consists of 3 activities are planting, maintenance and harvesting. Community forest management is done with agroforestry technique. Intercropping is done between agricultural crops and trees. Agricultural crops that combined with trees such as maize, cassava and beans. Some locations are also planted with vegetables such as beans, mustard and pepper. Land use understalso done by planting herbs such as ginger, kapulogo, ginger, galangal and turmeric. Another combination is with plantation crops such as coffee, tea, clove, cocoa and some types of fruits. While the trees that dominate community forest in Keceme hamlet is sengon and mahogany.

155
1. Planting Planting activities is preceded with land preparation. Land preparation is done by making the planting hole and cleaning the area around the planting hole. Before the seeds were planted in manure is put on the holes. The seeds used are usually derived from stump in their own land or their neighbors’ land. But lately more farmers are starting to buy seeds of certain trees. The farmers also seed from either the government or from other parties. Activities carried out by farmers after planting seedlings is planting during the rainy season. Some farmers planted at a spacing of 4 x 4 m, but most farmers plant seeds randomly by planting on land and the other using natural regeneration.
2. Maintenance Community forest maintenance activities performed Keceme hamlet farmers weeding. Weeding is done in conjunction with the maintenance of agricultural crops and sometimes in conjunction with the activities necessary for livestock grass. Other maintenance activities are such as pruning is done with an intensity that is not fixed because this activity is done with the main objective to find firewood. Fertilization is sometimes done, but its main purpose is to cultivate crops and herb. Fertilization is usually only done 2 times, ie at the time of planting and 3 months after planting. While the tree thinning activities carried out with the primary objective is to get results, so the tree that selected for thinning is that have high economic value.
3. Harvesting Harvesting or felling trees is usually done by traders after the transaction between farmers and traders. Community forest growers will sell the tree if they have an immediate need or a farmer requires a considerable amount of funds. The logging system is often known as “tebang butuh”. Farmers will choose a tree which when sold will be able to meet the immediate need and is quite large. For tree farmers considered the savings that will be used when having a big need. The branch of the trees is used for fuelwood while the timber is used for building materials.
b. Processing sub system
Processing of the final product of community forest that been sold or used by the farmer. The wood from community forest in Keceme Hamlet has been using by the farmer for building house and the other sold to the trader. Logging activities are carried out by traders because farmers do not have the infrastructure to cut the trees. The farmers sell the trees in standing stock. Processing activities have not been carried out by the farmers so that no a lot of added value derived from tree farmers from the community forest. Meanwhile, plantation crops and understory product are being processed by farmers through drying in the sun. The selling price could be higher than that if sold in wet conditions. But not many farmers are doing these activities. It is because farmers need some funds in a quick time to meet daily needs.
c. Marketing sub system
Farmers do not sell forest products directly, but traders who visit the farmers to buy the wood, tree crops and herb. The treader will do all harvesting activiteis, for trees plantation and herb growers often do harvesting and sold at home instead of on land. However, some farmers also sell their crops or herb directly in the land with “tebasan” system. System of cash payments made after the agreement of the price. Mechanism that works is trader visit the farmers or farmers call traders then jointly look at the quantity and condition of goods to be sold and determine a mutually agreed price. Trader who is providing the highest offer that will make a deal with the farmer.

156
Some factors affecting the selling price are the location where the communit forests are located. If the location is close to the access road, then usually the price will be more expensive because of its ease of access. In contrast to land located in a remote area, then usually the price will be lower because the trader requires additional labor and means of transport to take the goods. In addition to the location of the factors affecting the price is the quality and the size and physical condition.
3.2 Community Forest Farmer Characteristics
The total numbers of respondents in this study were 30 household of the total number of households in the Keceme hamlet as many as 64 families. The average number of families is 4 people with a range of the number between 2-7 people. Number of family is one of the indicators that can be used to measure human capital. It also shows the availability of family labor. Family labor can be used to help community forest management activities that do not need to bring in workers from outside the family. But on the other hand the number of families is also a burden to be borne by the head of the family.
While the average age of community forest farmers owners is 49 years, it is actually ideal because it is still not too old so its power is still possible to do the jobs in the community forests. The age range is between 32-69 years. According to Indonesia Law No. 13 of 2003 the population belonging to the labor force if the resident has entered the working age with the age limit of 15-64 years. At this age group, it can be said to be productive age. Based on that codition, community forest farmer in Kulon Progo is average on reproductive age. This condition is very potential for the development of community forests. Human Resource is one of the important capitals in the management of forests to improve livelihoods in addition to physical capital, financial, natural and social capital. Human capital other than age can be seen from the level of education, health and skills.
Education level of farmers in Kulon Progo community forest can be seen in Figure 2. Most of education the community forest growers is elementary school. The level of education has implications for understanding the knowledge and skills possessed. This aspect of the strengthening of the human resources community forest management needs to be improved, for example with training related to technical cultivation on community forest.
Figure 2: Education level of community forest farmer in Kulon Progo
Commnunity forest farmers in Keceme hamlet has not only have one location of the land. The average farmer in community forest Keceme hamlet has 3 locations with variations land ownership between 1-4 locations. The land distand from the house is between 0.1 - 7 km with
non educated
3%
elementary school 73%
Junior High
School 10%
High School 14%
Education level

157
average distance is 1.2 km. The average size of landownership is 0.8 ha of land with a wide variety of land ownership between 0.1 to 3.75 ha. In the field conditions are limited and population growth will continue to increase the farmers prefer to plant crops of the trees planted for subsistence farmers. But there is a change in the last decades, farmers tend to start planting trees on his land. It also occurs in Keceme hamlet Gerbosari Village located in mountainous regions topogafi condition of hilly land with a slope between 15-30%. Land types can be categorized into dry fields and homegarden. Furthermore, to land in home garden and dry fields called community forests. Community forest land use spatial pattern is dominated by a mix of agricultural crops and forest trees at random called random mixture. Trees species consists of sengon, mahogany, teak, acacia, African rosewood. While agricultural crops are consist of maize, cassava and paddy. There are also plantation crops such as cloves, coffee and tea. Understory also used by farmers to plant herbs.
3.3 Land Use and Farming System
Farmer land in Keceme hamlet, Gerbosari village majority managed agroforestry systems with a mix of forestry with agricultural crops, plantation crops and medicinal plants understory. Forestry crops widely grown in the area is mahogany and albizia. The plants are mixed with plantation crops such as cloves, coffee, or herbs (Cardamom, Ginger and Turmeric). Cropping pattern of the plants are not arranged according to a certain pattern so that it fits with the theory Nair (1993) called a random mixture. The combination of forest trees, plantations crops and crops understory is very diverse.
Although the farmer community forest does not have specific pattern, but based on the results of economic and ecological observations quite well. On the economic aspects the various types and the multi-cycle enables farmers to undertake harvesting activities in the short, medium and long term. Short-term results obtained from agricultural crops and herb. Intermediate outcomes derived from crops and results in the form of long-term derived from a tree. Aspects of the ecology of various kinds are certainly forming strata canopy that will reduce the rate of erosion. Besides, the number of plants in the forest will increase the diversity of the community forest.
3.4 Community Forest Contribution Toward Farmer’s Income
Community forest farmers' income in Keceme hamlet consisting of revenues derived from community forest and revenues derived from outside the farming community forests. Keceme hamlet is a hamlet with mountainous topography and is located on a hilltop of Menoreh so that there is no such irrigated area in the lowlands. Land type in Keceme hamlet is dryland and homegarden. The diversity of people's livelihood in Keceme hamlet will affect the total number of farmers' income. The income structure of farmers in keceme hamlet comes from land-based, ie of the understory, plantation crops and forest trees. That is not based on land from livestock, and the other services.
Average income derived from community forest are understory which is Rp 2,867,354.00 per year, plantation crops is Rp 4,869,367.00 per year, forestry is Rp 4,733,056.00 per year, from the livestock is Rp 2,204,166.00 per year and the other is Rp 6,408,083.00. The composition shows that the community forest was instrumental to sustain the livelihoods of farmers in Keceme hamlet, because it is able to contribute a total of 59% to total income. When compared with the structure of the village incomes Gerbosari monographs, in general it is almost same in different amounts, which is the main income of the farmer dominated

158
agriculture and forestry in the amount of 59% which is the second source of income comes from other income such as services and emplitees by 38% and 3% of livestock.
Figure 3: Structure of farmer income
The total amount of land ownership is assumed will affect income and efficiency in land management. Under these conditions, the stratification of land is carried out. Stratification respondents based on extensive land holdings was done after data collection. This is done because there is no population data based on extensive land holdings. The next samples are grouped into 3 strata, i.e. stratum I with tenure less than 0.5 ha, stratum II with land ownership from 0.5 to 1 ha and stratum III with an area of more 1 ha. Table 1 describes the structure of farmers’ income by stratum.
Table1: Income structure based on stratum
Stratum Understory Non wood
estate Wood Livestock Other Total
I 705,146 1,991,350 2,014,167 2,23,.333 2,242,333 9,186,329
II 1,438,583 6,092,583 2,520,000 1,045,833 9,771,917 20,868,916
III 6,458,333 6,524,167 9,665,000 3,333,333 7,210,000 33,190,833
Total 8,602,062 14,608,100 14.199,167 6,612,499 19,224,250 63,246,078
Source. Primary data, 2012 Trend of income structure can be seen in Table 1, of the three land-based income stratums, ie understory, plantation crops and forest trees, the wider land area the higher the income level. This is consistent with the results of the Attar’s study (2000) which states wider community forest land then earned income community forest farmers also higher. But when seen Figure 4, there is no significant relationship between stratification land ownership to the proportion of contribution based on source of income for both land-based sources of income and are not land-based. This means that there are other factors than land area that affect farmers' income
understory [14%]
plantation crops [23 %]
forestry [22 %]
livestock [11%]
others [30%]
Structure of Farmer Income

159
contribution, such as the intensity of management. Farmers with small land holdings tend to intensively manage the land, because the land is a major source of income. While wide land management tends to be less intense because farmers who have large land usually have other sources of income, such as from a trading or employee.
Figure 4: The relations between land area and income contribution 3.5 Understory Contribution Overall, community forest income contributes to 59% of the total income of farmers in the Keceme hamlet Gerbosari village Samigaluh sub district Kulon Progo district. This is consistent with Gerbosari village profile data which showed that the main source of income comes from dry land. People in Keceme hamlet apparently had a strategy to meet the people's livelihood through forest management. Community forest management is done with a long-term crop diversification, medium and short term. Likewise, the optimization of land use public forests with limited land area available, people do a combination of agricultural crops, herb, plantation crops and forest crops through agroforestry systems. Table 2. Community forest contribution to farmer income
No Strata Understory Non wood estate Wood Total
1 I 705,146 1,991,350 2,014,167 4,710,663
2 II 1,438,583 6,092,583 2,520,000 10,051,166
3 III 6,458,333 6,524,167 9,665,000 22,647,500
Total 8,602,062 14,608,100 14,199,167 37,409,329
Source. Primary data, 2012
Land
Are
a
Persentage
others
livestocks
forestry
Plantation crops
understory

160
Table 2 shows that higher total area of community forest, the income from understory, forest plantation and crop are also higher. This shows a linear relationship between the areas of community forest ownership with the results obtained. In comparison between community forest commodities, the total results of most major crops are 39%. These results are similar with the results derived from wood (38%). The contribution of the understory is 23%. The selection of commodities making up this community forests by farmers as a form of strategies to meet the various needs of the different time periods. Understory used to meet short-term needs because it is a seasonal plant. While the example of clove plantations, coffee and tea used to meet the needs of medium-term because harvest time is relatively longer than annual crops. To meet the long term needs of the farmers are using the results of wood that has long rotation. Farmers began cutting sengon at the age of 6 years. Farmers use trees as savings to meet the big needs, e.g. for school fees. 4. DISCUSSION
The history of community forest management from independent, government projects, partnerships, Gerhan was done for economic, ecological and social purposes. Community forests have provided evidence to contribute to the livelihood of farmers. According to Fillius (1997) farmers develop community forests by planting trees for several reasons including savings, in an effort to reduce soil erosion and remind fertility, changes in labor supply, changes in demand for forest products and government policies.
Management of the understory community forest can be described as a system model of human ecology. Duncan (1959) in Awang (2004) introduced this system with POET variable. A POET variable ie P is population, O is organization, E is the environment and T is technology. Recently the population is growing while available land remains even tends to fall due to changes in land use, such as for residential, industrial and other purposes. Land use should be intensified both horizontal and vertical. Understory planting is one solution that can be done to optimize the land use. The use of technology at this time is a necessity. Declining environmental quality require technological interventions to improve productivity. The use of quality seeds, the selection of species based on the terms the growth and intensive cultivation techniques are solutions that can be done. Organization is necessary because community forest farmers have narrow land ownership. It is often does not meet the required economies of scale of the community forest business. In addition to rallying the organization can increase farmers' bargaining position with traders especially in pricing. Community forest has high biodiversity. In addition commnunity forest will be able to prevent erosion and landslides. Forests also have the ability to store carbon stocks in biomassnya.
Community forest land use pattern in Kulon Progo is agroforestry techniques with random pattern mixture. Community forest land use in Kulon Progo is influenced by the physical condition such soil and climate. Base on Physiographic Kulon Progo region consists of 4 zones with different characteristics. Zone of coastal alluvial plains and dunes, which is located in the southern, mountainous zone Sentolo, which is in the central and eastern parts such as topography undulating to hilly, menoreh mountainous zone, which is in the west north west in the form of mountains and progo hills-plains zone, which is in the north east. A research site was located in menoreh mountainous zones with karakater topography of hills-mountains. Geographical conditions Gerbosari village located at an average altitude of 740 m above sea level with an average temperature of 23-34 º C with rainfall 2500-3000 mm / year. Topography of the village is including the highlands and hills.
Background condition of the natural resources makes growers to adapt to its environment. Some forms of adaptation include community forest land in the form of dryland is made

161
terrace to prevent soil erosion and landslides. Selection of commodity crops either in the form of community forests and trees and understory crops conducted in accordance with the physical condition of the land. Forest tree species dominate the people is sengon and mahogany. In addition because of the growth of the corresponding terms in the 1980s, there are investors who develop sengon community forest in partnership with farmers with sharing system. Agricultural crops such as maize, rice, cassava, soybean initially done but currently becoming obsolete because productivity is not optimal. Some farmers also planted vegetables such as beans, mustard and pepper. Conditions of forest land are now full with stands of trees so that the intensity of sunlight began to land big trees that have been blocked. Under these circumstances it is very difficult crop to grow optimally. Farmers adapt by planting a herb that can grow optimally in the shade under the forest stand. The species planted include kapulogo, ginger, turmeric, meeting buffoonery, laos and key. Understory has the ability to be able to live in under the trees. Understory also has the advantage to still be able to grow well in a more open area due to logging. Malik et. al (2013) say that the plant has the resilience stands under the auspices of a more open due to harvesting activities. Form of adaptation is often done partly by morphological adaptation, for example in the form of leaves.
The understory planting has begun by farmers in Kulon Progo especially Gerbosari village since the 1990s. Understory plants has contributed greatly to the total income of farmers, amounting to 14%. This contribution could be enhanced if they see a cultivation technique for doing this in the commodity markets and opportunities understory. Cultivation techniques that have made the farmers are still very simple. The cultivation techniques acquired knowledge from generation to generation of their parents. The cropping pattern is random, improvised seeds, activities are still very low maintenance, fertilization activities are also very rare. In this case the extension is actually a very important role to transfer knowledge and skills of understory cultivation and provide facilities to obtain inputs and seeds that can increase the productivity of understory.
Farmers sell understory product in the market around their village. Some farmers also sell understory commodities on the land with “tebasan “system. System of cash payments made after the agreement of the price. Mechanism that works is trader visit the farmers or farmers call traders then jointly look at the quantity and condition of goods to be sold and determine a mutually agreed price. Trader who is provide the highest offer that will make a deal with the farmer. Addition is determined by the quality and quality of goods, commodities prices are also influenced by understory locations where the land is located. If the location is close to the access road, then usually the price will be more expensive because of its ease of access. In contrast to land located in a remote area, then usually the price will be lower because the trader requires additional labor and means of transport to take the goods.
Management of the understory of community forest in the Gerbosari village needs attention because they have made a significant contribution to the total income of the farmers. While the cultivation is done is simple so that productivity is still very likely enhanced by intensive cultivation. Management of community forests with an understory in Gerbosari village has local knowladge of indigenous farmer communities as a form of adaptation to the conditions of natural resources in support of farmers' livelihoods. Based on the management of the community forest intenstif with understory is highly recommended according to Widayanti (2005) which says that the purpose of community forest management is to achieve sustainable management of community forests by local communities and private forest landowners to achieve the welfare of the community. Sustainability of community forest management is the preservation of community forest management to produce sustainable production with the

162
aim of achieving a balance between growth and harvest each year or period by considering aspects of ecological sustainability.
5. CONCLUSIONS
Land use system of community forest in Kulon Progo is agroforestry with mixture random technique. Understory combinations consist of agricultural crops, herbs, timber estate that dominated by cloves and trees that dominanted by albizia. The farmer income structure consist of 23 % form timber plantation, 22% from wood, 14% from understory, 11% from livestock and 30% from other. The high number of contribution from understory and shorter harvesting periode of understory compare to trees or timber estate is the benefit for the farmer to fullfill the farmer needs in the short term. Based on research finding we can conclude that recently management and optimizing of understrory is very importance strategy for the farmer to diversify the product and income managment from community forest so their livelihood will increase.
6. REFERENCES Awang, S.A (2005): Petani, Ekonomi dan Konservasi. Aspek Penelitian dan Gagasan. Seri Bunga Rampai Hutan Rakyat. Pustaka Hutan Rakyat. Debut Pres. Yogyakarta. Awang, S.A (2004): Dekonstruksi Sosial Forestry: Reposisi Masyarakat dan Keadilan Lingkungan. Bigraf. Yogyakarta. Awang. SA (2003): Hutan Desa ”Realitas Tidak Terbantahkan Sebagai Alternatif Model Pengelolaan Hutan Di Indonesia. Yayasan Damar. Yogyakarta. Awang, S.A., dkk (2002): Hutan Rakyat: Sosial Ekonomi Pemasaran. BPFE. Yogyakarta. Awang, S.A (2001): Gurat Hutan Rakyat di Kapur Selatan. Debut Pres. Yogyakarta. Chastain, R.A., Currie, W.S., and Townsend, P.A (2006): Carbon sequestration and nutrient cycling implications of the evergreen understory layer in Appalachian forests. Forest Ecology and Management. Vol. 232. Page. 63-77. Davis. L.S., and Johnson. K.N (1987) Forest Management 3 rd Edition. Mc Graw-Hill Book Company. New York. Fillius, A.M (1997) Factors Changing Farmers Willingness To Grow Trees in Gunungkidul. Netherland Journal of aricultural Science. Vol 45 page. 329-345. FWI/GFW (2001): Potret Keadaan Hutan Indonesia. Bogor, Indonesia: Forest Watch Indonesia dan Washington D.C.: Global Forest Watch. Gonzales, M., Augusto.,L., Budynek, A.G., Xue, J., Raguenes, NY., Guyon, D., Trichet, P., Delerue, F., Niollet, S., Andreasson, F., Achat, D.L., and Bakker, M.R. (2013): Contribution of Understory Species to total ecosystem aboveground and belowground biomass in temperate Pinus pinaster Ait. Forests. Forest Ecology and Management. Vol. 289. Page. 38-47. Hardjanto (1990) Pengembangan Kebijakan Ekonomi dan Kelestarian Hutan. Fakultas Kehutanan IPB. Bogor.

163
Malik, A.U., Kreutzweiser, D.P., Spalvieri, C.M., Mackereth, R.W (2013) Understory plant community resilience to partial harvesting in riparian buffers of central Canadian boreal forests. Forest Ecology and Management. Vol. 289. Page. 209-218. Nuroktalina, S. dan Utomo, S (2011) Peran Hutan dalam Peningkatan Kesejahteraan Masyarakat. Proseding Seminar Nasional Hasil-Hasil Penelitian Sosial Ekonomi Pertanian. Fakultas Pertanian. UGM. Yogyakarta. Nurhadi (2000) Kearifan Lokal Dalam Pengembangan Hutan Rakyat. Vo. 2 No. 1. Hal 53-64. Fakultas Kehutanan UGM.Yogyakarta. Pearce, D (1992) Economic Valuation and The Natural World. World Bank Working Papers. New York. Pearce, D., and Warford, JJ (1993) World Without End: Economics, Environment and Sustainable Development. Oxford University Pres. New York. Simon. H (1999) Pengelolaan Hutan Bersama Masyarakat. Bigraf. Yogyakarta. Simon, H (1998) Kehutanan masyarakat di Indonesia. Warta FKKM No. 1 tahun I. Yogyakarta. Widayanti, W.T., B. Himmah., dan S.S. Awang (2005) Manajemen sistem hutan rakyat menuju model sertifikasi (pengalaman di Desa Kedungkeris, Kecamatan Nglipar, Kabupaten Gunung Kidul). Jurnal hutan rakyat. Vol VII No. 3 Tahun 2005. Pustaka hutan rakyat.

164

165
INAFOR A-0108
THE SECOND INTERNATIONAL CONFERENCE OF INDONESIA FORESTRY RESEARCHERS
THE 2nd INAFOR, 27-28 AUGUST 2013
Community Participation in Water Resource Protection Through Community Collaborative Forest Management Program:
A Case Study of Kendal Forest Management Unit, Central Java
Sri Lestari
Forestry Research Institute of Palembang Ministry of Forestry of Indonesia
Jl. Kol. H. Burlian Km 6.5 Puntikayu Palembang South Sumatera, Indonesia
Paper prepared for The Second International Conference of Indonesian Forestry Researchers (INAFOR)
27-28 August 2013
INAFOR SECRETARIAT Sub Division of Dissemination, Publication and Library
FORESTRY RESEARCH AND DEVELOPMENT AGENCY Jl. Gunung Batu 5, Bogor 16610

166
Community Participation in Water Resource Protection Through Community Collaborative Forest Management Program: A Case Study of
Kendal Forest Management Unit, Central Java
Sri Lestari Forestry Research Institute of Palembang
Ministry of Forestry of Indonesia Jl. Kol. H. Burlian Km 6.5 Puntikayu Palembang - South Sumatera, Indonesia
Corresponding email: [email protected]
ABSTRACT
This paper aims to determine what factors influencing community participation in water resource protection in Kendal Forest Management Unit, Central Java, through Community Collaborative Forest Management Program (known with acronym PHBM) that is launched by Perum Perhutani. Field observation and primary data collection through interviewing the respondents with random sampling are performed to examine the eagerness of community to engage in the program. To determine what factors affect community participation in the program, logistic regression is applied. By implementing PHBM program, Perum Perhutani together with the community can improve the function of forest in term of ecological services, such as fresh air production, groundwater sustainability, flood prevention and landslide protection. The improvement of forest land capability in storing groundwater and diminishing the possibility of flood can be achieved after this program is launched. Most of the community revealed that after they participated in the program, they always have clean water and fresh air even in the dry season. The regression analysis result shows that the number of family member of the household, household’s knowledge about benefit mechanism, and Perum Perhutani advices to the community are significantly affect community eagerness to participate in PHBM program. Indirectly, it is also affects the willingness of people to get involved in water resource protection activity. Keywords: Community participation, water resource protection, and community collaborative
forest management program.
1. INTRODUCTION
Rural communities in developing countries heavily is depend on the extraction timber and non timber resources from forests. In some cases, the communities also convert forests to agriculture or other purposes (Le at al., 2012). Specifically for people who are farmer which has limited land and has low income level because they need forests to fulfill their needs. In addition to the economic function, forests also play an important role in providing environmental services such as clean air supply, ground water protection, floods and landslides prevention, and also carbon sink in order to reduce global warming. Due to these crucial functions, better forest management by involving community who lived near to the forest is needed to preserve the forest. Thus, forests can perform its function properly.
Regarding to this condition, in 2001 Perum Perhutani (a state owned company managing the forest in Java Island) launched Community Collaborative Forest Management Program (known with acronym PHBM) in order to restore forests in Java Island that was damage caused by the reformation in 1997-1998. During the reformation era, illegal logging was occurring everywhere resulted in ruined the forestland that had been previously planted. In addition, local community also opened the forest for agriculture purposes (Djajanti, 2005). Therefore,

167
the forests are being destroyed and environmental balance is disrupted. Because most of the forests were cleared, flora and fauna in the forest also damaged, the quality of water decreased, air temperature raised, and in the rainy seasons the capacity of runoff increase dramatically while in dry season, the groundwater diminish sharply or even exhausted.
Through Community Collaborative Forest Management (PHBM) program, Perum Perhutani together with the communities who live near to the forest has been working to rehabilitate the forest. By participating in the program, local communities will get a certain plot where they can grow agriculture crop while protecting the main trees in the plot. They can also participate in some others activities launched by Perum Perhutani, such as nursery, trimming, pruning, and felling, with or without payment depending on the agreement between the communities and Perum Perhutani (Damayanti et al., 2012). At the end of management cycle, the PHBM member will gain incentive called benefit sharing.
Various factors can influence people motivation to participate on forestry program in order to get better environmental condition such as planting trees in their land and committing in reforestation activities. Salam et al., (2000) applied logistic and multiple regression analyses to determine the factors that influence farmers’ tree-planting decisions. Their result explain that land owned, main source of income, cost of fuelwood, number of male family member, and knowledge of the activities of the forestry extension program influence farmers’ tree-planting decisions. Furthermore, they also revealed that economic concern plays big role rather than ecological issues in influencing community participation on tree-planting. Martin et al., (2011) explained that land area, number of parcels managed by the household, and also security of land tenure were significantly affects farmers’ decision to plant timber trees. Moreover, in Sri Lanka, level of income, source of income, and availability of land considered suitable for tea cultivation influence the decision of the community to undertake rubber-tea intercropping (Iqbal, et al., 2005). Djamhuri (2008) observes how the participation of members can evolve according to incentive schemes and identifies that the way of benefit sharing influences the participation of community. Related to environmental concerns, Alam et al., (2010) explained that in Bangladesh, 78% of their respondents said that they were aware with environmental issues in their area, and they are also understand the role of homegardens to overcome the issues if the land cover in the homegarden is increased.
Community motivation to participate in forestry program is different between places, it also depends on socio-economic factors that exist in the community. In Kendal Forest Management Unit, even though incentive mechanism exists in PHBM program, and environmental condition getting better due to PHBM program, not all members in the community have eagerness to participate in the program. Various perceptions, preferences and attitude of farmers will affect their motivation in such program. Therefore, this study aims to determine what factors influencing community participation in water resource protection through PHBM program.
2. METHODS 2.1 Data Collection
This research was conducted in Kendal Forest Management Unit, Central Java, Indonesia, in 2010 - 2011. Data used in this research is primary data that is collected using observations and interviews to the households who live in 3 villages in Semarang district, Kendal Forest Management Unit. The villages were Wates, Podorejo, and Gondoriyo. In total, 156 respondents were selected randomly from the villages for the interview. Community eagerness

168
to participate in water resource protection was identified through discussion with the respondents and also key persons in each village.
2.2 Data Analysis
Logistic regression analysis is applied adopting the specification of 𝑃𝑟𝑜𝑏 (𝑌 = 1) = 𝑒𝛽𝑥
1+ 𝑒𝛽𝑥
to capture the probability of participation, known as a logit model (Greene, 2000) because some of the variables used in the analysis were dummy variable. This function can estimate the probability of the occurrence of a certain event. In this research, the event is whether people in the community participate in water resource protection through PHBM program or not (Dougherty, 2002). Then, the logit model becomes:
𝐿𝑛 � 𝑝𝑖1− 𝑝𝑖
� = 𝛽0 + 𝛽1 𝑥1 + 𝛽2 𝑥2 + 𝛽3 𝑥3 + … + 𝛽𝑛 𝑥𝑛 ,
where 𝑝𝑖 (𝑌𝑖 = 1) = 𝑒𝛽𝑥𝑖
1+ 𝑒𝛽𝑥𝑖 (Nachrowi and Usman, 2002). The model specification used in
the data analysis is: Part = f(age, incm, educ, job, faml, exln, adfp, bnsm, disr). Furthermore, the econometric model is as follows: 𝑝𝑎𝑟𝑡 = 𝛽1𝑎𝑔𝑒 + 𝛽2 𝑖𝑛𝑐𝑚 + 𝛽3 𝑒𝑑𝑢𝑐 + 𝛽4 𝑗𝑜𝑏 + 𝛽5 𝑓𝑎𝑚𝑙 + 𝛽6 𝑒𝑥𝑙𝑛 + 𝛽7 𝑎𝑑𝑓𝑝 + 𝛽8 𝑏𝑛𝑠𝑚 + 𝛽9 𝑑𝑖𝑠𝑟
where: age = the age of the household incm = income level of the household educ = education level of the household job = household occupation faml = family number of the household exln = extensive land holding by the household adfp = a dummy variable indicating whether the household had received any advice from Perum Perhutani officials or not bnsm = a dummy variable indicating whether the household knowledgeable about benefit sharing mechanism that they can obtain after final harvesting of trees or not disr = a dummy variable indicating whether the Perum Perhutani program disrupted household’s
interests or not
In addition to logistic regression, marginal effects in probability is calculated. The purpose of marginal effect calculations is to provide a good approximation to the marginal change in the probability of participation when an independent variable increases by one unit.
3. RESULTS AND DISCUSSION
3.1 Descriptive Analysis of the Respondents
Most of the 156 respondents who live in Semarang district are farmers with various amount of income and various level of education. Figure 1 and Table 1 show the description result of the variable in the model. From figure 1, we can see the characteristic of the household based on their education level, in which the majority respondents (39%) have no school, 9% not finish their elementary school, and 30% have education level up to elementary school. From the observations result and also discussion with the respondent, people who have no education at all and who cannot finish their elementary school mostly have no skill in reading and writing. Furthermore, the result shows that 9% of the respondents could complete their education

169
until Junior High School, 9% up to High School, and 4% of them can finish their undergraduate level.
Education level, in many cases will influence the way of thinking of the community. People who have higher education level will have broader knowledge about the importance of environmental services, particularly in producing fresh air and storing ground water. Unfortunately, people who have high education level usually have an occupation other than farmers. Therefore, they do not have enough time to cultivate the land and do not need to access the forest in order to fulfill their needs such as food, fodder, or firewood. Thus, some of them think that they do not need to participate on Perum Perhutani program.
Table 1 explains that the range of age for the respondents is between 25 and 89 years old, in which the average is 51 years old. Compare to the younger people, older people will more dependent to the forest, because older people already get used to cultivate the land. On the other hand, younger people have tendency not to be a farmers. They prefer go out from the village and seek to find others job in the city. The average number of family in the respondents is 3 people. In general, in their daily life, the family members work together to find their needs in the forest nearby such as firewood, green fodder, or teak leaves. A wife usually has a major role in accessing the forest to fulfill these needs. Logically, the bigger the family member, the higher the eagerness of people to participate in PHBM program to get more land to cultivate in order to get more income.
Furthermore, respondents’ income ranges from 300 thousand to 6.6 million rupiah per month and the average income is 1.155 million rupiah per month. Mostly, people who have low income will need more land to cultivate to earn money. Moreover, the land holding by the respondents is between 40 to 62,900 meter square with the average of 3,401 meter square. For the respondents who have low income level and limited land, the existence of Community Collaborative Forest Management program is really meaningful for them because they are highly dependent on the existence of forest nearby to fulfill their needs. Therefore, for those who have wider land and higher income, they tend to be not participated in Perum Perhutani Program.
Figure 1: Education characteristic of the households
0%5%
10%15%20%25%30%35%40%
39%
9%
30%
9% 9% 4%
Num
ber o
f hou
seho
ld
Education level

170
Table 1: General summary of respondents based on age, income level, number of family, and land holding
Variables Min Mean Max Age (year) Income level (thousand rupiah) Number of family (person) Land holding (m2)
25 300 0 40
51 1,155 3 3,401
89 6,600 6 62,900
The dummy variables included as dependent and independent variables in the regression analysis are shown in Table 2. From the table we can see that 48% of respondents are in favor to actively participate in PHBM program and 52% of them are passive participants or even not participants at all on PHBM program. Respondents who are actively participate in PHBM program will get plot to cultivate. They also have some obligation to fulfill, such as taking care the trees in the plot from forest fire, illegal felling, illegal grazing, encroachment, etc. In addition, they also involve in some program launched by Perum Perhutani such as regular meeting, training, working group, etc. People who actively participate in PHBM program more knowledgeable about the importance of health environment for their life. They also understand that well manage forest will provide more benefit for the community, not only in economic matter but also in ecology.
The 68% of respondents are farmer and the rest of them have occupation other than farmer. As mentioned before, farmer will more likely to participate actively in Perum Perhutani Program other than non farmer because they will have more time to access the forest land as their plot to cultivate. From the Table 2, we can also explore that 52% of the respondents have knowledge that they will receive benefit sharing after final harvestings of trees. The existence of benefit sharing mechanism will increase the eagerness of community to participate in PHBM because they will receive benefit sharing at the end of harvesting timber. As much as 48% of the respondents have received any advice from Perum Perhutani officials; and 95% said that Perum Perhutani’s programs did not disrupt respondents’ interest. Perum Perhutani advices regarding to the influence of better forest management for environmental services will enlarge people motivation to participate in taking care of the forest nearby. Thus, they will take a part to engage in PHBM program.
Table 2: Characteristics of dummy variables in the model
Variables Yes (%) No (%) Dependent variable Households who are actively participate Independent variable Household who is a farmer Households who had received any advice from Perum Perhutani officials (adfp) Households who knowledgeable about benefit sharing after final harvesting of trees (bnsm) Households who think that PHBM program disrupt their interest (disr)
48 68 48 52 5
52 32 52 48 95
3.2 Estimation of the Regression Model Table 3 shows the logistic regression that analyzed community eagerness to participate actively on Perum Perhutani program that is Community Collaborative Forest Management (PHBM)

171
in which indirectly they already participated in water resource protection. At 1% signification level, Perum Perhutani advice to the household (adfp) and the households’ knowledge that they would receive some benefit through the sharing mechanism after harvesting timber (bnsm) were significantly different from zero. Furthermore, at 5% signification level, family number of the household (faml) is also significantly different from zero.
Based on the regression results we can see that the influence of one person increase in the family member of household would increase the probability of participation by 12%. Logically, the more the number of family member the more labor is available to cultivate the land in the forest plot. Moreover, they need more land to cultivate in order to meet their needs. Households who get advices from Perum Perhutani regarding the benefit that the community can obtain by participating in PHBM program, and also advices related to the importance of well manage forest for people life would increase the probability of participation by 64%. From this probability, we can observe that Perum Perhutani advices have a great role to motivate the community to participate in PHBM program. Furthermore, households who knowledgeable that they can get some benefit through an effective sharing mechanism after harvesting timbers would also increase the probability of participation by 50% than those who do not have such knowledge. This outcome is in line with the research result by Salam at al., (2004) in Central Sal forests, Bangladesh and also Djamhuri (2008) in Central Java, Indonesia.
In summary, the number of family member of the household has some impact on the participation, but Perum Perhutani advices and households’ understanding that they will get some benefit through the sharing mechanism at the end of timber rotation has major impact on the household participation. Therefore, these two variables should become a concern for Perum Perhutani to engage the community to participate in PHBM program.
Table 3: Regression result of the model
Variable Logistic Regression Marginal Effects
Coeff Std. Err dy/dx Std. Err.
The age of the household (age) -.0336 .0313 -.0074 .0069 Income level of the household (incm) -.0003 .0003 -.0000 .0000 Education level of the household (educ) .1255 .0779 .0276 .0174 Household occupation (job) .5169 .6846 .1095 .1395 Family number of the household (faml) .5310* .2538 .1168* .0572 Extensive land holding by the household (exln) .0002 .0001 .0000 .0000 Perum Perhutani advice to the household (adfp) 3.2949** .6543 . 6367** .0896 Household knowledge about benefit sharing mechanism (bnsm) 2.5102** .6595 .5001** .1055 Disruption of household interest (disr) -.0655 2.4005 -.0146 .5387 _cons -4.6151 3.1205
Note: **p < .01; and *p <.05.
4. CONCLUSIONS
By implementing PHBM program, Perum Perhutani together with the community can improve the function of forest in Java Island both economically and ecologically services, such as timber and non timber production, clean air production, groundwater sustainability, flood prevention and landslide protection. The improvement of forest land capability in storing groundwater and diminishing the possibility of flood can be achieved after this program is

172
launched. The regression analysis result shows that the number of family member of the household, household’s knowledge about benefit sharing mechanism, and Perum Perhutani advices to the community are significantly affect community eagerness to participate in PHBM program. Indirectly, it is also affects the willingness of people to get involved in water resource protection activity in the forest area. Thus, in order to increase community participation in PHBM program, Perum Perhutani should pay more attention in giving advices to the community. By inviting people and giving advices in the regularly meeting held by Perum Perhutani or village board become an alternative way to disseminate Perum Perhutani’s programs. Thus, people are encouraged to participate in PHBM program. Additionally, community should be more knowledgeable about benefit sharing mechanism that would be received after harvesting trees.
ACKNOWLEDGEMENTS
The author would like to express her deep gratitude to Professor Koji Kotani and Professor Kakinaka for their assistances and support during the research.
5. REFERENCES
Alam, M., Y. Furukawa, and M. Mika. (2010): Perceptions, preferences, and attitude of Bangladesh farmers towards homegarden farming systems. Small Scale Forestry 9: 213-226.
Damayanti, E.K., L.B. Prasetyo, M. Dhakal, M. Masuda, M. Wachyuni, and D. Puspawati. (2012): Characteristics of households as drivers for forest transition: a case study in Baghdevi CFUG, Chitwan District, Nepal and LMDH Galang Taruna, Ciamis District, Indonesia. Proceeding Inafor 2011 “Strengthening Forest Science and Technology for Better Forestry Development”. Forestry Research Institute, Ministry of Forestry.
Djamhuri, T. L., 2008. Community Participation in a Social Forestry Program in Central Java, Indonesia: The Effect of Incentive Structure and Social Capital. Department of Agricultural and Resource Economics.
Djajanti, D., (2005): Managing Forest with Community (PHBM) in Central Java: Promoting Equity in Access to NTFPs. Perhutani Jakarta. Indonesia.
Dougherty, C., (2002): Introduction to Econometrics. Second Edition. Oxford University Press.
Greene, W.H., (2000): Econometric Analysis, fourth edition. Library of Congress Catalog-in-Publication Data. United States of America.
Iqbal, S.M.M., C.R. Ireland, and V.H.L Rodrigo. (2006): A logistic analysis of the factors determining the decision of smallholder farmers to intercrop: a case study involving rubber-tea intercropping in Sri Lanka. Agricultural Systems 87: 296-312.
Le, H.D., C. Smith, J. Herbohn, and S. Harrison. (2012): More than just trees: assessing reforestation success in tropical developing countries. Journal of Rural Studies 28: 5-19.
Nachrowi, D. N. dan Usman, H. (2002): Penggunaan Teknik Econometri. PT Rajagrafindo Persada, Jakarta.

173
Salam, M.A., T. Noguchi, and M. Koike. (2000): Understanding why farmers plant trees in the homestead agroforestry in Bangladesh. Agroforestry Systems 50: 77-93.
Salam, M.A., T. Noguchi, and M. Koike. (2004): Factors Influencing the Sustained Participation of Farmers in Participatory Forestry: A Case Study in Central Sal Forests in Bangladesh. Journal of Environmental Management 74 (2005) 43 – 51.
Martin, F.S., M. Bertomeu, M.V. Noordwijk, and R. Navarro. (2011): Understanding forest transition in the Philippines: main farm-level factors influencing smallholder’s capacity and intention to plant native timber trees. Small-scale Forestry 11:47-60.

174

175
INAFOR A-0113
THE SECOND INTERNATIONAL CONFERENCE OF INDONESIA FORESTRY RESEARCHERS
2nd INAFOR, 27-28 AUGUST 2013
Potential Development of Sago (Metroxylon sp.) in West Papua as Sources of Food and Energy
Susan T. Salosa and Ezrom Batorinding
Manokwari Forest Research Institute, West Papua Jln. Inamberi Pasir Putih, Manokwari, West Papua, Indonesia 98314
Corresponding email: [email protected]
Paper prepared for The Second International Conference of Indonesian Forestry Researchers (INAFOR)
27-28 August 2013
INAFOR SECRETARIAT Sub Division of Dissemination, Publication and Library
FORESTRY RESEARCH AND DEVELOPMENT AGENCY Jl. Gunung Batu 5, Bogor 16610

176
Potential Development of Sago (Metroxylon sp.) in West Papua as Sources of Food and Energy
Susan T. Salosa and Ezrom Batorinding
Manokwari Forest Research Institute, West Papua Jln. Inamberi Pasir Putih, Manokwari, West Papua, Indonesia 98314
Corresponding email: [email protected]
ABSTRACT
Sago (Metroxylon sp) is one source of food in Papua besides sweet potatoes and other tubers. Mostly live in low-lying coastal areas, it is categorized as a multi-purpose plant because it is useful for several purposes such as applying its bark for wall and floor of traditional houses. The dependency of Papuans to sago is considerably heavy, especially in rural areas. Recently, sago is evolved to energy source. The research was conducted in the Sasirei village, district of Wondama bay, West Papua province. Qualitative research was carried out with survey techniques and semi-structural interviews and the results showed that as food, sago which consumed by local people was cultivated plants. Wild sago in local sago village was not managed well to support people demand because of limitation on equipments to reach the area and lack of sago starch. The cultivated sago was a chosen seed from best sago. Moreover in the planting area, it was maintained well, so it could produce lots starch. The potency of cultivated sago is still low because of less effort to plant it in the wide area, but it spreads on small area and only in ratio of 1:1, means cutting 1 tree, planting 1 seed. Mostly, sago starch is for household consumption but many sago traders come to the village to buy sago starches. Regarding of energy development, sago is source of bio ethanol. Sago standing stocks in sago village is very promising to use as energy source after permitted by traditional land owners.
Keywords: Sago, food, energy
1. INTRODUCTION
West Papua is well-known as the largest sago potential in Indonesia which has about 90% of 1,128 million ha sago in Indonesia (Flach, 1983). Sago is mostly spread on lowland, coastal and valleys. According to Oates and Hick (2002) in Limbongan (2007), Sago is able to live in an area up to 1,250 m asl with rainfall of 4,500 mm / year. There are two kinds of sago: sisika (Metroxylon rumphii Mart) and beka (Metroxylon sago Rottb.). The sago palm grows naturally and becomes one of the staple foods in Papua. It is also recognized as a multi-functional plant; all parts of this plant can be used for the benefit of the society, such as for food and for construction.
The important existence of sago to Papuans has faced challenges as sources of food and energy. Nowadays people have many choices for meals either traditional meals or regular meals which are inexpensive and affordable. The sago for meals is mostly obtained from cultivated sago and seldom from wild sago, so the wild sago could be used as a source of energy. Therefore, optimal utilization of sago has to be improved in order to gain self-sufficiency of food and energy for local community and to support family income.
This study was conducted in Teluk Wondama to anwer questions below: 1. How is traditional societies using sago for food and source of income?

177
2. How is Papua sago potential as a source of energy? This study aimed to describe the utilization of sago by traditional societies for their live both socially and economically and its potential development for energy.
2. EXPERIMENTAL METHODS
The study was conducted in the district of Teluk Wondama since 2012 until recently. Applying descriptive study, the study was done with surveys and interview techniques. Collected Data consisted of cultivation sago utilization, the sago owner and its development to marketing products. Other supporting data were sago market and its circulation in the district. Data were analyzed descriptively tabulation and displayed by tables and figures.
3. RESULTS AND DISCUSSION
Research shows that in Rasiei, district of Teluk Wondama, there are several types of sago that can be consumed such as: 1. Anangga (no thorn) 2. Ananggemo (thorns) 3. Wimir (thorns) 4. Witime (thorns) 5. Witae (thorns) 6. Wimama (thorns) 7. Wiakambi (thorns) 8. Wokowurui (thorns) 9. Anamoa (thorns) From those list of sago types, only three of them, anangga, ananggemo and wimir, have better quality of tastiness than other types. So, the preference has been made by people themselves to consume the most of those varieties. It is estimated that there are 60 cultivars of sago in Papua scattered from Wondama to Merauke.
Sago consumption in Papua is 50.18 kg / capita / year lower than the consumption of other foods. Sago is more widely consumed in the form of papeda and sagu lempeng, indeed it is not consumed daily, but as an option of family main menu, rice.
Sago starch is sold for Rp. 20.000,- per stack which is considerely expensive compared to the price of rice, Rp. 30.000-Rp. 120.000 per sack1 depending on the rice quality. On the other hand, The price of sago in the market is relatively competitive with price of cassava, taros and sweet potatoes.
Whenever need money, Quick cash can be easier get by selling sago starch than making the products because not all people selling sago. Nowadays, More people prefer rice than sago for their daily diet; even though it comes from outside Papua. Like other Indonesians, people would say that they were not eating anything yet, if there was no rice in the menu. Rice is the symbol of a complete meal. This though must be changed when we want to establish food security based on local available food. The local community needs empowering their capacity to create many types of marketable sago products, such as cakes or noodles. Indeed, consuming sago gives many benefits, like it has higher calories, vitamin B1 and B2 than rice. The content of sago compares to other kinds of food can be seen at Table 1.
1 1 sack = 15 kg

178
Table 1: Nutritional content of staple Food (per 100 grams of material)
Material name
Calories (g)
Protein (g)
fat (g) water(%) fiber(%) Ash (mg)
Vit A (mg)
Vit B1 (mg)
Vit B2 (mg)
Vit C (mg)
Ca (mg)
Fe (mg)
rice 248 8,0 1,2 40 - - - 0,02 - 0 5 0,5
Brown rice 359 7,5 0,9 13,0 2,9 - 0 0,21 - 0 16 0,3
Wheat 356 10,48 1,68 13,88 1,91 1,41 - - 3,1 - 2,3 0,9
Dry Cassava 338 1,5 0,7 43 - - - 0,6 - 0 80 1,9
Maize 362 10 4 13,5 - 1,5 - - 0,12 - 12 0,8
Jawawut 334 9,7 3,5 12 0 1,6 - 0,51 0,07 0 28 4,0
Potato 83 2,0 0,1 78 - 150,6 0 0,11 - 17 11 0,7
Oats 345 10,5 2,9 25,9 1,4 97,80 - - - - 11,0 6,0
Sago 353 0,7 0,2 14,0 1,9 157,0 11 1,35 2,00 - 47 65,7
Cassava 342 1,5 0,3 63 1,9 - 0 0,6 - 30 33 0,7
Sorghum 326 1,0 0,2 14,00 2,0 0,97 - 1,3 0,04 - 34 74,0
Sukun tua 108 1,3 0,3 69,3 - 0,9 - 0,12 0,06 17 21 0,4
Taro 98 1,9 0,2 73 - - 20 0,13 - 4 28 1,0
Yellow sweet potato
136 1,10 0,40 - 1,05 0,5 900 0,10 0,04 35 57 0,70
Red Sweet Potato
123 1,8 0,70 68,50 1,06 0,5 7700 0,90 - 22 30 0,70
White Sweet Potato
123 1,8 0,70 68,50 1,07 0,5 60 0,90 - 22 30 0,70
Uwi 101 2,0 0,2 75 - - 5 0,10 1,0 9 45 1,8
Waluh 29 1,10 0,30 91,20 - - 180 0,08 - 52 45 1,40
Source: Rahmawati & Yuliana, 2013 Estimated potential of sago starch was 4.75 million tons annually, but the actual production was only 200 thousand tons, so about 4.5 million ton was wasted (Kurniawan et al, 2012). In Teluk Wondama, local people cultivate sago for their needs based on their preferences of quality and quantity which are tastefully and excessively. So, They would bring the seeds from other places and grow it on their places in order to get what their like are.
The sago seeds were planted closed to the village in limited number. Only several clusters were found in garden when field survey was done because sago was planted in garden combined with other plants. They have maintained the plants in order to get a high quality sago starch.
3.1 Papuan Sago Development Prospects for Food Security
The reality that sago is one of many kinds of cluster plants which has a difference on harvest time, so no simultaneous logging activity can be operated because of various of tree maturity in one cluster. Therefore, The silviculture principle must be applied started from seed preparation until maintaining standing stock in order to sustain the yield.

179
Sago as a source of food is potential to fulfill people necessity both traditionally and world widely which is supported by President instruction (Instruksi President) Number 20, 1979 about food diversification (Diversifikasi Pangan) and President Rules (Peraturan Pemerintah) Number 22, 2009 about Policy of Diversification Acceleration of Food Consumption Based on Local Resources (Kebijakan Percepatan Penganekaragaman Konsumsi Pangan Berbasis Sumber Daya Lokal (Satari & Haryanto, 1992) (Fadila, 2013).
In spite of Papua is the largest sago potential, sago utilization is still in a small area. The advance management of sago in Indonesia is Riau. Sago area in Indonesia can be seen in the figure 1.
Source: Flach, 1997 (Modification)
Figure 1: Sago potential in Indonesia
The figure 1 shows that Riau and other places mostly have sago plantation, but Papua and Maluku have the wild sago. However, Riau, Sulawesi and other places have managed their plantation for providing food such as noodles, flavoring and other sago's based food. In Papua, one of sago investment, PT. Sagindo Sari Lestari, more develop on using sago as adhesive on the plywood company than other applications. In the early production, the company could produce 36.000 ton/ha, but it tended to decrease after a couple of years because of limited number of labors.
Traditional community in Teluk Wondama district prefer to consume sago that they cultivate because its closed to their villages. The sago were growing together with other plants in the garden, so the number of the cluster was also precisely their needs. When they cut one tree of sago, they may plant one seed if it is possible or at least maintaining the prospected sago trees in the clusters. Two practices of sago process, traditionally and semi-mechanics can be seen at Figure 2.
0
200000
400000
600000
800000
1000000
1200000
Papua Maluku Sulawesi Kalimantan Sumatera Riau Mentawai
Natural Cultivation

180
Figure 2: Traditional process of "menokok" (Left) and semi-mecanics equipment: a silinder type sago grater tool powered by fuel motor (right)
Dusun sagu (sago's hamlet)2 is rarely visited because of the remoteness from the villages. Particularly, People of Rasiei sub district has to row a boat passing through Wosimi river. Moreover, The hamlet sometimes is very desolate, so It is become a problem because woman is the one always in charged for almost all the processes of sago starch production. They have to find accompany for that work. Those are the limitation of wild sago utilization to provide people's food.
The potential sago's hamlets are scatter over whole Papua such as Sorong-Bintuni-75.845 ha, Nabire 446.596 ha, Sarmi 41.293 ha, Jayapura 21.145 ha and Timika 626.279 ha. While sago in Wondama spread in groups in the area of waterfronts, swamps and lowlands.
Utility of sago is limited to household food and only sold occasionally. Sago is supplied and sold in areas traversed by PELNI ships that pass through Ambon. This fact suggests that local sago has not been fully used to be a source of income for the community of Teluk Wondama district.
When the time of ships come and go from Teluk Wondama, several local sellers sell lunch for to go including sago. Sago products are sold together with other crops such as boiled taro as local people 's favorite foods during shipping. The sago products can be seen at Figure 3.
2 Dusun sagu (sago's hamlet) is called for a number of wild sago

181
Figure 3: Sagu bungkus (Left) and Sagu bakar (right) sold with others.
3.2 Papua's Sago Development Prospects as a Source of Energy
In the term of economic development based on local potency, the government of West Papua province has generated about five corridors of development in the area. Sago development is in the first corridor which is planned to elaborate sago as source of bioethanol from Sorong to Bintuni because the area covers 75.845 ha of wild sago. The sago did not well-managed either by local people or local government because it is located in the swamp and remoted, so it is difficult for people to deal manually.
Investment opportunity has been widely opened to the investors in order to manage those sago forest as source of energy and income. The development corridors of West Papua province can be seen in Figure 4.
Figure 4: Development corridors of West Papua Province

182
Problems that may be encountered when investors establish sago industry in Papua are:
1. Labor supplies are limited. Industry requires a workforce that much but it is difficulit to hire from local community because the numbers will be limited.
2. It is the heavy exploitation of sago forest, because the place is considerely deep swampy area with an extreme number of mosquitos and sometimes crocodiles.
3. The special characteristic of sago is thorn, so the tree needs a special treatment too.
Numberi (2011) is also proposing Sago Development Zoning District (Zonasi Wilayah Pengembangan Sagu) as depict in the folowing Figure 5.
Figure 5. WP I (Bintuni-Sorong) 75 845 ha, WP II (Sarmi-Waropen) 446 596 ha, WP III 41
293 ha, WP IV of 21 145 ha and WP V 626 279 ha.
In Papua, several companies have invested on sago bussiness like PT. Sagindo Sari Lestari which has operated in Bintuni since 1989 with a capacity of 36,000 tons / ha.
4. CONCLUSSION
1. Local people prefer to consume cultivated sago because of its quality better than wild sago. 2. Sago in Teluk Wondama has been well-managed yet as a source of local people income. 3. High potency of sago in Sorong to Bintuni can be prepared for energy (bioethanol)
production in line with Papua Barat Provincial government program.

183
5. REFERENCES
Fadila, I ( 2013): Sago Potential in Diversification Effort. Opened University. South Tangerang City.
Kurniawan, A , Darma, dan Istalaksana, P (2012): Development of Sago Agro-processing in Papua Province to Support Security and Diversification of Food. InSINas Proceeding 2012.
Limbongan, J (2007): Morphology of Several Potential Sago in Papua. Journal of Agriculture Research and Development 26 (1), 2007.
Numberi, F (2011): Sago is Still Overlooked Potential: Utilization of Sago Indonesia As One of Food and Energy National barn. PT. Bhuana Popular Science. West Jakarta.
Rahmawati, A and Yuliana, F (2013): Nutritional content of Staple Food. http://azaima.tripod.com July 18, 2013.
Satari, A M and Haryanto B (1992): Role of Sago Forest Management in Supporting Food Self-Sufficiency and Enhancing Welfare. Proceedings of the Seminar on Sago Forest Concession and Nipah. Jakarta.
Sutara (1992): Sustainable Sago Forest Management Systems. Proceedings of the Seminar on Sago and Nipah Forest Concession. Jakarta.

184

185
INAFOR A-0121
THE SECOND INTERNATIONAL CONFERENCE OF INDONESIA FORESTRY RESEARCHERS
THE 2nd INAFOR, 27-28 AUGUST 2013
Cultivating State Land by the Society: Case Study of Ex-KPWN Land at Teja Village, Rajagaluh Sub District, Majalengka
District, West Java Province
Tri Sulistyati Widyaningsih1, Budiman Achmad 2, and Nugraha Firdaus3
1,2,3Agroforestry Technology Research Institute
Jl. Raya Ciamis-Banjar Km 4 Pamalayan, PO BOX 5 Ciamis, West Java, Indonesia 46201
Corresponding email: [email protected]; [email protected]; [email protected]
Paper prepared for The Second International Conference of Indonesian Forestry Researchers (INAFOR)
27-28 August 2013
INAFOR SECRETARIAT Sub Division of Dissemination, Publication and Library
FORESTRY RESEARCH AND DEVELOPMENT AGENCY Jl. Gunung Batu 5, Bogor 16610

186
Cultivating State Land by the Society: Case Study of Ex-KPWN Land at Teja Village, Rajagaluh Sub District, Majalengka District, West Java
Province
Tri Sulistyati Widyaningsih 1, Budiman Achmad 2, and Nugraha Firdaus 3
1,2,3Agroforestry Technology Research Institute Jl. Raya Ciamis-Banjar Km 4 Pamalayan, PO BOX 5 Ciamis, West Java, Indonesia 46201
Corresponding email: 1 [email protected]; 2 [email protected]; 3 [email protected]
ABSTRACT
Unmanaged state land could trigger landless people who depend primarily on agricultural activities to cultivate the land. This study aims to describe the process of this cultivation by taking case study of Ex Koperasi Perumahan Wanabakti Nusantara (ex-KPWN) in Teja Village, Rajagaluh Sub District, Majalengka District, West Java Province. This study was conducted in May to Nopember 2012. Survey method was employed in this study by taking 70 farmers as samples, while interview in combination with field observation and documentation was conducted to obtain social and economic data. Accordingly, majority of respondents ages 40-49 years old and only obtained elementary education level. They have cultivated the land since 1970 while the land was managed by a plantation concession. In 2009, land occupation spread when National Land Agency (BPN) of West Java indicated that the land was abandoned. The farmers have been planting timber and food crops with an average size of 0.35 ha. Furthermore, farmers obtained IDR 1,376,595.- annually while the land impacted positively on water availability, forest security, and reducing fire. In contrast, majority of respondents were not aware of the land status, and their motivations to cultivate the land were as follows: following previous farmers (26%), providing families need (23%), given by committee (10%), and reforestation (10%).
Keywords: cultivation, state land,occupation, land of ex KPWN
1. INTRODUCTION
Land tenure is recently becoming a sensitive issue for Indonesian country. Land is important asset for the people who rely on the land management, such as agriculture and forestry, to support their livelihood. However, land ownership concentration and resources exploitation including land, forests, and mines by small number of people as well as large corporations underlines Indonesian agraria problem (Saragih, 2012 in Perkasa, 2012). As an agricultural country, land tenure conflict occured because landless people, particularly who rely on agricultural activities, was cultivating the state land. Land tenure conflict is one of social conflict that often occurs in Indonesia. National Land Agency (BPN) documented more that 2,810 cases of land disputes between the people and the state on Orde Baru period and the Consortium for Agrarian Reform (KPA) recorded 1,753 agrarian structural conflict (Khudori, 2012). In year 2011, KPA recorded at least 472,084.44 hectares of conflict land that involved 69,975 households (Perkasa, 2012). Land tenure conflict due to the cultivation of state land by society was also occuring in ex Koperasi Perumahan Wanabakti Nusantara (ex KPWN) land covering 267 ha located in Teja Village, Rajagaluh Sub-District, Majalengka District, West Java Province. This study aimed to describe the cultivation of ex-KPWN land by the societies.

187
2. METHODS
2.1 Site Description
The study site is located in Teja Village, Rajagaluh Sub-District, Majalengka District, West Java Province (see picture 1). This location was chosen because the state land has been occupied and cultivated by the farmers mainly from the village. The area of Teja village covers 6.76 km2 of land, and adjacent to Ciremai Mountain National Park. . The distance from this village to the sub district city is 7 km, while the distance to the district city is 25 km. The total population in Teja village in 2011 is 2,830 people consisting of 1,413 men and 1,417 women from 938 households, while population density in this village is 353 people/km2. Most Teja’s people livelihoods are farmers (67%), while the rest of them are traders, seedsman, and laborer. Education level of the communities is dominated by the elementary school (57%).
Figure 1: Map of ex-KPWN land in Teja Village
2.2 Methods
This study was conducted in May to Nopember 2012. Data collection was done by interviewing respondents in combination with field observation and documentation. According to the information from officials Teja village, in average 0.5 ha of land was cultivated by one household, so there are 534 households farmer. Interview was conducted with 70 farmers or 13.11% of the population that cultivating ex KPWN land. Observation was done to understand site condition as well as people activities in cultivating the land, while documentation was done by collecting secondary data. The data was analyzed and presented descriptively. 3. RESULTS AND DISCUSSION
3.1 History of The Ex KPWN Land
History of ex KPWN land management status can be traced since before 1960s when the land was still managed by a rubber plantation concession. As indicated in Table 1, since then several concessions had been granted in this land. However, in the end of 1990s KPWN retrieved its control toward the land before it was handed over to Ministry of Forestry in 2004.

188
Late response has caused the land been declared unmanaged and abandoned by the National Land Agency (BPN) of West Java. Since then land occupation has been widely spread. Table 1: History of ex-KPWN land in Teja village
Year Description Before 1960 Status of the land was plantation concession managed by Chinese ethnic
entrepreneur. 1960-1988 Rubber plantation concession granted to NV. Cultuur Matschapprij Padabeunghar
en Tedja. The land was managed in cooperation with local farmers. 1988-1998 Plantation concession expired, land was cultivated by societies. 1998 - Activated of plantation concession granted to PT Teja Mukti Utama.
- The National Land Agency indicated that PT Teja Mukti Utama derelicted the land (30th June 1998).
- Concession of PT Teja Mukti Utama handed over to KPWN to substitute forest areas in KPH Purwakarta which will be used for the housing of Ministry of Forestry employee (21th December 1998).
1998-2004 The land a controlled by KPWN. 2004 Chairman of KPWN handed over the land to Ministry of Forestry 14th December
2004). 2004-now The land of PT Teja Mukti Utama concession (known as ex-KPWN land) is
currently controlled by Planning Agency, Ministry of Forestry though has not been confirmed as forest land. Almost entire area of the land is currently cultivated for local people agricultural activities.
Source: Primary and secondary data analysis, 2012
3.2 Profile of Ex-KPWN Land Cultivators
As the land located several kilometers away from centre of the village, women rarely involved in cultivating the land, hence all respondents interviewed in this study were men. The majority of respondents are in the productive age group, which consist of 40-49 years (29%), 50-59 years (26%), and 30-39 years (19%). Most of interviewees (86%) were Teja Village residence, while the ohers 14% were migrants. The respondents lived with 3-4 (49%) and < 3 (46%)dependents, while their education levels are mostly (74%) primary school graduates. Furthermore, the majority of them depend mostly (63%) from agricultural activities, while the rests consider farming activities as alternative livelihood sources. Apart from their main income-generated activities, the farmers in ex-KPWN land earn extra income from agricultural activities (26%), working as labourers (16%), traders (14%) and nursery (13%). Only 19% of them depend solely from agricultural activities. Respondents have an average land area of 0.41 ha. The majority of them acquired land from purchasing (42%) and inherited from their parents (33%). Most of the land are used for private forest, and rice field (36%). Only 7% of the land are utilized for house and yard (see Table 2).

189
Table 2: Land ownership all respondents in the Teja village
Number Land use Origin of land
Inheritance (ha)
Purchase (ha)
Rent (ha)
Village land (ha)
Others (ha)
Total (ha) %
1. Private forest Total 6.00 10.21 0.07 0.00 0.00 16.14 57 Average 0.09 0.15 0.00 0.00 0.00 0.23 57
2. Paddy field Total 1.76 1.41 1.34 5.43 0.21 10.15 36 Average 0.03 0.02 0.02 0.08 0.00 0.15 36
3. House and yard Total 1.67 0.42 0.00 0.00 0.00 2.09 7 Average 0.02 0.01 0.00 0.00 0.00 0.03 7
4. Fishpond Total 0.05 0.03 0.00 0.00 0.00 0.08 0 Average 0.00 0.00 0.00 0.00 0.00 0.00 0
5. Overall land Total 9.47 12.07 1.41 5.43 0.21 28.46 100 Average 0.14 0.17 0.02 0.08 0.00 0.41 100
6. % 33 42 5 19 1 100 Source: primary data, processed, 2012 3.3 Agricultural Activities on Ex-KPWN Land
In addition to their private land, interviewees have been conducted on agricultural activities in ex-KPWN land. On average, the farmers cultivate an area of 0.35 ha of ex-KPWN land.. As indicated in Figure 2, the majority of them (45%) work on land less than 0.25 ha, while 33% of the farmers manage 0.25 to 0.5 ha. Only 3% of the respondents manage more than 1 ha of the land.
Figure 2: Arable land of respondent in ex KPWN land (source: primary data, processed 2012)
Historically, majority the farmers (53%) have conducted agricultural activities in the ex-KPWN land since before 1998, when the land as rubber plantation concession until the land handed to KPWN. Thirty one percent of the farmers initiated their agricultural activities in 2009, while 16% of them just started to manage the land after BPN released a decision indicated that the land was derelict in 2010. The BPN decree led to land redistribution
Perc
enta
ge
Area of arable land

190
demand by forming Land Redistribution Committee at the Teja village. The committee aims to process acquisition efforts of ex-KPWN land from state land to be private land, even though it was against government regulation on controlling and utilization of abandoned land (PP No. 11/2011). The committee has distributed 167 ha to 900 households of Teja Village. Approximately, each household obtained 0.21 ha of land. Residents who are interested in cultivating the land should pay IDR 300.000,00 for administration fee in order to get land certificate. Not all people are interested in cultivating the land because of some reasons such as: the distance to the land is so far, having another job, and not enough energy to work on the land. Unallocated lands could be cultivated by their family or others by paying land management fees proportionally. Furthermore, amount of 100 ha lands managed by the tenants coordinator who looked for investors outside Teja village. There were no agreement and the notice from the committee about the duration of the permission for respondents to cultivate the ex-KPWN land. Most of respondents (91%) managed the land for agroforestry activities by planting timber (albasia, mahogany, africa wood) and non timber forest product (banana, cassava, and sweet potatoes) as shown in Figure 3. The age of crops was ranging from 2-3 years old. Time allocated by respondents for working on the land is less than 7 hours per week. To achieve the land, respondent should walk between 3 to 5 km and takes about 30 to 60 minutes on foot.
Figure 3: Conditions of ex-KPWN land used for the agroforestry activity and stones mining (Source: research documentation, 2012)
Figure 3 indicated there was stone mining activities on the ex-KPWN land. The activities had been carried out by some respondents since 2007 to clear the land from stones before planting. The income from stone mining activities was Rp 65.000-110.000/truck obtained within 1-2 days. The stones are sold to people who need and willing to pick at the mining site. The activities were charged of IDR 5,000 to 15,000/truck for maintaining the village street. Agricultural and mining activities in the ex-KPWN land give economic contribution to some respondents. The average income of respondents amount IDR 14,317,478.61/ year or IDR 1,193,123.22/ month which can be seen in Table 3. Product from ex-KPWN land contributed by 10% equivalent to contributions from private forests. The results obtained by the respondent from selling firewood, bananas, and stones as shown in Figure 4.
b a
d
c

191
Table 3: Respondent incomes in the Teja village in one year
Number Source of income Total of income (Rp) Average of income (Rp) % 1. Paddy field 171,512,500.00 2,485,688.41 17 2. Private forest 101,788,404.76 1,475,194.27 10 3. Ex-KPWN land 94,985,119.03 1,376,595.93 10 4. Services 237,660,000.00 3,444,347.83 24 5. Sales 319,720,000.00 4,633,623.19 32 6. Livestock/ fish 8,230,000.00 119,275.36 1 7. Others 54,010,000.00 782,753.62 5
Total 987,906,023.80 14,317,478.61 100 Source: primary data, processed 2012
Figure 4: Agroforestry and mining products from ex-KPWN land (Source: research documentation, 2012)
3.4 Respondents' Perceptions about ex-KPWN Land
Not many respondents are aware of the history and status of ex-KPWN land. Respondents’ perception about this land listed in Table 4. Table 4: Respondents' perceptions about the status and managers of ex-KPWN land
Number Land status N % Land manager N % 1. Ex plantation concession land 11 16 Farmer 1 1 2. Concession land 12 17 Plantation concession manager 6 9 3. Abandoned land 10 14 Abandoned land 4 6 4. Ciremai Mountain National
Park 1 1 Ex-plantation 4 6
5. Village land 3 4 Village goverment 1 1 6. Ex plantation concession that
will be distributed 5 7 Redistribution committee 1 1
7. Government land 10 14 Government 11 16 8. No answer 18 26 No answer 42 60
Total 70 100 Total 70 100
Source: primary data, processed, 2012
The diversity of respondents' knowledge about the land status due to the status development and land ownership had never been formally socialized to public. Socialization was merely to the relevant agencies as well as community representatives. Respondents’ motivation to work on the land were shown in Figure 5.

192
Figure 5: Respondents’ motivation to work on ex-KPWN land (source: primary data, processed 2012)
3.5 The Impact of the Cultivation of ex-KPWN Land and Community Expectations
Most respondents felt the different impact especially to their economy between prior and post cultivating the land. The impact was positive, i.e. an increase in family income from ex-KPWN lands’ product, increase the security of the forest, etc as shown in Table 5.
Table 5: The condition of the ex-KPWN land post cultivated by society
Number Condition
No answer
Did not know
Decline Indifferent Increase
N % N % N % N % N %
1. The economy (bad/ good)
10 14 0 0 4 6 9 13 47 67
2. Availability of water (a little / a lot)
4 6 1 1 1 1 7 10 57 81
3. Forest security (insecure/ secure)
19 27 6 9 4 6 14 20 27 39
4. Landscape (dry/green)
12 17 0 0 0 0 2 3 56 80
Source: primary data, processed, 2012
Most respondents acknowledged that the ex-KPWN land is state land, not theirs. But if possible, they wanted the land to be their property. Respondents said that state land should always be planted with trees in order to provide better outcomes for the communities and for the environment. Respondents plan to maintain the plants and to cultivate the ex-KPWN land with timber and others which can increase their income.
Perc
enta
ge
Motivation

193
4. CONCLUSION AND RECOMENDATION
4.1 Conclusions
a. The ex-KPWN land is state land (ex plantation concession) which is currently cultivated by local people due long process of establishing the land become forest area.
b. Majority of the ex-KPWN land cultivators are Teja village residents who have cultivated the land. It was indicated as an abandoned land (2009) of 0.35 ha each in average.
c. The ex-KPWN land has been utilized by society for agroforestry activities by planting timbers plants (albasia, mahogany, africa), fruit trees (melinjo, clove, banana), as well as food crops (cassava and sweet pottatos yams) with an average income of IDR 1,376,595.93/ years.
d. The majority communities did not know about the status of the ex-KPWN land and also the manager of the ex-KPWN land. The communities cultivating the land because they follow others, gets a small claim, as well as meet the needs.
4.2 Recommendation
The existence of cultivation at ex-KPWN land whereas a state land which is on process to establish as forest needs to be followed immediately by socialising about the status and the managers of the land to local people. This is to prevent the conflict between the government and the communities and find out a solution if the ex-KPWN land turned into forest area.
5. REFERENCES
Khudori (2012): Konflik Lahan dan Transformasi Struktural. http://gagasanhukum.wordpress.com/2012/01/09/konflik-lahan-dan-trasformasi-struktural/. Accessed on January 19, 2012.
National Land Agency of the Republic of Indonesia (2010): Government Regulation Number 11 of 2010 about Controlling and Utilization of Abandoned Land. BPN RI. Jakarta.
Perkasa, A (2012): Konflik Lahan: Perijinan sering Cacat Prosedural. http://www.bisnis.com/articles/konflik-lahan-perizinan-sering-cacat procedural. Accessed on January 19, 2012.
Rural Agency for Community Empowerment, Women, and Family Planning (BPMDPKB) Majalengka (2011): Profile of Teja’s Village, Rajagaluh Sub District, Majalengka District, West Java, January to December 2011. BPMDPKB Majalengka. Majalengka.
Statistics Agency of Majalengka (2011): Rajagaluh in Figures 2010. Statistics Agency of Majalengka. Majalengka.

194

195
INAFOR A-0122
THE SECOND INTERNATIONAL CONFERENCE OF INDONESIA FORESTRY RESEARCHERS
2nd INAFOR, 27-28 AUGUST 2013
Looking for a Better Future: Towards Effective Buffer Zone Management
of Sebangau National Park, Central Kalimantan
Tri Wira Yuwati1, Gerard Persoon2 and San Afri Awang3
1Banjarbaru Forestry Research Institute Jl A Yani Km 28.7, Landasan Ulin, Banjarbaru 70721 South Kalimantan Indonesia
2 Department of Cultural Anthropology and Developmental Sociology, Faculty of Social and Behavioural Science, Pieter de la Court Building,
Wassenaarseweg 52 2333 AK Leiden, The Netherlands
3Department of Forest Management, Faculty of Forestry, Gadjah Mada University Jl. Agro Bulaksumur, Yogyakarta, Indonesia
Paper prepared for The Second International Conference of Indonesian Forestry Researchers (INAFOR)
27-28 August 2013
INAFOR SECRETARIAT Sub Division of Dissemination, Publication and Library
FORESTRY RESEARCH AND DEVELOPMENT AGENCY Jl. Gunung Batu No. 5, Bogor 16610

196
Looking For a Better Future: Towards Effective Buffer Zone Management of Sebangau National Park, Central Kalimantan
Tri Wira Yuwati1, Gerard Persoon2 and San Afri Awang3
1Banjarbaru Forestry Research Institute, Jl. A Yani km 28.7 Landasan Ulin, Banjarbaru, South Kalimantan, Indonesia. Corresponding email: [email protected]
2 Department of Cultural Anthropology and Developmental Sociology, Faculty of Social and Behavioural Science, Pieter de la Court Building,
Wassenaarseweg 52 2333 AK Leiden, The Netherlands
3Department of Forest Management, Faculty of Forestry, Gadjah Mada University Jl. Agro Bulaksumur, Yogyakarta, Indonesia
ABSTRACT
Sebangau National Park is an area of 568,700 ha that holds one of the largest known remaining orangutan (Pongo pigmaeus) populations; located in the southern part of Central Kalimantan Province; and serves as one of the last remaining peat swamp forests in Kalimantan. Effective buffer zone management is one of the answers to conserve the peat swamp forest resources due to the high dependency of the local people in 46 villages surrounding Sebangau forest. This research was aimed to determine aspects of consideration in formulating buffer zone management plan at Sebangau National park. The research was approached with case study in three villages of Sebangau National Park namely Baun Bango, Tumbang Ronen and Sebangau Permai. The research was carried out with qualitative method. The result showed that there were several aspects of consideration in formulating buffer zone management plan at Sebangau National Park, namely: the development of alternative livelihoods and their markets, the supply of alternative natural resources for their basic needs of fuel and construction woods, awareness raising of Sebangau conservation program, enhancing the participation of local people in the planning and development of buffer zone management plan, enhancing the communication between Park authority, WWF, local government and villagers, increasing the capacity of local economy institution and enhancing the capacity of Balai Taman Nasional Sebangau. Keywords: Co-management, protected areas, buffer zone, Sebangau National Park
1. INTRODUCTION
Sebangau National Park is an area of 568,700 ha that holds one of the largest known remaining orangutan (Pongo pigmaeus) populations in the world and was gazette by the government of Indonesia in October 2004. It is located in the southern part of Central Kalimantan Province, between the Sebangau and Katingan rivers, and serves as one of the last remaining peat swamp forests in Kalimantan. Administratively, Sebangau national park is part of Katingan district (52%), Pulang Pisau (38%) and Kota Palangkaraya (10%). Forest area of Sebangau was appointed as National Park through The Ministry of Forestry Decree No. 423/ Menhut-II/2004. Before designated as national park, the status of Sebangau forest was production forest and limited production forest (Central Kalimantan Provincial Spatial Planning 2003).

197
The Center for International Cooperation in Sustainable Management of Tropical Peatland (CIMTROP) reported 35 mammal species inhabiting Sebangau and 13 were identified as threatened species in 1993 (Drasosopolino, 2007). WWF conducted a study of Sebangau biodiversity and have found 166 flora species, 150 bird species, orang utan (Pongo pygmaeus) species and 36 fish species. The flora species in this area including Ramin (Gonystilus bancanus), which was considered as threatened species while the cutting and trading of this species has been banned. The list of threatened mammals species in Sebangau and their IUCN status is presented in Table 1.
Table 1: The 13 mammal species identified in Sebangau and their status according to IUCN
Local name Scientific name IUCN Status
Owa/ black-handed gibbon Hylobates agilis Endangered Orang utan Pongo pygmaeus Endangered Beruk/the southern pigtail macaque Macaca nemestrina Endangered Kelasi/maroon leaf-monkey Presbytis rubicunda Endemic to borneo Beruang madu/honey bear Helarctos malayanus Endangered Macan dahan/clouded leopard Neofelis nebulosa Threatened Kucing hutan/the Asian leopard cat Felis bengalensis Threatened Kucing batu/the marbled cat Felis marmorata Threatened Kucing kepala pipih/the flat-headed cat Felis planiceps Rare Binturong Arctitis binturong Vulnerable Musang pohon/ Small-toothed Palm Civet Arctogalidia trivirgata Status intermediate Bajing/ squirrel Exilisciurus axilis Endemic to borneo Tupai/the painted treeshrew Tupaia picta Endemic to borneo
Source: Drasospolino (2007)
During the period of 1996-2003, there has been a decline in the number of orang utan from 13,430 to 6,190 individual due to the widespread illegal logging and forest fires (Husson and Morrogh-Berned, 2004). In adjacent area, in the 1990’s, during the Soeharto era, The Mega Rice project was initiated which aimed at converting one million hectares of peat swamp forest into paddy fields in Central Kalimantan. Unfortunately, the project was a big failure, resulting in high input yet low output result.
Lesson learned from the failure of mega rice project in Central Kalimantan increased people’s awareness not to convert peat swamp forest into another land use. In order to limit the degradation of Sebangau peat swamp forest, the WWF-Indonesia promoted Sebangau as a conservation forest.
The designation of the park was supported by the head of Katingan district (district government decree No. 522.51/696/EK 1 October 2003, the head of Pulang Pisau district (district government decree No. 119/520/EK January 2003). Although given a legalized support, the head of Katingan district did not state the wide of the park in his area. The government of Kota Palangkaraya has not given support due to the overlapping land use and demanded to resolve the problem. The governor of Central Kalimantan and Central Kalimantan house of representatives had given their support for the conservation of Sebangau forest through decree No. 050/33/IV/Bapp (20 January 2004) and No.162/522/DPRD/2004 (25 March 2004), respectively.
Apart from local government support, the real problem that has been experienced by the park was the pressures from 46 villages surrounding the park. Those villages were traditional

198
villages and transmigration villages. The traditional villages of Dayak Ngaju resettled around rivers or canals. Moreover, during the logging era, the majority of the villagers were timber laborers and after the designation of the park they were forced to change their livelihood. Beside the local pressures, there was conflict of interests in the Sebangau forest. The road construction project was one example of conflicting interest between conservation and development. Katingan district translated the vision of Central Kalimantan governor to open the isolation to remote area through road construction. This road was expected to open the access from Selat Jaluju harbour, the future gate to enter Central Kalimantan from Java. The road construction of 98 km was planned with no permission from the Forestry Minister. However, it has been built 20 km long from Mendawai sub district. Moreover, the road construction was stopped in 2006 because of the park designation. The current management activities of the Sebangau national park authority (Balai Taman Nasional Sebangau) is presented in Table 2.
Table 2: The management activities of Sebangau National Park
No. Management activities 1. Canal blocking
Canal blocking is a way to leverage the ground water level and to preserve the water in dry season. This method moistens the soil and prevents forest and land fire. This method also encourages natural regeneration around the dam. Up to end of 2009, there were 190 dams in 15 canals.
2. Park boundary and zoning review The boundary marking has been clear only for Pulang Pisau district up to now, however neither Katingan nor Palangkaraya was agree on the park boundary. Both are waiting for the provincial spatial plan to be approved by the central government. Though agreement has not been made, the WWF Central Kalimantan has made a tentative zoning plan for Sebangau. Thus, up to the end of 2012, the Sebangau national park authority has not carried out the plan to review the zoning and finishing the park boundary marking.
3. Patrol against illegal logging Sebangau national park authority has three sections spreading throughout three districts: Katingan, Pulang Pisau and Palangkaraya. For each district, there are several resorts which are guarded by forest rangers. The patrol for illegal logging and forest fire are conducted routinely. The potential cases of illegal logging and illegal mining were happening in the two districts: Katingan and City of Palangkaraya; the two districts that have not given approval on the boundary of national park in their area. Illegal loggings mostly happened in Muara Bulan resort, or precisely in Tumbang Bulan village. In this village, in 2009, the illegal logs were drowned by the Balai TNS and there have been illegal trials of pull them out ever since. That is why, the Balai has been focusing to put their forest rangers in this village only.
4. Rehabilitation of degraded peat swamp The rehabilitation activities in Sebangau were carried out either by WWF in cooperation with Sebangau national park authority and the local people of villages surrounding the planted area and also in cooperation with local government and Kahayan watershed management institute the Ministry of Forestry. Some even carried out in cooperation with national and international companies through their CSR program. The local people were hired as labors/ workers to do land preparation and planting.
5. Community empowerment and development program The community empowerment and development program in Sebangau national park

199
No. Management activities were conducted by partners such as WWF and YCI (Yayasan Cakrawala Indonesia). The program was focused on giving information on alternative livelihood for local people; changing the image of logging as the only way to earn a living. The program offered a variety of livelihood emphasizing on sustainable farming, gardening and fishing, non timber forest product utilization and post-harvest home industry.
Wiratno et al (2004) stated that paper park is a national park that has not been intensively managed. Sebangau National park is classified as paper park. The park is still not intensively managed up to present. Hence, the Sebangau buffer zone has not been touched by the park management. Wind (1992) stated that there are four criteria that need to be considerate namely stability, sustainability, equity and productivity. Moreover, Ebregt and Greeve (2000) emphasized that towards effective buffer zone management, there were several aspects of considerations namely: ecology, social economy and institutional. This paper aims to determine aspects of consideration in formulating buffer zone management plan at Sebangau National park.
2. METHODS
The research was approached with case study. The research object was buffer zone villages of Sebangau. The primary data were obtained through interview in three villages namely Baun Bango and Tumbang Ronen of the Katingan district and Sebangau Permai of the Pulang Pisau district. The secondary data were obtained through documents study such as reports, regulations and village statistics. The collected data were presented in Table 3.
Table 3: The data for Sebangau buffer zone management research
No. Data Data collection method Subject
1. The history of villages Interview, PRA Villagers 2. Social economy Interview, PRA, observation Villagers 3. Access to forest resources Interview, PRA, observation Villagers 4. Livelihood Interview, PRA, observation Villagers 5. Policy and programs of BTNS Interview, documents BTNS
6. Policy and programs of WWF Interview, documents WWF Central Kalimantan
7. Katingan district community program
Interview Katingan district government
The techniques of data collection in this research was selecting informants, interview, Participatory Rural Appraisal (PRA), observation and desk study. The data analysis was carried out descriptively, explanation, qualitative data tabulation and interpretation of available data. The villages were selected because they were planned to become buffer zone management models. There were 30 respondents per village interviewed for this study, thus in total there were 120 respondents.
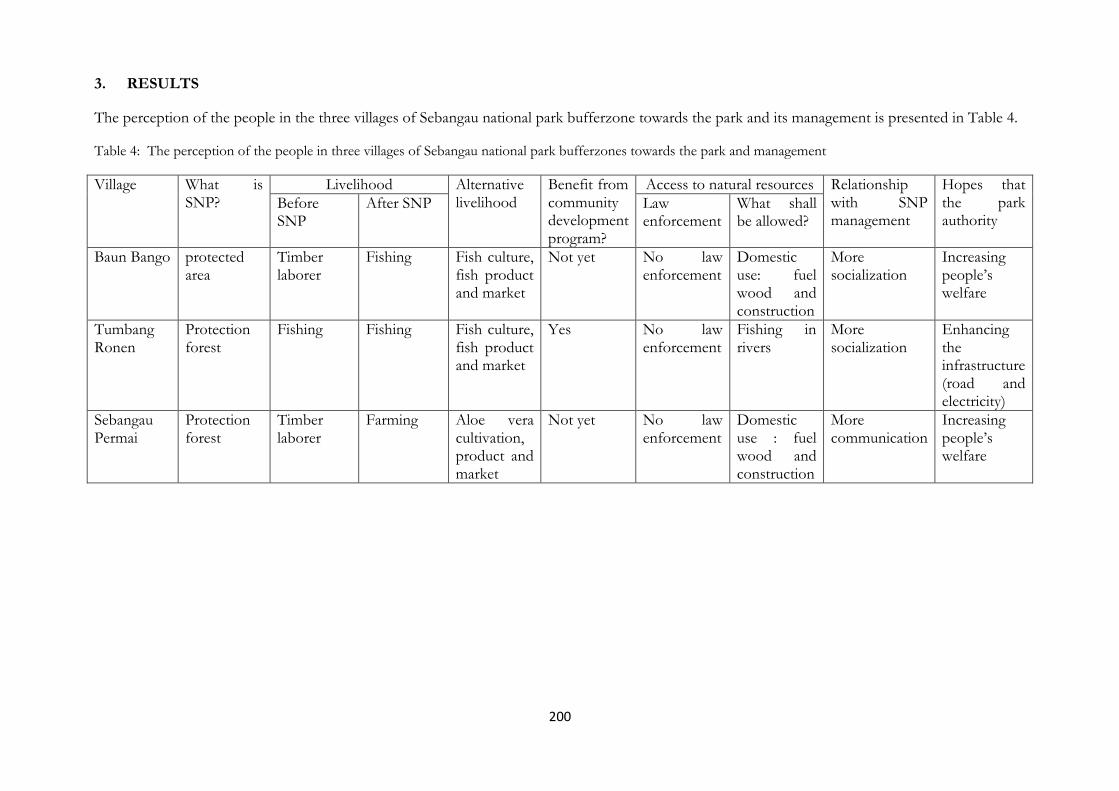
200
3. RESULTS
The perception of the people in the three villages of Sebangau national park bufferzone towards the park and its management is presented in Table 4.
Table 4: The perception of the people in three villages of Sebangau national park bufferzones towards the park and management
Village What is SNP?
Livelihood Alternative livelihood
Benefit from community development program?
Access to natural resources Relationship with SNP management
Hopes that the park authority
Before SNP
After SNP Law enforcement
What shall be allowed?
Baun Bango protected area
Timber laborer
Fishing Fish culture, fish product and market
Not yet No law enforcement
Domestic use: fuel wood and construction
More socialization
Increasing people’s welfare
Tumbang Ronen
Protection forest
Fishing Fishing Fish culture, fish product and market
Yes No law enforcement
Fishing in rivers
More socialization
Enhancing the infrastructure (road and electricity)
Sebangau Permai
Protection forest
Timber laborer
Farming Aloe vera cultivation, product and market
Not yet No law enforcement
Domestic use : fuel wood and construction
More communication
Increasing people’s welfare

201
3.1 Livelihood
The village of Baun Bango and Tumbang Ronen is traditional village while Sebangau Permai is a transmigration village. Most of the Baun bango villagers were working as timber laborer before the designation of Sebangau forest into national park. However, due to the forest function changes, the people of Baun Bango were then changing back into their traditional Dayak Ngaju livelihood as fisherman. The majority of the Baun Bango people experienced a drastical change of the amount of money they earned.
Most villagers of Tumbang Ronen were fishing and collecting rattan before and after Sebangau designation. Although there was no changes in the way of earning a living, nevertheless, there was a drastically decrease in the amount of money they earned. When Sebangau was a production forest, lots of small scale saw mills were present along the Katingan River where they supplied fish for timber laborers. There was a different perception regarding what were allowed and forbid from the Sebangau area. Some of the Tumbang Ronen villagers believed that the park has forbid people from fishing in the lakes and rivers of Sebangau. Lack of socialization and communication on the Sebangau conservation has caused the different perceptions among the villagers. Moreover, the village of Tumbang Ronen was not reached by electricity from the government (Perusahaan Listrik Negara) and was not reached by road transportation. That is why the villagers hope that the presence of the park will increase their welfare and their village will have a better infrastructure.
The majority of Sebangau Permai villagers were timber laborers before the designation of Sebangau as national park. After the timber was banned, villagers were then back to their former livelihood as farmers. The changes in the household income were drastically lower after the logging era. They hope that Balai Taman Nasional Sebangau will give more attention in increasing the welfare of the villagers through community development programs.
3.2 The role of park authority
The people of three villages emphasized that the park authority needs to give more socializations and communications regarding community development programs and Sebangau conservation program to the villages. Increasing the presence of the park staffs in the villages was seen as a good sign of park management.
Half of the respondents of Sebangau Permai village thought that the park authority and WWF Central Kalimantan has a positive role. However, more than one third of the respondents could not say whether they have positive or negative role towards the park management. These respondents were timber laborers during the logging era in Sebangau. This people were the people who experienced the decrease of household income after the park designation. Interestingly, half of the respondents were not agree of logging ban. They thought that logging shall be allowed for domestic use such as fuel wood and house construction.
3.3 Community development program
The community development programs that had been held by WWF Central Kalimantan and Sebangau national park authority were varied from producing fish fodder, fish culture, rubber plantation technical training, fish product variety (fish nuggets, prawn crackers and fish floss). According to the Baun Bango villagers, those trainings were useful but not yet well distributed among the villagers of Baun Bango. They also demanded for the assistance of the park authority and WWF Central Kalimantan up to the fish product market due to the difficulty in fish product marketing. Community development programs for traditional village (Baun
202
Bango and Tumbang Ronen) and transmigration village (Sebangau Permai) are presented in Table 4.
Table 4: The community development programs for traditional and transmigration village carried out by the Sebangau management: Balai Taman Nasional Sebangau (BTNS), WWF Central Kalimantan and Yayasan Cakrawala Indonesia
No. Institution Community development programs
1. Sebangau national park management (BTNS)
- Traditional village: fishing equipments, fish farming, - Transmigration village: agricultural equipments, animal
husbandry
2. WWF Central Kalimantan
- Traditional village: fish farming, fish nugget home industry, fish floss home industry, prawn crackers home industry, rattan handicraft home industry, agroforestry, traditional music (karungut) and story telling competition for Kamipang sub district.
- Transmigration village: sustainable agriculture, cultivation, product processing and marketing of Aloe vera, fruit crackers home industry, training on the cultivation of jelutong (Dyera polyphylla) and Gemor (Nothaphoebe coriacia)
3. YCI (Yayasan Cakrawala Indonesia)
- Traditional village: fish fodder home industry, fish farming (caramba, modified Beje)
Source: Yuwati (2010)
The majority of livelihood in Tumbang Ronen village is fishing thus the community development program from the park authority in cooperation with WWF Central Kalimantan and Katingan district fishery office was fish culture trainings. However, due to the limiting fund, not all the villagers of Tumbang Ronen followed this program, only several active groups of fisherman and farmer. They have experienced mega fish harvesting but facing difficulties in the marketing.
The community development program held by WWF in Sebangau Permai village was Aloe vera planting and Aloe vera product utilization into various drinks and the development of its factory. Unfortunately, there was a big flood in 2009 that inundated the village and has caused mortality for the Aloe vera plantation. Due to the unavailability of the raw material, the Seka vera drink factory was not operated anymore. The people of Sebangau Permai would like the park authority to assist with Aloe vera seedlings and building back the Seka vera drink factory.
4. DISCUSSION
There are three aspects of considerations towards effective buffer zone management, namely: ecology, social economy and institutional aspect (Ebregt and Greve, 2000). Ecological aspect emphasized on the traditional utilization of natural resources in the buffer zone that proved to be sustainable. Socio-economy aspect focused on the socio cultural condition of local people (customary and or migrant), consensus on the aims, location form and utilization that are permitted in the buffer zone, clarity of the land ownership, identification of people’s livelihood and a guarantee of basic needs fulfillment of food, clothing, housing and education.

203
Institutional aspect emphasized on the legality of the buffer zone, cooperation between local government institutions and the presence of regulations regarding utilization of buffer zone.
The understanding of people in the buffer zones of Sebangau national park on what allowed and what forbidden should be clearly communicated and socialized by the park manager together with its partner (WWF Central Kalimantan) in cooperation with the local governments to avoid confusions among the people in the buffer zones.
Wiratno (2012) mentioned that it is an obligation of the park manager to understand and really know for sure the content of the conservation area, the answers of why changes happened, social, economy and cultural changes, local policies, traditional institution (if any), etc. The answer to all the questions would be more presence in the sites. There was a common finding that management of conservation area by fence and fine approach was not effective in the implementation stage due to the lack of patrolling and weak law enforcement. Moreover, the capacity of Sebangau national park management is still weak in terms of human resources, funding and infrastructure. Increasing population surrounding conservation areas has caused land hunger and the relationship between park authority, local government and people in the surrounding park will be worsened whenever fence and fine approach was the only way to manage such conservation area. Finally, buffer zone management is one of the alternatives that can be opted to preserve such conservation area. Moreover, buffer zone management shall be led to increase the welfare of the people.
In formulating Sebangau national park buffer zone management plan, there are several priorities needs to be considered:
a. Developing alternative livelihood and its market for the people who have high dependency on Sebangau natural resources and its economical institution. The development of alternative livelihood should be adjusted to the people’s social and cultural condition. Fish culture and fish product are alternative livelihoods that can be opted for the traditional villages of dayak Ngaju whose traditional livelihood was fishing. However, park authority in cooperation with WWF central Kalimantan and local government should facilitate them up to marketing.
b. Developing alternatives natural resources in the buffer zones (e.g. agroforestry) to ensure the supply of fuel wood and construction wood for those who have high dependency on the natural resources of Sebangau forest.
c. Raising awareness, enhancing capacity and knowledge of local people on Sebangau conservation and preservation of flora and fauna.
d. Increasing participation of local people in the planning and development of Sebangau national park’s buffer zone.
e. Enhancing the communication between Sebangau authority, WWF Central Kalimantan, local governments of Katingan, Pulang Pisau, Kota Palangkaraya and the people in the villages surrounding Sebangau.
f. Enhancing the institutional capacity of park authority in the park management and buffer zone development.
5. CONCLUSIONS
In order to achieve effective buffer zone management of Sebangau national park, there are several aspects of considerations in the development of buffer zone management plan of Sebangau:

204
a. Developing the alternative livelihoods and their market for villagers surrounding Sebangau national park
b. Ensuring the supply of alternative natural resources to fulfill the domestic needs for fuel and construction woods
c. Raising awareness of Sebangau national park conservation program d. Enhancing the participation of local people in the planning and development of buffer
zone management plan e. Enhancing the communication between Park authority, WWF, local government and
villagers f. Increasing the capacity of local economy institution g. Enhancing the capacity of Balai Taman Nasional Sebangau
6. REFERENCES
Drasospolino (2007). Nilai ekonomi taman nasional Sebangau. Jurnal ekonomi lingkungan edisi 20. Jakarta.
Ebregt, A and Greve PD (2000). Buffer Zones and their management: Policy and Best Practices for terrestrial ecosystems in developing countries. National Reference Centre for nature Management, Wageningen, The Netherlands
Husson, SJ and Morrogh-Bernard, HC (2004). Orang-utan population dynamics in the Sabangau ecosystem, Central Kalimantan. Report for WWF Indonesia.
MoF-WWF (2004). Commitment to save Indonesia’s heritage for people and species in danger. Ministry of Forestry in cooperation with WWF Indonesia.
Wind, J (1992) : Buffer Zone Management for Indonesian National Parks. Vol. 2 :Tools for Planning, Monitoring and Evaluation. The World Bank National Park Development Project. DHV/RIN Consultant. Bogor.
Wiratno (2012). Solusi Jalan Tengah. Esai-esai Konservasi Alam. Dit KKBHL, Ditjen PHKA, Kementerian Kehutanan. Wiratno, Indriyo, D, Syarifudin, A and Kartikasari A (2004). Berkaca di Cermin Retak; Refleksi Konservasi dan Implikasi bagi Pengelolaan Taman Nasional, Jakarta: The Gibbon Foundation Indonesia, PILI-NGO Movement.
Yuwati, TW (2010). Managing Sebangau National Park: Different Approach for Ethnic Differences?”. In: Proceeding of the International Workshop on Indigenous People with theme Indigenous people and natural resource management: Towards new forms of governance, ed. G.A. Persoon. Leiden University The Netherlands and Murdoch University Australia.

205
INAFOR A-0132
THE SECOND INTERNATIONAL CONFERENCE OF INDONESIA FORESTRY RESEARCHERS
THE 2nd INAFOR, 27-28 AUGUST 2013
The Valuable Role of Ethnobotanical Knowledge for Food Resources: a Case Study of the Bali Aga Villages
Wawan Sujarwo1,2, Ida Bagus Ketut Arinasa1, Francois Salamone2, I Nyoman Peneng1 and Giulia Caneva2
1“Eka Karya” Bali Botanic Garden - Indonesian Institute of Sciences (LIPI)
1Candikuning, Baturiti, Tabanan, Bali, Indonesia 82191
2Department of Science, the University Roma Tre, Italy 2Viale G. Marconi 446 Rome, Italy
Corresponding e-mail: [email protected]; [email protected]
Paper prepared for The Second International Conference of Indonesian Forestry Researchers (INAFOR)
27-28 August 2013
INAFOR SECRETARIAT Sub Division of Dissemination, Publication and Library
FORESTRY RESEARCH AND DEVELOPMENT AGENCY Jl. Gunung Batu 5, Bogor 16610


