Page 1
Covering over the cracks in conservation assessments at EUinterfaces: A cross-jurisdictional ecoregion scale approach using theEurasian otter (Lutra lutra)Reid, N., Lundy, M. G., Hayden, B., Waterman, T., Looney, D., Lynn, D., ... Montgomery, W. (2014). Coveringover the cracks in conservation assessments at EU interfaces: A cross-jurisdictional ecoregion scale approachusing the Eurasian otter (Lutra lutra). Ecological Indicators, 45, 93-102.https://doi.org/10.1016/j.ecolind.2014.03.023
Published in:Ecological Indicators
Document Version:Peer reviewed version
Queen's University Belfast - Research Portal:Link to publication record in Queen's University Belfast Research Portal
Publisher rightsCopyright 2014 Elsevier.This manuscript is distributed under a Creative Commons Attribution-NonCommercial-NoDerivs License(https://creativecommons.org/licenses/by-nc-nd/4.0/), which permits distribution and reproduction for non-commercial purposes, provided theauthor and source are cited.
General rightsCopyright for the publications made accessible via the Queen's University Belfast Research Portal is retained by the author(s) and / or othercopyright owners and it is a condition of accessing these publications that users recognise and abide by the legal requirements associatedwith these rights.
Take down policyThe Research Portal is Queen's institutional repository that provides access to Queen's research output. Every effort has been made toensure that content in the Research Portal does not infringe any person's rights, or applicable UK laws. If you discover content in theResearch Portal that you believe breaches copyright or violates any law, please contact [email protected] .
Download date:26. Feb. 2020
Page 2
1
Post-Print (Ecological Indicators) 1
Covering over the cracks in conservation assessments at EU interfaces: A cross-2
jurisdictional ecoregion scale approach using the Eurasian otter (Lutra lutra) 3
Neil Reida,∗, Mathieu G. Lundyb, Brian Haydena,c, Tony Watermand, Declan Looneyd, 4
Deirdre Lynne, Ferdia Marnelle, Robbie A. McDonaldf, W. Ian Montgomerya,g 5
6 a Quercus, School of Biological Sciences, Queen’s University Belfast, Belfast BT9 7BL, UK 7 b Agri-Food and Biosciences Institute (AFBI), Fisheries and Aquatic Ecosystems Branch, Newforge 8
Lane, Belfast BT9 5PX, UK 9 c University of Helsinki, Kilpisjärvi Biological Station, Faculty of Biological and Environmental 10
Sciences, Viikinkaari 9, Helsinki, Finland 11 d Northern Ireland Environment Agency (NIEA), Biodiversity Unit, Klondyke Building, Gasworks 12
Business Park, Lower Ormeau Road, Belfast BT7 2JA, UK 13 e National Parks & Wildlife Service (NPWS), Department of Arts, Heritage and the Gaeltacht, 7 Ely 14
Place, Dublin 2, Ireland 15 f Environment and Sustainability Institute, University of Exeter, Penryn Campus, Penryn, Cornwall 16
TR10 9EZ, UK 17 g School of Biological Sciences, Queen’s University Belfast, Belfast BT9 7BL, UK 18
19
∗ Corresponding author at: Quercus, School of Biological Sciences, Queen’s University 20
Belfast, Belfast BT9 7BL, Northern Ireland (UK). Tel.: +44 28 9097 2281. 21
E-mail address: [email protected] (N. Reid). 22
23
Keywords: Distribution; EC Habitats Directive; Trans-boundary; Population estimation; 24
Range; Spraint surveys. 25
26
Page 3
2
ABSTRACT 27
Throughout the European Union, the EC Habitats Directive requires that member states 28
undertake national surveillance of designated species. Despite biological connections 29
between-populations across- borders, national assessments need not be co-ordinated in any 30
way. We conducted a trans-boundary assessment of the status of Eurasian otters (Lutra lutra) 31
aimed at providing consistency across a single biogeographical unit, i.e. the island of Ireland, 32
comprising two states, i.e. the Republic of Ireland and the United Kingdom (Northern 33
Ireland). Our aim was to ensure consistency with previous assessments conducted separately 34
in each state, and permit each Government to fulfil their separate statutory reporting 35
commitments. The species range increased by 23% from 1996–2006 and 2007–11. The 36
population estimate of 9400 [95%CI 8700–12,200] breeding females during 2010/11 was not 37
significantly different from 8300 [95%CI 7600–9800] breeding females established as a 38
baseline during 1981–82. Modelling of species-habitat associations suggested that available 39
habitat was not limiting and no putative pressures recorded at sites surveyed negatively 40
affected species occurrence. Thus, under the statutory parameters for assessing a species’ 41
conservation status, i.e. range, population, habitat and future prospects, the otter was judged 42
to be in ‘Favourable’ status throughout Ireland and in both discrete political jurisdictions. 43
Thus, we provide a trans-boundary test case for EU member states that share habitats and 44
species across ecoregions, ensuring conservation assessment data are standardised, 45
synchronised, spatially consistent and, therefore, biologically relevant without compromising 46
legal and administrative autonomy within separate jurisdictions. 47
48
Page 4
3
1. Introduction 49
International, coordinated, monitoring programmes for species of conservation concern are 50
essential in creating population measures for tracking changes in biodiversity, particularly 51
where global factors interact with regional habitat loss and fragmentation (Pereira and 52
Cooper, 2006; Schmeller, 2008; Henle et al., 2013). The EC Directive on the Conservation of 53
Natural Habitats and of Wild Fauna and Flora (92/43/EEC), hereafter referred to as the 54
Habitats Directive, requires that EU member states conduct surveillance of the conservation 55
status of natural habitats and species (Article 11) and to report on the implementation of the 56
Directive, including surveillance, every 6 years (Article 17). Each sovereign nation reports 57
separately to the European Commission despite sharing habitats, species and often common 58
borders with their neighbouring countries. Moreover, despite guidance on common standards 59
monitoring, states can adopt various approaches to monitoring: surveys need not be 60
temporally synchronised, survey effort can be spatially heterogeneous and different sources 61
of data can be used, leading to spatiotemporal discontinuities in the quantity and quality of 62
assessments. Clearly, such a discrete and jurisdictional approach could lead to 63
biogeographical regions shared by member states drawing on inconsistent or incomplete data 64
in making their assessments due to: divergent ecological trends within different areas; or, 65
application of differing methods and/or interpretation of monitoring results. Thus, 66
international conservation assessments of species and habitats could benefit from 67
standardised surveillance throughout the range of target species or habitats (Schmeller, 2008). 68
The Eurasian otter (Lutra lutra L. 1758) is listed in Annex II of the Habitats Directive and 69
as such requires detailed surveillance. Otters underwent a dramatic decline throughout 70
Europe during the 20th century (Mason and MacDonald, 1986), linked principally to the 71
bioaccumulation of polychlorinated biphenyl (PCB) pesticides (Gutleb and Kranz, 1998; 72
Mason and Wren, 2001) but also declines in water quality, changes to watercourses, 73
Page 5
4
landscape intensification and invasive species (Kruuk, 1995; Chanin, 2013). The otter is 74
currently listed by the International Union for the Conservation of Nature (IUCN) as ‘near 75
threatened’ (Ruiz-Olmo et al., 2008). Otters are elusive and nocturnal, thus monitoring uses 76
species inci- dence data derived indirectly from field signs. Otter surveillance started during 77
the late 1970s and so pre-dates the Habitats Directive (West, 1975; Macdonald and Mason, 78
1976; Lenton et al., 1980). 79
The Standard Otter Survey method developed by Lenton (1980) is typically comprised of 80
a search of 600 m of river bank for otter spraint. Changes in the frequency of positive sites 81
have often been taken as an indication of changes in abundance (Jefferies, 1986). 82
Consequently, this approach to otter surveillance has been adopted by most European 83
countries as the basis of their reporting commitments. Recent research has shown that the 84
Standard Otter Survey method is highly biased by surveyor experience and search effort, the 85
volume of rainfall in the week before survey and the number of bridges present on the survey 86
stretch of river calling into question its validity in determining temporal trends in abundance 87
(Parry et al., 2013; Reid et al., 2013a). Specifically, spatial or temporal trends within- or 88
between-countries could be entirely attributable to varying sources of survey bias. 89
The previous Article 17 conservation assessment for otters in the Republic of Ireland was 90
deemed as unfavourable inadequate U1 or poor (NPWS, 2008), principally due to a decline in 91
species incidence from 92.5% (Chapman and Chapman, 1982) to 70.5% (Bailey and 92
Rochford, 2006) translating into a 24% decline in estimated numbers from 8400 to 6400 adult 93
breeding females (Marnell et al., 2011). In contrast, data for Northern Ireland was reported 94
under a submission covering the United Kingdom, which judged the otter as favourable or 95
good (JNCC, 2007) due to a 527% increase in species incidence in England and a 268% 96
increase in Wales (due to recent recolonization after local extirpation) with concomitant 97
increases in overall estimated abundance despite an apparent decline from 72.4% (Chapman 98
Page 6
5
and Chapman, 1982) to 62.5% (Preston et al., 2006) in site occupancy throughout Northern 99
Ireland. Great Britain and Northern Ireland, whilst forming the United Kingdom, represent 100
distinct biogeographical ecoregions and thus the ecological relevance of changes in Northern 101
Ireland otter numbers was lost by regional inclusion with Great Britain. Moreover, no formal 102
comparative assessment of temporal trends in otter status has been made between Northern 103
Ireland and the Republic of Ireland even though they are more comparable and more 104
ecologically relevant to one another. 105
We aimed to conduct a conservation assessment for the otter, using Habitats Directive 106
parameters, throughout the island of Ireland treating it as a single ecoregion. 107
108
2. Methods 109
A total of 1229 survey sites were selected throughout Ireland (853 in the Republic of Ireland 110
and 377 in Northern Ireland) from three key habitats: flowing freshwater, representing rivers, 111
streams and canals (n = 999), static freshwater representing lakes and reservoirs (n = 59) and 112
coastal sites (n = 171). Sites included 525 sites surveyed previously in the Republic of Ireland 113
(Bailey and Rochford, 2006) and 377 sites surveyed previously in Northern Ireland (Preston 114
et al., 2006). An additional 327 sites were added to fill in gaps in the distribution including a 115
greater proportion of coastal sites which were under-represented in previous surveys. New 116
sites were situated on separate rivers at least 5 km apart and from existing survey sites to 117
provide spatial independence. Sites in the Republic of Ireland were surveyed by 75 118
conservation rangers from the National Parks & Wildlife Service (NPWS), whilst sites in 119
Northern Ireland were surveyed by two ecologists from Queen’s University Belfast. Surveyor 120
training courses were held to standardise data collection whilst providing a demonstration of 121
the survey protocol in the field. Surveys were based on the ‘Standard Otter Survey’ method 122
(Lenton et al., 1980) in which a 600 m stretch of river was selected and one bank walked 123
Page 7
6
searching exposed boulders, bridge footings and the bankside for otter spraint. The method 124
was modified at lakes and the coast to include 600 m of shoreline. 125
Methods for assessing conservation status have been devised by the European Topic 126
Centre for Nature Conservation (ETCNC) in conjunction with EU member states represented 127
on the Scientific Working Group of the Habitats Directive (Evans and Arvela, 2011). The 128
conservation status of a species is assessed on four parameters scored objectively: i) range; ii) 129
population; iii) habitat; and iv) future prospects. Conservation status is defined as “the sum of 130
the influences acting on the species concerned that may affect the long- term distribution and 131
abundance of its populations”. A standard format for reporting, but not data collection, was 132
agreed at a European level during 2006 (European Commission, 2006). The format involves 133
the application of a traffic-light system and brings together information on the four 134
parameters to be assessed. Each parameter is classified as being ‘favourable FV’ or ‘good’ 135
(green), ‘unfavourable inadequate U1’ or ‘poor’ (amber), ‘unfavourable U2’ or ‘bad’ (red) 136
and ‘unknown’ (grey). A species is taken as favourable only when: i) population dynamics 137
data on the species concerned indicate that it is maintaining itself on a long-term basis as a 138
viable component of its natural habitats; ii) the natural range of the species is neither being 139
reduced nor is likely to be reduced for the foreseeable future; and, iii) there is, and will 140
probably continue to be, a sufficiently large habitat to maintain its populations on a long-term 141
basis. Favourable reference values for range and population are set as targets against which 142
future values can be judged. These reference values have to be at least equal to the value 143
when the Habitats Directive came into force i.e. in 1994. The ‘Favourable Reference Range’ 144
for a species is the geographic range within which it occurs and which is sufficiently large to 145
allow its long-term persistence. The major pressures and threats perceived to be affecting the 146
species are listed during each assessment. Their status, projected status and observed impacts 147
Page 8
7
are used to determine the species’ likely future prospects. If any one of the four parameters 148
are assessed as unfavourable, then the overall assessment for the species is also unfavourable. 149
150
2.1. Range 151
The previous Article 17 report under the Habitats Directive established a baseline Favourable 152
Reference Range for the otter between the implementation of the Directive and the 153
submission of the first report covering the 13 year period from 1993 to 2006. The species 154
range was described at a 10-km square scale consistent with methods adopted by species 155
atlases. The Directive requires reporting every 6 years constraining the period during which 156
the current distribution (i.e. occupied 10-km grid cells) could be assessed, that is, the 4 year 157
period from 2007 to 2011. This necessarily constrained the methodology that could be 158
employed to describe changes in the distribution of the otter. Species records from the current 159
survey were augmented with those from multiple sources including the Centre for 160
Environmental Data and Recording (CEDaR), the National Biodiversity Data Centre 161
(NBDC), the Environmental Protection Agency (EPA), National Parks and Wildlife Service 162
(NPWS), Northern Ireland Environment Agency (NIEA), members of the public and 163
www.biology.ie (courtesy of Paul Whelan). Otter distribution during 2007–2011 was 164
compared to that recorded at baseline during 1993–2006 using a 2 × 2 contingency x2 test of 165
association and the difference expressed as percentage change. Power analysis based on a x2 166
distribution, was used to calculate the number of occupied squares needed during future 167
surveys so as to demonstrate no significant decline from the current survey. 168
169
2.2. Population 170
The aim of this paper was to conduct a conservation assessment for the otter in Ireland that 171
would fulfil the requirements of EC Habitat Directive; including an assessment of population 172
Page 9
8
change. We did not aim to either evaluate previous population assessment methods or 173
develop new (and thus non-directly comparable) methods. A baseline population estimate 174
was taken from the first national otter survey of Ireland during 1981–82 (Chapman and 175
Chapman, 1982); back calculated by Ó Néill (2008) and peer-reviewed and published by 176
Marnell et al. (2011). Baseline total abundance of adult breeding females was taken as 8300 177
[95%CI 7600–9800] individuals (Ó Néill, 2008; Marnell et al., 2011). Thus, we followed 178
their methods as closely as possible to provide temporal comparability with the previous 179
population estimate. Specifically, female otter abundance was estimated based on habitat- and 180
productivity-specific density (individuals km−1) described in Table 1. The total length of 181
riparian corridor (streams, rivers, lake edge) and coastline was calculated using a line vector 182
shapefile and ArcGIS 10.1 (ESRI, California, USA). Streams were categorised as <2 m and 183
2–5 m whilst rivers were categorised as 5–10 m, 10–20 m, 20–40 m and >40 m in Northern 184
Ireland where data were available from the Northern Ireland Environment Agency (shapefile 185
dated 11/08/2006). Linear data for riparian length for the Republic of Ireland were obtained 186
from the National Parks & Wildlife Service (shapefile dated 28/10/2008) but width had to be 187
based on mean estimates from ground-truthed data gathered during previous otter surveys 188
(Chapman and Chapman, 1982; Bailey and Rochford, 2006) where streams were estimated to 189
be on aver- age 4.2 m wide and rivers 12.9 m wide. Typically, otters do not forage >80 m 190
from river banks or lake or coastal shores (Kruuk and Moorhouse, 1991). Consequently, 191
rivers >80 m wide were taken as representing two banks rather than one (as assumed for all 192
rivers <80 m). Similarly, lake or coastal lines were mapped with a 80 m line length 193
resolution, whereby edge habitats were treated as coincident when they were within 80 m of 194
each other as they gave access to the same foraging habitat. 195
Page 10
9
Streams, rivers, and lakes were further classified according to their trophic status, as 196
defined by their levels of orthophosphate (low productivity = 0.00–0.02 mg l−1; intermediate 197
productivity = 0.02–0.04 mg l−1 and high productivity >0.04 mg l−1). 198
Measurements of orthophosphate in water were derived from 2177 sites throughout 199
Ireland from 2008 to 2010 collected by the Environmental Protection Agency in the Republic 200
of Ireland and the Water Management Unit, Northern Ireland Environment Agency in 201
Northern Ireland. Values were interpolated for areas with no measurements using the Kriging 202
tool in Spatial Analyst for ArcGIS. Densities were subsequently adjusted according to 203
altitude following the proportions identified by Ruiz-Olmo (1998). Coastal density was 204
classified according to the underlying geology derived from the All Ireland Bedrock Map 205
obtained from the Geological Survey of Ireland and was assumed to be independent of 206
produc- tivity (Ó Néill, 2008). Mean density of otters (adult females.km2) was calculated per 207
River Basin District and plotted using ArcGIS to demonstrate regional variation. 208
Breeding female otters have more stable home ranges than males or juveniles (Kruuk, 209
1995, 2006). Sex ratios of adult otter populations are rarely 1:1 (male:female), as might be 210
expected for mammals at birth, but range widely e.g. 1:1 (Hung et al., 2004), 1.2:1 (Hájková 211
et al., 2011), 1.3:1 (Philcox et al., 1999), 1.4:1 (Dallas et al., 2003 from carcasses), 1.5:1 212
(Dallas et al., 2003 from spraint) and 3.6:1 (Lanszki et al., 2009). Thus, estimating adult 213
female abun- dance was deemed more reliable than estimating total abundance by 214
multiplying female numbers by a factor of 2. 215
216
2.3. Habitat and future prospects 217
Surveyor, rainfall in the week prior to survey and the number of bridges on each 600 m 218
stretch of river have been shown to strongly negatively bias the Standard Otter Survey 219
method (Reid et al., 2013a). Thus, each of these three variables was included in analysis of 220
Page 11
10
otter incidence. A further 28 variables were listed as perceived pressures extracted and 221
modified from O’Sullivan (1996) and Foster-Turley et al. (1990) who listed major and 222
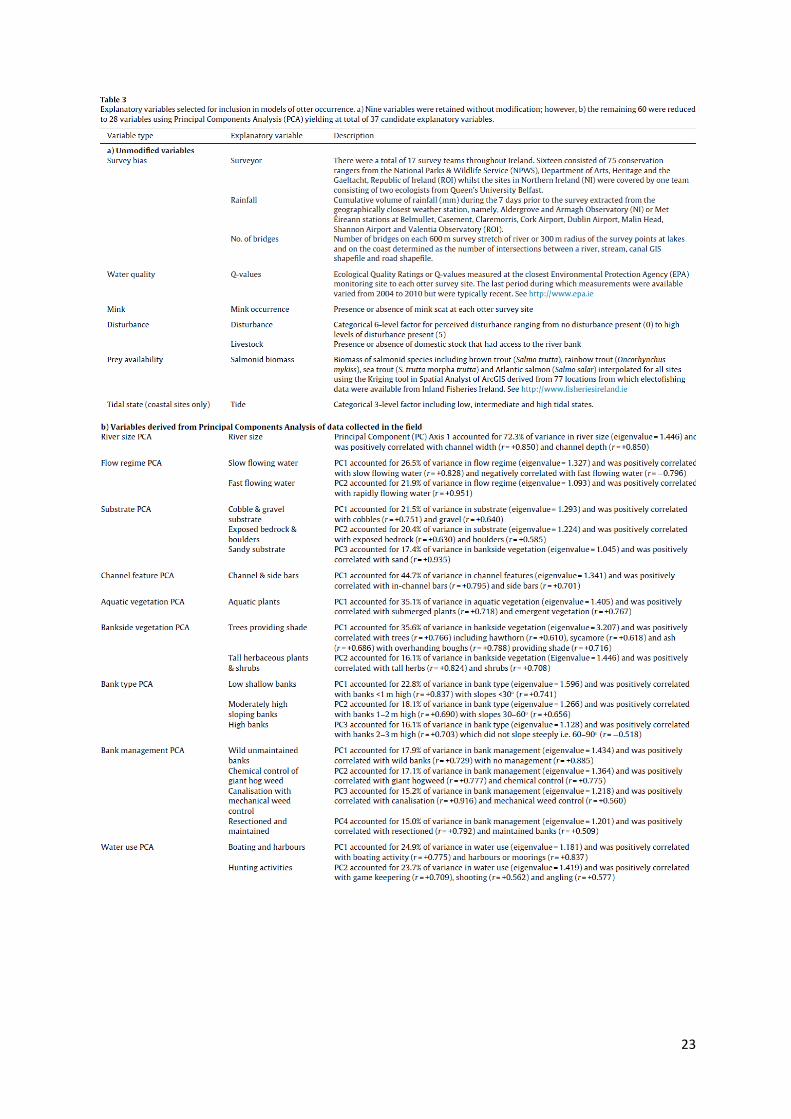
specific threats to otters as recorded in 29 European countries/regions (Table 2). Only 9 such 223
pressures were recorded at >10% of sites and retained for inclusion in analysis. A further 69 224
habitat (both aquatic and terrestrial) variables were recorded during the survey describing 225
river size, flow regime, substrate, prey availability, bank type and management, vegetation, 226
water use and adjacent landcover. Of these, 9 were deemed ecologically relevant enough for 227
inclusion in analysis without modification (Table 3a), whilst the remaining 60 were reduced 228
by a series of Principal Components Analyses (PCA) to 28 variables (Table 3b) yielding a 229
final total of 37 candidate explanatory variables. 230
Variance in otter occurrence was examined within each habitat type (rivers, lakes and the 231
coast) using Generalized Linear Models (GLMs) assuming a binomial error structure and a 232
logit link function where otter occurrence (presence or absence) was fitted as the dependent 233
variable. All candidate explanatory variables were tested for multicollinearity. One of each 234
pair of significant bivariates (r > 0.5); the one with the weakest correlation coefficient with 235
otter presence, was removed to ensure that all tolerance values were >0.1 and all variance 236
inflation factor values were <10.0 (Quinn and Keough, 2002). To allow the direct comparison 237
of regression coefficients, variables were standardised to have a x¯ = 0 and a a = 1 prior to 238
analysis. All possible model permutations were created and ranked using AIC values. The 239
Akaike weight (ωi) of each model was calculated within the top set of N models, where the 240
value of ΔAIC ≤ 2 units (Burnham and Anderson, 2002). The ωi of each model is the relative 241
likelihood of that model being the best within a set of N models. To calculate the importance 242
of each variable relative to all other variables, the Σωi of all models within the top set of 243
models that contained the variable of interest was calculated and the variables ranked by Σωi 244
(McAlpine et al., 2006); the larger the value of Σωi (which varies between 0 and 1), the more 245
Page 12
11
important the variable. Multimodel inference and model averaging was used to determine the 246
effect size (β coefficient) of each variable across the top set of models (Burnham and 247
Anderson, 2002). Variables that had equal Σωi values were ranked in order of the magnitude 248
of their model averaged regression coefficients. 249
250
3. Results 251
Otters were widespread throughout Ireland during 1993–2006(Fig. 1a). Their baseline range 252
in the Republic of Ireland was665 × 10 km cells and in Northern Ireland was 170 cells. Otters 253
remained widespread during 2007–2011 (Fig. 1b). Their current range in the Republic of 254
Ireland was 870 cells, representing a significant 52% increase (Х2df=1= 11.3, p < 0.001) and 255
in North-ern Ireland was 189 cells, representing a marginal 6% increase (Х2df=1= 2.8, p = 256
0.09; Fig. 1c). As their current distribution was larger than that recorded at baseline, the range 257
was revised and when reassessed on an All-Ireland scale all 1015 cells available for 258
occupation were deemed suitable for the species. During 2007–2011, otters were recorded in 259
707 cells (70%) of their All-Ireland range. Power analysis suggested that the target for future 260
surveys should be to record the otter as present in 160–182 cells in Northern Ireland, 504–581 261
cells in the Republic of Ireland or 666–746 cells throughout Ireland in order to demonstrate 262
no significant change (p < 0.05) in its distribution. 263
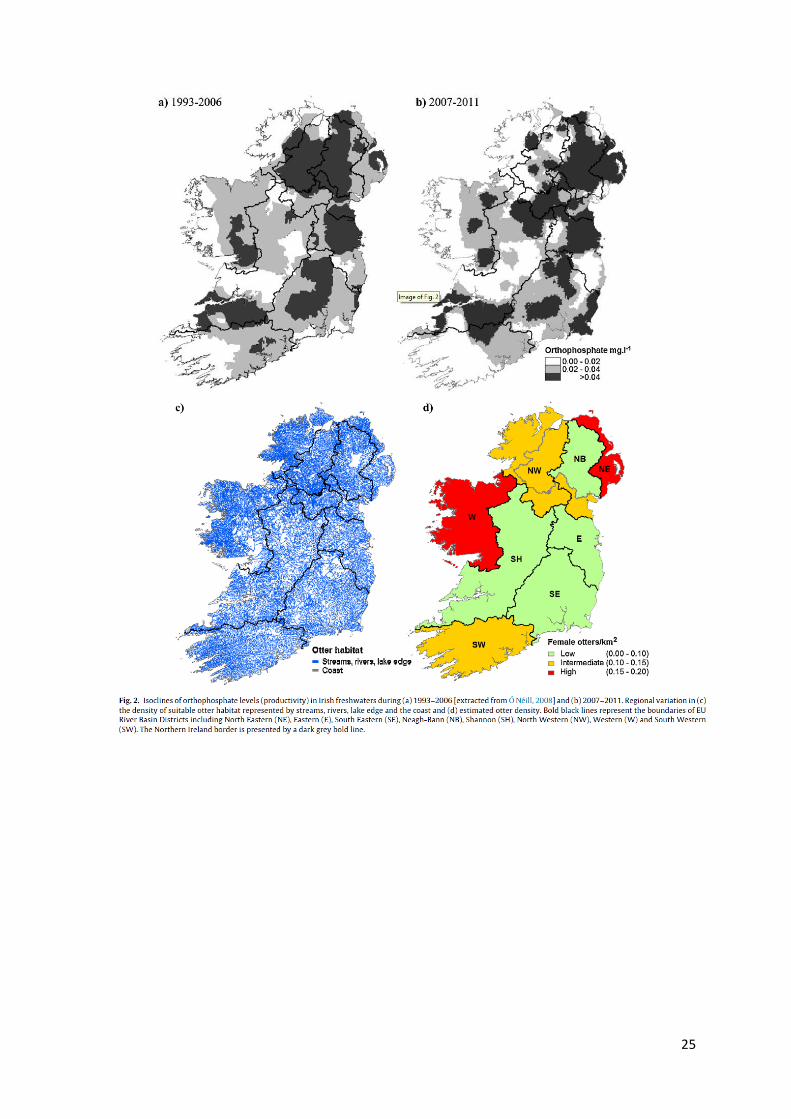
Landscape productivity throughout Ireland changed between 1993–2006 and 2007–2011 264
with areas of low orthophosphate concentration expanding west-to-east replacing some areas 265
of intermediate productivity, although eastern and southern areas of high productivity 266
remained largely stable due to association with intensive agriculture (Fig. 2a and b). The 267
density of suitable habitat for otters (streams, rivers and lake edge) was highest in the 268
Western River Basin District whilst coastal complexity was high in both the Western and 269
North Eastern River Basin Districts (Fig. 2c). The total estimate of adult otter abundance 270
Page 13
12
throughout Ireland (Table 4) was 9400 (95%CI 8700–12,200) breeding females. Whilst 271
estimates of otter incidence at survey sites were largely uniform between River Basin 272
Districts (Reid et al., 2013a), variance in the occurrence and density of suitable habitat 273
resulted in regional variation in estimated otter density which was highest in the Western and 274
North Eastern River Basin Districts (Fig. 2d). 275
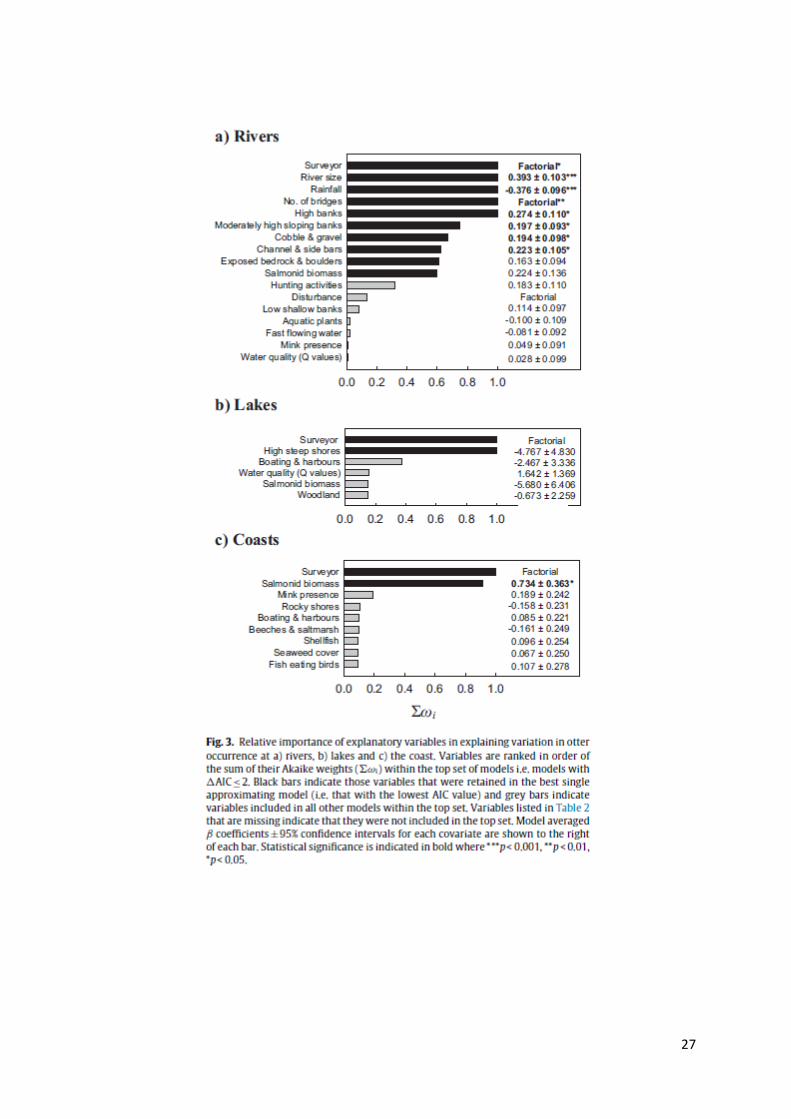
The detection of otter tracks and signs was biased by surveyor and, at rivers, the cumulative 276
volume of rain in the week prior to survey and the number of bridges present. At rivers, field 277
signs of otters were positively associated with river size (Figs. 3a and 4), banks >1 m high 278
sloping at >30◦, substrates composed of cobbles, gravel, boulders and exposed bedrock, 279
channel and side bars and salmonid biomass (Fig. 3a). There were no significant variables 280
retained in the top model of otter occurrence at lakes (Fig. 3b). Otter occurrence on the coast 281
was positively associated with the biomass of salmonids in adjacent rivers running out to sea 282
(Fig. 3c). 283
Some level of perceived disturbance (on an ordinal scale from 1 to 5) was recorded at 578 284
sites (59%) but 53% of these had a score ≤3 (intermediate levels). Sources of disturbance 285
included canal resectioning with bank maintenance at 216 sites (22%) and canalisation with 286
mechanical weed control at 110 sites (11%). Boating activity and harbours occurred at 94 287
sites (10%) whilst angling, shooting and game keepering were present at 212 sites (22%). 288
Mink were recorded at 117 sites out of 841 sites (14% occurrence). None of these perceived 289
pressures or water quality were determined as actual threats as none were retained in the top 290
models of otter occurrence, and thus had no discernible negative effect on otter occurrence in 291
either rivers, lakes or the coast (Fig. 3). 292
293
Page 14
13
4.0. Discussion 294
295
4.1. Range 296
We demonstrated not only that there has been no decline in the distribution of the otter 297
throughout Ireland, but that it’s known range is more extensive than previously reported. 298
Consequently, the range established during the baseline survey, against which future changes 299
are supposed to be measured, was reassessed to include all possible 10 km squares available 300
for occupation. All future surveys should thus be compared to the current study and not 301
baseline data. As the species remains widespread the conservation assessment parameter of 302
‘range’ was judged favourable throughout Ireland and in both political jurisdictions. 303
304
4.2. Population 305
Current estimates of species incidence for each River Basin District, corrected previously for 306
negative survey bias by Reid et al. (2013a) were used to estimate the adult breeding female 307
population during 2010–11 to be 9400 [95%CI 8700-12,200] individuals. As the 95% 308
confidence intervals between the current and baseline estimated overlapped considerably we 309
conclude that the current population was not significantly different from that estimated at 310
baseline. The same was true for the Republic of Ireland taken separately (Table 4) but the 311
population estimate for Northern Ireland increased significantly (i.e. the 95% confidence 312
intervals did not overlap) from 1100 [95%CI 1000-1400] to 1600 [95%CI 1500-2000] adult 313
females between 1981–82 and 2010–11. In any case, the conservation assessment parameter 314
of ‘population’ was judged favourable in both jurisdictions and throughout the island as a 315
whole. It is noteworthy that despite no variation in otter incidence being observed between 316
regions after correction for survey bias (Reid et al., 2013a), variation in the availability of 317
suitable habitat led to regional variation in predicted densities. Specifically, otter densities 318
Page 15
14
appeared highest in the Western and North Eastern River Basin Districts where the former 319
had a high density of streams, rivers, lakes and other inland waterways whilst both districts 320
possessed notably complex, convoluted coastlines providing greater habitat availability for 321
otters and thus supported higher densities per unit area. 322
It should be noted that population estimates were based on radiotracking studies that dated 323
from 1984 to 2008. Mammalian home range size can vary according to numerous local 324
factors e.g. habitat characteristics, human impact and landscape connectivity, all of which can 325
influence source-sink movements. Thus, caution must be used when generalising such data to 326
a country scale. More- over, the size of home ranges reported from radiotelemetry studies can 327
be influenced by methodological details which may also vary between studies e.g. the 328
duration of tracking, such that generalising over time might be an additional source of bias or 329
error. 330
331
4.3. Habitat 332
Variation in otter occurrence was more strongly influenced by bias in Standard Otter Survey 333
method (surveyor ability and search effort, rainfall and the number of bridges on each stretch 334
of river) than by landscape-scale parameters derived from a GIS- based approach (Reid et al., 335
2013a). Here, we demonstrate a broadly similar result using ground-truthed, habitat survey 336
data. It is essential to account for known biases in surveyor methodologies when analysing 337
habitat associations otherwise variation attributable to the survey method may be erroneously 338
attributed to environmental parameters which may appear more important than they might 339
otherwise be in reality. Having accounted for survey biases, otter incidence was positively 340
associated with large (wide and deep) rivers with in-channel features such as bars and side 341
bars, hard substrates including gravel, cobbles, boulders and exposed bedrock with high, 342
Page 16
15
moderately sloping banks. These findings are consistent with previous studies which have 343
shown similar results (Bailey and Rochford, 2006). 344
Whilst these may represent true ecological relationships it may also be the case that 345
surveyors preferentially examine bars and side bars or boulders and exposed bedrock for 346
spraint. If the bank was tall and sloping it may have provided a better vantage point from 347
which to search for spraint than if the bank was low and flat. Otters are known to be 348
positively associated with river width and depth (Bailey and Rochford, 2006) with larger 349
rivers supporting higher densities of individuals (Ó Néill, 2008) due to reduced competition 350
of territorial space and food resources. However, large rivers tend to have few in-channel 351
features, for example, bars and side bars or exposed boulders, whilst their depth often 352
prohibits the survey of any such features present. Thus, possible sprainting sites on large 353
rivers generally include bridge footings or boulders at the bank whilst these areas were 354
usually the only places where thorough surveys could be completed. Thus, it might be that 355
even the relationships found here may be confounded by survey bias rather than being 356
meaningful ecological associations. 357
Otter occurrence at rivers was positively influenced by salmonid biomass, derived from 358
electrofishing data in riffle habitat. Salmonids constitute, on average, 18–31% of the diet of 359
otters in Ireland (Reid et al., 2013b) though in some catchments this can be as high as 81% 360
(Fairley and Wilson, 1972). Thus, they are the single most important prey item in the diet of 361
Irish otters. Nevertheless, it has been shown that they do not actively select salmonid over 362
non-salmonid prey (Reid et al., 2013b). This may be because salmonids are present in 363
practically every waterway in Ireland with most rivers containing brown trout (Salmo trutta) 364
and many lakes stocked with rainbow trout (Oncorhynchus mykiss). Salmonid density varies 365
throughout Ireland being highest in rivers in the north- and south-west that drain into the 366
Atlantic Ocean suggesting that these areas are important in sustaining Atlantic salmon (S. 367
Page 17
16
salar) and sea trout (S. trutta morpha trutta) returning to freshwater and augmenting resident 368
salmonid numbers. Thus, otter abundance may reflect variation in salmonid abundance on a 369
very coarse scale whilst at a regional level there is little correspondence between otter and 370
salmonid populations. Otter occurrence on the coast has been shown to be positively 371
influenced by the coverage of adjacent inland freshwater-dominated landscapes, principally 372
high densi- ties of riparian corridors and standing freshwater (lakes) fringed with broad-373
leaved woodland (Reid et al., 2013a). Coastal otters are dependent on freshwater rivers for 374
bathing to maintain their fur or for foraging (Kruuk, 2006; Chanin, 2013). Certainly, coastal 375
radio-tracked otters in Co. Cork have been seen to travel upstream into freshwater systems on 376
occasions (de Jongh et al., 2010). All coastal sites surveyed in the current study were adjacent 377
to the mouth of a river or stream. Our results suggest that otters on the coast were positively 378
influenced by salmonid biomass in these adja- cent rivers supporting the previous supposition 379
that coastal otters may return to freshwater to feed. Thus, in coastal areas otters may indeed 380
actively select salmonids, principally, sea trout and salmon. 381
None of the factors that significantly influenced otter occurrence (river size, substrate 382
type, bank elevation and slope or salmonid biomass) are likely to be limiting or impacted 383
detrimentally by human activities. Consequently, the conservation assessment parameter of 384
‘habitat’ was judged favourable throughout Ireland. 385
386
4.4. Future prospects 387
It was notable that otter occurrence was unaffected by water quality (Q-values), perceived 388
levels of disturbance, mink occurrence or water use. Other pressures such as by-catch in 389
fishing gear and road kill may be important locally but were not considered to be significant 390
threats to the long-term persistence of the species regionally or at the national level, 391
especially considering the widespread distribution of the species. Consequently, the 392
Page 18
17
conservation assessment parameter of ‘future prospects’ was judged favourable throughout 393
Ireland. 394
395
5. Conclusions 396
The conservation status of the otter in the Republic of Ireland, Northern Ireland and 397
throughout the island was judged Favourable. The previous Article 17 assessment from 1993 398
to 2006 for the Republic of Ireland (NPWS, 2008) was deemed Poor indicating an improving 399
trend. However, this was considered to be due to improved knowledge and more accurate 400
data rather than a real temporal trend (also see Reid et al., 2013a). We recommend that a 401
formal trans-boundary assessment is submitted for the next Article 17 report and strongly 402
advocate that neighbouring EU member states that share habitats and species across 403
comparable ecoregions should work together to standardise and synchronise monitoring and 404
surveillence regimes to ensure conservation assessment data are biologically meaningful. 405
406
Acknowledgements 407
This study was part-funded by the National Parks & Wildlife Service (NPWS), Department 408
of Arts, Heritage and the Gaeltacht (DAHG) covering the Republic of Ireland and part-409
funded by the Northern Ireland Environment Agency (NIEA) via the Natural Heritage 410
Research Partnership (NHRP) with Quercus, Queen’s University Belfast (QUB). We also 411
thank landowners and farmers throughout Ireland who allowed access to their land.412
Page 19
18
References 413
92/43/EEC, 1992. Conservation of Natural Habitats and of Wild Fauna and Flora. 414
http://ec.europa.eu/environment/nature/legislation/habitatsdirective Last accessed 09/10/2013. 415
Bailey, M., Rochford, J., 2006. Otter Survey of Ireland 2004/2005. Irish Wildlife Man- uals No. 23. 416
National Parks and Wildlife Service, Department of Environment, Heritage and Local 417
Government, Dublin. 418
Burnham, K.P., Anderson, D.R., 2002. Model Selection and Multimodel Inference: A Practical 419
Information-Theoretic Approach, second ed. Springer-Verlag, New York. 420
Chanin, P., 2013. Otters. Whittet Books Ltd, Stansted. 421
Chapman, P.J., Chapman, L.L., 1982. Otter survey of Ireland 1980-81. The Vincent Wildlife Trust, 422
London. 423
de Jongh, A., O’Neill, L., de Jongh, T., 2010. Coastal otters (Lutra lutra) in Roaringwater bay, 424
Ireland. National Parks and Wildlife Service, Department of Environment, Heritage and Local 425
Government, Dublin. 426
Dallas, J.F., Coxon, K.E., Sykes, T., Chanin, P.R.F., Marshall, F., Carss, D.N., Bacon, P.J., Piertney, 427
S.B., Racey, P.A., 2003. Similar estimates of population genetic com- position and sex ratio 428
derived from carcasses and faeces of Eurasian otter Lutra lutra. Mol. Ecol. 12, 275–282. 429
Durbin, L., 1996. Individual differences in spatial utilisation of a river-system by otters (Lutra lutra). 430
Acta Theriol. 41, 137–147. 431
European Commission, 2006. Assessment, monitoring and reporting under Article 17 of the Habitats 432
Directive: Explanatory Notes & Guidelines, http://www.artdata.slu.se/filer/gybs/notes guidelines 433
report art17 final.pdf Last accessed 09/10/2013. 434
Evans, D., Arvela, M., 2011. Assessment and Reporting under the Habitats Directive. European Topic 435
Centre on Biological Diversity, Paris, France 436
http://bd.eionet.europa.eu/activities/Reporting/Article 17/reference portal 437
Fairley, J.S., Wilson, S.C., 1972. Autumn food of otters on the Agivey River, Co. Lon- donderry, 438
Northern Ireland. J. Zool. 166, 468–469. 439
Foster-Turley, P., Macdonald, S.M., Mason, C.F., 1990. Otters an Action Plan for Conservation. 440
International Union for the Conservation of Nature, Gland, Switzerland. 441
Green, J., Green, R., Jefferies, D.J., 1984. A radio-tracking survey of otters (Lutra lutra) on a 442
Perthshire river system. Lutra 27, 85–145. 443
Gutleb, A.C., Kranz, A., 1998. Estimation of polychlorinated biphenyl (PCB) levels in livers of the 444
otter (Lutra lutra) from concentrations in scats and fish. Water Air Soil Poll 106, 481–491. 445
Hájková, P., Zemanová, B., Roche, K., Hájek, B., 2011. Conservation genetics and non- invasive 446
genetic sampling of Eurasian otters (Lutra lutra) in the Czech and Slovak republics. In: 447
Page 20
19
Proceedings of Xth International Otter Colloquium, IUCN Otter Spec Group Bull. 28A, pp. 127–448
138. 449
Henle, K., Bauch, B., Auliya, M., Külvik, M., Pe’er, G., Schmeller, D.S., Framstad, E., 2013. 450
Priorities for biodiversity monitoring in Europe: a review of supranational policies and a novel 451
scheme for integrative prioritization. Ecol. Indic. 33, 5–18. 452
Hung, C.M., Li, S.H., Lee, L.L., 2004. Faecal DNA typing to determine the abundance and spatial 453
organisation of otters (Lutra lutra) along two stream systems in Kinmen. Anim. Conserv. 7, 301–454
311. 455
Jefferies, D.J., 1986. The value of otter Lutra lutra surveying using spraints: An analysis of its success 456
and problems in Britain. Otters 1, 25–32. 457
JNCC, 2007. Second Report by the UK under Article 17 on the implementation of the Habitats 458
Directive from January 2001 to December 2006. Joint Nature Con- servation Committee, 459
Peterborough, http://jncc.defra.gov.uk/page-4060 Last accessed 09/10/2013. 460
Kruuk, H., 1995. Wild Otters. Predation and populations. Oxford University Press, Oxford. 461
Kruuk, H., 2006. Otters, ecology, behaviour and conservation. Oxford University Press, Oxford. 462
Kruuk, H., Moorhouse, A., 1991. The spatial organization of otters (Lutra lutra) in Shetland. J. Zool. 463
224, 41–57. 464
Kruuk, H., Carss, D.N., Conroy, J.W., Durbin, L., 1993. Otter (Lutra lutra) numbers and fish 465
productivity in rivers in north-east Scotland. Symp. Zool. Soc. Lond. 65, 171–191. 466
Lanszki, J., Orosz, E., Sugár, L., 2009. Metal levels in tissues of Eurasian otters (Lutra lutra) from 467
Hungary: variation with sex, age, condition and location. Chemo- sphere 74, 741–743. 468
Lenton, E.J., Chanin, P.R.F., Jefferies, D.J., 1980. Otter survey of England 1977-79. 469
Nature Conservancy Council, London. 470
Macdonald, S.M., Mason, C.F., 1976. The status of the otter (Lutra lutra L.) in Norfolk. 471
Biol. Conserv. 9, 119–124. 472
Marnell, F., Ó Néill, L., Lynn, D., 2011. How to calculate range and population size for the otter? The 473
Irish approach as a case study. IUCN Otter Spec. Group Bull. 28 (8), 15–22. 474
Mason, C.F., MacDonald, S.M., 1986. Otters. Ecology and Conservation. Cambridge University 475
Press, New York. 476
Mason, C.F., Wren, C.D., 2001. Carnivora. In: Shore, R., Rattner, B. (Eds.), Ecotoxicology of Wild 477
Mammals. Wiley, Chichester, pp. 315–370. 478
McAlpine, C., Rhodes, A.J.R., Callaghan, J., Bowen, M.E., Lunney, D., Mitchell, D.L., Pullar, D.V., 479
Pssingham, H.P., 2006. The importance of forest area and configura- tion relative to local habitat 480
factors for conserving forest mammals: a case study of koalas in Queensland, Australia. Biol. 481
Conserv. 132, 152–165. 482
NPWS, 2008. The status of EU protected habitats and species in Ireland. National Parks and Wildlife 483
Service, Dublin, Ireland. 484
Page 21
20
Ó Néill, L., 2008. Population dynamics of the Eurasian otter in Ireland. Integrating density and 485
demography into conservation planning. Unpublished PhD thesis. Trinity College, Dublin. 486
O’Sullivan, W.M., 1996. Otter conservation: factors affecting survival, with particular reference to 487
drainage and pollution within an Irish river system. In: Reynolds, 488
J.D. (Ed.), The Conservation of Aquatic Systems. Royal Irish Academy, Dublin, pp. 117–133. 489
Parry, G.S., Bodger, O., McDonald, R.A., Forman, D.W., 2013. A systematic re-sampling approach to 490
assess the probability of detecting otters Lutra lutra using spraint surveys on small lowland rivers. 491
Ecol. Inform. 14, 64–70. 492
Pereira, H.M., Cooper, D., 2006. Towards the global monitoring of biodiversity loss. 493
Trends Ecol. Evol. 21, 123–129. 494
Philcox, C.K., Grogan, A.L., Macdonald, D.W., 1999. Patterns of otter (Lutra lutra) road mortality in 495
Britain. J. Appl. Ecol. 36, 748–762. 496
Preston, J., Prodohl, P., Portig, A., Montgomery, W.I., 2006. Reassessing Otter Lutra lutra distribution 497
in Northern Ireland. Environment and Heritage Service Research and Development Series. No. 498
06/24. Belfast. 499
Quinn, G.P., Keough, M.J., 2002. Experimental Design and Data Analysis for Biologists. 500
Cambridge University Press. 501
Reid, N., Lundy, M.G., Hayden, B., Lynn, D., Marnell, F., McDonald, R.A., Montgomery, W.I., 502
2013a. Detecting detectability: identifying and correcting bias in binary wildlife surveys 503
demonstrates their potential impact on conservation assess- ments. Eur. J. Wildlife Res. 59 (6), 504
869–879. 505
Reid, N., Thompson, D., Hayden, B., Marnell, F., Montgomery, W.I., 2013b. Review and quantitative 506
meta-analysis suggests of diet suggests the Eurasian otter (Lutra lutra) is likely to be a poor 507
bioindicator. Ecol. Indic. 26, 5–13. 508
Ruiz-Olmo, J., 1998. Influence of altitude on the distribution, abundance and ecology of the otter 509
(Lutra lutra). Symp. Zool. Soc. Lond. 71, 159–176. 510
Ruiz-Olmo, J., Loy, A., Cianfrani, C., Yoxon, P., Yoxon, G., de Silva, P.K., Roos, A., Bisther, M., 511
Hajkova, P., Zemanova, B., 2008. Lutra lutr. In: IUCN 2013. IUCN Red List of Threatened 512
Species. Version 2013. 1, http://www. iucnredlist.org/details/12419/0 Last accessed 09/10/2013. 513
Schmeller, D.S., 2008. European species and habitat monitoring: where are we now? 514
Biodivers. Conserv. 17 (4), 3321–3326. 515
West, R.B., 1975. The Suffolk otter survey. Suffolk Natural History 16, 378–388. Yoxon, P., 1999. 516
Geology and otter distribution on Skye. Dissertation. Open University, Milton Keynes, UK. 517