Page 1
COVID-19 outbreak in Italy: ICU response and patient clinical
characteristics
Prof . Giacomo Grasselli
• Associate Professor of Anesthesiology and Intensive Care Medicine, Dept of Pathophysiology and Transplantation, University of Milan
• Medical Director, Intensive Care Unit «E. Vecla», Ospedale Maggiore Policlinico Foundation, Milan
• Coordinator, Lombardy COVID-19 ICU Network
Page 2
Was this seasonal flu?
Page 3
Background
• February 20, 2020: first patient diagnosed with COVID-19 diagnosed in Lombardy
• March 11, 2020: WHO declares the SARS-CoV-2 outbreak as a pandemic
• March 20, 2020: Italy is the second most affected country in the world, after China
• Information on the clinical characteristics of critically ill pts is still limited
• In China the proportion of hospitalized pts requiring ICU care has varied from 5% to 32%
• Knowledge of the baseline characteristics and outcomes of critically ill patients is crucial for Health Care Systems preparedness
Page 4
Epidemiological situation in Italy
https://www.epicentro.iss.it/en/coronavirus/bollettino/Infografica_3giugno%20ENG.pdf
Page 5
Epidemiological situation in Italy
https://www.epicentro.iss.it/coronavirus/bollettino/Infografica_26mar%20ENG.pdf
Page 6
The case of mortality
• Testing strategy (denominator)
• Population age
• Definition of COVID-19 related deaths
Onder et al, JAMA 2020
Page 7
• February 20: a healthy 30-year-old man with atypical pneumonia unresponsive to treatment is tested positive in Codogno
• February 21: 36 new positive cases, without links to patient 1
• Pre-crisis total regional ICU capacity: 750 beds (2.9% of total hospital beds)
Emergency task force by the Government of Lombardy
Grasselli et al., JAMA March 2020
Page 8
Grasselli et al., JAMA March 2020
March 20: 1218 pts in ICU
Page 9
The response in Lombardy
• Increased ICU surge capacity to 1750 ICU beds (250 for non-COVID pts)
• Network of COVID-19 ICUs with central coordination
• Hospital Network reorganized: few hubs for specific diseases
• Stopped elective surgical procedures
• Containment measures
Grasselli et al., JAMA March 2020
Page 10
Pts admitted to COVID-19 ICUs
• 95 COVID-ICUs in 72
Hospitals
• Total patients: 3963
•Discharged: 1487
•Dead: 1440
•Currently in ICU: 1079
1079
1511
Page 11
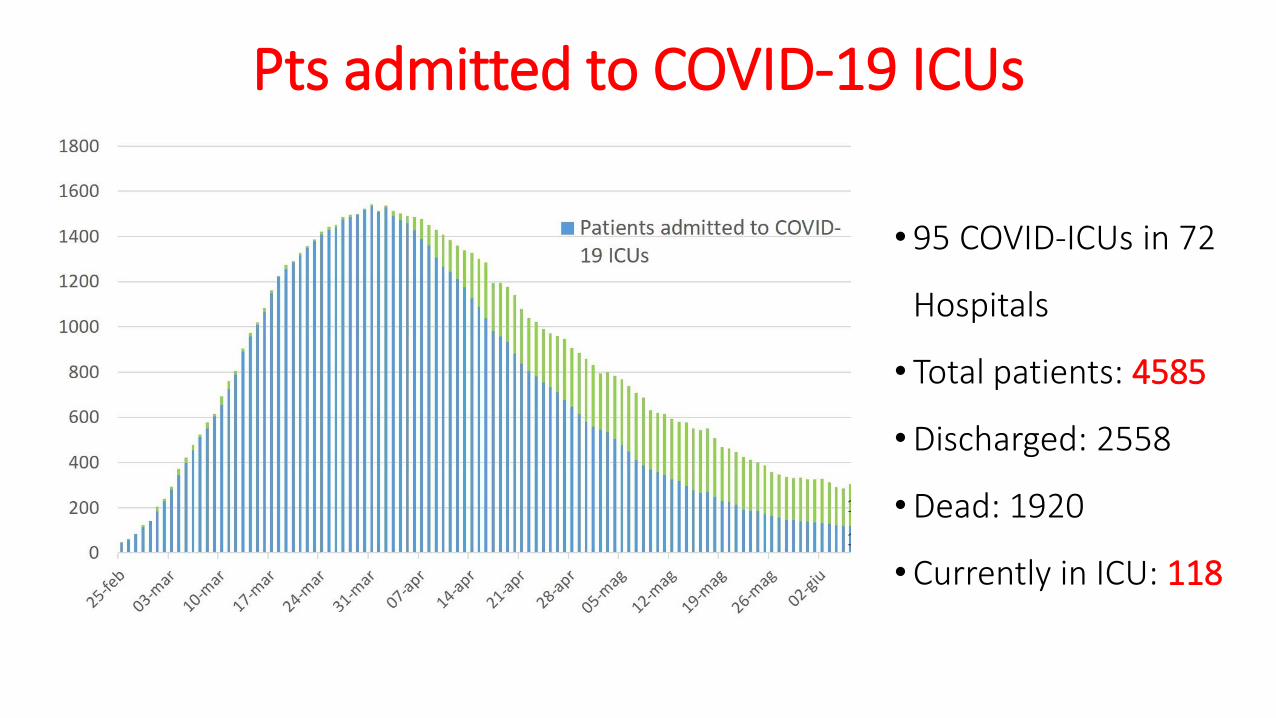
Pts admitted to COVID-19 ICUs
• 95 COVID-ICUs in 72
Hospitals
• Total patients: 4585
•Discharged: 2558
•Dead: 1920
•Currently in ICU: 118
Page 12
Pts admitted to COVID-19 ICUs
Page 13
Take-home message: GET READY!!!
• Significant mismatch between the number of pts requiring ICU admission and available ICU beds
• Increase ICU capacity and establish a network of cohorted “COVID-19 ICUs” with central coordination to optimize patient allocation
• Healthcare workers should be trained on the proper use of personal protective equipments
• Define protocols for triage and treatment of COVID-19 patients
Page 14
Clinical Presentation
• COVID-19 typically presents with systemic and/or respiratorymanifestations
• Common
‒ fever (85-90%)
‒ cough (65-70%)
‒ fatigue (35-40%)
‒ sputum production (30-35%)
‒ shortness of breath (15-20%)
Page 15
Clinical Presentation
• Attn: some individuals are asymptomatic and can act as carriers!
• LESS COMMON:
myalgia/arthralgia (10-15%)
headaches (10-15%)
sore throat (10-15%)
chills (10-12%)
pleuritic pain
• RARE:
nausea (<10%)
vomiting (<10%)
nasal congestion (<10%)
diarrhea (<5%)
palpitations (<5%)
chest tightness (<5%)
Page 16
Clinical Presentation
• 81% Mild disease: non-pneumonia and mild
pneumonia.
• 14% Severe disease: dyspnea, RR ≥ 30/min,
blood oxygen saturation (SpO2) ≤ 93%,
PaO2/FiO2 ratio or P/F < 300, and/or lung
infiltrates > 50% within 24 to 48 hours.
• 5% Critical disease: respiratory failure,
septic shock, and/or multiple organ
dysfunction (MOD) or failure (MOF)
Wu Z, McGoogan JM; JAMA 2020
Page 17
Radiological Presentation
Chest RX: patchy or diffuse asymmetricairspace opacities
Page 18
Radiological Presentation
Chest CT: ground-glassopacification with or without consolidative abnormalities, with peripheraldistribution, more likely bilateral and atlower lobes
Page 19
• Data collection: 1591 pts with confirmed SARS-CoV-2 infection admitted to
the Lombardy COVID-19 ICU Network from February 20 to March 18
• Data recorded on an electronic worksheet during daily telephone calls
• Data recorded at ICU admission: age, sex and medical comorbidities; mode
of respiratory support (PEEP, FiO2, PaO2, PaO2/FiO2); use of ECMO and
prone positioning; outcome (dead/alive/still in ICU)Grasselli et al., JAMA April 2020
Page 20
Demographic data: gender
18%
82%
similarly distributed among age groups
Critically illOverall population
CFR higher in males (15% vs 8%)
Page 21
Demographic data: age
Median (IQR): 63 (56-70) years
456
570
939
22
0
100
200
300
400
500
600
700
800
900
1000
0-19 20-40 41-60 61-80 81-100
Grasselli et al., JAMA April 2020
Page 22
Comorbidities
• 68% had at least one comorbidity
• All patients >80 years and 76% of patients >60 years had at least one comorbidity
• Hypertension was the most common comorbidity (49%)
• The second most common comorbidities were cardiovascular disease (21%), other (20%) and hypercholesterolemia (18%)
• Only 4% had a previous history of COPD
Grasselli et al., JAMA April 2020
Page 23
Respiratory support
• Among 1300 patients with available data, 99% needed respiratory support:
‒88% required mechanical ventilation
‒11% required non-invasive ventilation
• At admission, 27% of patients were treated with prone ventilation (N = 875)
• Only 5 patients (1%) required ECMO (N = 498)
• Relatively high compliance (low Pplat, low ΔP) and high MV
Page 24
Respiratory supportP
EEP
(cm
H2O
)
0
2
4
6
8
10
12
14
16
18
20
22
PaO
2/F
iO2
(mm
Hg)
50
100
150
200
250
300
350
400
450
500
550
Median: 14 (12-16) mmHg Median 70% Median: 160 (114-220) mmHg N = 999
Not statistically different between ages
Higher in older patients(median difference -10, P=.006)
Higher in younger patients(median difference 7, P=.02)
Grasselli et al., JAMA April 2020
Page 25
Outcome: mortality
• 920 (58%) of patients were still admitted in ICU
• 256 (16%) were discharged from ICU
• 405 (26%) had died in ICU
ICU mortality
0
10
20
30
40
50
60
70
80
90
100
Allages
00-19yrs
20-40yrs
41-50yrs
51-60yrs
61-70yrs
71-80yrs
81-90yrs
91-100yrs
ICU
de
ath
rat
e w
ith
in d
iffe
ren
t ag
e g
rou
ps
29,4
70,6
00-63 yrs 64-100 yrs
(difference -21 p<.001)
Length of stay in ICU: 9 (6-13) days
Grasselli et al., JAMA April 2020
Page 26
Outcome: ICU length of stay
N Mean ± SD Median (IQR) Min Max
Deaths 189 (34%) 8.6 ± 5.2 8 (4-12) 0 24
Discharged 173 (31%) 8.3 ± 5.4 8 (4-12) 0 24
Still in ICU 191 (35%) 16.8 ± 5.3 17 (15-20) 1 32
Total 553 11.4 ± 6.6 12 (5-17) 0 32
Pts admitted to ICU until March 8 – outcome on March 23
Page 27
ICU Hospital
All* Dead in
ICU
Discharged
from ICU
Still in
ICU
Dead in
Hospital
Discharged
from
Hospital
Still in
Hospital
No.
(%)
1715
(100)
836
(49)
865
(50)
14
(1)
915
(53)
673
(39)
127
(7)
Page 28
ICU Hospital
All* Dead in
ICU
Discharg
ed from
ICU
Still in
ICU
P Dead in
Hospital
Discharg
ed from
Hospital
Still in
Hospita
l
P
Male1398
(81)
700
(50)
688
(49)
10
(1)0.03
763
(55)
534
(38)
101
(7)0.046
Female317
(185)
136
(43)
177
(56)
4
(1)
152
(48)
139
(44)
26
(8)
Age,
median
(IQR), y
64
(56-70)
67.5
(62-73)
59
(52-66)
62
(52-65)
<0.001
**
68
(62-73)
58
(51-64)
62
(55-67)
<0.001
**
**p value for Dead vs Discharge
Page 29
ICU
All* Dead in ICU Discharged from
ICU
Still in ICU P
Dead vs
Discharged
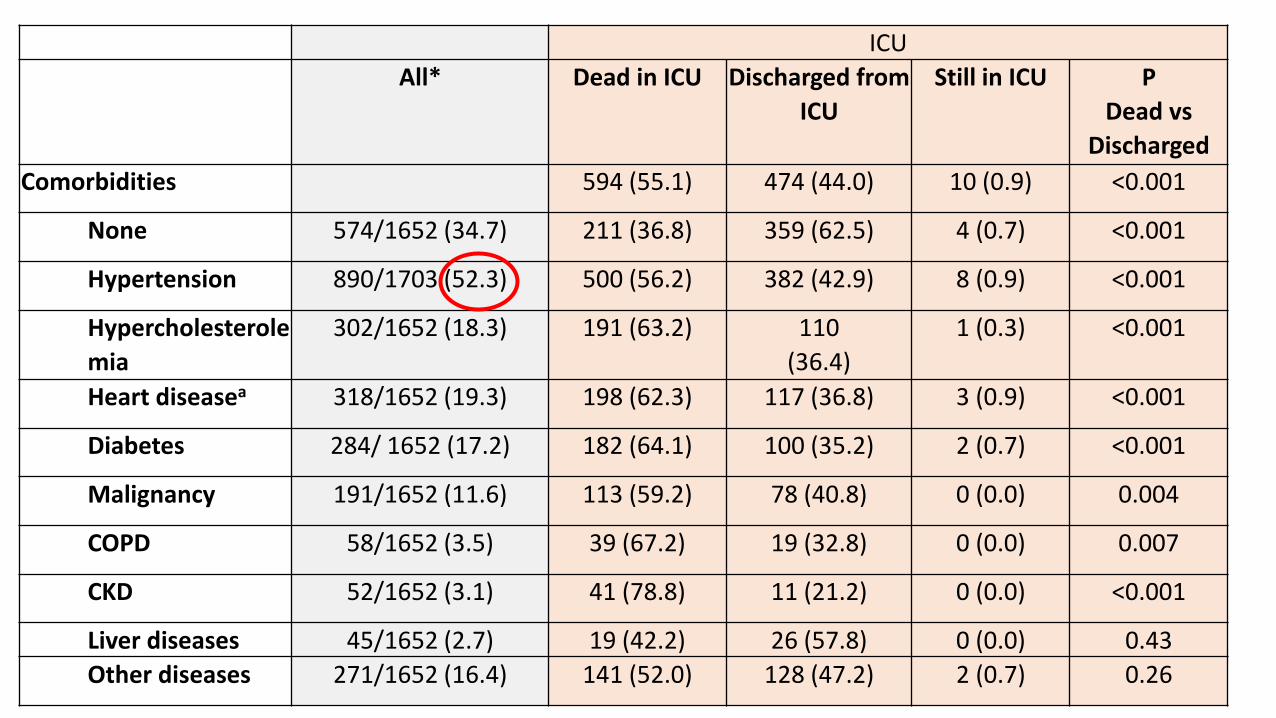
Comorbidities 594 (55.1) 474 (44.0) 10 (0.9) <0.001
None 574/1652 (34.7) 211 (36.8) 359 (62.5) 4 (0.7) <0.001
Hypertension 890/1703 (52.3) 500 (56.2) 382 (42.9) 8 (0.9) <0.001
Hypercholesterole
mia
302/1652 (18.3) 191 (63.2) 110
(36.4)
1 (0.3) <0.001
Heart diseasea 318/1652 (19.3) 198 (62.3) 117 (36.8) 3 (0.9) <0.001
Diabetes 284/ 1652 (17.2) 182 (64.1) 100 (35.2) 2 (0.7) <0.001
Malignancy 191/1652 (11.6) 113 (59.2) 78 (40.8) 0 (0.0) 0.004
COPD 58/1652 (3.5) 39 (67.2) 19 (32.8) 0 (0.0) 0.007
CKD 52/1652 (3.1) 41 (78.8) 11 (21.2) 0 (0.0) <0.001
Liver diseases 45/1652 (2.7) 19 (42.2) 26 (57.8) 0 (0.0) 0.43
Other diseases 271/1652 (16.4) 141 (52.0) 128 (47.2) 2 (0.7) 0.26
Page 30
ICU Hospital
All* Dead in
ICU
Discharged
from ICU
Still in
ICU
P
Dead vs
Discharg
ed
Dead in
Hospital
Discharged
from
Hospital
Still in
Hospital
P
Dead vs
Discharged
Time from
onset of
symptoms to
ICU admission
8 (4-11)
(N=1588)
7 (4-10)
(N=769)
8 (5-11)
(N=807)
8.5 (3.5-
10.5)
(N=12)
0.14 7 (4-10)
(N=844)
8 (5-11)
(N=631)
8 (4-11)
(N=113)
0.07
Length of ICU
stay (days)
12 (7-20)
(N=1711)
10 (5-16)
(N=836)
15 (8-24)
(N=861)
76 (74-
80)
(N=14)
<0.001*
*
10 (5-16)
N=(915)
14 (8-22)
(N=669)
33 (18-54)
(N=127)
<0.001**
Length of
Hospital stay
(days)
22 (12-42)
(N=1618)
12 (8-19)
(N=766)
39 (24-
61)
(N=838)
79 (74-
84)
(N=14)
<0.001*
*
13 (8-20)
(N=838)
37 (23-53)
(N=658)
84 (79-88)
(N=122)
<0.001**
Length of MV
(days)
10 (6-16)
(N=1171)
9 (5-15)
(N=787)
12 (7-18)
(N=370)
74 (73-
78)
(N=14)
<0.001*
*
9 (5-15)
(N=812)
11 (7-17)
(N=297)
19.5 (13-
65)
(N=62)
<0.001**
Page 31
Limitations
• Retrospective study
• Missing data (difficulty to obtain detailed information due to the critical situation in the Region)
• The follow up is still too short compared to the course of the disease
Grasselli et al., JAMA April 2020
Page 32
Conclusions
• In this case series of critically ill patients admitted to ICUs in Lombardy with
laboratory-confirmed COVID-19:
the majority of patients were older males
a large proportion required mechanical ventilation and relatively high
levels of PEEP
ICU mortality was 26%
Grasselli et al., JAMA April 2020