18
CPI Issues U.S. Department of Labor Bureau of Labor Statistics February 1980 Report 593 Digitized for FRASER http://fraser.stlouisfed.org/ Federal Reserve Bank of St. Louis
CPI Issues
U.S. Department of Labor Bureau of Labor Statistics February 1980
Report 593
Digitized for FRASER http://fraser.stlouisfed.org/ Federal Reserve Bank of St. Louis

Material contained in this publication is in the public domain and may be reproduced, fully or partially, without permission of the Federal Government. Source credit is requested but not required. Permission is required only to reproduce any copyrighted material contained herein.
Digitized for FRASER http://fraser.stlouisfed.org/ Federal Reserve Bank of St. Louis

CPI Issues U.S. Department of Labor Ray Marshall, Secretary
Bureau of Labor Statistics Janet L. Norwood, Commissioner February 1980
Report 593
Digitized for FRASER http://fraser.stlouisfed.org/ Federal Reserve Bank of St. Louis

CPI Issues
Janet L. Norwood
When prices rise, people pay increasing attention to how the government measures inflation. Workers worry about their real income. Retirees want to be sure that their pensions will buy the same package of goods and services upon which retirement plans were made. Those responsible for economic policy want to measure their success in restraining price rises. National budget makers, concerned about growing dollar outlays, worry about the effect of indexation on the country's budget.
The Consumer Price Index (CPI), the Nation's most important price index, is used for all of these needs. Al-though the index serves the Nation's users both during periods of relative price stability and in periods of rising or declining prices, questions about the accuracy of the measure always crescendo in periods like the present, when prices tend to be unresponsive to measures taken to turn them around. Therefore, it is essential that the public understand what the index is intended to measure, why it is put together the way it is, and, especially, in what areas price measurement could be improved.
The Consumer Price Index is a good measure of the changes in purchasing power of the average family repre-sented in the index. But, the CPI is not perfect. And, we know it is not appropriate for all measurement pur-poses. Because we recognize that index making is still a developing art, we are always experimenting with new approaches in order to improve the measurement of infla-tion.
Two criticisms of the index are now being widely dis-cussed: (1) That the CPI overstates the cost of living be-cause the index is based on a fixed market basket of goods and services and, therefore, does not reflect changes con-sumers make in buying habits, and (2) that the index overstates inflation because of the way it handles home-ownership. Let us examine each criticism in turn.
The fixed market basket The CPI is based on a fixed market basket. That is, the
weights for the mix of goods and services purchased during the base period are held constant from year to year until
Janet L. Norwood is the Commissioner of Labor Statistics, U.S. Department of Labor. This report was presented at the winter meeting of the National Association of Government Labor Officials in Washington, D.C., on January 21,1980.
a major revision occurs. We keep the market basket constant deliberately because we want to keep fixed the living standard represented by that market basket. Our purpose, to the extent possible, is to isolate price changes from other changes which may occur in living standards.
The economists in the Bureau of Labor Statistics, of course, know that consumers shift their purchases in response to changes in relative prices. What we do not know, however, is whether such changes in consumption patterns result in a living standard that is higher or lower than that in the base period. If the market basket were changed whenever prices change-without knowing whether the consumer is equally satisfied with the shift-we would not know whether a change in the index was caused by a change in prices or by a change in the market basket. Because a market-basket change could amount to a change in living standards, those whose income payments are ad-justed by the CPI would not be assured that their living standards would remain at the- same level. The purpose of such CPI cost-of-living adjustment (indexation) has tradi-tionally been to permit people to purchase in today's prices the bundle of goods and services they purchased in the base period, thereby leaving them at least as well off as they were then.
The following example will illustrate my point. If, in adjusting to higher prices, a family decides to forego its weekly restaurant dinner the family is both changing its market basket and lowering its satisfaction or standard of living. If the objective of indexation is to ensure pur-chasing power necessary to preserve living standards, a measure used to index income should not reflect this kind of a market-basket change.
Homeownership The present CPI homeownership component includes
the month-to-month change in prices of five expenditures of owning a home. The weights for three of these ex-penditures-property taxes, insurance, and maintenance and repairs-represent the average expenditures by all people living in their own homes during the CPI base period. Thus, the housing costs for those who purchased their homes before the base period are represented in the index only by property taxes, insurance, and maintenance and repairs. Weights for two other expenditures-house prices and contracted mortgage interest costs-are based on the
Digitized for FRASER http://fraser.stlouisfed.org/ Federal Reserve Bank of St. Louis
small group of families, roughly 6 percent of the total, who actually purchased a home in the base period. Thus, the CPI does not assume that everyone buys a new house every month; the house-price and mortgage-interest components in the CPI represent the expenditures only of those who actually purchased a house in the base period. In effect, those who purchased their own home before the base period are assumed to have no house price or mortgage interest costs at all
Because the CPI represents the cost of the base period market basket of goods and services in today's prices, the prices used for houses and the mortgage interest rates are current prices. The house-purchase and mortgage-interest components of the index, therefore, rise or fall each month, based on current prices of houses sold and of current mort-gage interest rates. This approach is entirely consistent with that used in other parts of the index, for refrigerators, stoves, apples, and oranges, for example.
Arguments for and against the current treatment of homeownership in the CPI come from people who look at the purchase of a house in different ways. They can roughly be divided into three groups:
1. Those who favor the current approach argue that most American families live in their own homes, not rented homes. They believe that the CPI should measure in today's prices the cost of the purchase of the same kind of house purchased in the base period and that owned homes should be treated in the index in exactly the same way as other items. The index should represent the price today for the proportion of expenditure on houses purchased in the base period. They argue that if a house were sold
> today and another of the same quality purchased, the consumer making the purchase would have to pay the house price prevailing today and would be forced to contract for a mortgage at the current in-terest rate. According to this view, that is exactly what the CPI should and does show. The index, they assert, correctly measures homeownership.
2. Another view of the CPI homeowner component is taken by those who argue that the index, as a mea-sure of the change in purchasing power for purposes of escalating income or determining the rate of in-flation, should not include the impact of rising prices on the value of assets such as houses. Just as the CPI excludes changes in the value of stocks and bonds, it is argued that the change in the asset value of the house (appreciation-or depreciation) and the cost of equity in holding that asset should be dis-tinguished from the change in the cost of the shelter provided by the house. It is the cost of consuming the shelter provided by the house-not the investment aspects of homeownership-which should be reflected in an index used to keep real income constant.
This is the position taken by the BLS staff during the last revision of the CPI. Bureau staff papers
pointed out that there are two empirical methods which could be used to measure the cost of the flow of housing services. The BLS did a great deal of research and experimentation on one of these methods: Estimating what economists call a "cost function" for the use of an owned home. Some felt that this method, which includes all the major com-ponents of the CPI homeownership component-prices for property taxes, insurance, home mainte-nance and repairs, and interest rates, while at the same time adjusting for the interest cost of equity and subtracting appreciation-would improve the index. It was thought that it would be acceptable to users, especially if it used current prices for each of these items, as is the case with all other parts of the index. Although some users of the CPI endorsed the Bureau's user-cost work, they asked that further research be done, especially on the procedures for estimating the equity interest term before use of this method in the CPI.
The second approach to measuring the cost of shelter, an approach which the Bureau has not yet had the resources to test, would develop a new rental-equivalence sample of prices to represent the types of homes that are owned. Such a sample would consist of homes of the same type and at the same locations as homes that are owned. Rental prices collected from this new sample could be used in the index to represent the cost of shelter provided to homeowners by their own houses. The design of a rental-equivalence sample would, of course, be quite different from the CPI rent component, which was constructed to represent all rented units, not just rental units that are typical of owned homes.
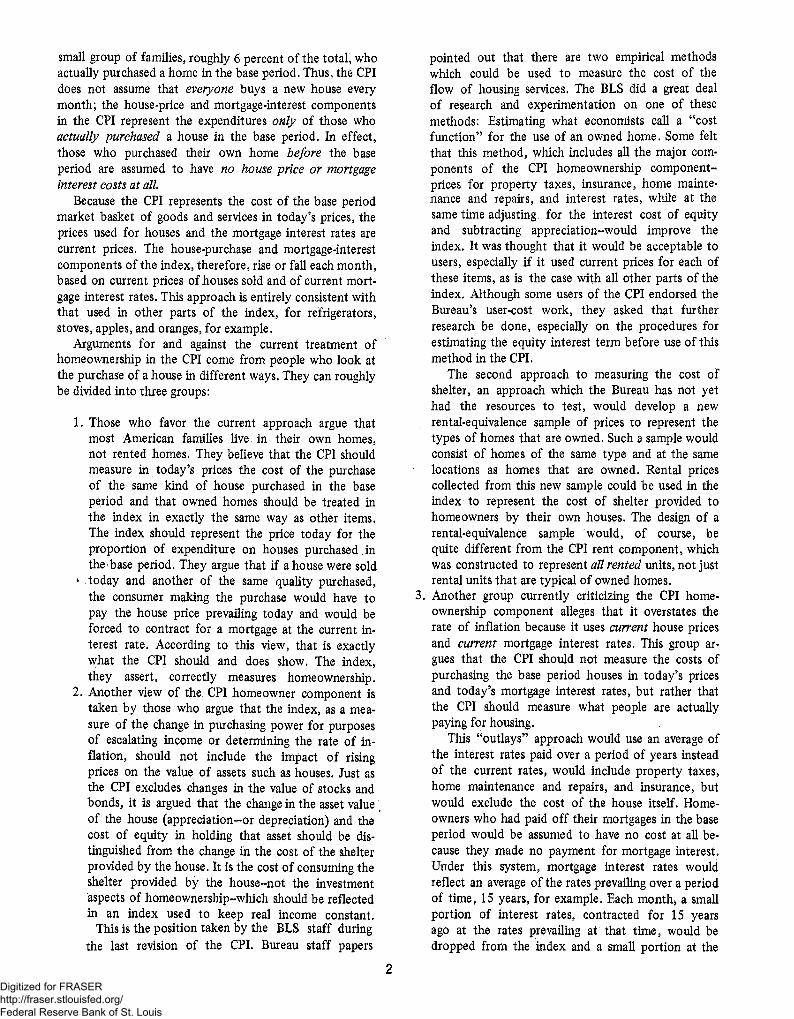
3. Another group currently criticizing the CPI home-ownership component alleges that it overstates the rate of inflation because it uses current house prices and current mortgage interest rates. This group ar-gues that the CPI should not measure the costs of purchasing the base period houses in today's prices and today's mortgage interest rates, but rather that the CPI should measure what people are actually paying for housing.
This "outlays" approach would use an average of the interest rates paid over a period of years instead of the current rates, would include property taxes, home maintenance and repairs, and insurance, but would exclude the cost of the house itself. Home-owners who had paid off their mortgages in the base period would be assumed to have no cost at all be-cause they made no payment for mortgage interest. Under this system, mortgage interest rates would reflect an average of the rates prevailing over a period of time, 15 years, for example. Each month, a small portion of interest rates, contracted for 15 years ago at the rates prevailing at that time, would be dropped from the index and a small portion at the
Digitized for FRASER http://fraser.stlouisfed.org/ Federal Reserve Bank of St. Louis

current mortgage interest rate would be added. An index calculated in this manner would be lower than the official CPI when current interest rates rise and higher when current mortgage interest rates decline. Because the current mortgage interest rate would be used only for a small portion of home-owners, the index would continue to rise even when current interest rates decline.
The foregoing review of differing views of the home-ownership component demonstrates the complexity of the conceptual and empirical issues involved in selecting the formulation to be used in the CPI. Among the alternatives, there are important differences in pricing mechanisms and large differences in the weight of homeownership relative to other components of the index. For example, the official CPI homeownership component now has a relative importance of almost 23 percent. Use of the flow-of-services concept that was proposed by the BLS staff would reduce that weight by one-half under the user-cost alterna-tive (to about 11 percent) and to about 14 percent under the rental-equivalence approach. The outlays approach currently being suggested would reduce the weight still further to a relative importance in the index somewhere between 9 and 10 percent. Such significant variations in the relative importance of shelter costs could have a large effect on the All-Items CPI, especially in a period like the present when house prices and mortgage interest rates are rising at a fast pace. This consideration, plus the lack of agreement among major users of the index, led former Commissioner Shiskin to decide, during the recent revision of the CPI, to retain-the historical treatment of the home-ownership component while continuing staff work in this field.
BLS is publishing five experimental measures using variants of these different approaches to homeownership. (See tables 1 and 2.) Tables 3 and 4 show the elements included and prices used in the official CPI and in the ex-perimental homeownership measures. Charts 1 and 2, which show 12-month percent changes in the homeowner-ship component, demonstrate how wide the measure-ment differences can be. Charts 3 and 4 use the experi-mental homeownership approaches in all-items measures and show that in the 12 months ended in December 1979, the range among the experimental measures was 2 per-centage points. For measure X-2 (user cost using current interest cost), the 13.2-percent change was about the same as in the official CPI. The percent changes in the other experimental measures were lower than in the official CPI. When one looks at these 12-month percent changes ended in each of the months of 1979, one sees a larger spread for measure X-2 (8.4 percent in January to 13.2 percent in December) than for the official CPI (9.3 to 13.3 per-cent). (See page 12 for a complete explanation of the homeownership measures.)
Further research Bureau of Labor Statistics research on the measure-
ment of homeownership began in 1970, long before the current discussion of the issue. As can be seen from the foregoing discussion, there is still considerable disagreement over the best method to measure homeownership. Because the issue is so important, the Bureau is continuing its work on homeownership measurement and will continue to publish research findings and experimental measures. We are also exploring the issues involved in development of a rental-equivalence measure so that BLS can, if resources are made available, carry out the field collection required for a full rental-equivalence index and calculate an experi-mental measure using a valid rental-equivalence component.
Further work also needs to be done on methods for developing what economists call a "constant utility" market basket. Such an approach would allow changes in the market basket while still permitting calculation of an index which holds constant the base period living standard.
This year, the Bureau began a new Continuing Consumer Expenditure Survey program. Under this program, the Bureau of the Census is collecting information on consumer expenditures on a recurring basis for the Bureau of Labor Statistics. These data will serve as the basis for revising the weights in future revisions of the CPI. The fielding of a continuing survey is an important step forward because it will provide an empirical foundation for examining changes in consumer expenditures and will become a basis for determining when a revision of the index is required.
Indexes for special purposes Users of the CPI should be aware of the many subin-
dexes which are produced as a part of the CPI system. These are published prominently in the monthly CPI news release, are used for analytical and other purposes, and, in some cases, are used for indexation. Among these subin-dexes, for example, is an index for "All items minus mort-gage interest costs" and another for "All items less energy." In addition to these and other subindexes, BLS will now be-gin regular publication of the experimental housing measures I have described. We hope that by publishing these measures, we will encourage full public discussion of this complex but important subject.
BLS also can produce other indexes if they are required. Special indexes may be needed when the government pursues social goals which-at least in the short run-may raise prices. Should it be considered socially desirable to reduce energy consumption by raising gasoline prices, consumers would pay more for gasoline and the index measuring the rate of inflation would and should go up. It might be useful to policymakers, in such a case, to create a special index which could exclude such increases or which could treat other policy-directed price changes, such as changes in interest rates, in a special way. Some also have suggested the desirability of a special index--for use in pension escalation-that would represent the expenditure experience of persons receiving retirement benefits.
Digitized for FRASER http://fraser.stlouisfed.org/ Federal Reserve Bank of St. Louis

The Bureau of Labor Statistics is a service agency. needs. We should not, however, permit these other needs Given the resources and time necessary, the Bureau can to weaken the ability of the present CPI to fulfill the ob-produce special consumer price indexes for particular jective for which it was intended.
Table 1. Alternative HOMEOWNERSHIP COMPONENTS used in official CPI-U and in experimental measures: Percent change over 12 months
12 months ended
Official Consumer
Price Index for All
Urban Con-sumers (CPI-U)
Experimental measures of homeownership
12 months ended
Official Consumer
Price Index for All
Urban Con-sumers (CPI-U)
Flow-of-services measures Outlays measures
12 months ended
Official Consumer
Price Index for All
Urban Con-sumers (CPI-U)
X-1 Rental
equivalent using CPI
rent
X-2 User cost
using current interest
costs
X-3 User cost
using average interest
costs
X-4 Outlays
using current interest
costs
X-5 Outlays
using average interest
costs
December: 1968 . . . . . . . . 7.6 2.8 11.1 8.0 11.0 6.0 1969 . . . . . . . . 10.2 3.8 6.9 3.5 13.2 8.3 1970 . . . . . . . . 10.2 4.5 4.3 1.7 12.6 10.1 1971 . . . . . . . . 2.7 3.8 - 1 2 . 1 - 8 . 9 0.3 7.7 1972 4.1 3.5 2.4 3.3 4.8 6.2 1973 7.7 4.9 22.9 18.8 10.8 4.4 1974 . . . . . . . . 13.3 5.4 16.8 12.9 14.9 9.1 1975 7.9 5.2 2.7 3.3 7.1 9.0 1976 3.8 5.5 - 1 . 0 2.0 2.7 7.6 1977 . . . 9.2 6.5 2.5 0.4 10.4 9.0 1978 12.4 7.3 5.7 1.1 12.0 5.3
January 1979 . . . . 12.4 7.2 8.0 5.7 12.4 5.7 February 1979 . . . 13.5 7.1 10.8 7.4 13.7 5.7 March 1979 . . . . . 13.7 6.7 11.7 10.4 14.0 5.9 April 1979 . . . . . . 14.2 6.5 12.3 9.9 14.4 6.1 May 1979 . . . . . . . 14.6 6.8 13.9 11.3 14.9 6.4 June 1 9 7 9 . . . . . . . 14.9 6.8 14.2 10.6 15.0 6.4 July 1979 15.2 7.1 16.7 11.7 15.3 6.8 August 1979 . . . . . 16.0 7.5 20.1 9.8 15.9 7.0 September 1979 . . 16.1 7.6 18.3 13.2 16.4 7.5 October 1979 . . . . 16.8 8.4 22.2 13.7 17.2 7.8 November 1979 . . 18.3 8.1 24.5 15.1 19.0 7.9 December 1979 . . 19.8 7.9 28.2 22.4 22.6 11.2
Relative impor-tance of home-ownership com-ponent, Decem-ber 1977 (all-items index=100) . 22.8 14.5 11.4 10.0 10.0 8.7
Digitized for FRASER http://fraser.stlouisfed.org/ Federal Reserve Bank of St. Louis
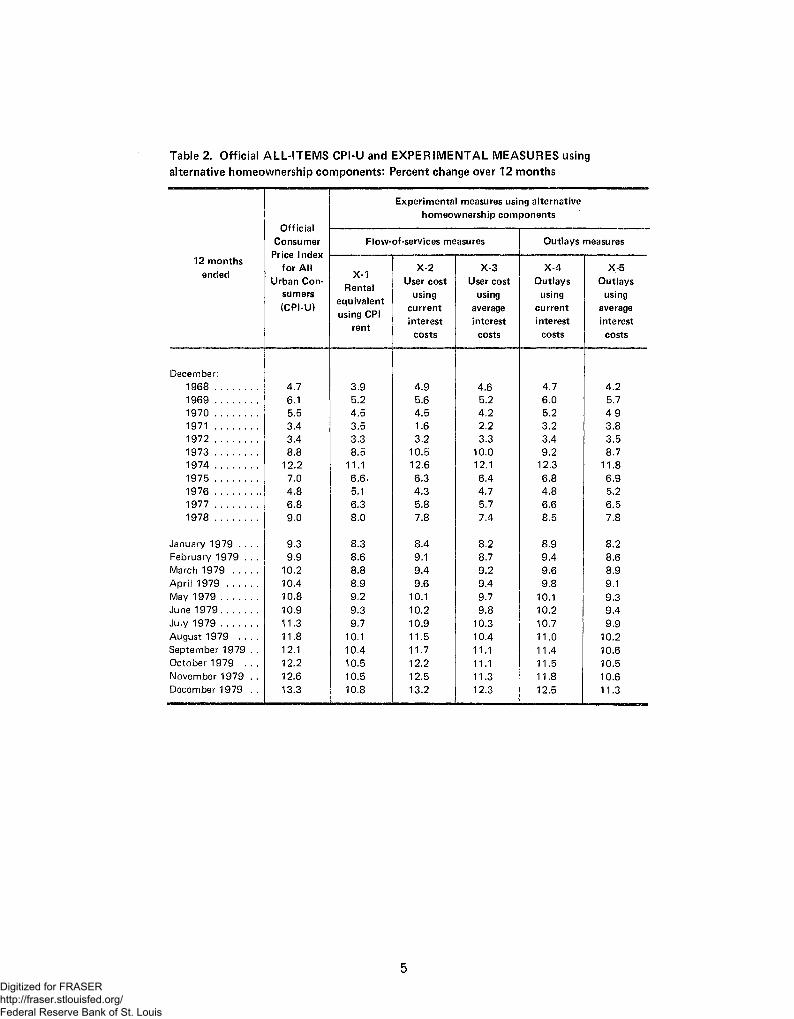
Table 2. Official ALL-ITEMS CPI-U and EXPERIMENTAL MEASURES using alternative homeownership components: Percent change over 12 months
12 months ended
Official Consumer
Price Index for All
Urban Con-sumers (CPI-U)
Experimental measures using alternative homeownership components
12 months ended
Official Consumer
Price Index for All
Urban Con-sumers (CPI-U)
Flow-of-services measures Outlays measures
12 months ended
Official Consumer
Price Index for All
Urban Con-sumers (CPI-U)
X-1 Rental
equivalent using CPI
rent
X-2 User cost
using current interest
costs
X-3 User cost
using average interest
costs
X-4 Outlays
using current interest
costs
X-5 Outlays
using average interest
costs
December: 1968 4.7 3.9 4.9 4.6 4.7 4.2 1969 6.1 5.2 5.6 5.2 6.0 5.7 1970 5.5 4.5 4.5 4.2 5.2 4 9 1971 3.4 3.5 1.6 2.2 3.2 3.8 1972 3.4 3.3 3.2 3.3 3.4 3.5 1973 8.8 8.5 10.5 10.0 9.2 8.7 1974 12.2 11.1 12.6 12.1 12.3 11.8 1975 7.0 6.6, 6.3 6.4 6.8 6.9 1976 4.8 5.1 4.3 4.7 4.8 5.2 1977 6.8 6.3 5.8 5.7 6.6 6.5 1978 9.0 8.0 7.8 7.4 8.5 7.8
January 1979 . . . . 9.3 8.3 8.4 8.2 8.9 8.2 February 1979 . . . 9.9 8.6 9.1 8.7 9.4 8.6 March 1979 10.2 8.8 9.4 9.2 9.6 8.9 April 1979 10.4 8.9 9.6 9.4 9.8 9.1 May 1979 . . 10.8 9.2 10.1 9.7 10.1 9.3 June 1979. . . . . . . 10.9 9.3 10.2 9.8 10.2 9.4 July 1979 11.3 9.7 10.9 10.3 10.7 9.9 August 1979 . . . . 11.8 10.1 11.5 10.4 11.0 10.2 September 1979 . . 12.1 10.4 11.7 11.1 11.4 10.6 October 1979 . . . 12.2 10.5 12.2 11.1 11.5 10.5 November 1979 . . 12.6 10.5 12.5 11.3 11.8 10.6 December 1979 . . 13.3 10.8 13.2 12.3 12.5 11.3
Digitized for FRASER http://fraser.stlouisfed.org/ Federal Reserve Bank of St. Louis

Table 3. Weights arid prices used in official CPI-U and experimental homeownership measures, December 1979
(Percent) Relative importance of homeownership and homeownership elements
Measure
Total home owner-
ship
Prop-erty taxes
Prop-erty insur-ance
Mainte-nance and
repairs
Home purchase
Equity costs
Appre-ciation
Resi-dential
rent
Mortgage interest cost
Measure
Total home owner-
ship
Prop-erty taxes
Prop-erty insur-ance
Mainte-nance and
repairs
Home purchase
Equity costs
Appre-ciation
Resi-dential
rent
Base-period home-
owners' contracts
Revalued base-
period debt
Actual base-
period pay-
ments
Official CPI-U . . . . . . . 22.8 2.1 0.6 3.7 10.0 6.5
X-1. Rental equivalent using CPI rent . 14.5 14.5
X-2. User cost using current interest costs . . . . . . . . . . . . . 11.4 2.4 0.7 1.8 9.8 —8.3 5.0
X-3.User cost using average interest costs . . . . . . . . . . . . . 10.0 2.5 0.7 1.8 10.0 —8.4 3.6
X-4.0utlays using current interest costs . . . . . . . . . . . . . 10.0 2.5 0.7 1.8 5.2
X-5. Outlays using average interest costs . 8.7 2.6 0.7 1.8 3.6
Digitized for FRASER http://fraser.stlouisfed.org/ Federal Reserve Bank of St. Louis
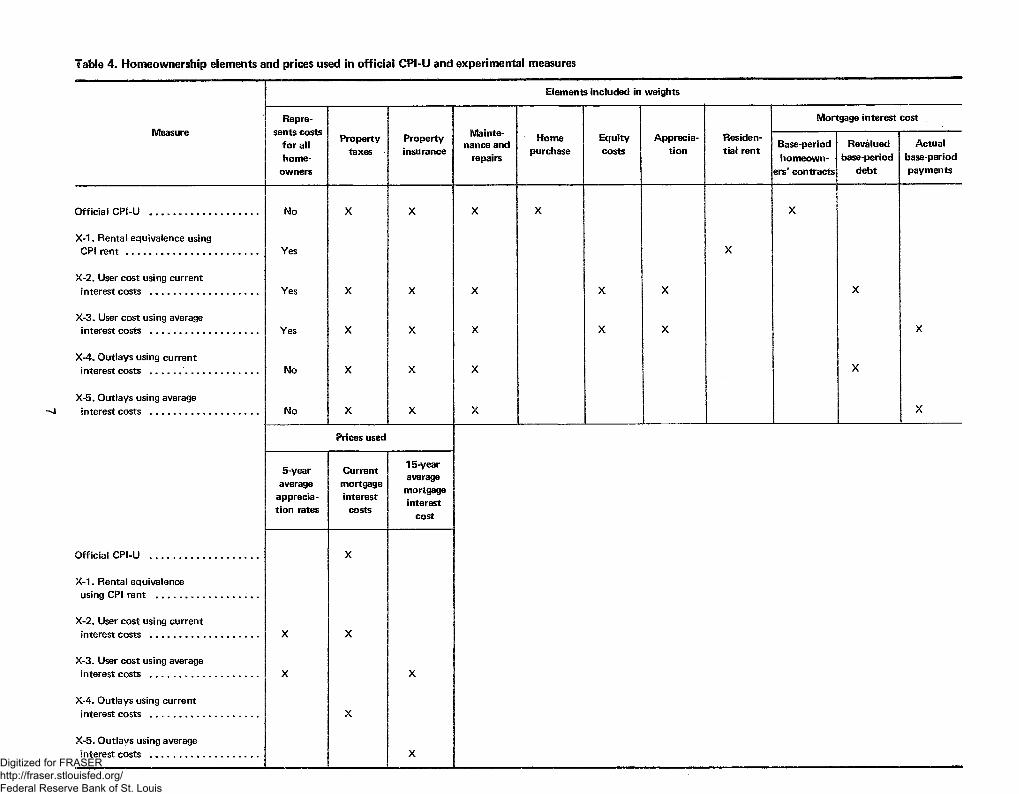
Table 4. Homeownership elements and prices used in official CPI-U and experimental measures
Elements included in weights
Measure Repre-
sents costs for all home-
owners
Mainte-nance and
repairs
Mortgage interest cost Measure
Repre-sents costs
for all home-
owners
Property taxes
Property insurance
Mainte-nance and
repairs
Home purchase
Equity costs
Apprecia-tion
Residen-tial rent
Base-period homeown-
ers' contracts
Revalued base-period
debt
Actual base-period payments
Official CPI-U No X X X X X
X-1. Rental equivalence using
No
CPI rent Yes X
X-2. User cost using current
Yes
interest costs . Yes X X X X X X
X-3. User cost using average
Yes
i nterest costs Yes X X X X X X
X-4. Outlays using current
Yes
interest costs No X X X X
X-5. Outlays using average
No
interest costs No X X X X No
Prices used
5-year average
apprecia-tion rates
Current mortgage interest
costs
15-year average mortgage interest
cost
Official CPI-U X
X-1. Rental equivalence using CPI rent
X-2. User cost using current interest costs X X
X-3. User cost using average interest costs X X
X-4. Outlays using current interest costs X
X-5. Outlays using average interest costs X
Digitized for FRASER http://fraser.stlouisfed.org/ Federal Reserve Bank of St. Louis
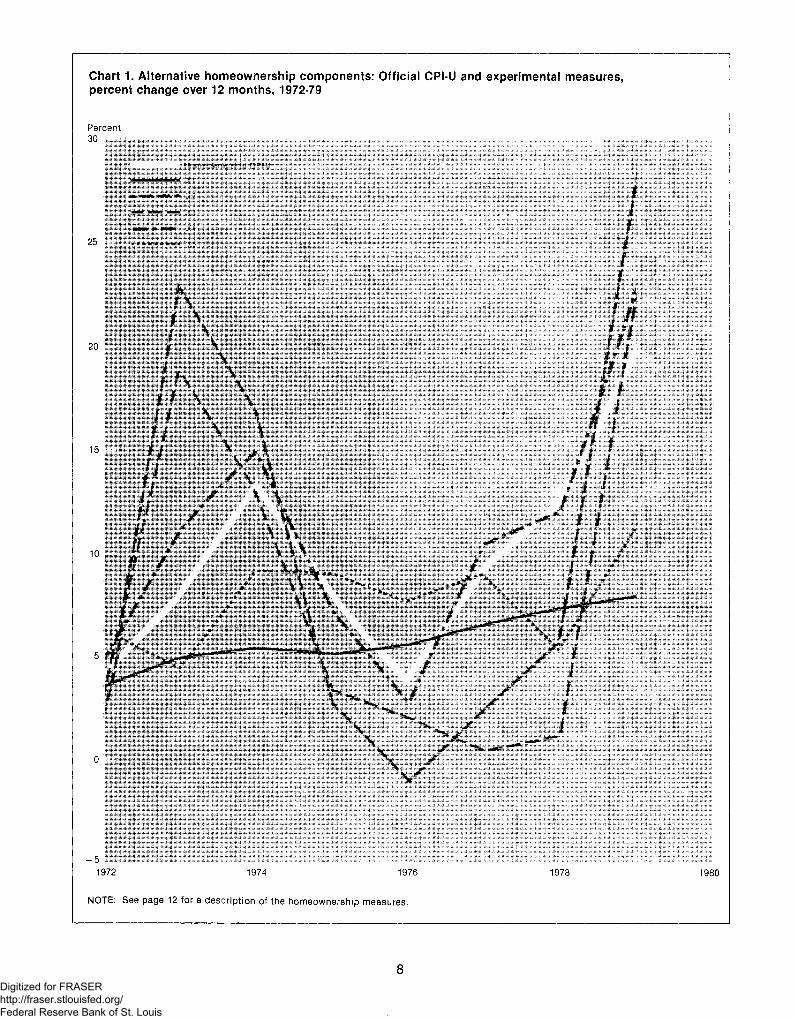
Chart 1. Alternative homeownership components: Official CPI-U and experimental measures, percent change over 12 months, 1972-79
Percent 30
Homeownership CPI-U
- 5 i i i : ; i i i i i i i i l l l i i i l i l ; l l l i i i i
1972 1974 1976 1978 1980
NOTE: See page 12 for a description of the homeownership measures.
Digitized for FRASER http://fraser.stlouisfed.org/ Federal Reserve Bank of St. Louis

Chart 2. Alternative homeownership components: Official CPI-U and experimental measures, percent change over 12 months, 1979
NOTE: See page 12 for a description of the homeownership measures.
Digitized for FRASER http://fraser.stlouisfed.org/ Federal Reserve Bank of St. Louis

Chart 3. Official All-Items CPI-U and experimental measures: Alternative homeownership components, percent change over 12 months, 1972-79
wmmmm^Kmmmmm i p a n M H H H M l • • M
1972 1974 1976 1978 1980
NOTE: See page 12 for a description of the homeownership measures.
Digitized for FRASER http://fraser.stlouisfed.org/ Federal Reserve Bank of St. Louis
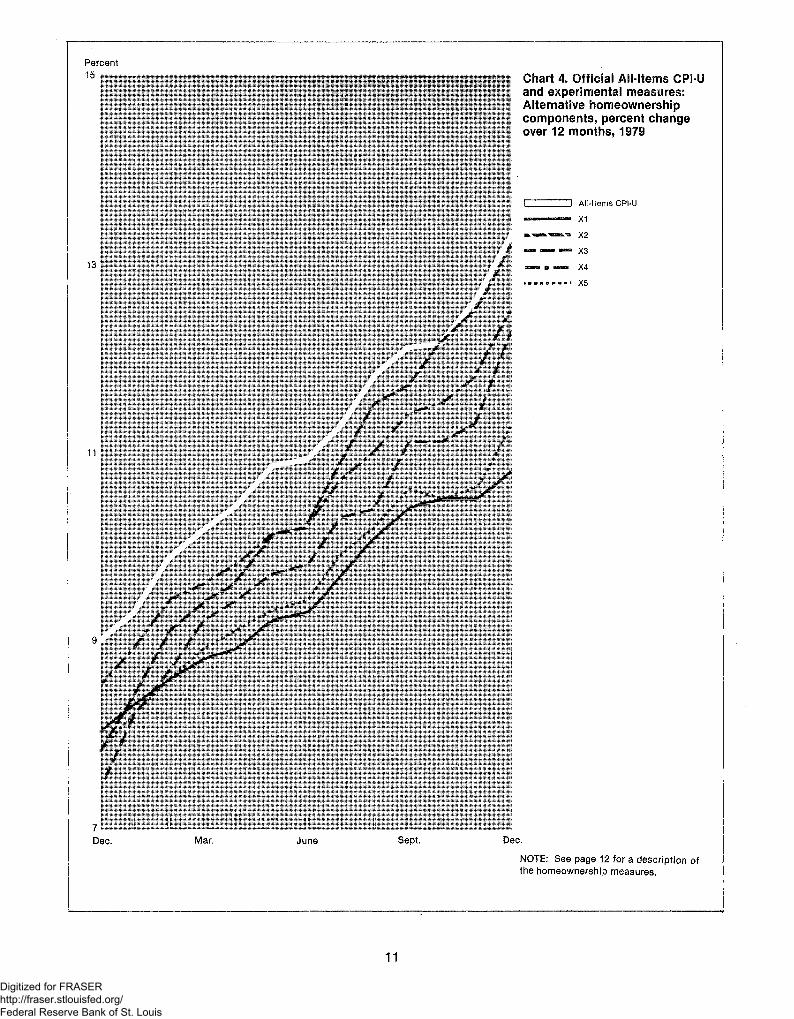
Chart 4. Official All-Items CPI-U and experimental measures: Alternative homeownership components, percent change over 12 months, 1979
• All-Items CPI-U
- X1 o X2 - X3 • X4
I n B I B H I X5
Dec. Mar, June Sept. Dec.
NOTE: See page 12 for a description of the homeownership measures.
Digitized for FRASER http://fraser.stlouisfed.org/ Federal Reserve Bank of St. Louis

Explanations of Homeownership Measures
Official CPI-U Includes five components. (1) The weights for property taxes, property insurance, and home maintenance and repairs represent expenditures of all homeowners in the base period. The weights for house prices and contracted mortgage interest cost represent only those homeowners who actually purchased a home in the ; base period. Included are the total price paid for the home and the total amount of interest expected to be paid over half the stated life of the mortgage. (2) Current monthly prices are used for each of these components.
Experimental Measure X-l: (1) The weight for this rental equivalence measure is the estimate of the rental value of all owner-occupied homes in the base period compiled from a specific question asked on the 1972-73 Consumer Expenditure Survey. This covers the entire stock of owned homes. (2) Prices used are the current rents collected for the residential rent component of the CPI. The CPI rent component is designed to represent changes in residential rents for all types of housing units, not just changes in rents for units that are typically owner occupied. The CPI rent component is, therefore, not appropriate for this measure.
Experimental Measure X-2: (1) The weight, for this user cost method includes expenditures .for mortgage in-terest, property taxes, property insurance, maintenance and repairs, the estimated base-period cost of homeowners' equity in their houses, and the offset to shelter- costs re-sulting from the estimated appreciation of house values in the base period. This measure covers the entire stock of owned houses. To derive the weights for mortgage interest costs and equity costs, the total value of the housing stock in the base period was apportioned into its debt and equity components. The debt component equals the amount owed and the equity component is the amount owned, i.e., payments on principal plus appreciation from the time of purchase to the base period. Each component was sub-sequently multiplied by the average mortgage interest rate
in the base period to determine its cost. (2) Prices used are current ones except for the appreciation term, which uses a 5-year moving average of- the changes in appreciation rates.
Experimental Measure X-3: { 1) The weights are the same as in Experimental Measure X-2, except that mortgage in-terest costs are calculated as the total interest amount paid out by homeowners in the base period. As in X-l and in X-2, this measure covers the entire homeowner popula-tion. (2) The prices for all components except mortgage interest costs and appreciation are current monthly prices. As in X-2, appreciation is represented by a 5-year moving average of the changes in house prices. However, X-3 uses past and current mortgage interest costs in a 15-year weighted moving average, which reflects the base period age distribution of mortgage loans.
Experimental Measure X-4: The weights for this out-lays approach include expenditures actually made in the base period for property taxes, property insurance, and maintenance and repairs. The weight for the mortgage interest term is calculated in the same manner as in X-2. However, no appreciation or equity terms are included. Not all homeowners are represented in this measure because those who made no mortgage debt payment in the base period are excluded. (2) The prices used for each of these items are current ones.
Experimental Measure X-5: (1) The weights for this outlays approach include, as in X-4, expenditures actually made in the base period for property taxes, property in-surance, and maintenance and repairs. The weight for the mortgage interest cost term is the same as for the X-3. No appreciation or equity elements are used. As in X-4, not all homeowners are represented in this measure because those who made no mortgage debt payment in the base period are excluded. (2) Current prices are used in X-5 except for mortgage interest, which uses the 15-year moving average also used in the X-3.
G P O 8 6 6 370
Digitized for FRASER http://fraser.stlouisfed.org/ Federal Reserve Bank of St. Louis

mmwmM
N N N M I f l
P - oJW^ ' >>
Digitized for FRASER http://fraser.stlouisfed.org/ Federal Reserve Bank of St. Louis
Bureau of Labor Statistics Regional Offices
GUAM o
AMERICAN SAMOA
REGION II PUERTO Rico Jr-N^jf
VIRGIN ISLANDS
Region I 1603 JFK Federal Building Government Center Boston, Mass. 02203 Phone: (617) 223-6761
Region II Suite 3400 1515 Broadway New York, N.Y. 10036 Phone: (212) 944-3121
Region III 3535 Market Street P.O. Box 13309 Philadelphia, Pa. 19101 Phone: (215) 596-1154
Region IV 1371 Peachtree Street, N.E. Atlanta, Ga. 30309 Phone: (404) 881-4418
Region V 9th Floor Federal Office Building 230 S. Dearborn Street Chicago, III. 60604 Phone: (312) 353-1880
Region VI Second Floor 555 Griffin Square Building Dallas, Tex. 75202 Phone: (214) 767-6971
Regions VII and VIII 911 Walnut Street Kansas City, Mo. 64106 Phone: (816) 374-2481
Regions IX and X 450 Golden Gate Avenue Box 36017 San Francisco, Calif. 94102 Phone: (415) 556-4678
Digitized for FRASER http://fraser.stlouisfed.org/ Federal Reserve Bank of St. Louis

U. S. Department of Labor Postage and Fees Paid Bureau of Labor Statistics U.S. Department of Labor Washington, D.C. 20212
Official Business Penalty for private use, $300
Third Class Mail
Lab-441
Digitized for FRASER http://fraser.stlouisfed.org/ Federal Reserve Bank of St. Louis


