~,.-_ 5.3.3.3 CPP-91 (&d/ding CPP-633 Blower Pit Drain). Site CPP-91 consists of soil potentially contaminated by discharges from the drain at the base of a blower pit located on the north side of the WCF (CPP-633). The blower pit contains a drain that is believed to discharge directly to the sediments below the blower pit floor, which is approximately 3.lm (10 ft) bgs. In 1992, a cleanup of the blower pit revealed elevated radiation levels on the blower pit walls and floor. During the cleanup, water from rain and snowmelt had entered the blower pit and was observed to be flowing into the blower pit drain. A sample of the dirt on the blower pit floor showed elevated levels of Cs-137, Cs-134, Co-60, Eu-154, and mercury. This suggests that releases of radionuclide contamination may have occurred through the blower pit drain to the underlying soils over the 25+ years since the WCF became operational. Upon discovery of the water and drain in 1992, the drain and blower pit were both sealed. Table 5-6 summarizes sampling results data from the CPP-91 soil borings. 5.3.3.4 CPP-01 (Concrete Settling Basins and Dry Wells East of CPP-603). This site is associated with the fuel storage basin cleanup support system, and consists of the concrete horizontal settling basin (CPP-740), concrete vertical settling pit (CPP-301), and two dry wells (CPP-303 and MAH-SFE-SW-048) east of CPP-603. The fuel storage basin cleanup support system received a backwash slurry of filter aid material (diatomaceous earth) from the Fuel Receiving and Storage Facility filter system. The shielding water in the fuel storage basin was recirculated through the filters to prevent accumulation of dirt and algae. The filtered solids and filter aid material were periodically backwashed from the filters and pumped to CPP-301, a 1.5 x 1.5 x 5.8 m (5 x 5 x 19 fi) vertical settling vault. When the slurry in the vault settled, the supematant was drained from the vault to a deep dry well, CPP-303, where the effluent percolated into the surrounding soils. _.. The filter backwash settling system operated from 1951 to 1962. The horizontal settling system was constructed in 1962. The system consisted of a horizontal settling basin CPP-740 and dry well SW-048. The CPP-301 was removed from service and valved off. The CPP-740 basin included a 1.2 x 1.6 x 9.1 m (4 x 5.3 x 30 fi) horizontal settling system of weir compartments and an access manhole. This system served to settle slurry solids and to drain the supematant to dry well SW-048 and subsequently the surrounding soils. The total volume (18,295 L [5,000 gal]) of sludge and liquid in the horizontal settling basin CPP-740 and the vertical settling pit CPP-301 was removed in the fall of 1993 under a CERCLA removal action. The liquid removed was sent to the PEW facility and the sludge was dried and sent to the RWMC. Use of dry wells was discontinued in 1966 due to internal administrative controls. This decision prompted reactivation of CPP-301 as a settling pit. Upon reactivation, steam jetting was used to transfer the supematant to waste storage tank SFE-20 (Site CPP-69 in OU 3-09). In March 1969, several Experimental Breeder Reactor (EBR) No. 2 fuel canisters ruptured, releasing contamination to the basin water. The CPP-740 settling facilities were removed from service in 1977 when the filters were replaced by a pressurized sand filtration system. Depth of contamination at CPP-01 is assumed to extend from ground surface to the sediment/basalt interface at 9.8 m (32 ft) bgs. Table 5-7 provides summary sampling results statistics for CPP-01. 5.3.3.5 CPP-04/05 (Contaminated Soil Area Around CPP-603 Settling Tank). These sites located east of CPP-603 were combined because they were determined to have resulted from the same release. Site CPP-04 includes a 10.0 x 20.4 m (33 x 67 ft) area of contaminated soil above the horizontal settling basin CPP-740. Site CPP-05 includes a 10.0 x 20.4 m (33 x 67 ft) area of contaminated soil above the vertical settling pit CPP-301. Soil contamination associated with the two sites resulted from unintentional releases during sludge removal from the two structures in 1978. 5-23
Transcript
~,.-_ 5.3.3.3 CPP-91 (&d/ding CPP-633 Blower Pit Drain). Site CPP-91 consists of soil potentially contaminated by discharges from the drain at the base of a blower pit located on the north side of the WCF (CPP-633). The blower pit contains a drain that is believed to discharge directly to the sediments below the blower pit floor, which is approximately 3.lm (10 ft) bgs. In 1992, a cleanup of the blower pit revealed elevated radiation levels on the blower pit walls and floor. During the cleanup, water from rain and snowmelt had entered the blower pit and was observed to be flowing into the blower pit drain. A sample of the dirt on the blower pit floor showed elevated levels of Cs-137, Cs-134, Co-60, Eu-154, and mercury. This suggests that releases of radionuclide contamination may have occurred through the blower pit drain to the underlying soils over the 25+ years since the WCF became operational. Upon discovery of the water and drain in 1992, the drain and blower pit were both sealed. Table 5-6 summarizes sampling results data from the CPP-91 soil borings.
5.3.3.4 CPP-01 (Concrete Settling Basins and Dry Wells East of CPP-603). This site is associated with the fuel storage basin cleanup support system, and consists of the concrete horizontal settling basin (CPP-740), concrete vertical settling pit (CPP-301), and two dry wells (CPP-303 and MAH-SFE-SW-048) east of CPP-603. The fuel storage basin cleanup support system received a backwash slurry of filter aid material (diatomaceous earth) from the Fuel Receiving and Storage Facility filter system. The shielding water in the fuel storage basin was recirculated through the filters to prevent accumulation of dirt and algae. The filtered solids and filter aid material were periodically backwashed from the filters and pumped to CPP-301, a 1.5 x 1.5 x 5.8 m (5 x 5 x 19 fi) vertical settling vault. When the slurry in the vault settled, the supematant was drained from the vault to a deep dry well, CPP-303, where the effluent percolated into the surrounding soils.
_..
The filter backwash settling system operated from 1951 to 1962. The horizontal settling system was constructed in 1962. The system consisted of a horizontal settling basin CPP-740 and dry well SW-048. The CPP-301 was removed from service and valved off. The CPP-740 basin included a 1.2 x 1.6 x 9.1 m (4 x 5.3 x 30 fi) horizontal settling system of weir compartments and an access manhole. This system served to settle slurry solids and to drain the supematant to dry well SW-048 and subsequently the surrounding soils. The total volume (18,295 L [5,000 gal]) of sludge and liquid in the horizontal settling basin CPP-740 and the vertical settling pit CPP-301 was removed in the fall of 1993 under a CERCLA removal action. The liquid removed was sent to the PEW facility and the sludge was dried and sent to the RWMC.
Use of dry wells was discontinued in 1966 due to internal administrative controls. This decision prompted reactivation of CPP-301 as a settling pit. Upon reactivation, steam jetting was used to transfer the supematant to waste storage tank SFE-20 (Site CPP-69 in OU 3-09). In March 1969, several Experimental Breeder Reactor (EBR) No. 2 fuel canisters ruptured, releasing contamination to the basin water. The CPP-740 settling facilities were removed from service in 1977 when the filters were replaced by a pressurized sand filtration system.
Depth of contamination at CPP-01 is assumed to extend from ground surface to the sediment/basalt interface at 9.8 m (32 ft) bgs. Table 5-7 provides summary sampling results statistics for CPP-01.
5.3.3.5 CPP-04/05 (Contaminated Soil Area Around CPP-603 Settling Tank). These sites located east of CPP-603 were combined because they were determined to have resulted from the same release. Site CPP-04 includes a 10.0 x 20.4 m (33 x 67 ft) area of contaminated soil above the horizontal settling basin CPP-740. Site CPP-05 includes a 10.0 x 20.4 m (33 x 67 ft) area of contaminated soil above the vertical settling pit CPP-301. Soil contamination associated with the two sites resulted from unintentional releases during sludge removal from the two structures in 1978.
5-23
Table 5-6. Summary sampling results statistics for soil contaminants in CPP-91 soil borings.’
Soil Concentration (mg/kg [nonradionuclide] or pCi/g [radionuclide])
Contaminants Minimum Maximum
Number Number Frequency MEEL Number of Arithmetic Standard of of of
MeaIl Deviation RMEb Back8round’ Samples Greater
Samples Detects Detection (mg/kg or pCi/g) than Background
As
Ba
Be
Cd
CO
Cr
CU
H8 vl
!2 M*
Ni
Pb
Sb
Se
Tb
V
Z*
cs-137
Pu-238
Pu-239
Sr-90
Tc-99
3.60E+OO P I .03E+Ol P 6.17E+OO 2.20E+OO 1.06E+ol
7.81E+Ol P I .86E+02 P l.llE+02 3.12E+Ol 1.73E+O2
3.70E-01 P 1.20E+OO P 5.90E-01 0.28E.01 6.46B01
4.3 E-01 BP 3.30E+OO P I .27E+OO 8.90E-01 3.05E+00
1.25E+Ol P 3.28E+Ol P I .768E+Ol 6.78E+OO 3.12E+Ol
7.00E.02 B 5.40E.0 I 2.70E-01 1.50E.01 5.70E-01
I .67E+02 P 5.34E+02 P 2.616E+02 1.28E+02 5.18E+02
1.81E+ol P 3.80E+Ol P 2.472E+Ol 6.85E+OO 3.84E+Ol
5.60E+oo P 1.72E+Ol P 9.74E+OO 3.79E+OO 1.73E+01
5.80E.01 BP I .20E+OO B P 8.50E-01 2.30E.01 I .3 1 E+OO
2.00E+OO P 2.00E+OO P 2.00E+OO NA NA
1.80E+OO BP I .80E+OO BP I .80E+oo NA NA
2.34Et01 P 4.34E+Ol P 3.083EiOl 7.70E+OO 4.62EX)l
4.73E+Ol P l.O7E+02 P 6.716E+Ol 2.03E+Ol l .O8E+02
1 .OOE-01 1.40E+02 3.08lE+Ol 4.59E+01 1.23E+O2
3.20E-01 3.20E.01 3.20E.01 NA NA
6.00E-02 6.00E.02 6E-02 NA NA
2.00E+Ol 7.58E+03 2.287Ec03 3.60EtO3 9.49E+03
2.32E+OO 2.32E+OO 2.32E+OO NA NA
IO 10
10 IO
10 10
10 10
IO 10
10 10
10 10
10 8
10 10
10 IO
IO IO
10 9
10 1
10 I
IO IO
10 10
10 8
1 1
1 1
4 4
I I
100%
100%
100%
100%
100%
100%
100%
80%
100%
100%
100%
90%
10%
10%
100%
100%
80%
100%
100%
100%
100%
5.80EHIO 6
3E+02 0
1.80E+oo 0
2.20EX)O 1
l.lOE+Ol 2
3.30E+Ol 2
2.20EtOl 2
5.00E-02 8
4.90Eii32 1
3.50EHIl 2
1.70EHIl 1
4.80E+OO 0
2.20E-01 1
4.30E-01 1
4.50E+Ol 0
1.50EtO2 0
8.20E-01 6
4.90&03 1
IE-01 0
4.90E.01 4
NA NA
Table 5-6. (continued).
Soil Concentration (m&kg [nomadionuclide] or pCi/g [radionuclide])
Number Number Frequency INEEL Number of Arithmetic Standard of of of Background’ Samples Greater
Contaminants Minimum Maximum MeaIl Deviation RMEb Samples Detects Detection (mg!kg or pCi/g) than Background
U-234 6.37E+OO I 6.37E+OO .I 6.37E+OO NA NA I I 100% I .44E+OO 1
U-235 2.00E-02 2.00E-02 2E-02 NA NA I 1 100% NA NA
U-236 I .OOE-02 J I .OOE-02 J 1 E-02 NA NA 1 I 100% NA NA
U-238 6.40E-01 6.40E-01 6.40E-01 NA NA 1 1 100% 1.40E+OO 0
Gross Alpha 5.30E+OO I .90E+O 1 l.l9E+Ol 4.69E+00 2.13E+Ol 9 8 89% NA NA
Table 5-7. Summary sampling results statistics for soil contaminants at Site CPP-01.”
Soil Concentration (pCl/g [radionuclide])
Number of Number Number Frequency INEEL Samples
Arithmetic Standard of of of Background’ Greater than Contaminants Minimum Maximum Meall Deviation RMEb Samples Detects Detection @g/kg or pCi/g) Background
Am-241 I .78E+OO J I .78E+OO J I .78E+OO NA NA 3 I 33% l . lOE-02 1
co-57 l .O2E+OO I .02E+OO I .02E+OO NA NA 19 1 5% NA NA
Co-60 1.38E+OO 3.32E+02 7.12E+01 I .46EtO2 3.63EtO2 19 5 26% NA NA
Gross Alpha 4.30E+OO 3.32E+03 4.47E+02 8.61E+02 2.17E+03 19 14 74% NA NA
Gross Beta 7.46E+OO 4.32E+04 4.99E+O3 l.OlE+O4 2.52E+O4 19 19 100% NA NA
a. NOTE: . hpiicate ramptc mults were not included in the statistical analysis
. analytical resultr are from samples collected from three botingr and from the bottom of dry well SW-048 duting the OU 3.09 Track 2 Investigation. Re~ulf~ are provided in the final Preliminary Scoping Track 2 Summary Report For Operable Unit OU 3-09 (LITCO 1995b) and Appendix G ofthe OU3.13 NiFS Part A (DOE-ID 1997b).
. Selected samples were also analyzed for Cd, K-40, Np-237. k-238 and U-234. INS data is not shown because concentrations were below detection limits.
/ . Samples rejected because of an unacceptable quality control pammekr were not included in the table.
b The RME concentration is the 95% upper value based on the empirical rule (9Wooflbe measurements lie within two standard deviations oftheir mean),
C~ the KNEEL background concentrations represent the 95% upper confidence limit (Rmd et al. 1995).
I = questionable KS recovery or analytical yields
NA = Notappiicable
KM,: = Keasonable Maxim”m Enpasure.
The contaminated area was later covered with 0.6 m (2 rt) of soil. Table 5-8 shows summary sampling results statistics for CPP-04/05.
The COPCs for CPP-04/05 include Ce-144, Co-60, Cs-134, Cs-137, Eu-152, Eu-154, Eu-155, and U-235. The area1 extent of contamination is estimated at 408 m* (4,422 fi*), Assuming an average depth of contamination of 0.6 m (2.0 ft), the total volume of contaminated soil is estimated at 245 m’ (8,844 ft’).
5.3.3.6 CPP-06/09 (Contaminated Soil Area Around CPP-603 Basin Filter System). These sites were combined because they were determined to have resulted from failure of an underground carbon steel filter system line due to corrosion. Approximately 25 1 m’ (2,700 ft’) of soil were contaminated with approximately 79,494 L (21,000 gal) of radionuclide-contaminated water from the CPP-603 basin over a 7-day period.
The exact location of the leak was never determined. The leaking line section was replaced and removed from service. Contaminated soil resulting from the leak was apparently encountered by construction crews on the east side of CPP-603, where a section of the line was located. The area of contamination was delineated by radiological survey instruments, however no soil samples were collected. Site CPP-09 was identified in the FFA/CO as “soil contamination northeast corner of CPP-603 South Basin.” Site CPP-08 was identified as “CPP-603 Basin Filter System Line Failure.” Sites CPP-08 and -09 were combined as one site based on information gathered during preparation of Track 2 investigation for each site. Table 5-9 provides summary sampling results statistics for CPP-08109.
The COPCs include Cs-137, Sr-90, Eu-152, Eu-154 and U-235. The assumed areal extent is 251 m2 (2700 f?). The assumed depth of contamination is 9.4 m (31 ft), with an estimated contaminated soil volume of 2,370 n? (83,700 ft’).
5.3.3.7 CPP-10 (Contaminated Soil Area around CPP-603 Plastic Pipeline Break). This site resulted from a release of approximately 3000 L (800 gal) of radionuclide-contaminated CPP-603 basin water that drained onto a shielded floor area as a result of failure of a PVC line in December 1976. Approximately 34 m* (366 ft2) of asphalt and soil outside the building were contaminated. Apparently no remedial actions were performed at the site, other than placing several inches of clean soil over the contaminated area. Table 5-10 provides summary sampling results statistics for CPP-14.
Radionuclide contaminants include G-60, Cs-137, Eu-152, -154, and -155. Sr-90, and U-235. The estimated area of CPP-10 is 31.2 m* (336 ft’). Contamination is assumed to extend from ground surface to the soil-basalt interface at 10.4 m (34 fi) bgs.
5.3.3.8 CPP-1 I (CPP-603 Sludge and Water Release). This site resulted from a release of contaminated sludge and water from CPP-603 in February 1978. Approximately 1,136 to 1,893 L (300 to 500 gal) of sludge and water were released, and covered an area of 8.5 x 17 m (28 x 56 ft). The initial spill was cleaned up and soils with radiation levels greater than 1 R/hr were removed.
The remainder of the area was roped off. Tank SFE-06 is located 1.8 m (6 ft) bgs at the site, and is still used for storage of radionuclide-contaminated waste. The tank is not known to be leaking. Summary sampling results statistics are provided in Table 5-11.
Contaminants of potential concern include arsenic, thorium, Co-60, Sr-90, Cs-137, Eu-154, and Np-237. Contamination is estimated to extend from ground surface to 5.5 m (18 ft) bgs. This est:mate was based on radionuclide activities above background in samples collected at 3.8 m (12.5 ft) bgs.
5-27
Table 5-8. Summary sampling results statistics for radionuclides at Sites CPP-04105.’
Soil Concentration (m&g [nonradionuclide] or pCi/g [radionuclide])
Number of Number Frequency INEEL SE3tllpleS
Arithmetic Standard of Number of Background’ Greater than Contaminants Minimum Maximum MGlll Deviation RMEb Samples ofDetects Detection (wh or PW) Background
C-z-144 2.00E-01 2.39E+03 I .20E+02 3.28E+02 7.76E+02 204 133 65% NA NA
Co-60 I .OSE-02 I .45E+03 4,62E+Ol I .57E+02 3.60E+02 204 172 84% NA NA
cs- I34 7SOE.02 2.26E+02 1.8lE+Ol 3.77EtOl 9.35E+Ol 204 89 44% NA NA
Eu-I52 2.00E-01 3.50E+04 9.32E+02 3.49E+03 7.91 E+03 204 199 98% NA NA
Eu- I 54 4.73E-01 3.22E+04 9.3lE+02 3.34E+O3 7.6lE.c03 204 I87 92% NA NA
Eu-155 5.38E-03 7.60E+03 2.27E+02 7.96E+02 1.82E+03 204 178 87% NA NA
VI tL
U-235 4.75E-02 3.02E-01 7.01E-02 3.62&02 1.43E-01 120 120 100% NA NA
m a. NOTE:
. “up,iea,e sample reS”,ts were not included in the statistical analysis.
. ,Qalytical ~SU!U are from samples collectid from 5 I borings installed to charactetize the CPP-740 horizontal settling basin in 1981. Results an provided in the Radimcbve ~asfe ~haracteriration ofC!~-603 Cleanup BasinCPP-740 (EC&G 1982) and in Appendix E of the Preliminary Scoping wrack 2 summary report kx Opaable Unit 3-09 (LITCO 1995b).
by ne P&E cm~enmtion is the 95% upper value bared on the empitical tule (95%0f the measurements lie within two standard deviations aftheir mean).
C~ ,h ,NEE,. backgmund concentmions represent the 95% upper confidence limit (Rood et al. 1995).
NA = NO, applicable
RME = Reasonable Maximum Exposure.
,
Table 5-9. Summary sampling results statistics for soil contaminants at Site CPP-08/09.”
Soil Concentration (pCi/g [radionuclide])
Number of Number Number Frequency MEEL Samples
Arithmetic Standard of of of Background’ Greater than Contaminants Minimum Maximum Mean Deviation RMEb Samples Detects Detection (mgikg OI pCi/g) Background
U-235 I .93E-02 2.61&02 2.27E-02 4.81E-03 3.23E-02 2 2 100% NA NA
U-238 1.56E-01 1.6lE-01 1.59E-01 3.54&03 1.66E-0 I 2 2 100% I .40E+OO 0
Gross Alpha 5.lOE+OO 7.99E+Ol 2.9lE+Ol 3.48E+Ol 9.87E+01 4 4 100% NA NA
Gross Beta 9.88E+Ol 9.36E+02 5.19E+02 4.34E+02 I .39E+O3 4 4 100% NA NA
a. NOTE:
. duplicate sample resuhs were not included in the statistical analysis.
. ~nalytieal results art from sampler collected from one boring installed during the 0” 349 Track 2 Investigation. Resulu are provided in the Final Preliminary Scoping Track 2 summary Repan Far Operable Unit 0” 349 (LITCO 1995b) and Appendix G oftbe OU3-13 RliFS Part A (DOE-ID 1997b).
. Selected samples \ue~e z&o analyzed for G-57, Co-GO, Eu-155, K-40, U-234, Np-237. Pu-238, Pu-239 and Am-241. TXs data is not shown because concentrations were below detection limits.
. samples rejected because of an unacceptable quality control parameter were not included in the table
b. nlhe RME ~o~~enrntion is the 95% upper value based on the empitical rule (95Vsfthe trasuremenfr lie within two standard deviations of their mean).
C~ ~~~ INEEL background concentrations represent the 95% upper confidence limit (Rood et al. 1995)
J = Questionable LCS recovery or analytical yield.
NA = NO, applicable
Table 5-10. Summary sampling results statistics for soil contaminants at Site CPP-IO.”
Soil Concentration (pCi/g [radionuclide])
Number of Number Number Frequent MEEL Samples
Arithmeti Standard of of Y of background’ Greater than Contaminants Minimum Maximum c Mean Deviation RMEb Samples Detects Detection (mgikg 01 pCi/g) Background
Co-60 3.18E+OO 3.18E+OO 3.18EtiO NA NA 6 I 17% NA NA
Gross Alpha 2.78E+00 1.38E+02 4.97E+Ol 5.65EtOl I .63E+O2 6 5 83% NA NA
Gross Beta 1.42E+02 5.45E+03 I .48E+O3 2.05E+03 5.58E+03 6 6 100% NA NA
a. NOTE
. duplicate rample RSUI~S were not included in the statistical analysis.
. Analytical resuhs are from samples collected from 0°C bating installed during the OU 349 Track 2 investigation. Results are provided in the Pinal Preliminary Scoping Track 2 Summary Repan For Operable Unit 0” 3-09 WTCO I995b) and Appendix G oftbe OU3-I 3 RliFS Part A (WE-ID 1997b).
. Selected samples were also analyzed f0rC0-57, K-40, U-234. Np-237, Pu-238, Pu-239and Am-241. This data is riot show kcausr concentr&ons wem b-&w defection limits,
. Samples rejected because ofan unacceptable quality control parameter were not included in the tabk
by the RME concentmtion is the 95% upper value based on the empirical wle (95Ymf the measurements lie within two standard deviations of their mean)
c, The INEEL background concentraksx represent the 95% upper confidence limit (Rood et al. 1995).
J = Questionable LCS recovery or analytical yield
NA = Not applicable
RME = Reasonable Maximum Exposure.
Table 5-11. Summary sampling results statistics for soil contaminants at Site CPP-11.’
Soil Concentration (mg/kg [nonradionuclide] or pCi/g [radionuclide]) -
Contaminants
AS
Ba
Be
Cd
CO
CI
CU
-.A h &
- Mn
Ni
Pb
Sb
Se
Tb
V
Ztl
Co-60
cs-137
Eu-154
N~-237
Sr-90
Minimum
Number of Number Number INEEL S~IllQl~S
Arithmetic Standard of of Frequency Background’ Greater than Maximum MeaIl Deviation RMEb Samples Detects of Detection (mg/kg or pCi/g) Background -
2.80E+OO 6.40E+OO
6.34E+Ol P 1.22E+02 P
2SOE-01 P 5E-01 P
4.30E-01 P 1.70E+OO P
3SOE+OO B P 6.30E+OO B P
1.32EtOl J P 2.37E+Ol P
7.80E+OO P 1.54E+Ol P
5.00E-02 B 5.00E-02 B
I .32EHl2 P 2.58E+O2 NJ P
l.l6E+01 P 2.06E+Ol P
5.30EtOO P 8.80E+oo P
4.40E-01 B P 8.30E-01 BP
8.50E-01 BP 8.50E-01 BP
1.30E+OO B P 1.30E+OO B
1.83E+Ol 2.8lE+Ol
3.29E+Ol 6.42E+Ol
l.lOE+Ol 6.10E-01
2.90E-01 7.27E+Ol
3.60E-01 I .SOE+OO
I .50E-01 I .50E-01
1.3lE+Ol J 1.3lE+Ol I
4.77E+OO
9.76E+Ol
4.23E-01
I .12E+OO
5.13E+OO
1.85EWl
1.31E+Ol
5.00E-02
1.97E+O2
1.73E+Ol
6.96E+OO
6.06E-01
8.50E-01
1.30E+OO
2.50E+Ol
5.04E+Ol
2.93E-01
2.56E+Ol
7.53E-01
I .50E-01
1.3lE+Ol
1.27EtOO 7.31E+OO
1.96E+Ol 1.37E+02
7.32E-02 5.69&01
5.00E-01 2.12EtOO
7.83E-01 6.70E+OO
3.07E+OO 2.46E+Ol
2.26EtOO 1.76E+Ol
NA NA
4.44E+Ol 2.86E+02
2.78E+OO 2.29E+01
l.llE++O 9.18E+OO
1.56E-01 9.18E.0 1
NA NA
NA NA
3.14E+OO 3.13E+Ol
8.44E+00 6.73E+Ol
2.75B01 8.43E.01
2.64EiiIl 7,84E+Ol
5.64E-01 1.88E+oo
NA NA
NA NA
10
10
10
10
10
10
10
10
10
10
10
10
10
10
10
10
10
10
IO
I
1
10 100% 5.80E+OO 2
IO 100% 3.00EtO2 0
IO 100% 1.80EHlO 0
10 100% 2.20EtOO 0
10 100% l.lOE+Ol 0
10 100% 3.30E+Ol 0
10 100% 2.20EtOl 0
I 10% 5.00E-02 0
10 100% 4.90E+O2 0
10 100% 3.50E+Ol 0
10 100% 1.70Ei01 0
9 90% 4.80E+OO 0
1 10% 2.20E.01 1
1 10% 4.30E-01 1
10 100% 4.50E+Ol 0
10 100% 1.50E+O2 0
3 30% NA NA
10 100% 8.20E-01 9
6 60% NA NA
1 100% NA NA
I 100% 4.90E.01 I
.,,. Radionuclide activities were still above background levels at that depth; however, COPC activities decrease with depth. The areal extent of the site is 208 m2 (2,240 fi*). The total estimated contaminated soil volume is 1,140 m3 (40,390 fi’).
5.3.3.9 CPP-03 (Temporary Storage Area Southeast of CPP-603). Site CPP-03 is a temporary storage area southeast of CPP-603 that was used to store old and abandoned equipment, most of which was radioactively contaminated. The area was decommissioned in the late 1970s and all stored material was boxed and sent to the RWMC for disposal. Contaminated soil was removed, boxed and sent to the RWMC, and the area was covered with 28 cm (11 in.) of “cold” soil. Subsequently, 9,175 m’ (12,000 yd3) of contaminated soil excavated from the Tank Farm was stockpiled at the site before burial in three trenches located in the northeast corner of the INTEC.
Radiological field surveys in the area have indicated surface activity levels above background at various locations at the site. Three boreholes in the area were drilled to 3.0 m (10 fi) bgs in locations where high surface activities were observed. Samples were collected and submitted for radionuclide analysis. Summary sampling results statistics are provided in Table 5-12. The COPCs include Cs-137 and Sr-90. Cesium-137 is the primary COC, with contamination detected from the surface to about 1.2 m (4 fi) bgs. The area1 extent of contamination is estimated at 6,970 m2 (75,000 ft”), and the estimated volume of contaminated soil is 8,364 m3 (300,000 ft3).
5.3.3.70 CPP-67 (CPP Percolation Ponds #I and #2). Site CPP-67 consists of two unlined service waste percolation ponds. The ponds receive service wastewater consisting primarily of cooling water and condensed steam generated by various INTEC operations. INTEC wastewater that contains only traces of radioactivity (or none at all) passes through the service waste system. The waste consists primarily of cooling water and steam condensates. This waste activity is monitored before being discharged to SWP-1 or SWP-2. There are three main service waste systems at INTEC: (1) the eastside system, (2) the westside system, and (3) the CPP-604 PEW process condensate monitor/shutdown system Figure l-5 shows the relative location of the ponds, which are fenced to exclude entry of large wildlife and unauthorized personnel. Table 5-13 shows summary sampling results statistics for CPP-67.
SWP-1 is located outside the south INTEC security fence, southeast of CPP-603 and was established in 1984. The pond is approximately 125.0-m (410-ft) long in the east-west direction and 146.3 m (480 ft) in the north-south direction and approximately 5.5-m (18-ft) deep. The pond was excavated in gravelly alluvium that is approximately 7.6- to 9.1-m (25- to 30-ft) thick and is underlain by basalt, which locally outcrops in the pond.
The SWP-2 is located outside the south INTEC security fence, southeast of CPP-603. The SWP-2 was established in 1985 when it became apparent that the infiltration capacity of SWP-1 had decreased and water levels began to rise. The $t bottom is approximately 152.4-m (500-ft) square and 3 to 4 m (12 to 14 ft) deep. The pit was excavated in gravelly alluvium approximately 6 to 11 m (20 to 35 ft) thick, underlain with basalt. Basalt outcrops in the comer of SWP-2. The pond is designed to accommodate continuous disposal of approximately 11.4 M L (3 M gal) of water per day.
RCRA clean-closure equivalency was achieved for metals contamination in Pond SWP-1 in April 1994 and Pond SWP-2 in May 1995; therefore, only radionuclide contamination was assessed as part of the WAG 3 RI/BRA. Site CPP-67 is considered to be a significant source of the perched water beneath the southern portion of the INTEC.
5-33
Table 5-12. Summary sampling results statistics for soil contaminants at Site CPP-03.”
Contaminants
cs-137
Soil Concentration (pCi/g [radionuclide])
Number of Number Number INEEL SXllPkS
Arithmetic Standard of of Frequency BackgroundC Greater than Minimum Maximum MeaIl Deviation RMEb Samples Detects of Detection (mg!kg orpCi/g) Background
O.OOE+OO 7.24E+OO 3.57E+OO 3.25E+OO l.OlE+Ol 9 4 44% NA NA
3.02E+OO 1.67E+02 4.68E+Ol 6.76E+Ol 1.82E+O2 9 6 67% NA NA
Table 5-13. Summary sampling results statistics for soil contaminants at Site CPP-67.”
Soil Concentration (mgikg [nonradionuclide] or pCi/g [radionuclide]) -
Contaminants
Ag A5
BZ?
Be
Cd
CO
Cr
CU cn LJ Hg WI Pb
Mn
Ni
Sb
Se
Th
V
ZII
Cyanide
Sulfide
2-Butanone
Acetone
BelUelle
bis(2- Ethylhexyl).
Minimum Maximum
2.lOE-01 BJ I .80E+OI J
I .20E+00 B 1.38E+Ol
3.21E+Ol 4.00E+02
3.00E-01 J 8.30E.01
4.20E.01 B l.l2E+Ol
I .70E+OO B I .OOE+Ol
3.60E+OO NJ l.O8E+02
8.60E+OO J 1.49E+O2 J
9.00E-02 1.26E+O2 J
3.90EHIO J 1.95E+OlJ
3.86E+Ol EJ 3.59E+02 EJ
6.90E+OO 2.83E+01
3.60E-01 B 6.90E+OO B
l.OOE-01 BJ 8.00E-01 J
2.10E-01 B 2.10E-01 B
5.60EHIO 3.63E+Ol N
2.44E+Ol NJ I .02E+02 J
1.20E-01 B 5.20E-01 J
5.40E.01 1.57E+Ol
7.00E-03 J 9.00E-03 J
5.00E-03 J 9. IOE-02 B
I .OOE-03 J I .OOE-03 J
3.60E-02 J 3.70E+OO
Arithmetic Mea
Standard Deviation RMEb
MEEL Number of Number Number Frequency Background’ Samples
of of of bwkz 01 Greater than Samples Detects Detection PCdP) Background
2.91E+OO
4.52EtOO
I .44E+02
5.61E-01
1.82E+OO
4.82E+OO
2,35E+Ol
2.43E+Ol
1.26E+Ol
8.49E+OO
1.23E+02
1.51E+Ol
1.42E+OO
3.88E-01
2.10E.01
1.53E+Ol
4.77E+Ol
2.90E-01
8.10E+OO
8.00E-03
2.39E.02
l.OOE-03
1.3lE+OO
3.84E+OO
2.17E+OO
8.40E+Ol
1.62E-01
2.14E+OO
I .83E+OO
1.90E+Ol
2.06EHJl
2.76E+Ol
3.33E+OO
7.12E+01
5.37E+OO
2.42E+OO
2.71E.01
O.OOE+OO
5.66E+OO
1.74E+Ol
2.07E-01
5.20E+OO
1.4 1 E-03
2.99E.02
NA
1.76E+OO
l.o6E+O 1 87 34
8.86E+OO 99 98
3.12E+02 92 92
8.85E-01 67 8
6.10EH30 100 65
8.48E+00 66 46
6.15E+Ol 99 95
6.55E+Ol 66 66
6.78E+Ol 81 66
1.52E+Ol 98 88
2.65E+02 59 59
2.58E+Ol 67 67
6.26E+OO 56 7
9.30E.01 100 8
2.10E-01 57 1
2.66E+Ol 67 67
8.25E+Ol 67 67
7.04E-01 65 3
1.85E+Ol IO IO
1.08E.02 33 2
8.37E-02 7 33
NA 33 1
4.83E+OO 29 5
39%
99%
100%
12%
65%
70%
96%
100%
81%
90%
I 00%
100%
13%
8%
2%
100%
100%
5%
100%
6%
21%
3%
17%
O.OOE+IO 34
5.80E+00 24
3.00E+O2 4
1.80E+OO 0
2.20E+OO 9
l.lOE+Ol 0
3.30EtOl 15
2.20E+Ol 22
S.OOE-02 66
1.70E+01 1
4.90E+O2 0
3.50E+Ol 0
4.80E+00 1
2.20E-01 4
4.30E-01 0
4.50E+Ol 0
1.50E+O2 0
NA NA
NA NA
NA NA
NA NA
NA NA
NA NA
Table 5-13. (continued).
Contaminants phthalate
Butylbenzyl- phthalate
Carbon Disulfide
Chlorobenzene
Di-n- butylphthalate
Diethyl-phthalate
Metbylene Chloride
Pentachloro- phenol
TObKlK
Trichloroethane
Am-241
Ce-144
Co-60
cs-134
cs-137
Eu-154
H-3
I-129
Np-237
Pu-238
Pu-239!240
Ru- 106
Soil Concentration (&kg [nonradionuclide] or pCi/g [radionuclide])
Minimum Maximum Arithmetic Standard
M&III Deviation RMEb
INEEL Number of Number Number Frequency Background” Samples
of of of (mgh 01 Greater than Samples Detects Detection PCgg) Background
4.00E-02 J I .40E+OO 6.12E.01
I .40E-02 1.40E.02 1.40E.02
I .OOE-03 J 1 .OOE-03 J I.OOE-03
3.80E-02 J
4.10E-02 J
1.30E-01 J
4. IOE-02 J
8.92B02
4.1 OE-02
2.00E-03 J 2.40E-02 J 9.63E.03
3.70E-01 J
1 .OOE-03 J
I .OOE-03 J
8.00E-02 J
4.00E-01
1.60E-01
1.50E-01
1 .OOE-01
2.80E-01
6.10E-01 I
1.46E+OO
6.30E-01
9.00E-02
5.00E-02
I .40E+OO
3.70E.01 J
I .OOE-03 J
I .OOE-03 J
7.80E+00
1.50E+OO
2.35EWO
3.50E+OO
I .80E+02
4.00E+OO
6.10E-01 J
3.70EtOO
I .63E+OO
3.04E+Ol
2.07E+OO
5.97E+OO
3.70E.01
l.OOE-03
I .OOE-03
6.31E-01
9.23E-01
5.99&01
1.50E+OO
4.06E+01
I .63E+OO
6.10E.01
2SOE+OO
l.l2E+OO
6.loE+oo
5.49E-01
3.45E+OO
6.75E-01 I .96E+OO
NA NA
NA NA
4.74E.02 1.84E-0 1
NA NA
7.44B03 2.45E.02
NA NA
NA NA
NA NA
I .46EWO 3.55E+OO
5.52E.01 2.03E+OO
6.43E-01 1.89E+OO
9.23E.01 3.35E+OO
4.67E+Ol 1.34E+02
1.26E+OO 4.15E+OO
NA NA
9.67&01 4.43E+OO
2.90E-01 I .70E+OO
7.50E+OO 2.11lz+o1
5.43E-01 I .64E+OO
1.9lE+OO 7.27E+OO
29 4 14%
33 1 3%
33 1 3%
29 5
29 I
17%
3%
33 8 24%
29 1 3%
33 1 3%
33 1 3%
53 27 51%
58 3 5%
58 12 21%
58 23 40%
58 43 74%
38 7 18%
10 1 10%
20 4 20%
IO 10 100%
53 36 68%
53 22 42%
58 7 12%
NA NA
NA NA
NA NA
NA NA
NA NA
NA NA
NA NA
NA NA
NA NA
l.lE-02 27
NA NA
NA NA
NA NA
8.2E-01 35
NA NA
NA NA
NA NA
NA NA
4.90E-03 36
I .OOE-01 21
NA NA
!
Table 5-13. (continued).
Contaminants
Sb-125
Sr-90
U-234
U-235
U-2351236
U-238
Soil Concentrat ion (mg/kg [nonradionuclide] or pCi/g [radionuclide])
INEEL Number of Number Number Frequency Background’ Samples
Arithmetic Standard of of of bwg 01 Greater than Minimum Maximum Meall Deviation RMEb Samples Detects Detection PCug) Background
3.lOE.01 5. IOE+OO 1.76E+OO I .73E+OO 5.22E+OO 58 8 14% NA NA I .20E-01 1.63E+Ol 2.07E+OO 3.73E!-OO 9.53E+OO 54 24 44% 4.90E-01 20
O.OOE+OO 2.75E+OO 9.98E-01 5.12E-01 2.02E+OO 53 53 100% 1.44EHIO 6 7.00E-02 7.00E-02 7.OOE-02 NA NA 43 1 2% NA NA
1 .OOE-01 I .OOE-0 1 l .OOE-01 NA NA 10 1 10% NA NA 9.00E-02 2.60E+OO 8.92E.01 4.37E-01 1.77E+OO 54 50 93% 1.4E+OO 4
Y-90 l.lOE-01 1.20EtOO 4.04E.01 4.05E.01 1.21E+00 11 7 64% NA NA
Based on the investigative results, the zone of contamination for SWP-1 is estimated to be about 1.8 m (6.0 ft) thick, and extends from the surface to 1.8-m (6.0-R) bgs. Based on the dimensions of SWP-1, the volume of contaminated soil beneath SWP-1 was estimated to be 32,922 m’ (1,180,800 ft’).
Based on the investigative results, the zone of contamination for SWP-2 is assumed to be 1.8-m (6.0-ft) thick, and extends from the surface to 1.8-m (6.0~ft) bgs. This depth is based on the decrease in radionuclide COPCs with depth, and the low activities measured in deeper samples. Based on the dimensions of the pit, the volume of contaminated soil beneath the pit was estimated to be 14,814 m3 (1,500,000 A’).
5.3.3.11 CPP-34 A/B (Soil Storage Area). Site CPP-34 is a soil storage trench in the northeast comer of the INTEC. The area is 4,366 m’ (47,000 ft2). In 1984, radionuclide-contaminated soil at levels up to 30 mFUhr was removed from a pile east of CPP-603 and disposed of in the trench. The soil was originally excavated from Site CPP-33. Contaminants included nitric acid and radionuclides, including Cs-137, U-234, U-238, Np-237, Sr-90, and Pu-238. Table 5-14 shows summary sampling results statistics for CPP-34. Based on the investigative results, the primary COCs at this site are Cs-137 and Sr- 90. The zone of contamination assumed for this site is from 0 to 6.1 m (0 to 20 ft). The volume of contaminated soil was estimated to be 20,912 m’ (738,500 ft’). An average width of the trench (10.7 m [35 ft]) was used to calculate soil volumes, as the width ofthe trench varied from 13.7 to 7.6 m (45 to 25 ft).
5.3.3.12 CPP-13 (Release from Solid Storage Cyclone NE of CPP-633). Site CPP-13 resulted from an air release of calcined, radioactively-contaminated waste. Site CPP-13 is located on an earthen berm covering underground storage Bin Set 3 which contains calcined high-level radioactive waste (WINCO 1993~). While attempting to clear a reseiction in the solid storage cyclone (WC-912) on October 26, 1976, the cyclone became overpressurized and blew contaminated granular solids into the air.
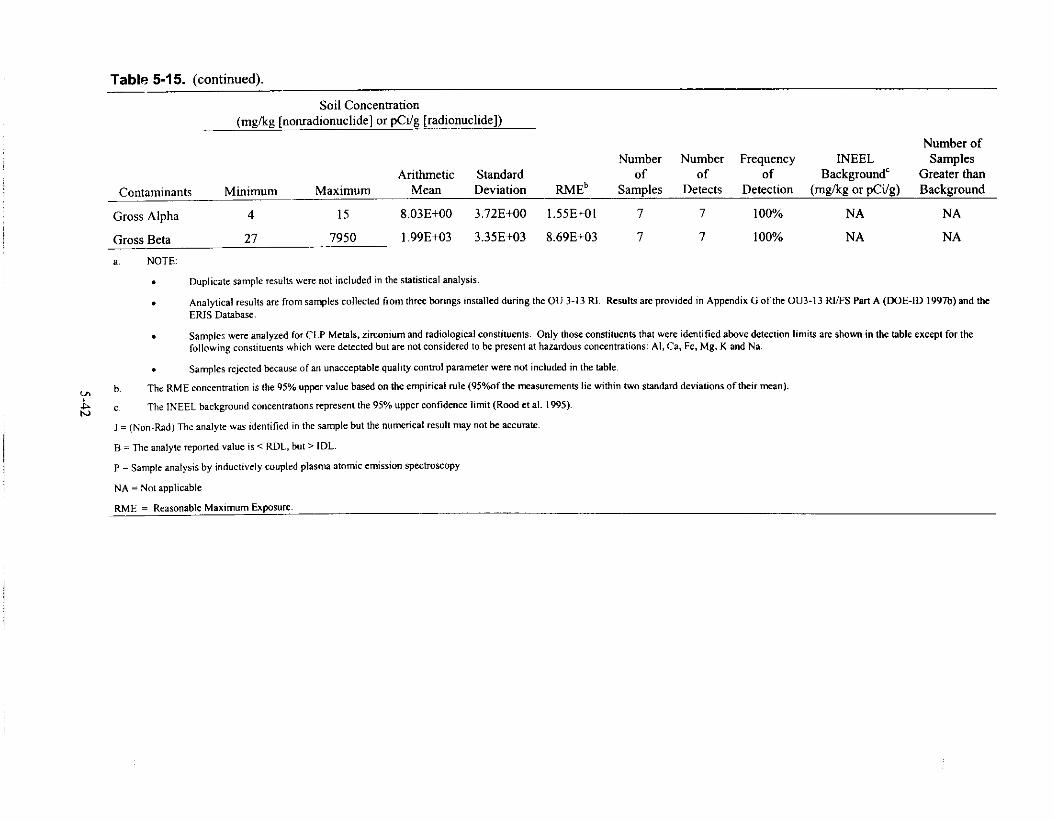
The release contaminated the roof of building CPP-747, located on the top of the concrete-vaulted storage bin and the berm area northeast of building CPP-747. Subsequent cleanup efforts were successful in decontaminating the top of building CPP-747. Surface soil from the bin set area contains radioactivity levels ranging between 800 and 3,000 counts per minute (cpm). The contamination over the berm area was left in place and covered with approximately 0.15 m (6 in.) of clean soil. Summary sampling results statistics for soil contaminants are given in Table 5-15.
The zone of contamination at CPP-I3 is assumed to extend throughout the estimated 7.6-m (25-ft) high berm to approximately 0.8 m (2.5 ft) below the base of the berm (original ground surface). The area of CPP-13 is estimated at 366 m2 (3,949 f?).
X3.3.73 CPP-19 (CPP-603 to -604 Line Leak). This site resulted from a 1978 release of 7,570 L (2,000 gal) of radionuclide-contaminated liquid that leaked from an underground waste transfer line between CPP-603 and WL-102 in CPP-604. The waste transfer line was constructed of 304 stainless steel that reduced from a 3.81-to 3.18-cm (l-112- to l-l/4&.) diameter line and ran for 530 m (0.33 mi) at a depth of approximately 1.5 m (5 ft) bgs. The major area of contamination was estimated at the time to be approximately 10 m- (108 ft2) on the surface. The waste transfer line was abandoned in place after the leak was discovered. Table 5-16 shows summary sampling results statistics for soil contaminants for CPP-19.
Numerous radionuclides were identified as COPCs for Site CPP-19. Cesium-137, Sr-90, and isotopes of europium are the most widespread and are found at the highest activity levels. These COPCs range in activity as high as 408,000 pCi/g for Cs-137 at boring CPP-19-2 drilled at the site of the release.
5-38
I Table 5-14. Summary sampling results statistics for soil contaminants at Site CPP-34.3
- Soil Coacentratiott
(m~/kg~nonradionuclidel or pCi/g [radionuclide])
Contaminants
A8
As
Ba
Be
Cd
Cl
CO m CU s
Fluoride
Hg
Ml1
Ni
Pb
Se
Sulfide
V
Zn
bis (2.ethylhexl) phalate
cs-137
Np-237
Minimum Maximum Arithmetic
MeaIl
2.20E+OO
3.96E+OO
I .07Et02
S.OOE-01
7.80E-01
1.53l?+01
5.6OE+OO
I .49E+ol
I .93E+OO
3SOE.01
I .94E+O2
I .96E+Ol
1.41E+Ol
7.00E-01
3.95E+Ol
1.97Eiill
6.33E+Ol
Number of
Samples
20
20
20
2
20
20
2
2
15
20
2
2
20
20
5
2
2
Frequency Backgroundc Greater than of Detection (mgikg or pCi/g) Background
1.90E+oo 2.soE+oo
I .50E+OO 7.loE+oo
5.28E+Ol 2.39E+02
S.OOli-01 S.OOE-01
6.00E.01 I .ooE+Oo
9.loE+oo 2.80E+Ol
3.60E+OO 7.60EtOO
1.27E+Ol 1.7lE+Ol
1 JOE+00 2.60E+OO
l.OOE-01 6.00E-01
1. IOE+02 2.69E+o2
1.3lE+Ol 2.60E+Ol
3.00E+OO 1.32E+O2
7.00E-01 7.00E-01
2.18E+01 8.14E+Ol
1.72E+Ol 2.2lE+OI
3.71E+Ol 8.95E+Ol
4.24&01
1.86E+oo
4.87EtOl
NA
2.05E-01
4.12E+OO
2.83E+00
3.llEHIO
3.72&01
3.54B01
l.O6E+O2
9.12E+OO
2.8lE+Ol
O.OOE+OO
2.46E+Ol
3.46E+00
3.7lE+01
3.05E+OO
7.68E+OO
2.04E+02
NA
I. 19E+oo
2.35E+Ol
1.13lT+01
2.1 lE+Ol
2.67E+OO
I .06E+OO
4.06E+02
3.78E+Ol
7.03E+Ol
7.00E-01
8.87E+Ol
2.66E+Ol
1.38E+02
Number of
Detects
2
20
20
I
5
20
2
2
IS
2
2
2
20
I
s
2
2
10%
100%
100%
50%
25%
100%
100%
1.00%
100%
10%
100%
100%
100%
5%
100%
100%
100%
4.60E-01 6.20E01 5.40E-01 l.l3E-01 7.66E.01 20 2 I 0%
1. I OE+OO 2.00E+03 3.96E+02 6.13E+02 I .62E+O3 20 I6 80%
7.00E-01 7.OOE-0 I 7.00E.01 NA NA 20 I 5%
Standard Deviation RMEb
INEEL Number of
Samples
O.OOE+OO 2
5.80E+00 4
3.OOE+O2 0
1.80E+oo 0
2.20EHtO 0
3.30EWl 0
l.lOE+Ol 0
2.20E+Ol 0
NA NA
S.OOE-02 2
4.90E+O2 0
3.50E+Ol 0
1.70E+Ol 2
2.20E-01 1
NA NA
4.50EtOl 0
I .50E+O2 0
NA NA
8.20E.01 16
NA NA
Table 5-14. (contintlcd)~
Table 5-15. Summary sampling results statistics for soil contaminants at Site CPP-13.”
Soil (‘oncentration (mgikg ~nonradionuclide] or pCi/g [radionuclidel)
Contaminants Minimum Maximum
Number of Number Number Frequency INEEL Samples
Arithmetic Standard of of of BackgroundC Greater than MeatI Deviation RMEb Samples Detects Detection (mgikg or pCi/g) Background
AS
Da
Be
CO
CT
CU
111: “I b MI1
Ni
Pb
Se
V
Ztl
Zr
Co-60
a-1 34
es-137
ELI- 154
s-90
l.c.99
5.30E+OO BP 8.3OWOO P
7.58E+Ol P l.l3r:~to2 P
3.80E-01 BP 5.301-01 BP
4.10E+OO BP 5,6Oli+OO BP
l.lGE+Ol P 1.71Ei-01 P
1.2013+01 JP 1.74WOl JP
I .30E-01 P.IOE-01
L39E+02 JP 2..57E+02 JP
1.4lE+ol P 1.97E+OI P
6.30E+OO P 1.391ii~Ol P
6.80E-01 BP 9.60E-01 BP
1,69E+Ol P 2.65E+Ol P
3.84E+Ol P 8.59E+Ol P
7.50E+OO P I .23E+Ol P
4.90E-01 9.00E-01
6.00E-01 6.00E-01
B.OOE-02 4.63E+03
2.20E+Ol 3.10EtOl
4.70EKIO 4. I BE+03
9.00E-01 2.70E+OO
6.30E+OO
8.93E+Ol
4.36E-01
4.61E+OO
1.37E+Ol
I .42E+O I
4.40E-01
I .82E+02
1.57E+Ol
8.46E+OO
8.40E-01
2.1lE+Ol
4.99E+Ol
l.ObE+Ol
6.95E-01
6.00E-01
1.21EtO3
2.65E+Ol
1.37EtO3
I .67E+OO
I .02E+OO
1.39E+Ol
5.13&02
5.70E-01
2.2sE+oo
2.0 I E+OO
4.14E-01
4.07E+OI
2.23E+OO
2.5lEtOO
1.24E-01
3.34E+OO
1.64E+Ol
1.57E+OO
2.90E-01
NA
2.04EtO3
6.36E+OO
1.93E+03
9.29E-01
8.34E+OO
l.l7E+02
5.39E-01
5.75l3+00
1.82E+Ol
I .82E+Ol
1.27E+OO
2.63EtO2
2.02E+Ol
1.35EtOl
I .09E+OO
2.78E+Ol
8.27E+01
1.37E+Ol
1.28EtOO
NA
5.29EHl3
3.92E+01
5.23E+03
3.53E+OO
7 7 100%
7 7 100%
7 7 100%
7 7 100%
7 7 100%
7 7 100%
7 3 43%
7 7 100%
7 7 100%
7 7 100x
7 4 57%
7 7 100%
7 7 100%
7 7 100%
7 2 29%
7 1 14%
7 7 100%
7 2 29%
5 5 100%
4 3 75%
5.80E+oo 4
3.00E+O2 0
I .80EtOO 0
l.lOE+Ol 0
3.30E+OI 0
2.20E+Ol 0
5.00E-02 3
4.90E+02 0
3.50EHIl 0
1.70E+Ol 0
2.20E-01 4
4.50EtOl 0
I .50E+02 0
NA NA
NA NA
NA NA
8.20E-01 6
NA NA
4.90E-01 5
NA NA
Table 5-15. (continued).
Soil Concentration (mg/kg [nonmdionuclide] OI pCi/g [radionuclide])
Number of Number Number Frequency INEEL Samples
Arithmetic Standard of of Background’ Greater than Contaminants Minimum Maximum M~~ll Deviation RMEb Samples Detects DetzAion (mgikg or pCi/g) Background
Gross Alpha 4 15 8.03E+OO 3.72E+OO 1.55E+OI 7 7 100% NA NA
Gross Beta 27 7950 1.99E+03 3.35E+03 8.69E+03 7 7 100% NA NA
a. NOTE:
. mplicate sample resuhs were “at included in the statistical analysis.
. Analytical rewlts arc from samples collected from three borings installed during the Oli 3-t 3 RI, Results are provided in Appendix G of the OW-13 RVFS Pan A (WE-ID 1997b) and the ERIS Database.
Table 5-16. Summary sampling results statistics for soil contaminants at Site CPP-19.”
Soil Concentration mg/kg nonradionuclide or pCi/g radionuclidc )
Contaminants Minimum
Number of Number INEEL Samples
Arithmetic Standard of Number Greater than Maximum M~.Tl Deviation RMEb
Frequency BackgroundC Samples of Detects of detection (mgikg or pCi/g) Background
AS
Da
Be
CL3
Cd
co
Ilg
MI1
Ni
Pb
Sb
V
Zll
Am-24 I
Co-60
a-134
Cs-137
h-1 52
Iill- IS4
3.10E+OO JP
4.45E+Ol P
I .bOE-01 P
2.18E+03 P
I .30E-0 1 BP
I .90E+oo BP
5.10E+OO JP
6.OOE+OO P
l.SOE-01
9.1 IE+Ol P
8.40E+OO P
3.80EHO JP
5.30E-01 BP
6.50EtOO BP
2.21EtOl NJP
1.97E+OO
1.90E-01
S.OOE-02
6.00E-02
1.52E+OO
1.70E.01
7.001:+00 JP 4.65E+OO 1.23E+OO
1.84lii~O2 P l.O3E+02 4.64E+Ol
6.601:.-01 P 4.08E.01 1.56E.01
2.3213+05 P 3.53E+04 6.97E+04
9.601:.01 BP 4.33E-01 2.92&01
X.201<+00 BP 4.77E+OO 2.00E+OO
2.63E+Ol P I .54E+Ol 7.45EtoO
I .67E+Ol P 1.25E+Ol 3.85EtOO
LSOE-01 I .SOE-0 1 O.OOE+00
2.941:.+02 NJP I .80E+02 6.77E+01
2.64E+Ol P I .65E+ol 5.76E+OO
LOlEt P 6.86E+oo I .80E+00
8.3OE-01 B P 7.12E.01 1.13E.01
3.64E+Ol P 1.94EKIl I .04E+O1
8.60E+OI P 4.7SE+OI 2.00E+Ol
I .97E+OO I .97E+OO NA
2.16E+04 I .08E+O4 I .53E+O4
6.00E-02 5.50&02 7.07&03
4.08Ei05 3.40iz+04 l.l8E+05
8.7GE+04 2.92Ei~04 5.06E+04
5.35E+04 I .34Ei~04 2.67E+O4
7.1 lE+OO
1.96E+02
7.20E-01
1.75E+05
l.O2E+OO
8.77E+OO
3.03E+Ol
2.02E+Ol
1.50E.01
3.15EtO2
2.80E+Ol
I .OSE+Ol
9.38E-01
4.02E+Ol
8.75E+Ol
NA
4.14E+04
6.91E-02
2.70E+O5
I .30E+05
6.68E+04
10
IO
IO
IO
21
IO
IO
IO
IO
IO
IO
IO
10
IO
10
3
21
10
21
11
21
IO
IO
IO
IO
IO
IO
IO
IO
I
IO
IO
IO
6
IO
10
1
2
2
12
3
4
100%
100%
100%
100%
100%
100%
100%
I OO”/
10%
100%
100%
100%
60%
100%
100%
100%
I 0%
20%
57%
27%
19%
5.80E+OO 1
3.OOE+O2 0
1.80EMO 0
2.40E+O4 2
2.20EHlO 0
l.lOEtfJl 0
3.30EtOl 0
2.20E+Ol 0
5.00E-02 1
4.90E+O2 0
3.50E+Ol 0
1.70EHIl 0
4.8OE+OO 0
4.5OE+Ol 0
1 SOEtO2 0
l.lOE-02 1
NA NA
NA NA
8.2OE-01 10
NA NA
NA NA
Table 5-16. (continued).
Soil Concctllration mrlkg [nonradionuclide] ur pCi/S [radionuclidel)
Contaminants Minimum Maximum
Number of Number INEEL Samples
Arithmetic Standard of Number Greater than MCVl Deviation RMEb
Frequency Background’ Samples of Detects of detection (n&g or pCi/g) Background
Eu-155 I .6OE-01 9.62E-iO3 3.2lE+O3 5.55E+03 I .43E+O4 21
Nb-95 6.00E-02 9.00E.02 7.33&02 1.53&02 I .04E-01 10
Pu-2391240 I .4 I I?+02 I .41 Ei.02 1.41EtO2 NA NA I
ST-90 2.8SE+Ol 1.25WOS 2.68EKI4 5.02E+O4 I .27E+05 IO
U-235 I .73E-02 2.361’i 00 8.17E-01 I .34E+~OO 3SOE+OO 5
11.238 I .56E-01 4.53~~01 2.58&01 1.69E.01 5.96E-01 S
Gross Alpha I .57E+OO I .6 1111-04 1 .SOE+03 4.50E+03 1 .OSE+O4 21
. I~oplic~ic smplc R!S”I,S were I”<11 included ill he S1illiSliC.I zmalysis.
3 14% NA NA
3 30% NA NA
I 100% 1 .OOE-01 1
8 80% 4.90E-01 8
3 60% NA NA
3 60% 1.40E+Oa 0
I 9 100% NA NA
21 90% NA NA
The COPCs were detected at activity levels above background in samples collected just above the soil/basalt interface at approximately 9.2 m (3 1 ft) bgs. The zone of contamination is assumed to extend from the ground surface to the soilibasalt interface. The area of site CPP-19 has been expanded to the north, west, and south based on the soil boring results. The area of Site CPP-19 is estimated to be 306 m2 (3,300 f?).
5.3.3.74 CPP-92 (Soil Boxes West of CPP-1617). This site is a group of 648 boxes of soil located west of CPP-1617 that contain soils and debris with low levels of radioactive contamination. The 0.6 x 1.2 x 2.4 m (2 x 4 x 8 ft) and 1.2 x 1.2 x 2.4 m (4 x 4 x 8 fi) boxes are constructed of 1.9~cm (0.75-in.) plywood and are lined with a polyethylene membrane. The soils were generated during various INTEC activities, including the Tank Farm upgrade, CERCLA remedial projects, the CPP-603 cleanup, excavation for the fire exit from building 604/605 and miscellaneous excavations at MTEC where soil contamination was encountered. Most of the boxes contain soil with such low levels of contamination that the RWMC will not accept the waste for disposal.
Boxed soil from the excavation for the fire exit from building 604/605 was sampled and analyzed for inorganics, VOCs, and radionuclides. Sampling results data for the soil generated during the 6041605 excavation are provided in Table 5-3.
The COPCs identified from contaminant screening for the various excavation activities are arsenic, Am-241, Cs-134. Cs-137, Co-60, Eu-152, Eu-154, I-129, Np-237, Pu-238, Pu-239/240, Sr-90, Sb-125, U-234, and U-235. VOCs were not detected in the samples. The only inorganics detected above background were arsenic at 5.9 mg/kg and mercury at 10.4 mgikg. Mercury was below the EPA Region III risk-based soil concentration of 23 mgikg residential, noncarcinogenic soil screening level. These contaminants are consistent with the types of contaminants contained in the service wastes and condensates from the PEW evaporator that have historically included nitric acid, mercury, plutonium, cesium, and strontium.
The soil and debris are contained in polyethylene-lined boxes that have not deteriorated. Therefore, it is assumed that significant amounts of contaminated soil have not leaked from the boxes and that lateral and vertical contaminant migration from the box staging area have not occurred. Assuming that the boxes are 80% full, there is a total of approximately 1,000 m3 (37,000 ft3) of soil in the boxes.
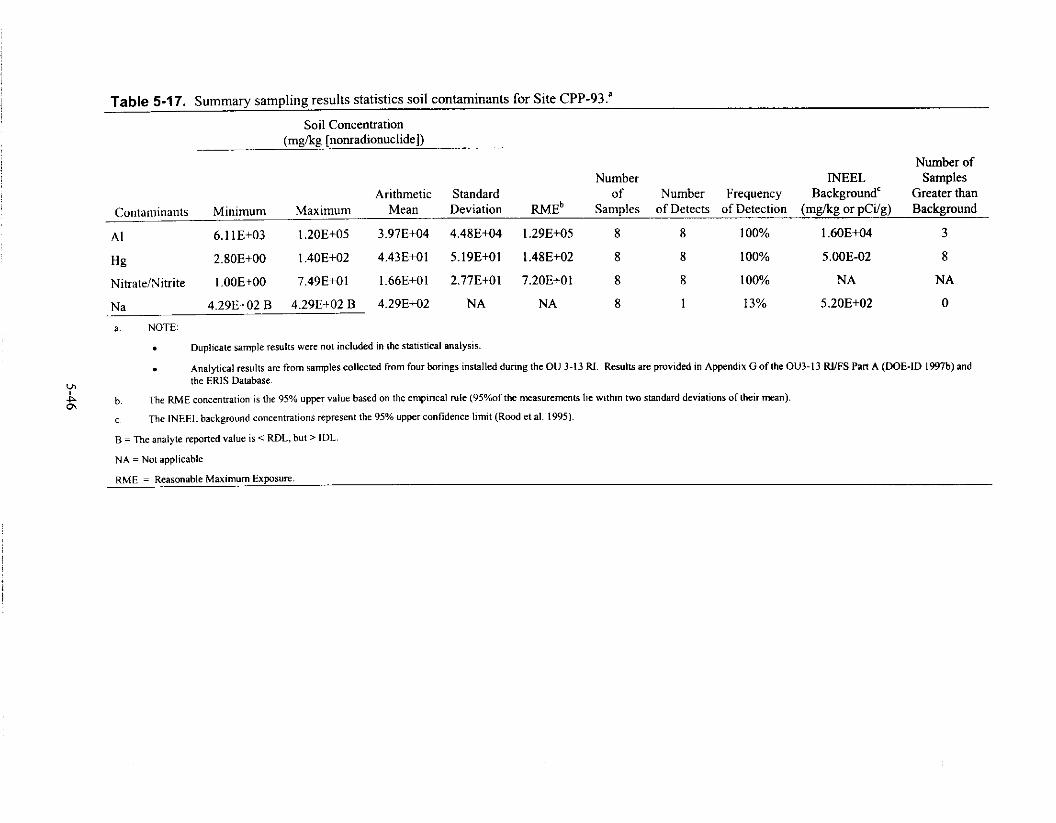
5.3.3.15 CPP-93 (Simulated Calcine Disposal Trench). This trench was excavated in the early to mid-1960s and was used to dispose of simulated calcine test batches before hot startup of the WCF. Ten test batches of solution containing aluminum nitrate, nitric acid, sodium nitrate and boric acid were calcined and disposed in the trench. None of the test batches contained radionuclides; however, one test batch contained mercuric nitrate. Sampling and analysis identified mercury, aluminum, nitrate/nitrite and sodium as contaminants. Table 5-17 shows soil contaminant summary sampling results statistics for CPP-93.
The nonradioactive simulated calcine associated with Site CPP-93 was generated in 1961 and 1962 during testing of building CPP-633 waste calcining equipment and systems before operation with high-level radioactive waste. Historical operator log entries and photographs indicate that several tons of simulated calcine material were disposed in the trench. The trench was approximately 61 m (200 ft) in length and 2.4 m (X ft) in width at the bottom, sloping to 4.9 m (16 ft) in width at the top. The trench contained I. I to 1.2 m (3.5 to 4 ft) of nonradioactive calcine before being backfilled to grade with approximately 1.2 m (4 ft) of topsoil. Based on photographs and operator logs, the trench was used for simulated cnlcine disposal from 1964 through 1966.
5-45
Table 5-17. Summary sampling results statistics soil contaminants for Site CPP-93.’
Soil Concentration (m&g [nooradionuclide]) -
Number of Number INEEL Samples
Arithmetic Standard of Number Frequency Background’ Greater than Contaminants Minimum Maximum MeaIl Deviation RMEb Samples of Detects of Detection (mgikg or pCi/g) Background
Nitrate/Nitrite I .OOE+OO 7.49E+Ol 1.66E+O I 2.77E+Ol 7.20EtOl 8 8 100% NA NA
Na 4.29E+02 B 4.29E+O2 B 4.29E+O2 NA NA 8 I 13% 5.20E+O2 0
a. NOTE:
. Duplicate sample reesults were not included in the statistical analysis
. Analytical results are from samples collected From four brings installed during the 0” 3-13 RI. Resuk.5 are provided in Appendix G of the OU3-13 RUFS Pan A (DOE-ID 1997b) and the ERIS Database.
cp A? b. The RME concentration is the 95% upper value based on the empirical rule (95Ydlhe masurements lie within two standard deviations oftheir mean).
c The ,NEEL backgro”nd conce”trations represent the 95% upper co”menee limit (Rood et al. IW5,.
B = the analyte repand value is < RDL, but > ID1
NA = Not applicable
RME = Reasonable Maximum Exposure.
During the investigation more than 60 borings were drilled to define the simulated calcine. Because the calcine was easily identified visually only a few samples were collected for laboratory analysis. The analytical results from borings CPP-93-1 through CPP-93-4 confirm the presence of thin layers of simulated calcine material in the vicinity of a trench located southeast of building CPP-603. The presence of simulated calcine material is supported by visual observations in the borings and elevated concentrations of mercury, aluminum, nitrate/nitrite, and sodium. The observed calcine was only 3- to 5-cm (l- to Z-in.) thick.
Samples of the simulated calcine contain elevated concentrations of mercury, aluminum, nitrate/nitrite, and sodium. Concentrations of sodium, nitrate/nitrite, and aluminum appear to decrease with depth in the borings to background levels but mercury concentrations are still above background at the deepest samples in the borings. The full extent of mercury above background has not been defined but the analytical data suggest that mercury concentrations would continue to decrease with depth below 3.0 m (10 ft). The results of additional borings drilled outside of the area of the trench indicate that significant lateral migration of mercury and aluminum from the buried calcine has not occurred.
The contaminated zone for this site is assumed to be from 0.8 to 7.6 m (2.5 to 25 ft). A volume of contaminated soil of 2,039 m3 (72,000 ft3) was estimated based on the reported dimensions of the trench. A trench width of 4.9 m (16 ft) down to a depth of 7.6 m (25 ft) was used to account for some lateral migration of COPCs. This site is being addressed as an ecological risk site.
,. ,.
5.3.3.76 CM’-74 (Decommissioned Sewage Treatment Plant). Site CPP-14 is the site of a decommissioned sewage treatment plant that operated from 1951 through 1982. The treatment plant processed sanitary wastes from nine facilities at the INTEC. Site CPP-14 is located in the north-central portion of the INTEC. south of Cypress Avenue, east of Beech Street, and north of the INTEC Tank Farm as shown on Figure l-5. Site CPP-14 was determined in the RIlsRA (DOE-ID 1997b) to be solely an ecological concern due to the presence of mercury at a depth greater than 9 feet.
The treatment plant consisted of two Imhoff digestion tanks, a trickling filter, a chlorine contact basin, sludge drying beds, and a drain field. Raw sewage was initially digested in the Imhoff tank followed by secondary treatment of the effluent in the trickling filter. The digested sludge was transferred to the sludge drying beds, while liquid effluent from the trickling filter was chlorinated and discharged to the drain field.
The sewage treatment facility was demolished as part of the Utility Replacement and Expansion Project (UREP) to upgrade INTEC facilities. Demolition was completed in September 1983 and reportedly consisted of:
. Removing the wastewater treatment facilities and associated equipment to a depth of 1.5-m (5- ft) belowgrade
. Removing and disposing of all remaining sludge in the drying beds
. Removing all buried piping, except the 0.3-m (12-in.) influent line and the 0.15-m (6-in.) effluent lines from the chlorine contact basin to the drain field.
The excavated area was backfilled and graded to match the surrounding ground surface
The influent manhole, ejector pit, Imhoff tanks, final tank, and chlorination tank extended to as deep as 6.1 m (20 ft) belowgrade. The lower portions of these facilities were left abandoned in place.
5-47
Demolition planning documents stated that drainage holes approximately 0.09 m’ (1 ft*) would be cut in the bottoms of all abandoned structures to prevent accumulation of infiltrating surface water. Also left in place were the 0.3 m (12 in.) diameter influent line, the 0.15 m (6 in.) effluent line to the drain field, and the drain tield distribution piping.
The extent of contamination at the former sewage treatment plant was evaluated based on the results of sampling. The zone of contamination in the area of the Imhoff Tanks is assumed to be 0.9 m (3.0 A) thick, and extends from 2.4 to 3.4 m (8 to 11-A) bgs. This thickness is based on the initial depth at which sludge was encountered in sampling, and the depth of the base of the tanks. The area of the tanks is 18.6 m* (200 ft*). Radionuclide COPCs at this site include Cs-137, Np-237, U-235, and Sr-90. Of these, Cs-137, Np-237, and Sr-90 were detected at activities above 1.0 pCi/g. Cs-137 activity ranged as high as 6.21 pCi/g.
The zone of contamination at CPP-14 Plant site was assumed to be 8.2 m (27 ft) thick. This zone extends from 1.5 to 9.7 m (5.0 to 32.0 A) bgs. The area of CPP-14 Plant site measures 900 m2 (9,860 ft*). Numerous radiological COPCs were detected in multiple plant site area samples. These include Cs-137, U-234. U-238, and Np-237. Of these, U-234 and U-238 were detected at the highest activities, 6.89 and 52.1, respectively. Cs-137 and Sr-90 detections were also common, but at lower activities. Table 5-18 provides summary sampling results statistics for soil samples collected at CPP-14.
The zone of contamination at the drain field is assumed to extend t?om 4.3 to 7.6 m (25 ft) bgs. The top of this interval is based on the depth of the drain field piping. The area of CPP-14 drain field is estimated to be 306 m’ (3,300 ft’). Radiological COPCs at the drain field are Np-237 and Sr-90. Of these COPCs, only Np-237 was detected above 1 pCi/g. Np-237 was detected at a maximum activity of 1.4 pCi/g.
5.3.3.f 7 CPP-37A (Gravel Pit ##I). Site CPP-37A (Pit #l) is located outside of the INTEC security fence and measures approximately 43 m (140 A) in width 64 m (210 ft) in length and is 4.3 m (14 ft) in depth. No information is available on the date pit usage began; however, Pit #l was used for decontamination of radiolonuclide-contaminated construction equipment during July and October 1983. In addition, during 1982 and 1983, the pit was used as a percolation pond for INTEC service wastewater while the injection well was being refitted. This pit currently receives stormwater runoff from the INTEC.
Soil samples were collected from Pit #l in 1991. Analytical results are summarized in Table 5-19. Based on the contaminant screening, COPCs identified for Pit #l were arsenic, Co-60, Am-241. Cs-137, Np-237, Pu-238, Sr-90, U-235, and U-238. The Track 2 investigation for Site CPP-37 (WINCO 1994a) Pit #l indicated that arsenic was detected above background in eight out of 14 samples collected. However, the maximum arsenic concentration was only 8.7 mgikg relative to the background value for arsenic of 5.8 mgikg.
Radionuclides detected above background in soil samples collected in Pit #l were Am-241, Cs-137, Pu-238, Sr-90, and U-238. Other radionuclides that do not have a background value were detected at low concentrations including (maximum concentrations in parentheses): Co-60 (0.55 pCi/g), Np-237 (1.07 pCi/g) and U-235 (0.05 pCi/g). No radionuclides were detected in the 0- to 0.3-m (O- to 0.5-ft) samples except for Sr-90 at 0.69hO.12 pCi/g in the southwestern portion of the pit. Radionuclides were not detected above background in the deep borehole below 4.6 m (15 ft).
The contaminated zone at Pit #l is assumed to extend from 0 to 3.0 m (10 ft). The area of Pit #I is 2,731 m’ (29,400 ft’) and 9,179 m’ (98,800 ft*) based on the dimensions reported in the Track 2 (WINCO 1994a).