The Information Intelligence LifecycleAs data moves to intelligence it goes through four distinct stages. The stages define
the activities that represent how the data is used to drive business decisions.
Collection (Transactional)Collection represents the initiation of data access and transformation from the underlying operational systems. At this point data is transactional, but begins to transform into a structure that makes it usable in a BI system.
Reporting (Operational)Reporting is the first effort to begin to define how data will be organized into meaningful information on a regular or standardized basis. It is the most common form of BI content and is often delivered through more sophisticated analysis tools. Yet, the use case for the information is not considered analytical at this stage.
Analysis (Tactical)Analysis is a stage of the information use case that is a critical maturity point for an organization because it drives a better understanding of performance. It also opens the door for interactive comparison and correlation of established data elements. Trending usually begins here.
Visualization (Strategic)Visualization represents a use case in which performance management, through the use of dashboards and scorecards, becomes influential on analyzing adherence to corporate strategy. Some companies try to do this early, but without the definitions created by stages 2 and 3 it rarely works out.
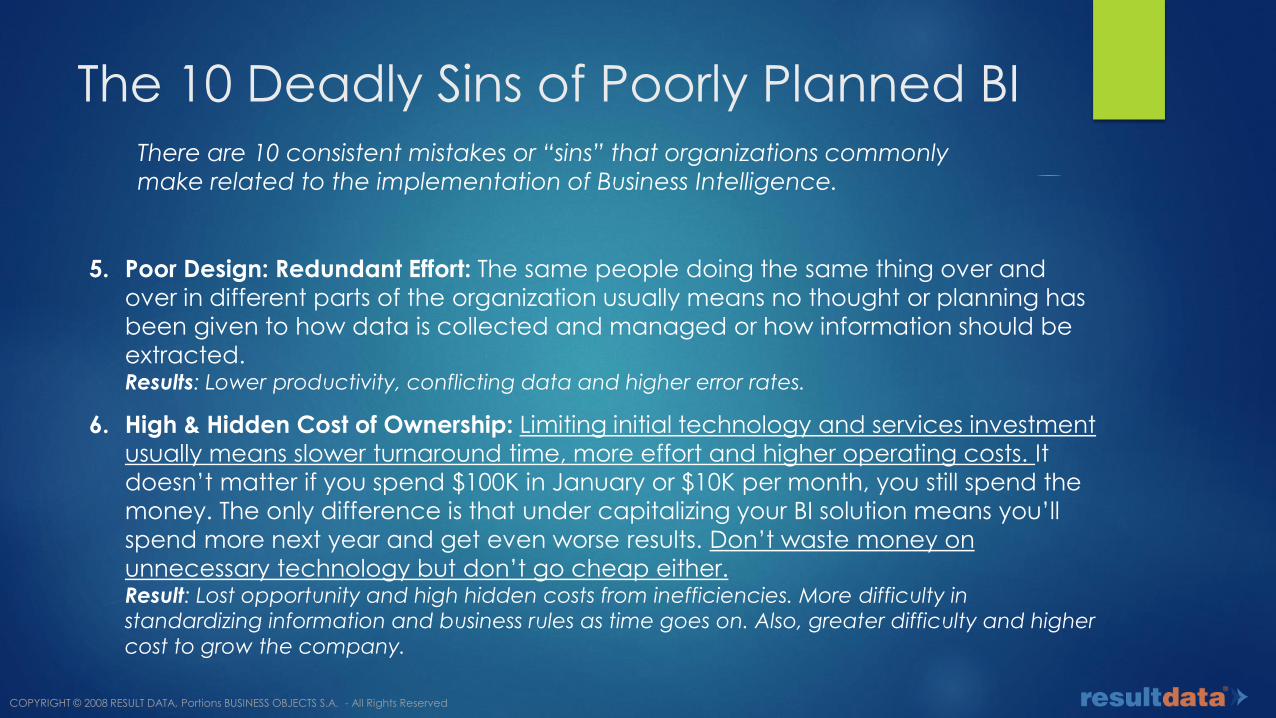
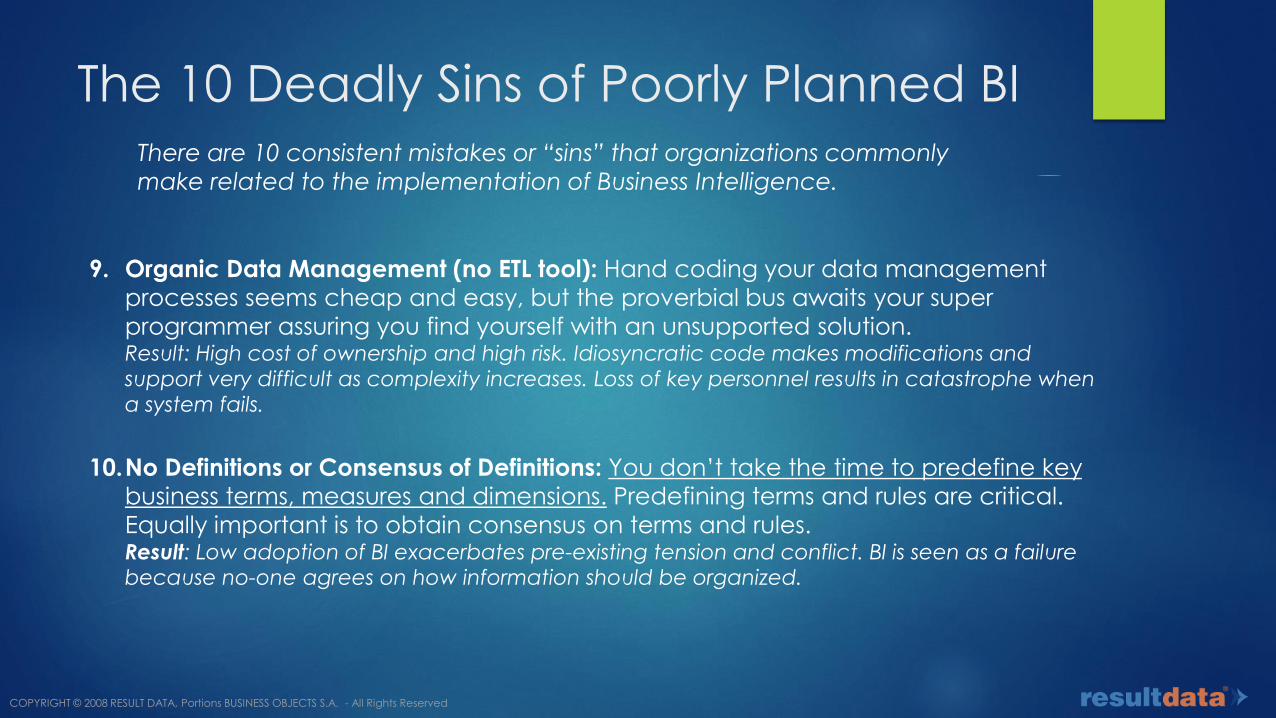
The 10 Deadly Sins of Poorly Planned BIThere are 10 consistent mistakes or “sins” that organizations commonly
make related to the implementation of Business Intelligence.
3. No Data: Delayed Decisions: If it takes a long time to make a decision then in all
likelihood the decision maker doesn’t have a way to get the data needed to make
the decision.Result: Perception that decisions take too long and management is slow to respond resulting in loss of faith by employees and investors
4. Bad Data: Poor Decisions If poor decisions are made regularly then in all likelihood
the data used to make the decision is incomplete or simply wrong.Result: Perception that management doesn’t know what it’s doing. This can also result in very costly mistakes.
The 10 Deadly Sins of Poorly Planned BIThere are 10 consistent mistakes or “sins” that organizations commonly
make related to the implementation of Business Intelligence.
5. Poor Design: Redundant Effort: The same people doing the same thing over and
over in different parts of the organization usually means no thought or planning has
been given to how data is collected and managed or how information should be
extracted. Results: Lower productivity, conflicting data and higher error rates.
6. High & Hidden Cost of Ownership: Limiting initial technology and services investment
usually means slower turnaround time, more effort and higher operating costs. It
doesn’t matter if you spend $100K in January or $10K per month, you still spend the
money. The only difference is that under capitalizing your BI solution means you’ll
spend more next year and get even worse results. Don’t waste money on
unnecessary technology but don’t go cheap either.Result: Lost opportunity and high hidden costs from inefficiencies. More difficulty in standardizing information and business rules as time goes on. Also, greater difficulty and higher
The 10 Deadly Sins of Poorly Planned BIThere are 10 consistent mistakes or “sins” that organizations commonly
make related to the implementation of Business Intelligence.
7. Poor or NO high level indicators (no KPI’s): Knowing key measures and trends is only
half the battle. Being able to measure performance requires the development of
Key Performance Indicators and a way to evaluate them.Result: Greater difficulty in planning for the future and inability to identify what is causing poor performance. Inability to see how decisions affect the big picture.
8. Inability to measure against goals (no scorecards): You don’t know how fast you
should go if you don’t know the speed limit and what time you should arrive.
Predefining goals and having a system to measure against them is the best way to
manage performance.Result: Inability to bring performance into “control” and make results predictable. Also, inability to increase competitiveness on a regular basis.
The 10 Deadly Sins of Poorly Planned BIThere are 10 consistent mistakes or “sins” that organizations commonly
make related to the implementation of Business Intelligence.
9. Organic Data Management (no ETL tool): Hand coding your data management
processes seems cheap and easy, but the proverbial bus awaits your super
programmer assuring you find yourself with an unsupported solution.Result: High cost of ownership and high risk. Idiosyncratic code makes modifications and
support very difficult as complexity increases. Loss of key personnel results in catastrophe when
a system fails.
10.No Definitions or Consensus of Definitions: You don’t take the time to predefine key
business terms, measures and dimensions. Predefining terms and rules are critical.
Equally important is to obtain consensus on terms and rules.Result: Low adoption of BI exacerbates pre-existing tension and conflict. BI is seen as a failure because no-one agrees on how information should be organized.