43
FY 2009 results and comments Opportunity Day 4 March 2010 1

FY 2009 results and commentsOpportunity Day
4 March 2010
1

2
DISCLAIMER
The views expressed here contain information derived from publicly available sources that have not been independently verified. No representation or warranty is made as to the accuracy, completeness or reliability of the information. Any forward looking information in this presentation has been prepared on the basis of a number of assumptions which may prove to be incorrect. This presentation should not be relied upon as a recommendation or forecast by Banpu plc. Nothing in this release should be construed as either an offer to sell or a solicitation of an offer to buy or sell shares in any jurisdiction.

1. Introduction
2. Operational review
3. Commercial review
4. Financial review
3

4
1. Introduction

5
Banpu in 2009: consolidation and organic growth
Luannan
Zhengding
Zouping (70%)
Hebi (40%)
Daning (56%)
Gaohe (45%)
Hongsa (40%)
BLCP (50%)
Bharinto*
Trubaindo*
Jorong*
Indominco-Bontang*
Kitadin*
CHINA
THAILAND
INDONESIA
100MW, 490tph
100MW, 128tph
48MW, 180tph
1.5Mtpa
4Mtpa
6Mtpa
1,800MW
4,345MW1,434MW
12.4 Mtpa
3.1 Mtpa
2 Mtpa
5.2 Mtpa
Ratch (15%)
* Banpu effective equity interest in ITM assets is 73.7%
Power – China
• Ebitda performance improved from easing coal cost
Coal – China
• Integration of AACI into Banpu group
• Daning LW relocation Q3
• Gaohe construction on schedule
Power – Thailand
• BLCP: smooth operation
• Hongsa: delayed but back on track
Coal – Indonesia
• E Block online as planned from Q3
• Embalut re-opened earlier than plan
• Trubaindo good performance
Coal mine tonnage figures show approximate saleable output in 2009 (and targets for projects). Chinese power assets sell both power and steam. Banpu ownership 100% unless otherwise shown.
Coal mineCoal mine projectCoal-fired powerCoal-fired power projectGas-fired power
4
3
2
1
0.7 Mtpa

6
Banpu in 2009: the figures
Coal sales
21.09 Mt
Coal
53,077
4,035
17,127
10,444
Power
4,788
3,412
4,540
3,785
Revenue
Equity income
EBIT
Net income
Total
57,865
7,447
21,667
14,229
Unit: Bt. million
Up 2.6 Mt14% Y-Y Y-Y
15%
51%
28%
54%

East Kalimantan
Bunyut Port
Balikpapan
Palangkaraya
Banjarmasin
Central Kalimantan
South Kalimantan
KITADIN-EMBALUT
1.6 Mt
INDOMINCO 13.2 Mt
TRUBAINDO 6 Mt
BHARINTO0.2 Mt
(Commissioning at end 2010)
JORONG 2 Mt
ITM OPERATIONS & PROJECTS (Saleable output targets)
Captive coal-fired power
Samarinda
Jorong Port
Bontang Coal Terminal
Banpu outlook in Indonesia in 2010
OperationProject
OperationProject
POWER
COAL
ITM
Bontang
Indominco
Embalut
Trubaindo
Bharinto
Jorong
- Lower ASP, higher fuel cost- Continued cost management
- Port expansion fully complete 1Q10
- E.Block: full-year production, study conveyor belt
- W.Block UG: continue trial run
- Utilize existing reserves
- Wash plant completion- Increased output
- First output by Q4
- Lower output to optimize reserves
7

8
Banpu outlook in China in 2010
HZTM (40%),Henan1.4 Mt
BANPU CHINA OPERATIONS & PROJECTS
OperationProject
OperationProject
POWER
COAL
Daning (56%),Shanxi
4 Mt
Gaohe (45%),Shanxi1.5 Mt BEIJING
Luannan (100%),Hebei100MW, 128tph
Zhengding (100%),Hebei
48MW, 180tph
Zouping (70%),Shandong100MW, 490tph
Coal
Power
- AACI: management integration, strengthen partnership
- Daning: ensure smooth operation and safety record
- Gaohe: first output by Q3
- Higher fuel efficiency
- Optimize steam/power ratio
- All plants: FGD
(Output targets)
9
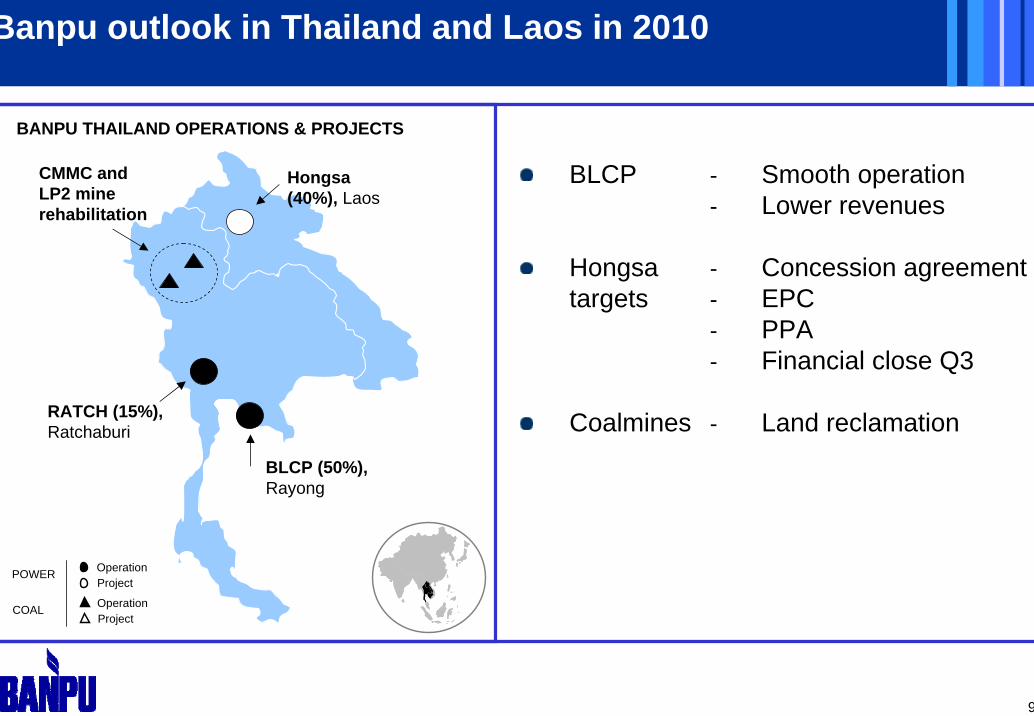
Banpu outlook in Thailand and Laos in 2010
BANPU THAILAND OPERATIONS & PROJECTS
OperationProject
OperationProject
POWER
COAL
Hongsa(40%), Laos
BLCP (50%), Rayong
RATCH (15%), Ratchaburi
CMMC and LP2 mine rehabilitation
BLCP
Hongsatargets
Coalmines
- Smooth operation- Lower revenues
- Concession agreement- EPC- PPA- Financial close Q3
- Land reclamation

?
?
10
?
Banpu strategic planning 2010-15: growth dynamics
Coal operationCoal projectPower operationPower project
ILLUSTRATIVE ONLY
Coal focus
Growth company
Planning and opportunism
Pushing the boundaries
- Relative importance of coal (vspower and other) in Banpu asset mix likely to increase by 2015 with both organic and acquisition growth
- Target similar growth rates to those achieved in the past
- Growth will continue to be mix of pro-active planning and opportunistic action
- Banpu will face tough competition and associated risks
- Active expansion in existing geographies and competencies
- Develop new skills, enter new countries and markets
- Diversify into solar, palm oil, ethanol…
?
2. Operational review
11
2. Operational review
i) Coal business
12

Indonesian coal operations in 2009
Coal output :
2009 : 21.4 Mt4Q09 : 6.7 Mt
Project update:
BoCT Expansion: Finished Phase 1 expansion, Barge Unloader (CBU) being commissioned
Bontang Power Plant: commissioning delayed until mid 2010
Indominco Underground: trial production is underway
Bharinto: on-going development to commission by end 2010
East Kalimantan
Bunyut Port
Balikpapan
Palangkaraya
Banjarmasin
Central Kalimantan
South Kalimantan
KITADIN0.7 Mt
INDOMINCO 12.4 Mt
TRUBAINDO 5.2 Mt
BHARINTO (Start by end 2010)
JORONG 3.1Mt
ITM OPERATIONS & PROJECTSShowing targets for saleable coal output in 2009
Project
OperationProject
POWER
COAL
Captive coal-fired power project
Samarinda
Jorong Port
Bontang Coal Terminal
13

Indonesian quarterly output and SR analysis
Note: output figures are saleable coal
Indominco-Bontang
CV: 6050 - 6500 kcal/kg
Smooth running at E. Block; reducing SR
1Q09 2Q09 3Q09 4Q09 1Q10e
3.6Mt
STRIP RATIO (bcm/t)
COAL OUTPUT (Mt)
Trubaindo
CV: 6550 - 7200 kcal/kg
Good performance due to favorable weather
1.4Mt
STRIP RATIO (bcm/t)
COAL OUTPUT (Mt)
Jorong
CV: 5300 kcal/kg
Expect lower production in 2010
0.4Mt
STRIP RATIO (bcm/t)
COAL OUTPUT (Mt)
15.3
11.0 11.06.6 6.614.5
1.3Mt
13.7
0.8Mt
2.6Mt
1.3Mt
0.7Mt
1Q09 2Q09 3Q09 4Q09
2.4Mt
1.3Mt
0.8Mt
16.7
11.76.6
3.3Mt
Kitadin - Embalut
CV: 5750 kcal/kg
Smooth production from good mine planning
3Q09 4Q09 1Q10e1Q09 2Q09 3Q09 4Q09 1Q10e
1Q09 2Q09 3Q09 4Q09
1Q09 2Q09 3Q09 4Q09 1Q10e
1Q09 2Q09 3Q09 4Q09
0.4Mt0.3Mt
STRIP RATIO (bcm/t)
COAL OUTPUT (Mt)
7.6
3Q09
2.7
8.2
W Block
E Block
East blockWest block
0.6
4.1Mt
3.1
1.0
1.3Mt
0.8Mt
0.4Mt
7.6
4Q097.3
14.5 6.6
14
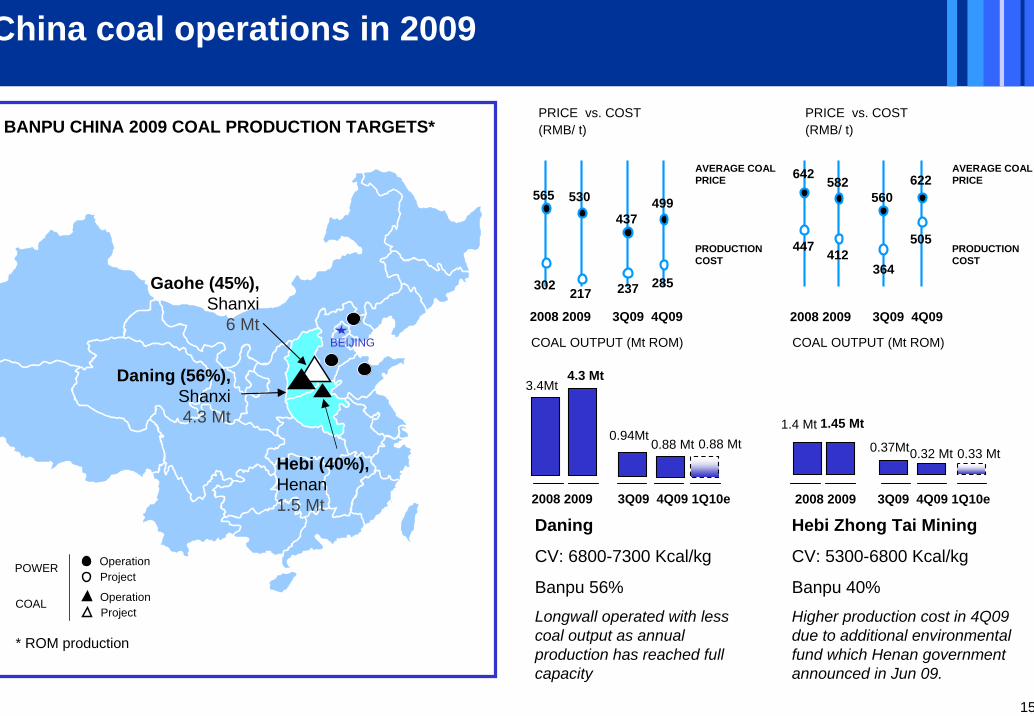
China coal operations in 2009
Daning
CV: 6800-7300 Kcal/kg
Banpu 56%
Longwall operated with less coal output as annual production has reached full capacity
PRICE vs. COST (RMB/ t)
COAL OUTPUT (Mt ROM)
Hebi Zhong Tai Mining
CV: 5300-6800 Kcal/kg
Banpu 40%
Higher production cost in 4Q09 due to additional environmental fund which Henan government announced in Jun 09.
COAL OUTPUT (Mt ROM)
BANPU CHINA 2009 COAL PRODUCTION TARGETS*
OperationProject
OperationProject
POWER
COAL
BEIJING
* ROM production
PRICE vs. COST (RMB/ t)
2008 2009 3Q09 4Q09 1Q10e
3.4Mt4.3 Mt
1.4 Mt0.88 Mt
1.45 Mt0.94Mt
0.37Mt
217
530
237
437
412
582
364
560
PRODUCTION COST
AVERAGE COAL PRICE
285
499
505
622
PRODUCTION COST
AVERAGE COAL PRICE
2008 2009 3Q09 4Q09 1Q10e
2008 2009 3Q09 4Q09 2008 2009 3Q09 4Q09
0.88 Mt0.32 Mt 0.33 Mt
302
565
447
642
15
Hebi (40%),Henan1.5 Mt
Daning (56%),Shanxi4.3 Mt
Gaohe (45%),Shanxi
6 Mt

2. Operational review
ii) Power business
16

Total revenue
Availability Payment (AP)
Energy Payment (EP)
Dispatch (%)
Operating cost
EBIT
EBITDA
Power Thailand : BLCP in 2009
4Q09
3,214
1,538
1,424
94%
2,079
639
1,135
Units: Bt. Million(100% basis)
Equity income 2009
Bt 3,363 m** Based on Banpu’s 50% interest;
including FX gain Bt 296 million
2009
19,697
10,535
8,393
95%
9,891
7,834
9,807
2008
20,430
11,474
8,301
89%
9,502
8,897
10,825
3Q09
5,609
3,031
2,358
96%
2,786
2,328
2,823
17
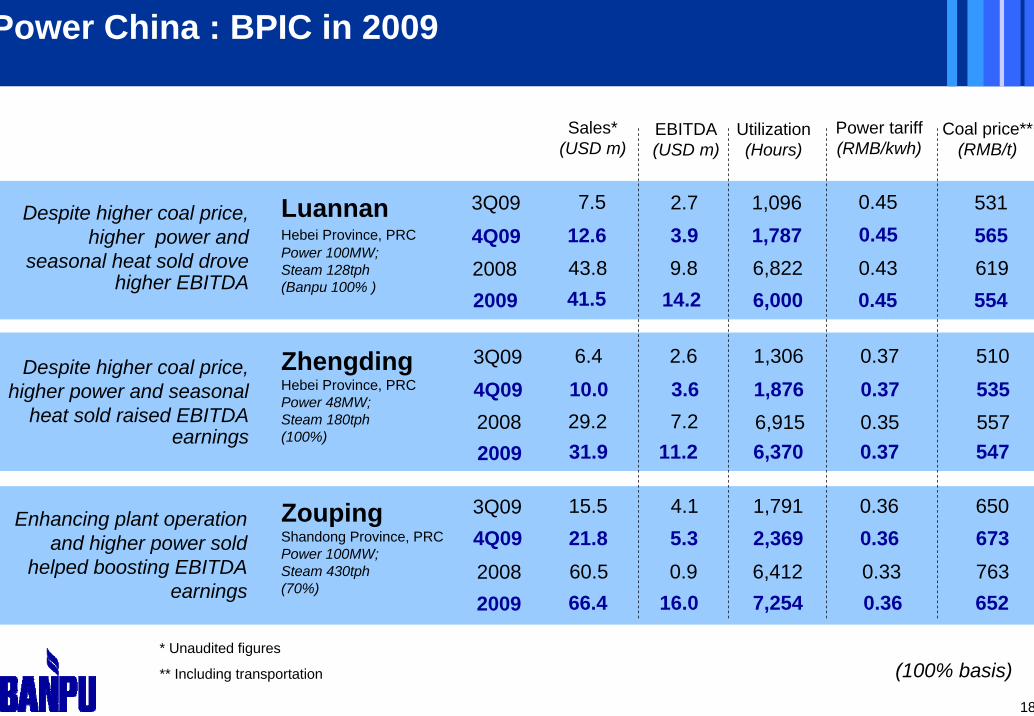
Power China : BPIC in 2009
* Unaudited figures
** Including transportation
Sales* )
EBITDA Utilization Power tariff )
Coal price**(RMB/t)(USD m (USD m) (Hours) (RMB/kwh
(100% basis)
LuannanHebei Province, PRCPower 100MW; Steam 128tph(Banpu 100% )
ZoupingShandong Province, PRCPower 100MW;Steam 430tph(70%)
ZhengdingHebei Province, PRCPower 48MW;Steam 180tph(100%)
Despite higher coal price, higher power and
seasonal heat sold drove higher EBITDA
Enhancing plant operation and higher power sold
helped boosting EBITDA earnings
Despite higher coal price, higher power and seasonal
heat sold raised EBITDA earnings
2009 41.5 14.2 6,000 0.45 554
3Q09 7.5 2.7 1,096 0.45 531
4Q09 12.6 3.9 1,787 0.45 565
2009 31.9 11.2 6,370 0.37 547
3Q09 6.4 2.6 1,306 0.37 510
4Q09 10.0 3.6 1,876 0.37 535
2009 66.4 16.0 7,254 0.36 652
3Q09 15.5 4.1 1,791 0.36 6504Q09 21.8 5.3 2,369 0.36 673
43.8 9.8 6,822 0.43 619
2008 29.2 7.2 6,915 0.35 557
2008
2008 60.5 0.9 6,412 0.33 763
18

19
3. Commercial review
20
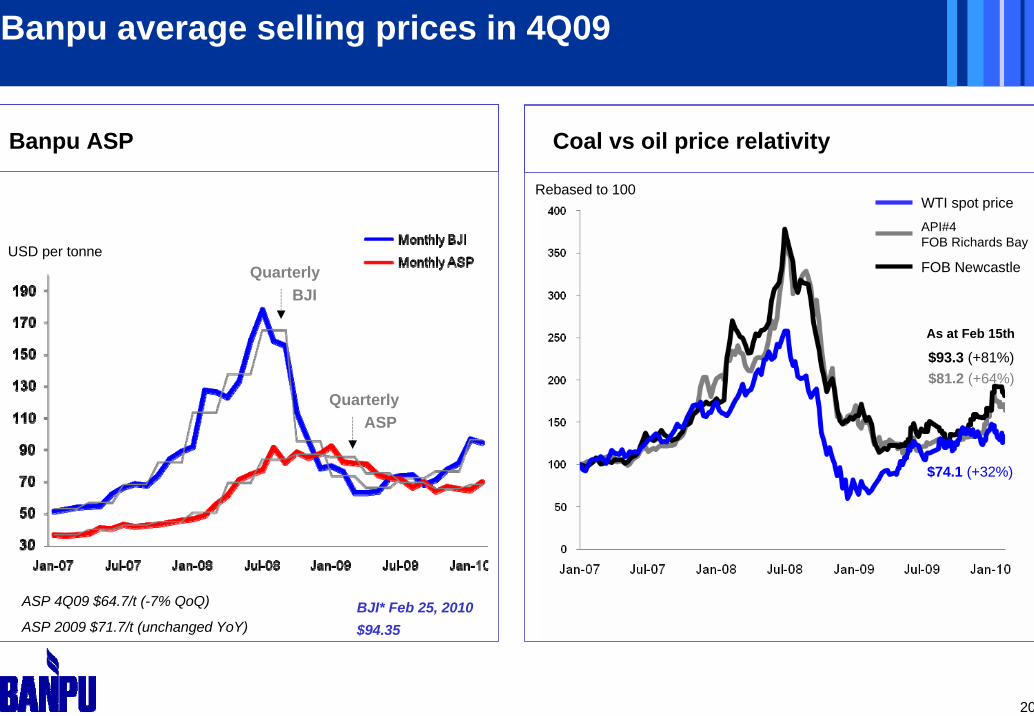
Banpu average selling prices in 4Q09
WTI spot priceAPI#4 FOB Richards Bay
FOB Newcastle
Coal vs oil price relativity
Rebased to 100
$74.1 (+32%)
$81.2 (+64%)$93.3 (+81%)
As at Feb 15th
Banpu ASP
USD per tonneQuarterly
BJI
QuarterlyASP
ASP 4Q09 $64.7/t (-7% QoQ)
ASP 2009 $71.7/t (unchanged YoY) BJI* Feb 25, 2010$94.35

21
Coal sales contract and pricing status
Indicative 2010 coal sales
Comment
Coal sold with fixed price has higher proportion of lower CV products.
Index linked sales at 25% is higher than in previous years.
Due to introduction of East Block and return of Kitadin Embalut, proportion of lower CV for 2010 rises
Cannot compare meaningfully 2009 ASP with 2010 ASP, as composition changed.
Contract Status Price Status
Contracted
Uncontracted
Fixed
Price under negotiation
UnpricedIndex
Coal sales contract and pricing status
TARGET SALES 2010: c.23 Mtas at end Feb 2010

22
JAPAN
*Includes small, non-regular purchasers Low-to-Mid CV
Coal sales by geographic destination (ITM and Thai)
Mid-to-High CV
Cumulative coal sales 2009 (total 21.09Mt)
2008 3M 09 6M 09 9M 09 2009
2008 3M 09 6M 09 9M 09 2009
2008 3M 09 6M 09 9M 09 2009
2008 3M 09 6M 09 9M 09 2009
2008 3M 09 6M 09 9M 09 20092008 3M 09 6M 09 9M 09 2009
2008 3M 09 6M 09 9M 09 2009
2008 3M 09 6M 09 9M 09 2009
2008 3M 09 6M 09 9M 09 2009
4.0Mt
2008 3M 09 6M 09 9M 09 2009
1.1Mt2008 3M 09 6M 09 9M 09 2009
0.1Mt0.4Mt
2.1Mt
0.9Mt
0.1
INDIA
1.4Mt1.7Mt
1.3Mt
INDONESIA
0.3Mt0.6Mt
PHILIPPINES
CHINA
1.7Mt
0.1Mt
HONG KONG
TAIWAN
1.9Mt
0.3Mt
0.9Mt
2.3Mt
S.KOREA
0.4Mt0.5Mt
OTHERS*
1.4Mt
0.2Mt
ITALY
1.3Mt
0.3Mt0.5Mt
1.6Mt
0.4Mt
0.9Mt
2.8MtTHAILAND
0.3Mt
1.0Mt
0.7Mt
1.0Mt
0.6Mt
0.5Mt
3.2Mt
1.7Mt
1.4Mt1.0Mt
1.5Mt
0.6Mt
2010 trend expectation
4.2Mt
2.6Mt
1.8Mt1.3Mt
2.1Mt
2.2Mt
2.6Mt 1.3 Mt
0.6Mt
1.4Mt
1.0Mt2010
2010
2010 201020102010
2010
20102010
2010

23
4. Financial review

2424
57,865
50,530
32,442
2007 2008 2009
Sales revenues
Units: Bt. million
• 14% increase in sale volume
• 3% depreciation of Thai Baht
+15% Y on Y
Coal Bt 53,077 m
Power Bt 4,788 m+7% Y on Y
+15% Y on Y
0200400600800
10001200140016001800
2008 2009
Revenues in USD +11% Y on Y

25
Average gross margin for coal in 2009: 51% (2008 : 48%)
2007 2008 2009
Indominco
Bt 18,758M
39%
Bt 25,817M
Bt 31,978 M
49%
2007 2008 2009
Trubaindo
Bt 6,126 M
38%
Bt 16,361 M
63%
Bt 15,489 M
57%
2007 2008 2009
Jorong
Bt 2,616M
31%
Bt 3,095 M
41%
Bt 3,982 M
42%
2007 2008 2009
Thai mines
Bt 716 M
-16%
Bt 377 M Bt 101M
Coal sales (Bt millions)
Gross margin (%)
-23%
40%
2007
Kitadin
Bt 175 M
32%
2009
Bt 1,150 M
37%-20%

2626
23,687
18,772
10,432
2007 2008 2009
EBITDA
Units: Bt. million
Coal Bt 18,821 m
Power Bt 4,866 m
+20% Y on Y
+28% Y on Y
+26%
Y on Y

2727
9,228
6,654
2007 2008 2009
Net Profit after Tax
Units: Bt. million
Coal Bt 10,444 m
34% Y on Y
+63% Y on Y
+54%
Y on Y
14,229
Power Bt 3,785 m

28
INDICATIVE ONLY
Capital expenditure plans 2010-2015 (total c.$466 M)
The capital expenditure figures shown above do not include estimates for maintenance or sustaining capital expenditure.
E Block Conveyor $ 96 MIndominco UG
$ 11 M
Bharinto$ 38 M
Trubaindo UG $ 11 M
Embalut$ 11 M
CHINA: $22 M
LAOS: $255 M**Note: $255M is for 2014-15 only and is part of total estimated Banpu capex on Hongsa project of approx. $400 M
INDONESIA: $189 M
TandungMayang
$ 8 M
Others$14 M
Gaohe$ 17 M
Hebi$ 5 M
Hong Sa $ 255 M
Units: USD million

29
0.16
0.36
0.14
0.66
0.34
2005 2006 2007 2008 2009
91
Balance sheet
Debt structureNet D/E (Times)
Net gearing (%)
As end of December 2009
25%
40%
12%
Floating 64%
Fixed 36%
26% 14%
* Net gearing = ND / (ND+E)

30
Dividend payments
5
812
8.57.57.55.5
8
2004 2005 2006 2007 2008 2009
Dividend per share (Bt)
(Special)
(1H09)
(2H09)

3131
Questions & Answers

3232
APPENDICES

33
Operating profit
Units: Bt. million
Sales revenues – Power (BPIC) 4,788Cost of sales (29,992)Gross profit* 27,874 24%
GPM 48%
2009 YoY %
57,865 15%
Note: * Including other business
Sales revenues – Coal
Total sales revenues*
52,704 15%
Gross profit - Coal 26,629 21%Gross profit – Power (BPIC) 1,182
7%
198%
4,460(28,110)22,419
44%
2008
50,53045,976
21,983397
GPM – Power (BPIC) 25%51%GPM - Coal
9%48%

34
Operating profit
Units: Bt. million
Gross profit 27,874 24%GPM 48%SG&A (5,390)Royalty (6,467)
Dividend income – Coal & Power 478Other income 351
EBIT 21,667 28%
EBITDA 23,687 26%
2009 YoY %
EBIT - Coal 17,127 28%EBIT - Power 4,540
Income from associates 7,447
26%
EBITDA - Coal 18,821 28%EBITDA - Power 4,866 20%
Other expenses - Operations (2,626)
22,41944%
(5,081)(5,537)
478689
16,951
18,772
13,3503,601
4,946
14,7204,052
(963)
2008

35
Units: Bt. million
EBITInterest expenses (1,282)Financial expenses (181)Income tax (core business) (4,611)Minorities (3,574)Net profit before extra items 12,020Non-recurring items* 2,730Net profit before FX 14,751 67%FX translations (521)Net profit 14,229 54%EPS (Bt/share) 52.36
Note: * Income from non-core assets and other non-operating expenses
YoY %2009
Net profit
15%
21,667 28%
(1,240)(128)
(3,768)(1,333)10,482(1,638)8,844
3839,22833.96
16,951
2008

36
Operating profit
Units: Bt. million
Sales revenues – Power (BPIC) 1,477Cost of sales (10,051)Gross profit* 7,376 8% -15%
GPM 42%
4Q09 QoQ % YoY %
17,428 26% 6%
Note: * Including other business
Sales revenues – Coal
Total sales revenues*
15,713 23% 4%
Gross profit - Coal 6,979 6% -18%Gross profit – Power (BPIC) 367
48% 6%
43%
1,400(7,754)8,719
53%
4Q08
16,47315,051
8,470240
999(7,057)6,824
49%
3Q09
13,88112,801
6,555256 53%
GPM – Power (BPIC) 25%44%GPM - Coal
17%56%
26%51%
3737
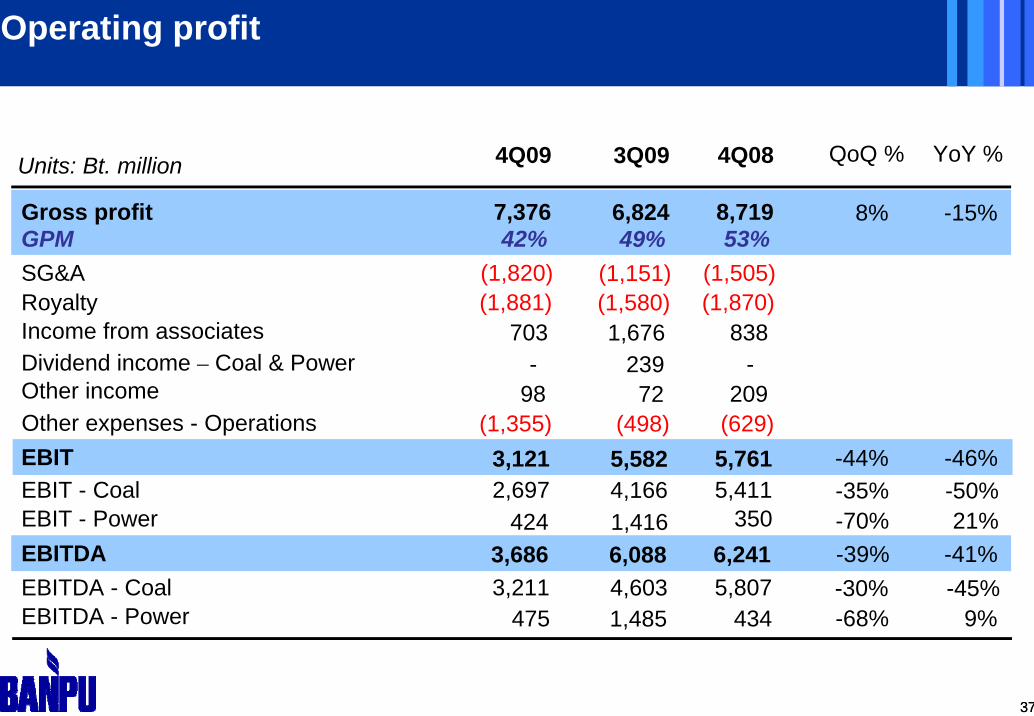
Operating profit
Units: Bt. million
Gross profit 7,376 8% -15%GPM 42%SG&A (1,820)Royalty (1,881)
Dividend income – Coal & Power -Other income 98
EBIT 3,121 -44% -46%
EBITDA 3,686 -39% -41%
4Q09 QoQ % YoY %
EBIT - Coal 2,697 -35% -50%EBIT - Power 424
Income from associates 703
-70% 21%
EBITDA - Coal 3,211 -30% -45%EBITDA - Power 475 -68% 9%
Other expenses - Operations (1,355)
8,71953%
(1,505)(1,870)
-209
5,761
6,241
5,411350
838
5,807434
(629)
6,82449%
(1,151)(1,580)
23972
5,582
6,088
4Q083Q09
4,1661,416
1,676
4,6031,485
(498)

38
Units: Bt. million
EBITInterest expenses (289)Financial expenses (55)Income tax (core business) (927)Minorities (914)Net profit before extra items 935
Non-recurring items* 796Net profit before FX 1,731 -10%
FX translations (90)Net profit 1,641 -6%EPS (Bt/share) 6.04
Note: * Income from non-core assets and other non-operating expenses
YoY %4Q09
Net profit
-70%
-57%(1,177)1,930(187)
9703,991
(183)
-57%1,7443,809
QoQ %
-69%
3,121 -44% -46%
(404)(27)
(1,880)(343)
3,107
5,761(312)(48)
(1,214)(986)
3,021
5,582
6.4214.02
4Q083Q09

3939
Banpu’s Resources & Reserves statement (100% basis)
As at 31 December 2009 As at 31 December 2008
Mine operation and project
Interest(%) Measured
ResourcesIndicated
ResourcesTotal
ResourcesProved
ReservesProbable Reserves
Total Reserves
Total Resources
Total Reserves
Mine operationJorong 73.48 134.2 12.4 146.6 8.16 - 8.16 150.1 10.2Indominco 73.71 587.8 155.3 743.1 98.2 37.3 135.5 757.4 148.8Kitadin 73.71 114.6 51.5 166.1 8.2 17.9 26.1 166.8 26.7Trubaindo 73.71 217.6 78.9 296.5 55.4 22.9 78.3 302.6 80.0Lampang 100.00 1.2 - 1.2 - - - 1.2 -Payao 100.00 0.2 - 0.2 - - - 0.5 0.1Daning 56.00 148 45.7 194.1 45.4 47.3 92.7 89.0 66.6Hebi* 40.00 61.8 - 61.8 28.8 - 28.8 63.2 30.3ProjectBharinto 72.98 183.5 114.5 298.0 9.8 36.5 46.3 298.0 46.3Gaohe 45.00 255.7 116.9 372.6 71.5 119.1 190.6 311.8 190.8
Total 1,705.2 575.22 2,280.1 325.4 281.0 606.4 2,140.6 600.0
Note: figures have been estimated in accordance to JORC Code unless otherwise stated* Figures have been estimated in accordance to Chinese reporting standard

40
45
29
72
0
98
55
8
47
119
37
23
10
8
18
37
40
Coal reserves by operation and project (100% basis)
Daning
Hebi
Gaohe
Lampang
Payao
Indominco
Trubaindo
Jorong
Kitadin
Bharinto
Proved reserves
Probable reserves
Resources (Measured & Indicated)
194
62
373
1
0
743
297
147
166
298
CHINAResources:
Re
628Reserves: 312
THAILANDsources: 1
INDONESIAResou
Reserves: 294
Unit: Mt
rces: 1,651
As at 31 December 2009

4141
Banpu Coal Resources & Reserves Statement
281 Mt
PROVED
RESOURCES*2,280 Mt (100% basis)
575 Mt
1,705 Mt
RESERVES606 Mt (100% basis)
Notes: Reporting generally in accordance with JORC Code plus some internal estimates. Major changes audited by independent experts.
* Only Measured and Indicated Coal Resources
INDICATED
MEASURED
PROBABLE
325 Mt
496 Mt
1,568 Mt
274 Mt
192 Mt
Equity tonnage
100% basis As at 31 December 2009

42
25
32
72
41
6
7
26
54
27
17
13
12
6
27
42
Coal reserves by operation and project (equity basis)
Daning
Hebi
Gaohe
Lampang
Payao
Indominco
Trubaindo
Jorong
Kitadin
Bharinto
Proved reserves
Probable reserves
Resources (Measured & Indicated)
109
25
168
548
219
108
122
217
CHINAResources:
Unit: Mt
302Reserves: 149
THAILAND
INDONESIAResources: 1,214
Reserves: 216
As at 31 December 2009

43
Banpu 2010-15: green energy development rationale
Renewable energy
Renewable technologies becoming more viable
Developed countries gradually penalizing fossil fuel use and subsidizing renewables use
Renewables going down cost curve through technological improvement
Investment in sector becoming more attractive
New coal technologies
‘Peak oil’ and carbon emission concerns plus tougher asset market for high CV coal reserves: some new coal technologies will become viable
In LT ‘clean coal’ and coal-to-liquids could be natural areas of future diversification for Banpu
But new coal technologies still face host of economic and technical changes
Banpu
New
Energy
Development
‘NED’
NED initiative is based on the Banpu philosophy of sustainability and innovation. Coal-based energy is cheaper, more abundant and more reliable than oil-based energy in Asia. But Banpu
recognizes that the most sustainable energies of all are ‘renewable’.


