MRC Clinical Trials Unit at UCL LSHTM seminars – 27 November 2015 Credibility of risk predictions in medical research: concepts, tools, and applications Babak Oskooei London Hub for Trials Methodology Research MRC Clinical Trials Unit at UCL 27 November 2015
Transcript
MRC Clinical Trials Unit at UCL LSHTM seminars – 27 November 2015
Credibility of risk predictions in medical research: concepts, tools, and applications
Babak Oskooei
London Hub for Trials Methodology Research
MRC Clinical Trials Unit at UCL
27 November 2015
Contents
1. Introduction – why risk prediction is important
2. Risk prediction models
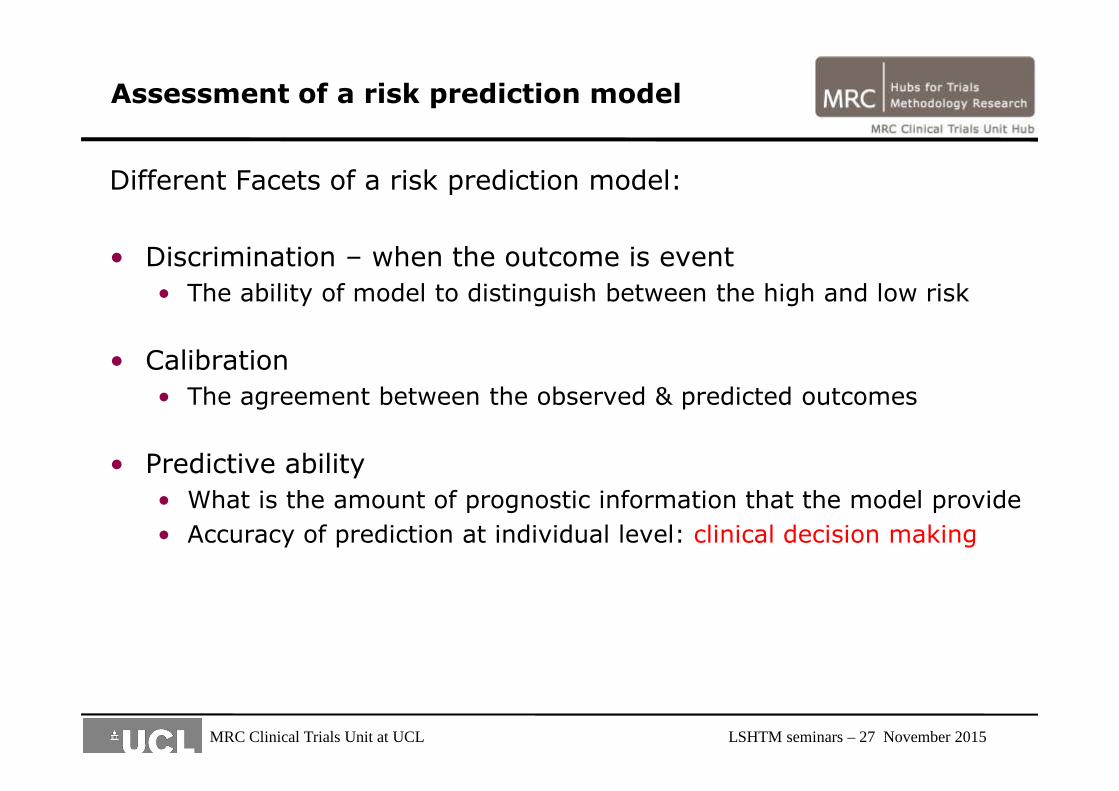
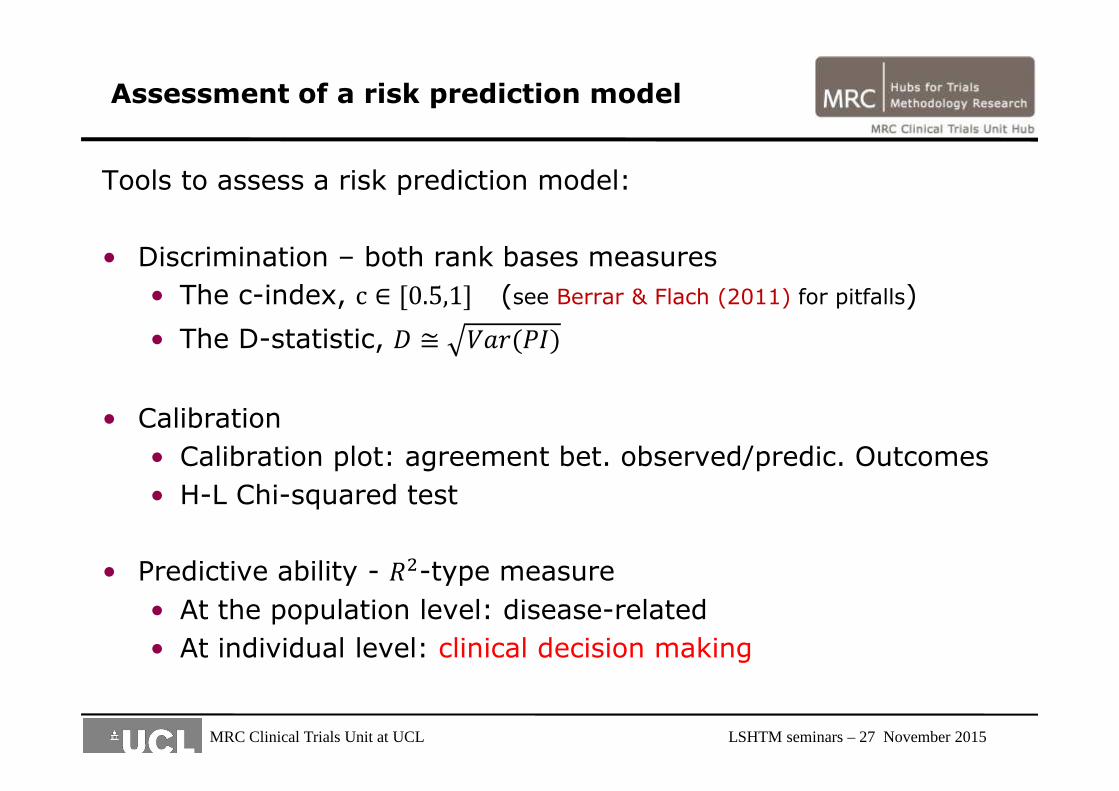
3. Concepts underlying the assessment of risk predictionsa. Discrimination
b. Calibration
c. Predictive ability
4. Performance of a survival risk prediction modela. In validation setting: transportability & reproducibility
b. A new measure of predictive ability: total gain (TG) statistics
5. Some real examples
6. Conclusions
MRC Clinical Trials Unit at UCL LSHTM seminars – 27 November 2015
Why is risk prediction important?
• It is used in clinical management of patients
• Selection for surgery
• Selection for screening/diagnostic tests
• Determining prognosis
• It can be used to assess the importance/significance of available prognostic factors as well as the new biomarkers
• We use them in the design of clinical trials
• E.g. RAMPART trial
MRC Clinical Trials Unit at UCL LSHTM seminars – 27 November 2015
Clinical management of patients Example I: breast cancer
• Online web-tool PREDICTwww.predict.nhs.uk :
• to select the most appropriate adjuvant therapy following surgery
MRC Clinical Trials Unit at UCL LSHTM seminars – 27 November 2015
θ̂
Clinical management of patients Example II: American college of surgeons surgical risk calculator - http://riskcalculator.facs.org/
MRC Clinical Trials Unit at UCL LSHTM seminars – 27 November 2015
θ̂
Clinical management of patients Example II: American college of surgeons surgical risk calculator - http://riskcalculator.facs.org/
MRC Clinical Trials Unit at UCL LSHTM seminars – 27 November 2015
θ̂
Clinical risk predictions:Example III: Cancer prognosis
MD Anderson clinical calculatorshttp://www.mdanderson.org/education-and-research/resources-for-professionals/clinical-tools-and-resources/clinical-calculators/index.html
Memorial Sloan-Kettering—prediction tools http://www.mskcc.org/cancer-care/prediction-tools
University of Montreal—nomograms http://nomogram.org/
Mayo clinic adjuvant tool (numeracy) http://www.mayoclinic.com/calcs/
Calculator for estimating overall life expectancy and lifetime risk for prostate cancer death in newly diagnosed men managed without definitive local therapy
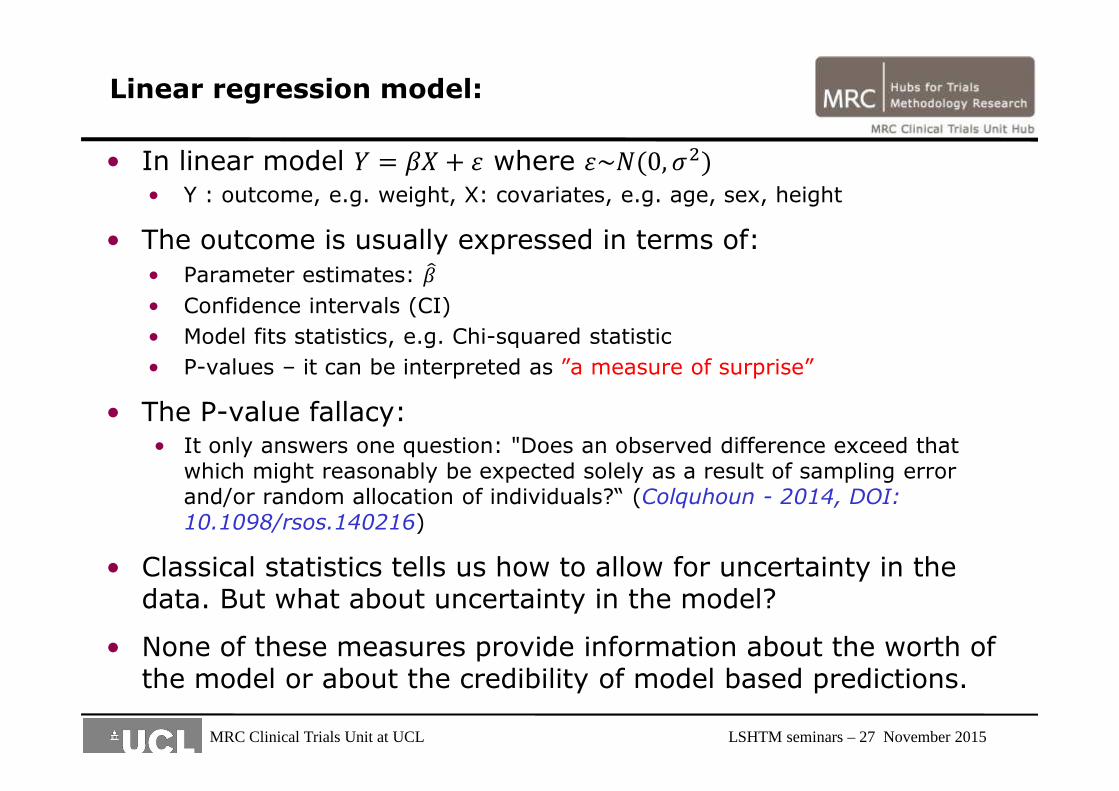
• Model fits statistics, e.g. Chi-squared statistic
• P-values – it can be interpreted as ”a measure of surprise”
• The P-value fallacy: • It only answers one question: "Does an observed difference exceed that
which might reasonably be expected solely as a result of sampling error and/or random allocation of individuals?“ (Colquhoun - 2014, DOI: 10.1098/rsos.140216)
• Classical statistics tells us how to allow for uncertainty in the data. But what about uncertainty in the model?
• None of these measures provide information about the worth of the model or about the credibility of model based predictions.
Linear regression model:
MRC Clinical Trials Unit at UCL LSHTM seminars – 27 November 2015
• In linear model � = �� + � where �~�(0, � )• Y : outcome, e.g. weight, X: covariates, e.g. age, sex, height
• � measures the amount of prognostic information (i.e. reduction in uncertainty):
• Uncertainty can be measured using: variance, likelihood, etc.
MRC Clinical Trials Unit at UCL LSHTM seminars – 27 November 2015
• The outcome is a binary variable � = [0,1]• The mean of Y is E � = Pr � = 1 = +• The model is represented by ,-./0 + � = ��• In a logistic regression, assessment of the predictive ability can
be summarised in different ways:
• Discrimination measures
• AUC or the c-statistic
• D-statistic
• � -type measure:
• On the probability scale: the Brier score
• On a "latent" variable scale, i.e. �∗ = ,-./0(+│�)• On the likelihood scale
• Each of these approaches answer different research questions.
Predictive ability in logistic regression:
MRC Clinical Trials Unit at UCL LSHTM seminars – 27 November 2015
• On the probability scale
• Brier score: the squared difference between a patient's status and the predicted probability (34) for this patient
�56��.6 7�/6�89-�6 = 1:; (�4 − 34) <
4=>
• One can write the model as a GLM
�∗ = �� + �and �∗ = ,-./0 3 � , � has a symmetric distribution around 0.
• One candidate is:
� ?@ =���(��)
��� �� + + 3B• In a Probit model CD EB is replaced with 1.
• � ?@ is commonly used in social sciences
Predictive ability in logistic regression:
MRC Clinical Trials Unit at UCL LSHTM seminars – 27 November 2015
Example: child mortality for children with congenital heart disease
• Population cohort study of all children with CHD in Paris
• Outcome: Death
• Patients: 1166
• Deaths: 40
• Prognostic model: ACC-CHD, gestational age, sex, and birth weight
Item no Measure Estimate
1 � ?@ 0.28
2 � FG4HG 0.26
4 9 − /:I6� 0.90
0.00
0.25
0.50
0.75
1.00
Sen
sitiv
ity
0.00 0.25 0.50 0.75 1.001 - Specificity
Area under ROC curve = 0.9240
MRC Clinical Trials Unit at UCL LSHTM seminars – 27 November 2015
Predictive ability in logistic regression:
• Which measure to use:
• Use the 7�/6�89-�6 if the interest is in accuracy of the estimates of Pr � = 1 at individual level∙
• Use � ?@ to quantify the amount of prognostic information in the "latent" variable model.
• Use the 9 − /:I6�if you want to describe the capacity that the model has for distinguishing an individual who experience the event from a non-event subject.
MRC Clinical Trials Unit at UCL LSHTM seminars – 27 November 2015
Assessment of risk predictions in survival models:
• It is not straightforward to define appropriate tools because:
• Censoring makes it more complicated
• The underlying distribution of time is unknown in the Cox PH model
• The Cox model has no error term.
• Several tools proposed, but still no consensus
MRC Clinical Trials Unit at UCL LSHTM seminars – 27 November 2015
Predictive ability in survival models:
MRC Clinical Trials Unit at UCL LSHTM seminars – 27 November 2015
Item no Group Name
Author
1 � JK Kent & O’Quigley (1988)
2 � LM Korn & Simon (1990)
3 � NO O’Quigley & Flandre (1994)
4 Explained Variation (EV) � PL Akazawa (1997)
5 � QN Xu & O’Quigley (2001)
6 � R Royston & Sauerbrei (2004)
7 � S Royston (2006)
8 T U Kent & O’Quigley (1988)
9 T U,P Kent & O’Quigley (1988)
10 Explained Randomness (ER) T < Negelkerke (1991)
11 T QN Xu & O’Quigley (1999)
12 T L O’Quigley et al (2005)
13 �>/� Schemper (1990/1994)
14 Predictive Accuracy (PA) � FM(W) Graf et al (1999)
15 �MX W Schemper & Henderson (2000)
16 Other � ML Schemper & Kaider (1997)
17 � X Harrell (1986)
MRC Clinical Trials Unit at UCL LSHTM seminars – 27 November 2015
Predictive ability in survival models:
Mod
el b
ased
Mod
el b
ased
MRC Clinical Trials Unit at UCL LSHTM seminars – 27 November 2015
Item no Group Name
Author
1 � JK Kent & O’Quigley (1988)
2 � LM Korn & Simon (1990)
3 � NO O’Quigley & Flandre (1994)
4 Explained Variation (EV) � PL Akazawa (1997)
5 � QN Xu & O’Quigley (2001)
6 � R Royston & Sauerbrei (2004)
7 � S Royston (2006)
8 T U Kent & O’Quigley (1988)
9 T U,P Kent & O’Quigley (1988)
10 Explained Randomness (ER) T < Negelkerke (1991)
11 T QN Xu & O’Quigley (1999)
12 T L O’Quigley et al (2005)
13 �>/� Schemper (1990/1994)
14 Predictive Accuracy (PA) � FM(W) Graf et al (1999)
15 �MX W Schemper & Henderson (2000)
16 Other � ML Schemper & Kaider (1997)
17 � X Harrell (1986)
Different survival C statistics:Quantifying discrimination of Framingham risk score
Statistics in MedicineVolume 31, Issue 15, pages 1543-1553, 17 FEB 2012 DOI: 10.1002/sim.4508http://onlinelibrary.wiley.com/doi/10.1002/sim.4508/full#sim4508-fig-0002
Men:
Women:Note: In other examples the 4 estimates can differ substantially
1) YZR-index
2) YXJN-index
3) Y\<]-index
4) Y@X-index/_-statatistic
MRC Clinical Trials Unit at UCL LSHTM seminars – 27 November 2015
Example of a risk prediction model:breast cancer ( Royston & Sau. 1999)
• External validation: validation data is from a different a more homogenous population
1. Low risk profile – majority are long-term survivors
2. High risk profile – majority are short-term survivors*)Ambler G, Rahman MS, Choodari-Oskooei B, Omar R (2015) Performance measures for validating risk models for survival data. Submitted to the International Journal of Epidemiology,
MRC Clinical Trials Unit at UCL LSHTM seminars – 27 November 2015
Validation of a risk prediction model:Results on internal validation - reproducibility
CS: calibration slope - the slope of the regression of the observed survival outcomes on the predicted prognostic index.
MRC Clinical Trials Unit at UCL LSHTM seminars – 27 November 2015
Total gain (TG) measure:
• Most existing measures of predictive ability only do not handle the case where time-dependent covariates (i.e. non-PH assumption) exist
• The existing explained variation measures only provide an estimate for the whole follow-up period
MRC Clinical Trials Unit at UCL LSHTM seminars – 27 November 2015
0.0
0.2
0.4
0.6
0.8
1.0
R(ν
,2)
0.0 0.2 0.4 0.6 0.8 1.0Cumulative dist. of the PI - ν
Pred. curve: ideal (back) and null (red) model
Total gain (TG) measure:TG is based on the predictiveness curve
• Predictiveness curve is the distribution function of the predicted survival probabilities at time T.
• This gives the graph a useful interpretation• For example, 40% of the individuals in the data have predicted
survival probabilities of more than 0.82
0.2
.4.6
.81
Pre
dict
ed s
urvi
val p
roba
bilit
y
0 .2 .4 .6 .8 1Quantile
Predictiveness curve for a prognostic model at 2 years
MRC Clinical Trials Unit at UCL LSHTM seminars – 27 November 2015
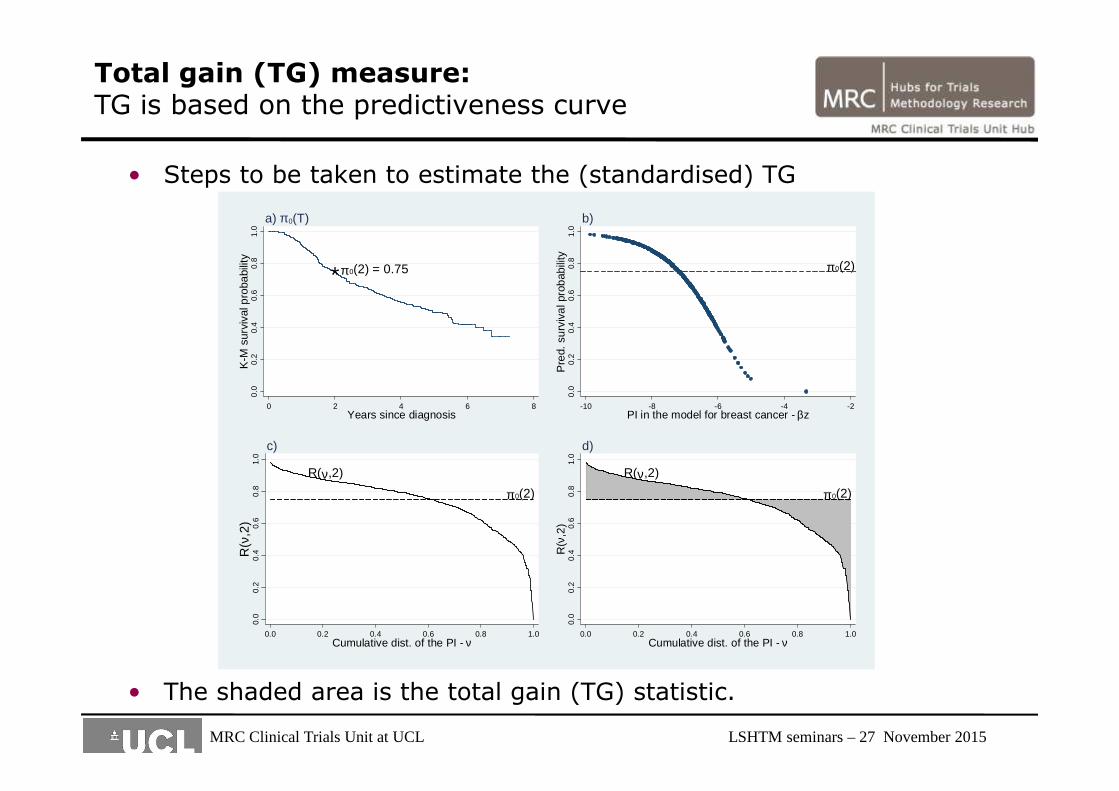
• Steps to be taken to estimate the (standardised) TG
• The shaded area is the total gain (TG) statistic.
Total gain (TG) measure:TG is based on the predictiveness curve
*π 0(2) = 0.750.
00.
20.
40.
60.
81.
0K
-M s
urvi
val p
roba
bilit
y
0 2 4 6 8Years since diagnosis
a) π 0(T)
π 0(2)
0.0
0.2
0.4
0.6
0.8
1.0
Pre
d. s
urvi
val p
roba
bilit
y
-10 -8 -6 -4 -2PI in the model for breast cancer - βz
b)
π 0(2)
R(ν,2)
0.0
0.2
0.4
0.6
0.8
1.0
R(ν
,2)
0.0 0.2 0.4 0.6 0.8 1.0Cumulative dist. of the PI - ν
c)
π 0(2)
R(ν,2)
0.0
0.2
0.4
0.6
0.8
1.0
R(ν
,2)
0.0 0.2 0.4 0.6 0.8 1.0Cumulative dist. of the PI - ν
d)
MRC Clinical Trials Unit at UCL LSHTM seminars – 27 November 2015
• Predictiveness curve for an "ideal" prognostic survival model
Total gain (TG) measure:TG is based on the predictiveness curve
π 0(2)
0.0
0.2
0.4
0.6
0.8
1.0
R(ν
,2)
0.0 0.2 0.4 0.6 0.8 1.0Quantile of the PI - ν
MRC Clinical Trials Unit at UCL LSHTM seminars – 27 November 2015
Properties of W M̀aR(W):
MRC Clinical Trials Unit at UCL LSHTM seminars – 27 November 2015
W M̀aR(W) is:• W M̀aR(W) ∈ [0,1],
• 0 means no predictive ability;
• 1 means perfect predictive ability;
• A function of time: can deal with time-dependant covariates,
• Is not affected by random censoring,
• Is normally distributed,
• Can be extended to other survival models,
Properties of W M̀aR(W):
MRC Clinical Trials Unit at UCL LSHTM seminars – 27 November 2015
Properties of W M̀aR(W):
MRC Clinical Trials Unit at UCL LSHTM seminars – 27 November 2015
Properties of W M̀aR(W):
MRC Clinical Trials Unit at UCL LSHTM seminars – 27 November 2015
Some examples I: Breast cancer:
0.2
.4.6
.81
Pre
dict
ed s
urvi
val p
roba
bilit
y
0 .2 .4 .6 .8 1Quantile
Predictiveness curve for breast cancer data at 2 years
Model Dev. W`MaR(2)All pr. factors 3423.2 0.33(0.28-0.38)
age 3558.7 0.06(0.03-0.09)
MRC Clinical Trials Unit at UCL LSHTM seminars – 27 November 2015
Some examples II: Other diseases
Study efgeh(ei) jikl jih R2BS(ei) Y\<]-index
Breast cancer 0.33 0.27 0.28 0.16 0.69
(0.28-0.38) (0.21-0.35) (0.21-0.35) (0.10-0.21)
Lymphoma 0.21 0.10 0.09 0.11 0.62
(0.07-0.36) (0.02-0.28) (0.02-0.30) (0.01-0.18)
Lymphoma + Gene factor 0.31 0.23 0.23 0.22 0.70
(0.18-0.44) (0.11-0.42) (0.11-0.40) (0.05-0.34)
PBC – liver disease 0.62 0.56 0.65 0.47 0.80
(0.54-0.70) (0.48-0.65) (0.55-0.74) (0.38-0.58)
Renal cancer 0.37 0.27 0.26 0.27 0.71
(0.31-0.42) (0.21-0.36) (0.20-0.33) (0.21-0.34)
Prostate cancer 0.24 0.13 0.13 0.11 0.63
(0.19-0.29) (0.09-0.20) (0.09-0.21) (0.06-0.15)
MRC Clinical Trials Unit at UCL LSHTM seminars – 27 November 2015
Conclusions
• In most diseases, there still remains a large uncertainty regarding risk predictions at the individual level
• The existing web-tools and risk calculators should be more transparent
• They should provide more information regarding the uncertainty associated with their predicted risk
• Long-term risk predictions are less accurate than short-term
• Applying a risk prediction model to a different population will affect its predictive ability, but might not change its discrimination
• Discrimination is only part of the story. It provides little or no information on the accuracy of risk predictions
• W M̀aR(W) can be used in survival model
MRC Clinical Trials Unit at UCL LSHTM seminars – 27 November 2015
Future research
• Design of a risk prediction study/model
• E.g. sample size issue
• What are the design parameters?
• Define the “error rates” that need to be controlled?
• Repositories for risk prediction models in different diseases
• Currently, the available information is widely dispersed!
• Comprehensive assessment of risk prediction models across different disease areas to compare the available prognostic information provided by clinical, biological, and genetic factors
• Dissemination and knowledge transfer of the available guidelines for prognostic studies in different disease areas
MRC Clinical Trials Unit at UCL LSHTM seminars – 27 November 2015
A relevant quote:
• “If you can measure that of which you speak, and can express it by a number, you know something of your subject, but if you cannot measure it, your knowledge is meagre and unsatisfactory.”
William Thomson,
Lord Kelvin, engineer, mathematician, and physicist (1824–1907)
MRC Clinical Trials Unit at UCL LSHTM seminars – 27 November 2015
References
• Choodari-Oskooei B, Royston P, Parmar MKB (2015). The extension of total gain (TG) statistic in survival models: Properties and applications. BMC Medical Research Methodology. doi:10.1186/s12874-015-0042-x
• Choodari-Oskooei B, Royston P, Parmar MKB (2012). A simulation study of predictive ability measures in a survival model I: Explained variation measures. Statistics in Medicine, 31 (23), 2627-2643. doi:10.1002/sim.4242
• Choodari-Oskooei B, Royston P, Parmar MKB (2012). A simulation study of predictive ability measures in a survival model II: explained randomness and predictive accuracy. Statistics in Medicine, 31 (23), 2644-2659. doi:10.1002/sim.5460
• Ambler G, Rahman MS, Choodari-Oskooei B, Omar R (2015) Performance measures for validating risk models for survival data. Submitted to the International Journal of Epidemiology,
MRC Clinical Trials Unit at UCL LSHTM seminars – 27 November 2015