53
Credit Investor Presentation Strong growth reinforced throughout the year and solid performance Significant debt and gearing reduction Full Year 2018

Credit Investor Presentation
Strong growth reinforced throughout the year and solid performance
Significant debt and gearing reduction
Full Year 2018

Agenda
1 Business Model
2 FY 2018 Activity
3 Business Development
4 Group Credit Profile
5 2019 Outlook
Full Year 2018 Credit Investor A world leader in gases, technologies and services for Industry and Health2

3
Business Model
Full Year 2018 Credit Investor A world leader in gases, technologies and services for Industry and Health

Full Year 2018 Credit Investor A world leader in gases, technologies and services for Industry and Health
A New Dimension and Strong Fundamentals
80Countries
65,000 Employees
>3.5 mCustomers
and Patients
>€21 bnof Sales in 2018
>€2bn
>€4bn
>€46bn
Net Profitin 2018
Cash Flow in 2018
Market Capitalization*
* on December 31, 2018
4

Full Year 2018 Credit Investor A world leader in gases, technologies and services for Industry and Health
A Strong Business ModelElectricity
Natural gas
Water
ESG(d)
Healthcare
Large Industries
Industrial Merchant
Electronics
Air Liquide Activities
Home healthcare
Patient
Filling
center
SMR(a)
ASU(b)
Filling center
On-site (c)
customer
Hospital
Bulk and Cylinder
Customer
Metal
Producer
Refinery
Chemical
Producer ESG(d)
Filling center
Electronics
Customer
ASU(b)
Mutualize assets
Liquefaction piggyback
Distributors, bolt-on acquisitions
1
2
3
(a) SMR: Hydrogen and carbon monoxide production unit (Steam Methane Reformer) (b) ASU: Air gases production unit (Air Separation Unit) (c) On-site: Small local production unit (d) ESG: Electronic Specialty Gases
5

Full Year 2018 Credit Investor A world leader in gases, technologies and services for Industry and Health
0,0
0,5
1,0
1,5
2,0
2,5
1988 1990 1992 1994 1996 1998 2000 2002 2004 2006 2008 2010 2012 2014 2016 2018
0,0
1,0
2,0
3,0
4,0
5,0
1988 1990 1992 1994 1996 1998 2000 2002 2004 2006 2008 2010 2012 2014 2016 2018
Regular and Sustained Performance - 2018
0
4 000
8 000
12 000
16 000
20 000
1988 1990 1992 1994 1996 1998 2000 2002 2004 2006 2008 2010 2012 2014 2016 2018
0
1 000
2 000
3 000
4 000
1988 1990 1992 1994 1996 1998 2000 2002 2004 2006 2008 2010 2012 2014 2016 2018
Revenue (in €m) EPS(1) (in €)
Cashflow (in €m)
(1) Adjusted for the 2-for-1 share split in 2007, for attributions of free shares and for a factor of 0.974 reflecting the value of the rights of the capital increase completed in October 2016. (2) Calculated according to prevailing accounting rules over 30 years.
Dividend(1) (in € per share)
CAG Rover 30 years
(2)
+5.8%CAG R
over 30 years(2)
+6.9%
CAG Rover 30 years
(2)
+6.5%CAG R
over 30 years(2)
+8.3%
6

7
FY 2018 Activity
Full Year 2018 Credit Investor A world leader in gases, technologies and services for Industry and Health

Full Year 2018 Credit Investor A world leader in gases, technologies and services for Industry and Health
FY 2018 Highlights
+6.1% +60bps
+30bps +22%
Strong sales growth in all markets and geographies
ROCEramping up
Improved G&SOperational margin
Record level ofinvestment decisions
(1) Group comparable sales growth(2) Excluding energy impact
(2)
(1) (3)
(3) Excluding FX impact and positive impact on 2017 net profit of non-cash one-off items
8

Growth at the Top of NEOS Range
Full Year 2018 Credit Investor A world leader in gases, technologies and services for Industry and Health
Note: NEOS sales growth objective between +6% and +8% CAGR 2016-2020, including Airgas scope effect in 2017 contributing +2% to the CAGR(1) Comparable sales growth: excluding currency, energy and significant scope impacts
(1) (1)
9

Full Year 2018 Credit Investor A world leader in gases, technologies and services for Industry and Health
High Sales Growth, Markets Well Oriented
Group
Gas & Services
Comparable sales growth
-1%
0%
1%
2%
3%
4%
5%
6%
7%
H1 16 H2 16 H1 17 H2 17 H1 18 H2 18
Sales growth Markets
Chemicals
Oil & gas
Steel
Metal Fab.
Construction
Energy
Food & Pharma
Integrated Circuit
OutlookH1 19
IM
LI
EL
FY +6.1%
10
Full Year 2018 Credit Investor A world leader in gases, technologies and services for Industry and Health
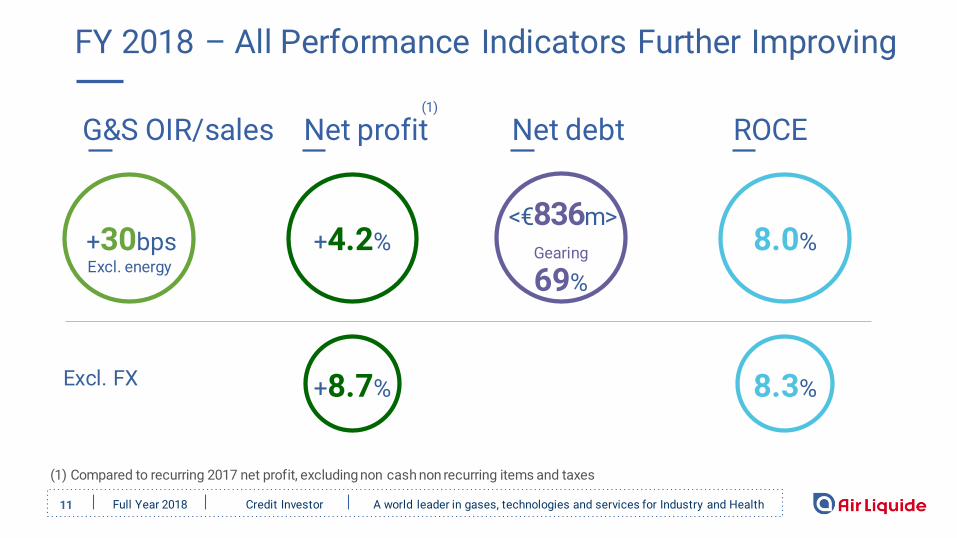
FY 2018 – All Performance Indicators Further Improving
ROCEG&S OIR/sales
+30bps
Net profit Net debt
+4.2%<€836m>
69%Excl. energy
Gearing
(1)
(1) Compared to recurring 2017 net profit, excluding non cash non recurring items and taxes
8.0%
+8.7%Excl. FX 8.3%
11

Full Year 2018 Credit Investor A world leader in gases, technologies and services for Industry and Health
Dividend Proposal, 1 Free Share for 10 in 2019
(1) Excluding non-cash non-recurring items & taxes
(2) Historical data adjusted for attribution of free shares and for a factor 0.974 reflecting the value of the rights of the capital increase completed in October 2016
(3) Subject to approval at the combined shareholders’ meeting scheduled for 7 May 2019
Dividend Growth
0,0
0,4
0,8
1,2
1,6
2,0
2,4
2,8
1998 2000 2002 2004 2006 2008 2010 2012 2014 2016 2018
20 yrsCAGR
+8.8%Dividend(2)
in € per share
€2.65
Net Profit
€2.1bn
(3)
As published
+ 4.2%
Compared to 2017 Recurring Net Profit(1)
12

Positive Environment, Softening FX Headwind
World IP at High Level in 2018
Full Year 2018 Credit Investor A world leader in gases, technologies and services for Industry and Health
Neutral Forex Impact in Q4 2018(2)
Q4 2018
-0.1%
FY 2018
-3.6%
Higher Positive Energy impact(2)
+2.4% +1.3%
Q4 2018 FY 2018
Industrial Production growth in % YTD 2018(1)
+4.0%+3.0%
U.S.World
+4.5%+1.2%
DevelopingEconomiesEuro zone
(1) End of Nov. 2018, except U.S. end of Dec. 2018 (2) On Group sales
13
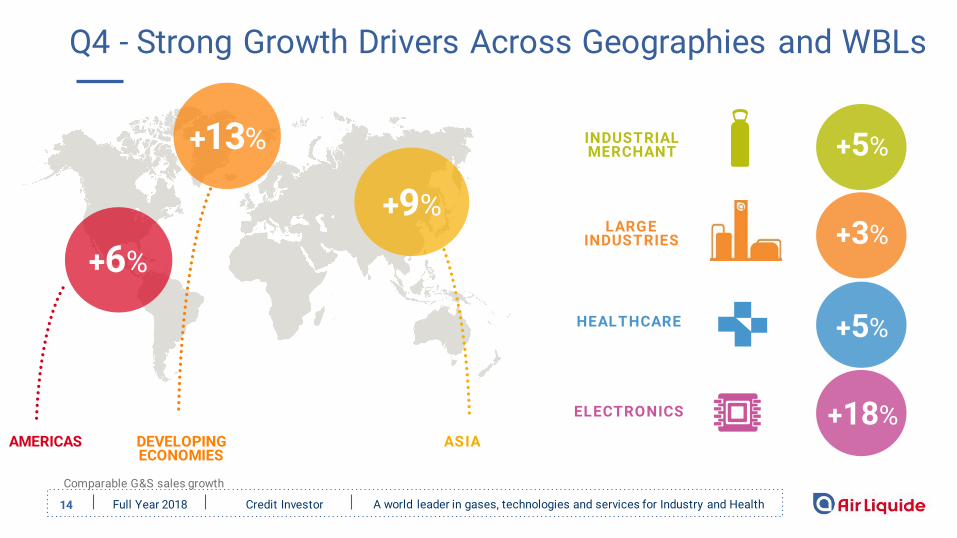
Q4 - Strong Growth Drivers Across Geographies and WBLs
Comparable G&S sales growth
ASIA
INDUSTRIALMERCHANT
AMERICAS
HEALTHCARE +5%
+9%
Full Year 2018 Credit Investor A world leader in gases, technologies and services for Industry and Health
+13%
DEVELOPING ECONOMIES
+6%
ELECTRONICS
+5%
LARGE INDUSTRIES +3%
+18%
14

Base Business Operating at Highest Level
Full Year 2018 Credit Investor A world leader in gases, technologies and services for Industry and Health
G&S Quarterly Sales Growth Analysis
(1) Comparable growth based on 2016 adjusted sales
+29%+31%+14%
15

Q4 – Strong Momentum in Americas, Solid Europe
AMERICASF Y 2 0 1 8
€7,982m
EURO PEF Y 2 0 1 8
€7,111m
Dynamic activity in all WBLs
• LI: high H2, start-ups in air gases
• IM: high growth with increased pricing; most markets well-oriented, very strong Metal Fabrication
• Dynamic HC in the U.S. and South America
• EL: high Advanced Materials, buoyant E&I
• LI: HyCO turnarounds, start-up in Turkey
• IM: growth in all countries; high bulk and cylinders;stronger pricing
• HC: HHC driving growth especiallydiabetes in Nordics
High IM and HC
G&S Comparable Sales Growth
16 Full Year 2018 Credit Investor A world leader in gases, technologies and services for Industry and Health

Q4 – Very Dynamic Asia, Major Start-Up in South Africa
IM boosted by China, buoyant EL
• LI: 3 start-ups including Fujian but majorH2 turnaround in Singapore
• IM: China driving growth with high cylinder volumes,softer pricing; dynamic SEA
• EL: buoyant activity with double-digit growthin CG and AM, very dynamic E&I
Full impact of major start-up in LI
• LI: Sasol start-up in South Africa in Dec. 17
• IM: high growth in Egypt and India
• HC: major contribution from acquisition in Saudi Arabia
ASIA-PACIF I CF Y 2 0 1 8
€4,359m
MIDDLE-EAST& AFRICA
F Y 2 0 1 8
€655m
G&S Comparable Sales Growth
Full Year 2018 Credit Investor A world leader in gases, technologies and services for Industry and Health
FY 18 : +15.5%
17

Continued Recovery in E&C, High Growth in GM&T
Full Year 2018 Credit Investor A world leader in gases, technologies and services for Industry and Health
E&C - Strong Improvement
Sales FY 2018*
+31%
Order Intake FY 2018
+11%
GM&T - Strong Sales and Order Intake
+30%
+31%
Sales FY 2018*
Order Intake FY 2018
€807m €460m
€430m €474m
* Comparable sales growth
18

Full Year 2018 Credit Investor A world leader in gases, technologies and services for Industry and Health
Improved OIR Margin in line with NEOS
19
Note: Group FY 18 OIR Margin as published at 16.4%

Full Year 2018 Credit Investor A world leader in gases, technologies and services for Industry and Health
$300m Airgas Synergies Fully Delivered Beginning 2019
$290m
Costs ~$230m
Revenue ~$60m
$300m synergies expected in Q1 2019, one year ahead initial target
Airgas fully integrated
From 2019, future Airgas contribution to the efficiency program
Cumulatedsynergies
End of 2018
20
21
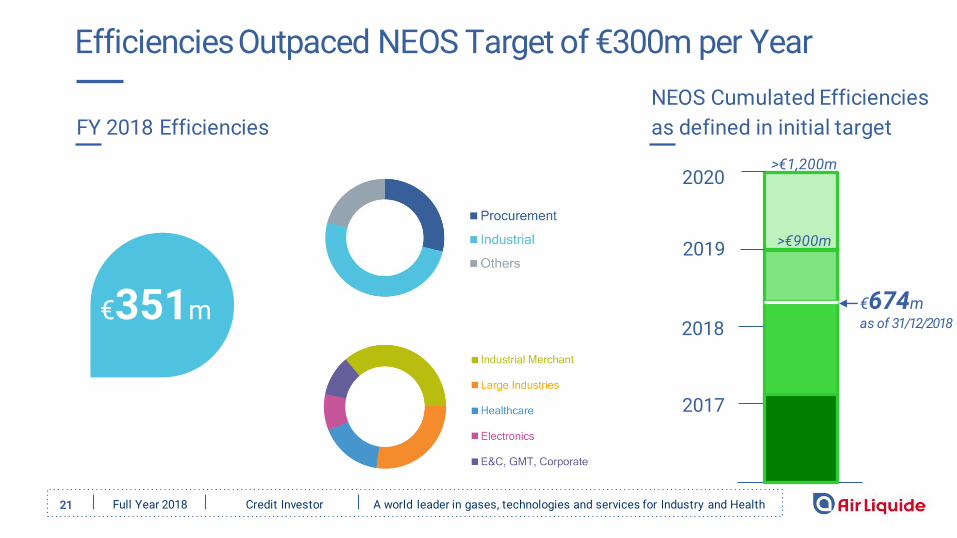
Efficiencies Outpaced NEOS Target of €300m per Year
€351m
Full Year 2018 Credit Investor A world leader in gases, technologies and services for Industry and Health
FY 2018 Efficiencies
NEOS Cumulated Efficiencies
as defined in initial target
2020
2019
2018
2017
>€1,200m
>€900m
€674mas of 31/12/2018
22
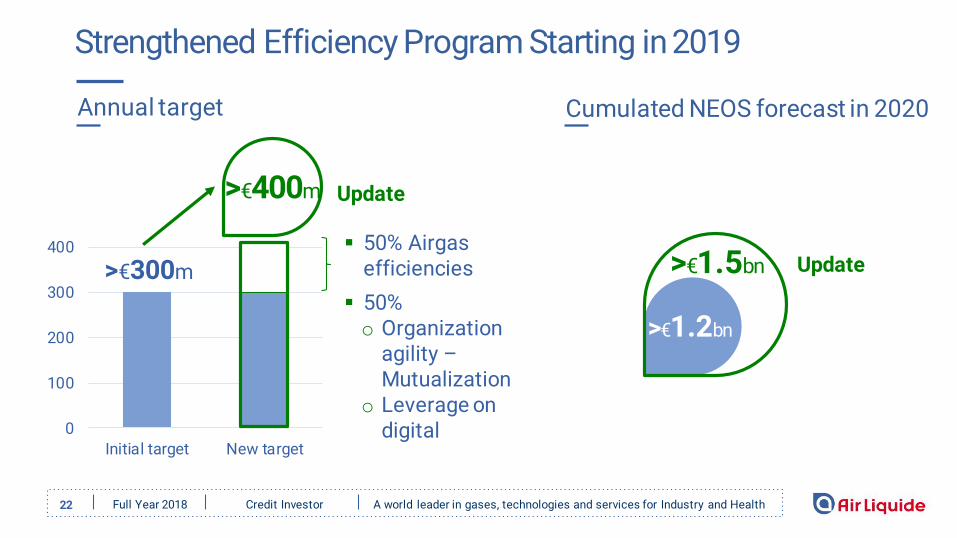
Strengthened Efficiency Program Starting in 2019
Full Year 2018 Credit Investor A world leader in gases, technologies and services for Industry and Health
0
100
200
300
400
Initial target New target
50% Airgas efficiencies
50% o Organization
agility –Mutualization
o Leverage on digital
>€300m
>€400m
Annual target Cumulated NEOS forecast in 2020
Update
>€1.2bn
>€1.5bn
Update

23
Net Profit Recurring Excluding Currency +8.7%
Full Year 2018 Credit Investor A world leader in gases, technologies and services for Industry and Health
(1) Excluding non-cash one-off items in 2017 net profit
24
Dynamic Business Development
Full Year 2018 A world leader in gases, technologies and services for Industry and HealthCredit Investor

25
Very High Decisions & Increasing Opportunities
InvestmentOpportunities(1)
12-month portfolio
2018 Investment Decisions(1)
2018Start-up/Ramp-up
Sales Growth Contribution
€270m€2.6bn
• Selectivity in thriving bidding activity
• Medium-size opportunities
• Record level
• Very high in LI, EL and GM&T
• 1/3 of decisions in the U.S.
• 17 start-ups
(1) See definitions in appendix
Full Year 2018 Credit Investor A world leader in gases, technologies and services for Industry and Health
€3.1bn

Record Level for Investment Decisions, >€3bn
Full Year 2018 Credit Investor A world leader in gases, technologies and services for Industry and Health
Reinforcing presence in key basins
Strategic positionsin growing markets
Opening innovative new markets
~40%
2018 investment decisions
~40%
~20%
Large Industries
Industrial Merchant
Electronics
Global Markets & Technologies
26

27
Strong Backlog
(1) See definitions in appendix
Full Year 2018 Credit Investor A world leader in gases, technologies and services for Industry and Health
Dec 2015 Dec 2016 Dec 2017 Decisions Start-ups Dec 2018
Start-upsDecisions
Yearly Sales Backlog(1)
after full Ramp-ups
€2.3bn
€2.1bn €2.1bn
€2.2bn
€ 0.9bn
in €bn

28 Full Year 2018 Credit Investor A world leader in gases, technologies and services for Industry and Health
Start-Ups Outlook for 2019
Major start-ups
Sales growth contribution
€270m >€300m
FY 2019FY 2018
Note: TO = Take Over
LITO
China
FujianShenyuan
China
PemexTO
Mexico
20182019
Q1 Q2 Q3 Q4
Yanchang
China
LIProjects
Middle-East
ELProjects
Asia
ELProjects
Asia
SteelProjects
Europe
LIProjectArgentina
ELProjects
Asia

Group Credit Profile
Full Year 2018 Credit Investor A world leader in gases, technologies and services for Industry and Health29

Full Year 2018 Credit Investor A world leader in gases, technologies and services for Industry and Health
1,61 1,59 1,63 1,70
3,302,60 2,40
0,000,200,400,600,801,001,201,401,601,802,002,202,402,602,803,003,203,403,603,804,004,204,404,604,805,005,205,405,605,806,006,206,406,606,807,007,207,407,607,808,008,208,408,608,809,009,209,409,609,8010,00
2 000
4 000
6 000
8 000
10 000
12 000
14 000
16 000
2012 2013 2014 2015 2016 2017 2018
Net Debt Net Debt / EBITDA
Net Debt ratios under control
DEBT/ EQUITY
58%
DEBT/ EQUITY
56%
DEBT/ EQUITY
53%
DEBT/ EQUITY
57%
DEBT/ EQUITY
80%
In €m
DEBT/ EQUITY
90%
Following the acquisition of
13,37112,535
2,40x
DEBT/ EQUITY
69%
30

31
Significant Debt and Gearing Reduction
Full Year 2018 Credit Investor A world leader in gases, technologies and services for Industry and Health
CASH FLOW
+10.9%
(1) Including acquisitions, transactions with minority shareholders, net of divestitures.
(2) Including share purchases and capital increases.
GEARING
80%GEARING
69%
Net Debt31 Dec. 2017
Net Debt31 Dec. 2018

32
A Well-diversified Financing Structure
As of December 31, 2018
(1)Others: finance leases and put options granted to minority shareholders
Full Year 2018 Credit Investor A world leader in gases, technologies and services for Industry and Health
BANK DEBT
7%
PRIVATE PLACEMENTS
OTHERS(1)
COMMERCIAL PAPER
BONDS
MARKET DEBT
93%
75%
12%
5%1%
Sources Currencies - Net debt
RMB
3% EUR
45%
USD
37%
OTHERS
12%
JPY
3%

33
Visibility of Financing costs
Full Year 2018 Credit Investor A world leader in gases, technologies and services for Industry and Health
Average cost of net debt
2,00%
3,00%
4,00%
5,00%
2009 2010 2011 2012 2013 2014 2015 2016 2017 2018
-20bps*
3%3,2%
*Excluding a non-recurring gain of around €55mn generated by the unwinding of hedging instruments relating to the debt reorganization in the US
Fixed/variable rates(gross debt)
FIXEDRATE
90%
VARIABLERATE
10%

34
Diversified Market Debt Well Spread over Time
As of December 31, 2018
Full Year 2018 Credit Investor A world leader in gases, technologies and services for Industry and Health
2038
2046

35
Enhanced Liquidity Profile
As of December 31, 2018
Full Year 2018 Credit Investor A world leader in gases, technologies and services for Industry and Health
< 1 year
> 5 years
Between1 and 5 years
Group gross debt maturity profile
€5,3bn
Available liquidity
CONFIRMED CREDIT LINES
68%
• Holdings’ Confirmed Credit Lines are a mix of bilateralfacilities for €1.6bn and a €2bn Revolving Credit Facility
• “Adequate” liquidity profile (S&P)
- 1 syndicated credit line : €2bn
CASH ANDCASH EQUIVALENT
32%
- 12 bilateral facilities : €1,6bn

36
“A” Long Term Credit Rating Commitment
Full Year 2018 Credit Investor A world leader in gases, technologies and services for Industry and Health
■ Long-term rating: A-
■ Short-term rating: A-2
■ Outlook: Stable on 11 October 2018
■ Rationale:
○ Excellent Business Risk as well as adequate Liquidity and asignificant Financial Risk. “S&P places a strong emphasison Air Liquide's earnings resilience and stable cash flowgeneration when analyzing its profitability and financialmetrics. Consequently, S&P views Air Liquide's profitabilityas less volatile than that of most rating peers in thechemicals sector.”
○ The stable outlook reflects S&P‘s expectation that thecompany will report overall resilient performance andstrong free operating cash flow generation that shouldallow FFO to debt to remain at about 25% in 2018 andexceedthat level in 2019.
■ Long-term rating: A3
■ Short-term rating: P-2
■ Outlook: Stable on 18 June 2018
■ Rationale:
○ “As a result of the acquisition Air Liquide's business profileis now stronger and, with higher revenue and stableprofitability, the company was free cash flow positive in2017. […] The rating also incorporates the high resilience ofrevenue and profits from long-term energy-indexed take-or-pay contracts, a well-balanced geographic diversification,and customers from various uncorrelated end markets.”
○ “Air Liquide managed to maintain its Moody's adjustedEBITDA margin at 26% in 2017, despite integrating lessprofitable Airgas and energy price headwinds, by realizinghigher-than expected synergies and costs savings.”

37
2019 Outlook
Full Year 2018 Credit Investor A world leader in gases, technologies and services for Industry and Health

38
2019 Outlook
Profitable, consistent and responsible growth
Solid performance with continued margin improvement and strong cash flow
Dynamic business development
20192018
Full Year 2018 Credit Investor A world leader in gases, technologies and services for Industry and Health
“Assuming a comparable environment, Air Liquide is confident in its abilityto deliver net profit growth in 2019, calculated at constant exchange rate.”
Continue to focus on growth and operational excellence
Strengthening efficiency program
Continue to seize strategic opportunities

39
2019 - Focus On NEOS Objectives
Full Year 2018
Strategic investments to support growth
Strengthening efficiencies
Focus on ROCE
Profitable growth
Consistentgrowth
Responsiblegrowth
Solid and resilient Business Model
Innovation and digital
Operational excellence
Climate objectives, 2015-2025o Reduce carbon intensity by 30%
o Develop new low carbon solutionsfor customers and ecosystems
A world leader in gases, technologies and services for Industry and HealthCredit Investor

40
Appendix
Full Year 2018 Credit Investor A world leader in gases, technologies and services for Industry and Health

FY 2018 G&S Revenue Breakdown by Region
AMERICAS
€8.0bn
EUROPE
€7.1bn ASIA-PACIFIC
€4.4bn
Large Industries ElectronicsHealthcareIndustrial Merchant
Full Year 2018 Credit Investor A world leader in gases, technologies and services for Industry and Health
€20,107m
41

42
Americas
Q4 Gas & Services Sales: €2,091m
INDUSTRIAL MERCHANT LARGE INDUSTRIES HEALTHCARE ELECTRONICS
• Very solid activity for all products: bulk, cylinders and hardgoods
• Very strong pricing +4.2%
• Well-oriented end-markets, particularly Manufacturing,Metal Fabrication and Construction in the U.S.
• Strong volumes of hydrogen in the U.S. and high cogen in Canada
• Ramp-ups in Argentina and the U.S.
• Limited customer turnarounds
• Solid growth in the U.S. and Canada for medical gases
• Limited contribution from bolt-on acquisitions
• Strong momentum in medical gases and HHC in Brazil
• Double-digit sales growth in Advanced and Specialty Materials
• Buoyant E&I sales
Full Year 2018 Credit Investor A world leader in gases, technologies and services for Industry and Health
(1) Excluding energy impact
(1)

43
Europe
Q4 Gas & Services Sales: €1,868m
INDUSTRIAL MERCHANT LARGE INDUSTRIES HEALTHCARE
• High number of customer turnarounds in HyCO
• Softer volumes from steel customers
• Start-up in Turkey
• Growth in all countries
• ~+1 working day
• All markets positive; high Manufacturing and Craftsmen
• Strengthened pricing at +2.6%
• Very strong HHC, particularly inAir Liquide’s largest markets:sleep apnea and diabetes
• Limited bolt-on acquisitions
• Increased number of patients,especially in Northern Europe
Full Year 2018 Credit Investor A world leader in gases, technologies and services for Industry and Health
(1)
(1) Excluding energy impact

44
Asia-Pacific
Q4 Gas & Services Sales: €1,153m
INDUSTRIAL MERCHANT LARGE INDUSTRIES ELECTRONICS
• 3 SUs in China
• H2 customer turnarounds
• Double-digit growth in China :very strong volumes in cylinders ; high demand for small on-site generators ; softer pricing
• Slight decrease in Japan
• High Fabrication and Craftsmen markets
• Double-digit growth in Carrier Gases and Advanced Materials in all countries
• Multiple Ramp-ups• Buoyant E&I sales
Full Year 2018 Credit Investor A world leader in gases, technologies and services for Industry and Health
(1)
(1)
(1) Excluding energy impact

45
Q4 – Strong IM, Solid LI
LARG EINDUSTRIES
F Y 2 0 1 8
€5,685m
INDUSTRIALMERCHANT
F Y 2 0 1 8
€9,181m
Robust growth, several start-ups
• 5 SUs, contribution onlyend of Q4
• Strong H2 in Americas
• HyCO turnarounds in Europe and Asia
Favorable environment with price hikes
All end markets positive
Very strong fabrication market
Strong bulk, cylinders catching up
Increased pricing at +3.3%
G&S Comparable Sales Growth
Credit Investor A world leader in gases, technologies and services for Industry and Health
FY 18 : +4.5%
Full Year 2018

46
Q4 – Steady HC Growth, Buoyant EL
Very solid organic activity
• Double-digit growth in HHC,low level of bolt-on acquisitions
• Solid business model
• High Medical Gases in Americasdriven by Proximity Care
Record sales growth
• Strong demand fromIC market
• Very high growth ofCG and AM
• Very dynamic E&I
HEALTHCAREF Y 2 0 1 8
ELECTRO NICSF Y 2 0 1 8
€1,755m€3,486m
G&S Comparable Sales Growth
Full Year 2018 Credit Investor A world leader in gases, technologies and services for Industry and Health

47
Industrial Merchant Pricing
Full Year 2018 Credit Investor A world leader in gases, technologies and services for Industry and Health

Progressive Improvement in E&C, Dynamic GM&T
48
Sales and Order intake(1) – in €m
Full Year 2018 Credit Investor A world leader in gases, technologies and services for Industry and Health
0
100
200
Q1-17 Q2-17 Q3-17 Q4-17 Q1-18 Q2-18 Q3-18 Q4-18
Sales Order intake
0
100
200
Q1-17 Q2-17 Q3-17 Q4-17 Q1-18 Q2-18 Q3-18 Q4-18
Sales Order intake
(1) Group and third-party order intake
E&C GM&T

Consolidated P&L
Full Year 2018 Credit Investor A world leader in gases, technologies and services for Industry and Health49

50
Consolidated Balance Sheet Simplified - In €m
* Including fair value of derivatives
Full Year 2018 Credit Investor A world leader in gases, technologies and services for Industry and Health

51
Cash Flow Statement
* PPE: Property, plant and equipment
Full Year 2018 Credit Investor A world leader in gases, technologies and services for Industry and Health

52
Investment Cycle – Definitions
● Investment opportunities at end of the period
– Investment opportunities under consideration by the Group for decision within 12 months.
– Industrial projects with investment value > €5m for Large Industries and > €3m for other business lines.
– Includes asset replacements or efficiency projects. Excludes maintenance and safety.
● Investment backlog at end of the period
– Cumulated industrial investment value of projects decided but not yet started.
– Industrial projects with value > €10m, including asset replacements or efficiency projects, excluding maintenance and safety.
● Sales backlog
– Cumulated expected sales per year generated by the current investment backlog after full ramp-up.
● Decisions of the period
– Cumulated value of industrial and financial investment decisions.
– Industrial, growth and non-growth projects including asset replacements, efficiency, maintenance and safety.
– Financial decisions (acquisitions).
Full Year 2018 Credit Investor A world leader in gases, technologies and services for Industry and Health

For further information, please contact:
Investor Relations
Aude Rodriguez + 33 (0)1 40 62 57 08
Louis Laffont + 33 (0)1 40 62 57 18
Ludmilla Binet + 33 (0)1 40 62 57 37
Muriel Légeron + 33 (0)1 40 62 50 18
Jérôme Zaman + 33 (0)1 40 62 59 38
Joseph Marczely + 1 610 263 8277
Group Financing and Rating
Jacques Molgo + 33 (0)1 40 62 57 75
Aude Revel + 33 (0)1 40 62 56 64
Aurélien de Chomereau + 33 (0)1 40 62 53 74
www.airliquide.com Follow us on Twitter @AirLiquideGroup
L’Air Liquide S.A.
Corporation for the study and application of processes developed by Georges Claude
with registered capital of 2,361,264,235 euros
Corporate Headquarters:
75, Quai d’Orsay
75321 Paris Cedex 07
Tel : +33 (0)1 40 62 55 55
RCS Paris 552 096 281
A world leader in gases, technologies and services for Industry and HealthFull Year 2018 Credit Investor53


![Credit Investor Presentation€¦ · Credit Investor Presentation NOK [1,000]m Senior Unsecured Bond Issue November 2017 . 2 IMPORTANT INFORMATION (1/2) This Presentation (the “Presentation")](https://static.documents.pub/doc/80x56/5f39b8482481fd765f19e4d3/credit-investor-presentation-credit-investor-presentation-nok-1000m-senior-unsecured.jpg)


