37
Crescent Point Energy Corporate Presentation April 2016 1
| Date post: | 20-Apr-2018 |
| Category: |
Documents |
| Upload: | nguyentram |
| View: | 218 times |
| Download: | 4 times |
Crescent Point Energy Corporate Presentation April 2016
1

This presentation contains "forward-looking statements" within the meaning of applicable securities legislation, such as section 27A of the Securities Act of 1933 and section 21E of the Securities Exchange Act of 1934, including estimates of future production, cash flows and reserves, business plans for drilling and exploration, the estimated amounts and timing of capital expenditures, the assumptions upon which estimates are based and related sensitivity analyses, and other expectations, beliefs, plans, objectives, assumptions or statements about future events or performance (often, but not always, using words or phrases such as "expects" or "does not expect", "is expected", "anticipates" or "does not anticipate", "plans", "estimated" or "intends", or stating that certain actions, events or results “may", "could", "would", "might" or "will" be taken, occur or be achieved). In particular, this presentation contains forward-looking statements pertaining, to the following: the Company's anticipated 2016 capital budget and average daily production; expected impact of dividend reduction on long-term growth; living within cash flow; plans for the use of excess cash flow; payout ratios; impact of price danger on funds flow; waterflood plans; step-out drilling plans; half-cycle capital efficiencies; corporate decline rate reductions; F&D costs; using internal funding to complete future acquisitions; potential additional cost savings in 2016; expected ongoing cost improvements in 2016; planned reduction or elimination of fresh water usage during completions in Viewfield Bakken; improving differentials in Uinta; the ability of the Company to maintain its balance sheet strength; type well economics and performance; drilling inventory and reserve life index expectations; the anticipated impact of technical advancements and waterflood activities on productivity and decline rates; the Company’s strategy to increase recovery factors and maintain high netbacks with low costs; the Company's waterflood goals and injection well plans; the ability of the Company to manage the current low oil price environment; the Company’s hedging program; the Company’s business strategy (including development, enhancement, acquisition and risk management); capital allocation; 2016 capital expenditure scenarios; CAGR predictions; free cash flow; future commodity prices and production; capital cost and type well scenarios, cost per well, NPV, rate of return and payout; increased recovery given mobility levels; plans for injection wells; production and reserve growth; outperformance of large oil in place pools; and the Company’s expected ongoing emphasis on prudent cost and risk management.
Statements relating to "reserves" are deemed to be forward looking statements, as they involve the implied assessment, based on certain estimates and assumptions, that the reserves described exist in the quantities predicted or estimated and that the reserves can be profitably produced in the future. There are numerous uncertainties inherent in estimating crude oil, natural gas and NGL reserves and the future cash flow attributed to such reserves. The reserve and associated cash flows therefrom are based upon a number of variable factors and assumptions, such as historical production from the properties, production rates, ultimate reserve recovery, timing and amount of capital expenditures, marketability of oil and natural gas, royalty rates, the assumed effects of regulation by governmental agencies and future operating costs, all of which may vary materially. Actual reserve values may be greater than or less than the estimates provided herein. All required reserve information for the Company is contained in its Annual Information Form for the year ended December 31, 2015, which is accessible at www.sedar.com.
All forward-looking statements are based on Crescent Point’s beliefs and assumptions based on information available at the time the assumption was made. The material assumptions are disclosed in the presentation, in the Management’s Discussion and Analysis for the year ended December 31, 2015 under the headings “Marketing and Prices”, “Dividends”, “Capital Expenditures”, “Decommissioning Liability”, “Liquidity and Capital Resources”, “Critical Accounting Estimates”, “Changes in Accounting Policies” and “Outlook”. Crescent Point believes that the expectations reflected in these forward-looking statements are reasonable but no assurance can be given that these expectations will prove to be correct and such forward-looking statements included in this presentation should not be unduly relied upon. By their nature, such forward-looking statements are subject to a number of risks, uncertainties and assumptions, which could cause actual results or other expectations to differ materially from those anticipated, expressed or implied by such statements, including those material risks discussed in the Company’s Annual Information Form and Form 40-F under “Risk Factors” and our Management’s Discussion and Analysis for the year ended December 31, 2015, under the headings “Risk Factors” and “Forward-Looking Information”, and risk factors described in other documents we file from time to time with securities regulatory authorities, all of which are available on SEDAR or sedar.com , EDGAR or www.sec.gov and Crescent Point Energy’s website as www.crescentpointenergy.com. In addition, risk factors include: financial risk of marketing reserves at an acceptable price given market conditions; volatility in market prices for oil and natural gas; delays in business operations; pipeline restrictions; blowouts; the risk of carrying out operations with minimal environmental impact; industry conditions including changes in laws and regulations including the adoption of new environmental laws and regulations and changes in how they are interpreted and enforced; uncertainties associated with estimating oil and natural gas reserves; economic risk of finding and producing reserves at a reasonable cost; uncertainties associated with partner plans and approvals; operational matters related to non-operated properties; increased competition for, among other things, capital, acquisitions of reserves and undeveloped lands; competition for and availability of qualified personnel or management; incorrect assessments of the value of acquisitions and exploration and development programs; unexpected geological, technical, drilling, construction and processing problems; availability of insurance; fluctuations in foreign exchange and interest rates; stock market volatility; failure to realize the anticipated benefits of acquisitions; general economic, market and business conditions; uncertainties associated with regulatory approvals; uncertainty of government policy changes; uncertainties associated with credit facilities and counterparty credit risk; and changes in income tax laws, tax laws, crown royalty rates and incentive programs relating to the oil and gas industry.
These risks and uncertainties could cause actual results or other expectations to differ materially from those anticipated, expressed or implied by such statements. The impact of any one risk, uncertainty or factor on a particular forward-looking statement is not determinable with certainty as these are interdependent. Crescent Point assumes no obligation to update forward-looking statements should circumstances or management's estimates or opinions change. Certain information contained herein have been prepared by third-party sources. The information provided herein has not been independently audited or verified by the Company.
FORWARD-LOOKING STATEMENTS
2

HIGH-QUALITY, LOW-COST PRODUCER: CPG (TSX AND NYSE)
FOOTNOTES INCLUDED IN THE BACK AS ENDNOTES
Market Capitalization $9.2 billion (508.9 million shares fully diluted)(1)
Net Debt* $4.3 billion (incl. hedged US$ denominated debt)
Enterprise Value $13.5 billion
2016 Average Production 165,000 boe/d (~90% oil weighted)
Monthly Dividend $0.03/share
Proved + Probable Reserves 935.7 million boe (RLI:15.5 years)(2)(3)
Proved Reserves 592.1 million boe (RLI: 9.8 years)(2)(3)
Drilling Inventory ~7,700 locations (~14 years of inventory)(3)(4)
* As of December 31, 2015.
Maximize shareholder return with long-term growth and dividend income
3
Viewfield Bakken Shaunavon Flat Lake / Midale Viking Conventional
Uinta Basin
OOIP >7.8 billion
barrels OOIP
>7.4 billion barrels
OOIP >5.2 billion
barrels
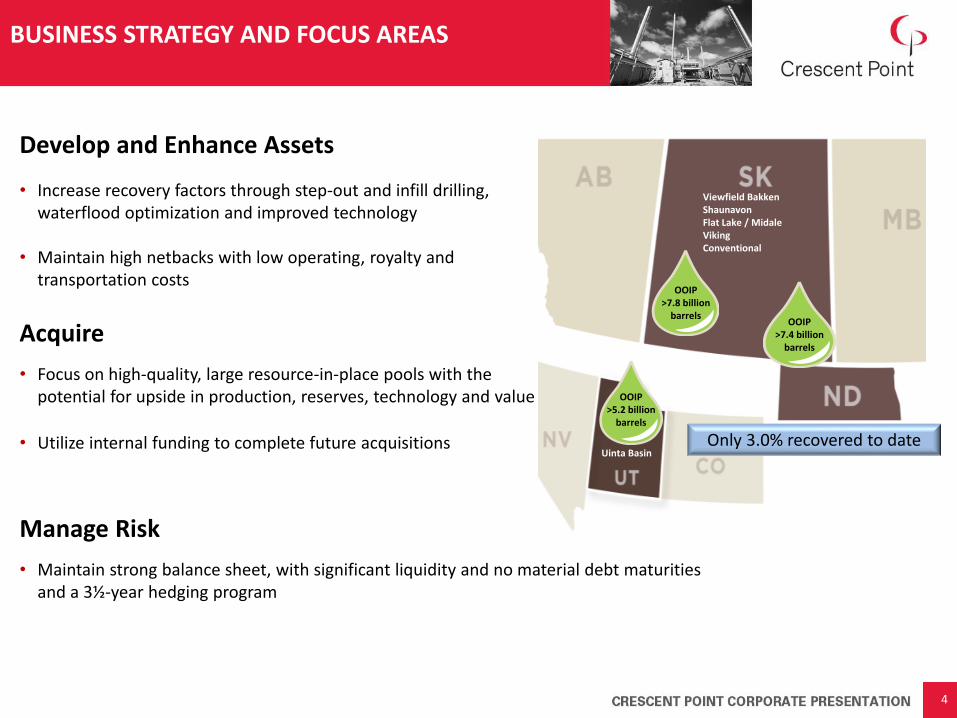
BUSINESS STRATEGY AND FOCUS AREAS
Develop and Enhance Assets
• Increase recovery factors through step-out and infill drilling, waterflood optimization and improved technology
• Maintain high netbacks with low operating, royalty and transportation costs
• Focus on high-quality, large resource-in-place pools with the potential for upside in production, reserves, technology and value
• Utilize internal funding to complete future acquisitions
Acquire
• Maintain strong balance sheet, with significant liquidity and no material debt maturities and a 3½-year hedging program
Manage Risk
4
Only 3.0% recovered to date

0%
10%
20%
30%
40%
50%
0
10,000
20,000
30,000
40,000
50,000
60,000
Q1 16 Q2 16 Q3 16 Q4 16 Q1 17 Q2 17 Q3 17 Q4 17 Q1 18 Q2 18 Q3 18
Swaps Collars Percent Hedged w/o Extendables
COMMODITY HEDGING STRATEGY
2016 average floor price ~ CAD $80.00/bbl 2017 average floor price ~ CAD $76.00/bbl 2018 average floor price ~ CAD $80.00/bbl
As of March 4, 2016. Percentages based on 2016 guidance.
2016 Average: 39%
2017 Average: 9%
2018 Average: 3%
5
Current Oil Hedges
• Mark-to-market value of hedge book is ~$500 million, including oil and gas hedges in place through 2018
Disciplined hedging strategy reduces volatility
bb
l/d
% h
ed
ged

2016 CAPITAL PROGRAM SUPPORTED BY QUICK PAYOUTS
6 US $35 WTI = $35WTI/bbl in 2016, $45WTI/bbl in 2017 and Sproule Dec. 31, 2015 pricing assumptions thereafter. US $45 WTI = Sproule Dec. 31, 2015 pricing assumptions.
High-return asset base provides capital flexibility during current environment
US $35 WTI
US $45 WTI
Mo
nth
s
Type Well Payouts by Play (Excluding Upside from Waterflood and New Technology)
75 - 125 Type Well
150 - 225 Type Well
103 - 175 Type Well
41 - 51 Type Well
65 - 75 Type Well
180 - 250 Type Well
84 - 150 Type Well
125 - 175 Type Well
0
12
24
36
48
60
Viewfield Bakken Flat LakeTorquay
SE SKConventional
MidaleUnconventional
SK Viking Swan Hills Shaunavon(Upper & Lower)
Uinta(Vertical)

REDUCING DRILLING & DEVELOPMENT COSTS
7
Efficiencies are expected to be retained as commodity prices increase
$1.0
$2.0
$3.0
2008 2009 2010 2011 2012 2013 2014 2015 2016E
Shaunavon Drilling and Development Cost
Co
st p
er
we
ll ($
Mill
ion
s)
Co
st p
er
we
ll ($
Mill
ion
s)
• 30% reduction in drilling and development capital costs in 2015 due to operational efficiencies and cost savings
Operational efficiencies include new technology, reduced drilling days and other optimizations
Per well productivity has also increased over this period, enhancing overall economics
• Targeting further capital cost reductions of 10% on average during 2016
Shaunavon well costs are based on an average of Lower and Upper Shaunavon zones. Well costs for 2015 are based on Q4 actual results. 2016 estimated costs based on Q4 2015 actuals less 10%.
$1.0
$1.5
$2.0
$2.5
2008 2009 2010 2011 2012 2013 2014 2015 2016E
Viewfield Bakken Drilling and Development Cost

$(10.00)
$(5.00)
$-
$5.00
$10.00
$15.00
CP
G 2 3 4 5 6 7 8 91
01
11
21
31
41
51
61
71
81
92
02
12
22
32
42
52
62
72
82
93
03
13
23
33
43
53
63
73
83
94
04
14
24
34
44
54
64
74
84
95
05
15
25
35
45
55
65
7
Cash Netbacks @ US$30 WTI (Excluding Hedging Gains)
INDUSTRY-LEADING CASH NETBACKS
8
Cas
h N
etb
acks
$/b
oe
Peer group includes: AAV, APA, APC, AREX, ARX, BBG, BCEI, BIR, BNP, BTE, BXE, BXO, CHK, CLR, CNQ, COG, COS, CPG, CR, CVE, CXO, DVN, ECA, EGN, EOG, EOX, ERF, GXO, HSE, IMO, KEL, MEG, NBL, NFX, OAS, PDCE, PE, PEY, POU, PXD, REXX, RMP, RRC, SGY, SM, SN, SPE, SU, SWN, TOG, TPLM, TVE, VET, VII, WCP, WLL, XEC.
Source: Macquarie Capital Markets Canada Ltd. Based on 2016 WTI US$30, US/Cdn$0.72, and NYMEX $2.50/mcf
Strong Netbacks: • Support corporate cash flow generation to protect balance sheet strength at low oil prices • Contribute to strong economics and quick project payouts
CPG
Canadian Peers
USA Peers
Saskatchewan Focused
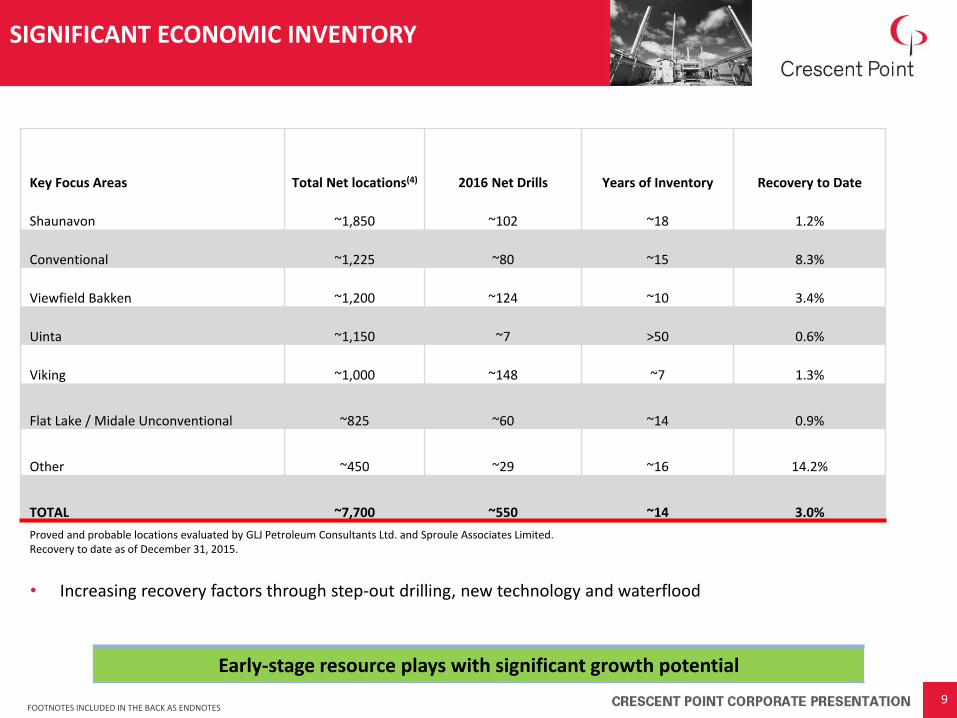
SIGNIFICANT ECONOMIC INVENTORY
Key Focus Areas Total Net locations(4) 2016 Net Drills Years of Inventory Recovery to Date
Shaunavon ~1,850 ~102 ~18 1.2%
Conventional ~1,225 ~80 ~15 8.3%
Viewfield Bakken ~1,200 ~124 ~10 3.4%
Uinta ~1,150 ~7 >50 0.6%
Viking ~1,000 ~148 ~7 1.3%
Flat Lake / Midale Unconventional ~825 ~60 ~14 0.9%
Other ~450 ~29 ~16 14.2%
TOTAL ~7,700 ~550 ~14 3.0%
Proved and probable locations evaluated by GLJ Petroleum Consultants Ltd. and Sproule Associates Limited. Recovery to date as of December 31, 2015.
9 FOOTNOTES INCLUDED IN THE BACK AS ENDNOTES
• Increasing recovery factors through step-out drilling, new technology and waterflood
Early-stage resource plays with significant growth potential

0
20
40
60
80
100
120
140
160
0 1 2 3 4 5
Oil
Rat
e (
bb
l/d
)
Years
100mbbl Infill Direct Offsets Indirectly Affected
Indirect = 125mbbl DO = 350mbbl
VIEWFIELD BAKKEN WATERFLOOD: TRIPLES VALUE OF BAKKEN INFILL WELLS
EUR: 350 mbbls
EUR: 125 mbbls
EUR: 100 mbbls
Viewfield Waterflood Offset Well EURs ~3x greater versus Primary(5)(6)
Example of Per Section Bakken Recoveries and Economics
• Currently producing from ~150 direct offset wells in the Viewfield Bakken
OOIP (MMbbls)
Estimated Recovery Factor(7)
Incremental EURs (mbbls)
Cumulative F&D costs (per bbl)
4-well Spacing
6.1
~10% 615 ~$13
8-well Spacing
6.1
~19% 553 ~$13
Waterflood
6.1
~30% 676 ~$9
Waterflood 6.1 ~40% 615 ~$7
Includes historical land acquisition costs of $1M per section, primary well costs of $1.8M and waterflood injector conversions of $0.4M per well. Current primary well costs are ~$1.4M.
10
Development EUR
(mbbls) NPV
@10%*
Primary Infill
100 $2.1 M Waterflood – Indirect offset 125 $2.8 M Waterflood – Direct Offset 350 $5.9 M
*December 31, 2015 Sproule pricing
FOOTNOTES INCLUDED IN THE BACK AS ENDNOTES
• Incremental F&D of waterflood reserve additions <$3/bbl
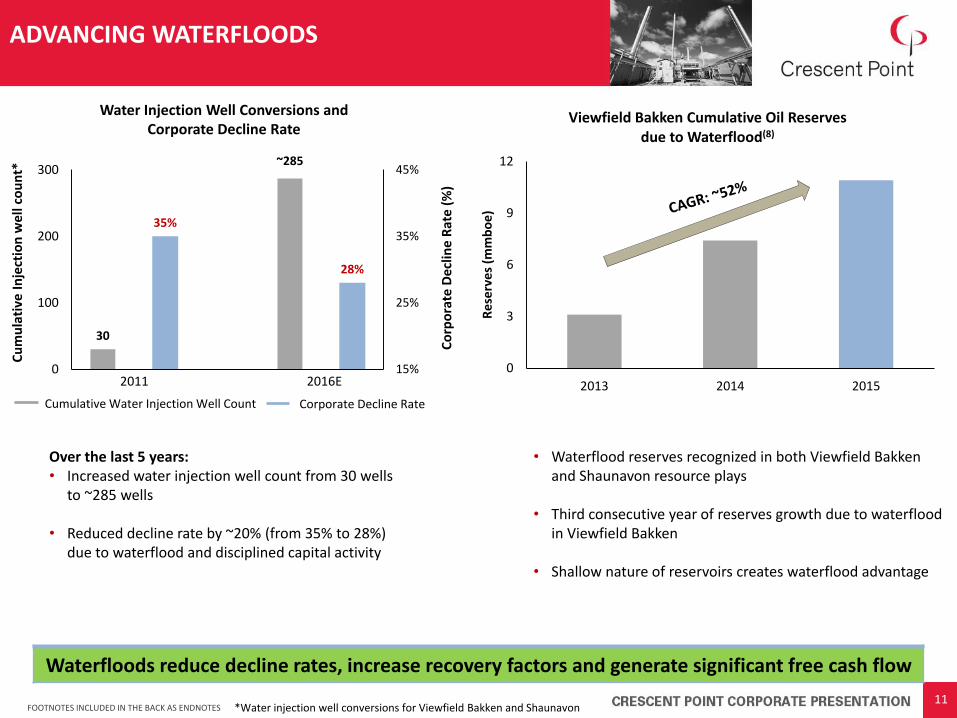
30
~285
35%
28%
15%
25%
35%
45%
0
100
200
300
2011A 2011B 2016A 2016B
ADVANCING WATERFLOODS C
um
ula
tive
In
ject
ion
we
ll co
un
t*
Co
rpo
rate
De
clin
e R
ate
(%
)
*Water injection well conversions for Viewfield Bakken and Shaunavon 11
Water Injection Well Conversions and Corporate Decline Rate
2011 2016E
Cumulative Water Injection Well Count Corporate Decline Rate
Over the last 5 years: • Increased water injection well count from 30 wells
to ~285 wells
• Reduced decline rate by ~20% (from 35% to 28%) due to waterflood and disciplined capital activity
• Waterflood reserves recognized in both Viewfield Bakken and Shaunavon resource plays
• Third consecutive year of reserves growth due to waterflood in Viewfield Bakken
• Shallow nature of reservoirs creates waterflood advantage
Waterfloods reduce decline rates, increase recovery factors and generate significant free cash flow
FOOTNOTES INCLUDED IN THE BACK AS ENDNOTES
0
3
6
9
12
2013 2014 2015
Re
serv
es
(mm
bo
e)
Viewfield Bakken Cumulative Oil Reserves due to Waterflood(8)

578 mmboe
0
100
200
300
400
500
600
700
20
04
20
05
20
06
20
07
20
08
20
09
20
10
20
11
20
12
20
13
20
14
20
15
Cumulative Technical and Development 2P Reserve Additions (mmboe)(9)
ORGANIC RESERVES GROWTH
• Organic growth of 578 mmboe since inception = ~50% of current 2P Reserves (935.7 mmboe) plus cumulative production (~299 mmboe)
• Historical five-year 2P F&D of $20.39/boe with a recycle ratio of 2.2 times(10)
12 FOOTNOTES INCLUDED IN THE BACK AS ENDNOTES
Long-term strategy of step-out and infill drilling, waterflood optimization and improved technology

2016 GUIDANCE
2016 Guidance US$35/bbl WTI
Production (boe/d) 165,000
Capital Expenditures $950 million
Total Payout Ratio 97%
• Living within cash flow: protecting balance sheet and production levels
• 39% capital expenditures reduction from 2015: ($950 million in 2016 from $1.56 billion in 2015) ~55% of capital allocated to H2/16 to benefit from ongoing cost reductions and to increase 2017 flexibility
Reiterated production guidance of 165,000 boe/d
• Focused on long-term sustainability:
Accelerating waterflood development; 120 water injection conversion wells planned for 2016, up 70% from 2015
Advancing technology across asset base to improve recoveries and per-well economics
Drilling step-out wells to expand the economic boundaries of core resource plays
13
2016 Capital Budget Break-Down
Long-Term Capital ~$75 million
Waterflood Injection Well Conversions
Step-Out Drilling
New Completions Technology
Drilling Capital Efficiencies ~$21,000 / boe
Drilling Capital Efficiencies (ex. Long-Term Capital) ~$19,500 / boe

FULLY-FUNDED MODEL
14
• Forecast 97% total payout ratio protects balance sheet strength
• Funds flow increases by ~$400 million in 2016 and ~$600 million in 2017 for every US$10/bbl increase in WTI
FFO = Funds Flow from Operations.
2017 @ US $45 WTI Total Payout Ratio: 96%
Capital Expenditures
Cash Dividends
Funds Flow
16% of FFO
80% of FFO
Production: 165,000 boe/d
Funds Flow
Capital Expenditures
Cash Dividends
2016 @ US $35 WTI Total Payout Ratio: 97%
Production: 165,000 boe/d
21% of FFO
76% of FFO
Sustainable business model positioned for upside in oil price recovery

SUMMARY
15
Proven Management Team
• Proven track record of per share reserves, production and cash flow growth
• 5-year weighted average F&D of $20.39 per 2P boe of reserves (2.2 times recycle ratio)(6)
• Cost-focused producer with strong netbacks and capital efficiencies
• Conservative and flexible capital budget to live within cash flow and maintain balance sheet strength
• Utilize internal funding to complete future acquisitions
• 3½-year hedging program provides cash flow stability and balance sheet protection
• Significant unutilized credit capacity of more than $1.4 billion
Excellent Balance Sheet
High-Quality Reserve Base
• Efficiently allocating capital across high-quality asset base
• ~7,700 net locations in drilling inventory primarily within low cost, high-return basins(4)
• ~14 years of low-risk drilling inventory with a large inventory of potential unbooked upside(3)
• Large OOIP of ~23 billion barrels with only ~3.0% recovered to date
FOOTNOTES INCLUDED IN THE BACK AS ENDNOTES
16
APPENDIX

ORIGINAL OIL IN PLACE ~23 BILLION BARRELS
All figures are rounded to approximate values *Gross OOIP estimates **As of December 31, 2015 *** Calculated by dividing net OOIP by reserves assigned by independent engineering evaluators
Key Focus Areas
OOIP (mmbbls)*
Recovery to Date**
Independent Recovery Factor
(P+P)***
Shaunavon 5,500 1.2% 3.6%
Uinta Basin 5,200 0.6% 3.4%
Viewfield Bakken 4,600 3.4% 8.5%
Flat Lake 1,800 0.9% 3.8%
Viking 1,400 1.3% 5.0%
Midale Unconventional 1,000 0.9% 3.7%
Turner Valley 1,000 19.8% 23.9%
Swan Hills 600 2.4% 9.2%
Cantuar 500 15.7% 21.1%
Battrum 400 26.9% 36.0%
Other 1,000 8.3% 10.6%
TOTAL 23,000 3.0% 6.5%
17

BALANCE SHEET STRENGTH
• Living within cash flow in 2016 and 2017
• No material near-term debt maturities • Significant unutilized credit capacity of more than $1.4 billion
on syndicated credit facility with June 2018 renewal date
• Bank credit facilities and senior guaranteed notes rank equal and are unsecured and covenant-based.
• US$ denominated senior guaranteed notes fully hedged with
cross currency swaps
*Includes underlying currency swaps
Debt Composition ($CAD) as of Dec 31, 2015
$1.4B Unutilized
Credit Capacity
$1.8B Senior
Guaranteed Notes*
$2.2B Drawn on Bank Credit Facilities (~60% utilized)
$50
$119
$232
0
50
100
150
200
250
Less than 1 year 1 - 3 Years 3 - 5 Years
Senior Guaranteed Notes Maturity Schedule*
Mill
ion
$ C
AD
18
0.0x
1.0x
2.0x
3.0x
4.0x
2005 2006 2007 2008 2009 2010 2011 2012 2013 2014 2015
Net Debt to Funds Flow from Operations
Significant amount of liquidity and financial flexibility

1st 2nd
3rd
7th
9th 10th
17th 18th
19th
0
5
10
15
20
25
SK V
ikin
g
SE S
K C
on
ven
tio
nal
Vie
wfi
eld
Bak
ken
Kar
r D
un
vega
n
Bra
zeau
Bel
ly R
iver
Spir
it R
iver
Ch
arlie
Lak
e
Mid
ale
Un
con
ven
tio
nal
East
Pem
bin
a C
ard
ium
Low
er S
hau
nav
on
Flat
Lak
e To
rqu
ay
Wes
t P
emb
ina
Car
diu
m
Per
mia
n M
idla
nd
Bas
in
Kay
bo
b D
uve
rnay
Loch
end
Car
diu
m
Per
mia
n D
elaw
are
Bas
in
Tow
er M
on
tney
Up
per
Sh
aun
avo
n
Uin
ta B
asin
(V
t.)
US
Bak
ken
Tusc
alo
osa
Sh
ale
HIGH-RETURN, QUICK-PAYOUT ASSET BASE
19
CPG
Canadian Peers
USA Peers
Source: Scotiabank GBM. Based on 2016 WTI US$30, US/Cdn$0.70, AECO C$/mcf $1.86 and heavy oil differential of 25%.
Top Light and Medium Oil Resource Plays in North America (ranked by half-cycle payout)
Based on 43 light and medium oil plays (excluding condensate). Payouts based on average of total play results.
Eight of Crescent Point’s nine core resource plays ranked in the top 20 across North America
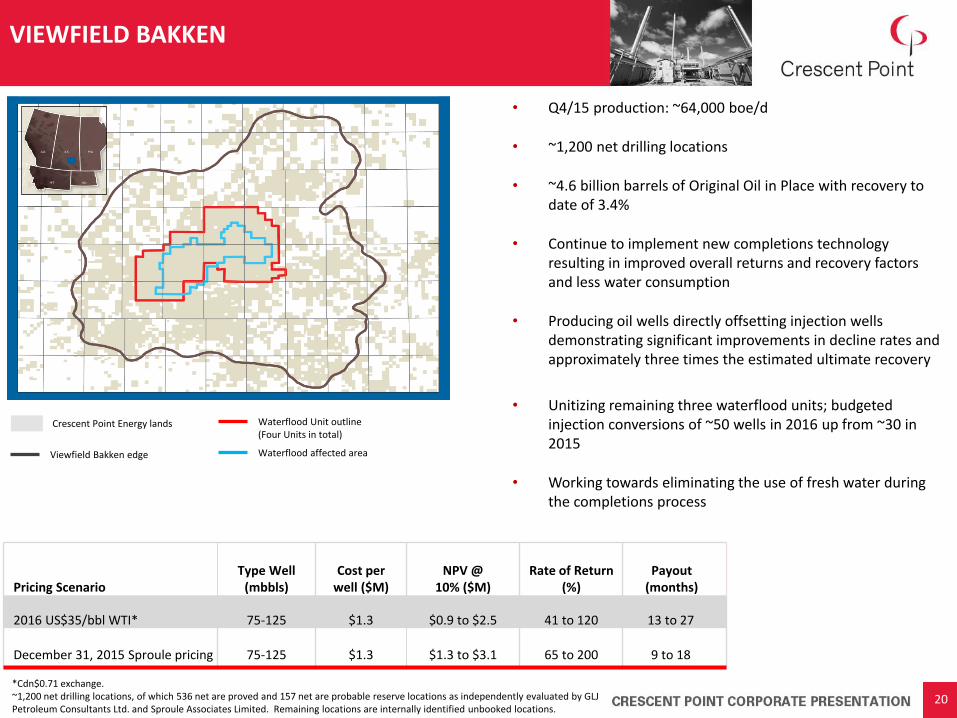
• Q4/15 production: ~64,000 boe/d
• ~1,200 net drilling locations
• ~4.6 billion barrels of Original Oil in Place with recovery to date of 3.4%
• Continue to implement new completions technology resulting in improved overall returns and recovery factors and less water consumption
• Producing oil wells directly offsetting injection wells demonstrating significant improvements in decline rates and approximately three times the estimated ultimate recovery
• Unitizing remaining three waterflood units; budgeted injection conversions of ~50 wells in 2016 up from ~30 in 2015
• Working towards eliminating the use of fresh water during the completions process
VIEWFIELD BAKKEN
Viewfield Bakken edge
Waterflood Unit outline (Four Units in total)
Waterflood affected area
Pricing Scenario Type Well
(mbbls) Cost per
well ($M) NPV @
10% ($M) Rate of Return
(%) Payout
(months)
2016 US$35/bbl WTI* 75-125 $1.3 $0.9 to $2.5 41 to 120 13 to 27
December 31, 2015 Sproule pricing 75-125 $1.3 $1.3 to $3.1 65 to 200 9 to 18
Crescent Point Energy lands
20 *Cdn$0.71 exchange. ~1,200 net drilling locations, of which 536 net are proved and 157 net are probable reserve locations as independently evaluated by GLJ Petroleum Consultants Ltd. and Sproule Associates Limited. Remaining locations are internally identified unbooked locations.

STRATEGIC ASSET BASE WITH STRONG ECONOMICS
75 mbbls infill type well 60/40 Crown/Freehold; 0% GOR, Type Well Economics @ December 31, 2015 Sproule pricing
Average Production
(boe/d)
Average Oil Production
(bbl/d)
Average
Oil Price (C$/bbl)
Average Royalty
(%)
Average Op Cost ($/boe)
Average Netback
($/boe)
Cumulative Cash Flow (M$)
(excl. initial capital)
Year 1 72 62 $53.70 10 $6.53 $38.05 $975
Year 2 29 25 $68.00 10 $9.47 $47.10 $1,787
Comparison Viewfield North Dakota
Land Majority crown Majority freehold
Royalties Crown holiday, ~10% royalty
No holiday, ~30% royalty
Efficiencies Multi-well batteries, no day camps
Single-well batteries, camps for workers
Capital Shallower wells, lower cost wells
Deeper wells, higher cost wells
Drilling and completion capital costs of $1.3 million
0
20
40
60
80
100
120
140
160
0 1 2 3 4 5
Pro
du
ctio
n (
bo
e/d
)
Year
Viewfield Bakken Infill Type Well (75 mbbls)
21

SHAUNAVON
Lower Shaunavon edge
Upper Shaunavon edge
Waterflood affected areas
Waterflood Voluntary Unit
*Cdn$0.71 exchange. Based on Upper and Lower Shaunavon type well economics.
Crescent Point Energy lands
• Q4/15 production: ~25,000 boe/d
• ~1,850 net drilling locations
• ~5.5 billion barrels of Original Oil in Place with recovery to date of 1.2%
• Upper Shaunavon wells exceeding expectations
• Producing oil wells directly offsetting injection wells demonstrating significant improvements in decline rates and approximately two times the estimated ultimate recovery
• Continue to advance waterflood with ~30 injection well conversions planned for 2016
• Eliminated the use of fresh potable water during completions in Q4 2015
22
Pricing Scenario Type Well
(mbbls) Cost per
well ($M) NPV @
10% ($M) Rate of Return
(%) Payout
(months)
2016 US$35/bbl WTI* 84-150 $1.4 - $1.5 $0.6 to $1.5 22 to 38 34 to 48
December 31, 2015 Sproule pricing 84-150 $1.4 - $1.5 $1.0 to $2.2 37 to 78 17 to 30
~1,850 net drilling locations, of which 491 net are proved and 221 net are probable reserve locations as independently evaluated by GLJ Petroleum Consultants Ltd. and Sproule Associates Limited. Remaining locations are internally identified unbooked locations.

SHAUNAVON WATERFLOOD ECONOMICS
Example of Per Section Shaunavon Recoveries and Economics
OOIP (MMbbls) Estimated Recovery
Factor(9) Incremental EURs
(mbbls)
Cumulative F&D costs (per bbl)
4-well Spacing
13.5
~6% 810 ~$14
8-well Spacing
13.5
~10% 540 ~$14
Waterflood 13.5 ~15% 675 ~$10
Includes land acquisition costs of $1.5M per section, primary well costs of $2.5M and waterflood injector conversions of $0.4M per well. Current primary well costs are ~$1.6M. OOIP per section based on lower Shaunavon OOIP estimates only.
23 FOOTNOTES INCLUDED IN THE BACK AS ENDNOTES
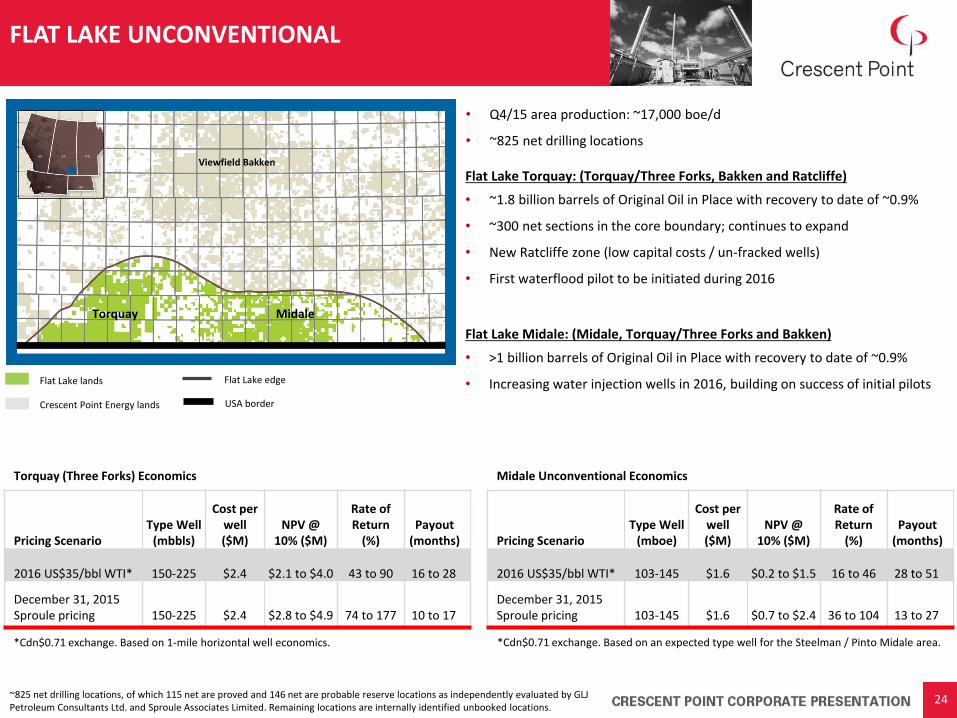
*Cdn$0.71 exchange. Based on 1-mile horizontal well economics.
FLAT LAKE UNCONVENTIONAL
USA border
Flat Lake lands Flat Lake edge
Flat Lake Torquay: (Torquay/Three Forks, Bakken and Ratcliffe)
• ~1.8 billion barrels of Original Oil in Place with recovery to date of ~0.9%
• ~300 net sections in the core boundary; continues to expand
• New Ratcliffe zone (low capital costs / un-fracked wells)
• First waterflood pilot to be initiated during 2016
Flat Lake Midale: (Midale, Torquay/Three Forks and Bakken)
• >1 billion barrels of Original Oil in Place with recovery to date of ~0.9%
• Increasing water injection wells in 2016, building on success of initial pilots
*Cdn$0.71 exchange. Based on an expected type well for the Steelman / Pinto Midale area.
Crescent Point Energy lands
• Q4/15 area production: ~17,000 boe/d
• ~825 net drilling locations
Torquay Midale
Viewfield Bakken
24
Torquay (Three Forks) Economics
Pricing Scenario Type Well
(mbbls)
Cost per well ($M)
NPV @ 10% ($M)
Rate of Return
(%) Payout
(months)
2016 US$35/bbl WTI* 150-225 $2.4 $2.1 to $4.0 43 to 90 16 to 28
December 31, 2015 Sproule pricing 150-225 $2.4 $2.8 to $4.9 74 to 177 10 to 17
Midale Unconventional Economics
Pricing Scenario Type Well
(mboe)
Cost per well ($M)
NPV @ 10% ($M)
Rate of Return
(%) Payout
(months)
2016 US$35/bbl WTI* 103-145 $1.6 $0.2 to $1.5 16 to 46 28 to 51
December 31, 2015 Sproule pricing 103-145 $1.6 $0.7 to $2.4 36 to 104 13 to 27
~825 net drilling locations, of which 115 net are proved and 146 net are probable reserve locations as independently evaluated by GLJ Petroleum Consultants Ltd. and Sproule Associates Limited. Remaining locations are internally identified unbooked locations.
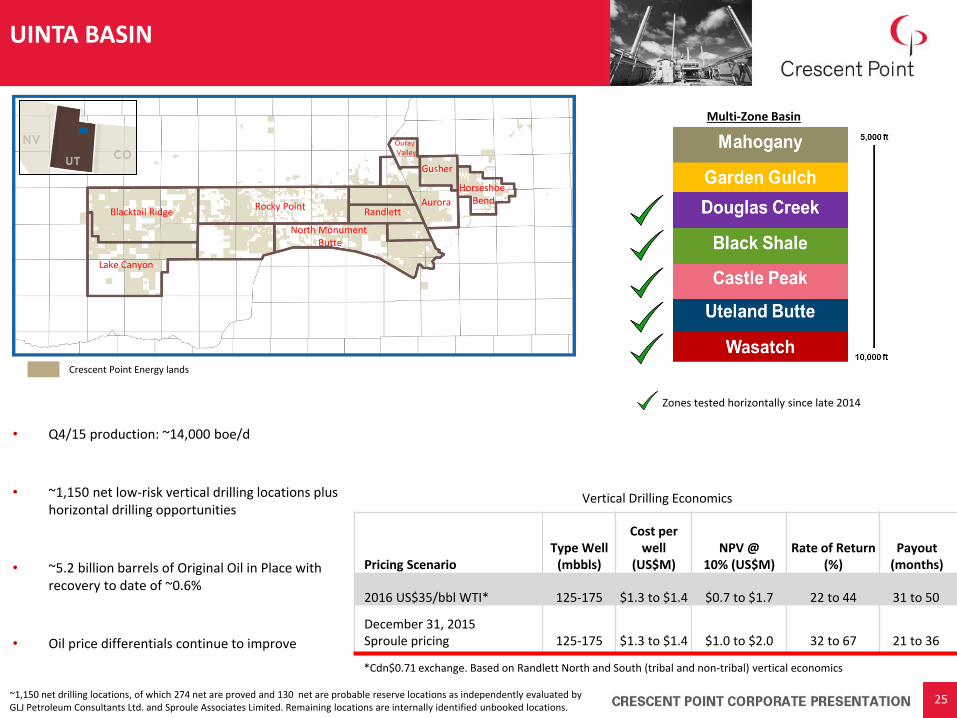
*Cdn$0.71 exchange. Based on Randlett North and South (tribal and non-tribal) vertical economics
• Q4/15 production: ~14,000 boe/d
• ~1,150 net low-risk vertical drilling locations plus horizontal drilling opportunities
• ~5.2 billion barrels of Original Oil in Place with recovery to date of ~0.6%
• Oil price differentials continue to improve
UINTA BASIN
Multi-Zone Basin
Zones tested horizontally since late 2014
25
Crescent Point Energy lands
Blacktail Ridge
Lake Canyon
Randlett
North Monument Butte
Aurora Rocky Point
Gusher
Horseshoe Bend
Ouray Valley
Vertical Drilling Economics
Pricing Scenario Type Well
(mbbls)
Cost per well
(US$M) NPV @
10% (US$M) Rate of Return
(%) Payout
(months)
2016 US$35/bbl WTI* 125-175 $1.3 to $1.4 $0.7 to $1.7 22 to 44 31 to 50
December 31, 2015 Sproule pricing 125-175 $1.3 to $1.4 $1.0 to $2.0 32 to 67 21 to 36
~1,150 net drilling locations, of which 274 net are proved and 130 net are probable reserve locations as independently evaluated by GLJ Petroleum Consultants Ltd. and Sproule Associates Limited. Remaining locations are internally identified unbooked locations.
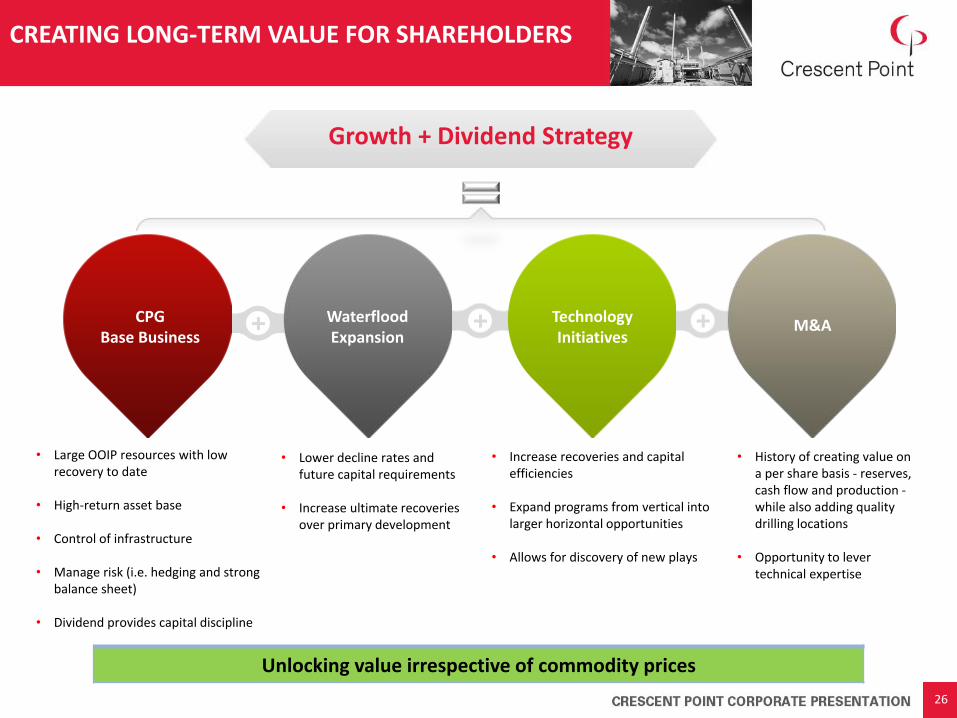
CREATING LONG-TERM VALUE FOR SHAREHOLDERS
Growth + Dividend Strategy
• Large OOIP resources with low recovery to date
• High-return asset base
• Control of infrastructure
• Manage risk (i.e. hedging and strong balance sheet)
• Dividend provides capital discipline
• Lower decline rates and future capital requirements
• Increase ultimate recoveries over primary development
• Increase recoveries and capital efficiencies
• Expand programs from vertical into
larger horizontal opportunities
• Allows for discovery of new plays
• History of creating value on a per share basis - reserves, cash flow and production - while also adding quality drilling locations
• Opportunity to lever technical expertise
CPG Base Business
Waterflood Expansion
Technology Initiatives
M&A
26
Unlocking value irrespective of commodity prices
0
200
400
600
800
1,000
20
05
20
06
20
07
20
08
20
09
20
10
20
11
20
12
20
13
20
14
20
15
P+P Reserves (MMboe)
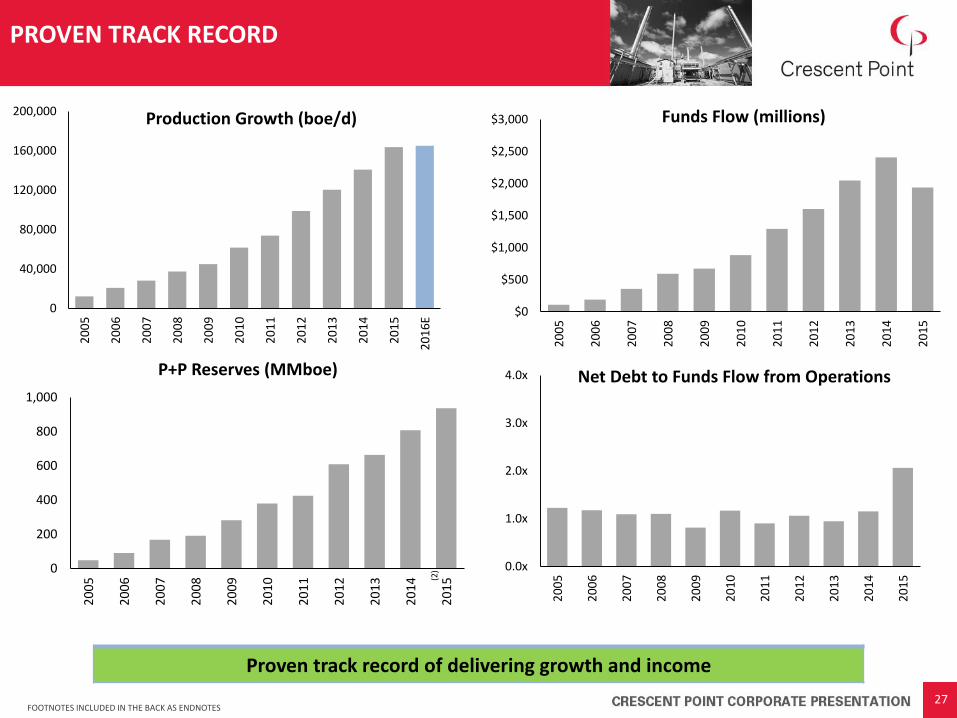
PROVEN TRACK RECORD
(2)
27 FOOTNOTES INCLUDED IN THE BACK AS ENDNOTES
0
40,000
80,000
120,000
160,000
200,000
20
05
20
06
20
07
20
08
20
09
20
10
20
11
20
12
20
13
20
14
20
15
20
16
E
Production Growth (boe/d)
$0
$500
$1,000
$1,500
$2,000
$2,500
$3,000
20
05
20
06
20
07
20
08
20
09
20
10
20
11
20
12
20
13
20
14
20
15
Funds Flow (millions)
0.0x
1.0x
2.0x
3.0x
4.0x
20
05
20
06
20
07
20
08
20
09
20
10
20
11
20
12
20
13
20
14
20
15
Net Debt to Funds Flow from Operations
Proven track record of delivering growth and income

1
1.25
1.5
1.75
2
2010 2011 2012 2013 2014 20150
100
200
300
400
2010 2011 2012 2013 2014 2015
• Integrated strategy of organic development and acquisitions has consistently generated growth on a per share basis
• Declared $30.94 of dividends per share to shareholders from inception to December 31, 2015
• Suspended the dividend reinvestment plans (DRIP and SDP) effective August, 2015, further enhancing long-term per share growth
PER SHARE FOCUS
28
CAGR: ~6% + Dividend Yield
(2)
Production per Share
FOOTNOTES INCLUDED IN THE BACK AS ENDNOTES
CAGR: ~6% + Dividend Yield
Continue growing on a per share basis
Reserves per Share
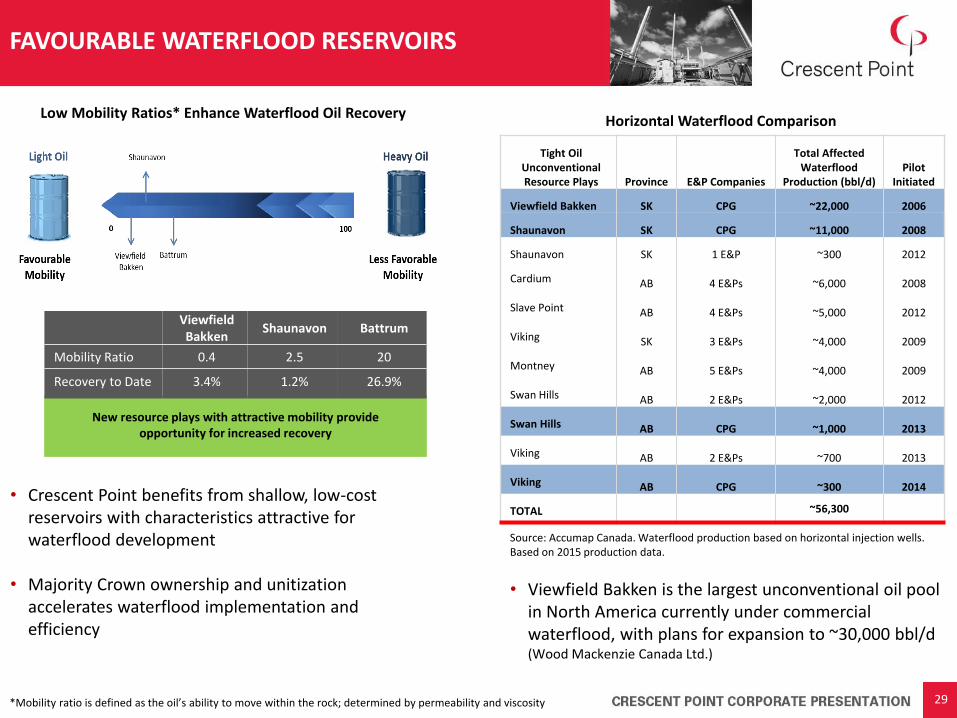
FAVOURABLE WATERFLOOD RESERVOIRS
• Crescent Point benefits from shallow, low-cost reservoirs with characteristics attractive for waterflood development
• Majority Crown ownership and unitization
accelerates waterflood implementation and efficiency
Viewfield Bakken
Shaunavon Battrum
Mobility Ratio 0.4 2.5 20
Recovery to Date 3.4% 1.2% 26.9%
New resource plays with attractive mobility provide opportunity for increased recovery
*Mobility ratio is defined as the oil’s ability to move within the rock; determined by permeability and viscosity 29
Tight Oil Unconventional Resource Plays Province E&P Companies
Total Affected Waterflood
Production (bbl/d) Pilot
Initiated
Viewfield Bakken SK CPG ~22,000 2006
Shaunavon SK CPG ~11,000 2008
Shaunavon SK 1 E&P ~300 2012
Cardium AB 4 E&Ps ~6,000 2008
Slave Point AB 4 E&Ps ~5,000 2012
Viking SK 3 E&Ps ~4,000 2009
Montney AB 5 E&Ps ~4,000 2009
Swan Hills AB 2 E&Ps ~2,000 2012
Swan Hills AB CPG ~1,000 2013
Viking AB 2 E&Ps ~700 2013
Viking AB CPG ~300 2014
TOTAL ~56,300
Source: Accumap Canada. Waterflood production based on horizontal injection wells. Based on 2015 production data.
• Viewfield Bakken is the largest unconventional oil pool in North America currently under commercial waterflood, with plans for expansion to ~30,000 bbl/d (Wood Mackenzie Canada Ltd.)
Horizontal Waterflood Comparison Low Mobility Ratios* Enhance Waterflood Oil Recovery
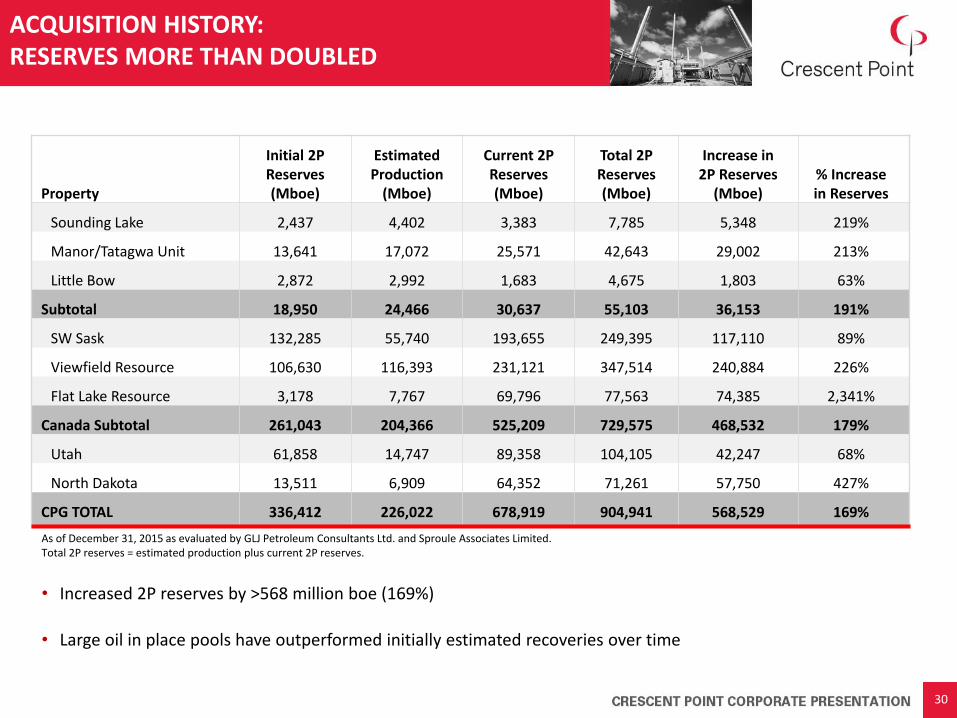
ACQUISITION HISTORY: RESERVES MORE THAN DOUBLED
• Increased 2P reserves by >568 million boe (169%)
• Large oil in place pools have outperformed initially estimated recoveries over time
Property
Initial 2P Reserves (Mboe)
Estimated Production
(Mboe)
Current 2P Reserves (Mboe)
Total 2P Reserves (Mboe)
Increase in 2P Reserves
(Mboe) % Increase in Reserves
Sounding Lake 2,437 4,402 3,383 7,785 5,348 219%
Manor/Tatagwa Unit 13,641 17,072 25,571 42,643 29,002 213%
Little Bow 2,872 2,992 1,683 4,675 1,803 63%
Subtotal 18,950 24,466 30,637 55,103 36,153 191%
SW Sask 132,285 55,740 193,655 249,395 117,110 89%
Viewfield Resource 106,630 116,393 231,121 347,514 240,884 226%
Flat Lake Resource 3,178 7,767 69,796 77,563 74,385 2,341%
Canada Subtotal 261,043 204,366 525,209 729,575 468,532 179%
Utah 61,858 14,747 89,358 104,105 42,247 68%
North Dakota 13,511 6,909 64,352 71,261 57,750 427%
CPG TOTAL 336,412 226,022 678,919 904,941 568,529 169%
As of December 31, 2015 as evaluated by GLJ Petroleum Consultants Ltd. and Sproule Associates Limited. Total 2P reserves = estimated production plus current 2P reserves.
30
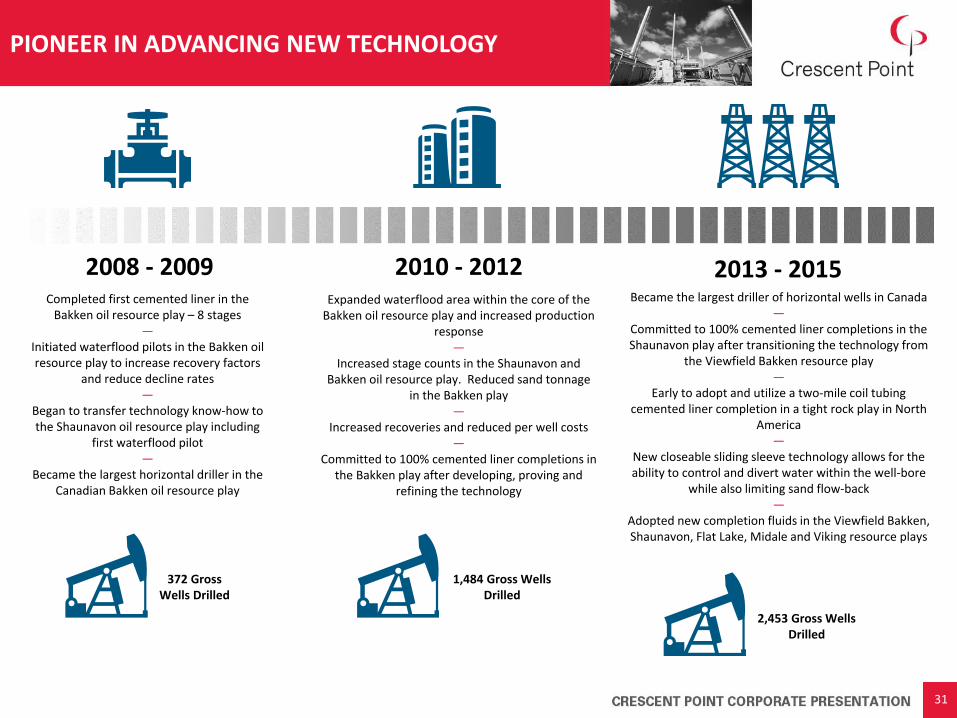
PIONEER IN ADVANCING NEW TECHNOLOGY
Completed first cemented liner in the Bakken oil resource play – 8 stages
—
Initiated waterflood pilots in the Bakken oil resource play to increase recovery factors
and reduce decline rates —
Began to transfer technology know-how to the Shaunavon oil resource play including
first waterflood pilot —
Became the largest horizontal driller in the Canadian Bakken oil resource play
Expanded waterflood area within the core of the Bakken oil resource play and increased production
response —
Increased stage counts in the Shaunavon and Bakken oil resource play. Reduced sand tonnage
in the Bakken play —
Increased recoveries and reduced per well costs —
Committed to 100% cemented liner completions in the Bakken play after developing, proving and
refining the technology
2008 - 2009 2010 - 2012 2013 - 2015
2,453 Gross Wells Drilled
1,484 Gross Wells Drilled
372 Gross Wells Drilled
31
Became the largest driller of horizontal wells in Canada
— Committed to 100% cemented liner completions in the Shaunavon play after transitioning the technology from
the Viewfield Bakken resource play —
Early to adopt and utilize a two-mile coil tubing cemented liner completion in a tight rock play in North
America —
New closeable sliding sleeve technology allows for the ability to control and divert water within the well-bore
while also limiting sand flow-back —
Adopted new completion fluids in the Viewfield Bakken, Shaunavon, Flat Lake, Midale and Viking resource plays

• Technology has shown to be a significant value creator over time; net present value (@ 10%) per-well has more than tripled with technology evolutions (December 31, 2015 Sproule pricing - WTI US$45 and
US/Cdn exchange $0.75)
• New closeable sliding sleeve technology allows for:
Lower costs by minimizing sand flow-back (primary recovery)
Greater efficiency and productivity of waterflood programs through increased control of water placement, potentially leading to enhanced recovery factors (secondary recovery)
VIEWFIELD BAKKEN TECHNOLOGY ADVANCEMENTS
0
50
100
150
200
250
300
Surgi Frac 16 stage packerFrac
16 stagecemented liner
25 stagecemented liner
Viewfield Bakken Independent type well changes(11)
(Primary recovery – 3 twp core)
32 FOOTNOTES INCLUDED IN THE BACK AS ENDNOTES
Technology advancements continue to be transferred to our emerging plays
Mb
bl

0
100
200
300
400
500
600
700
800
900
2009 2010 2011 2012 2013 2014 2015
Wat
er
(m3
)
Viewfield Bakken Fresh Water Usage
0
2
4
6
8
10
12
14
0
5
10
15
20
25
30
2007 2008 2009 2010 2011 2012 2013 2014 2015
Viewfield Bakken Stage and Tonnage Evolution
0
100
200
300
400
500
600
700
800
900
Surgifrac 16 StagePackers Plus
16 StageCemented
Liner
25 StageCemented
Liner
Viewfield Bakken well ROR (3 twp core) Dec. 31, 2015 Sproule pricing– 2016 WTI US$45 US/CDN $0.75 exchange
IMPACT OF TECHNOLOGY IMPROVEMENTS St
age
s p
er
we
ll
Ton
nag
e p
er
stag
e
Rat
e o
f R
etu
rn %
>500% increase in rate of return
Targeting to eliminate fresh water usage during completions
33
0.00
4.00
8.00
12.00
16.00
2007 2008 2009 2010 2011 2012 2013 2014 2015
Day
s
Viewfield Bakken Drilling Progression Spud to Rig Release
ENDNOTES
1. Fully diluted shares outstanding as of December 31, 2015. Based on March 4, 2016 market closing price of $18.04. Directors and officers ownership represents 0.6% of issued and outstanding shares as of March 6, 2016.
2. As of December 31, 2015 as independently evaluated by GLJ Petroleum Consultants Ltd. and Sproule Associates Limited. 3. Calculated using 2016 guidance production of 165,000 boe/d and the drilling of approximately 550 net wells. 4. Approximately 7,700 net drilling locations, of which 2,378 net are proved and 1,305 net are probable reserve locations as independently evaluated by GLJ
Petroleum Consultants Ltd. and Sproule Associates Limited. The remaining net locations are internally identified locations that are unbooked. 5. The non-waterflood infill profile is based on an internal evaluation of existing, 200 meter direct offset infill drilled wells where no waterflood influence has
occurred, normalized to start of production. 6. Waterflood reserve additions represent internally evaluated incremental reserves over the average primary type curve described above. 7. Estimated recovery factors are based on independent (P+P) reserves, comparable analog pools, independent studies commissioned by Crescent Point Energy
and company targets. 8. Waterflood reserve additions represent reserves over primary, as evaluated by independent reserve evaluators, for areas that are directly under
waterflood. 9. Positive reserve revisions include reserves obtained from “Discoveries”, “Extensions”, “Infill Drilling”, “Improved Recovery”, “Technical Revisions” and
“Economic Factors” as defined in COGEH. 10. As of December 31, 2015, excluding the change in future development capital and based on the five year average netback (prior to realized derivatives) of
$44.47 per boe. 11. Well results are based on independently generated curves by Sproule Associates Limited. Results are indicative of typical Estimated Ultimate Recovery levels
based on proved plus probable reserves for each completion type.
34
DEFINITIONS:
1. Original Oil in Place (OOIP) is equivalent to Discovered Petroleum Initially-In-Place (DPIIP) as at December 31, 2015. DPIIP, as defined in the Canadian Oil and Gas Evaluations Handbook (COGEH), is that quantity of petroleum that is estimated, as of a given date, to be contained in known accumulations prior to production. The recoverable portion of DPIIP includes production, reserves and contingent resources; the remainder is unrecoverable.
2. OOIP/DPIIP estimates and recovery rates are as at December 31, 2015 and are based on current accepted technology and prepared by Crescent Point’s qualified reservoir engineers.
3. Cash flow equates to funds flow from operations. Cash flow from operations equals funds flow from operations per share.
4. Net present values disclosed in this presentation are calculated before tax.
5. Enhanced Ultimate Recovery relates to the extraction of additional crude oil, natural gas, and related substances from reservoirs through a production process other than natural depletion, which includes both secondary and tertiary recovery processes such as pressure maintenance, cycling, waterflooding, thermal methods, chemical flooding, and the use of miscible and immiscible displacement fluids.
6. Dividend reinvestment plans include the Dividend Reinvestment Plan (DRIP) and Share Dividend Plan (SDP).
7. Type wells are internally generated based on actual well results and data that is interpreted by internal qualified reserves evaluators.
8. December 31, 2015 Sproule pricing : 2016 US $45 WTI and US/CAD $0.75 exchange, 2017 US $60WTI and US/CAD $0.80 exchange. Hybrid Sproule price deck in 2016; US $35 WTI and US/CAD $0.71 exchange, 2017 US $45WTI and US/CAD $0.73 exchange
NON-GAAP FINANCIAL MEASURES:
Throughout this presentation, the Company uses the terms “funds flow”, “funds flow per share”, “half-cycle capital efficiency”, ”market capitalization”, “net debt”, “net debt to funds flow from operations” and “total payout ratio”. These terms do not have any standardized meaning as prescribed by International Financial Reporting Standards (“IFRS”) and, therefore, may not be comparable with the calculation of similar measures presented by other issuers.
Funds flow is calculated based on cash flow from operating activities before changes in non-cash working capital, transaction costs and decommissioning expenditures. Funds flow per share is calculated as funds flow divided by the number of weighted average diluted shares outstanding. Management utilizes funds flow as a key measure to assess the ability of the Company to finance dividends, operating activities, capital expenditures and debt repayments. Funds flow as presented is not intended to represent cash flow from operating activities, net earnings or other measures of financial performance calculated in accordance with IFRS.
Netback is calculated on a per boe basis as oil and gas sales, less royalties, operating and transportation expenses. Netback is used by management to measure operating results on a per boe basis to better analyze performance against prior periods on a comparable basis.
Half-cycle capital efficiency is calculated as the capital expenditure required to replace a barrel equivalent (boe) of oil. Management utilized half-cycle capital efficiency as a key measure to assess the economic viability of a particular well.
Market capitalization is an indication of enterprise value and is calculated by applying a recent share trading price to the number of diluted shares outstanding.
DEFINITIONS / NON-GAAP FINANCIAL MEASURES
35

DEFINITIONS / NON-GAAP FINANCIAL MEASURES
Net debt is calculated as long-term debt plus accounts payable and accrued liabilities and dividends payable, less cash, accounts receivable, prepaids and deposits and long-term investments, excluding the equity settled component of dividends payable and unrealized foreign exchange on translation of hedged US dollar long-term debt. Management utilizes net debt as a key measure to assess the liquidity of the Company.
Net debt to funds flow from operations is calculated as the net debt divided by funds flow from operations. The ratio of net debt to funds flow from operations is used by management to measure the Company’s overall debt position and to measure the strength of the Company’s balance sheet. Crescent Point monitors this ratio and uses this as a key measure in making decisions regarding financing, capital spending and dividend levels.
Total payout ratio is calculated on a percentage basis as annual capital expenditures and annual dividends paid divided by annual funds flow from operations. Total payout ratio is used by management to monitor the dividend policy and the Company’s capital reinvestment, as a percentage of the amount of funds flow from operations.
Management believes the presentation of the Non-GAAP measures above provide useful information to investors and shareholders as the measures provide increased transparency and the ability to better analyze performance against prior periods on a comparable basis.
Management believes the presentation of the Non-GAAP measures above provide useful information to investors and shareholders as the measures provide increased transparency and the ability to better analyze performance against prior periods on a comparable basis. This information should not be considered in isolation or as a substitute for measures prepared in accordance with IFRS. For definitions of the non-GAAP measures listed above refer to the Company’s most recent annual Management’s Discussion & Analysis (“MD&A”) available on SEDAR as sedar.com, or EDGAR as www.sec.gov and on our website as www.crescentpointenergy.com.
OIL AND GAS METRICS:
This presentation includes oil and gas metrics including “drilling inventory”, “finding and development costs”, “netback”, “mobility ratio” and “recycle ratio”. Such metrics do not have a standardized meaning and as such may not be reliable, and should not be used to make comparisons.
Drilling inventory and current inventory are calculated in years as net well count guidance divided by remainder of inventory. Drilling inventory and current inventory are used by management to assess the amount of available drilling opportunities.
Finding and development costs (or “F&D”) are calculated in dollars by dividing the capital required by the number of barrels being produced. Finding and developments costs are the amounts spent to locate, and establish commodity reserves.
Netback is calculated on a per boe basis as oil and gas sales, less royalties, operating and transportation expenses. Netback is used by management to measure operating results on a per boe basis to better analyze performance against prior periods on a comparable basis.
Mobility ratio is defined as the oil’s ability to move within the rock and is calculated by dividing the permeability of the reservoir’s rock by the viscosity of the fluid within the reservoir. It is used to determine the ease of which OOIP may be extracted.
Recycle Ratio is calculated as the profit per barrel divided by the total cost of discovering and extracting the barrel. For the purposes of this presentation the recycle ratio is calculated as netback divided by finding and development costs per barrel. It is used in determining the profitability of the Company.
Barrels of oil equivalent (“boe”) may be misleading, particularly if used in isolation. A boe conversion ratio of 6 Mcf : 1 Bbl is based on an energy equivalency conversion method primarily applicable at the burner tip and does not represent a value equivalency at the wellhead.
36

BANKER Bank of Nova Scotia
AUDITOR
PricewaterhouseCoopers LLP
LEGAL COUNSEL
Norton Rose Fulbright Canada LLP
EVALUATION ENGINEERS
GLJ Petroleum Consultants Ltd Sproule Associates Ltd
REGISTRAR & TRANSFER AGENT
Computershare Trust Company
INVESTOR CONTACTS
403.767.6930 1.855.767.6923 (Toll Free) [email protected]
Suite 2000, 585 – 8th Ave SW, Calgary, AB T2P 1G1
T: 403.693.0020 | F: 403.693.0070 | TF: (Canada & USA) 1.888.693.0020
COMPANY INFORMATION
www.crescentpointenergy.com
37


