Environmental noise is the unwanted sound receivedat an outdoor location from all sources in a community.Environmentalnoiseexcludessoundsthatareexperiencedbylistenersinoccupationalsettingsaswellasthesoundsemittedbyconsumerproductsandexperiencedbylistenersintheirhomes.Majorsourcesofenvironmentalnoiseincluderoad,rail, and air traffic; industries; construction and public works; lawn and garden equipment; snow-removal equipment; and amplified music. Theextentoftheenvironmentalnoiseproblemisverylarge.IntheUSAintheearly1970s,over40%ofthepopulationwas estimated to be exposed to A-weighted sound levels from vehicular traffic that exceed 55 dB [1]1; in the European Union and Japan, this percentage is even higher [2]. In contrast to manyotherenvironmentalproblems,thepopulationexposedtounacceptablenoisecontinuestogrow,accompaniedbyanever-increasing number of complaints [3]. EnvironmentalnoiseisfrequentlyassessedintheUnitedStates by means of the day-night average A-weighted sound level (abbreviated DNL for day-night average sound level where the A-frequency weighting is understood). In countries in the European Union, the day-evening-night average sound level (abbreviated DENL) is now required for assessments of environmental noise [4]. Day-night average sound level and day-evening-night average sound level have units of decibels (dB) relative to the standard reference pressure of 20 µPa. Day-night average sound level differs from a 24-hour average sound level in that a 10-dB factor is added to sound levels occurring during night-time hours in a determination of DNL. Day-evening-night average sound levels use a 5-dB factor added to sound levels
occurring in evening hours and a 10-dB factor for sound levels occurringduringnighttimehours. The American National Standards Institute [5] and the U.S. National Research Council [6] recommend DNL for assessment of environmental noise as do most federalagenciesandadministrations.TheInternationalOrganizationfor Standardization [7] recommends similar measures for assessmentsofenvironmentalnoise. The degree of noise annoyance in a community isrelated to the level of the noise by means of so called "dose-response"relationships.Theserelationshipshavebeenunderdevelopment for the past 50 years and are developed from meta-analyses of attitudinal survey data. Examples of the developmentoftheresponserelationshipsincludetheseminalstudy by Schultz [8], the study by Finegold, Harris, and von Gierke [9], and the more-recent study by Miedema and Vos [10]. Examples of the application for these relationships can befoundindocumentsbytheU.S.EnvironmentalProtectionAgency [1], the U.S. Federal Interagency Committee on Urban Noise [11], and the U.S. Federal Interagency Committee on Noise [12]. ThereisastrongconsensusthatDNLisagooddescriptor2for assessment of the noise from individual modes oftransportationsuchasvehiclesoraircraft. While thereareotherdescriptorsthatcanbeusedtoassesstransportationnoise,yearly-average DNL (YDNL) is the descriptor of choice for assessments of the long-term annoyance caused by individual noisesourcetypes. Thechoiceofnoisedescriptor,however, isbuthalf theproblem.Moreimportantthanthedescriptorarethevaluesof the descriptor chosen to represent various degrees ofadversity.Ifthecriteriaaretoohigh,theywillfailtoprovidean acceptable living environment; conversely, if the criteria are too low, then theywill requireunnecessarilyexpensivemitigationmeasuresandwillprobablybe ignored. Apoor
a) Schomer and Associates, Inc.; 2117 Robert Drive, Champaign, Illinois, 61821, USA; e-mail: [email protected]
1 Numbers enclosed within brackets represent citations in the list of refer-ences. 2 Noise descriptors are also known as ‘metrics.’
133Noise Control Eng. J. 53 (4), 2005 July–Aug
choicefordescriptorwithappropriatecriterionlevelscandoafairjobinportrayingthecommunityreactiontonoise,butthebestdescriptorwillfailifthecriterionlevelsaretoohighortoolow. Thispapercollects,tabulates,andcomparesrecommendedappropriate minimum criteria levels for the long-term DNL descriptorinvarioustypesofcommunitiesandsettings.Theanalysis is primarily from a USA perspective; however the conclusionsshouldbeequallyapplicableinanyindustrializedcountry. This paper also looks at the available basic data on which many of the criteria were based. Finally, this paper summarizessomeoftherecommendedadjustmentstoDNLthat are contained in [7] and other factors that reduce the variationsbetweenpredictedandreportedcommunitynoiseannoyance. This paper is concerned with noise annoyance in areaswherepeoplereside.Itdoesnotdealwithnoiseannoyancein other settings such as at work, or in parks and wilderness areas. This paper does not deal with non-auditory effects of noisesuchashearinglossordirectimpactsofnoiseonhealthor sleep. Thispaperdoesnotdealwithcognitiveorothernon-annoyance effects of noise in schools, the workplace, or thehome.
2 RevIew Of DeSCRIPTORS AND CORReSPONDING CRITeRIA fOR ASSeSSING NOISe ANNOYANCe
2.1 U.S. federal Agencies that recommend minimum day-night average sound levels of about 65 dB
2.1.1FederalAviationAdministration
The U.S. Federal Aviation Administration (FAA), a part of the U.S. Department ofTransportation, uses DNLas the preferred descriptor for assessing aircraft noise inso-called “Airport Part 150 Studies.” Part 150 studies are noise-compatibility/land-use studies designed to identify and evaluatemeasurestomitigatetheimpactofaircraftnoiseinthevicinity of airports. Outdoor day-night average sound levels ranging upward from 65 dB are considered in such studies [13]. For an airport Part 150 study3,residentialareasdonotdifferentiatebetweenurban,suburban,orruralareas. Withvirtually no exceptions, the FAA provides noise-mitigation funds for residentialareasonlywhen theDNLexceeds,oris predicted to exceed, 65 dB. The FAA regards a DNL of 65 dB as “the level of significance for assessing noise impacts” [13].
2.1.2DepartmentofDefense
The U.S. Department of Defense (DoD) uses DNL to evaluate noise in environmental assessments and in “Air-Installation Compatible Use Zone Studies” [14]. AICUZ studies are noise-compatibility/land-use studies designed to
helpmitigatetheimpactofthenoiseproducedbyoperationsofmilitaryaircraftatresidentiallocationsinthevicinityofairinstallations. Outdoor day-night average sound levels ranging upward from 65 dB are considered in such studies. Sometimes, forpurposesofinformation,aDNLcontourlineispresentedat a level of 60 dB. For an AICUZ study, the description of a residential area doesnotdifferentiatebetweenurban,suburban,orruralareas.The same factors that influenced the FAA’s choice of 65 dB as the minimum criterion level also influenced the DoD’s choice, althoughaircraftoperatedbyagenciesoftheDoDhaveneverbeendesignedtominimizenoiselevelsinacommunityaroundan airfield. In addition to aircraft noise, agencies of the DoD thatoperate weapons as part of military training and readinessexercisesareconcernedaboutthenoiselevelsinneighboringcommunities. Day-night average sound level [hereafter shortened to day-night sound level] is the preferred descriptor forthesoundsproducedbyweaponsandexplosivedevices4.2.1.3DepartmentofHousingandUrban Development
The U.S. Department of Housing and Urban Development (HUD) noise policy was first published in 1971 [15]. However, HUD has no cognizance over the sound produced by any noise source. The HUD Noise Assessment Guidelines are included here for completeness. In a 1985 document [16], outdoor day-night sound levels ranging from 65 dB to 75 dB are described as “normally unacceptable [for housing]” and DNLs from 60 dB to 65 dB are described as being “normally acceptable.” DNLs less than 60 dB are termed in the HUD Guidelines as “clearly acceptable.”
2.2 Agencies and Boards of the U.S. federal Government that recommend minimum day-night average sound levels of about 55 dB
Many administrations, agencies, commissions, andboards of the U.S. Federal Government, other than the FAA and the DoD, have oversight over noise-producing sources. The Federal Transit Administration, the Federal Railroad Administration, the Surface Transportation Board, the Federal Highway Administration, and the Federal Energy Regulatory Commission are five of the more important. Moreover,a mission of the National Research Council, a part of theNational Academy of Science, is to provide advice on scientific matters to the entire Federal Government, including advice on preferred descriptors for evaluating noise in residentialcommunities.
2.2.1TheFederalTransitAdministration
The Federal Transit Administration (FTA), a part of the U.S.DepartmentofTransportation,usestheDNLdescriptor
3 Part 150 refers to a part of Title 14 of the U.S. Code of Federal Regula-tions.
4 A-weighted sound exposure is used for the sound of small arms. For large weapons, C-weighted sound exposure is measured or predicted and then converted to an equivalent A-weighted sound exposure as described in [5] and [7].
134 Noise Control Eng. J. 53 (4), 2005 Jul–Aug
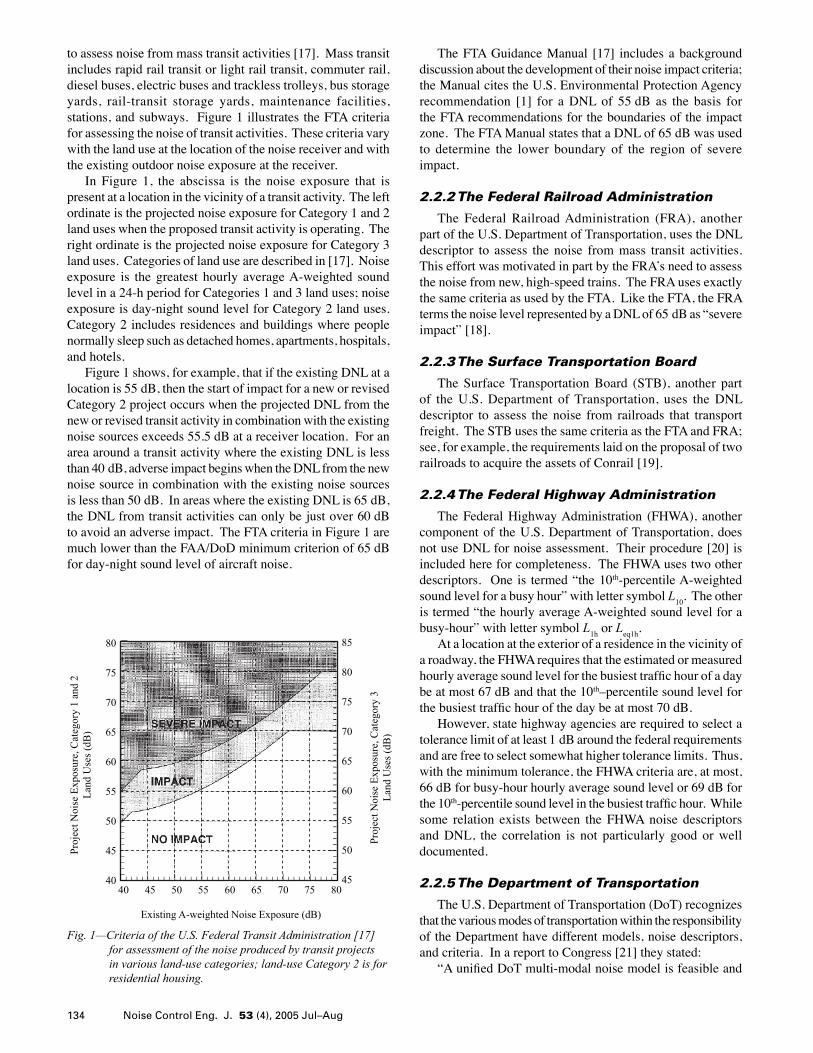
to assess noise from mass transit activities [17]. Mass transit includesrapidrailtransitorlightrailtransit,commuterrail,diesel buses, electric buses and trackless trolleys, bus storage yards, rail-transit storage yards, maintenance facilities, stations, and subways. Figure 1 illustrates the FTA criteria forassessingthenoiseoftransitactivities.Thesecriteriavarywiththelanduseatthelocationofthenoisereceiverandwiththeexistingoutdoornoiseexposureatthereceiver. In Figure 1, the abscissa is the noise exposure that is presentatalocationinthevicinityofatransitactivity.Theleftordinate is the projected noise exposure for Category 1 and 2 landuseswhentheproposedtransitactivityisoperating.Theright ordinate is the projected noise exposure for Category 3 land uses. Categories of land use are described in [17]. Noise exposure is the greatest hourly average A-weighted sound level in a 24-h period for Categories 1 and 3 land uses; noise exposure is day-night sound level for Category 2 land uses. Category 2 includes residences and buildings where people normallysleepsuchasdetachedhomes,apartments,hospitals,andhotels. Figure 1 shows, for example, that if the existing DNL at a location is 55 dB, then the start of impact for a new or revised Category 2 project occurs when the projected DNL from the neworrevisedtransitactivityincombinationwiththeexistingnoise sources exceeds 55.5 dB at a receiver location. For an areaaroundatransitactivitywheretheexistingDNLislessthan 40 dB, adverse impact begins when the DNL from the new noisesourceincombinationwiththeexistingnoisesourcesis less than 50 dB. In areas where the existing DNL is 65 dB, the DNL from transit activities can only be just over 60 dB to avoid an adverse impact. The FTA criteria in Figure 1 are much lower than the FAA/DoD minimum criterion of 65 dB for day-night sound level of aircraft noise.
The FTA Guidance Manual [17] includes a background discussion about the development of their noise impact criteria; theManualcitestheU.S.EnvironmentalProtectionAgencyrecommendation [1] for a DNL of 55 dB as the basis for the FTA recommendations for the boundaries of the impact zone. The FTA Manual states that a DNL of 65 dB was used to determine the lower boundary of the region of severeimpact.2.2.2TheFederalRailroadAdministration
The Federal Railroad Administration (FRA), another partoftheU.S.DepartmentofTransportation,usestheDNLdescriptor to assess the noise from mass transit activities.This effort was motivated in part by the FRA’s need to assess the noise from new, high-speed trains. The FRA uses exactly the same criteria as used by the FTA. Like the FTA, the FRA terms the noise level represented by a DNL of 65 dB as “severe impact” [18].
2.2.3TheSurfaceTransportationBoard
The Surface Transportation Board (STB), another part of the U.S. Department ofTransportation, uses the DNLdescriptor to assess the noise from railroads that transportfreight. The STB uses the same criteria as the FTA and FRA; see,forexample,therequirementslaidontheproposaloftworailroads to acquire the assets of Conrail [19].
2.2.4TheFederalHighwayAdministration
The Federal Highway Administration (FHWA), another componentof theU.S.DepartmentofTransportation,doesnot use DNL for noise assessment. Their procedure [20] is included here for completeness. The FHWA uses two other descriptors. One is termed “the 10th-percentile A-weighted sound level for a busy hour” with letter symbol L
10.Theother
is termed “the hourly average A-weighted sound level for a busy-hour” with letter symbol L
1horL
eq1h.
Atalocationattheexteriorofaresidenceinthevicinityofa roadway, the FHWA requires that the estimated or measured hourly average sound level for the busiest traffic hour of a day be at most 67 dB and that the 10th–percentilesoundlevelforthe busiest traffic hour of the day be at most 70 dB. However, state highway agencies are required to select a tolerance limit of at least 1 dB around the federal requirements andarefreetoselectsomewhathighertolerancelimits.Thus,with the minimum tolerance, the FHWA criteria are, at most, 66 dB for busy-hour hourly average sound level or 69 dB for the10th-percentile sound level in the busiest traffic hour. While some relation exists between the FHWA noise descriptors and DNL, the correlation is not particularly good or welldocumented.
2.2.5TheDepartmentofTransportation
The U.S. Department of Transportation (DoT) recognizes thatthevariousmodesoftransportationwithintheresponsibilityoftheDepartmenthavedifferentmodels,noisedescriptors,and criteria. In a report to Congress [21] they stated: “A unified DoT multi-modal noise model is feasible and
Fig. 1—Criteria of the U.S. Federal Transit Administration [17] for assessment of the noise produced by transit projects in various land-use categories; land-use Category 2 is for residential housing.
desirable. It would enable the evaluation of the noiseimpactsfrommultiplesourceswithouttheneedformultiplemodels. As an example, using MNM [Multi-modal Noise Model], evaluation of the noise impacts of an airport with severalhighwaysanda rapid transit line running to theairportwouldnolongerrequiretheuseoftwocomputerizedmodels and one non-computerized model to perform an assessment. In addition to facilitating analysis, a multi-modalmodelwouldenableonetomoreclearlyassessandcomparethecontributionsofeachsourcetothetotalnoiseexposure. In the present situation, the commonly usednoisedescriptorsdifferfromonemodetoanother.Evenfor the same transportationmode, criteriavalueswoulddiffer [i.e., there would be different criteria from one mode to another when using the same descriptor].”
Clearly, in 2000 the DoT recognized that there is no commonnoisedescriptororcriterionwithintheDoT,letalonewithin the Federal Government, for assessing the noise from transportationmodes.
2.2.6TheFederalEnergyRegulatory Commission
The Federal Energy Regulatory Commission (FERC) has issued regulations [22] that require: “the noise attributable to any new compressor stations,
compression added to an existing station, or anymodification, upgrade or update of an existing station, must not exceed a day-night average sound level of 55 dB at any pre-existing noise-sensitive area (such as schools, hospitals, or residences).”
FERC developed this policy based on the level of significance identified by the USEPA at a DNL of 55 dB.
2.2.7TheEnvironmentalProtection Agency
The U.S. Environmental Protection Agency [1] recommended a DNL of 55 dB as the “level requisite to protect health and welfare with an adequate margin of safety.” The USEPArecommendedtheuseofDNLandtheDNLcriterionlevel of 55 dB to other federal agencies. In a recent letter [23], a USEPA regional administrator, Ms. Mindy Lubber, asked the FAA to assess the noise of a proposed new runway at Boston’s Logan Airport using DNL at a criterion level of 55 dB.
2.2.8TheNationalResearchCouncil
The National Research Council (NRC), Committee on Hearing, Bioacoustics and Biomechanics (CHABA), developed guidelines for preparing environmental impactstatements on noise [6]. The NRC selected DNL as the preferred noise descriptor and a criterion level of 55 dB to representthebeginningofnoiseimpactinresidentialareas. Figure 2 shows the NRC requirements for noise assessments invarioussituations. Therequirementsare in termsof theyearly day-night average sound level, YDNL, in decibels. The abscissa is the existing or expected YDNL at a receiver location with the sound from noise sources in a ‘project’ not present. A
‘project’ could be any new activity (highway, airport, airplane flight paths, railroad, unloading and loading of ships, freight or truck depot, delivery trucks for a supermarket, or building or road construction) that contains sources that could increase the existing YDNL at a receiver location. The ordinate is the YDNL expected at the receiver location when the new sources ofnoisearepresent. For a project, actions that may be required to assess the noiseof theprojectrangefromtherequirement toproducea ‘full’ Noise Environmental Documentation (NED), to a ‘modified’ NED, to no action if the expected YDNL is sufficiently low (i.e., the project is ‘screened out’). A project may be permanent (e.g., a highway) or temporary (e.g., road construction). For temporary projects, a modified NED is required if the daily DNL is less than 90 dB; if the daily DNL equals or exceeds 90 dB, a ‘full’ NED is required. Figure 2 shows, for example, that if the existing DNL is 50 dB, then full environmental documentation is required when the expected YDNL for a permanent project is equal to or greater than 40 dB. The NRC recommendations in Figure 2 for project environmental documentation are more stringent thanthecorrespondingguidelinesorrecommendationsbyallother Agencies and Boards of the U.S. Federal Government and much more stringent than a DNL criterion level of 65 dB.
2.3 National Standards Setting Bodies
2.3.1AmericanNationalStandardsInstitute (ANSI)
American National Standard ANSI S12.9/Part 4 [5] recommendsDNLasthepreferreddescriptorofenvironmentalnoise. American National Standard ANSI S12.9/Part 5
Modified NED For TemporaryProjects (Daily Ldn < 90 dB)
Fig. 2—Screening diagram from the U.S. National Research Council [6] for the expected yearly day-night average sound level (YDNL) of an intruding noise source, relative to the existing or expected YDNL at a receiver location, to determine whether ‘full’ or ‘modified’ Noise Environmen-tal Documentation (NED) is required.
136 Noise Control Eng. J. 53 (4), 2005 Jul–Aug
establishes a DNL criterion of 55 dB for housing and similar noise-sensitive land uses [24].
2.3.2AmericanPublicTransitAssociation
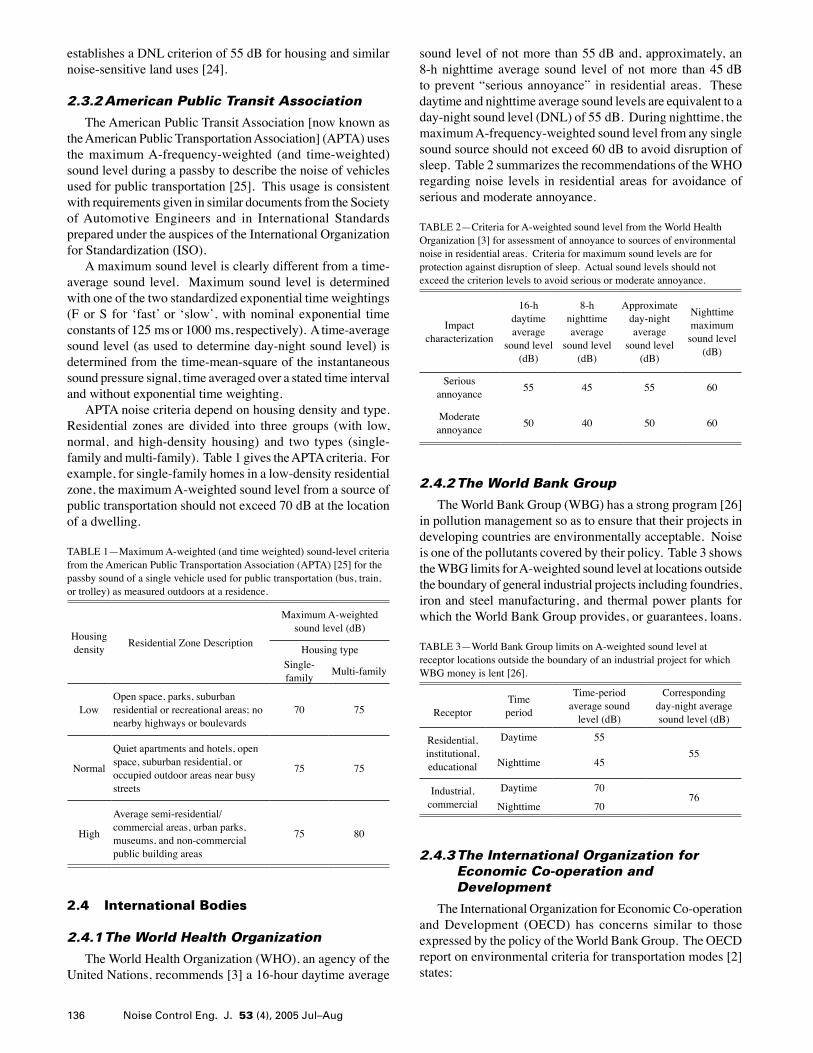
The American Public Transit Association [now known as the American Public Transportation Association] (APTA) uses the maximum A-frequency-weighted (and time-weighted) soundlevelduringapassbytodescribethenoiseofvehiclesused for public transportation [25]. This usage is consistent withrequirementsgiveninsimilardocumentsfromtheSocietyofAutomotive Engineers and in International StandardspreparedundertheauspicesoftheInternationalOrganizationfor Standardization (ISO). A maximum sound level is clearly different from a time-average sound level. Maximumsound level isdeterminedwithoneofthetwostandardizedexponentialtimeweightings(F or S for ‘fast’ or ‘slow’, with nominal exponential time constants of 125 ms or 1000 ms, respectively). A time-average sound level (as used to determine day-night sound level) is determined from the time-mean-square of the instantaneous soundpressuresignal,timeaveragedoverastatedtimeintervalandwithoutexponentialtimeweighting. APTAnoisecriteriadependonhousingdensityandtype.Residential zones are divided into three groups (with low,normal, and high-density housing) and two types (single-family and multi-family). Table 1 gives the APTA criteria. For example, for single-family homes in a low-density residential zone, the maximum A-weighted sound level from a source of public transportation should not exceed 70 dB at the location ofadwelling.
TABLE 1—Maximum A-weighted (and time weighted) sound-level criteria from the American Public Transportation Association (APTA) [25] for the passbysoundofasinglevehicleusedforpublictransportation(bus,train,or trolley) as measured outdoors at a residence.
Housing density ResidentialZoneDescription
Maximum A-weighted sound level (dB)
Housing typeSingle-family Multi-family
LowOpen space, parks, suburban residential or recreational areas; no nearbyhighwaysorboulevards
Average semi-residential/commercial areas, urban parks, museums, and non-commercial publicbuildingareas
75 80
2.4 International Bodies
2.4.1TheWorldHealthOrganization
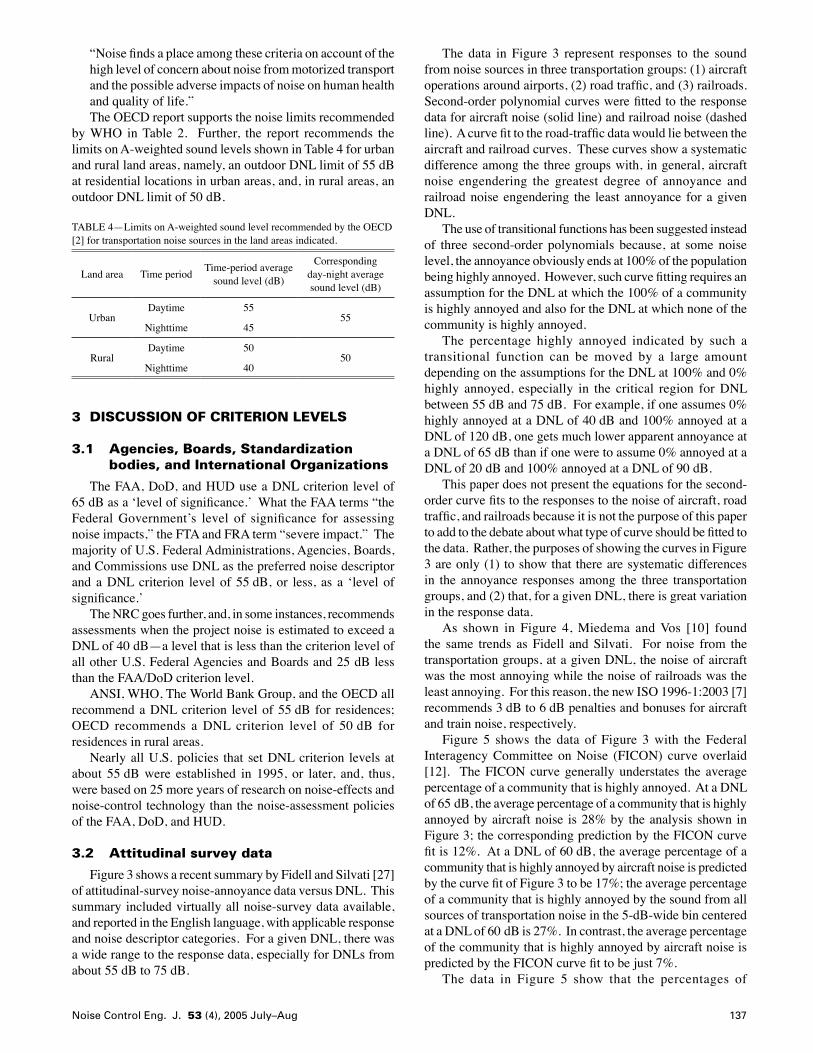
The World Health Organization (WHO), an agency of the United Nations, recommends [3] a 16-hour daytime average
sound level of not more than 55 dB and, approximately, an 8-h nighttime average sound level of not more than 45 dB to prevent “serious annoyance” in residential areas. These daytimeandnighttimeaveragesoundlevelsareequivalenttoaday-night sound level (DNL) of 55 dB. During nighttime, the maximum A-frequency-weighted sound level from any single sound source should not exceed 60 dB to avoid disruption of sleep. Table 2 summarizes the recommendations of the WHO regardingnoise levels in residential areas for avoidanceofseriousandmoderateannoyance.
TABLE 2—Criteria for A-weighted sound level from the World Health Organization [3] for assessment of annoyance to sources of environmental noiseinresidentialareas.Criteriaformaximumsoundlevelsareforprotectionagainstdisruptionofsleep.Actualsoundlevelsshouldnotexceedthecriterionlevelstoavoidseriousormoderateannoyance.
Impactcharacterization
16-h daytimeaverage
soundlevel(dB)
8-h nighttimeaverage
soundlevel(dB)
Approximateday-night average
soundlevel(dB)
Nighttimemaximum
soundlevel(dB)
Seriousannoyance 55 45 55 60
Moderateannoyance 50 40 50 60
2.4.2TheWorldBankGroup
The World Bank Group (WBG) has a strong program [26] inpollutionmanagementsoastoensurethattheirprojectsindevelopingcountriesareenvironmentallyacceptable.Noiseis one of the pollutants covered by their policy. Table 3 shows the WBG limits for A-weighted sound level at locations outside theboundaryofgeneralindustrialprojectsincludingfoundries,ironandsteelmanufacturing,andthermalpowerplantsforwhich the World Bank Group provides, or guarantees, loans.TABLE 3—World Bank Group limits on A-weighted sound level at receptorlocationsoutsidetheboundaryofanindustrialprojectforwhichWBG money is lent [26].
ReceptorTimeperiod
Time-period averagesound
level (dB)
Correspondingday-night average sound level (dB)
Residential,institutional,educational
Daytime 5555
Nighttime 45
Industrial,commercial
Daytime 7076
Nighttime 70
2.4.3TheInternationalOrganizationfor EconomicCo-operationand Development
The International Organization for Economic Co-operation and Development (OECD) has concerns similar to those expressed by the policy of the World Bank Group. The OECD report on environmental criteria for transportation modes [2] states:
137Noise Control Eng. J. 53 (4), 2005 July–Aug
“Noise finds a place among these criteria on account of the highlevelofconcernaboutnoisefrommotorizedtransportandthepossibleadverseimpactsofnoiseonhumanhealthand quality of life.”
TheOECDreportsupportsthenoiselimitsrecommendedby WHO in Table 2. Further, the report recommends the limits on A-weighted sound levels shown in Table 4 for urban and rural land areas, namely, an outdoor DNL limit of 55 dB atresidentiallocationsinurbanareas,and,inruralareas,anoutdoor DNL limit of 50 dB.
TABLE 4—Limits on A-weighted sound level recommended by the OECD [2] for transportation noise sources in the land areas indicated.
Landarea Timeperiod Time-period average sound level (dB)
Correspondingday-night average sound level (dB)
UrbanDaytime 55
55Nighttime 45
RuralDaytime 50
50Nighttime 40
3 DISCUSSION Of CRITeRION LeveLS
3.1 Agencies, Boards, Standardization bodies, and International Organizations
The FAA, DoD, and HUD use a DNL criterion level of 65 dB as a ‘level of significance.’ What the FAA terms “the Federal Government’s level of significance for assessing noise impacts,” the FTA and FRA term “severe impact.” The majority of U.S. Federal Administrations, Agencies, Boards, andCommissionsuseDNLasthepreferrednoisedescriptorand a DNL criterion level of 55 dB, or less, as a ‘level of significance.’ TheNRCgoesfurther,and,insomeinstances,recommendsassessmentswhentheprojectnoiseisestimatedtoexceedaDNL of 40 dB—a level that is less than the criterion level of all other U.S. Federal Agencies and Boards and 25 dB less than the FAA/DoD criterion level. ANSI, WHO, The World Bank Group, and the OECD all recommend a DNL criterion level of 55 dB for residences; OECD recommends a DNL criterion level of 50 dB for residencesinruralareas. NearlyallU.S.policies that setDNLcriterion levelsatabout 55 dB were established in 1995, or later, and, thus, were based on 25 more years of research on noise-effects and noise-control technology than the noise-assessment policies of the FAA, DoD, and HUD.
3.2 Attitudinal survey data
Figure 3 shows a recent summary by Fidell and Silvati [27] of attitudinal-survey noise-annoyance data versus DNL. This summary included virtually all noise-survey data available, andreportedintheEnglishlanguage,withapplicableresponseand noise descriptor categories. For a given DNL, there was awiderangetotheresponsedata,especiallyforDNLsfromabout 55 dB to 75 dB.
The data in Figure 3 represent responses to the sound from noise sources in three transportation groups: (1) aircraft operations around airports, (2) road traffic, and (3) railroads. Second-order polynomial curves were fitted to the response data for aircraft noise (solid line) and railroad noise (dashed line). A curve fit to the road-traffic data would lie between the aircraftandrailroadcurves.Thesecurvesshowasystematicdifferenceamongthethreegroupswith,ingeneral,aircraftnoise engendering the greatest degree of annoyance andrailroadnoise engendering the least annoyance for agivenDNL. Theuseoftransitionalfunctionshasbeensuggestedinsteadof three second-order polynomials because, at some noise level,theannoyanceobviouslyendsat100%ofthepopulationbeing highly annoyed. However, such curve fitting requires an assumptionfortheDNLatwhichthe100%ofacommunityishighlyannoyedandalsofortheDNLatwhichnoneofthecommunityishighlyannoyed. The percentage highly annoyed indicated by such atransitional function can be moved by a large amountdependingontheassumptionsfortheDNLat100%and0%highly annoyed, especially in the critical region for DNLbetween 55 dB and 75 dB. For example, if one assumes 0% highly annoyed at a DNL of 40 dB and 100% annoyed at a DNL of 120 dB, one gets much lower apparent annoyance at a DNL of 65 dB than if one were to assume 0% annoyed at a DNL of 20 dB and 100% annoyed at a DNL of 90 dB. This paper does not present the equations for the second-order curve fits to the responses to the noise of aircraft, road traffic, and railroads because it is not the purpose of this paper to add to the debate about what type of curve should be fitted to the data. Rather, the purposes of showing the curves in Figure 3 are only (1) to show that there are systematic differences in the annoyance responses among the three transportationgroups, and (2) that, for a given DNL, there is great variation intheresponsedata. As shown in Figure 4, Miedema and Vos [10] found the same trends as Fidell and Silvati. For noise from the transportationgroups,atagivenDNL,thenoiseofaircraftwasthemostannoyingwhilethenoiseofrailroadswastheleast annoying. For this reason, the new ISO 1996-1:2003 [7] recommends 3 dB to 6 dB penalties and bonuses for aircraft andtrainnoise,respectively. Figure 5 shows the data of Figure 3 with the Federal Interagency Committee on Noise (FICON) curve overlaid [12]. The FICON curve generally understates the average percentageofacommunitythatishighlyannoyed.AtaDNLof 65 dB, the average percentage of a community that is highly annoyed by aircraft noise is 28% by the analysis shown in Figure 3; the corresponding prediction by the FICON curve fit is 12%. At a DNL of 60 dB, the average percentage of a communitythatishighlyannoyedbyaircraftnoiseispredictedby the curve fit of Figure 3 to be 17%; the average percentage ofacommunitythatishighlyannoyedbythesoundfromallsources of transportation noise in the 5-dB-wide bin centered at a DNL of 60 dB is 27%. In contrast, the average percentage ofthecommunitythatishighlyannoyedbyaircraftnoiseispredicted by the FICON curve fit to be just 7%. The data in Figure 5 show that the percentages of
138 Noise Control Eng. J. 53 (4), 2005 Jul–Aug
a population that were highly annoyed by sources oftransportationnoisestartedtodecreaserapidlyataDNLofabout 55 dB with a further drop to near 0% at a DNL of about 50 dB, i.e., in the gray-shaded region in Figure 5. Thus, to minimizethepercentageofapopulationthatishighlyannoyedby sources of transportation noise, it appears that a DNLcriterion level should be selected in the range from 50 dB to 55 dB, based on the totality of applicable worldwide noise
annoyancesurveydata.Suchachoicewouldbeconsistentwith the recommendations of the World Health Organization andtheU.S.NationalResearchCouncil.
4 ADjUSTmeNT fACTORS
4.1 A History of adjustment factors
A great deal of energy has been expended on fitting a variety of “dose-response” curves to the cloud of attitudinal survey data such as that shown in Figures 3 and 5. The scatter in the
Schomer - 4
100
80
60
40
20
040 50 60 70 80
DNL (dB)
Aircraft
Road Traffic
Railroads
Hig
hly
anno
yed
(%)
–
-
–
-
–
-
–
-
–
-
–- - - - - - - - -
Fig. 4—Results of a meta-analysis by Miedema and Vos [10] of noise annoyance using all applicable world-wide survey data on attitudes of residents in a community to intruding noise from aircraft, road traffic, and railroads. Schomer - 5
100
80
60
40
20
030 40 50 60 70 80 90
DNL (dB)
Airports Road Traffic Railroad
Hig
hly
anno
yed
(%) -
-
-
-
-
-- - - - - - -
FICON
Fig. 5—Annoyance response data of Fidell and Silvati with curve fit from the FICON study [12] and the 65‑dB point high-lighted. The gray-shaded area is the region where there is a transition from moderate to substantial degrees of annoyance to little-to-no annoyance.
100
80
60
40
20
020 30 40 50 60 70 80 90
DNL (dB)
Airports
Road Traffic
Railroad— — — — — — — —
Hig
hly
anno
yed
(%)
Fig. 3—Compilation by Fidell and Silvati [27] of surveys of the annoyance response to noise from aircraft operations from airports, road traffic, and railroads. The top solid‑line is a second‑order curve fit to the aircraft noise data; the bottom dashed‑line curve is a similar fit to the railroad noise data. The curve fit to the road‑traffic noise data lies between the curves for aircraft and railroad noise.
139Noise Control Eng. J. 53 (4), 2005 July–Aug
data can be traced to at least three causes: (1) response bias, (2) descriptor shortcomings, and (3) measurement bias and uncertainty. Anexampleof responsebias ispublic relations. Ithasbeenshownthatpeoplearemoreacceptingofanoiseiftheyfeel the authorities are concerned with their well-being and aredoingvirtuallyallthattheyreasonablycantomitigatetheexposuretothenoise.Ontheotherhand,ifpeoplefeelthatit is a case of “you can’t fight city hall,” then annoyance may increaseoverthatpresentinaneutralsituation. An example of “descriptor shortcomings” is the difference in the annoyance to the sound from aircraft, road traffic, and railroad noise sources. If one used loudness-weighted sound exposure instead of A-frequency-weighted sound exposure to determine day-night average sound level, as suggested by Schomer [28,29], then these differences tend to lessen or disappear. Other examples of “descriptor shortcomings” are the difficulties in describing the sound when tonal components arepresentorwhenthesoundisimpulsive. Measurement bias might be the result of setting a highsound-level threshold for an unattended airport noise monitor so as to ensure that only aircraft noise is included in themeasured results. Such an action could bias the reportedmeasurementslowbecauseoftheexclusionofaircraftnoisethat was actually present at the location but was not highenough to exceed the threshold. For a single measurement ofsoundexposure,measurementuncertaintyisbasicallythetolerancesaroundthedesigngoalsfortheinstruments,theirplacementandoperation,howoftentheacousticalsensitivityis checked, and the spectrum and temporal characteristics
of the sound. Measurement uncertainty, at the 95% confidence interval, can be of the order of a few decibels in a measurement of A-weighted sound exposure level. In this section, we are concerned with “response bias” and “descriptor shortcomings.” The 1974 EPA report [1] attempted to relate day-night averagesoundlevelswithcommunityreactionasmeasuredbycomplaints and threats of legal actions as shown in Figure 6. Agivenresponsecategorywasassociatedwithawiderangeof day-night sound levels. For example, at a DNL of 55 dB, Figure 6 shows that community reactions ranged from “no reaction” to “severe threats of legal action or strong appeals to local officials to stop the noise.” In an attempt to reduce the scatter to the communityresponse data, the EPA [1] suggested the use of “normalized” DNL.NormalizedDNListhemeasuredorpredictedDNLwith a number of adjustments added to account for specific characteristics of the sound. Table 5 shows the EPA-suggested adjustmentfactorsandtheirmagnitudes.Adjustmentfactorsincludedseasonalconsiderations,considerationofthelevelof background noise present at a location, consideration of the influence of previous exposure and community relations, andconsiderationofthecharacteroftheintrudingsound(e.g.,tonal or impulsive). Figure 7 shows the data from Figure 6 afterhavingbeenadjustedusingthisprocedure.ThedatainFigure 7 are substantially compressed and there is much less scatter than was present in Figure 6. The adjustment factors in Table 5 were in use long before the EPA’s Office of Noise Abatement and Control came into being in 1973. In 1953, the adjustment factors in Table 5 were
TABLE 5—EPA-recommended adjustments [1] to be added to the measured or predicted DNL of an intruding noise at a residential location.
Communityhashadsomepreviousexposuretotheintrudingnoise,butlittleeffortisbeingmadetocontrolthenoise.Thisadjustmentmayalsobeappliedinasituationwherethecommunityhasnotbeenexposedtothenoisepreviously,butthepeopleareawarethatbona-fide efforts are being made to control the noise.
Communityhashadconsiderablepreviousexposuretotheintrudingnoiseandthenoisemaker’s relations with the community are good.
Communityisawarethattheoperationcausingthenoiseisverynecessaryandwillnotcontinue indefinitely. This adjustment can be applied for an operation of limited duration and underemergencycircumstances.
+5
0
−5
−10
Puretoneorimpulsivesound
Nopuretoneorimpulsivecharacter
Puretoneorimpulsivecharacterpresent
0+5
140 Noise Control Eng. J. 53 (4), 2005 Jul–Aug
incorporated in the first Air Force Land Use Planning Guide [30]. The principles of the 1953 Guide were later simplified for ease of application and recommended by the Air Force and the Federal Aviation Administration [31,32].
4.2 AdjustmentsincludedinISO 1996-1:2003
ISO 1996-1:2003 contains adjustments that are to be applied to measurements or predictions of day-night sound level outdoors at a receiver location. Table 6 describes the adjustmentsandgivestherangesofadjustmentvaluestobeconsidered. Equation (D.1) in ISO 1996-1:2003 is the original 1978 Schultz curve [8] showing the percentage of a community that
ishighlyannoyedbytransportationnoisesourcesasafunctionof the long-term day-night average sound level. AnnexDalsocontainsnotesforapplicationofEquation(D.1) as paraphrased below.• Equation (D.1) is applicable only to evaluation of long-term
environmentalsoundsusinganappropriatedescriptorsuchas the yearly day-night average sound level (YDNL). The equationshouldnotbeusedforassessmentsofcommunityresponse over short time periods such as weekends, a single season, or “busy traffic days.” Equation (D.1) is not applicable to a short-term environmental sound such as that resulting from an increase in road traffic caused by a short-duration construction project; the equation is applicableonlytoexistingsituations.
Widespreadcomplaints or singlethreat of legal action
Sporadiccomplaints
No reactionalthough noise is
generally noticeable
Fig. 6—Community reactions to intruding noise (after the U.S. EPA [1]) as a function of the measured or predicted out-door DNL of the intruding noise (non-normalized).
Widespreadcomplaints or singlethreat of legal action
Sporadiccomplaints
No reactionalthough noise is
generally noticeable
Data Normalized To:Residential urban residual noiseSome prior exposureWindows partially openNo pure tone or impulses
Fig. 7—Community reactions to intruding noise (after the U.S. EPA [1]) as a function of the measured or predicted outdoor DNL of the intruding noise with the normalizing adjustments of Table 5 included.
TABLE 6—Adjustments from ISO 1996-1:2003 [7] to be added to measured or predicted day-night sound levels depending on the type of sound source, the characterofthesound,andthetimeofday.
Adjustmenttype SpecificationAdjustment to add to day-night
soundlevel(dB)
Sourcesofsound
Road Traffic 0Aircraft +3 to +6Railway -3 to –6Industry 0
Characterofthesound
Regularimpulsive +5Highly impulsive +12
High-energy impulsive See Annex B of ISO 1996-1:2003Prominenttones +3 to +6
NOTE 2 Weekend adjustments on sound sources subject to regulation may be applied to a measured or predicted DNL to permit adequate rest and recuperation and to account for the greater numbers of people at home during the weekend.
NOTE 3 If more than one adjustment applies for a type of sound source or for the character of a given single sound source, only the largest adjustment shall be applied. However, time period adjustments always are added to the otherwise adjusted day-night sound levels.
NOTE4Adjustmentsfortheimpulsivecharacterofasoundshallbeappliedonlyforimpulsivesoundsourcesthatareaudibleatthereceiverlocation.Adjustments for tonal character shall be applied only when the total sound is known to be audibly tonal at the receiver location.
141Noise Control Eng. J. 53 (4), 2005 July–Aug
• For new situations, especially when the community is not familiar with the sound source in question, greatercommunityannoyancethanpredictedbyapplicationoftheequation can be expected; the difference may be as much as +5 dB.
• There isagreaterexpectation for, andvalueplacedon,“peace and quiet” in rural settings; this expectation may be equivalent to a DNL adjustment of as much as +10 dB. These last two factors are additive. A new, unfamiliarsound source in a quiet rural area can engender muchgreaterannoyance thanwouldbeestimatedbyrelationslike Equation (D.1) and may be equivalent to an additional adjustment of as much as +15 dB to be added to a measured orpredictedDNL.
4.3 Adjustments NOT included in ISO 1996-1:2003
Several potential adjustments for the annoyance causedby an intruding noise are not included in ISO 1996-1:2003. Two notable adjustments that were omitted are (1) what is sometimes called “public relations,” and (2) the additional annoyancecausedbyaudiblerattlesofthestructuralelementsofabuildingoritscontents.
4.3.1“Publicrelations”
The influence of “public relations” is sometimes discussed in terms of the concept of “misfeasance,” which alternatively can be thought of as “people do not believe that bona-fide efforts are being made to control the noise.” Only scant information is available to quantify the adjustment for “public relations,” but it is believed that this factor can range from a 5-dB penalty to a 5-dB bonus depending on the quality of the relations between the noisemaker and the community. The meta-analyses of Fields [33] confirm that the attitude engendered by “public relations” is an important modifier of annoyance. However, this is only one of five attitudes confirmed as important. In addition to “noise prevention beliefs,” Fields listed “fear of danger from the noise source,” “beliefs about the importance of the noise source,” “annoyance with non-noise impacts of the noise source,” and “general noise sensitivity.” Inamoredetailedstudyofattitudes,Staples,et al. [34] combined elements of Fields’ “noise prevention beliefs,” “beliefs about the importance of the noise source” and “annoyance with non-noise impacts of the noise source” into a 10-item environmental noise risk scale. Staples had 351 subjects that were living in an area where the DNL was between 55 dB to 60 dB in the vicinity of a former military airfield that had been converted to a civil airport. Thedependent variable was a 14-item “noise-disturbance” scale that combined activity-disturbance questions with annoyance questions.Usingstepwisemultipleregressionanalyses,theyfound that the environmental noise risk scale accounted for 36% of the variation in individual disturbances from noise. Particularlypowerfulwerefouritemsloadedonastatisticalfactor that they labeled: “appraisal of one’s neighborhood as inadequatelyprotectedandvulnerabletofutureincreasesinnoise.” The four items were:
• If airport noise increases, it will make my neighborhood a less desirable place to live.
• My neighborhood is exposed to more noise than other neighborhoods near the airport.
• Airport and government officials are doing all they can do control noise.
• Airport noise probably will not increase much over the next 5 to 10 years.
These four questions accounted for 43% of the variation in individualdisturbances fromnoise,more thanwhatwasaccounted for by the use of the entire noise scale when itwas used in the regression. “Noise sensitivity,” one of the attitudes confirmed by Fields, was positively correlated with generalannoyancebutwasunrelatedtoenvironmentalnoiserisk. In addition to confirming the importance of the attitudes identified by Fields, Staples, et al., confirmed the importance of expectationsandpriorexposure.Whenaddedtothestepwisemultiple-regression analyses, “noise relative to expectations” increased the fraction of the explained variance to 45%. The addition of “noise relative to prior exposure” as a third variable raised the fraction of the explained variance to 48%. Schomer [35] found almost a 5-fold increase in the percent highly annoyed for those who thought “a great deal,” “quite a bit,” or “ a fair amount” can be done to reduce noise but “not very much” or “nothing at all” is being done, when compared with the reactions of all other respondents in the study. More-recent evidence about the influence of “public relations” on annoyancecomesfromarailwaynoisesurvey inGermanyby Schreckenberg, et al. [36] that showed a relatively high correlationbetweenrailwaynoiseannoyanceandmisfeasanceorthebeliefthattheauthoritieswerenotdoingwhattheycouldtoreducethenoise. In a Swiss noise study in 2000, Wirth, et al. [37] found a standardized linear-regression coefficient of –0.1 between annoyance and “trust the noise maker.” Insummary,thereislittlequestionthatcommunityattitudescanbeswayedbypublicrelationsandthattheseattitudescanhavepositiveornegativeeffectsontheannoyancebyasound.The 1974 EPA recommendation [1] for a “public-relations” factor was 5 dB. This adjustment can be a –5-dB ‘bonus’ if thereareverygoodrelations.Conversely,ifthereisastrongfeelingofmisfeasanceanddistrust,thenthetrueadjustmentmay be a +5-dB ‘penalty’.
4.3.2Rattles
The second adjustment factor not included in ISO 1996-1:2003 is the presence of observable (heard but not necessarily felt) rattles induced by a noise. Blazier [38] was one of the first to comment on noise-induced rattles in building elements. He was concerned about rattles induced by the low-frequency soundandvibrationgeneratedwithinheatingandventilatingsystems in an office setting. He noted that there was a “high probability that noise-induced vibration levels in light-weight wall and ceiling constructions will be clearly noticeable.” ANSI S12.2-1995 [39] incorporated this suggestion in the Room Criterion (RC) procedure of Blazier and the Balanced Noise Criterion (NCB) procedure of Beranek as methods to evaluatenoiseinrooms.Inessence,theevaluationprocedures
142 Noise Control Eng. J. 53 (4), 2005 Jul–Aug
recommendtheinclusionofacousticaldesignfeaturessoastolimit the sound pressure levels in a room to less than 75 dB in the octave bands with nominal midband frequencies of 16 Hz and 31.5 Hz. Schomer has specifically studied the equivalent increase in annoyance when there is audible sound from noise-induced vibration. The subjects need only hear the rattle sounds; there isnotactileperceptionofvibration.InonestudybySchomerand Averbuch [40], simulated blast sounds were presented to subjectsbothwithandwithoutnoticeablerattlesounds.Theblast-sound-induced rattle noise was virtually unmeasurable comparedwith theblastsoundyet it increasedthe levelofequivalent annoyance by 6 dB at low blast sound levels and by 13 dB at the highest blast sound levels used in that study. In another study by Schomer and Neathammer [41] using realhelicopterstogeneratethetestsounds,themereadditionofnoticeablerattlesoundsincreasedtheequivalentlevelofsubjective annoyance judgments by 10 dB to 20 dB. Again, therattlesoundswerevirtuallyunmeasurablecomparedwiththe sound of the helicopter. Subsequent studies showinganincreaseinannoyancewhensoundwasaccompaniedbyvibration include the following: Sato [42], Zeichart, et al. [43], Paulsen and Kastka [44], Öhrstrom and Skånberg [45], Öhrstrom [46], and Lercher, et al. [47]. At this time, an adjustment of +10 dB is recommended whenanintrudingnoiseproduces,orisexpectedtoproduce,noticeablerattlesounds,althoughtheevidencesuggeststhatthemagnitudeofthisadjustmentmaybevariableandmaybe larger than +10 dB at times. It should be noted that rattle sounds occur because the low-frequency sounds that vibrate building elements may be manifested as the much-higher-frequency sounds of the rattle of windows or bric-a-brac.
5 CONCLUSIONS1. Nearly all Agencies and Boards of the U.S. Federal
Government, standards settingbodies, and internationalorganizations that have cognizance over noise-producing sources use day-night average sound level (DNL) as the preferred noise descriptor and aDNLcriterion level of55 dB as the threshold for adverse noise impact in urban residential areas. Of the large number of Agencies, Boards, standardssettingbodies,andinternationalorganizations,only the U.S. Department of Defense, the U.S. Federal AviationAdministration, and the U.S. Department ofHousing and Urban Development recommend a DNL criterion level that is greater than 55 dB.
2. The policies of FAA, DoD, and HUD all were developed in the early 1970s or earlier. On the other hand, mostof the concerned U.S. Federal Agencies and Boards, standard setting bodies, and international organizationsestablished their noise policies after 1995. In particular, the recommendations of the World Health Organization were based on over 25 years of additional worldwide research into noise effects than were the earlier policies of the FAA andDoD.
3. Significant evidence exists to suggest that the noise of aircraft is more annoying than the noise of road traffic and
railroads for the same DNL. ISO 1996-1:2003 recommends that an adjustment ranging from +3 dB to +6 dB be applied to the measured or predicted DNL of aircraft noise toassess a community’s annoyance response. Selection of an appropriateadjustmentintherangeofallowedadjustmentsistobemadebyappropriatelocalauthorities.
4. Examination of the totality of applicable, English-language attitudinal surveydata suggest aDNLcriterion level inthe 50 dB to 55 dB range to ensure a minimum acceptable annoyanceresponseinaresidentialcommunity.
5. Agencies and Boards of the U.S. Federal Government that arechargedwiththemissionofpromotingtheactivitiesof a particular noise producer may not be as free ofbias as more-neutral bodies such as the U.S. National Research Council or the World Health Organization. The World Health Organization terms a DNL of 55 dB as engenderingseriousannoyanceandcreatinganunhealthyenvironment; a DNL of 50 dB is considered as engendering moderateannoyance.TheNationalResearchCouncilwentfurther,and,inmanyinstances,recommendedacousticalengineering assessments when the estimated DNL of aproject exceeds 40 dB.
6. No single DNL criterion level is equally applicable to all residential situations and all types of residentialcommunities. For this reason, ISO 1996-1:2003 includes recommendations for adjustment factors that shouldbe applied in a noise analysis. Additional adjustmentsshould be included when an intruding sound produces,or is expected to produce, noticeable noise-induced rattle sounds.
7. Community relations (good or bad) are believed to be equivalent to a –5-dB ‘bonus’ or a +5-dB ‘penalty’ in assessments of community response. Although goodcommunity relations should be observed, it is notrecommended that any “public relations” adjustment be addedtoameasuredorestimatedDNLtoaccountfortheeffectofpublicrelations.
6 ReCOmmeNDATIONS
1. The recommended adjustment factors of ISO 1996-1:2003 should be applied in analyses of environmental noise.In addition, adjustments should be included when theintruding sound is known, or predicted, to cause noticeable noise-induced rattle sounds inside a residence.
2. An adjustment of +5 dB should be added to measured or predicted day-night average sound levels caused by aircraftnoiseinthevicinityofairportswhenrelatingtheDNLtotheexpectedannoyanceresponseofresidentsinthesurroundingcommunity.
3. After addition of the adjustment factors from ISO 1996-1:2003 and the +5 dB aircraft-noise adjustment, as applicable, the DNL criterion level for assessing theminimum acceptable degree of annoyance to intrudingsounds in noise-sensitive areas such as residential housing should be 55 dB, or less.
143Noise Control Eng. J. 53 (4), 2005 July–Aug
7 RefeReNCeS[1] “Information on Levels of Environmental Noise Requisite to Protect
Public Health and Welfare with an Adequate Margin of Safety,” U.S. Environmental Protection Agency, Office of Noise Abatement and Control (ONAC), EPA Report 550/9-74-004, Washington, DC (March 1974).
[2] “Pollution Prevention and Control: Environmental Criteria for Sustainable Transport, Report on Phase 1 of the Project onEnvironmentally Sustainable Transport (EST), 1996,” Organization for Economic Co-Operation and Development, Report OCDE/GD(96)136, Paris, France (September 1996). (http://www.oecd.org)
[3] “Guidelines for Community Noise,” Edited by Birgitta Berglund, Thomas Lindvall, and Dietrich Schwela, World Heath Organization, Geneva, Switzerland (April 1999). (http://www.who.int/docstore/peh/noise/Comnoise-1.pdf)
[4] “A Global Approach to Noise Control Policy; Part 3: Community Noise,” Noise Control Eng. J. 52(6), 268-289 (2004 November-December).
[5] American National Standard Quantities and procedures for description and measurement of environmental sound—Part 4: Noise assessment and prediction of long-term community response,AmericanNationalStandards Institute ANSI S12.9-1996/Part 4 (Acoustical Society of America, Melville, New York, 1996).
[6] “Guidelines for Preparing Environmental Impact Statements on Noise,” Report of Working Group 69, National Research Council, Assembly of Behavioral and Social Sciences, Committee on Hearing, Bioacoustics and Biomechanics (CHABA), Washington, DC (1977).
[7] Acoustics—Description, measurement and assessment of environmental sound—Part 1: Basic Quantities and assessment procedures,International Standard ISO 1996-1:2003 (International Organization for Standardization, Geneva, Switzerland, 2003)
[8] Theodore J. Schultz, “Synthesis of social surveys on noise annoyance,” J.Acoust.Soc.Am.64(2), 377-405 (1978).
[9] Lawrence S. Finegold, C. Stanley Harris, and Henning E. von Gierke, “Community annoyance and sleep disturbance: Updated criteria for assessing the impacts of general transportation noise on people,” Noise ControlEng.J.42(1), 25-30 (1994).
[10] Henk M.E. Miedema and Henk Vos, “Exposure-response relationships for transportation noise,” J. Acoust. Soc. Am. 104(6), 3432-3445 (1998).
[11] “Guidelines for Considering Noise in Land Use Planning and Control,” Federal Interagency Committee on Urban Noise (FICUN), U.S. Government Printing Office Report 1981-337-066/8071, Washington, DC (June 1980).
[12] “Federal Agency Review of Selected Airport Noise Analysis Issues,” 1992 Federal Interagency Committee on Noise (FICON), Washington, D.C. (August 1992).
[13] “Aviation Noise Abatement Policy 2000,” Proposed policy document and Request for Comments, Department of Transportation, Federal Aviation Administration, Docket No.: 30109, Federal Register 65(136), 43802-43824 (14 July 2000). (http://www.faa.gov/programs/en/impact/fr_anap.pdf)
[14] “Air Installations Compatible Use Zones,” Department of Defense Instruction 4165-57 (November 1977). (http://www.dtic.mil/whs/directives/corres/pdf/i416557_110877/i416557p.pdf)
[15] “Noise Assessment Guidelines,” U.S. Department of Housing and Urban Development, BBN Report No. 2176; HUD Accession No. 2932 (Issued August 1971; revised June 1983). (http://www.huduser.org/search/Bibliography.asp?id=2932)
[16] “Noise Guidebook: A Reference Document for Implementing the Department of Housing and Urban Development’s Noise Policy,” Report HUD 953-DPC; HUD Accession Number 4114, U.S. Department of Housing and Urban Development, Washington, DC (March 1985). (http://www.huduser.org/search/Bibliography.asp?id=4114)
[17] “Guidance Manual for Transit Noise and Vibration Impact Assessment,” Report DOT-T-95-16, U.S. Department of Transportation, Federal Transit Administration, Washington, DC, (April 1995). (www.fta.dot.gov/transit_data_info/reports_publications/publications/environment)
[18] “High-Speed Ground Transportation Noise and Vibration Impact Assessment,” FRA Report No. 293630-1, U.S. Department of Transportation, Federal Railroad Administration, Office of Railroad Development, Washington, DC, (December 1998). (http://www.fra.dot.gov/downloads/RRDev/nvman1_75.pdf)
[19] “Proposed Conrail Acquisition,” Draft Environmental Impact Statement, STB Finance Docket No. 33388, “CSX Corporation and CSX Transportation, Inc., Norfolk Southern Corporation, and Norfolk Southern Railway Company—Control and Operating Leases/Agreements—Conrail Inc. and Consolidated Rail Corporation,” Surface Transportation Board, Section of Environmental Analysis, Washington, DC (January 1998). (www.stb.dot.gov/decisions)
[20] “Highway Traffic Noise Analysis and Abatement Policy and Guidance,” U.S. Department of Transportation, Federal Highway Administration, Office of Environment and Planning, Noise and Air Quality Branch, Washington, DC, (June 1995). (http://www.fhwa.dot.gov/environment/polguid.pdf)
[21] “Report to Congress: Feasibility of a United States Department of Transportation Multi-Modal Noise Model,” Office of the Assistant Secretary for Transportation Policy, Office of the Secretary, U.S. Department of Transportation, Washington, DC, (January 2000).
[22] “Revision of Existing Regulations Under Part 157 and Related Sections of the Commission’s Regulations Under the Natural Gas Act,” 18 CFR Part 157.206(d)(5); Docket No. RM98-9-001; Order No. 603-A; FERC Citation 88FERC61,297 (Federal Energy Regulatory Commission, Washington, D.C., USA, Issued 29 September 1999). (www.ferc.gov/docs-filing/elibrary.asp)
[23] Letter re: “Supplemental draft EIS for Boston Logan Airport” from Ms. Mindy Lubber, Regional Administrator, EPA to Mr. Vincent Scarano, Director of Aviation, Federal Aviation Administration (06 November 2000).
[24] American National Standard Quantities and procedures for description and measurement of environmental sound—Part 5: Sound level descriptors for determination of compatible land use,AmericanNational Standards Institute ANSI S12.9-1998/Part 5 (Acoustical Society of America, Melville, New York, 1998).
[25] “1981 Guidelines for Design of Rapid Transit Facilities,” Section 2-7, “Noise and Vibration,” APTA Rail Transit Committee, American Public Transit (Transportation) Association, Washington, DC, USA (June 1981). (http://apta100.apta.com)
[26] “Pollution Prevention and Abatement Handbook 1998: Toward cleaner production; Part 3: Project Guidelines, General Environmental Guidelines,” p. 439, The World Bank Group, Washington, DC, USA (1998).
[27] Sanford Fidell and Laura Silvati, “Parsimonious alternatives to regressionanalysisforcharacterizingprevalenceratesofaircraftnoiseannoyance,” Noise Control Eng. J., 52(2), 56-68 (2004).
[28] P.D. Schomer, “Loudness-level weighting for environmental noise assessment,” Acta Acustica united with Acustica, 86(1), 49-61 (2000).
[29] Paul D. Schomer, “The importance of proper integration of and emphasis on the low-frequency sound energies for environmental noise assessment,” Noise Control Eng. J. 52(1), 26-39 (2004).
[30] Walter A. Rosenblith and Kenneth N. Stevens, “Handbook of Acoustic Noise Control; Volume II—Noise and Man,” Wright Air Development Center, Wright-Patterson Air Force Base, Ohio (June 1953).
[31] “Impact of Noise on People,” Report FAA-EQ-78-12, U.S. Department of Transportation, Federal Aviation Administration, Office of Environmental Quality, Washington, DC (May 1977).
[32] “Aviation Noise Effects,” Report FAA-EE-86-2, U.S. Department of Transportation, Federal Aviation Administration, Office of Environmental and Energy,Available from the NationalTechnicalInformation Service, Washington, DC (March 1985).
[33] James M. Fields, “Effect of personal and situational variables on noise annoyance in residential areas,” J. Acoust. Soc. Am. 93(5), 2753-2763 (1993).
[34] Susan L. Staples, Randolph R. Cornelius, and Margaret S. Gibbs, (1999), “Noise disturbance from a developing airport: Perceived risk or general annoyance?” Environment and Behavior, 31(5), 692-710 (1999).
144 Noise Control Eng. J. 53 (4), 2005 Jul–Aug
[35] P. Schomer, “Community Reaction to Impulse Noise: Initial Army Survey,” Technical Report. N-100, U.S. Army Construction Engineering Research Laboratory, Champaign, Illinois (1981).
[36] Dirk Schreckenberg, Rudolf Schuemer, and Ulrich Moehler, “Railway-noise annoyance and ‘misfeasance’ under conditions of change,” Proc. INTER‑NOISE 01, The Hague, The Netherlands, Paper in01_344.pdf, pp. 1759-1762 on CD-ROM (International Institute of Noise Control Engineering, Purdue University, West Lafayette, Indiana, USA,2001).
[37] Katja Wirth, Mark Brink, and Christoph Schierz, “Swiss Noise Study 2000: Aircraft noise annoyance in the neighborhood of the airport Zurich-Kloten,” Proc. INTER‑NOISE 03, Seogwipo, Jeju Island,Korea, Paper N-535, pp. 4425-4432 (International Institute of Noise Control Engineering, Purdue University,West Lafayette, Indiana,USA, 2003).
[38] Warren E. Blazier, Jr., “Revised noise criteria for application in the acoustical design and rating of HVAC systems,” Noise Control Eng. J.16(2), 64-73 (1981 March-April).
[39] American National Standard Criteria for evaluating room noise,American National Standards Institute ANSI S12.2-1995 (Acoustical Society of America, Melville, New York, 1995).
[40] Paul D. Schomer and Aaron Averbuch, “Indoor human response to blast sounds that generate rattles,” J. Acoust. Soc. Am. 86(2), 665-673 (1989).
[41] Paul D. Schomer and Robert D. Neathammer, “The role of helicopter noise-induced vibration and rattle in human response,” J. Acoust. Soc. Am.81(4), 966-976 (1987).
[42] Tetsumi Sato, “Path analyses of the effect of vibration on road traffic and railway noise annoyance,” Proc INTER‑NOISE 94, Yokohama, Japan, pp. 923-928 on CD-ROM (International Institute of Noise Control Engineering, Purdue University,West Lafayette, Indiana,USA, 1994).
[43] K. Zeichart, A. Sinz, A. Schuemer-Kohrs, and R. Schuemer, “Erschütterungen durch Eisenbahnverkehr und ihre Wirkungen auf Anwohner. Teil 1: Zum Zusammenwirken von Erschütterungs- und Geräuschbelastungen, Z. Lärmbekämpfung 41, 43-51 (1994).
[44] R. Paulsen and J. Kastka, “Effects of combined noise and vibration on annoyance,” J. Sound Vib. 181(2), 295-314 (1995).
[45] E. Öhrstrom and A.-B. Skånberg, “A field survey on effects of exposure to noise and vibration from railway traffic, Part 1: Annoyance and activity disturbance effects,” J. Sound Vib., 193(1), 39-47 (1996).
[46] E. Öhrstrom, “Effects of exposure to railway noise—A comparison between areas with and without vibration,” J. Sound Vib., 205(4), 555-560 (1997).
[47] Peter Lercher, Gernot Brauchle, and Ulrich Widmann, “The interaction of landscape and soundscape in the Alpine area of the Tyrol: An annoyance perspective,” Proc. INTER‑NOISE 99, Fort Lauderdale, Florida, USA, Paper 268, pp. 1347-1350 on CD-ROM (International Institute of Noise Control Engineering, Purdue University,WestLafayette, Indiana, USA, 1999).