2021 Oregon Annual Ambient Criteria Pollutant Air Monitoring Network Plan Air Quality 7202 NW Evergreen Pkwy #150, Hillsboro, OR 97124 Phone: 503-693-5708 800-452-4011 Fax: 503-693-4999 Contact: Anthony Barnack www.oregon.gov/DEQ DEQ is a leader in restoring, maintaining and enhancing the quality of Oregon’s air, land and water.
Transcript
2021 Oregon Annual Ambient Criteria Pollutant Air Monitoring Network Plan
Air Quality 7202 N W Evergreen Pkwy #150, Hillsboro, OR 97124 Phone: 503-693-5708
800-452-4011 Fax: 503-693-4999 Contact: Anthony Barnack www.oregon.gov/DEQ
DEQ is a leader in restoring, maintaining and enhancing the quality of Oregon’s air, land and water.
Documents can be provided upon request in an alternate format for individuals with disabilities or in a
language other than English for people with limited English skills. To request a document in another
format or language, call DEQ in Portland at 503-229-5696, or toll-free in Oregon at 1-800-452-4011,
2.1 National Monitoring Strategy ....................................................................................... 2 2.1.1 State and Local Support ............................................................................................ 2 2.1.2 AQ Maintenance and Non-attainment support ........................................................... 2 2.2 Non-attainment and Maintenance Areas ..................................................................... 3
2.2.1 Formerly non-attainment areas awaiting maintenance plans: .................................... 3
2.2.2 Maintenance Areas in Oregon: .................................................................................. 3
3. Overview of Network Operations ........................................................... 4
3.1 Air Monitoring Network Design .................................................................................... 4
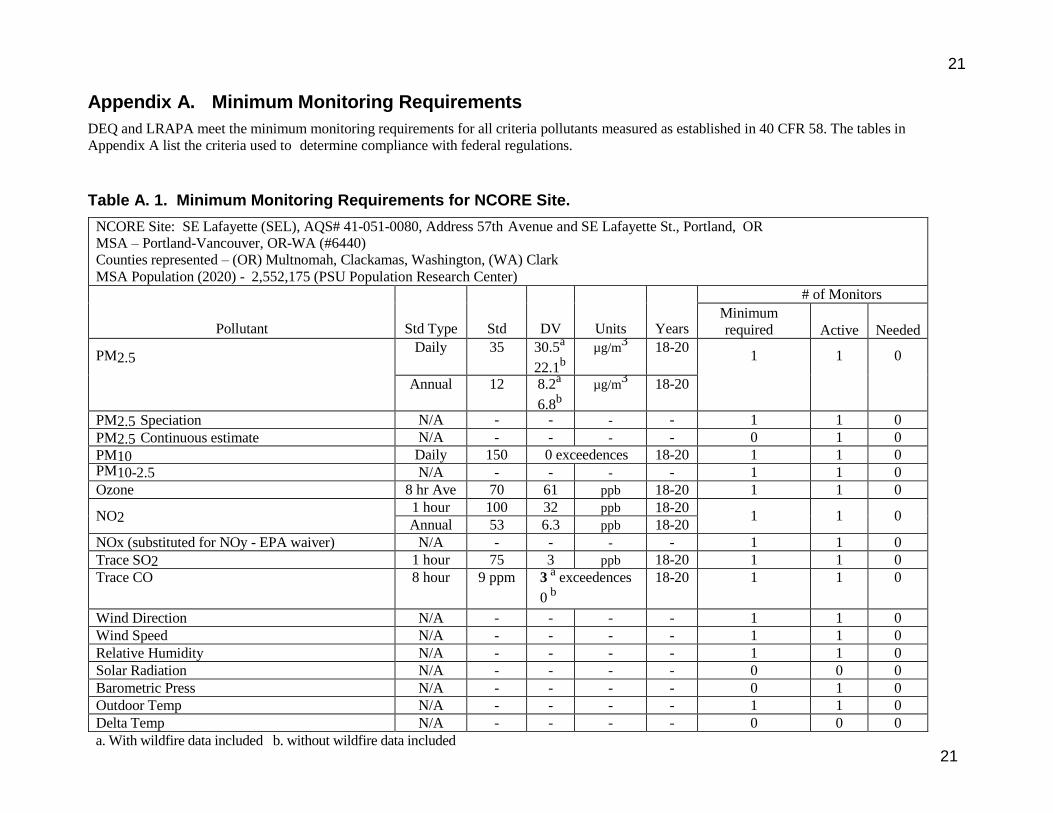
Appendix A. Minimum Monitoring Requirements ...................................... 21
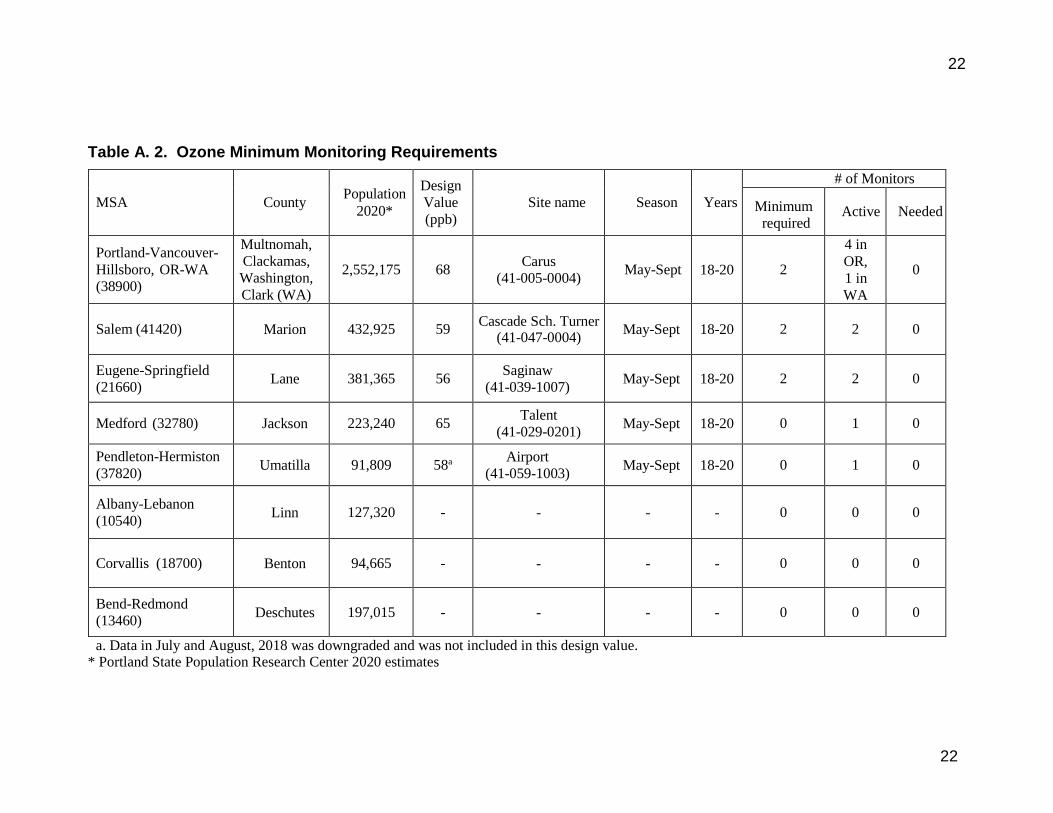
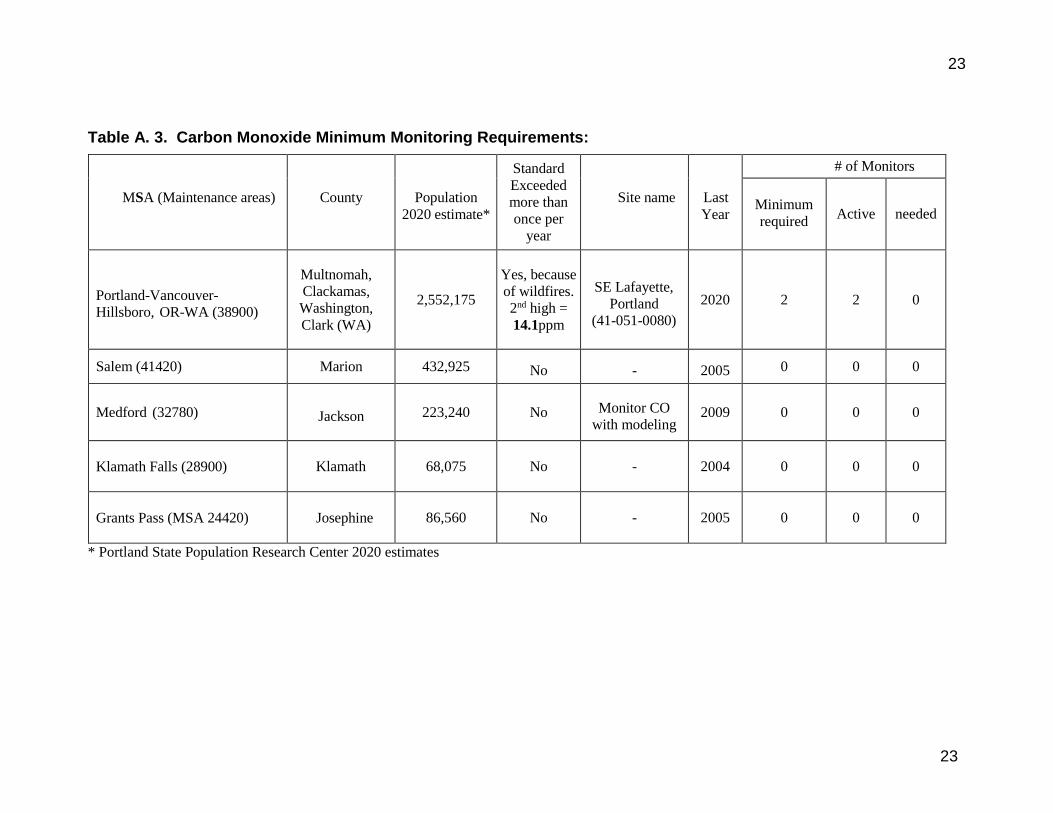
Table A. 1. Minimum Monitoring Requirements for NCORE Site. .................................. 21 Table A. 2. Ozone Minimum Monitoring Requirements .................................................. 22 Table A. 3. Carbon Monoxide Minimum Monitoring Requirements: ............................... 23
Table A. 4. NO2, NO, NOx Minimum Monitoring Requirements: .................................... 24 Table A. 5. SO2 Minimum Monitoring Requirements: .................................................... 25
ii
Table A. 6. Lead Minimum Monitoring Requirements:.................................................... 26 Table A. 7. PM10 Minimum Monitoring Requirements: .................................................. 27
Table A. 8. PM2.5 (FRM) Minimum Monitoring Requirements: ...................................... 28 PM2.5 for AQI (Non-FRM) site information ..................................................................... 29 Table A. 9. PM2.5 for AQI (Non-FRM) site information .................................................. 29
Appendix B. Collocation Requirements ..................................................... 29
Table B 1. Collocation Requirements for PM2.5 ............................................................. 29 Table B 2. Collocation Requirements for PM10 ............................................................. 29 Table B 3. Collocation Requirements for PM10 lead ...................................................... 29
Appendix C. Detailed Site Information ....................................................... 30
Table C 1. Portland, SE Lafayette Site Information ........................................................ 30
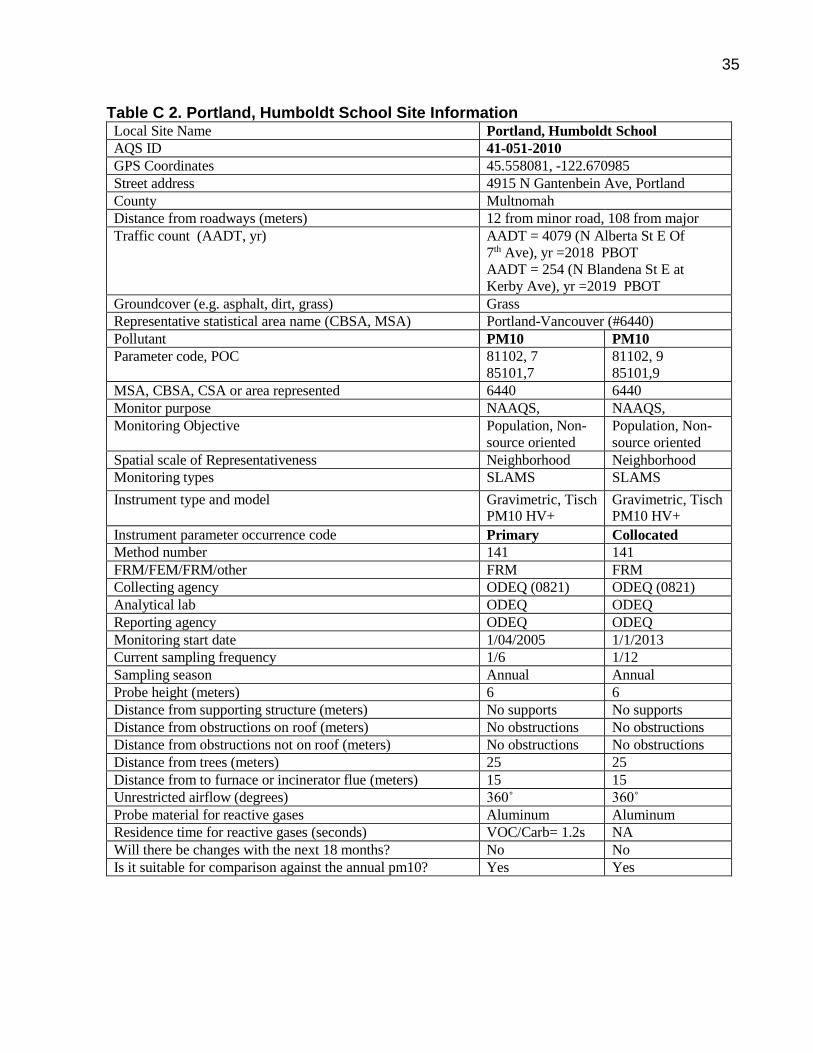
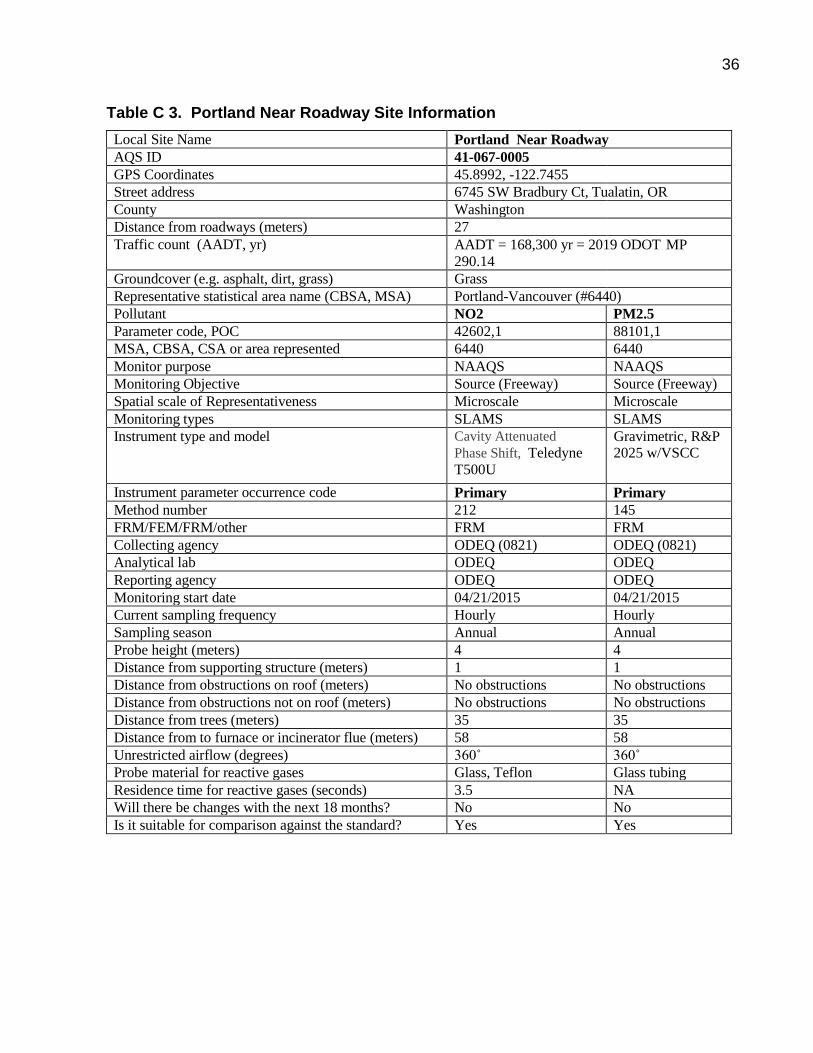
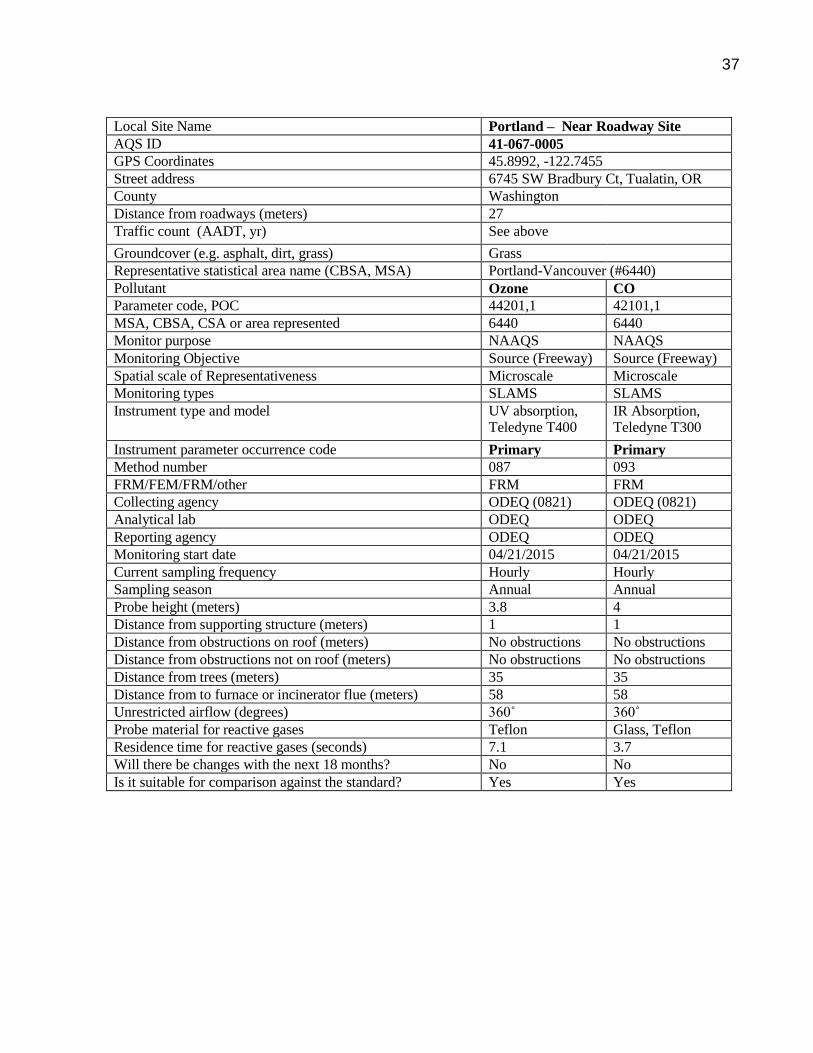
Table C 2. Portland, Humboldt School Site Information .................................................. 35 Table C 3. Portland Near Roadway Site Information ...................................................... 36 Table C 4. Hillsboro, Hare Field Site Information ........................................................... 38
Table C 5. Portland, Sauvie Island Site Information ....................................................... 39 Table C 6. Portland - Carus – Spangler Rd. Site Information ......................................... 40
Table C 7. Salem – State Hospital Information .............................................................. 41 Table C 8. Salem/Turner - Cascade Jr. High Site Information ....................................... 42 Table C 9. Eugene – Amazon Park Site Information ........ Error! Bookmark not defined. Table C 10. Eugene – Saginaw Site Information ............................................................. 45 Table C 11. Eugene – Hwy 99 Site Information ............................................................. 46
Table C 12. Cottage Grove, City Shops Site Information ............................................... 47 Table C 13. Oakridge, Willamette Center Site Information ............................................. 48
Table C 14. Grants Pass, Parkside School Site Information ........................................... 49 Table C 15. Medford, Welch and Jackson Information .................................................... 50
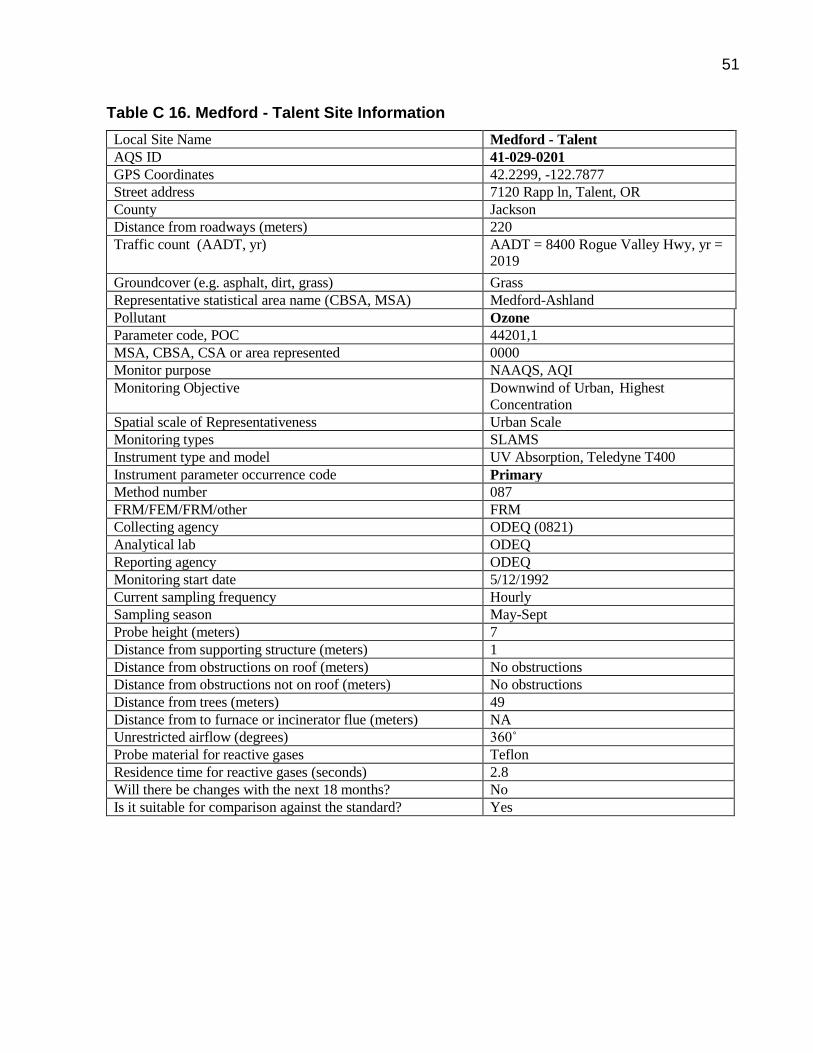
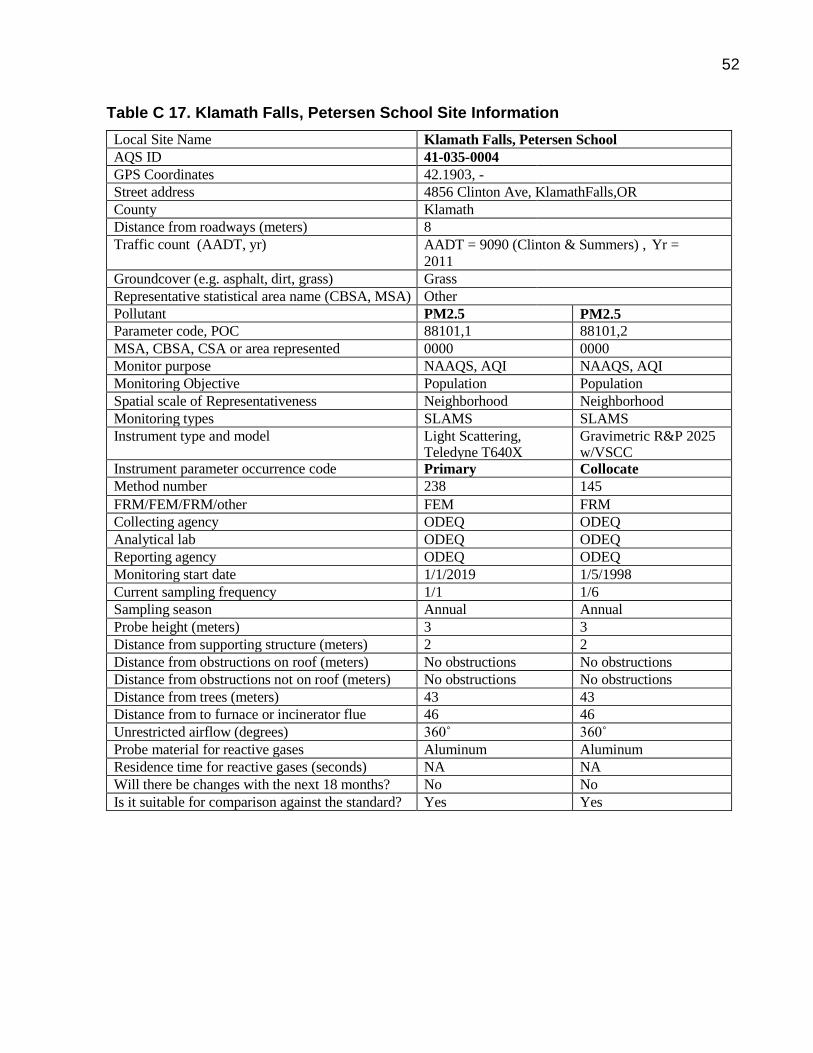
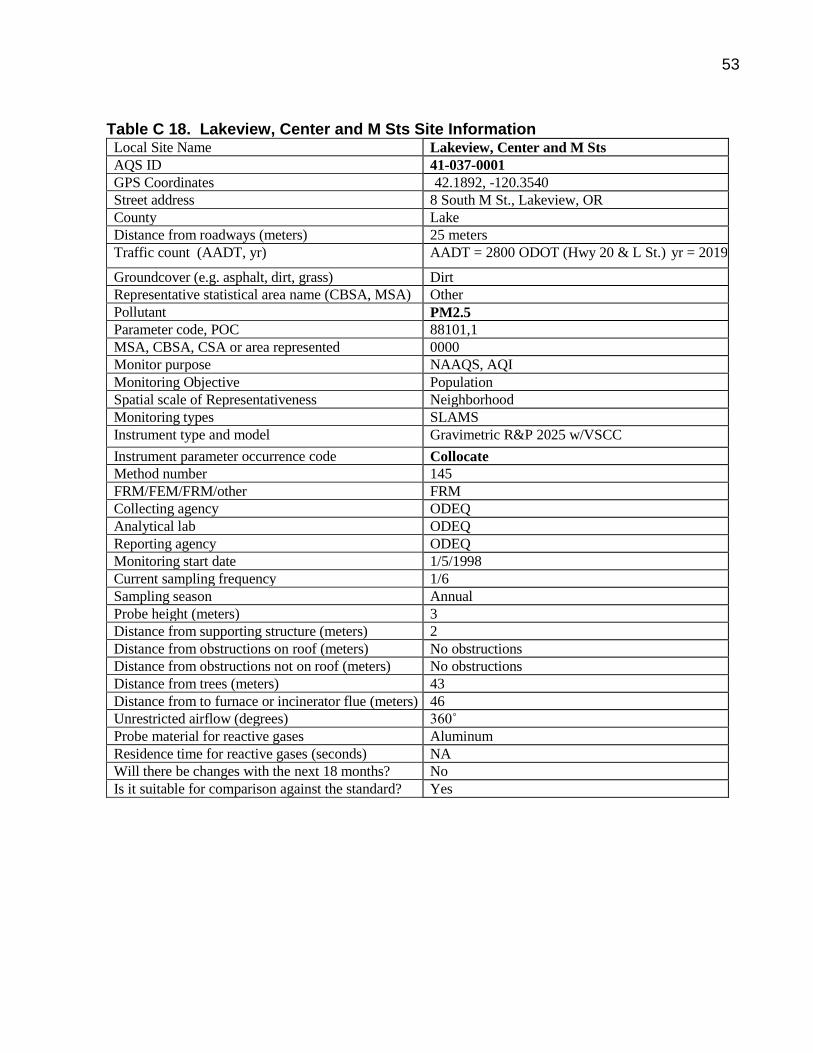
Table C 16. Medford - Talent Site Information ................................................................ 51 Table C 17. Klamath Falls, Petersen School Site Information ......................................... 52 Table C 18. Lakeview, Center and M Sts Site Information ............................................. 53
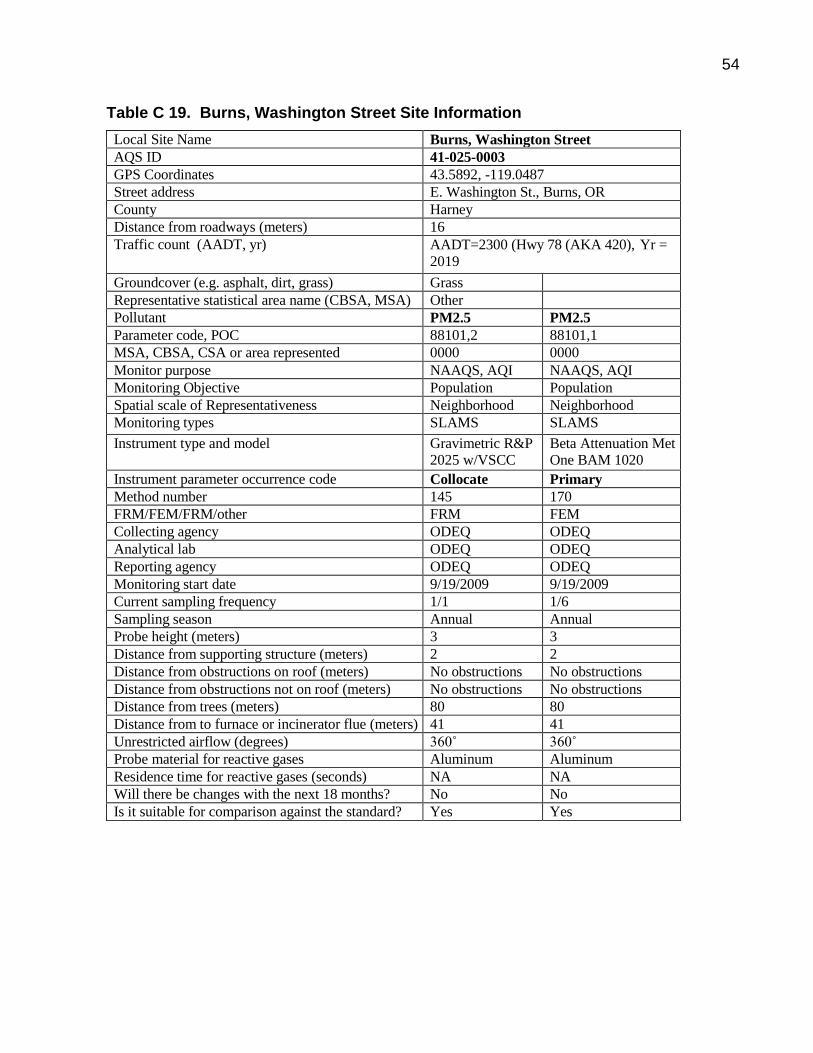
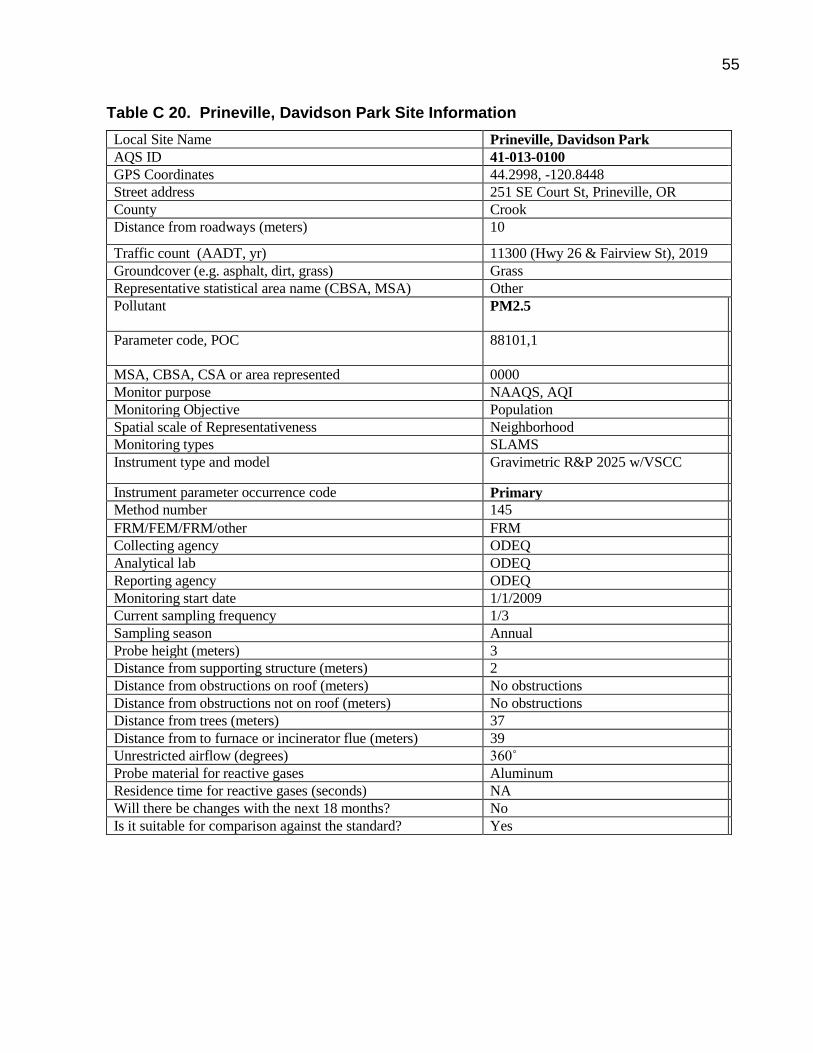
Table C 19. Burns, Washington Street Site Information ................................................. 54 Table C 20. Prineville, Davidson Park Site Information .................................................. 55
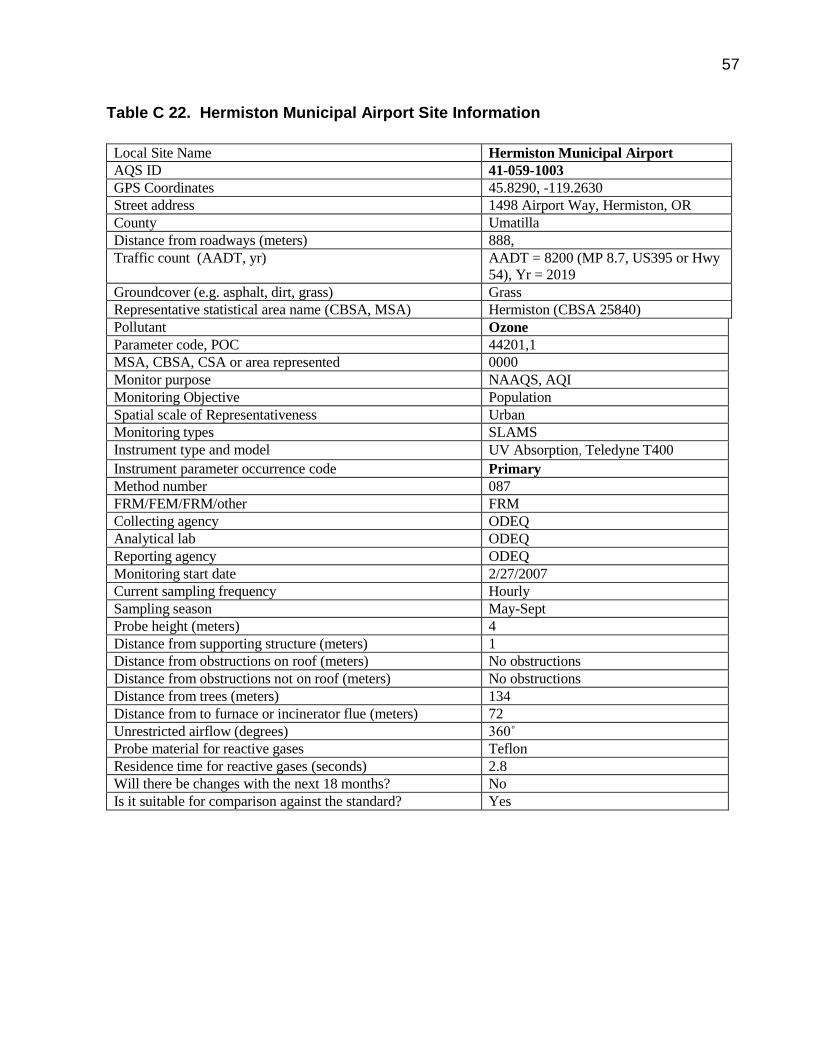
Table C 21. La Grande, Hall and North Site Information ................................................ 56 Table C 22. Hermiston Municipal Airport Site Information .............................................. 57
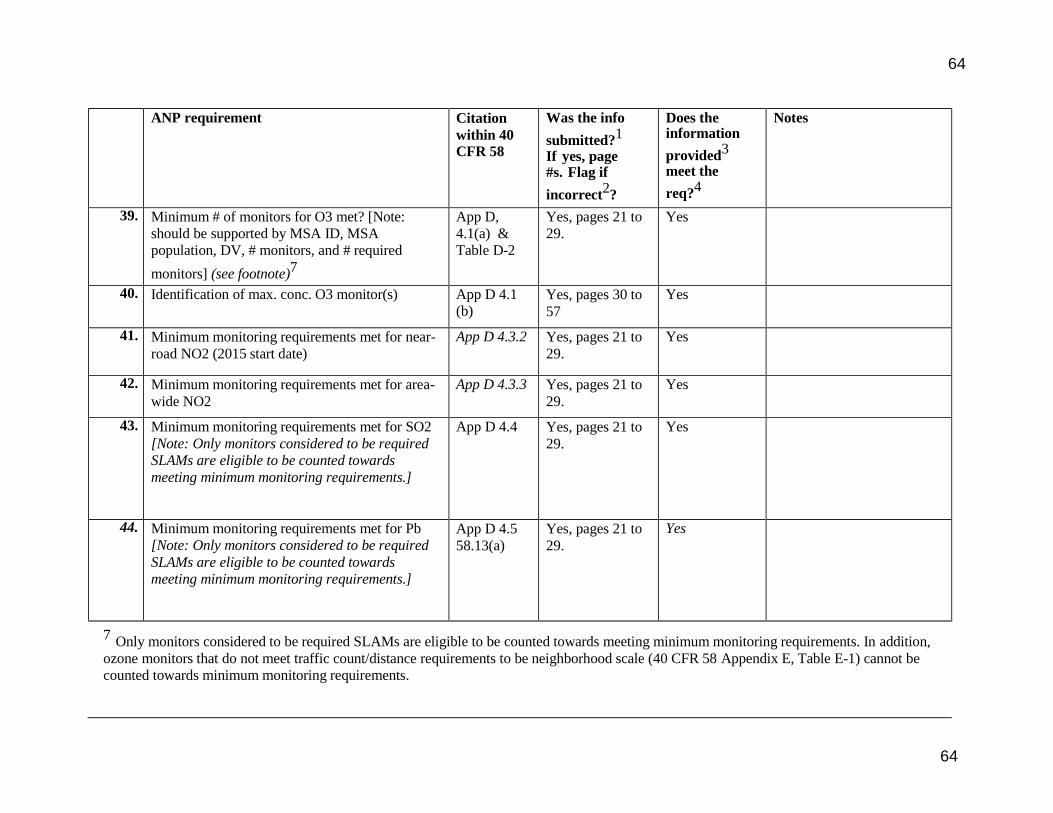
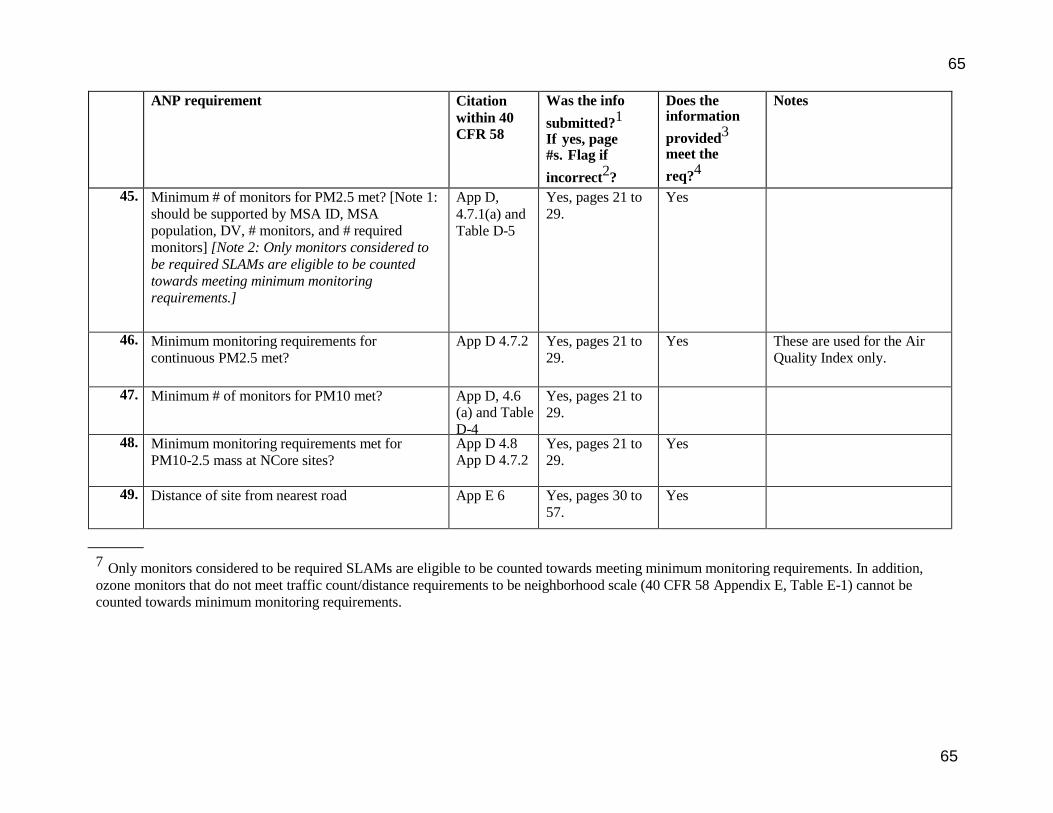
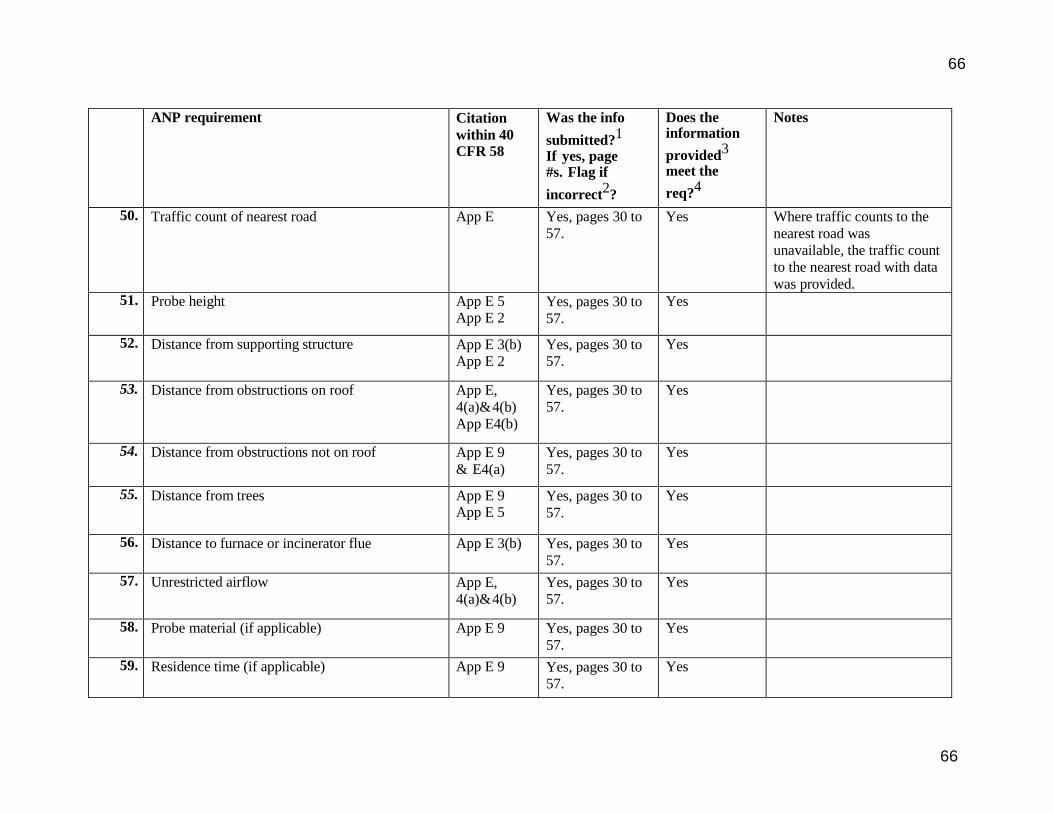
Appendix D. Site Evaluation Checklist ....................................................... 58
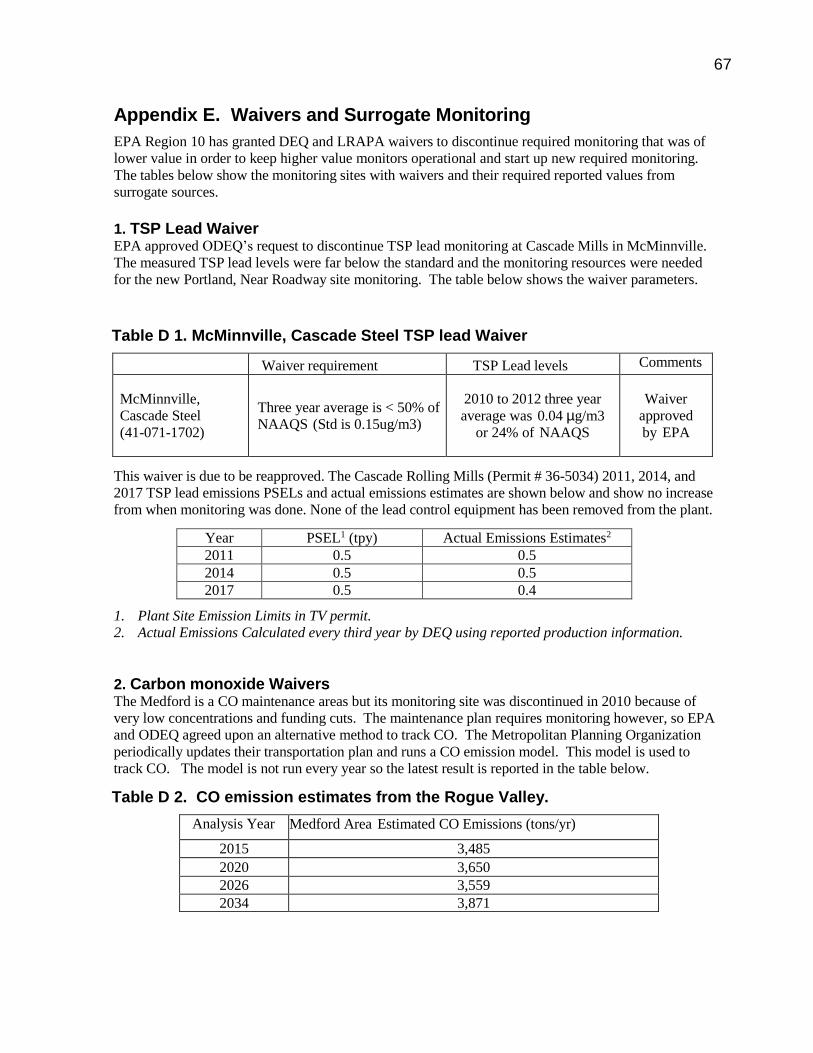
Appendix E. Waivers ................................................................................. 67
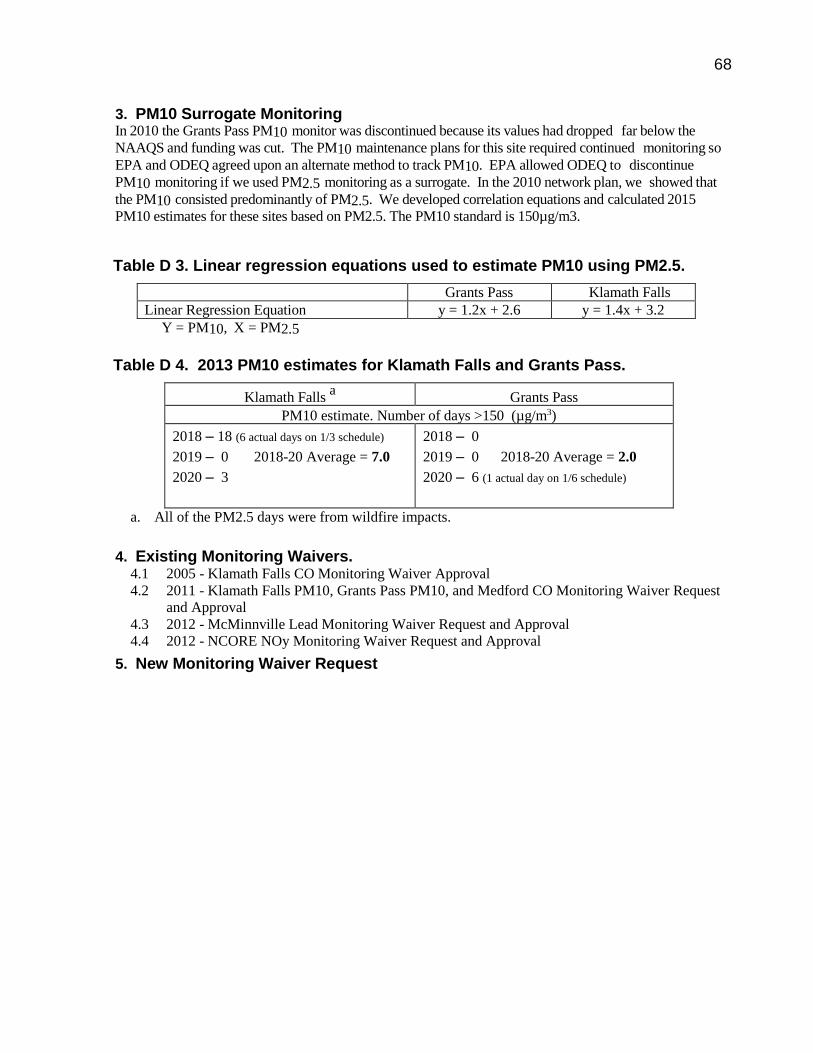
Table D 1. McMinnville, Cascade Steel TSP lead Waiver ............................................... 67 Table D 2. CO emission estimates from the Rogue Valley. ............................................ 67 Table D 3. Linear regression equations used to estimate PM10 using PM2.5. ............... 68 Table D 4. 2013 PM10 estimates for Klamath Falls and Grants Pass. ........................... 68
Appendix F. Interstate Memos of Understanding ....................................... 84
Appendix G. Review of Violating monitor changes..................................... 87
iii
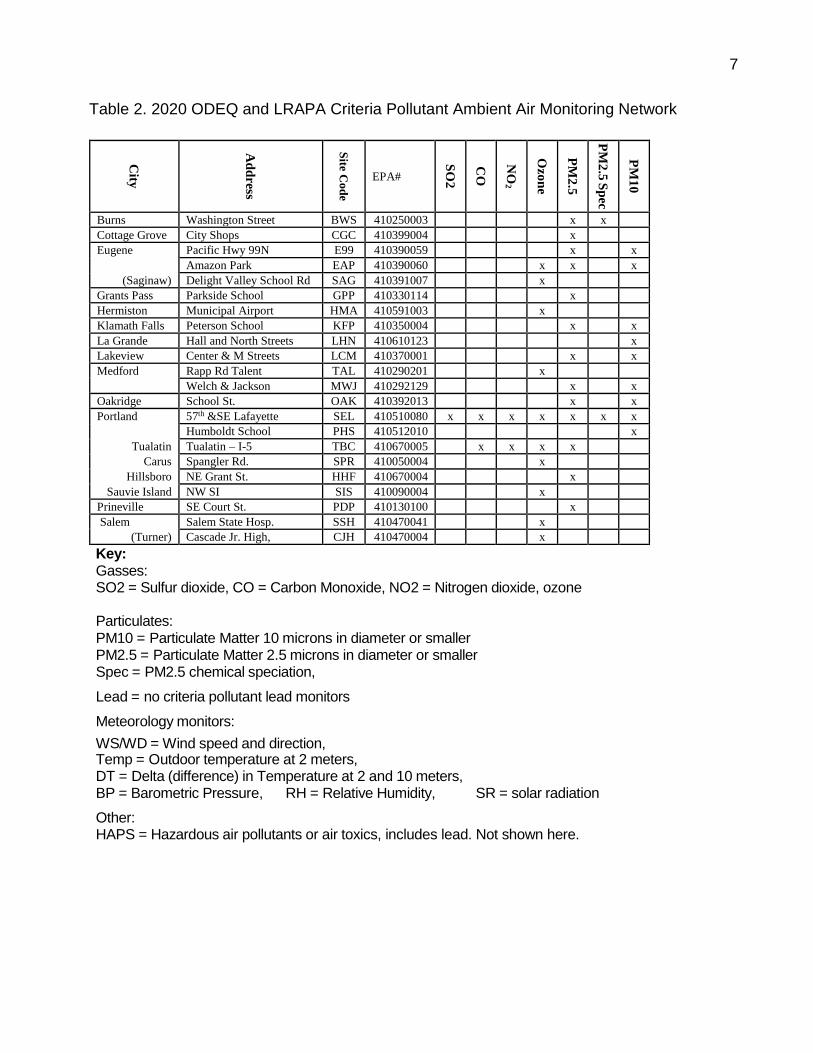
Table of Tables Table 1. Relationship Between Site Type and Scale of Representativeness ........................... 5 Table 2. 2020 ODEQ and LRAPA Criteria Pollutant Ambient Air Monitoring Network ............. 7 Table 3. AQI site list ............................................................................................................... 16 Table 4. Meteorology Network ............................................................................................... 19
Table A. 1. Minimum Monitoring Requirements for NCORE Site. ......................................... 21 Table A. 2. Ozone Minimum Monitoring Requirements ........................................................ 22 Table A. 3. Carbon Monoxide Minimum Monitoring Requirements: ...................................... 23 Table A. 4. NO2, NO, NOx Minimum Monitoring Requirements: .......................................... 24
Table A. 5. SO2 Minimum Monitoring Requirements: ........................................................... 25 Table A. 6. Lead Minimum Monitoring Requirements: .......................................................... 26
Table A. 7. PM10 Minimum Monitoring Requirements: ......................................................... 27 Table A. 8. PM2.5 (FRM) Minimum Monitoring Requirements:............................................. 28 Table A. 9. PM2.5 for AQI (Non-FRM) site information ......................................................... 29 Table B 1. Collocation Requirements for PM2.5 .................................................................... 29
Table B 2. Collocation Requirements for PM10 .................................................................... 29 Table B 3. Collocation Requirements for PM10 lead ............................................................ 29 Table C 1. Portland, SE Lafayette Site Information .............................................................. 30 Table C 2. Portland, Humboldt School Site Information ......................................................... 35 Table C 3. Portland Near Roadway Site Information ............................................................ 36
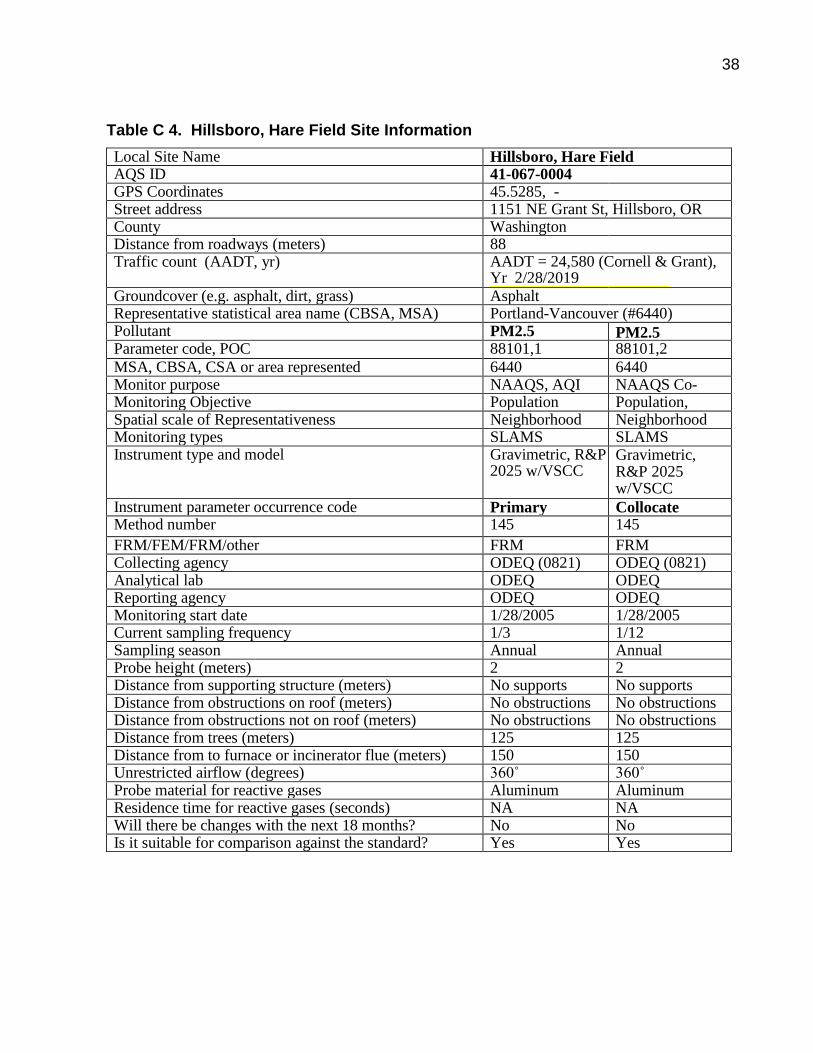
Table C 4. Hillsboro, Hare Field Site Information .................................................................. 38 Table C 5. Portland, Sauvie Island Site Information ............................................................. 39
Table C 6. Portland - Carus – Spangler Rd. Site Information ............................................... 40
Table C 7. Salem – State Hospital Information ..................................................................... 41
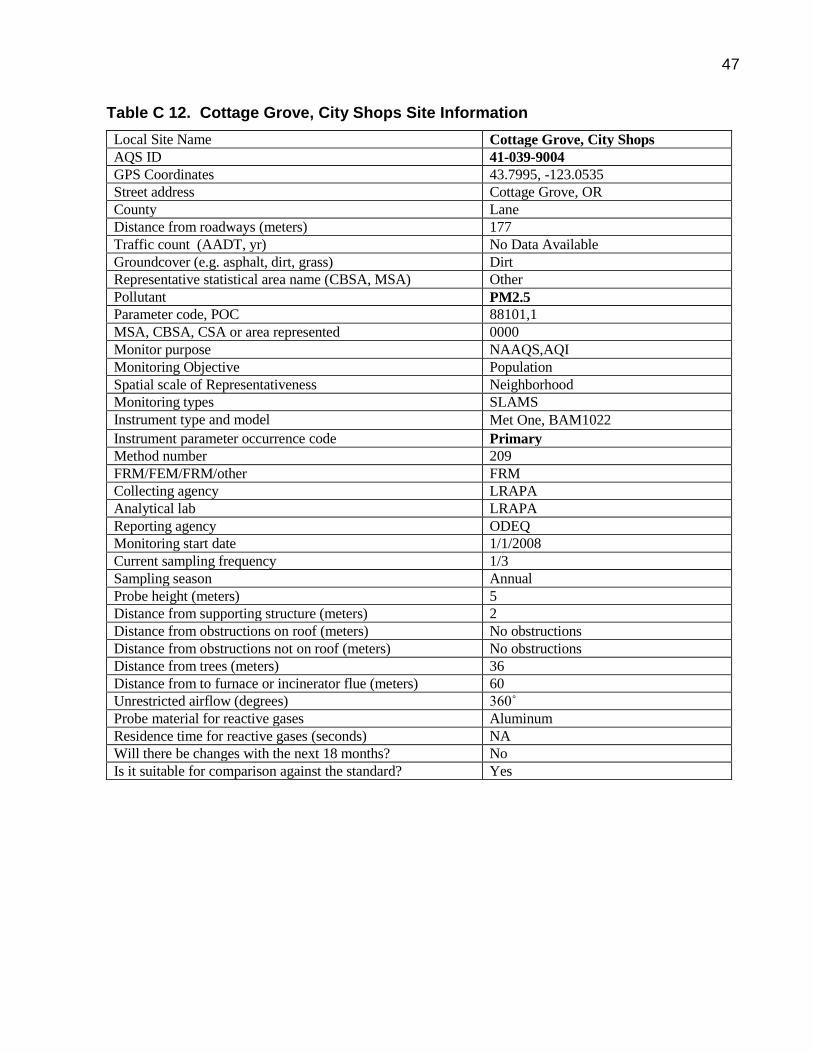
Table C 8. Salem/Turner - Cascade Jr. High Site Information .............................................. 42 Table C 9. Eugene – Amazon Park Site Information .............. Error! Bookmark not defined. Table C 10. Eugene – Saginaw Site Information ................................................................... 45 Table C 11. Eugene – Hwy 99 Site Information .................................................................... 46 Table C 12. Cottage Grove, City Shops Site Information ...................................................... 47
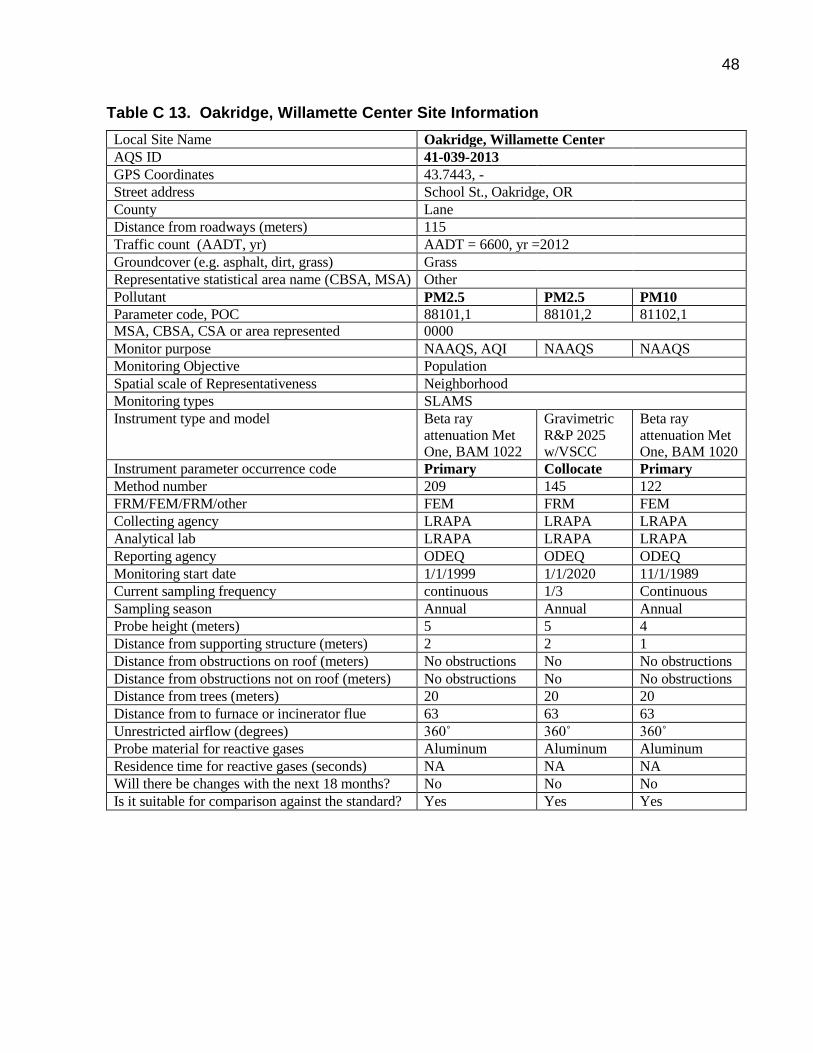
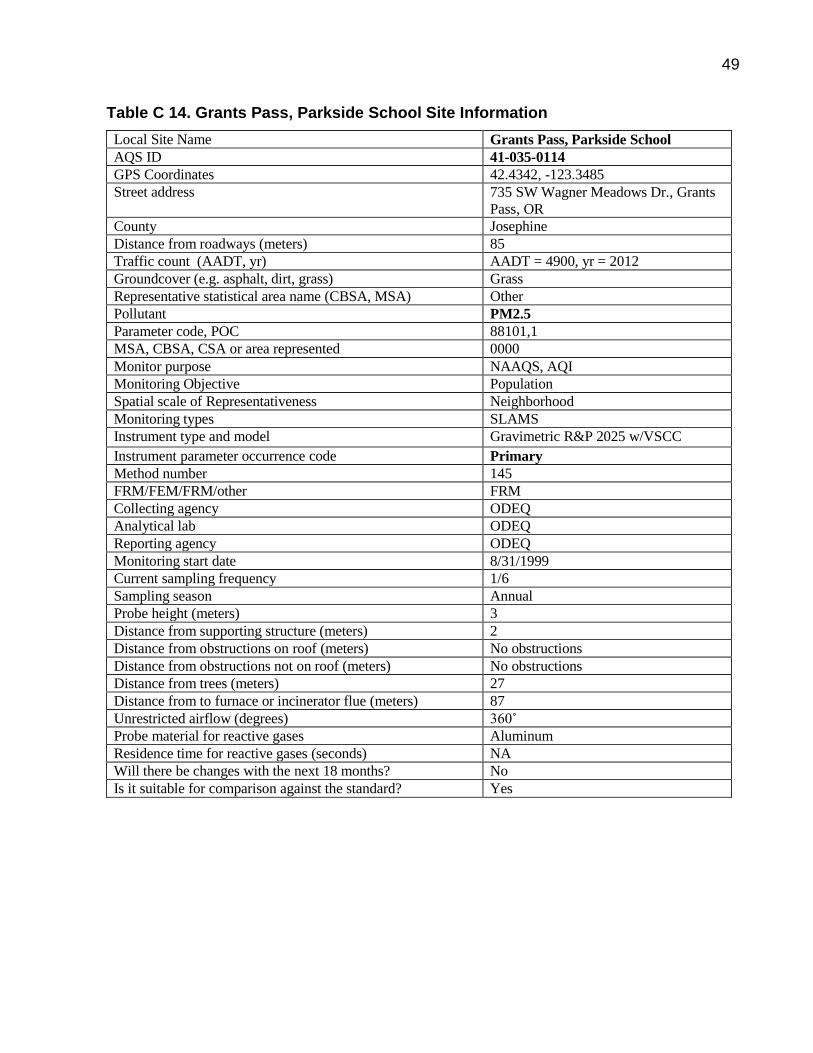
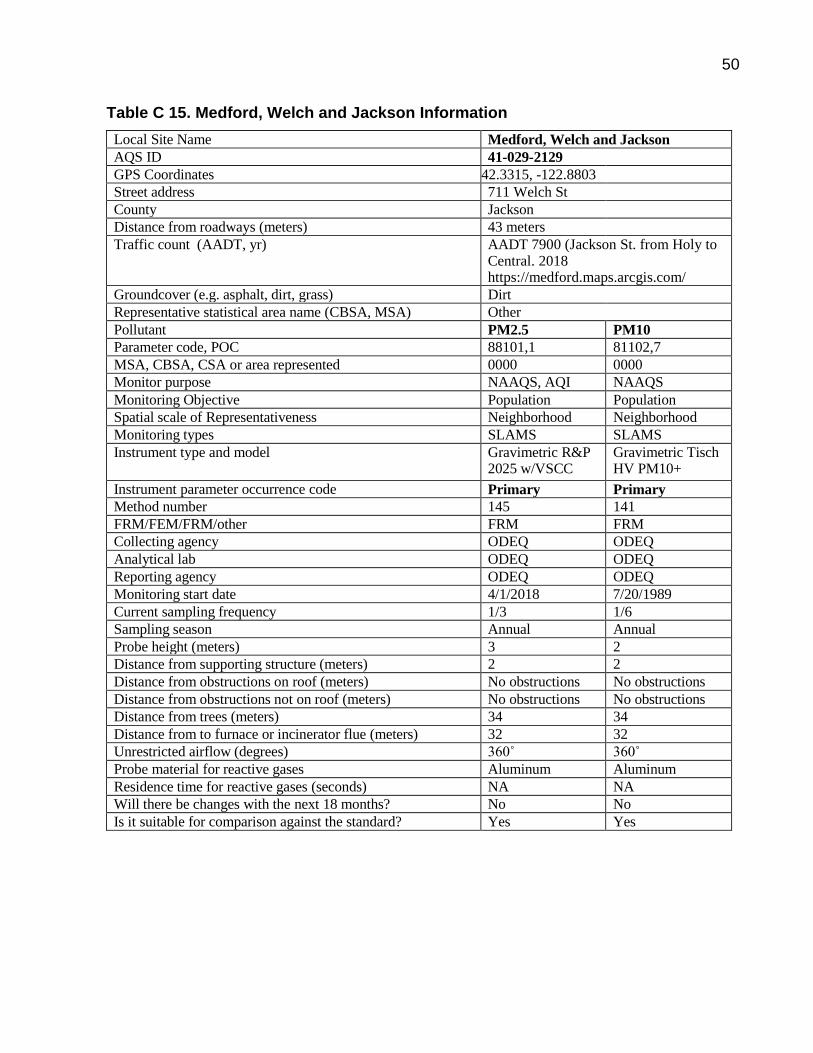
Table C 13. Oakridge, Willamette Center Site Information ................................................... 48 Table C 14. Grants Pass, Parkside School Site Information .................................................. 49 Table C 15. Medford, Welch and Jackson Information .......................................................... 50 Table C 16. Medford - Talent Site Information ....................................................................... 51
Table C 17. Klamath Falls, Petersen School Site Information ............................................... 52 Table C 18. Lakeview, Center and M Sts Site Information ................................................... 53
Table C 19. Burns, Washington Street Site Information ....................................................... 54 Table C 20. Prineville, Davidson Park Site Information ........................................................ 55 Table C 21. La Grande, Hall and North Site Information ...................................................... 56 Table C 22. Hermiston Municipal Airport Site Information .................................................... 57 Table D 1. McMinnville, Cascade Steel TSP lead Waiver ..................................................... 67 Table D 2. CO emission estimates from the Rogue Valley. .................................................. 67 Table D 3. Linear regression equations used to estimate PM10 using PM2.5. ...................... 68 Table D 4. 2013 PM10 estimates for Klamath Falls and Grants Pass. ................................. 68
iv
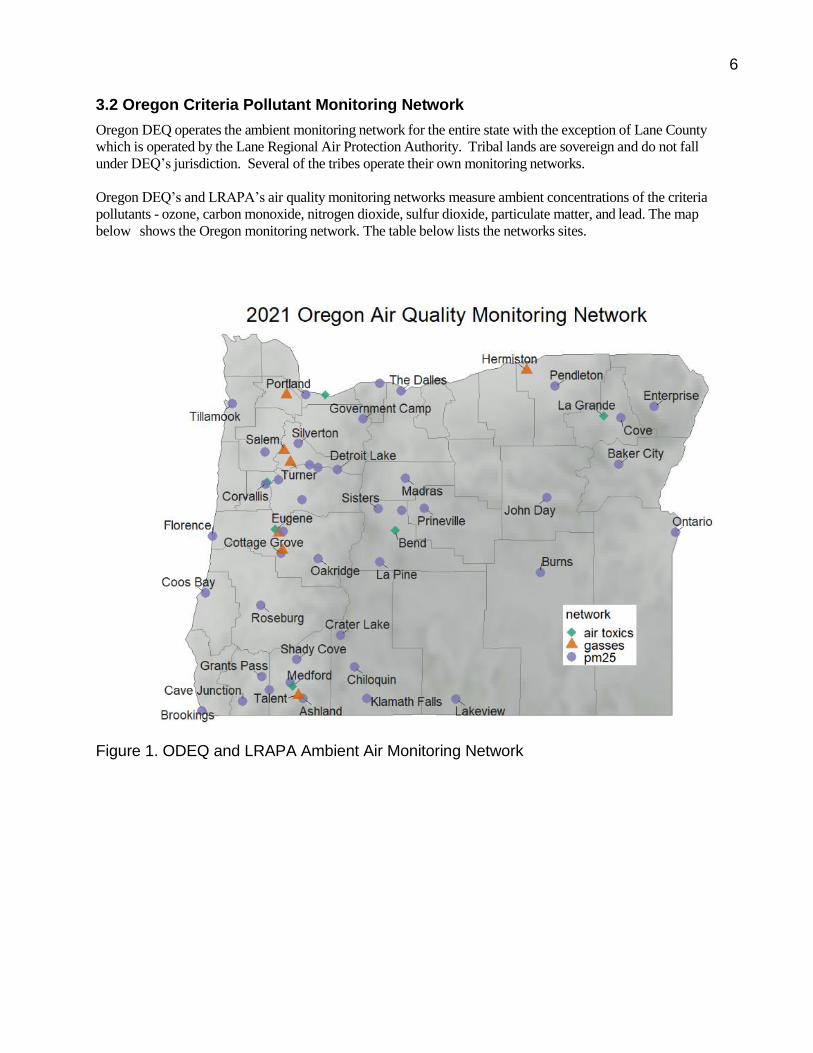
Table of Figures Figure 1. ODEQ and LRAPA Ambient Air Monitoring Network ................................................. 6 Figure 2. Ozone Monitoring Network ........................................................................................ 8
1. Introduction The Oregon Department of Environmental Quality’s (ODEQ) ambient air quality monitoring network is
designed in response to the Environmental Protection Agency’s (EPA) National Monitoring Strategy, state
and local needs, the requirements of air quality maintenance plans and the State Implementation Plans
(SIPs) for non-attainment areas, and Code of Federal Regulations (CFR) requirements.
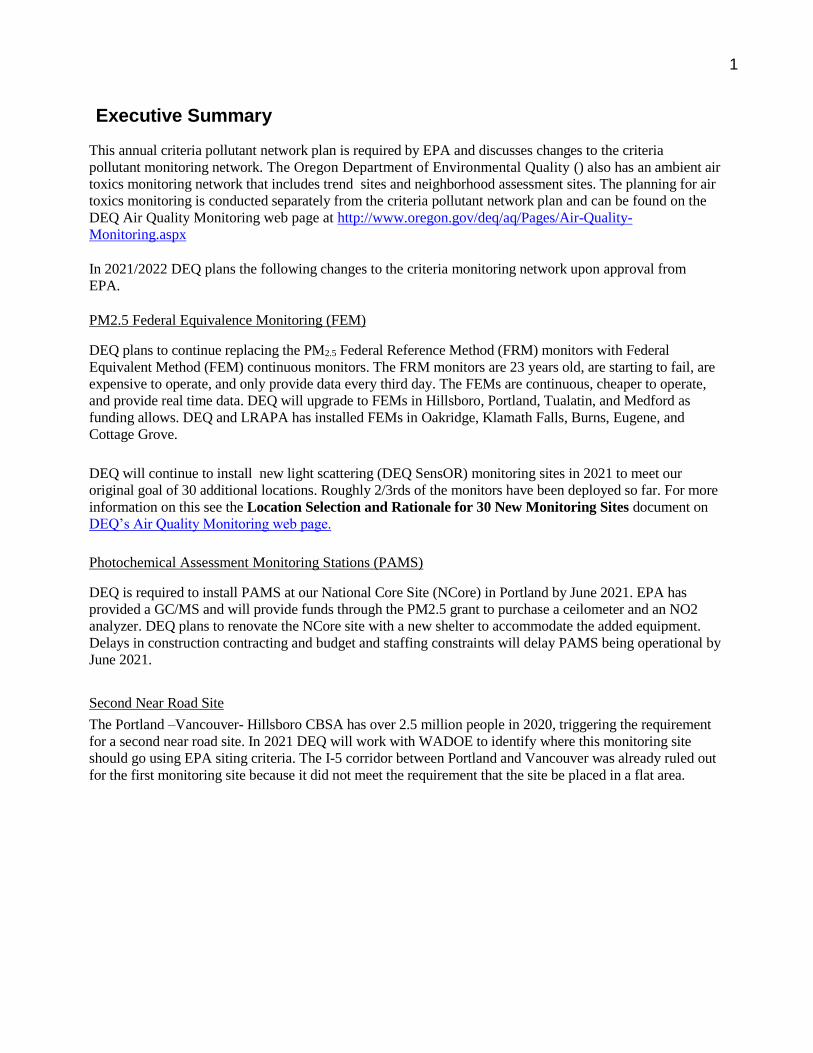
40 CFR 58.10 requires the state and local air quality surveillance agencies to write an annual ambient air quality monitoring network plan. EPA requires the plan to be put out for public comment and submitted to EPA by July 1st. This report is used to determine if the network meets the monitoring objectives defined in Part 58, Appendix D and to propose modifications to the network in the following year. A more detailed air quality data summary is available annually at http://www.deq.state.or.us/aq/forms/annrpt.htm
2. Monitoring background
2.1 National Monitoring Strategy
The National Monitoring Strategy directs state and local agencies to operate more continuous monitors and to collect real time air quality data. The real time information is available through EPA’s AIRNow and ODEQ’s Air Quality Index (AQI) web pages. In particular, EPA encouraged states to use continuous
PM2.5 monitors instead of the filter base samplers which do not provide real time information. The
National Monitoring Strategy also created National Core (NCORE) sites which contain a wide array of pollutant monitoring. ODEQ’s NCORE site has monitors for Carbon monoxide (CO), Nitrogen oxides
(NOx), Sulfur dioxide (SO2), ozone (O3), particulate matter 2.5 and 10 micrometers in diameter and
smaller (PM2.5 and PM10), PM coarse (PM10-PM2.5=PMc), PM2.5 Speciation, visibility, and
meteorology. The NCORE site is at SE Lafayette Street, Portland.
2.1.1 State and Local Support Our monitors support state and local needs by providing data for the Air Quality Index, local wood stove
management programs, Clean Air Quality Advisories, the Department of Agriculture’s field burning
program, and the US Forest Service and BLM’s forest health program. ODEQ also operates a visibility
network in the Cascades to support Regional Haze requirements protecting pristine Class 1 areas.
2.1.2 AQ Maintenance and Non-attainment support
ODEQ monitoring supports the SIPs and maintenance plans developed for many cities. ODEQ also has
monitors in attainment areas with fast growing populations to support pollution prevention measures.
Particulates: PM10 = Particulate Matter 10 microns in diameter or smaller PM2.5 = Particulate Matter 2.5 microns in diameter or smaller Spec = PM2.5 chemical speciation,
Lead = no criteria pollutant lead monitors
Meteorology monitors:
WS/WD = Wind speed and direction, Temp = Outdoor temperature at 2 meters, DT = Delta (difference) in Temperature at 2 and 10 meters, BP = Barometric Pressure, RH = Relative Humidity, SR = solar radiation
Other: HAPS = Hazardous air pollutants or air toxics, includes lead. Not shown here.
8
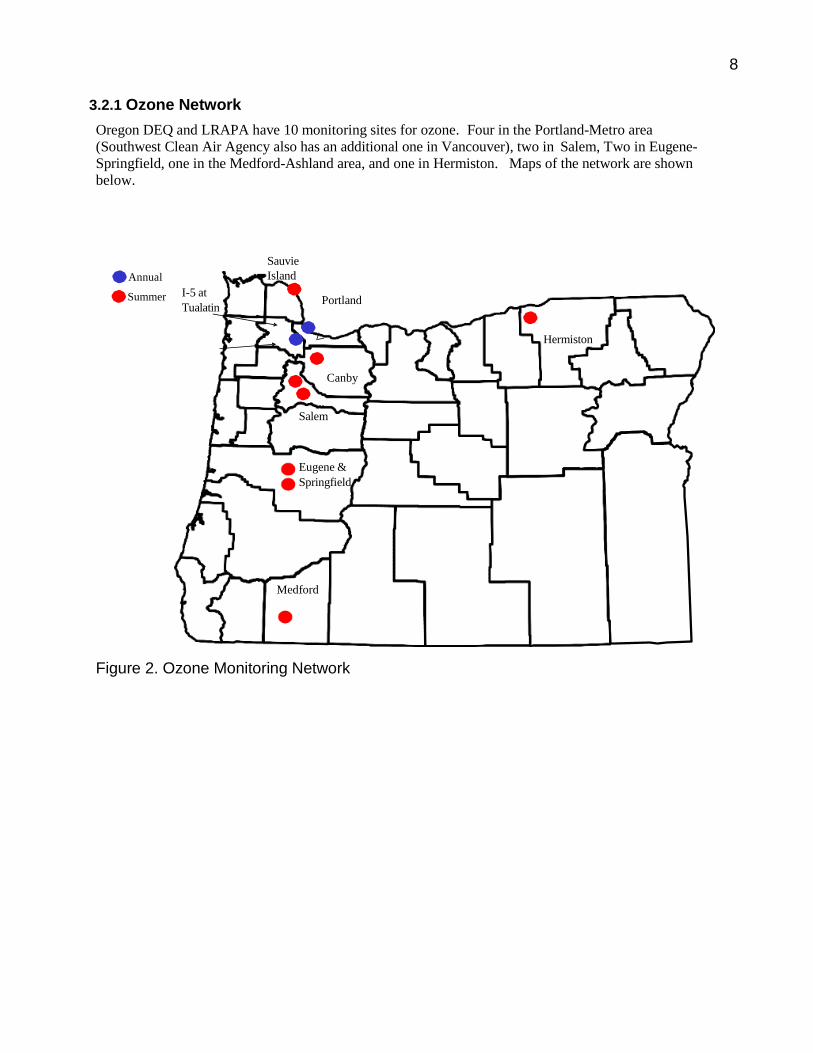
3.2.1 Ozone Network
Oregon DEQ and LRAPA have 10 monitoring sites for ozone. Four in the Portland-Metro area
(Southwest Clean Air Agency also has an additional one in Vancouver), two in Salem, Two in Eugene-
Springfield, one in the Medford-Ashland area, and one in Hermiston. Maps of the network are shown
below.
Annual
Summer
I-5 at
Tualatin
Sauvie
Island
Portland
Hermiston
Canby
Salem
Eugene &
Springfield
Medford
Figure 2. Ozone Monitoring Network
9
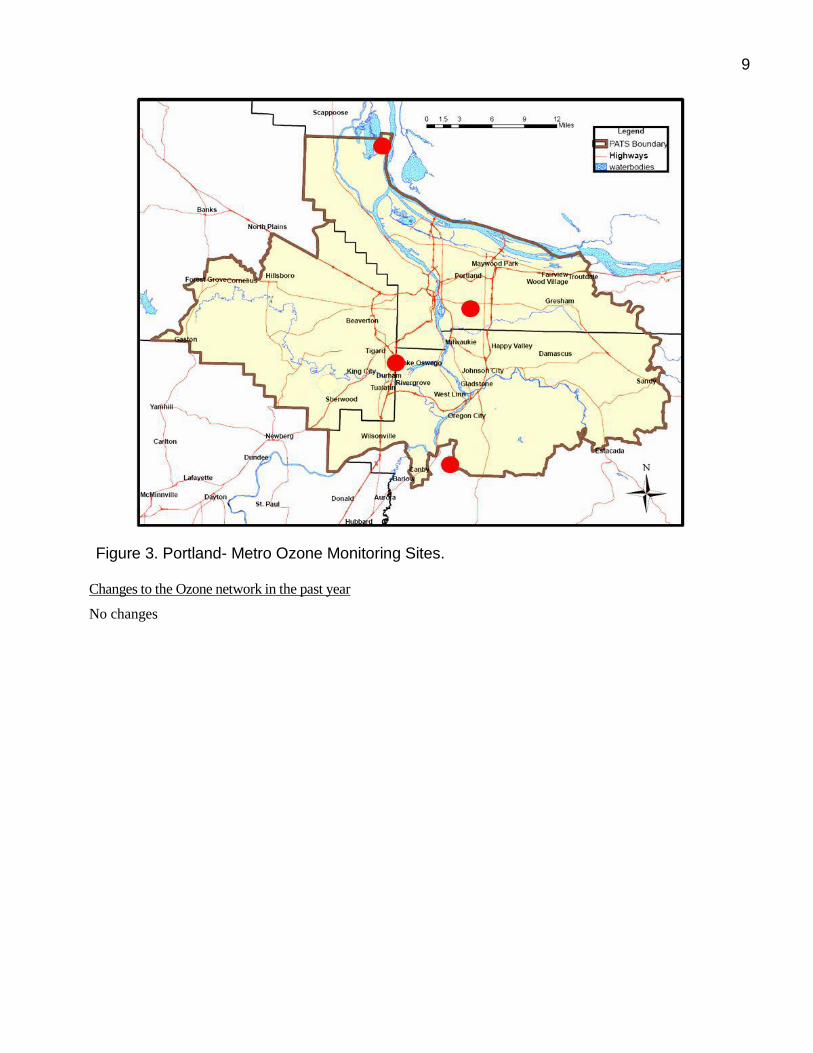
Figure 3. Portland- Metro Ozone Monitoring Sites. Changes to the Ozone network in the past year
No changes
10
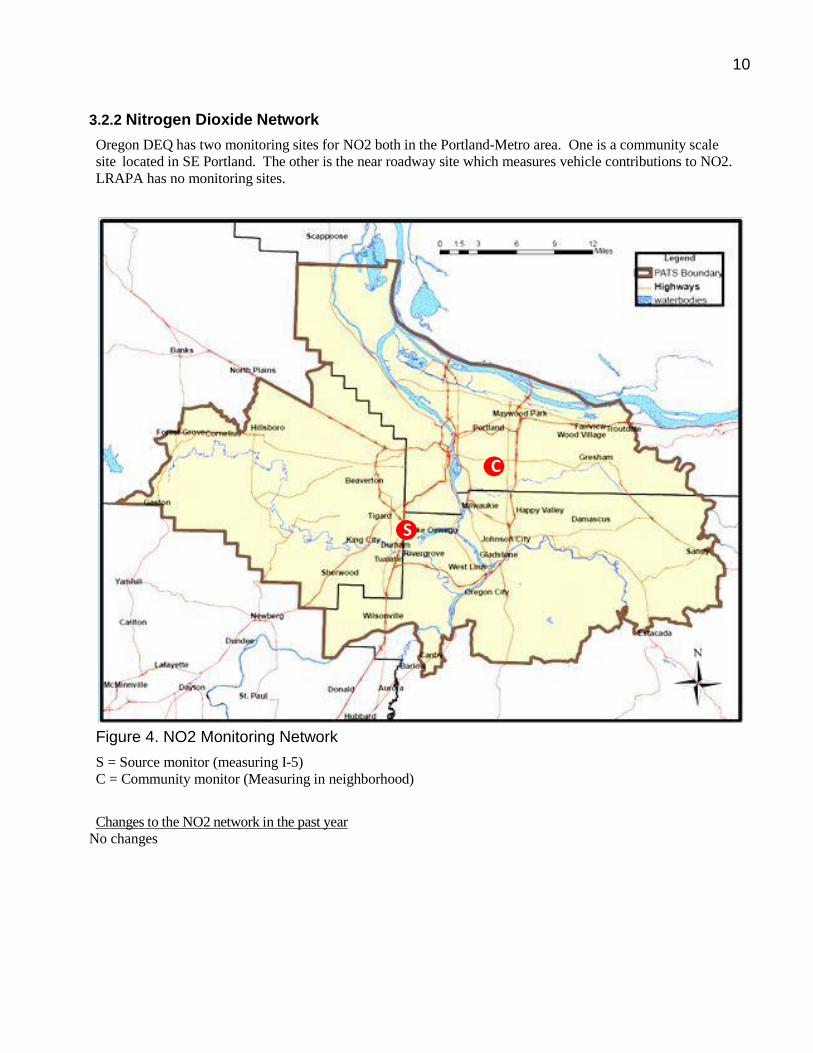
3.2.2 Nitrogen Dioxide Network
Oregon DEQ has two monitoring sites for NO2 both in the Portland-Metro area. One is a community scale
site located in SE Portland. The other is the near roadway site which measures vehicle contributions to NO2.
LRAPA has no monitoring sites.
Figure 4. NO2 Monitoring Network
S = Source monitor (measuring I-5)
C = Community monitor (Measuring in neighborhood)
Changes to the NO2 network in the past year
No changes
C
S
11
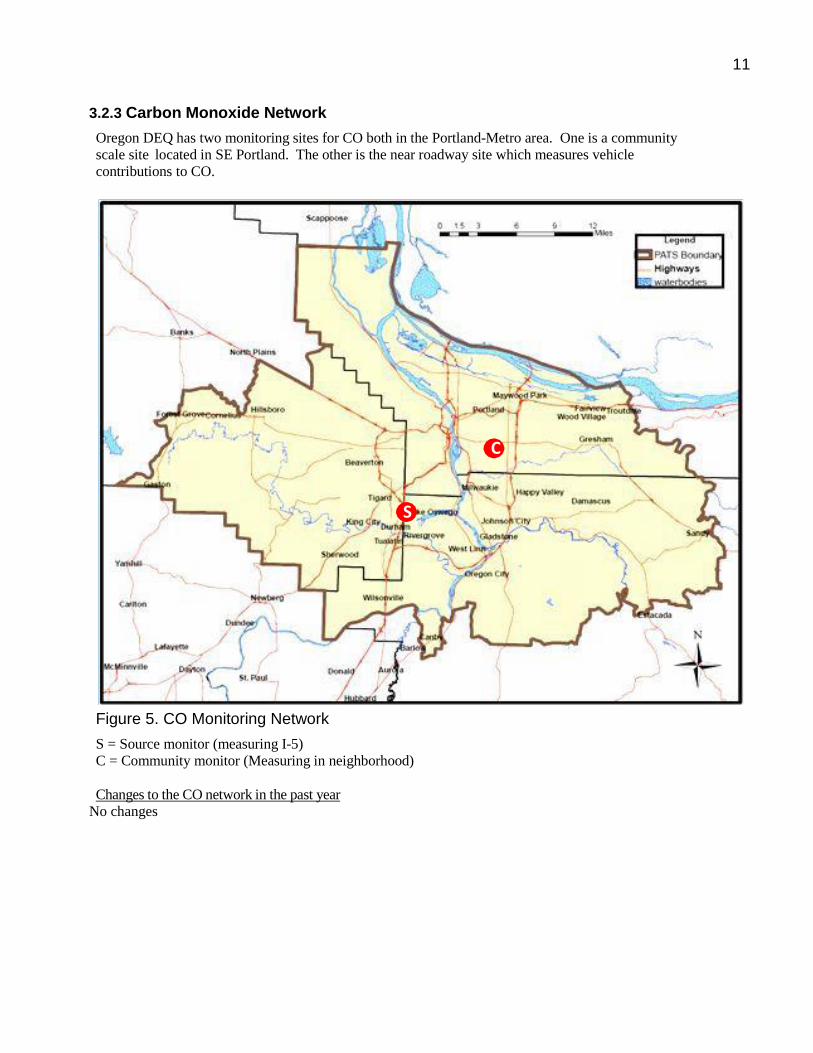
3.2.3 Carbon Monoxide Network
Oregon DEQ has two monitoring sites for CO both in the Portland-Metro area. One is a community
scale site located in SE Portland. The other is the near roadway site which measures vehicle
contributions to CO.
Figure 5. CO Monitoring Network
S = Source monitor (measuring I-5)
C = Community monitor (Measuring in neighborhood)
Changes to the CO network in the past year
No changes
C
S
12
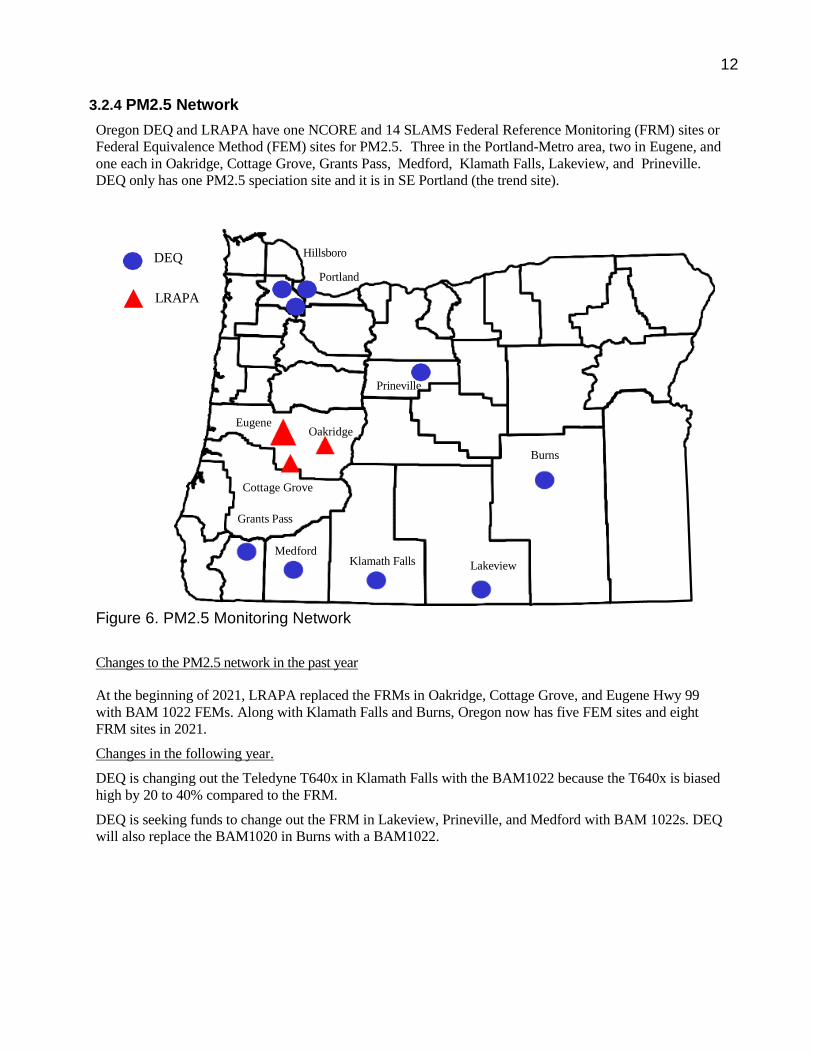
3.2.4 PM2.5 Network
Oregon DEQ and LRAPA have one NCORE and 14 SLAMS Federal Reference Monitoring (FRM) sites or
Federal Equivalence Method (FEM) sites for PM2.5. Three in the Portland-Metro area, two in Eugene, and
one each in Oakridge, Cottage Grove, Grants Pass, Medford, Klamath Falls, Lakeview, and Prineville.
DEQ only has one PM2.5 speciation site and it is in SE Portland (the trend site).
DEQ
LRAPA
Hillsboro
Portland
Prineville
Eugene
Oakridge
Burns
Cottage Grove
Grants Pass
Medford Klamath Falls Lakeview
Figure 6. PM2.5 Monitoring Network
Changes to the PM2.5 network in the past year
At the beginning of 2021, LRAPA replaced the FRMs in Oakridge, Cottage Grove, and Eugene Hwy 99
with BAM 1022 FEMs. Along with Klamath Falls and Burns, Oregon now has five FEM sites and eight
FRM sites in 2021.
Changes in the following year.
DEQ is changing out the Teledyne T640x in Klamath Falls with the BAM1022 because the T640x is biased
high by 20 to 40% compared to the FRM.
DEQ is seeking funds to change out the FRM in Lakeview, Prineville, and Medford with BAM 1022s. DEQ
will also replace the BAM1020 in Burns with a BAM1022.
13
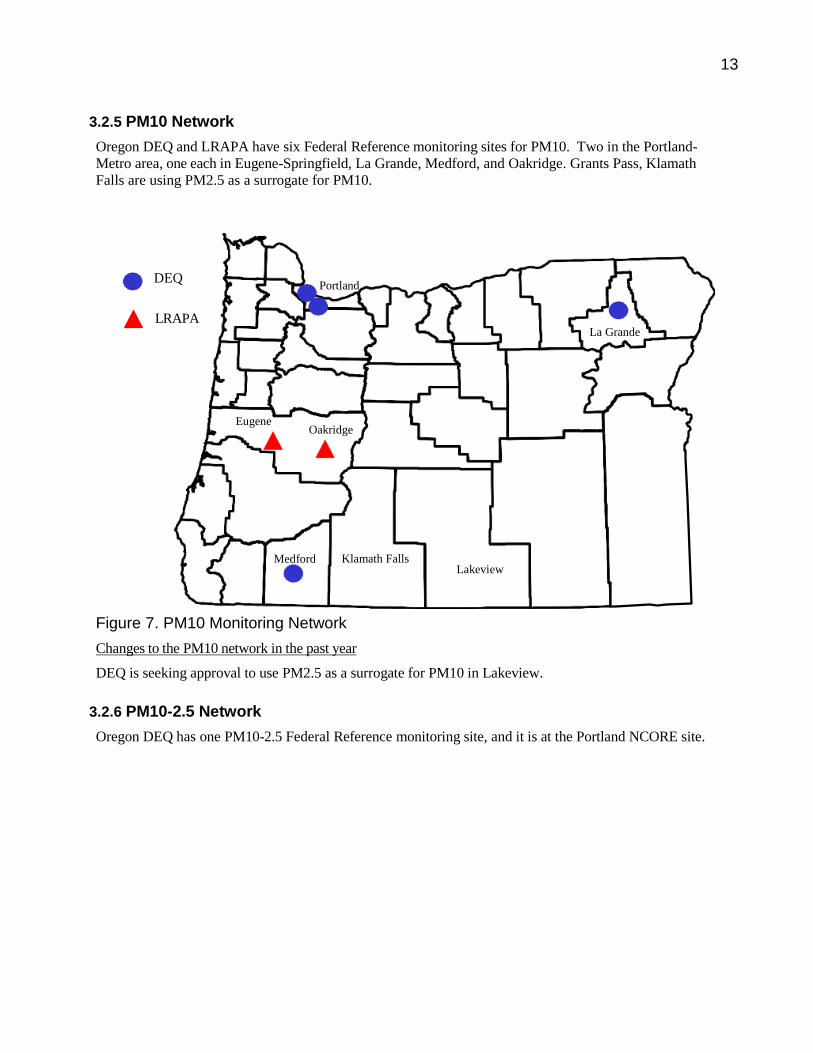
3.2.5 PM10 Network
Oregon DEQ and LRAPA have six Federal Reference monitoring sites for PM10. Two in the Portland-
Metro area, one each in Eugene-Springfield, La Grande, Medford, and Oakridge. Grants Pass, Klamath
Falls are using PM2.5 as a surrogate for PM10.
DEQ
LRAPA
Portland
Eugene Oakridge
Medford
Figure 7. PM10 Monitoring Network
Changes to the PM10 network in the past year
DEQ is seeking approval to use PM2.5 as a surrogate for PM10 in Lakeview.
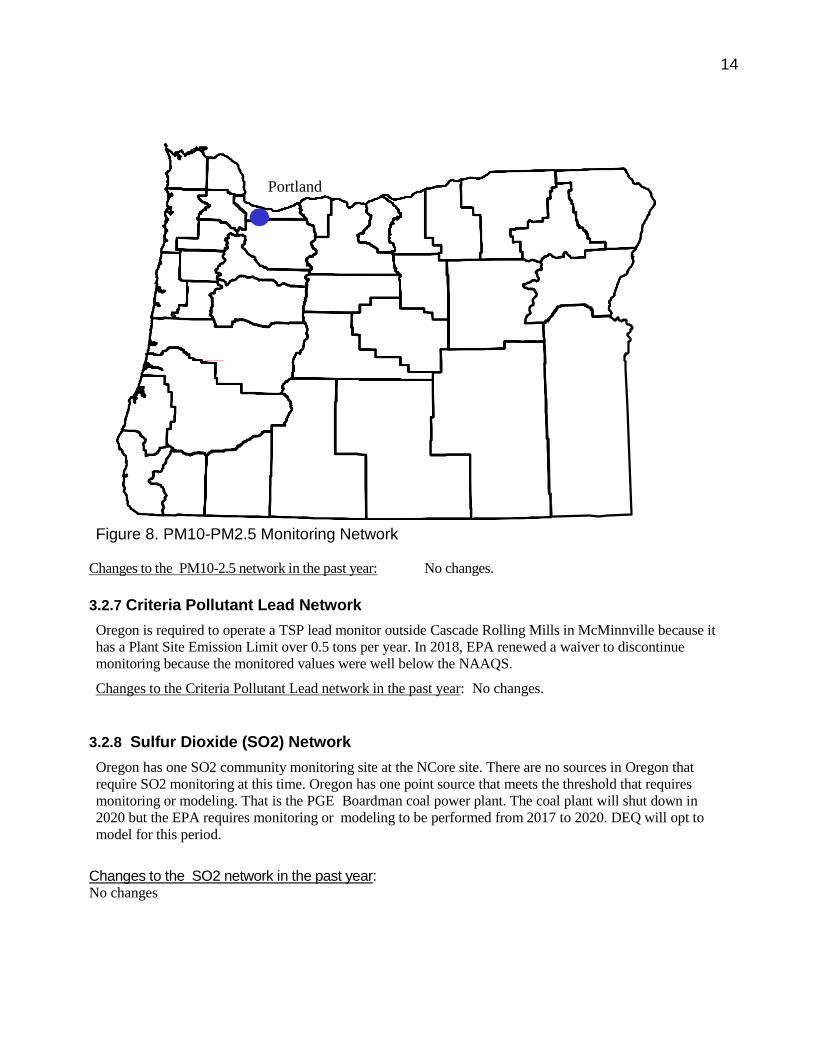
3.2.6 PM10-2.5 Network
Oregon DEQ has one PM10-2.5 Federal Reference monitoring site, and it is at the Portland NCORE site.
Klamath Falls Lakeview
La Grande
14
Figure 8. PM10-PM2.5 Monitoring Network
Changes to the PM10-2.5 network in the past year: No changes.
3.2.7 Criteria Pollutant Lead Network
Oregon is required to operate a TSP lead monitor outside Cascade Rolling Mills in McMinnville because it
has a Plant Site Emission Limit over 0.5 tons per year. In 2018, EPA renewed a waiver to discontinue
monitoring because the monitored values were well below the NAAQS.
Changes to the Criteria Pollutant Lead network in the past year: No changes.
3.2.8 Sulfur Dioxide (SO2) Network
Oregon has one SO2 community monitoring site at the NCore site. There are no sources in Oregon that
require SO2 monitoring at this time. Oregon has one point source that meets the threshold that requires
monitoring or modeling. That is the PGE Boardman coal power plant. The coal plant will shut down in
2020 but the EPA requires monitoring or modeling to be performed from 2017 to 2020. DEQ will opt to
model for this period.
Changes to the SO2 network in the past year: No changes
Portland
15
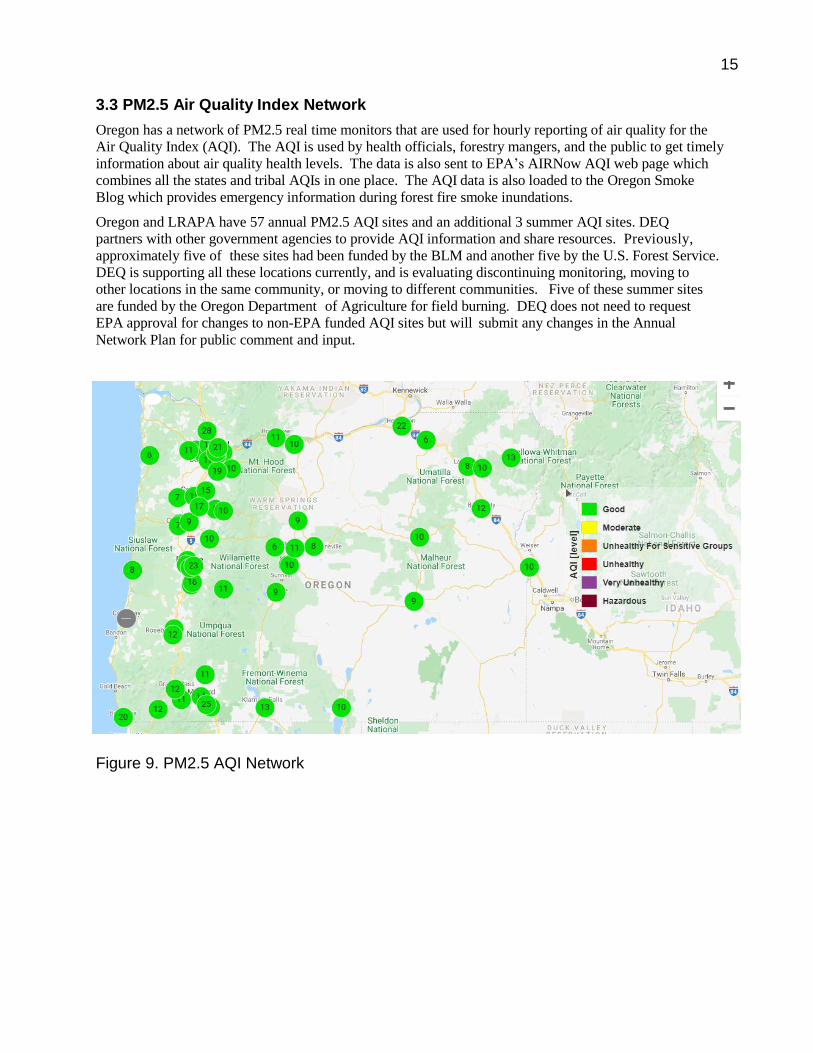
3.3 PM2.5 Air Quality Index Network
Oregon has a network of PM2.5 real time monitors that are used for hourly reporting of air quality for the
Air Quality Index (AQI). The AQI is used by health officials, forestry mangers, and the public to get timely
information about air quality health levels. The data is also sent to EPA’s AIRNow AQI web page which
combines all the states and tribal AQIs in one place. The AQI data is also loaded to the Oregon Smoke
Blog which provides emergency information during forest fire smoke inundations.
Oregon and LRAPA have 57 annual PM2.5 AQI sites and an additional 3 summer AQI sites. DEQ
partners with other government agencies to provide AQI information and share resources. Previously,
approximately five of these sites had been funded by the BLM and another five by the U.S. Forest Service.
DEQ is supporting all these locations currently, and is evaluating discontinuing monitoring, moving to
other locations in the same community, or moving to different communities. Five of these summer sites
are funded by the Oregon Department of Agriculture for field burning. DEQ does not need to request
EPA approval for changes to non-EPA funded AQI sites but will submit any changes in the Annual
Network Plan for public comment and input.
Figure 9. PM2.5 AQI Network
16
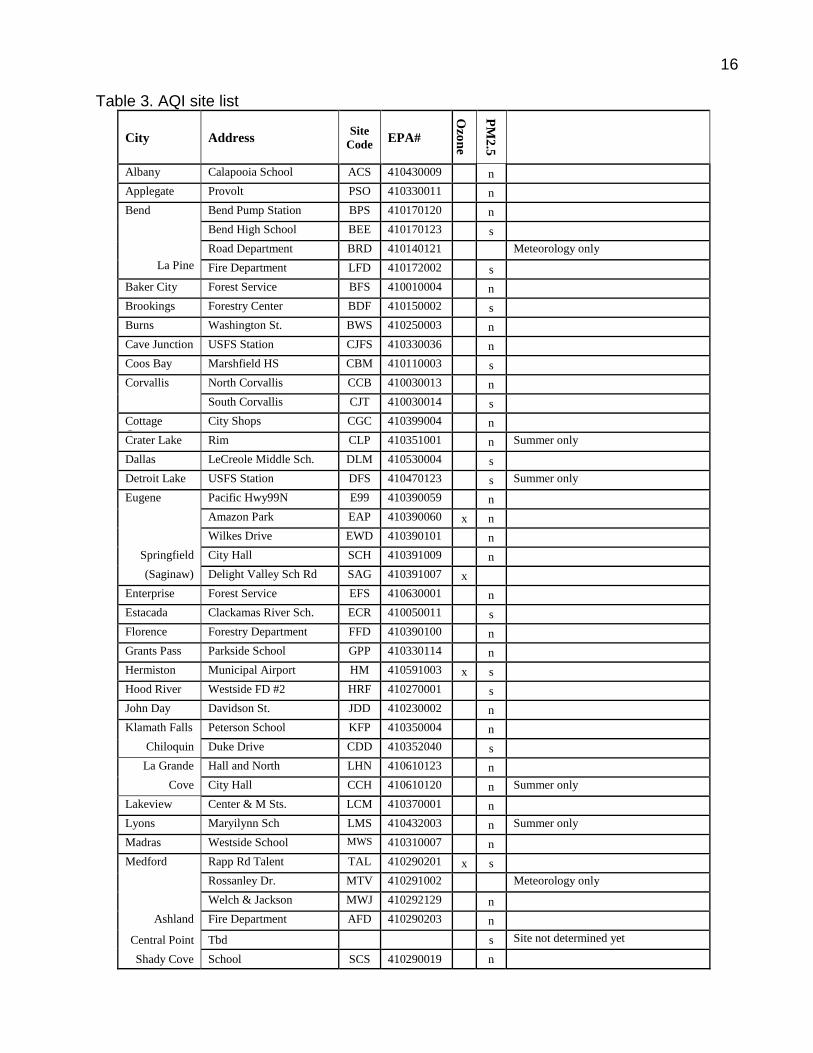
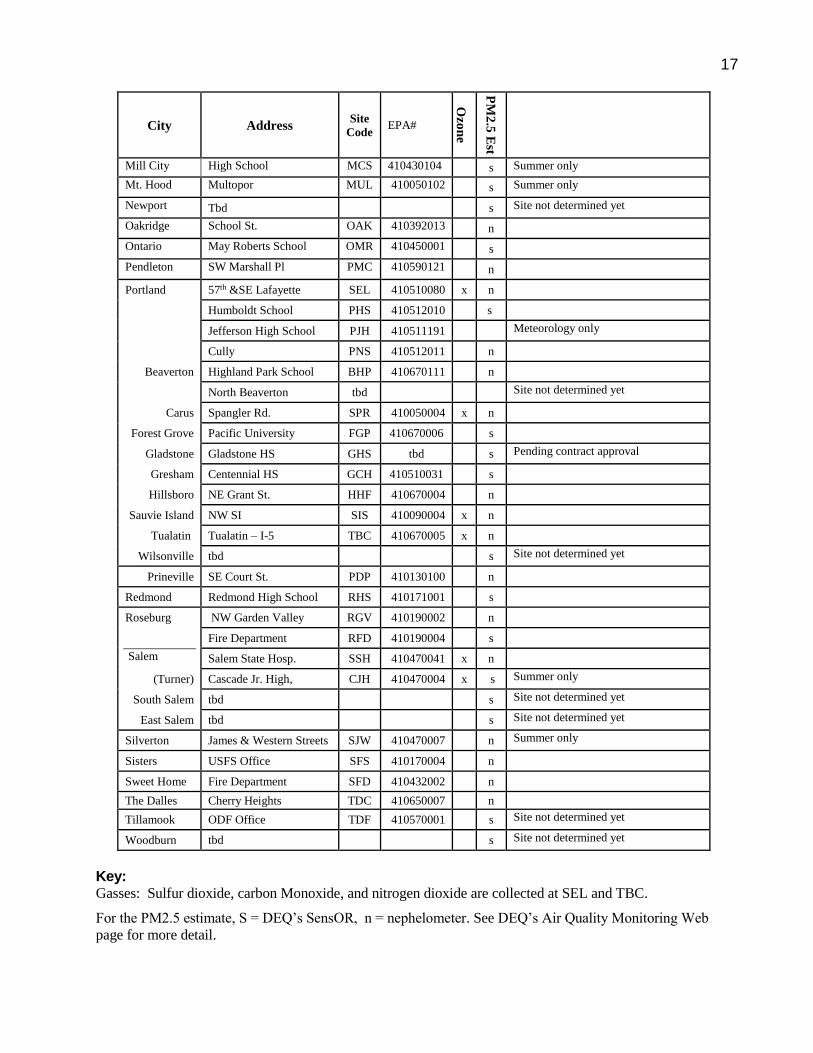
Table 3. AQI site list
City Address Site
Code EPA#
Ozo
ne
PM
2.5
Albany Calapooia School ACS 410430009 n
Applegate Provolt PSO 410330011 n
Bend
La Pine
Bend Pump Station BPS 410170120 n
Bend High School BEE 410170123 s
Road Department BRD 410140121 Meteorology only
Fire Department LFD 410172002 s
Baker City Forest Service BFS 410010004 n
Brookings Forestry Center BDF 410150002 s
Burns Washington St. BWS 410250003 n
Cave Junction USFS Station CJFS 410330036 n
Coos Bay Marshfield HS CBM 410110003 s
Corvallis North Corvallis CCB 410030013 n
South Corvallis CJT 410030014 s
Cottage
Grove
City Shops CGC 410399004 n
Crater Lake Rim CLP 410351001 n Summer only
Dallas LeCreole Middle Sch. DLM 410530004 s
Detroit Lake USFS Station DFS 410470123
s Summer only
Eugene Pacific Hwy99N E99 410390059 n
Amazon Park EAP 410390060 x n
Wilkes Drive EWD 410390101 n
Springfield City Hall SCH 410391009 n
(Saginaw) Delight Valley Sch Rd SAG 410391007 x
Enterprise Forest Service EFS 410630001 n
Estacada Clackamas River Sch. ECR 410050011 s
Florence Forestry Department FFD 410390100 n
Grants Pass Parkside School GPP 410330114 n
Hermiston Municipal Airport HM
A
410591003 x s
Hood River Westside FD #2 HRF 410270001 s
John Day Davidson St. JDD 410230002 n
Klamath Falls Peterson School KFP 410350004 n
Chiloquin Duke Drive CDD 410352040 s
La Grande Hall and North LHN 410610123 n
Cove City Hall CCH 410610120 n Summer only
Lakeview Center & M Sts. LCM 410370001 n
Lyons Maryilynn Sch LMS 410432003
n Summer only
Madras Westside School MWS 410310007 n
Medford Rapp Rd Talent TAL 410290201 x s
Rossanley Dr. MTV 410291002 Meteorology only
Welch & Jackson MWJ 410292129 n
Ashland Fire Department AFD 410290203 n
Central Point Tbd s Site not determined yet
Shady Cove School SCS 410290019 n
17
City Address Site
Code EPA#
Ozo
ne
PM
2.5
Est
Mill City High School MCS 410430104 s Summer only
Mt. Hood Multopor MUL 410050102 s Summer only
Newport Tbd s Site not determined yet
Oakridge School St. OAK 410392013 n
Ontario May Roberts School OMR 410450001 s
Pendleton SW Marshall Pl PMC 410590121 n
Portland 57th &SE Lafayette SEL 410510080 x n
Humboldt School PHS 410512010 s
Jefferson High School PJH 410511191 Meteorology only
Cully PNS 410512011 n
Beaverton Highland Park School BHP 410670111 n
North Beaverton tbd Site not determined yet
Carus Spangler Rd. SPR 410050004 x n
Forest Grove Pacific University FGP 410670006 s
Gladstone Gladstone HS GHS tbd s Pending contract approval
Gresham Centennial HS GCH 410510031 s
Hillsboro NE Grant St. HHF 410670004 n
Sauvie Island NW SI SIS 410090004 x n
Tualatin Tualatin – I-5 TBC 410670005 x n
Wilsonville tbd s Site not determined yet
Prineville SE Court St. PDP 410130100 n
Redmond Redmond High School RHS 410171001 s
Roseburg NW Garden Valley RGV 410190002 n
Salem
Fire Department RFD 410190004 s
Salem State Hosp. SSH 410470041 x n
(Turner) Cascade Jr. High, CJH 410470004 x s Summer only
South Salem tbd s Site not determined yet
East Salem tbd s Site not determined yet
Silverton James & Western Streets SJW 410470007 n Summer only
Sisters USFS Office SFS 410170004 n
Sweet Home Fire Department SFD 410432002 n
The Dalles Cherry Heights TDC 410650007 n
Tillamook ODF Office TDF 410570001 s Site not determined yet
Woodburn tbd s Site not determined yet
Key: Gasses: Sulfur dioxide, carbon Monoxide, and nitrogen dioxide are collected at SEL and TBC.
For the PM2.5 estimate, S = DEQ’s SensOR, n = nephelometer. See DEQ’s Air Quality Monitoring Web
page for more detail.
18
Changes to the PM2.5 AQI Network in the past year:
DEQ added 22 of 30 new PM2.5 estimate sites to the AQI. This information is available on the DEQ Air
Quality Monitoring webpage.
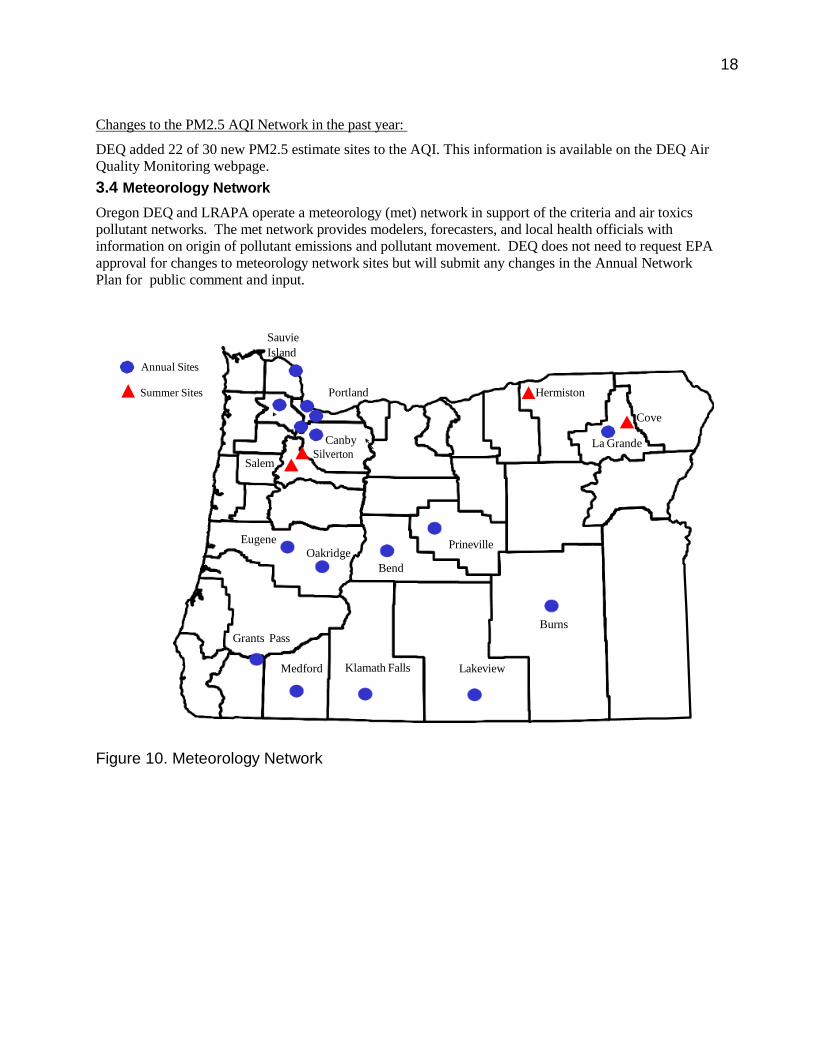
3.4 Meteorology Network
Oregon DEQ and LRAPA operate a meteorology (met) network in support of the criteria and air toxics
pollutant networks. The met network provides modelers, forecasters, and local health officials with
information on origin of pollutant emissions and pollutant movement. DEQ does not need to request EPA
approval for changes to meteorology network sites but will submit any changes in the Annual Network
Plan for public comment and input.
Annual Sites
Summer Sites
Sauvie
Island
Salem
Portland
Canby
Silverton
Hermiston
Cove
La Grande
Eugene
Oakridge
Bend
Prineville
Burns
Grants Pass
Medford Klamath Falls Lakeview
Figure 10. Meteorology Network
19
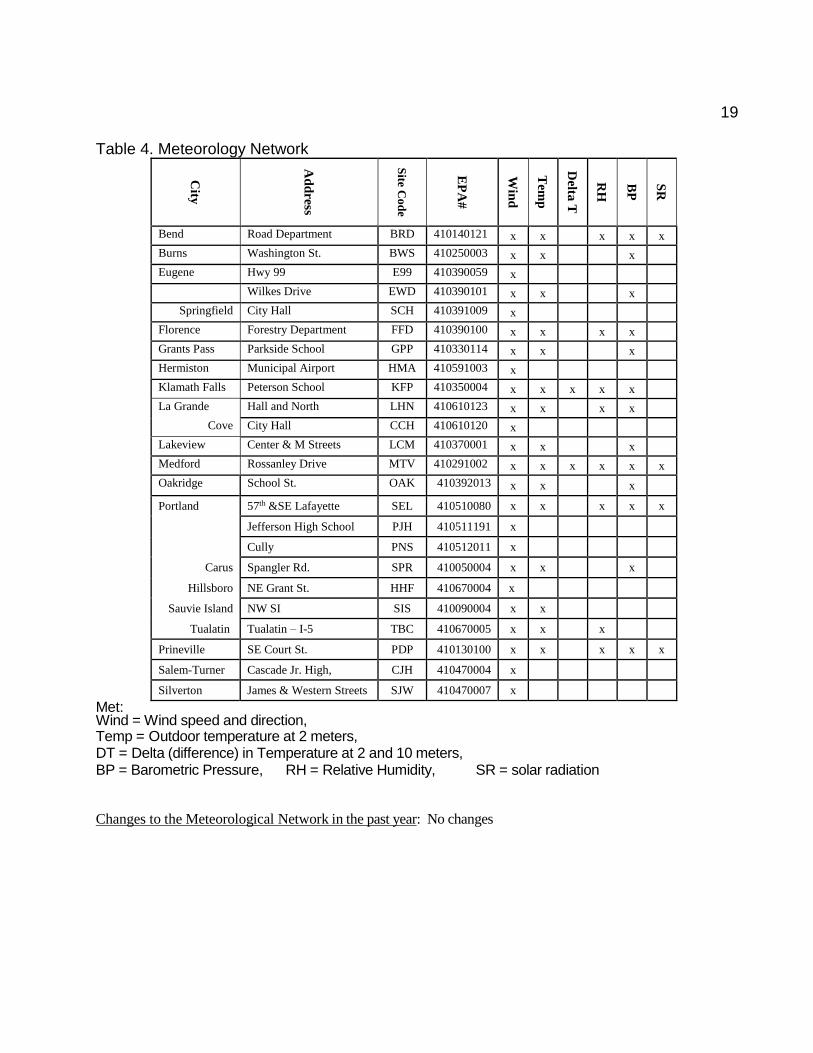
Table 4. Meteorology Network
City
Ad
dress
Site C
od
e
EP
A#
Win
d
Tem
p
Delta
T
RH
BP
SR
Bend Road Department BRD 410140121 x x x x x
Burns Washington St. BWS 410250003 x x x
Eugene Hwy 99 E99 410390059 x
Wilkes Drive EWD 410390101 x x x
Springfield City Hall SCH 410391009 x
Florence Forestry Department FFD 410390100 x x x x
Grants Pass Parkside School GPP 410330114 x x x
Hermiston Municipal Airport HMA 410591003 x
Klamath Falls Peterson School KFP 410350004 x x x x x
La Grande Hall and North LHN 410610123 x x x x
Cove City Hall CCH 410610120 x
Lakeview Center & M Streets LCM 410370001 x x x
Medford Rossanley Drive MTV 410291002 x x x x x x
Oakridge School St. OAK 410392013 x x x
Portland 57th &SE Lafayette SEL 410510080 x x x x x
Jefferson High School PJH 410511191 x
Cully PNS 410512011 x
Carus Spangler Rd. SPR 410050004 x x x
Hillsboro NE Grant St. HHF 410670004 x
Sauvie Island NW SI SIS 410090004 x x
Tualatin Tualatin – I-5 TBC 410670005 x x x
Prineville SE Court St. PDP 410130100 x x x x x
Salem-Turner Cascade Jr. High, CJH 410470004 x
Silverton James & Western Streets SJW 410470007 x
Met: Wind = Wind speed and direction, Temp = Outdoor temperature at 2 meters, DT = Delta (difference) in Temperature at 2 and 10 meters, BP = Barometric Pressure, RH = Relative Humidity, SR = solar radiation
Changes to the Meteorological Network in the past year: No changes
20
20
4. Planned Changes to Network
All major modifications to the ambient air quality monitoring network required by EPA are submitted to the regional administrator for review and
approval in the network assessment. Changes that do not require EPA approval are also mentioned for informational purposes.
4.1 Criteria Pollutant Changes PM2.5
The Klamath Falls monitoring station is equipped with the Teledyne T640x continuous FEM method for continuous monitoring. It will be changed
to a Met One BAM 1022 in the hope of improving the accuracy compared to the FRM. As funds become available, other sites like Burns, Lakeview,
Prineville, and Medford will be changed to BAM 1022s. Hillsboro, Tualatin, and Portland may be changed to T640x FEMs if their bias meets the
EPA FEM/FRM bias and correlation requirements used to designate FEMS. LRAPA has changed Oakridge, Cottage Grove, and Eugene Hwy 99 to
BAM 1022 FEMs. LRAPA will change over Eugene Amazon Park to FEM in January 2022.
PM10
DEQ is seeking approval from EPA to use PM2.5 as a surrogate for PM10 in Lakeview to meet the PM10 maintenance plan monitoring
* Portland State Population Research Center 2020 estimates
24
24
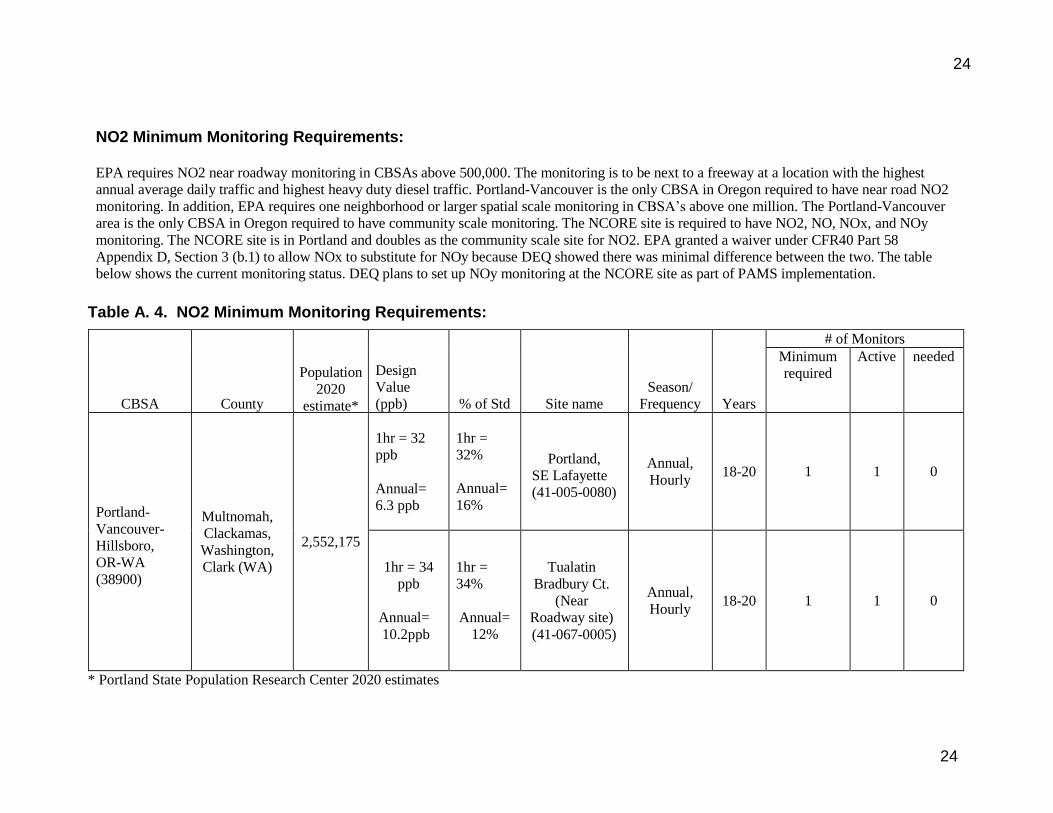
NO2 Minimum Monitoring Requirements:
EPA requires NO2 near roadway monitoring in CBSAs above 500,000. The monitoring is to be next to a freeway at a location with the highest
annual average daily traffic and highest heavy duty diesel traffic. Portland-Vancouver is the only CBSA in Oregon required to have near road NO2
monitoring. In addition, EPA requires one neighborhood or larger spatial scale monitoring in CBSA’s above one million. The Portland-Vancouver
area is the only CBSA in Oregon required to have community scale monitoring. The NCORE site is required to have NO2, NO, NOx, and NOy
monitoring. The NCORE site is in Portland and doubles as the community scale site for NO2. EPA granted a waiver under CFR40 Part 58
Appendix D, Section 3 (b.1) to allow NOx to substitute for NOy because DEQ showed there was minimal difference between the two. The table
below shows the current monitoring status. DEQ plans to set up NOy monitoring at the NCORE site as part of PAMS implementation.
Table A. 4. NO2 Minimum Monitoring Requirements:
CBSA
County
Population
2020
estimate*
Design
Value
(ppb)
% of Std
Site name
Season/
Frequency
Years
# of Monitors
Minimum
required
Active needed
Portland-
Vancouver-
Hillsboro,
OR-WA
(38900)
Multnomah,
Clackamas,
Washington,
Clark (WA)
2,552,175
1hr = 32
ppb
Annual=
6.3 ppb
1hr =
32%
Annual=
16%
Portland,
SE Lafayette
(41-005-0080)
Annual,
Hourly 18-20 1 1 0
1hr = 34
ppb
Annual=
10.2ppb
1hr =
34%
Annual=
12%
Tualatin
Bradbury Ct.
(Near
Roadway site)
(41-067-0005)
Annual,
Hourly 18-20 1 1 0
* Portland State Population Research Center 2020 estimates
25
25
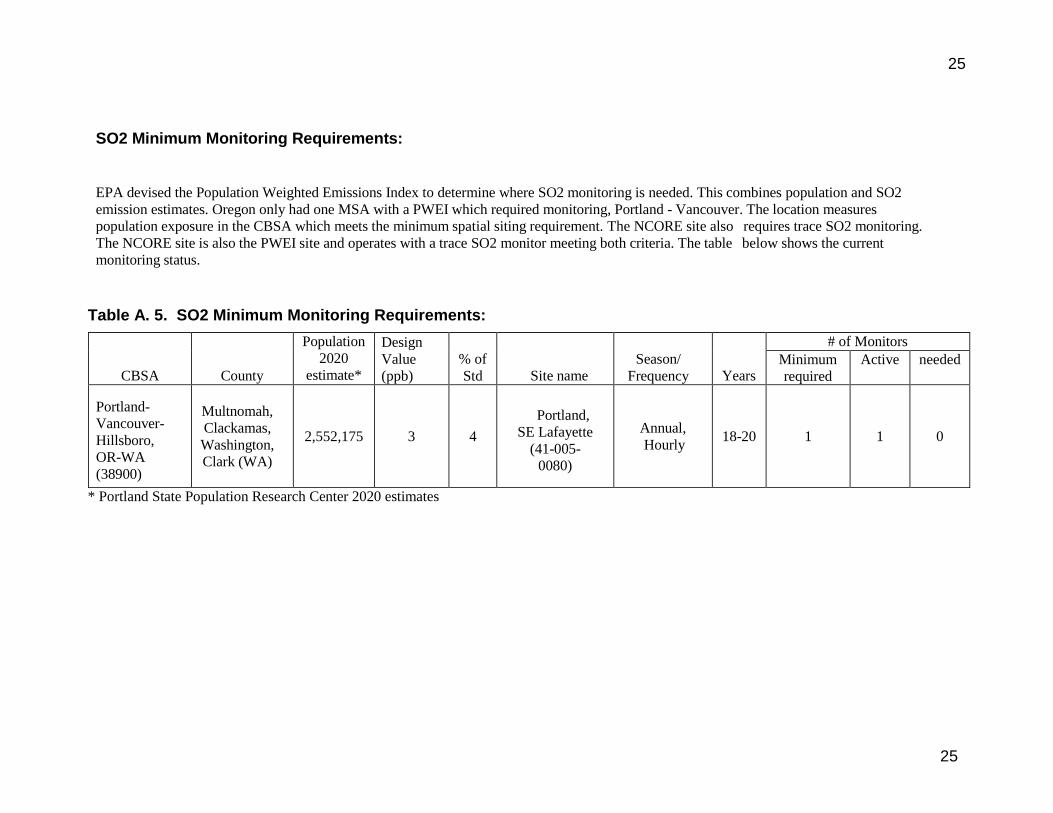
SO2 Minimum Monitoring Requirements:
EPA devised the Population Weighted Emissions Index to determine where SO2 monitoring is needed. This combines population and SO2
emission estimates. Oregon only had one MSA with a PWEI which required monitoring, Portland - Vancouver. The location measures
population exposure in the CBSA which meets the minimum spatial siting requirement. The NCORE site also requires trace SO2 monitoring.
The NCORE site is also the PWEI site and operates with a trace SO2 monitor meeting both criteria. The table below shows the current
monitoring status.
Table A. 5. SO2 Minimum Monitoring Requirements:
CBSA
County
Population
2020
estimate*
Design
Value
(ppb)
% of
Std
Site name
Season/
Frequency
Years
# of Monitors
Minimum
required
Active needed
Portland-
Vancouver-
Hillsboro,
OR-WA
(38900)
Multnomah,
Clackamas,
Washington,
Clark (WA)
2,552,175 3 4
Portland,
SE Lafayette
(41-005-
0080)
Annual,
Hourly 18-20 1 1 0
* Portland State Population Research Center 2020 estimates
26
26
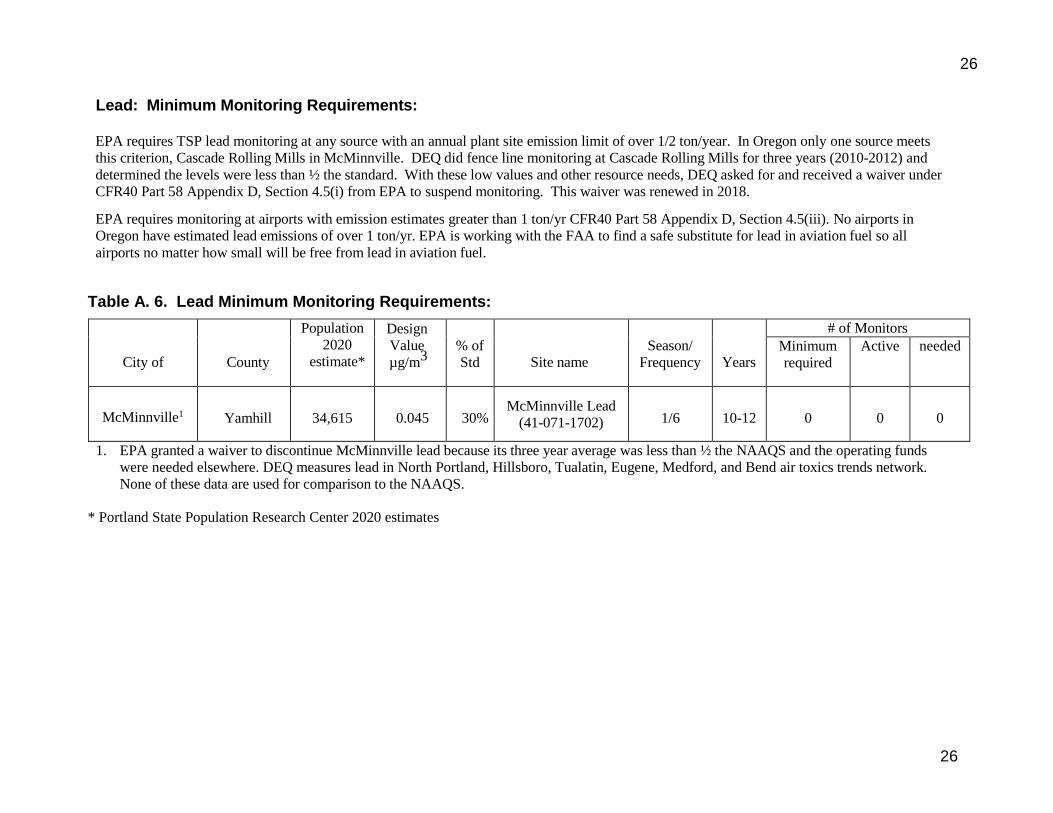
Lead: Minimum Monitoring Requirements:
EPA requires TSP lead monitoring at any source with an annual plant site emission limit of over 1/2 ton/year. In Oregon only one source meets
this criterion, Cascade Rolling Mills in McMinnville. DEQ did fence line monitoring at Cascade Rolling Mills for three years (2010-2012) and
determined the levels were less than ½ the standard. With these low values and other resource needs, DEQ asked for and received a waiver under
CFR40 Part 58 Appendix D, Section 4.5(i) from EPA to suspend monitoring. This waiver was renewed in 2018.
EPA requires monitoring at airports with emission estimates greater than 1 ton/yr CFR40 Part 58 Appendix D, Section 4.5(iii). No airports in
Oregon have estimated lead emissions of over 1 ton/yr. EPA is working with the FAA to find a safe substitute for lead in aviation fuel so all
airports no matter how small will be free from lead in aviation fuel.
Table A. 6. Lead Minimum Monitoring Requirements:
City of
County
Population
2020
estimate*
Design
Value
µg/m3
% of
Std
Site name
Season/
Frequency
Years
# of Monitors
Minimum
required
Active needed
McMinnville1 Yamhill 34,615 0.045 30% McMinnville Lead
(41-071-1702) 1/6 10-12 0 0 0
1. EPA granted a waiver to discontinue McMinnville lead because its three year average was less than ½ the NAAQS and the operating funds
were needed elsewhere. DEQ measures lead in North Portland, Hillsboro, Tualatin, Eugene, Medford, and Bend air toxics trends network.
None of these data are used for comparison to the NAAQS. * Portland State Population Research Center 2020 estimates
27
27
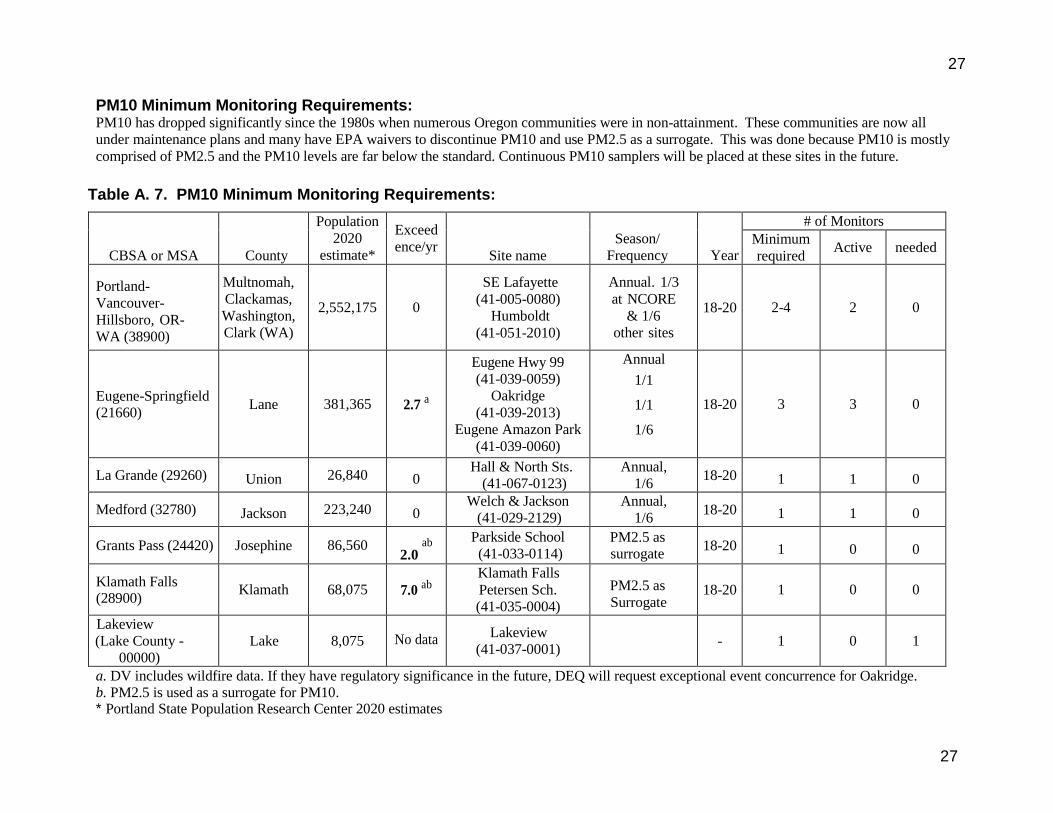
PM10 Minimum Monitoring Requirements: PM10 has dropped significantly since the 1980s when numerous Oregon communities were in non-attainment. These communities are now all
under maintenance plans and many have EPA waivers to discontinue PM10 and use PM2.5 as a surrogate. This was done because PM10 is mostly
comprised of PM2.5 and the PM10 levels are far below the standard. Continuous PM10 samplers will be placed at these sites in the future.
Table A. 7. PM10 Minimum Monitoring Requirements:
CBSA or MSA
County
Population
2020
estimate*
Exceed
ence/yr
Site name
Season/
Frequency
Year
s
# of Monitors
Minimum
required Active needed
Portland-
Vancouver-
Hillsboro, OR-
WA (38900)
Multnomah,
Clackamas,
Washington,
Clark (WA)
2,552,175 0
SE Lafayette
(41-005-0080)
Humboldt
(41-051-2010)
Annual. 1/3
at NCORE
& 1/6
other sites
18-20 2-4 2 0
Eugene-Springfield (21660)
Lane 381,365 2.7 a
Eugene Hwy 99
(41-039-0059)
Oakridge
(41-039-2013)
Eugene Amazon Park
(41-039-0060)
Annual
1/1
1/1
1/6
18-20 3 3 0
La Grande (29260) Union 26,840 0 Hall & North Sts.
(41-067-0123)
Annual,
1/6 18-20 1 1 0
Medford (32780) Jackson 223,240 0 Welch & Jackson
(41-029-2129)
Annual,
1/6 18-20 1 1 0
Grants Pass (24420) Josephine 86,560 2.0
ab
Parkside School
(41-033-0114) PM2.5 as surrogate
18-20 1 0 0
Klamath Falls (28900)
Klamath 68,075 7.0 ab
Klamath Falls
Petersen Sch.
(41-035-0004)
PM2.5 as
Surrogate 18-20 1 0 0
Lakeview
(Lake County -
00000)
Lake 8,075 No data
Lakeview
(41-037-0001) - 1 0 1
a. DV includes wildfire data. If they have regulatory significance in the future, DEQ will request exceptional event concurrence for Oakridge. b. PM2.5 is used as a surrogate for PM10. * Portland State Population Research Center 2020 estimates
28
28
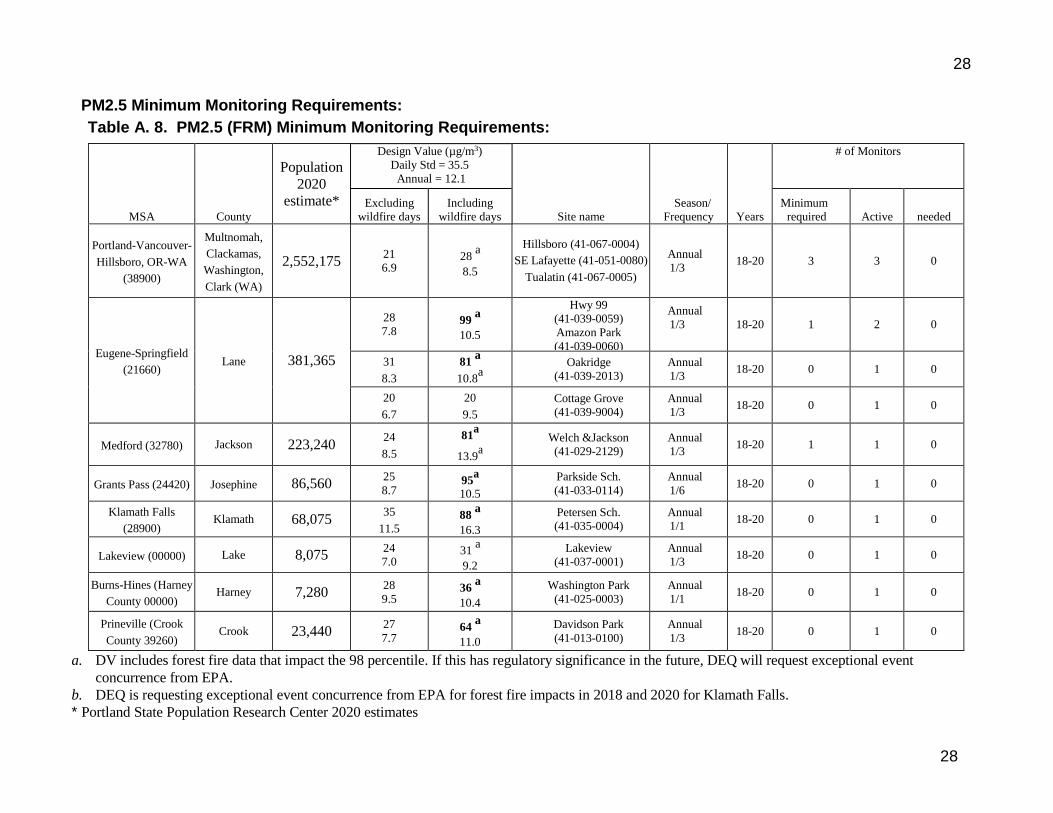
PM2.5 Minimum Monitoring Requirements:
Table A. 8. PM2.5 (FRM) Minimum Monitoring Requirements:
MSA County
Population
2020
estimate*
Design Value (µg/m3)
Daily Std = 35.5
Annual = 12.1
Site name
Season/
Frequency Years
# of Monitors
Excluding
wildfire days
Including
wildfire days
Minimum
required Active needed
Portland-Vancouver-
Hillsboro, OR-WA
(38900)
Multnomah,
Clackamas,
Washington,
Clark (WA)
2,552,175 21
6.9 28
a
8.5
Hillsboro (41-067-0004)
SE Lafayette (41-051-0080)
Tualatin (41-067-0005)
Annual
1/3 18-20 3 3 0
Eugene-Springfield
(21660) Lane 381,365
28
7.8 99
a
10.5
Hwy 99
(41-039-0059)
Amazon Park
(41-039-0060)
Annual
1/3
18-20 1 2 0
31
8.3
81 a
10.8a
Oakridge
(41-039-2013)
Annual
1/3 18-20 0 1 0
20
6.7
20
9.5
Cottage Grove
(41-039-9004)
Annual
1/3 18-20 0 1 0
Medford (32780) Jackson 223,240 24
8.5
81a
13.9a
Welch &Jackson
(41-029-2129)
Annual
1/3 18-20 1 1 0
Grants Pass (24420) Josephine 86,560 25
8.7 95
a
10.5
Parkside Sch.
(41-033-0114)
Annual
1/6 18-20 0 1 0
Klamath Falls
(28900) Klamath 68,075
35
11.5 88
a
16.3
Petersen Sch.
(41-035-0004)
Annual
1/1 18-20 0 1 0
Lakeview (00000) Lake 8,075 24
7.0 31
a
9.2
Lakeview
(41-037-0001)
Annual
1/3 18-20 0 1 0
Burns-Hines (Harney
County 00000) Harney 7,280
28
9.5 36
a
10.4
Washington Park
(41-025-0003)
Annual
1/1 18-20 0 1 0
Prineville (Crook
County 39260) Crook 23,440
27
7.7 64
a
11.0
Davidson Park
(41-013-0100)
Annual
1/3 18-20 0 1 0
a. DV includes forest fire data that impact the 98 percentile. If this has regulatory significance in the future, DEQ will request exceptional event
concurrence from EPA.
b. DEQ is requesting exceptional event concurrence from EPA for forest fire impacts in 2018 and 2020 for Klamath Falls.
* Portland State Population Research Center 2020 estimates
29
29
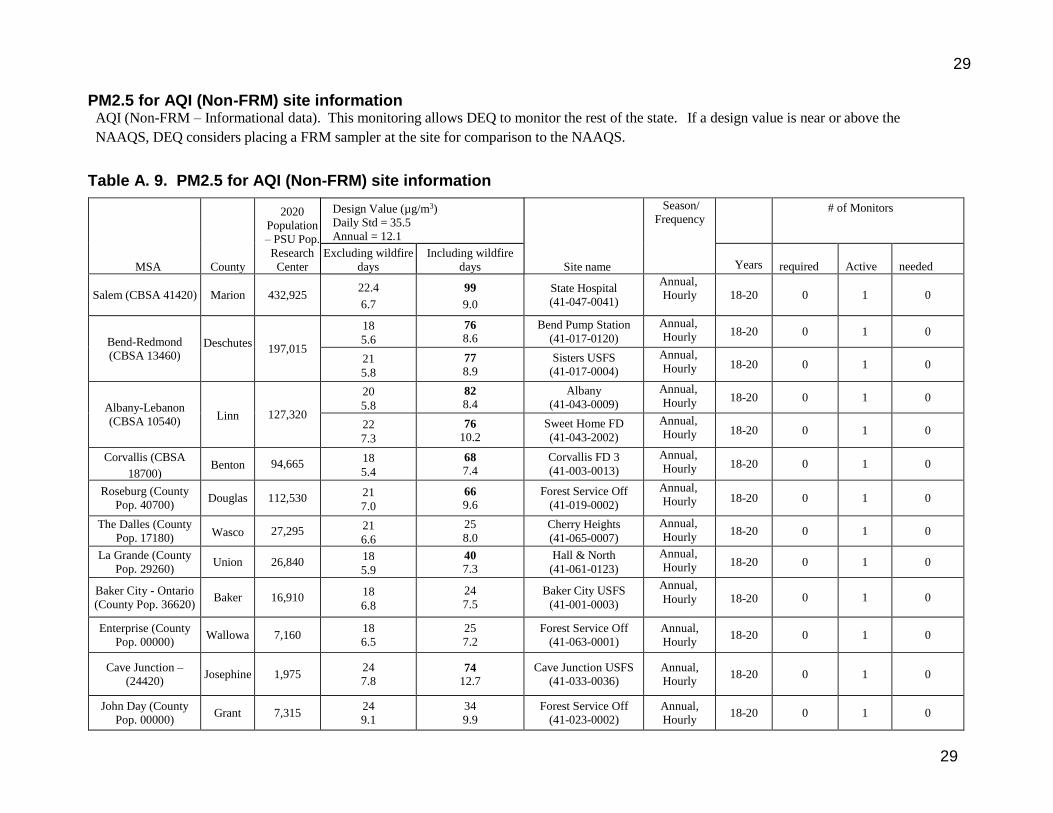
PM2.5 for AQI (Non-FRM) site information AQI (Non-FRM – Informational data). This monitoring allows DEQ to monitor the rest of the state. If a design value is near or above the
NAAQS, DEQ considers placing a FRM sampler at the site for comparison to the NAAQS.
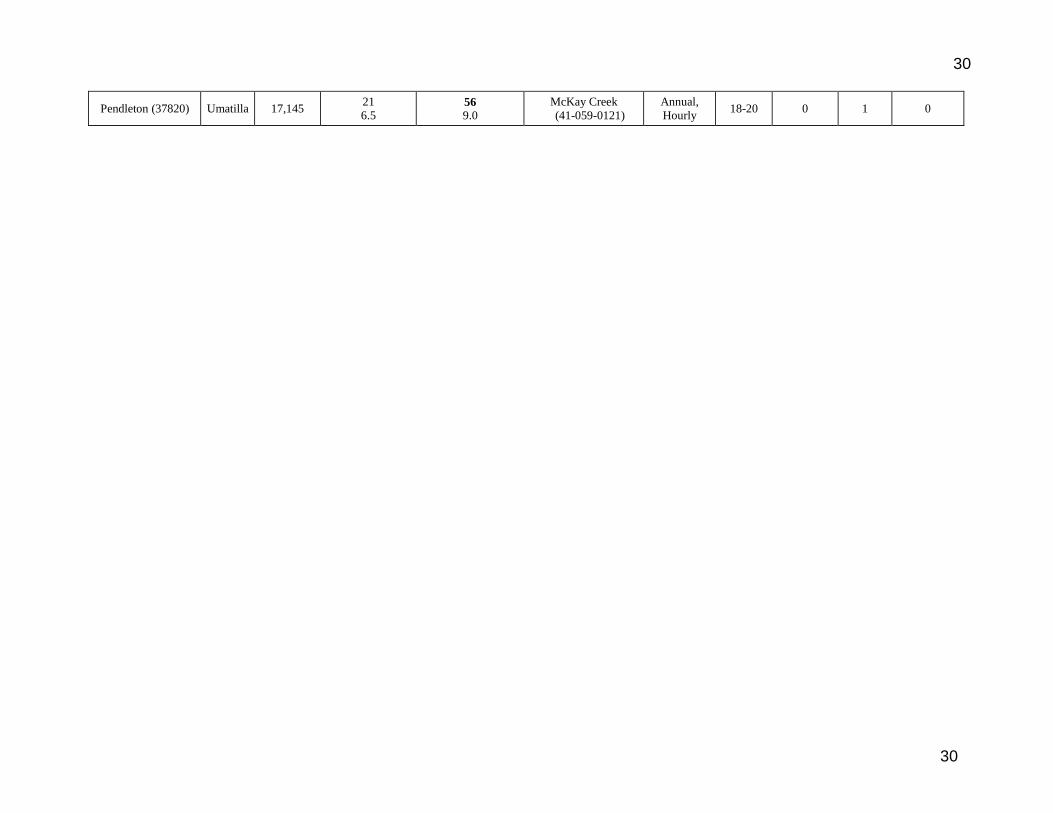
Table A. 9. PM2.5 for AQI (Non-FRM) site information
MSA County
2020
Population
– PSU Pop.
Research
Center
Design Value (µg/m3)
Daily Std = 35.5
Annual = 12.1
Site name
Season/
Frequency
# of Monitors
Excluding wildfire
days
Including wildfire
days
Years required Active needed
Salem (CBSA 41420) Marion 432,925 22.4
6.7
99
9.0
State Hospital
(41-047-0041)
Annual,
Hourly 18-20 0 1 0
Bend-Redmond
(CBSA 13460) Deschutes
197,015
18
5.6
76
8.6
Bend Pump Station
(41-017-0120)
Annual,
Hourly 18-20 0 1 0
21
5.8
77
8.9
Sisters USFS
(41-017-0004)
Annual,
Hourly 18-20 0 1 0
Albany-Lebanon
(CBSA 10540) Linn 127,320
20
5.8
82
8.4
Albany
(41-043-0009)
Annual,
Hourly 18-20 0 1 0
22
7.3
76
10.2
Sweet Home FD
(41-043-2002)
Annual,
Hourly 18-20 0 1 0
Corvallis (CBSA
18700) Benton 94,665
18
5.4
68
7.4
Corvallis FD 3
(41-003-0013)
Annual,
Hourly 18-20 0 1 0
Roseburg (County
Pop. 40700) Douglas 112,530
21
7.0
66
9.6
Forest Service Off
(41-019-0002)
Annual,
Hourly 18-20 0 1 0
The Dalles (County
Pop. 17180) Wasco 27,295
21
6.6
25
8.0
Cherry Heights
(41-065-0007)
Annual,
Hourly 18-20 0 1 0
La Grande (County
Pop. 29260) Union 26,840
18
5.9
40
7.3
Hall & North
(41-061-0123)
Annual,
Hourly 18-20 0 1 0
Baker City - Ontario
(County Pop. 36620) Baker 16,910
18
6.8
24
7.5
Baker City USFS
(41-001-0003)
Annual,
Hourly 18-20 0 1 0
Enterprise (County
Pop. 00000) Wallowa 7,160
18
6.5
25
7.2
Forest Service Off
(41-063-0001)
Annual,
Hourly 18-20 0 1 0
Cave Junction –
(24420) Josephine 1,975
24
7.8 74
12.7
Cave Junction USFS
(41-033-0036)
Annual,
Hourly 18-20 0 1 0
John Day (County
Pop. 00000) Grant 7,315
24
9.1
34
9.9
Forest Service Off
(41-023-0002)
Annual,
Hourly 18-20 0 1 0
30
30
Pendleton (37820) Umatilla 17,145 21
6.5 56
9.0
McKay Creek
(41-059-0121)
Annual,
Hourly 18-20 0 1 0
29
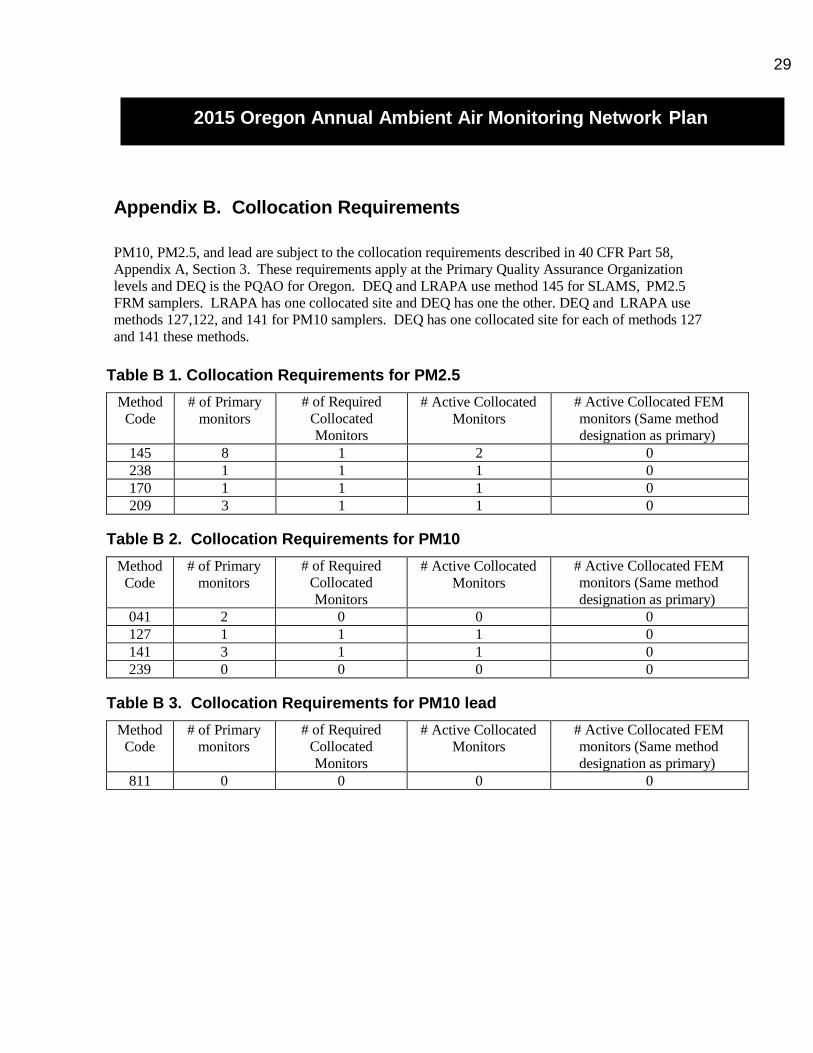
Appendix B. Collocation Requirements
PM10, PM2.5, and lead are subject to the collocation requirements described in 40 CFR Part 58,
Appendix A, Section 3. These requirements apply at the Primary Quality Assurance Organization
levels and DEQ is the PQAO for Oregon. DEQ and LRAPA use method 145 for SLAMS, PM2.5
FRM samplers. LRAPA has one collocated site and DEQ has one the other. DEQ and LRAPA use
methods 127,122, and 141 for PM10 samplers. DEQ has one collocated site for each of methods 127
and 141 these methods.
Table B 1. Collocation Requirements for PM2.5
Method
Code
# of Primary
monitors
# of Required
Collocated
Monitors
# Active Collocated
Monitors
# Active Collocated FEM
monitors (Same method
designation as primary)
145 8 1 2 0
238 1 1 1 0
170 1 1 1 0
209 3 1 1 0
Table B 2. Collocation Requirements for PM10
Method
Code
# of Primary
monitors
# of Required
Collocated
Monitors
# Active Collocated
Monitors
# Active Collocated FEM
monitors (Same method
designation as primary)
041 2 0 0 0
127 1 1 1 0
141 3 1 1 0
239 0 0 0 0
Table B 3. Collocation Requirements for PM10 lead
Method
Code
# of Primary
monitors
# of Required
Collocated
Monitors
# Active Collocated
Monitors
# Active Collocated FEM
monitors (Same method
designation as primary)
811 0 0 0 0
2015 Oregon Annual Ambient Air Monitoring Network Plan
30
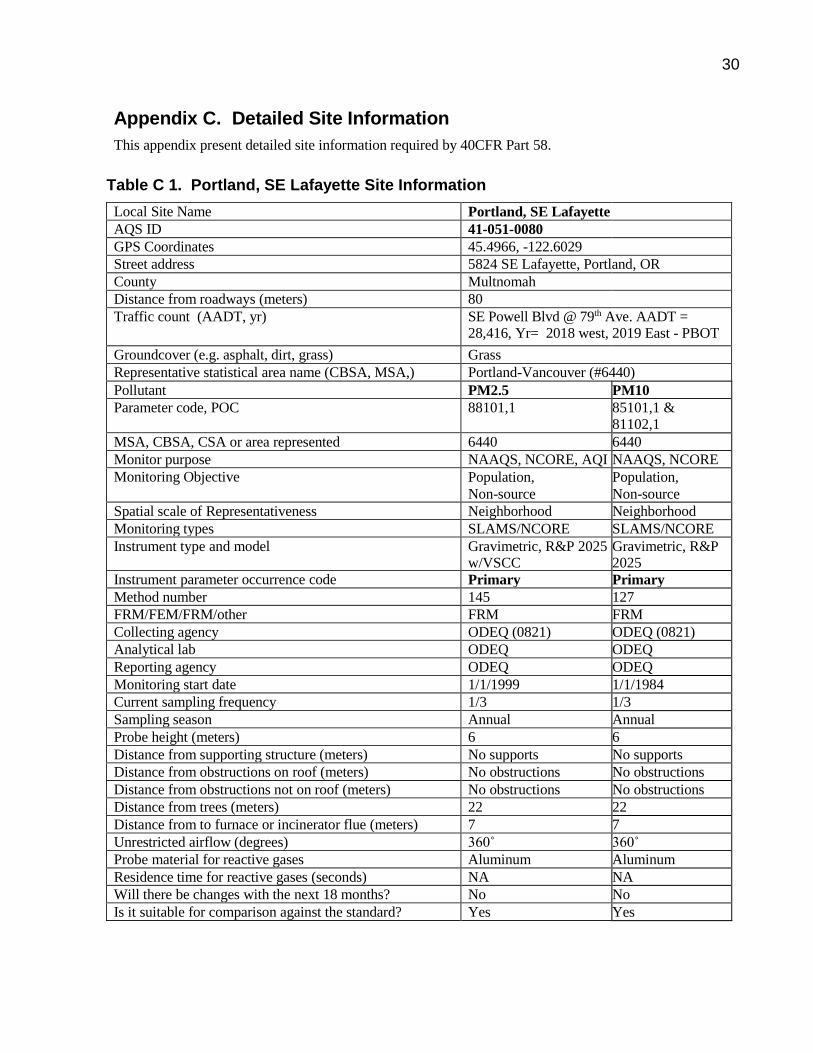
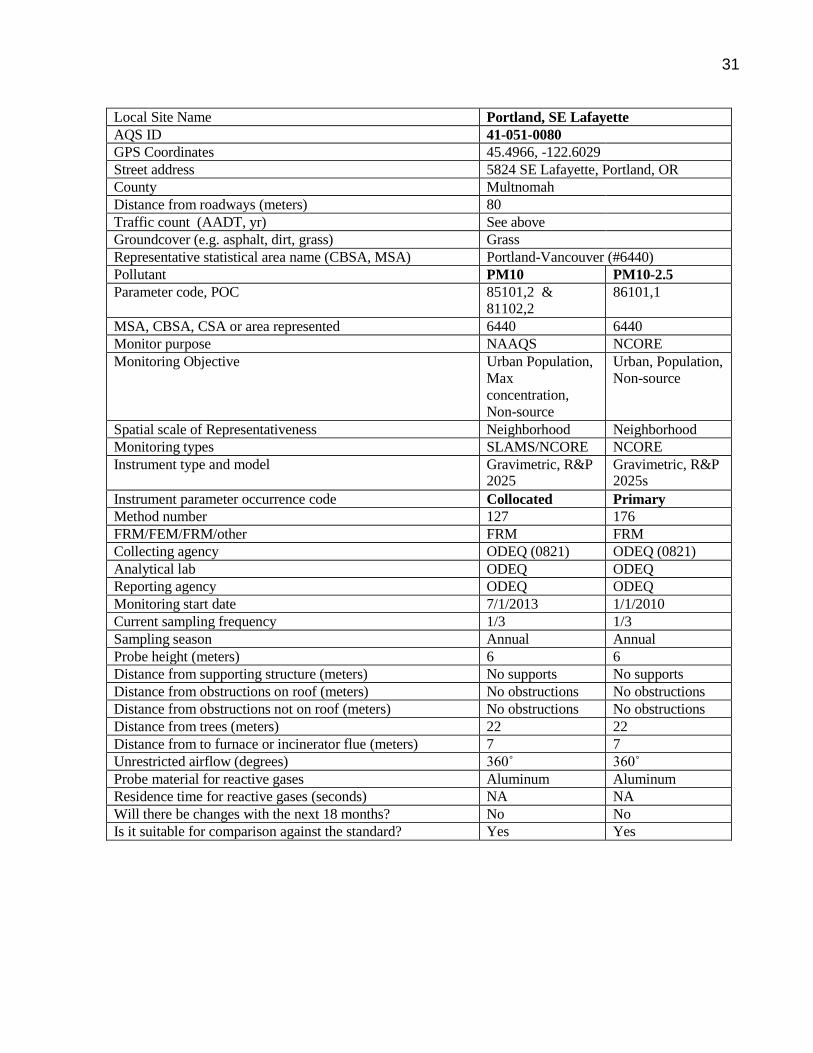
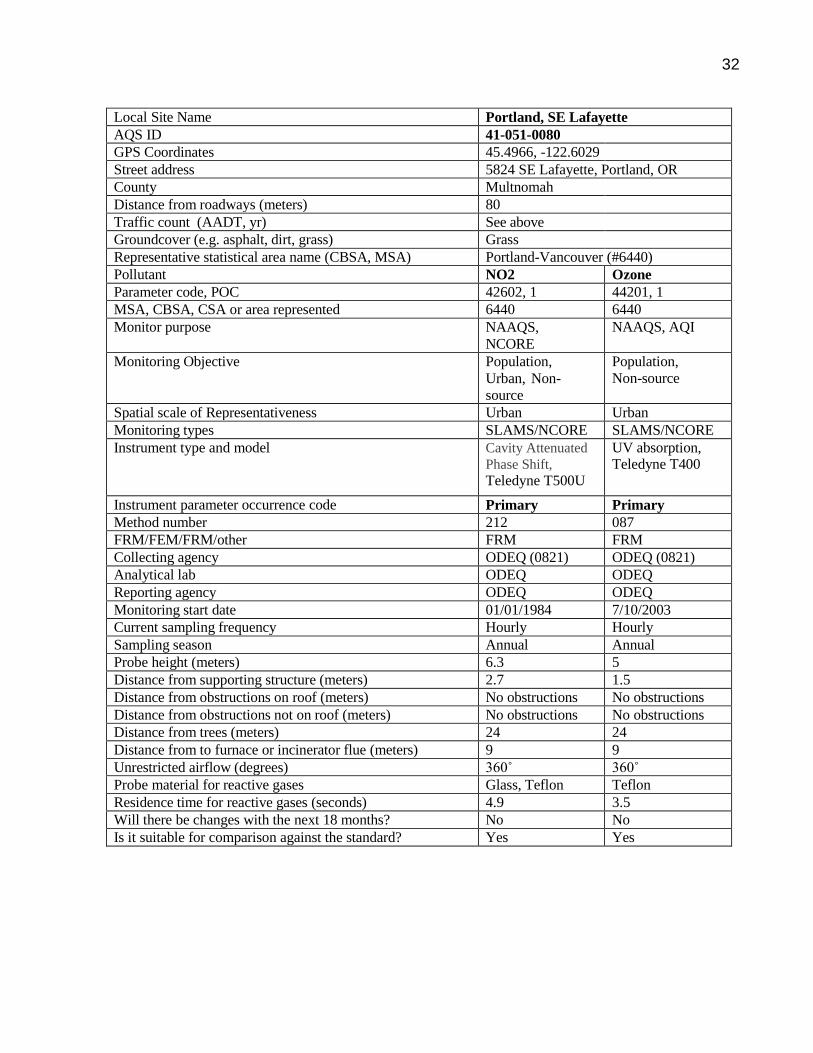
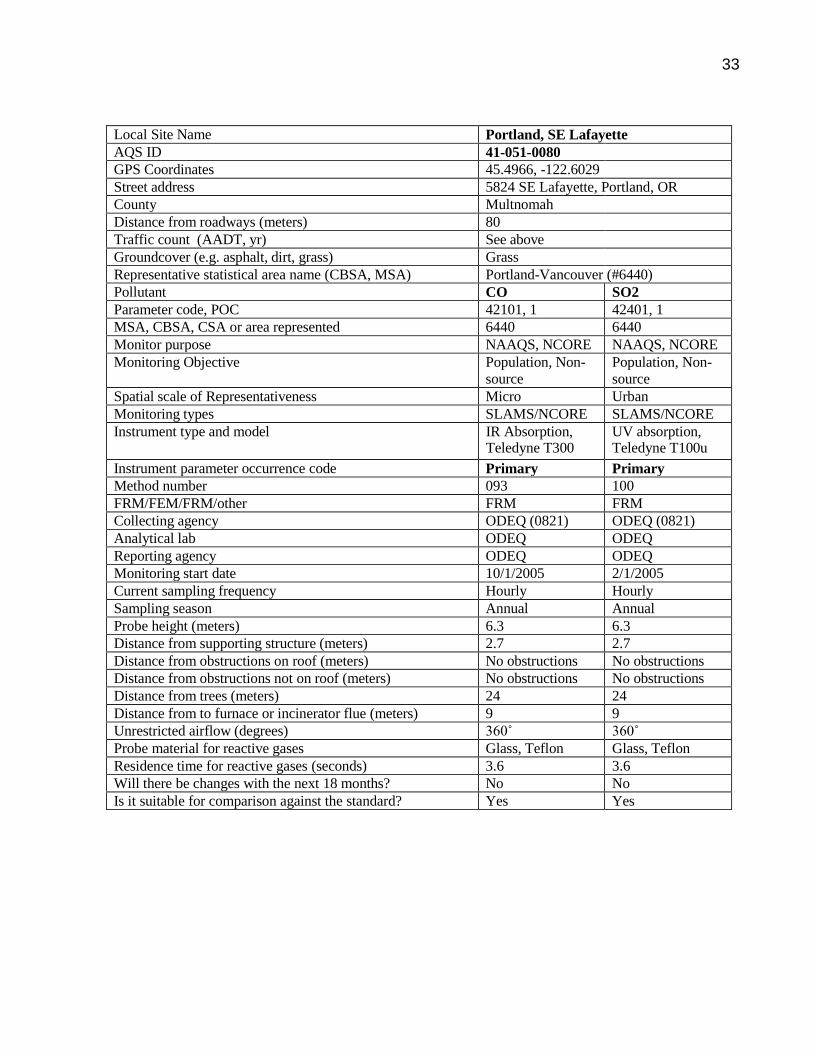
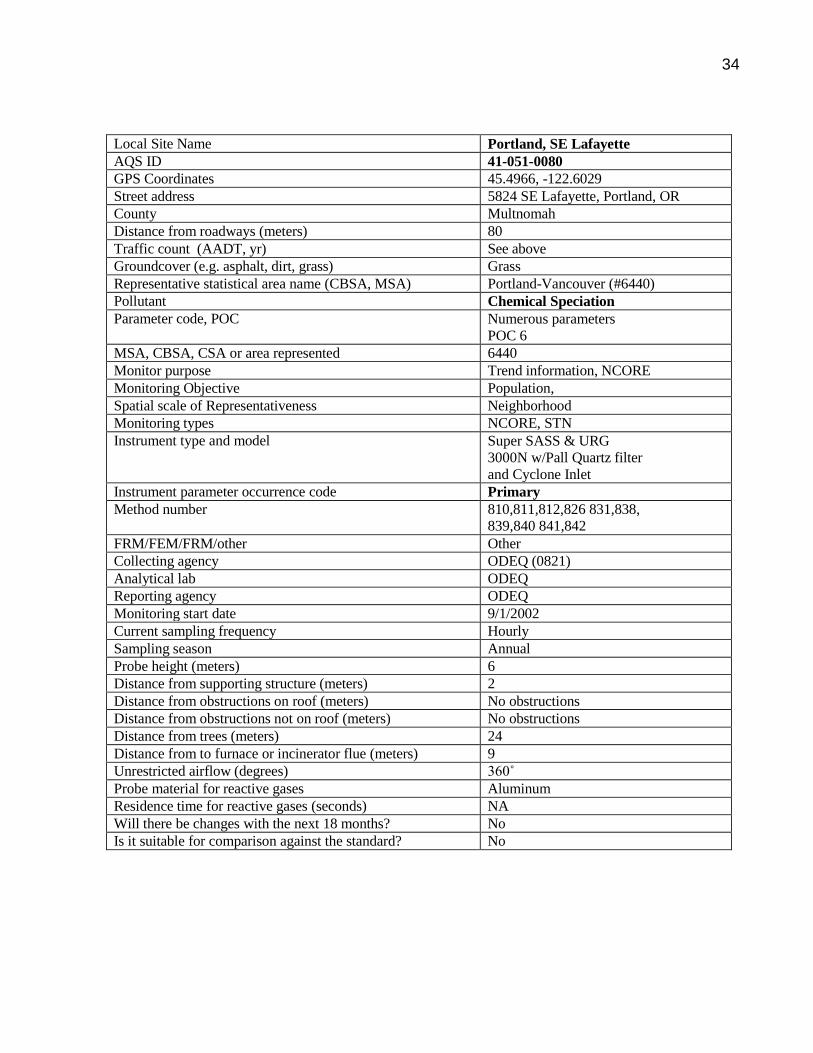
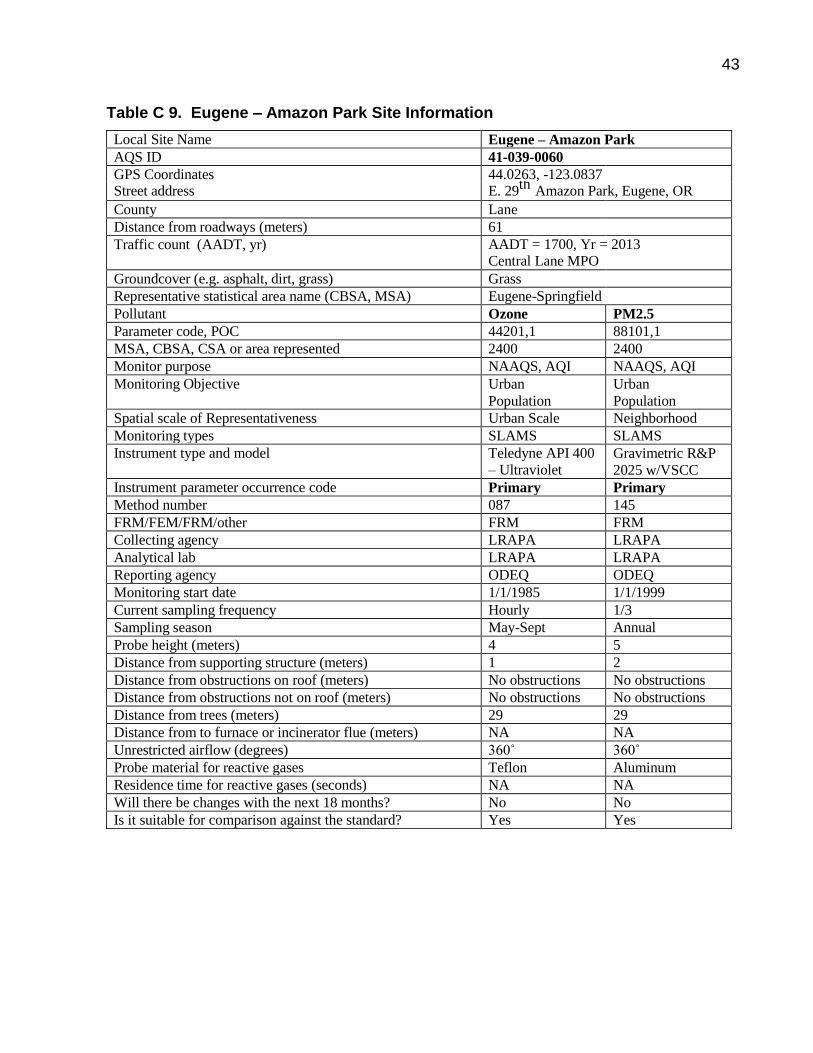
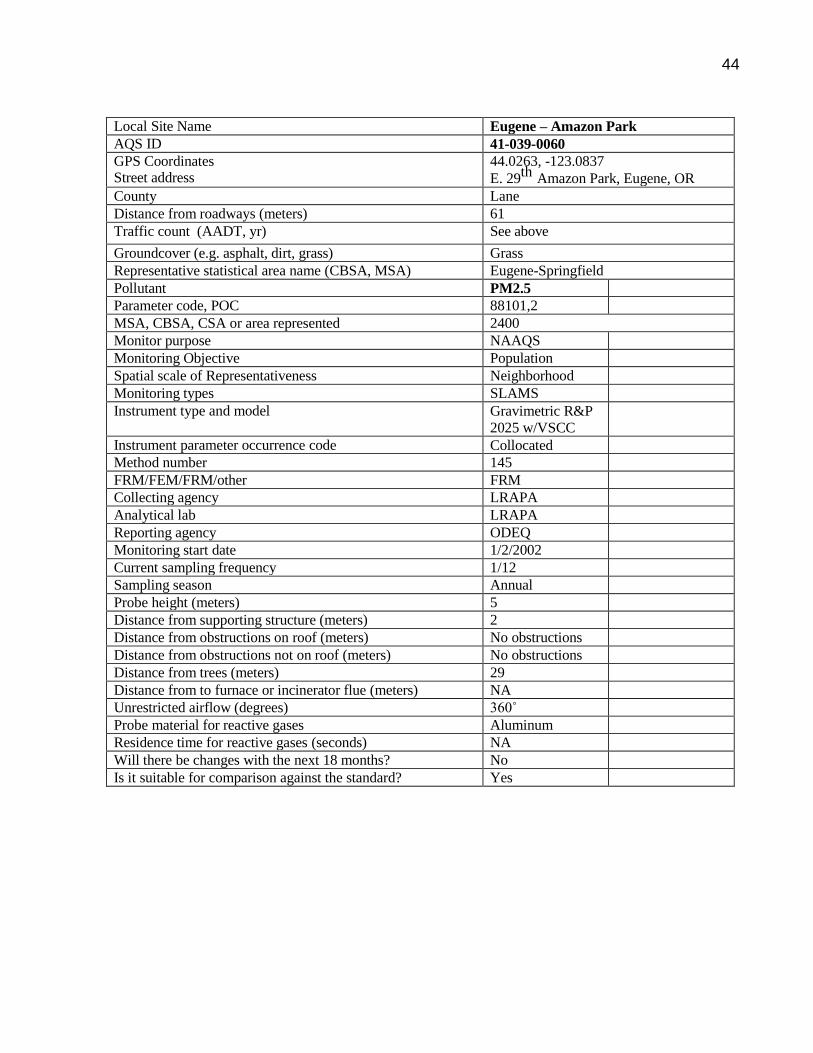
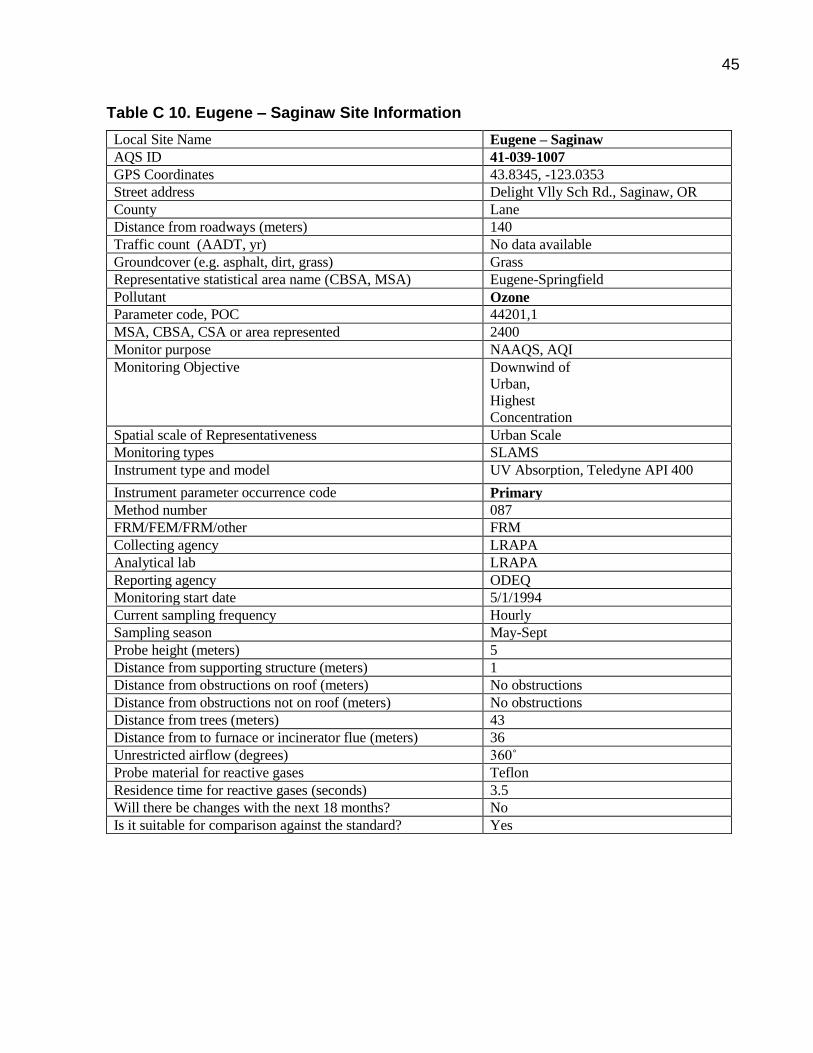
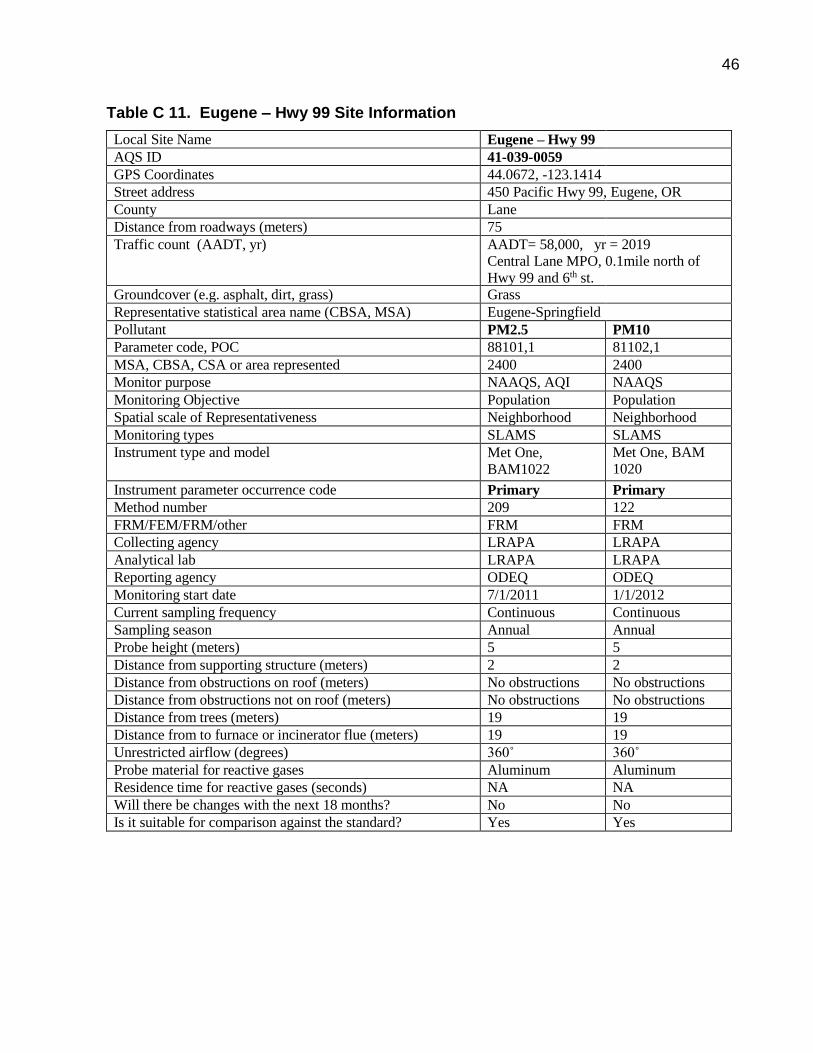
Appendix C. Detailed Site Information
This appendix present detailed site information required by 40CFR Part 58.
Table C 1. Portland, SE Lafayette Site Information
Local Site Name Portland, SE Lafayette
AQS ID 41-051-0080
GPS Coordinates 45.4966, -122.6029
Street address 5824 SE Lafayette, Portland, OR
County Multnomah
Distance from roadways (meters) 80
Traffic count (AADT, yr) SE Powell Blvd @ 79th Ave. AADT = 28,416, Yr= 2018 west, 2019 East - PBOT
Groundcover (e.g. asphalt, dirt, grass) Grass
Representative statistical area name (CBSA, MSA,) Portland-Vancouver (#6440)
Pollutant PM2.5 PM10
Parameter code, POC 88101,1 85101,1 & 81102,1
MSA, CBSA, CSA or area represented 6440 6440
Monitor purpose NAAQS, NCORE, AQI NAAQS, NCORE
Monitoring Objective Population,
Non-source
Population,
Non-source
Spatial scale of Representativeness Neighborhood Neighborhood
Monitoring types SLAMS/NCORE SLAMS/NCORE
Instrument type and model Gravimetric, R&P 2025 w/VSCC
Distance from obstructions on roof (meters) No obstructions No obstructions
Distance from obstructions not on roof (meters) No obstructions No obstructions
Distance from trees (meters) 35 35
Distance from to furnace or incinerator flue (meters) 58 58
Unrestricted airflow (degrees) 360˚ 360˚
Probe material for reactive gases Teflon Glass, Teflon
Residence time for reactive gases (seconds) 7.1 3.7
Will there be changes with the next 18 months? No No
Is it suitable for comparison against the standard? Yes Yes
38
Table C 4. Hillsboro, Hare Field Site Information
Local Site Name Hillsboro, Hare Field AQS ID 41-067-0004 GPS Coordinates 45.5285, -
122.9724
Street address 1151 NE Grant St, Hillsboro, OR County Washington Distance from roadways (meters) 88 Traffic count (AADT, yr) AADT = 24,580 (Cornell & Grant),
Yr 2/28/2019 = 2015 (5/26/2013) WA Co. Groundcover (e.g. asphalt, dirt, grass) Asphalt
Representative statistical area name (CBSA, MSA) Portland-Vancouver (#6440) Pollutant PM2.5 PM2.5 Parameter code, POC 88101,1 88101,2
MSA, CBSA, CSA or area represented 6440 6440 Monitor purpose NAAQS, AQI NAAQS Co-
locate Monitoring Objective Population Population, Spatial scale of Representativeness Neighborhood Neighborhood Monitoring types SLAMS SLAMS Instrument type and model Gravimetric, R&P
2025 w/VSCC Gravimetric, R&P 2025 w/VSCC
Instrument parameter occurrence code Primary Collocate Method number 145 145
FRM/FEM/FRM/other FRM FRM Collecting agency ODEQ (0821) ODEQ (0821) Analytical lab ODEQ ODEQ Reporting agency ODEQ ODEQ Monitoring start date 1/28/2005 1/28/2005 Current sampling frequency 1/3 1/12 Sampling season Annual Annual Probe height (meters) 2 2 Distance from supporting structure (meters) No supports No supports Distance from obstructions on roof (meters) No obstructions No obstructions Distance from obstructions not on roof (meters) No obstructions No obstructions Distance from trees (meters) 125 125 Distance from to furnace or incinerator flue (meters) 150 150 Unrestricted airflow (degrees) 360˚ 360˚ Probe material for reactive gases Aluminum Aluminum Residence time for reactive gases (seconds) NA NA Will there be changes with the next 18 months? No No Is it suitable for comparison against the standard? Yes Yes
39
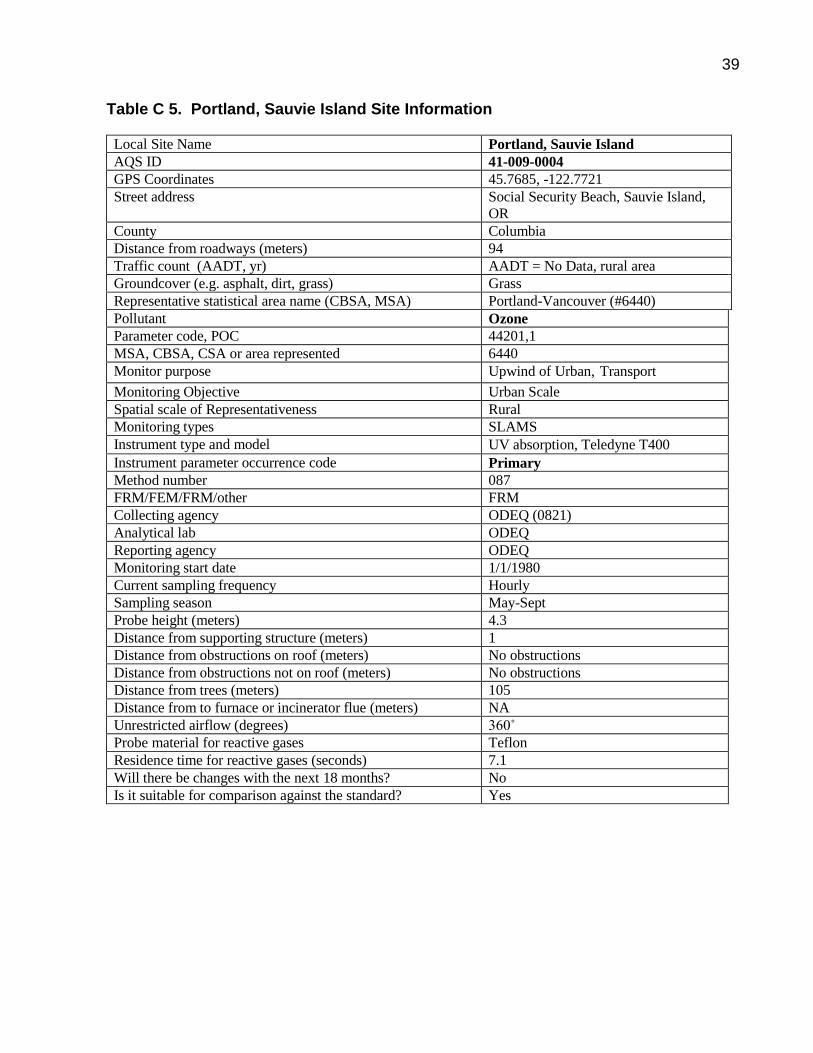
Table C 5. Portland, Sauvie Island Site Information
Local Site Name Portland, Sauvie Island
AQS ID 41-009-0004
GPS Coordinates 45.7685, -122.7721
Street address Social Security Beach, Sauvie Island,
OR
County Columbia Distance from roadways (meters) 94 Traffic count (AADT, yr) AADT = No Data, rural area
Groundcover (e.g. asphalt, dirt, grass) Grass Representative statistical area name (CBSA, MSA) Portland-Vancouver (#6440)
Pollutant Ozone
Parameter code, POC 44201,1
MSA, CBSA, CSA or area represented 6440
Monitor purpose Upwind of Urban, Transport
Monitoring Objective Urban Scale
Spatial scale of Representativeness Rural
Monitoring types SLAMS
Instrument type and model UV absorption, Teledyne T400
Instrument parameter occurrence code Primary
Method number 087
FRM/FEM/FRM/other FRM
Collecting agency ODEQ (0821)
Analytical lab ODEQ
Reporting agency ODEQ
Monitoring start date 1/1/1980
Current sampling frequency Hourly
Sampling season May-Sept
Probe height (meters) 4.3
Distance from supporting structure (meters) 1
Distance from obstructions on roof (meters) No obstructions
Distance from obstructions not on roof (meters) No obstructions
Distance from trees (meters) 105
Distance from to furnace or incinerator flue (meters) NA
Unrestricted airflow (degrees) 360˚
Probe material for reactive gases Teflon
Residence time for reactive gases (seconds) 7.1
Will there be changes with the next 18 months? No
Is it suitable for comparison against the standard? Yes
40
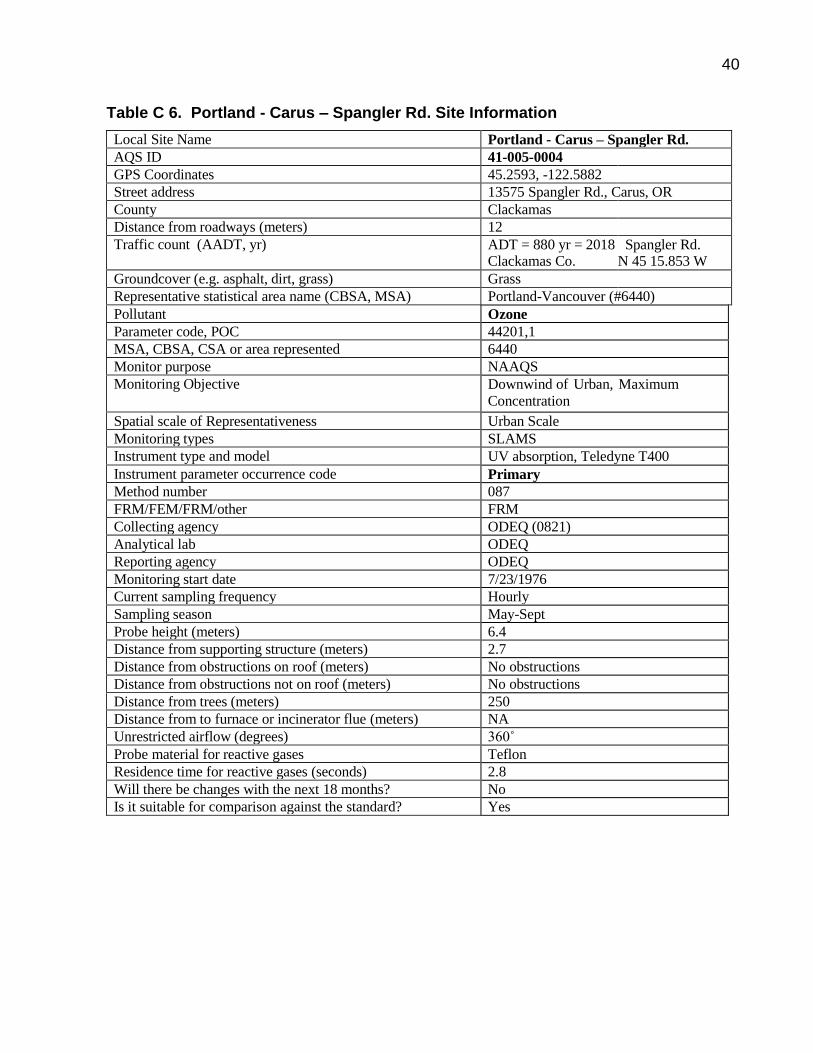
Table C 6. Portland - Carus – Spangler Rd. Site Information
Local Site Name Portland - Carus – Spangler Rd.
AQS ID 41-005-0004
GPS Coordinates 45.2593, -122.5882 Street address 13575 Spangler Rd., Carus, OR
County Clackamas Distance from roadways (meters) 12 Traffic count (AADT, yr) ADT = 880 yr = 2018
Clackamas Co. Spangler Rd. N 45 15.853 W 122 31.227 Groundcover (e.g. asphalt, dirt, grass) Grass
Representative statistical area name (CBSA, MSA) Portland-Vancouver (#6440)
Pollutant Ozone
Parameter code, POC 44201,1
MSA, CBSA, CSA or area represented 6440
Monitor purpose NAAQS
Monitoring Objective Downwind of Urban, Maximum
Concentration
Spatial scale of Representativeness Urban Scale
Monitoring types SLAMS
Instrument type and model UV absorption, Teledyne T400
Instrument parameter occurrence code Primary
Method number 087
FRM/FEM/FRM/other FRM
Collecting agency ODEQ (0821)
Analytical lab ODEQ
Reporting agency ODEQ
Monitoring start date 7/23/1976
Current sampling frequency Hourly
Sampling season May-Sept
Probe height (meters) 6.4
Distance from supporting structure (meters) 2.7
Distance from obstructions on roof (meters) No obstructions
Distance from obstructions not on roof (meters) No obstructions
Distance from trees (meters) 250
Distance from to furnace or incinerator flue (meters) NA
Unrestricted airflow (degrees) 360˚
Probe material for reactive gases Teflon
Residence time for reactive gases (seconds) 2.8
Will there be changes with the next 18 months? No
Is it suitable for comparison against the standard? Yes
41
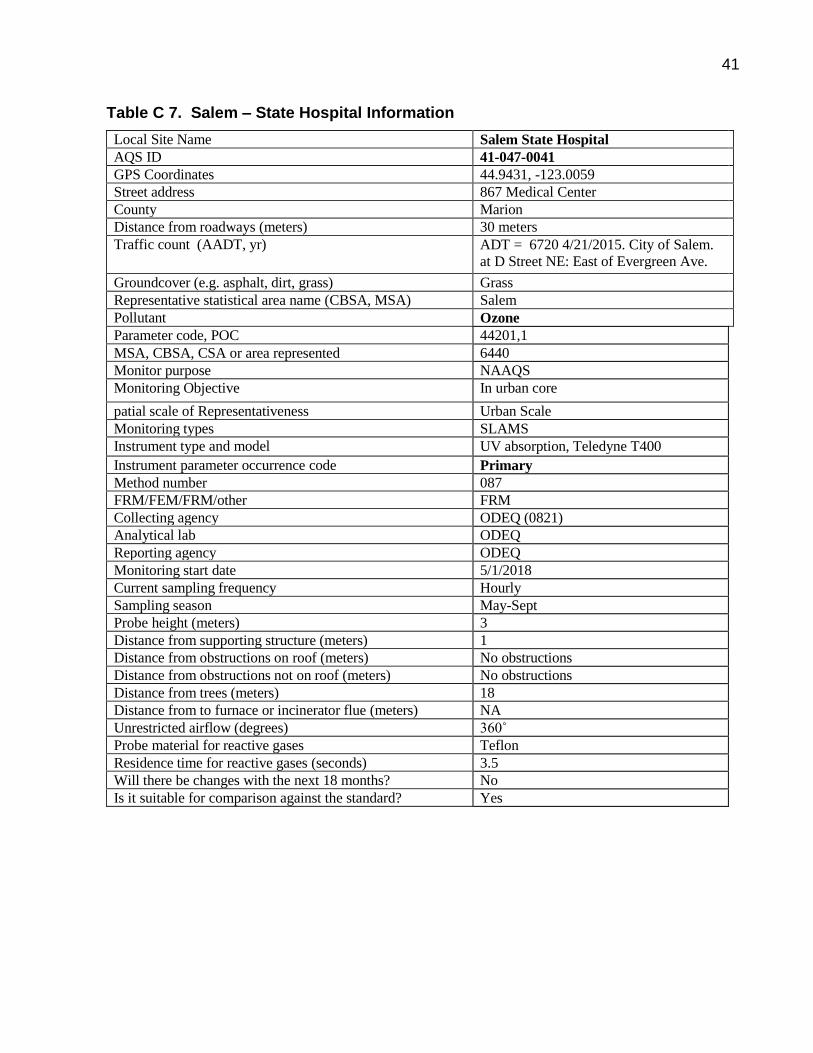
Table C 7. Salem – State Hospital Information
Local Site Name Salem State Hospital
AQS ID 41-047-0041
GPS Coordinates 44.9431, -123.0059 Street address 867 Medical Center
County Marion Distance from roadways (meters) 30 meters Traffic count (AADT, yr) ADT = 6720 4/21/2015. City of Salem.
at D Street NE: East of Evergreen Ave.
Groundcover (e.g. asphalt, dirt, grass) Grass
Representative statistical area name (CBSA, MSA) Salem
Pollutant Ozone
Parameter code, POC 44201,1
MSA, CBSA, CSA or area represented 6440
Monitor purpose NAAQS
Monitoring Objective In urban core
patial scale of Representativeness Urban Scale
Monitoring types SLAMS
Instrument type and model UV absorption, Teledyne T400
Instrument parameter occurrence code Primary
Method number 087
FRM/FEM/FRM/other FRM
Collecting agency ODEQ (0821)
Analytical lab ODEQ
Reporting agency ODEQ
Monitoring start date 5/1/2018
Current sampling frequency Hourly
Sampling season May-Sept
Probe height (meters) 3
Distance from supporting structure (meters) 1
Distance from obstructions on roof (meters) No obstructions
Distance from obstructions not on roof (meters) No obstructions
Distance from trees (meters) 18
Distance from to furnace or incinerator flue (meters) NA
Unrestricted airflow (degrees) 360˚
Probe material for reactive gases Teflon
Residence time for reactive gases (seconds) 3.5
Will there be changes with the next 18 months? No
Is it suitable for comparison against the standard? Yes
42
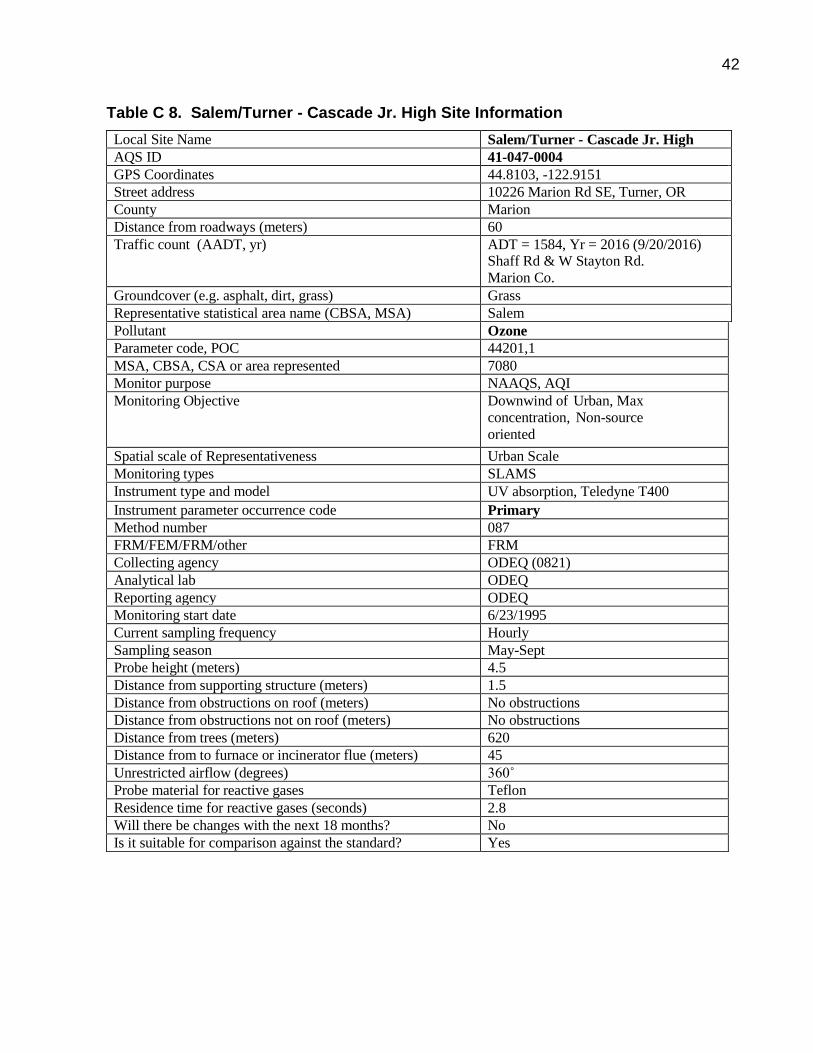
Table C 8. Salem/Turner - Cascade Jr. High Site Information
Local Site Name Salem/Turner - Cascade Jr. High
AQS ID 41-047-0004
GPS Coordinates 44.8103, -122.9151 Street address 10226 Marion Rd SE, Turner, OR
County Marion Distance from roadways (meters) 60 Traffic count (AADT, yr) ADT = 1584, Yr = 2016 (9/20/2016)
Shaff Rd & W Stayton Rd.
Marion Co.
Groundcover (e.g. asphalt, dirt, grass) Grass Representative statistical area name (CBSA, MSA) Salem Pollutant Ozone
Parameter code, POC 44201,1
MSA, CBSA, CSA or area represented 7080
Monitor purpose NAAQS, AQI
Monitoring Objective Downwind of Urban, Max
concentration, Non-source
oriented
Spatial scale of Representativeness Urban Scale
Monitoring types SLAMS
Instrument type and model UV absorption, Teledyne T400
Instrument parameter occurrence code Primary
Method number 087
FRM/FEM/FRM/other FRM
Collecting agency ODEQ (0821)
Analytical lab ODEQ
Reporting agency ODEQ
Monitoring start date 6/23/1995
Current sampling frequency Hourly
Sampling season May-Sept
Probe height (meters) 4.5
Distance from supporting structure (meters) 1.5
Distance from obstructions on roof (meters) No obstructions
Distance from obstructions not on roof (meters) No obstructions
Distance from trees (meters) 620
Distance from to furnace or incinerator flue (meters) 45
Unrestricted airflow (degrees) 360˚
Probe material for reactive gases Teflon
Residence time for reactive gases (seconds) 2.8
Will there be changes with the next 18 months? No
Is it suitable for comparison against the standard? Yes
43
Table C 9. Eugene – Amazon Park Site Information
Local Site Name Eugene – Amazon Park
AQS ID 41-039-0060 GPS Coordinates 44.0263, -123.0837 Street address E. 29
th Amazon Park, Eugene, OR
County Lane Distance from roadways (meters) 61
Traffic count (AADT, yr) AADT = 1700, Yr = 2013 Central Lane MPO
Groundcover (e.g. asphalt, dirt, grass) Grass Representative statistical area name (CBSA, MSA) Eugene-Springfield
Pollutant Ozone PM2.5
Parameter code, POC 44201,1 88101,1
MSA, CBSA, CSA or area represented 2400 2400
Monitor purpose NAAQS, AQI NAAQS, AQI
Monitoring Objective Urban
Population
Urban
Population
Spatial scale of Representativeness Urban Scale Neighborhood
4.2 2011 - Klamath Falls PM10, Grants Pass PM10, and Medford CO Monitoring Waiver Request
and Approval
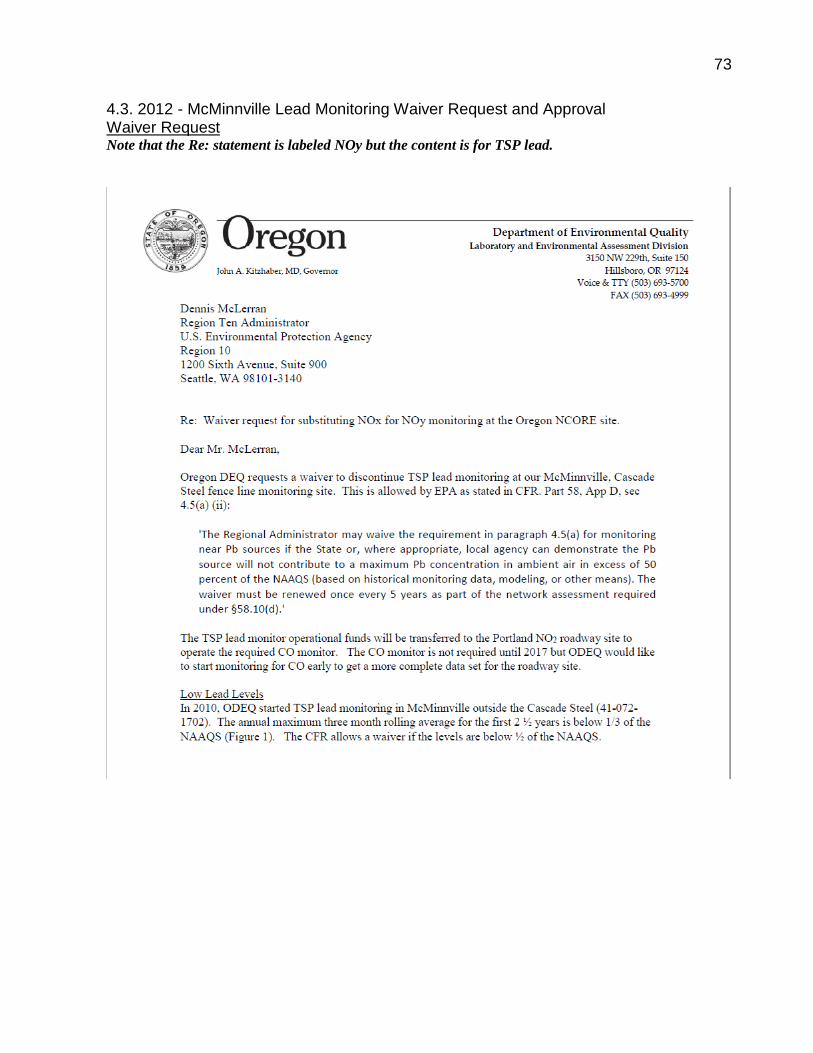
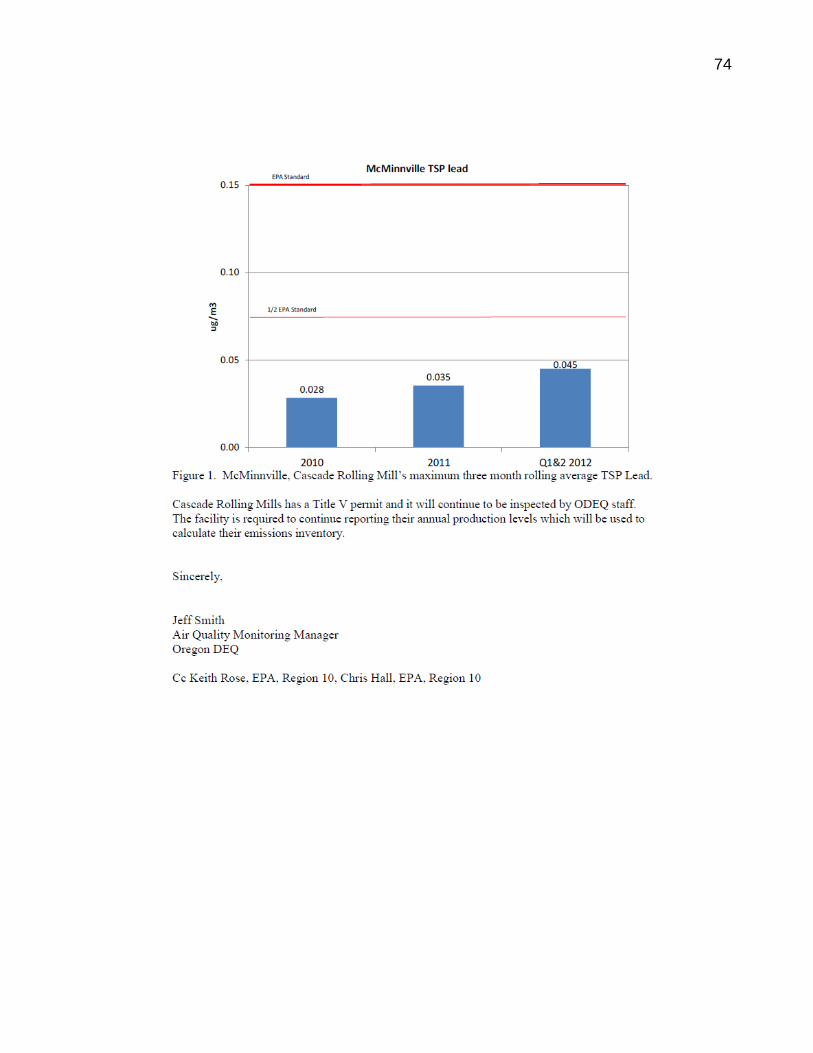
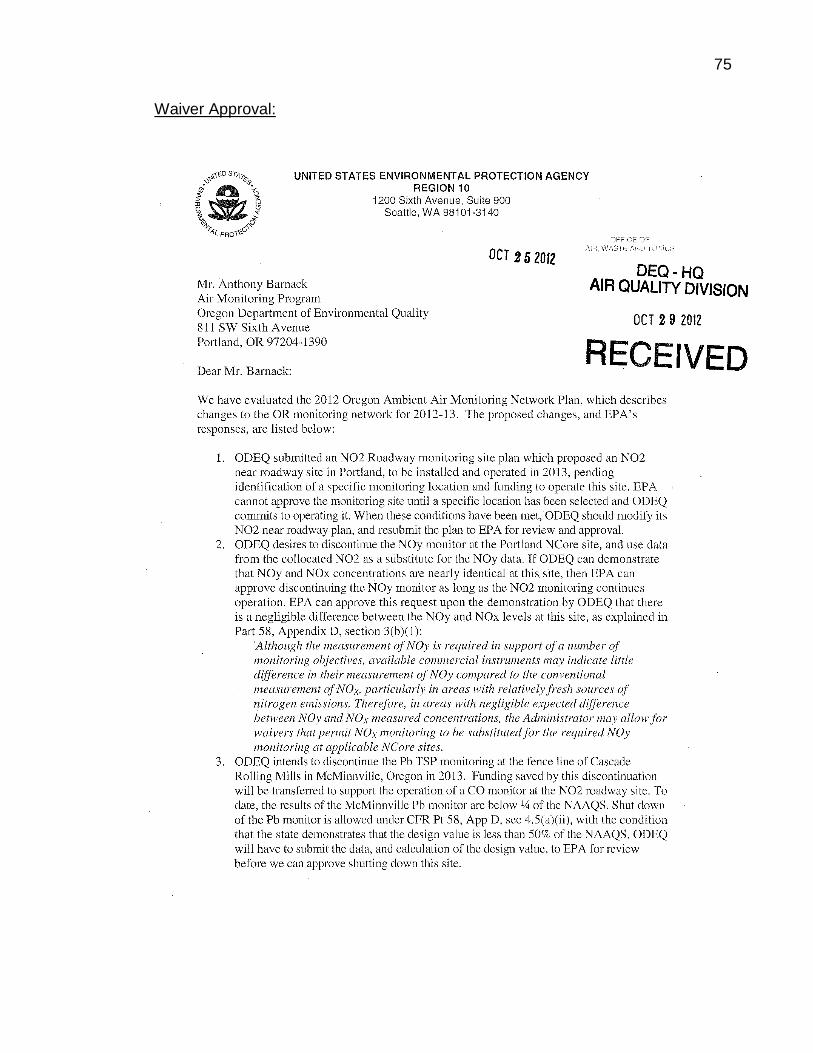
4.3 2012 - McMinnville Lead Monitoring Waiver Request and Approval
4.4 2012 - NCORE NOy Monitoring Waiver Request and Approval
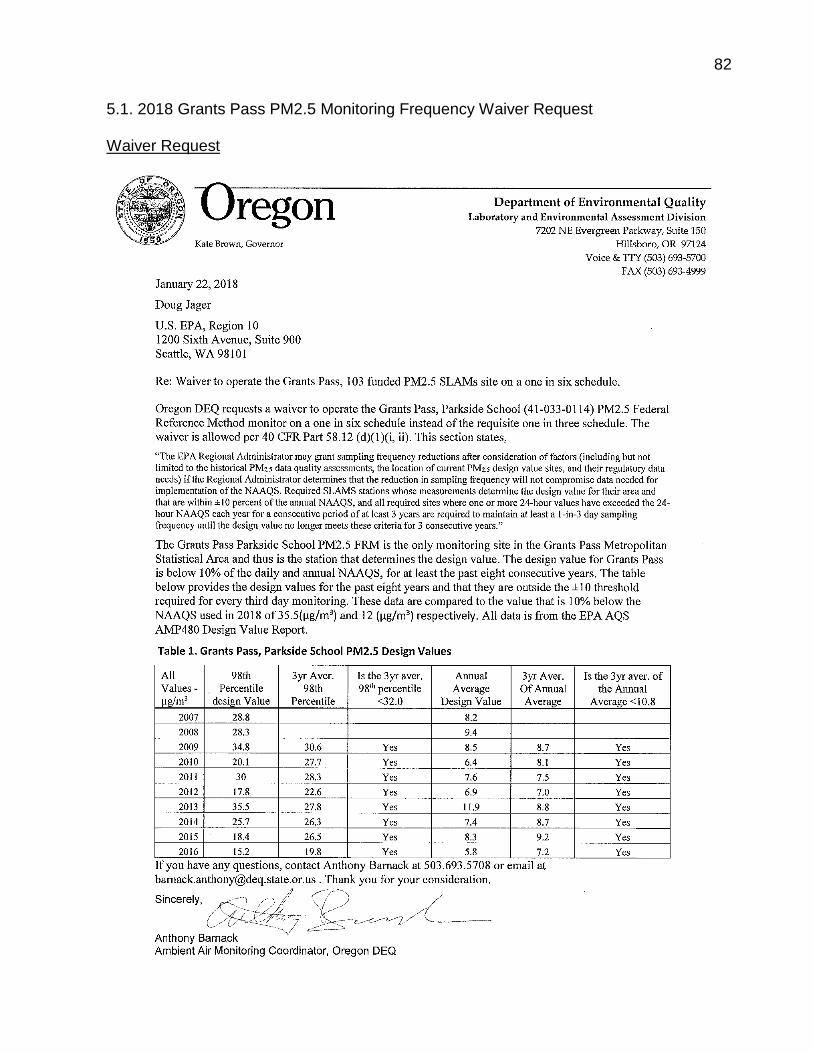
5. New Monitoring Waiver Request
69
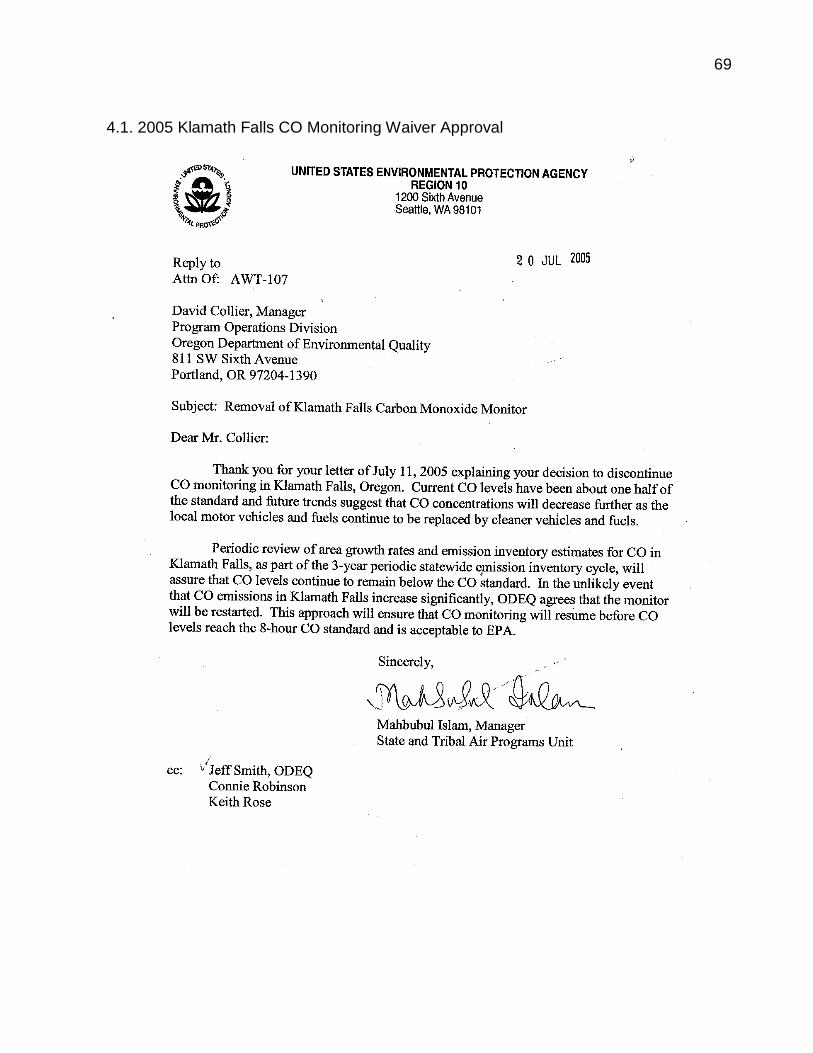
4.1. 2005 Klamath Falls CO Monitoring Waiver Approval
70
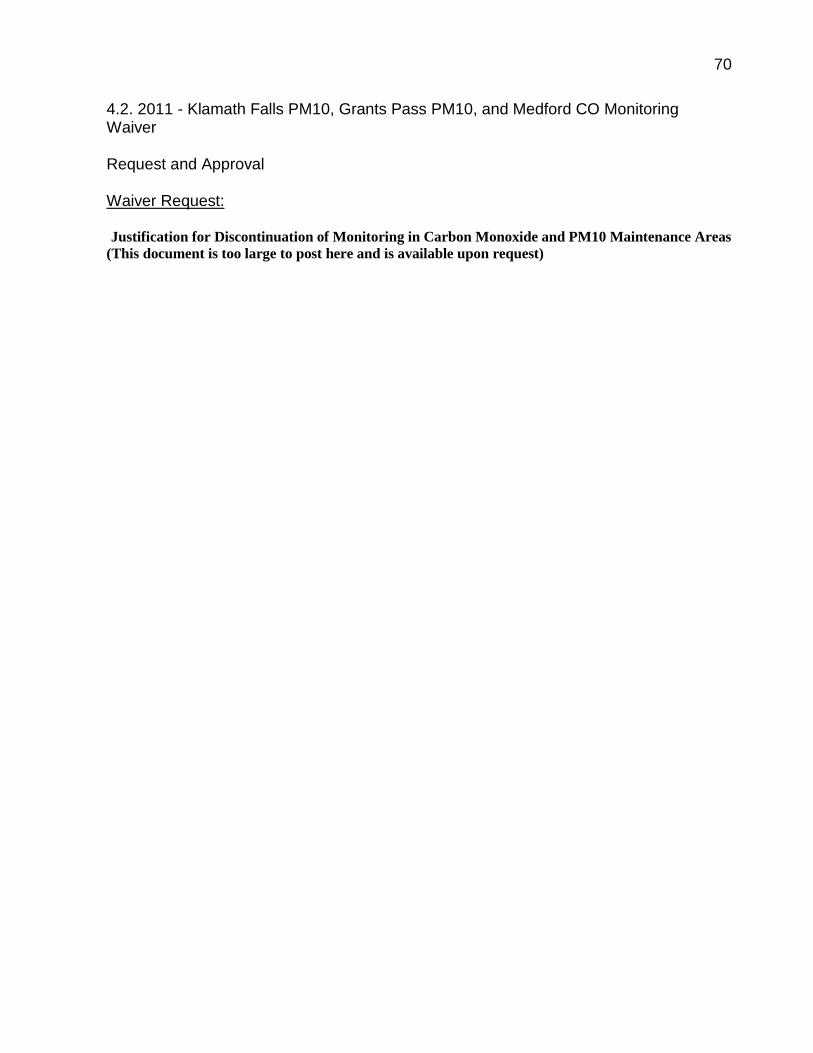
4.2. 2011 - Klamath Falls PM10, Grants Pass PM10, and Medford CO Monitoring Waiver Request and Approval Waiver Request: Justification for Discontinuation of Monitoring in Carbon Monoxide and PM10 Maintenance Areas (This document is too large to post here and is available upon request)
71
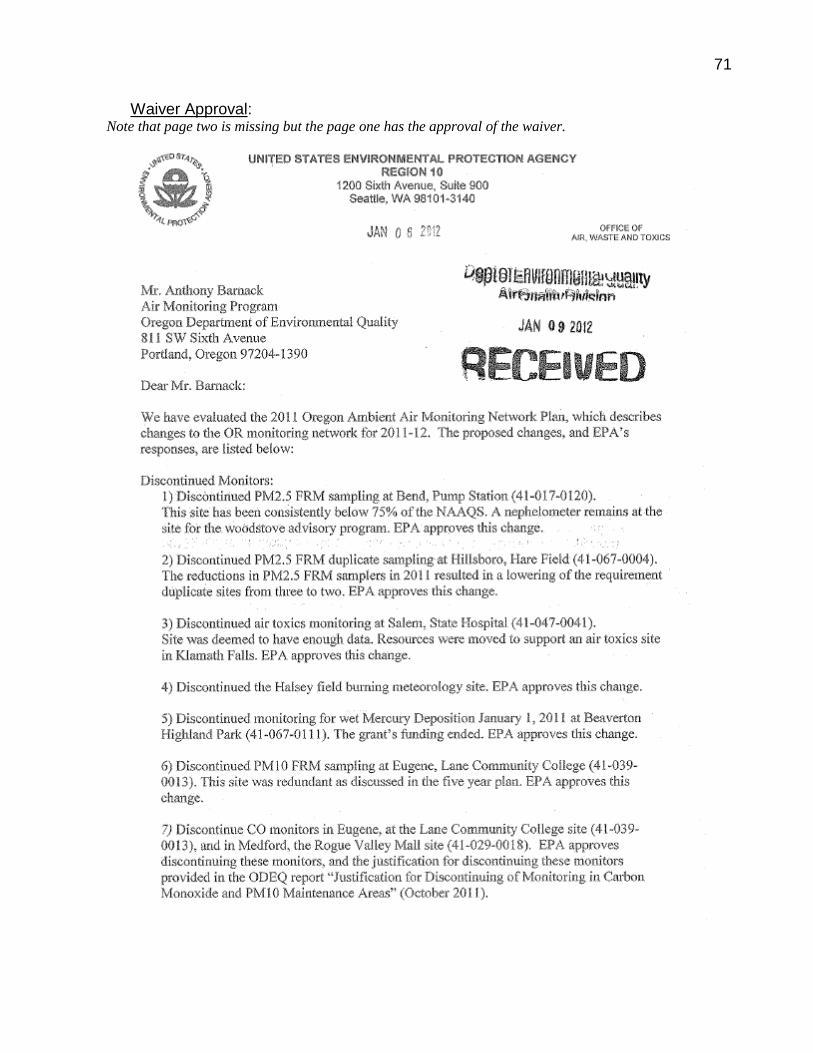
Waiver Approval: Note that page two is missing but the page one has the approval of the waiver.
72
73
4.3. 2012 - McMinnville Lead Monitoring Waiver Request and Approval Waiver Request Note that the Re: statement is labeled NOy but the content is for TSP lead.