Page 1
Crofton High School Anne Arundel County, Maryland
December 22, 2016
Traffic Impact Analysis
Prepared for:
MK Consulting Engineers, LLC Mr. Nick Wilson
301 Central Avenue
Glyndon, MD 21071
(410) 458-8464
[email protected]
Page 2
TABLE OF CONTENTS
• INTRODUCTION and SUMMARY OF FINDINGS ......................................................... 1
• EXISTING TRAFFIC CONDITIONS ................................................................................ 4
1 Location Map of Study Intersections ...................................................................... 7
2 Site Plan................................................................................................................... 8
3 Existing Lane Use .................................................................................................... 9
4 Existing Peak Hour Traffic Volumes ...................................................................... 10
• BACKGROUND TRAFFIC CONDITIONS ..................................................................... 11
5 Location Map of Background Developments ....................................................... 13
6 Trip Generation for Background Developments ................................................... 14
7 Combined Trip Assignment Generated by Background Developments ............... 15
8 Background Peak Hour Traffic Volumes ............................................................... 16
• TOTAL TRAFFIC CONDITIONS .................................................................................. 17
9 Trip Generation for Subject Site ........................................................................... 20
10 Trip Assignment for Subject Site ........................................................................... 21
11 Total Peak Hour Traffic Volumes .......................................................................... 22
12 Results of Intersection Capacity Analyses ............................................................ 23
13 Results of Intersection Capacity Analysis for MD 424 and School Main Access .. 24
14 Signal Warrant Analysis Warrant 3 – Peak Hour .................................................. 25
15 Future Lane Use .................................................................................................... 26
• RESULTS, RECOMMENDATIONS, AND CONCLUSIONS .............................................. 27
Page 4
INTRODUCTION AND SUMMARY OF FINDINGS
Study Purpose
The Traffic Group, Inc. has prepared this Traffic Impact Analysis to quantify the
effect the proposed development of Crofton High School will have on the
surrounding road network in the Crofton section of Anne Arundel County. This
site is located on the east side of MD 424 (Davidsonville Road) within the existing
Crofton Middle School site, north of Underwood Road. In addition to the
operational middle school, a wooded area of Crofton Park sits on the site. The
proposed plan includes the development of a high school with the capacity of up
to 1,700 students. Access to the facility is proposed via the existing access point
that currently serves Crofton Park on MD 424 and at a fourth leg to the
roundabout at the intersection of Underwood Road at Mt. Tabor Road. The
existing access point to Crofton Middle School along MD 424 will serve as the
high school’s bus access.
Study Criteria/Methodology
This Traffic Impact Analysis was conducted in accordance with the methodology
set forth by Anne Arundel County and the Maryland State Highway
Administration (SHA). Since this is a Board of Education (BOE) project, it is
exempt from Anne Arundel County’s Adequate Public Facilities Ordinance
requirements. Access to a state road, however, will be intensified and the
subject site will generate more than 50 peak hour trips, a Traffic Impact Study is
required to satisfy SHA criteria. All site access intersections and the nearest
signalized intersection in each direction from the state-maintained roadway are
analyzed. Critical Lane Volume (CLV) methodology is utilized as required by SHA.
A meeting was held with representatives from BOE, SHA, and Anne Arundel
County on November 15, 2016 to discuss the site and routing of traffic. Minutes
from the meeting can be found in Appendix A. All issues raised at the meeting
are addressed within this document.
1
Page 5
Scope of Services
The Principal Scope of Services undertaken as part of the study was as follows:
� Conduct a field inspection to collect physical information concerning the
nearby road system, including the compilation of aerial photography at
each of the key intersections.
� Collect intersection turning movement counts at each of the study
intersections during the morning and afternoon peak periods.
� Review Anne Arundel County’s Development Activity Maps to determine
impact that previously approved developments will have on the study
intersections.
� Prepare Trip Generation and Trip Distribution for Crofton High School and
each approved background development based on the Institute of
Transportation Engineers (ITE) Trip Generation (9th
Edition).
� Undertake Intersection Capacity Analysis using CLV methodology to
quantify existing background and total levels of service.
� Provide an overall assessment of traffic conditions.
Summary of Findings and Recommendations
This analysis will show that the proposed development of Crofton High School
will have a minimal impact to surrounding intersection operations during school
peak times. All intersections within the study area currently operate at Level of
Service “A” conditions during both the morning and school afternoon peak
period. With the addition of the proposed high school, each intersection is
proposed to maintain acceptable operations without the need for improvements
from a capacity standpoint.
In order to comply with SHA requirements, however, improvements are
recommended to the site access point along MD 424. Specifically, a separate left
turn lane is recommended in addition to widening of the access road to provide
a separate left turn and right turn lane. The introduction of these improvements
would permit safe, efficient access to the road system. During school arrival and
dismissal times, however, a high level of delay is projected for the main access.
The access point should feature separate left and right turn lanes to facilitate a
more efficient exit from the site. Traffic signalization should also be considered,
2
Page 6
though it would only be needed for a brief time during morning arrival and
afternoon dismissal. The installation of signalization may be preferable to police
control, although SHA will ultimately approve traffic control at this location.
The data and methodology used to undertake the study is detailed in the
sections below.
3
Page 7
EXISTING TRAFFIC CONDITIONS
Site Information
The proposed Crofton High School site is located within the existing
Crofton Park/Crofton Middle School complex located on the east side of MD 424,
north of Underwood Road in the Crofton section of Anne Arundel County. A
map detailing the location can be found in Exhibit 1.
With the development of this site, the existing middle school will remain
operational. The Master Plan for the site, however, shows the redevelopment of
the middle school to the north within the same property. This analysis is for the
development of the high school only. The future Master Plan is included for
reference purposes only. Exhibit 2 contains the Concept Site Plan.
Access to the property is currently available via two points along MD 424. One
access point serves the existing middle school facility, and one access point
serves Crofton Park. The Crofton Park access point would be converted to serve
as an access point for the proposed high school. At the middle school access,
only busses will be permitted for Crofton High School. The final existing access
point provides ingress and egress to Crofton Middle School. Along Underwood
Drive, access is also proposed at the roundabout at Mt. Tabor Road.
Study Area
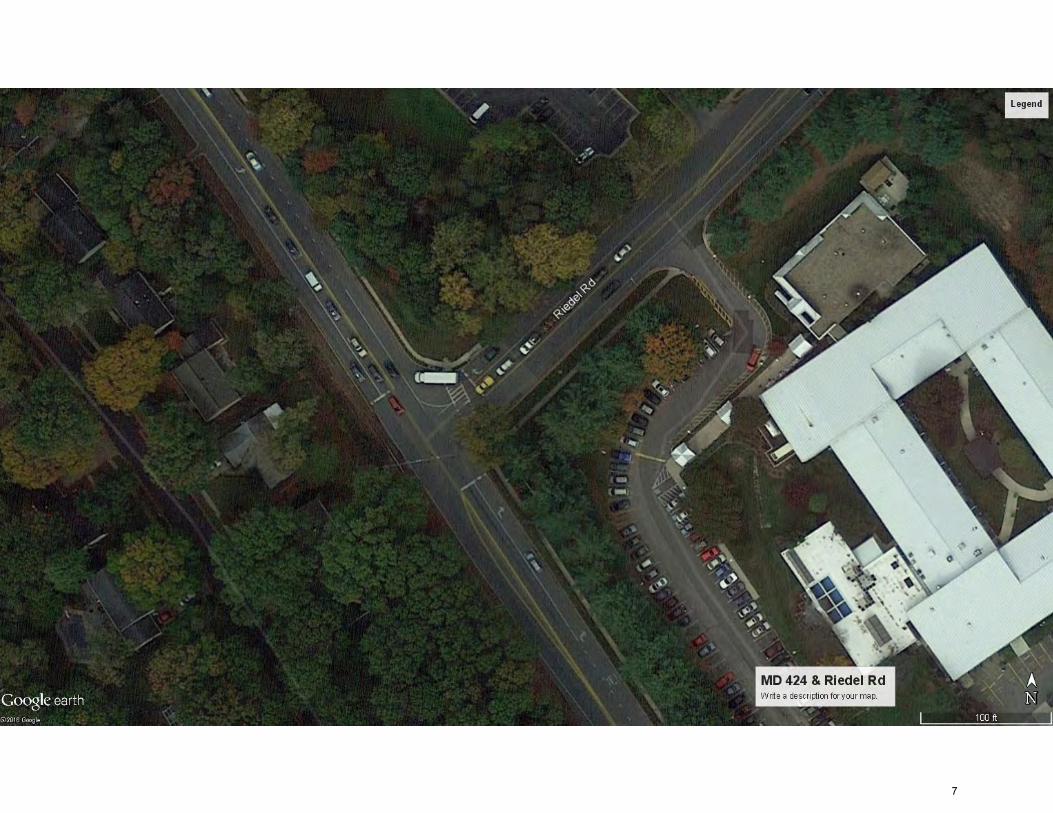
Based on the location of the subject sites and the signalized intersections, the
following locations were included as part of this study.
� MD 424 at Riedel Road
� MD 424 at Layton Street
� MD 424 at Pleasant Meadow Road
� MD 424 at Underwood Road/Cardinal Crest Drive
� MD 424 at MD 450
� Underwood Road at Mt. Tabor Road
MD 424 traverses Anne Arundel County in the north/south direction for a total
of 8.24 miles from MD 214 to MD 3. In the vicinity of the subject site the
roadway features one travel lane in each direction. The posted speed limit is
35 MPH.
4
Page 8
SHA classifies MD 424 as secondary road on the state system with the functional
classification of Urban Other Principal Arterial. There are no access controls
along this segment of road.
Within the study area there are signalized intersections to the north and south
along MD 424 at Riedel Road, Underwood Road, and MD 450. Auxiliary lanes are
located at each of these intersections to facilitate left turns. There are no
separate right turn lanes in the northbound direction along MD 424 at 450 and
Underwood Road.
Along site frontage, sidewalk is generally available from Underwood Road,
northerly to and beyond the edge of the park. Similarly, a sidewalk is also
available on the west side of MD 424 to the south of Layton Street. There is a
mid-block crossing located across MD 424 on the south side of Layton Street.
There are no existing pedestrian accommodations at any of the signalized
intersections within the study area.
Underwood Road features one travel lane in each direction. The roadway
extends from just north of MD 450 (with no intersection), northerly to
Johns Hopkins Road. There is one travel lane in each direction.
At its intersection with Mt. Tabor Road, a one lane roundabout controls traffic.
Anne Arundel County classifies Underwood Road as a Collector Road. This type
of roadway is adequate to provide access to a school facility.
Exhibit 3 has been prepared to detail the existing lane use and traffic control
devices at each of the study intersections. In addition, aerial photography can be
found in Appendix A.
Traffic Volumes
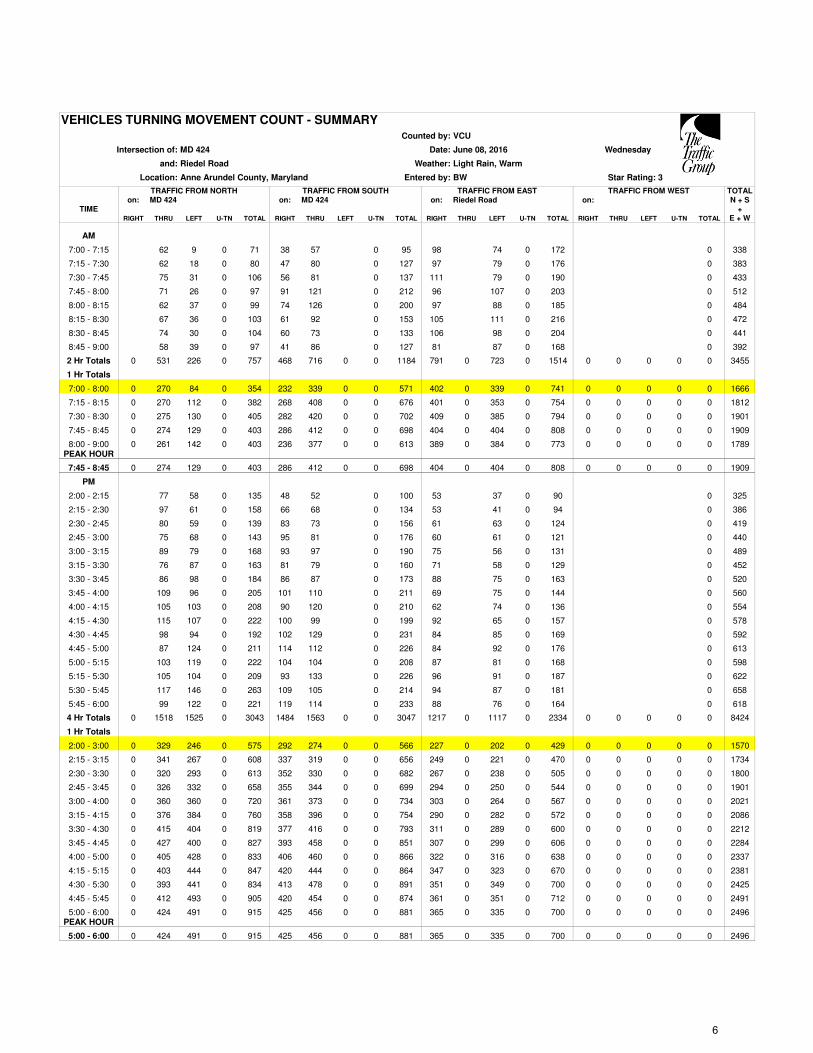
Intersection Turning Movement Counts were collected at each of the study
intersections from 7-9 AM and from 2-6 PM. Public schools were in session at
the time of the traffic counts which were collected in June 2016. All traffic count
data is summarized in Exhibit 4. It is important to recognize that a common peak
hour of 7-8 AM and 2-3 PM was used for each intersection. This peak hour
represents the high school arrival and dismissal time. Complete details on
turning movement counts can be found in Appendix A.
5
Page 9
Analysis of Existing Traffic Conditions
Intersection Capacity Analysis was undertaken for each of the study intersections
using Critical Lane Volume (CLV) methodology. The results are summarized in
Exhibit 12. As shown within Exhibit 12, each intersection currently exhibits
optimal Level of Service “A” conditions during the morning and afternoon peak
periods.
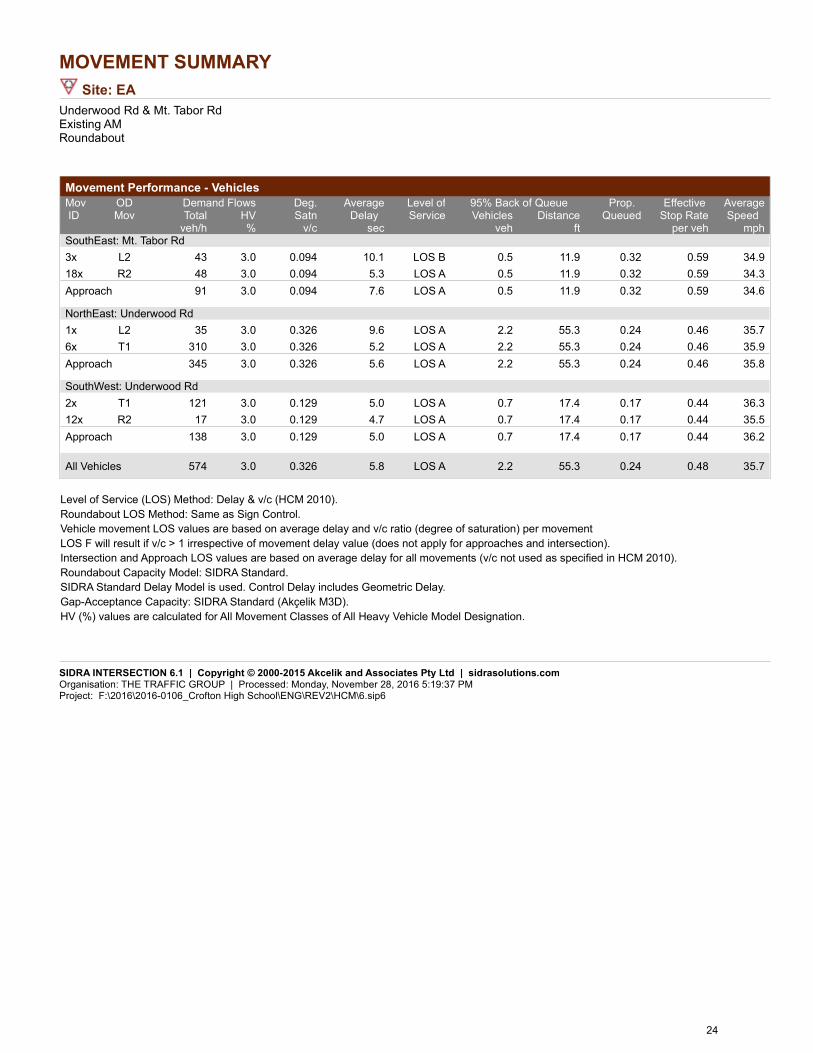
The intersection of Underwood Road and Mt. Tabor Road was analyzed using
Sidra methodology. Sidra is used commonly for roundabout intersections. As
shown within Exhibit 12, the roundabout currently operates at Level of
Service “A” conditions.
Appendix B contains worksheets detailing all of the Capacity Analysis.
6
Page 10
#STUDY INTERSECTION
1
2
4
3
5
6
SITE
EXHIBIT 1LOCATION MAP OF
STUDY INTERSECTIONS
7
8
rh, 160106_crofton high school\rev2\rev2.dwg-loc_st, f11/28/16 7
Page 11
8
rhuang
EXHIBIT 2 SITE PLAN
Page 14
BACKGROUND TRAFFIC CONDITIONS
Design Year
It is anticipated that Crofton High School will be open to students within three
years. Therefore, no growth rate is required to satisfy SHA criteria. Similarly,
Anne Arundel County does not require the use of a growth rate for Traffic Impact
Studies.
Background Traffic
Anne Arundel County’s Development Activity Maps (DAMS) were reviewed to
determine what background developments have been approved in the vicinity of
the subject site. Exhibit 5 shows a map of those developments. They include:
� Staples Corner
� High’s Dairy Store
� Riding at North Branch
� Jorden Farms
� Duckett Farm, Lots 15 and 16
� Gertz, Donald, Roger, and William Property
� Gertz, Alan, and Pamela Property
� Flower Mill, Lots 1, 2, 17
In order to quantify the trips projected to be generated by each of the
background developments, the Institute of Transportation Engineers (ITE) Trip
Generation (9th
Edition) was consulted. Exhibit 6 shows the rates and equations
that were used for each individual development. It is important to recognize
that based on the number of units associated with each residential project, the
rate was selected instead of the equation. This is a result of the high constant
factor provided in the equation which would result in an unrealistic projection of
future trips.
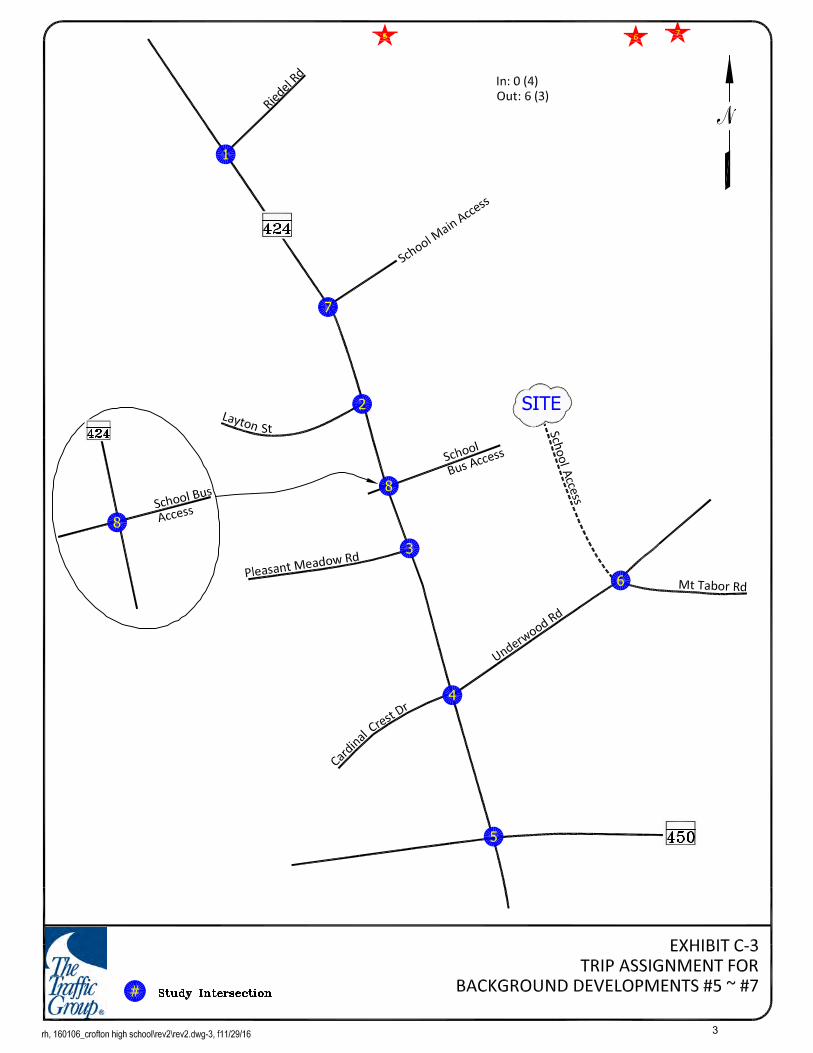
Based on existing traffic conditions and projected future demand, the
background trips were distributed and assigned to the road network as shown in
Exhibit 7. Appendix C contains details on the trip distribution for individual
groups of background developments.
Adding the background traffic to the existing peak hour traffic volumes results in
the background traffic conditions as shown in Exhibit 8.
11
Page 15
Analysis of Background Traffic Conditions
Intersection Capacity Analysis was again undertaken; this time for the
background condition. The results of the Capacity Analysis can be found in
Exhibit 12. Complete capacity worksheets can be found in Appendix B.
As shown in Exhibit 12, each traditional intersection is projected to maintain
Level of Service “A” conditions using Critical Lane Volume (CLV) methodology.
The intersection of Underwood Road at Mt. Tabor Road, which contains a
roundabout, is similarly projected to maintain optimal Level of Service “A”
conditions when considering all background traffic.
12
Page 16
#
#
1
EXHIBIT 5LOCATION MAP OF
BACKGROUND DEVELOPMENTS
2
3
4
5
6
7
SITE
1
2
3
4
5
6
8
Background Developments:1. Staples Corner2. High's Dairy Store3. Riding at North Branch4. Jorden Farms5. Duckett Farm, Lots 15 & 166. Gertz, Donald, Roger & William Property7. Gertz Allen & Pamela Property8. Flourmill, Lots 1, 2, 17
7
8
rh, 160106_crofton high school\rev2\rev2.dwg-loc_dev, f11/28/16 13
Page 17
Trip Generation Rates
IN OUT IN OUT
Single-Family Detached (ITE-210, Units)
Morning Trips = 0.75 x Units 25% 75% 63% 37%
Evening Trips = 1.00 x Units
Convenience Market (Open 15-16 Hours) (ksf, ITE-852)
Morning Trips = 31.02 x ksf 50% 50% 49% 51%
Evening Trips = 34.57 x ksf
Note:Trip generation formula and rates obtained from ITE Trip Generation Manual, 9th Edition, 2012.
Trip Generation for Background Developments
In Out Total In Out Total
1. Staples Corner (C2005-0055) No new construction
2. High's Dairy Store - Staples Corner
Convenience Market 3,630 sq.ft. 56 57 113 61 64 125
Pass-by Trip (PM-51%) -31 -33 -64
Net Trips 56 57 113 30 31 61
3. Riding at North Branch (S2014-015)
Single Family Detached 43 units 8 24 32 27 16 43
4. Jorden Farms (S1990-003)
Single Family Detached 12 units 2 7 9 8 4 12
5. Duckett Farm, Lots 15 & 16 (S1986-347)
Single Family Detached 2 units 0 2 2 1 1 2
6. Gertz, Donald, Roger & William Property (S2015-006)
Single Family Detached 3 units 0 2 2 2 1 3
7. Gertz, Allen & Pamela Property (D2015-007)
Single Family Detached 2 units 0 2 2 1 1 2
8. Flourmill, Lots 1, 2, 17 (S2000-145)
Single Family Detached 3 units 0 2 2 2 1 3
Formula/Rate
Directional Distribution
AM Peak Hour PM Peak Hour
No. Land Use SizeAM Peak Hour PM Peak Hour
FH F:\2016\2016-0106_Crofton High School\ENG\INITIAL\Trips.xls,11/28/2016
EXHIBIT 6
TRIP GENERATION FOR
BACKGROUND DEVELOPMENTS
14
Page 20
TOTAL TRAFFIC CONDITIONS
Site Information
The Crofton High School site is located on the east side of MD 424, north of
Underwood Road in the Crofton section of Anne Arundel County. Specifically, it
is situated on the site currently occupied by Crofton Middle School and Crofton
Park. The existing middle school will remain on site and a section of the park will
be developed by the school. The Master Plan for the property calls for the
redevelopment of Crofton Middle School to the north of its existing location.
However, that is not considered as part of this analysis.
The proposed high school site currently features one point of access to MD 424
which is utilized by Crofton Park. This access point will remain for the high
school. Also along MD 424, all high school bus traffic is assigned to the existing
middle school access and routed internally to a bus parking/staging area. In
addition, a second point of access is proposed at the existing roundabout at
Underwood Road and Mt. Tabor Road.
Trip Generation/Distribution
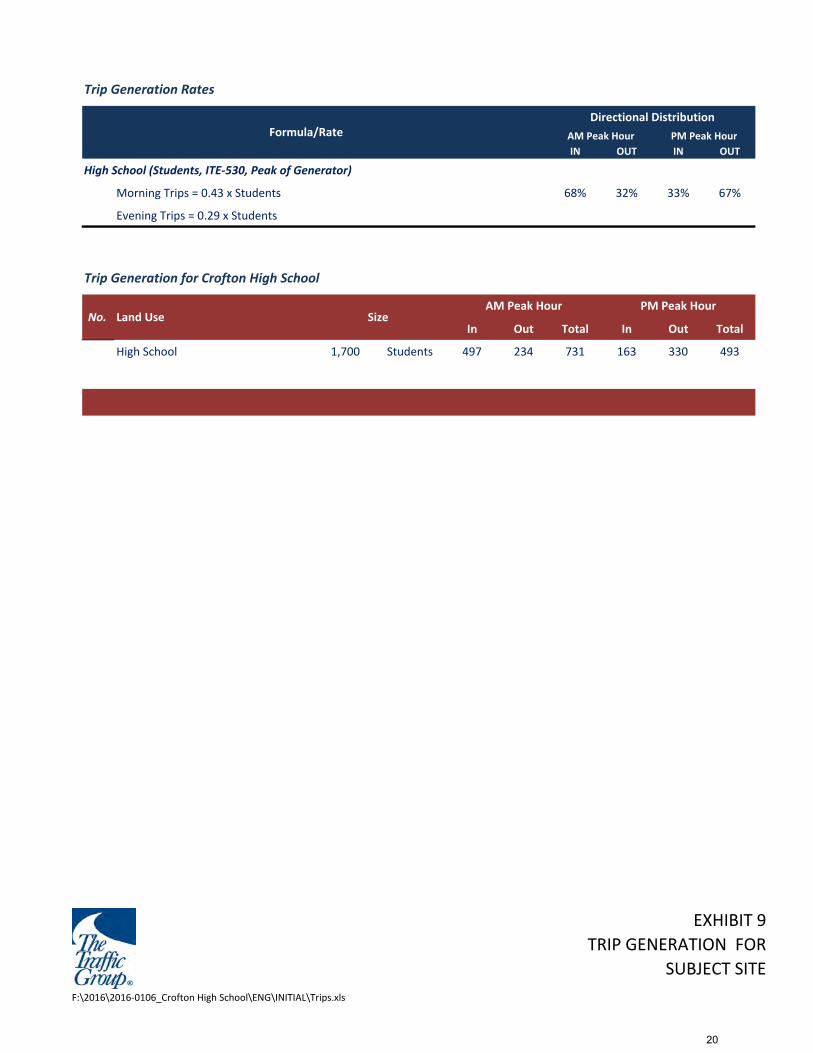
ITE’s Trip Generation was again utilized to determine the number of trips
projected to be generated by the development of this project. The results of the
trip generation calculations can be found in Exhibit 9. As shown, a total of 731
morning peak hour trips and 493 evening peak hour trips are projected. For this
particular land use, the peak hour of the generator was used. This results in a
slightly earlier peak hour time than traditional AM and PM peaks, as it reflects
the most intense use for the high school.
Based on current traffic patterns, the proposed layout of the facility, and
attendance boundary and mapping provided by Anne Arundel County Public
Schools (AAPS), the trips were distributed and assigned to the road network as
shown in Exhibit 10. A copy of the AAPS mapping can be found in Appendix A.
Combining the trips projected to be generated by Crofton High School with the
background peak hour traffic volumes results in the total peak hour traffic
volumes as shown in Exhibit 11.
As previously discussed, the existing Crofton Park access will serve as the primary
access point for all trips assigned to MD 424. Similarly, the Underwood Road
access point will satisfy the localized demand to the north and east of the facility.
17
Page 21
AAPS has indicated the school will be served by 40 buses, which are all assigned
to the middle school access.
Analysis of Total Traffic Conditions
Intersection Capacity Analysis was again undertaken for each study location this
time with consideration given to the full buildout of Crofton High School. The
results of the analysis are summarized in Exhibit 12. Complete capacity
worksheets can be found in Appendix B.
A review of Exhibit 12 shows that all intersections are projected to maintain
acceptable operations in the future with the buildout of the school. All
traditional intersections will exhibit Level of Service “D” or better conditions
during both peak periods, and the roundabout at Underwood Road at
Mt. Tabor Road will exhibit Level of Service “A” condition during each of the
peak periods.
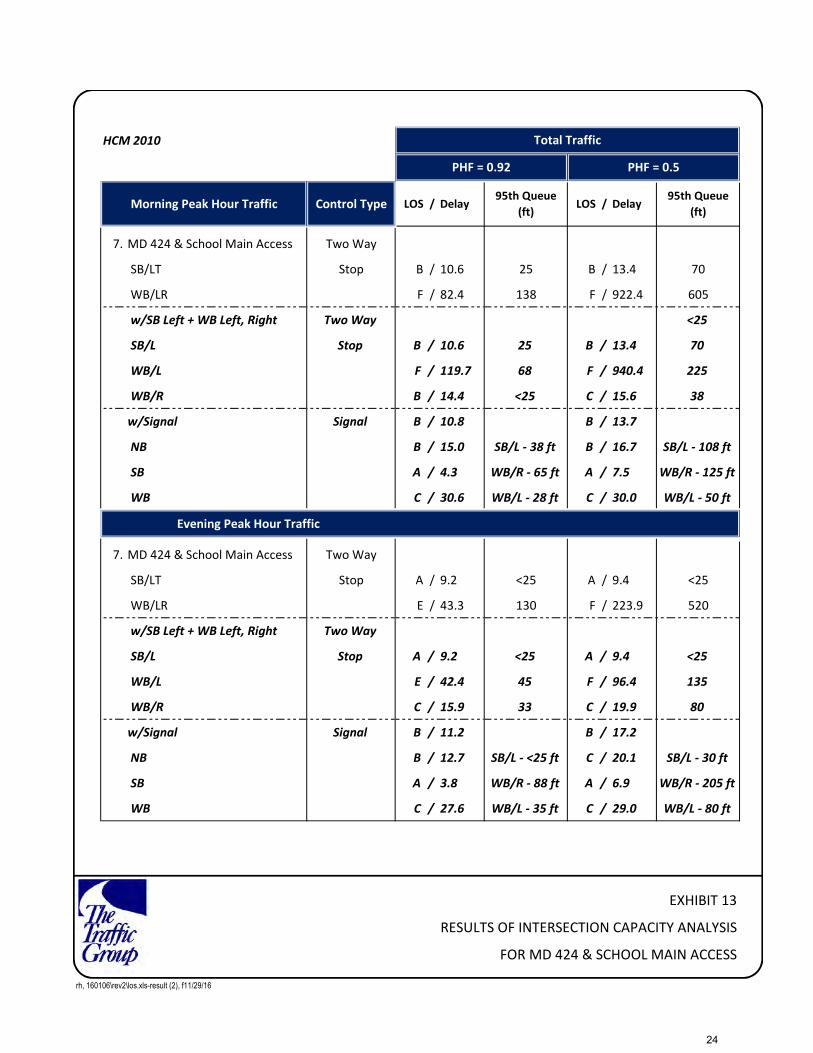
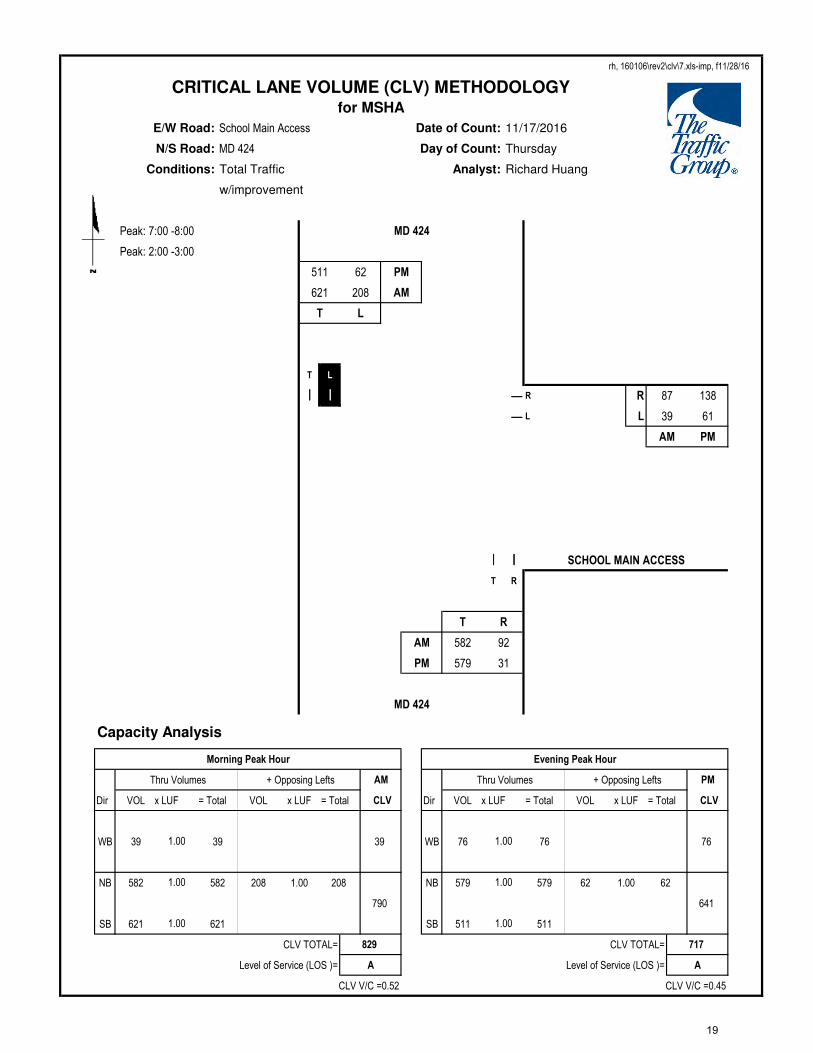
While the proposed main access point along MD 424 is shown to operate
acceptably from a capacity standpoint using CLV, improvements are
recommended to enhance traffic operations and satisfy SHA requirements.
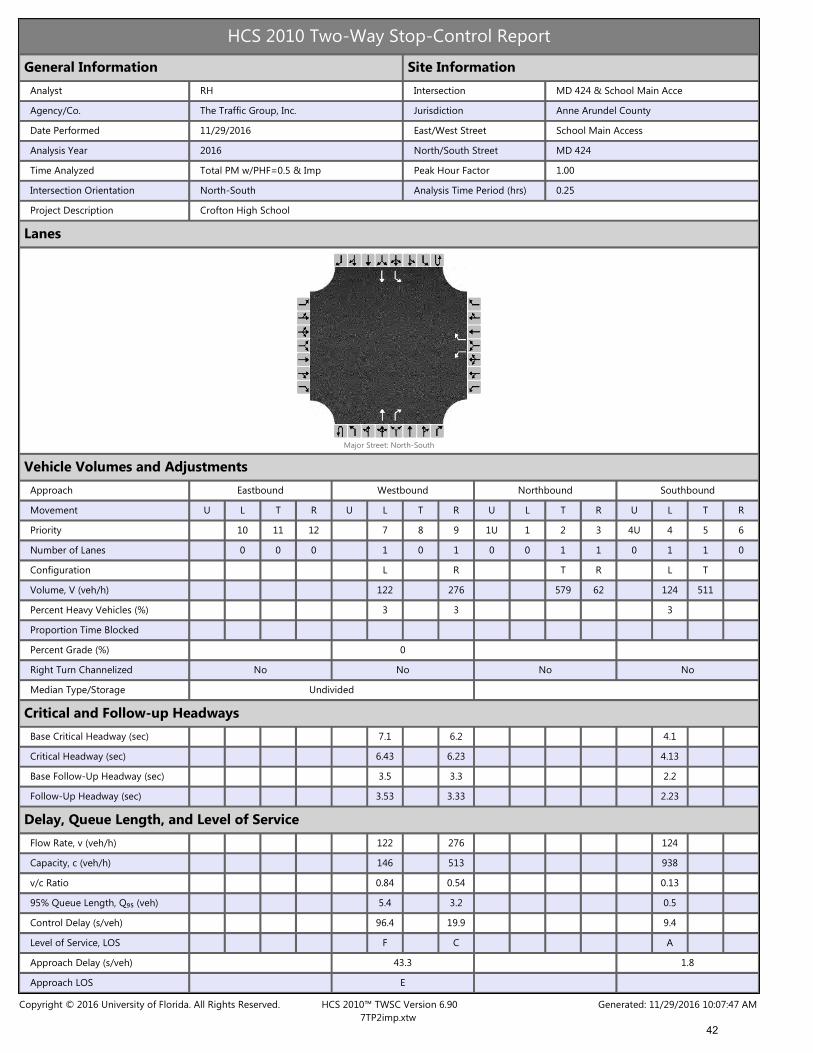
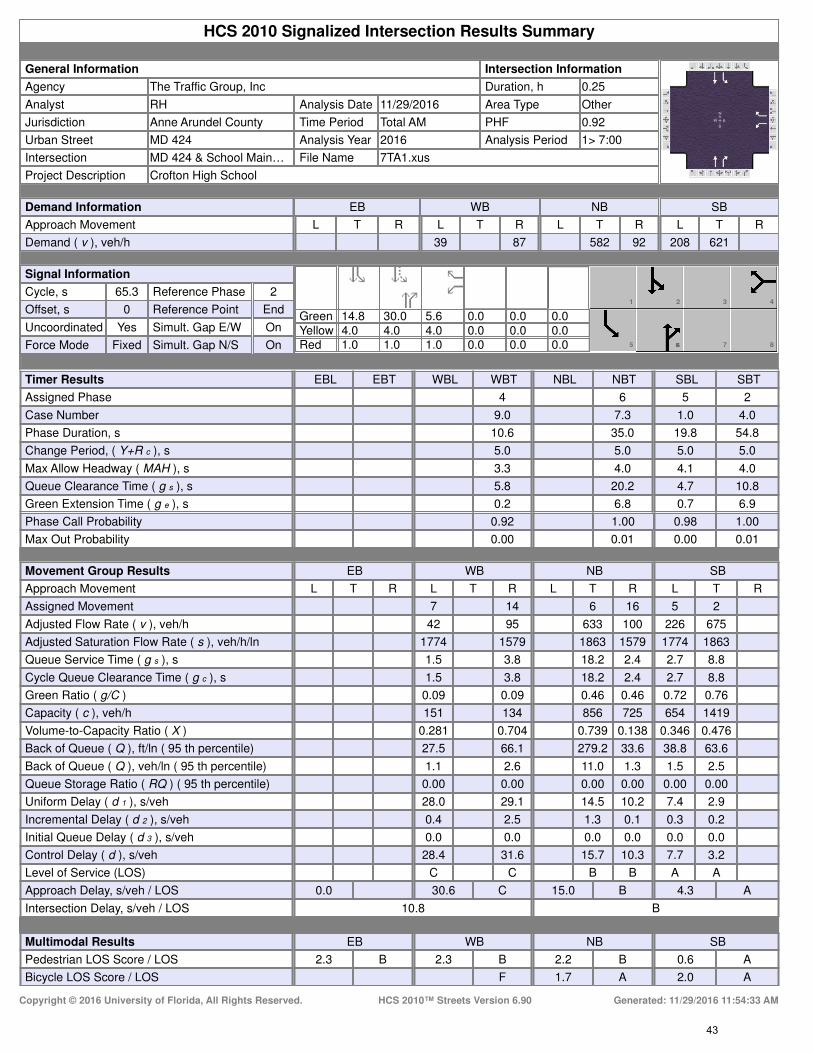
Using Highway Capacity Manual (HCM) procedures and a reduced peak hour
factor to represent school arrival and departure peak conditions, a failing level of
service is expected to result from high levels of delay. To mitigate the delay,
installation of a traffic signal should be considered. When reviewed with HCM,
acceptable operations are expected. The HCM Analysis is summarized in
Exhibit 13. In lieu of signalization, consideration could be given to the use of a
police officer to direct traffic as the high level of delay will only occur during
school arrival an dismissal times.
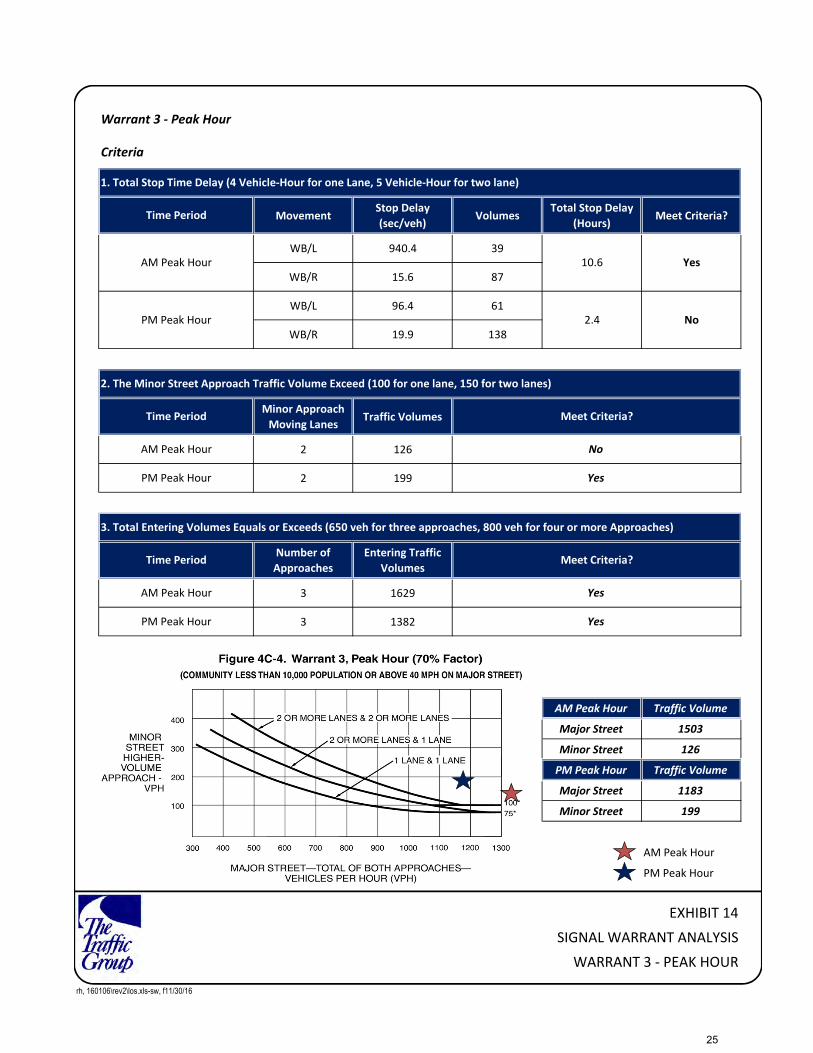
Criteria in the Manual on Uniform Traffic Control Devices (MUTCD) was reviewed
to confirm signalization is appropriate at the main school access point.
Specifically, Warrant 3 – Peak Hour Warrant – was considered. As shown in
Exhibit 14, all three of the first criteria must be met for the same hour. This does
not occur. The chart (Figure 4c-4), however, indicates there is adequate volumes
during both peak periods to warrant installation of a signal. Since the use of this
chart is independent of the first three criteria, signalization is appropriate.
Since traffic throughout the remainder of the day si projected to be minimal, no
other warrants were reviewed as they would not be satisfied.
Along Underwood Road, the school access would form the fourth leg of the
roundabout. This approach will have to be approved by Anne Arundel County.
18
Page 22
Since all other intersections are projected to maintain acceptable operations, no
other improvements are recommended. Exhibit 15 shows a summary of the
future recommended lane use.
19
Page 23
Trip Generation Rates
IN OUT IN OUT
High School (Students, ITE-530, Peak of Generator)
Morning Trips = 0.43 x Students 68% 32% 33% 67%
Evening Trips = 0.29 x Students
Trip Generation for Crofton High School
In Out Total In Out Total
High School 1,700 Students 497 234 731 163 330 493
No. Land Use
Formula/Rate AM Peak Hour PM Peak Hour
Directional Distribution
AM Peak Hour PM Peak HourSize
F:\2016\2016-0106_Crofton High School\ENG\INITIAL\Trips.xls
EXHIBIT 9
TRIP GENERATION FOR
SUBJECT SITE
20
Page 26
CLV
Morning Peak Hour Traffic LOS / CLV LOS / CLV LOS / CLV
1. MD 424 & Riedel Rd A / 762 A / 776 A / 934
2. MD 424 & Layton St/School Access 2 A / 668 A / 682 A / 744
3. MD 424 & Pleasant Meadow Rd A / 646 A / 660 A / 732
4. MD 424 & Underwood Rd A / 885 A / 908 A / 948
5. MD 424 & MD 450 A / 792 A / 826 A / 853
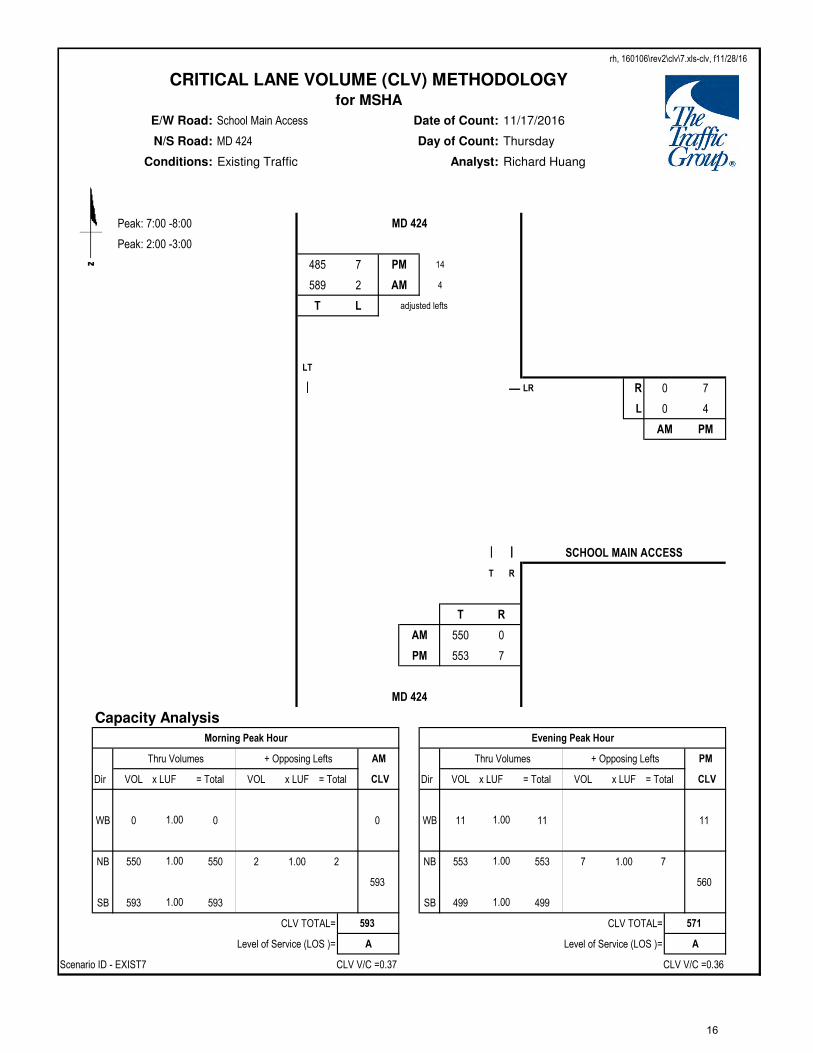
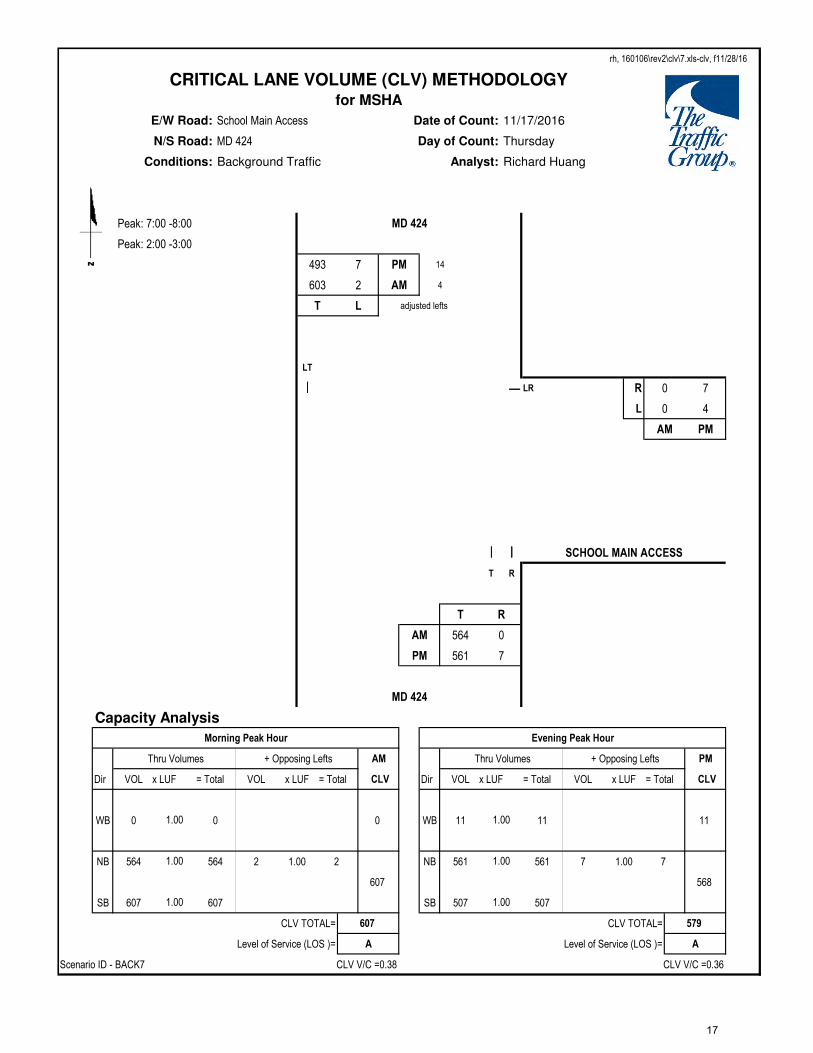
7. MD 424 & School Main Access A / 593 A / 607 D / 1371
w/Recommended improvement --- --- A / 829
8. MD 424 & School Bus Access/Old Post Rd A / 594 A / 608 A / 742
Evening Peak Hour Traffic
1. MD 424 & Riedel Rd A / 722 A / 730 A / 845
2. MD 424 & Layton St/School Access 2 A / 560 A / 568 A / 643
3. MD 424 & Pleasant Meadow Rd A / 619 A / 627 A / 666
4. MD 424 & Underwood Rd A / 836 A / 860 A / 893
5. MD 424 & MD 450 A / 780 A / 817 A / 832
7. MD 424 & School Main Access A / 571 A / 579 A / 896
w/Recommended improvement --- --- A / 717
8. MD 424 & School Bus Access/Old Post Rd A / 611 A / 619 A / 700
Roundabout - Sidra Methodology
Morning Peak Hour Traffic LOS / Delay LOS / Delay LOS / Delay
6. Underwood Rd & Mt Tabor Rd A / 5.8 A / 5.8 A / 6.6
EB A / 5.0 A / 5.0 A / 5.6
WB A / 5.6 A / 5.6 A / 5.9
NB A / 7.6 A / 7.6 A / 7.9
SB --- --- B / 11.6
Evening Peak Hour Traffic
6. Underwood Rd & Mt Tabor Rd A / 5.9 A / 5.8 A / 7.0
EB A / 4.9 A / 4.9 A / 5.9
WB A / 6.1 A / 6.1 A / 5.8
NB A / 7.7 A / 7.8 A / 8.5
--- --- A / 9.9
EXHIBIT 12
RESULTS OF INTERSECTION
CAPACITY ANALYSES
rh, 160106\rev2\los.xls-result, f11/29/16
Existing Traffic Total TrafficBackground
Traffic
Existing TrafficBackground
TrafficTotal Traffic
23
Page 27
HCM 2010
Morning Peak Hour Traffic Control Type LOS / Delay95th Queue
(ft)LOS / Delay
95th Queue
(ft)
7. MD 424 & School Main Access Two Way
SB/LT Stop B / 10.6 25 B / 13.4 70
WB/LR F / 82.4 138 F / 922.4 605
w/SB Left + WB Left, Right Two Way <25
SB/L Stop B / 10.6 25 B / 13.4 70
WB/L F / 119.7 68 F / 940.4 225
WB/R B / 14.4 <25 C / 15.6 38
w/Signal Signal B / 10.8 B / 13.7
NB B / 15.0 SB/L - 38 ft B / 16.7 SB/L - 108 ft
SB A / 4.3 WB/R - 65 ft A / 7.5 WB/R - 125 ft
WB C / 30.6 WB/L - 28 ft C / 30.0 WB/L - 50 ft
Evening Peak Hour Traffic
7. MD 424 & School Main Access Two Way
SB/LT Stop A / 9.2 <25 A / 9.4 <25
WB/LR E / 43.3 130 F / 223.9 520
w/SB Left + WB Left, Right Two Way
SB/L Stop A / 9.2 <25 A / 9.4 <25
WB/L E / 42.4 45 F / 96.4 135
WB/R C / 15.9 33 C / 19.9 80
w/Signal Signal B / 11.2 B / 17.2
NB B / 12.7 SB/L - <25 ft C / 20.1 SB/L - 30 ft
SB A / 3.8 WB/R - 88 ft A / 6.9 WB/R - 205 ft
WB C / 27.6 WB/L - 35 ft C / 29.0 WB/L - 80 ft
EXHIBIT 13
RESULTS OF INTERSECTION CAPACITY ANALYSIS
FOR MD 424 & SCHOOL MAIN ACCESS
rh, 160106\rev2\los.xls-result (2), f11/29/16
Total Traffic
PHF = 0.92 PHF = 0.5
24
Page 28
Warrant 3 - Peak Hour
Criteria
MovementStop Delay
(sec/veh)Volumes
Total Stop Delay
(Hours)Meet Criteria?
WB/L 940.4 39
WB/R 15.6 87
WB/L 96.4 61
WB/R 19.9 138
Minor Approach
Moving LanesTraffic Volumes
2 126
2 199
Number of
Approaches
Entering Traffic
Volumes
3 1629
3 1382
AM Peak Hour Traffic Volume
Major Street 1503
Minor Street 126
PM Peak Hour Traffic Volume
Major Street 1183
Minor Street 199
AM Peak Hour
PM Peak Hour
EXHIBIT 14
SIGNAL WARRANT ANALYSIS
WARRANT 3 - PEAK HOUR
rh, 160106\rev2\los.xls-sw, f11/30/16
1. Total Stop Time Delay (4 Vehicle-Hour for one Lane, 5 Vehicle-Hour for two lane)
Time Period
10.6 YesAM Peak Hour
PM Peak Hour 2.4 No
2. The Minor Street Approach Traffic Volume Exceed (100 for one lane, 150 for two lanes)
Time Period
AM Peak Hour
PM Peak Hour
Meet Criteria?
No
Yes
3. Total Entering Volumes Equals or Exceeds (650 veh for three approaches, 800 veh for four or more Approaches)
Time Period Meet Criteria?
AM Peak Hour Yes
PM Peak Hour Yes
25
Page 30
RESULTS, RECOMMENDATIONS, AND CONCLUSIONS
Study Purpose
The Traffic Group, Inc. has prepared this Traffic Impact Analysis to quantify the
effect the proposed development of Crofton High School will have on the
surrounding road network in the Crofton section of Anne Arundel County. This
site is located on the east side of MD 424 (Davidsonville Road) within the existing
Crofton Middle School site, north of Underwood Road. In addition to the
operational middle school, a wooded area of Crofton Park sits on the site. The
proposed plan includes the development of a high school with the capacity of up
to 1,700 students. Access to the facility is proposed via the existing access point
that currently serves Crofton Park on MD 424 and at a fourth leg to the
roundabout at the intersection of Underwood Road at Mt. Tabor Road. The
existing access point to Crofton Middle School along MD 424 will serve as the
high school’s bus access.
Study Criteria/Methodology
This Traffic Impact Analysis was conducted in accordance with the methodology
set forth by Anne Arundel County and the Maryland State Highway
Administration (SHA). Since this is a Board of Education (BOE) project, it is
exempt from Anne Arundel County’s Adequate Public Facilities Ordinance
requirements. Access to a state road, however, will be intensified and the
subject site will generate more than 50 peak hour trips, a Traffic Impact Study is
required to satisfy SHA criteria. All site access intersections and the nearest
signalized intersection in each direction from the state-maintained roadway are
analyzed. Critical Lane Volume (CLV) methodology is utilized as required by SHA.
A meeting was held with representatives from BOE, SHA, and Anne Arundel
County on November 15, 2016 to discuss the site and routing of traffic. Minutes
from the meeting can be found in Appendix A. All issues raised at the meeting
are addressed within this document.
Summary of Findings and Recommendations
This analysis will show that the proposed development of Crofton High School
will have a minimal impact to surrounding intersection operations during school
peak times. All intersections within the study area currently operate at Level of
Service “A” conditions during both the morning and school afternoon peak
period. With the addition of the proposed high school, each intersection is
27
Page 31
proposed to maintain acceptable operations without the need for improvements
from a capacity standpoint.
In order to comply with SHA requirements, however, improvements are
recommended to the site access point along MD 424. Specifically, a separate left
turn lane is recommended in addition to widening of the access road to provide
a separate left turn and right turn lane. The introduction of these improvements
would permit safe, efficient access to the road system. During school arrival and
dismissal times, however, a high level of delay is projected for the main access.
The access point should feature separate left and right turn lanes to facilitate a
more efficient exit from the site. Traffic signalization should also be considered,
though it would only be needed for a brief time during morning arrival and
afternoon dismissal. The installation of signalization may be preferable to police
control, although SHA will ultimately approve traffic control at this location.
28
Page 32
APPENDIX A
Scope Letter,
Intersection Turning Movement Counts,
and Photos
Page 33
1
Richard Huang
From: Carl Wilson
Sent: Tuesday, November 29, 2016 2:40 PM
To: Richard Huang
Subject: FW: Crofton Traffic Meeting Summary (#16014)
Attachments: image001.jpg; image002.jpg; image003.jpg
-----Original Message-----
From: Salamy, Kimberly M [mailto:[email protected] ]
Sent: Thursday, November 17, 2016 7:00 PM
To: Gretchen E. Wagner
Cc: Nick Wilson; Robert Tomcanin; Schuster, Erik S; Alberts, Lawrence A; [email protected] ; Paul Hume; Carl
Wilson; Hopkins, Jacqueline D; [email protected] ; McIntire, Wanda F; [email protected] ;
[email protected] ; Levy, Alan M; Admin
Subject: Re: Crofton Traffic Meeting Summary (#16014)
Gretchen-
I think you have captured all that was discussed.
The only thing I would add to bullet number 5 is "The AACPS directed revision of the secondary entrance to the circle
may result in the elimination of the extra R&P softball field. Final direction and acceptance of this design revision be
field elimination will be given upon receipt of revised design."
Thanks!
Kim
Sent from my iPhone
> On Nov 17, 2016, at 5:28 PM, Gretchen E. Wagner <[email protected] > wrote:
>
> Below is a summary of the decisions made at the meeting on Tuesday regarding site circulation for Crofton Area High
School:
>
>
> 1. The main entrance to the high school will be at the current Crofton Park entrance off of Davidsonville Road.
>
> 2. The middle school entrance will be used for the high school bus traffic. This will allow the buses to avoid the high
school car traffic accessing the site. The middle school and high school arrival and dismissal times are staggered so this
should not impact the middle school.
>
> 3. Crossing guards will be required at the middle school entrance and possibly the crosswalk at Layton Street and the
high school entrance. This will be coordinated by AACPS.
>
> 4. The capacity of the high school bus loop will be reduced to 40 buses.
>
> 5. The secondary high school entrance off of Underwood Road will be moved to align with the traffic circle.
>
1
Page 34
2
> 6. The traffic study will be revised to reflect the information above. The study should be completed by December 1
and will then be reviewed by SHA.
>
> The meeting sign-in sheet is attached to this email.
>
> Thanks,
>
> Gretchen Wagner, AIA, LEED AP BD+C
> GWWO, Inc./Architects
> 800 Wyman Park Drive
> Suite 300
> Baltimore, MD 21211
> T: 410.332.1009
> F: 410.332.0038
>
[cid:[email protected] ]<https://na01.safelinks.protection.outlook.com/?url=http%3A%2F%2Fwww.g
wwoinc.com%2F&data=01%7C01%7CKSalamy%40AACPS.org%7Cf4b56deac4f246c34ed208d40f386596%7Cb7d27e9335
6b4ad88a7089c35df207c0%7C0&sdata=erO3VCQ60zt2haG%2BpKFdzjzLPpW%2B5hiPrIPVG02k3g4%3D&reserved=0>
[cid:[email protected] ]
<https://na01.safelinks.protection.outlook.com/?url=https%3A%2F%2Fwww.facebook.com%2FGWWOArchitects&data=
01%7C01%7CKSalamy%40AACPS.org%7Cf4b56deac4f246c34ed208d40f386596%7Cb7d27e93356b4ad88a7089c35df207
c0%7C0&sdata=mrPuCKy7mdzY9t3%2B%2BSqWOWTbytkxbdRJr9pys%2BgxbEk%3D&reserved=0>
[cid:[email protected] ]
<https://na01.safelinks.protection.outlook.com/?url=http%3A%2F%2Fwww.linkedin.com%2Fcompany%2Fgwwo-
inc.architects&data=01%7C01%7CKSalamy%40AACPS.org%7Cf4b56deac4f246c34ed208d40f386596%7Cb7d27e93356b4
ad88a7089c35df207c0%7C0&sdata=%2Bp9EUFomzmeR%2FLCWdV20uh8mes2z8KGxm6u5ucc8ENo%3D&reserved=0>
>
> <image001.jpg>
> <image002.jpg>
> <image003.jpg>
> <Traffic Meeting Sign-In.pdf>
________________________________
Please consider the environment before printing this e-mail.
2
Page 35
¹º
¹º¹º
¹º
¹º
¹º¹º
¹º
¹º
US50
I97
CRAI
N HW
Y
DEFENSE HWY
CONWAY RD
GOVERNOR BRIDGE RD
PATUXENT RD
ROSSBACK RD
CECI
L AVE
S
WAUGH CHAPEL RD
BELL BRANCH RD
MILLERSVILLE RD
DAVIDSONVILLE RD
MOUNT TABOR RD
BOTTNER RD
GENERALS HWY
JUSTIN DR
DAIRY FARM RD
TWO
RIVE
RS B
LVD
JOHNS HOPKINS RD
MAUD LN
RIEDEL RD
PATUXENT RIVER RD
MEYE
RS S
TATIO
N RD
COX RD
LAVA
LL DR
CROFTON PKWY
MAYTIME DR
HOWARD GROVE RD
URBY DR
NANTUCKET DR
PRICE RDCHAPMAN RD
BRAG
ERS R
D
CHELMSFORD DR
GOSHEFF LN
ETON
WAY
SENECA DR
ASHE ST
EVERGREEN RD
GERSTANHAL RD
STRA
WBE
RRY L
AKE
WAY
BRANDERMILL BLVD
ABERDEEN DR
SYMPHONY LN
UNDERWOOD RD
FARM LN
SAINT GEORGE BARBER RD
GRAYS FORD RD
TANA
GER
DR
FARLOW AVE
FALLSWAY DR
NB I97 ONR WB RT32FORNEY RD
NB CRAIN ONR SB I97CO
LLIN
S AVE
REYNOLDS ST
MAYFAIR PLTRENT ST
HARCOURT AVE
ROSETTA WAY
BACO
N RI
DGE
RD
PENDERBROOKE DR
HUNTCLIF
F DR
ELWYN AVE
LAKE FO
REST DR
MCKN
EW R
D
LANG DR
LINDA
LN
CRONSON BLVD
RIVERSCAPE RD
BALDWIN AVE
REGA
L LN
TARLETON WAY
HOPP
A RD
CHARING CROSS DR
KATH
Y ANN
E LNSUMMER HILL DR
MACALLISTER LN
CARVER RD
HAVERFORD DR
EDWIN
LN
SINCLAIR RD
HIGHTEE CT
FOX CREEK LN
MALVERN HILL DR
SAINT H
EATH
ER LN
LEVEE DR
SEBASTIAN LN
EDEN
WOOD LN
COXSHIRE LN
LEE ST
NO NAME 7430
5TH AVE
HANS
EL D
R
WILLIAM RD
EB US50 ONR SB DAVIDSONVILLE
SNOW VALLEY LN
GALWAY RD
PRIEST BRIDGE DR BRANCHWOOD CT
MARTINS GRANT CT
COLL
EEN
AVE
CHAPEL CT
NUCCI WAY
PEARL AVE
DOROTHY RD
WINDY OAK CT
DILLON DR
CHAPMAN LN
VILLAGE LAKE DR
ROSE HILL LN
PATR
ICE C
IR
WESTPORT LN
TAXUS DR
RANGE RD
GINGER DR
VINEYARD LN
CHARLIE MANN CT
PEDIMENT AVE
JOHNSON DR
CHURCHVIEW CT
POLLY PL
ANGELINA CT
BRANDY FARMS LN
COLEUS DR
DICKEY DR
KINGSWAY DR
PARKRIDGE CIR
HUNTFIELD CT
DEER PASS LN
FLOURMILL CT
NANC
ARLE
S DR
ABBINGTON LN
THICKET C
T
JOLIE
PL
COLUMBINE CT
HEARTS BAY DR
JERROLD PL
CATBRIAR WAY
JASON CT
JASON CT
DAVIDSONVILLE RD
PATUXENT RIVER RD
CRAIN
HWY
US50
I97
CRAIN HWY
US50
I97
CRAIN HWY
DEFENSE HWY
CONWAY RD
RUTLA
ND RD
GOVE RNOR BRIDGE RD
PA TUXENT RD
ROSS BACK RD
SAINT STEPHENS CHURCH RD
WILDLIFE LOOP RD
BOTT N ER RD
JUSTIN DR
J OHNS HOPKINS RDTWO RIVERS BLV D
MEYERS STATIO N RD
CROF
TON PKWY
WATERBURY RD
ANNA POLIS RD
BRICKHEAD RD
CHE VAL DR
HALLM A RK DR
CHURCH VIEW RD
SUNNY RIDGE DR
SW INBURNE AVE
GOL DFINCH
LN
SUNSH INE AVE
PEBBLE BROOK CT
CHESTERFIEL D RD
CAPITOL RACEWAY RD
BARBAR A SWANN WAY
PA
DDOCKS CT
TIM E DR
BASIL HALL LN
WILDERNESS RIDGE TRL
WINTERH AVEN DR
REMINGTON DR
US50
I97
CRAIN HWY
PATUXENT R D
Crofton Elem.
Nantucket Elem.
Millersville Elem.Four Seasons Elem.
Waugh Chapel Elem.
Piney Orchard Elem.
Crofton Woods Elem.
Crofton Meadows Elem.
Crofton Middle
Crofton Area Student Enrollment 2016-2017 ¯
Source: AACPS 2016
Crofton_Area_HSStudent Enrollment 2016-2017
Crofton Elementary SchoolCrofton Meadows Elementary School
#* Crofton Woods Elementary SchoolNantucket Elementary School
ES DsitrictsCrofton Elementary SchoolCrofton Meadows Elementary SchoolCrofton Woods Elementary SchoolNantucket Elementary School
TransportationFREEWAYPRINCIPAL ARTERIALMINOR ARTERIALLOCALCOLLECTOR 3
Page 36
1
Richard Huang
From: Carl Wilson
Sent: Tuesday, August 09, 2016 3:14 PM
To: Richard Huang
Subject: FW: Crofton Middle School
Carl Wilson, Jr., P.E., PTOE
Senior Project Manager The Traffic Group, Inc.
9900 Franklin Square Dr. - Suite H
Baltimore, MD 21236
T 410.931.6600
M 410.292.5545
F 410.931.6601
[email protected]
www.trafficgroup.com
Merging Innovation and Excellence®
From: David Braun [mailto:[email protected] ] Sent: Tuesday, May 31, 2016 7:26 AM
To: Carl Wilson Cc: Kirsten Cook; Monet Lea; Sarah Fowler; Brian Ulrich; Martha Arzu-McIntosh; Chris Soldano
Subject: Re: Crofton Middle School
Carl:
BOE projects are not subject to County regulations regarding APF. We can review this for general compliance
with the County requirements, but we will not be reviewing the study itself. In that regard, we would not have
any additional requirements, but you would need to ensure that all school access points are included in the
study.
David
On Fri, May 27, 2016 at 3:13 PM, Carl Wilson <[email protected] > wrote:
Attached please find a site map and intersection list for the proposed development of Crofton High School Anne
Arundel County. The site is situated on the existing Crofton Middle School property. At this time we are
seeking approval on the study locations so we can count immediately, prior to school closing for the summer. I
will provide a formal Scoping Agreement next week.
Thanks for your prompt assistance in this matter. If you have any questions or need anything else, please let
me know.
Thank you!
Carl Wilson, Jr., P.E., PTOE Senior Project Manager The Traffic Group, Inc.
4
Page 37
2
9900 Franklin Square Dr. - Suite H Baltimore, MD 21236 T 410.931.6600 M 410.292.5545 F 410.931.6601 [email protected]
www.trafficgroup.com
Merging Innovation and Excellence®
The information contained in this e-mail is confidential information intended only for the use of the individual
or entity named above. The review, dissemination, distribution or copying of this communication to anyone
other than the intended addressee is strictly prohibited. If you have received this message in error, promptly
notify the sender by return email, and permanently delete this message from your computer. Thank you.
5
Page 38
VEHICLES TURNING MOVEMENT COUNT - SUMMARYCounted by: VCU
Intersection of: MD 424 Date: June 08, 2016 Wednesday
and: Riedel Road Weather: Light Rain, Warm
Location: Anne Arundel County, Maryland Entered by: BW Star Rating: 3
TOTALon: MD 424 on: MD 424 on: Riedel Road on: N + S
TIME +RIGHT THRU LEFT U-TN TOTAL RIGHT THRU LEFT U-TN TOTAL RIGHT THRU LEFT U-TN TOTAL RIGHT THRU LEFT U-TN TOTAL E + W
AM
7:00 - 7:15 62 9 0 71 38 57 0 95 98 74 0 172 0 338
7:15 - 7:30 62 18 0 80 47 80 0 127 97 79 0 176 0 383
7:30 - 7:45 75 31 0 106 56 81 0 137 111 79 0 190 0 433
7:45 - 8:00 71 26 0 97 91 121 0 212 96 107 0 203 0 512
8:00 - 8:15 62 37 0 99 74 126 0 200 97 88 0 185 0 484
8:15 - 8:30 67 36 0 103 61 92 0 153 105 111 0 216 0 472
8:30 - 8:45 74 30 0 104 60 73 0 133 106 98 0 204 0 441
8:45 - 9:00 58 39 0 97 41 86 0 127 81 87 0 168 0 392
2 Hr Totals 0 531 226 0 757 468 716 0 0 1184 791 0 723 0 1514 0 0 0 0 0 3455
1 Hr Totals
7:00 - 8:00 0 270 84 0 354 232 339 0 0 571 402 0 339 0 741 0 0 0 0 0 1666
7:15 - 8:15 0 270 112 0 382 268 408 0 0 676 401 0 353 0 754 0 0 0 0 0 1812
7:30 - 8:30 0 275 130 0 405 282 420 0 0 702 409 0 385 0 794 0 0 0 0 0 1901
7:45 - 8:45 0 274 129 0 403 286 412 0 0 698 404 0 404 0 808 0 0 0 0 0 1909
8:00 - 9:00 0 261 142 0 403 236 377 0 0 613 389 0 384 0 773 0 0 0 0 0 1789
PEAK HOUR
7:45 - 8:45 0 274 129 0 403 286 412 0 0 698 404 0 404 0 808 0 0 0 0 0 1909
PM
2:00 - 2:15 77 58 0 135 48 52 0 100 53 37 0 90 0 325
2:15 - 2:30 97 61 0 158 66 68 0 134 53 41 0 94 0 386
2:30 - 2:45 80 59 0 139 83 73 0 156 61 63 0 124 0 419
2:45 - 3:00 75 68 0 143 95 81 0 176 60 61 0 121 0 440
3:00 - 3:15 89 79 0 168 93 97 0 190 75 56 0 131 0 489
3:15 - 3:30 76 87 0 163 81 79 0 160 71 58 0 129 0 452
3:30 - 3:45 86 98 0 184 86 87 0 173 88 75 0 163 0 520
3:45 - 4:00 109 96 0 205 101 110 0 211 69 75 0 144 0 560
4:00 - 4:15 105 103 0 208 90 120 0 210 62 74 0 136 0 554
4:15 - 4:30 115 107 0 222 100 99 0 199 92 65 0 157 0 578
4:30 - 4:45 98 94 0 192 102 129 0 231 84 85 0 169 0 592
4:45 - 5:00 87 124 0 211 114 112 0 226 84 92 0 176 0 613
5:00 - 5:15 103 119 0 222 104 104 0 208 87 81 0 168 0 598
5:15 - 5:30 105 104 0 209 93 133 0 226 96 91 0 187 0 622
5:30 - 5:45 117 146 0 263 109 105 0 214 94 87 0 181 0 658
5:45 - 6:00 99 122 0 221 119 114 0 233 88 76 0 164 0 618
4 Hr Totals 0 1518 1525 0 3043 1484 1563 0 0 3047 1217 0 1117 0 2334 0 0 0 0 0 8424
1 Hr Totals
2:00 - 3:00 0 329 246 0 575 292 274 0 0 566 227 0 202 0 429 0 0 0 0 0 1570
2:15 - 3:15 0 341 267 0 608 337 319 0 0 656 249 0 221 0 470 0 0 0 0 0 1734
2:30 - 3:30 0 320 293 0 613 352 330 0 0 682 267 0 238 0 505 0 0 0 0 0 1800
2:45 - 3:45 0 326 332 0 658 355 344 0 0 699 294 0 250 0 544 0 0 0 0 0 1901
3:00 - 4:00 0 360 360 0 720 361 373 0 0 734 303 0 264 0 567 0 0 0 0 0 2021
3:15 - 4:15 0 376 384 0 760 358 396 0 0 754 290 0 282 0 572 0 0 0 0 0 2086
3:30 - 4:30 0 415 404 0 819 377 416 0 0 793 311 0 289 0 600 0 0 0 0 0 2212
3:45 - 4:45 0 427 400 0 827 393 458 0 0 851 307 0 299 0 606 0 0 0 0 0 2284
4:00 - 5:00 0 405 428 0 833 406 460 0 0 866 322 0 316 0 638 0 0 0 0 0 2337
4:15 - 5:15 0 403 444 0 847 420 444 0 0 864 347 0 323 0 670 0 0 0 0 0 2381
4:30 - 5:30 0 393 441 0 834 413 478 0 0 891 351 0 349 0 700 0 0 0 0 0 2425
4:45 - 5:45 0 412 493 0 905 420 454 0 0 874 361 0 351 0 712 0 0 0 0 0 2491
5:00 - 6:00 0 424 491 0 915 425 456 0 0 881 365 0 335 0 700 0 0 0 0 0 2496
PEAK HOUR
5:00 - 6:00 0 424 491 0 915 425 456 0 0 881 365 0 335 0 700 0 0 0 0 0 2496
TRAFFIC FROM NORTH TRAFFIC FROM SOUTH TRAFFIC FROM EAST TRAFFIC FROM WEST
6
Page 40
VEHICLES TURNING MOVEMENT COUNT - SUMMARYCounted by: VCU
Intersection of: MD 424 Date: June 14, 2016 Tuesday
and: Layton Street Weather: Light Rain, Warm
Location: Anne Arundel County, Maryland Entered by: BW Star Rating: 5
TOTALon: MD 424 on: MD 424 on: on: Layton Street N + S
TIME +RIGHT THRU LEFT U-TN TOTAL RIGHT THRU LEFT U-TN TOTAL RIGHT THRU LEFT U-TN TOTAL RIGHT THRU LEFT U-TN TOTAL E + W
AM
7:00 - 7:15 6 110 0 116 72 4 0 76 0 12 8 0 20 212
7:15 - 7:30 5 133 0 138 103 3 0 106 0 14 11 0 25 269
7:30 - 7:45 3 168 0 171 136 5 0 141 0 25 8 0 33 345
7:45 - 8:00 3 161 0 164 209 22 0 231 0 28 3 0 31 426
8:00 - 8:15 5 122 0 127 148 17 0 165 0 19 12 0 31 323
8:15 - 8:30 4 136 0 140 128 4 0 132 0 12 10 0 22 294
8:30 - 8:45 9 138 0 147 138 8 0 146 0 13 9 0 22 315
8:45 - 9:00 5 123 0 128 117 6 0 123 0 24 8 0 32 283
2 Hr Totals 40 1091 0 0 1131 0 1051 69 0 1120 0 0 0 0 0 147 0 69 0 216 2467
1 Hr Totals
7:00 - 8:00 17 572 0 0 589 0 520 34 0 554 0 0 0 0 0 79 0 30 0 109 1252
7:15 - 8:15 16 584 0 0 600 0 596 47 0 643 0 0 0 0 0 86 0 34 0 120 1363
7:30 - 8:30 15 587 0 0 602 0 621 48 0 669 0 0 0 0 0 84 0 33 0 117 1388
7:45 - 8:45 21 557 0 0 578 0 623 51 0 674 0 0 0 0 0 72 0 34 0 106 1358
8:00 - 9:00 23 519 0 0 542 0 531 35 0 566 0 0 0 0 0 68 0 39 0 107 1215
PEAK HOUR
7:30 - 8:30 15 587 0 0 602 0 621 48 0 669 0 0 0 0 0 84 0 33 0 117 1388
PM
2:00 - 2:15 5 107 0 112 133 12 1 146 0 14 3 0 17 275
2:15 - 2:30 7 126 0 133 123 10 0 133 0 9 9 0 18 284
2:30 - 2:45 14 107 0 121 131 11 0 142 0 10 8 0 18 281
2:45 - 3:00 7 116 0 123 147 5 0 152 0 12 6 0 18 293
3:00 - 3:15 13 119 0 132 141 5 0 146 0 7 4 0 11 289
3:15 - 3:30 12 134 0 146 147 18 0 165 0 7 3 0 10 321
3:30 - 3:45 9 126 0 135 192 15 0 207 0 9 8 0 17 359
3:45 - 4:00 8 129 0 137 175 7 0 182 0 8 12 0 20 339
4:00 - 4:15 13 138 0 151 172 10 0 182 0 8 4 0 12 345
4:15 - 4:30 8 126 0 134 202 9 0 211 0 9 8 0 17 362
4:30 - 4:45 8 167 0 175 186 12 0 198 0 13 11 0 24 397
4:45 - 5:00 15 141 0 156 191 17 0 208 0 21 6 0 27 391
5:00 - 5:15 14 160 0 174 204 15 0 219 0 15 5 0 20 413
5:15 - 5:30 13 153 0 166 219 16 0 235 0 16 10 0 26 427
5:30 - 5:45 16 145 0 161 203 13 0 216 0 18 12 0 30 407
5:45 - 6:00 20 166 0 186 195 18 0 213 0 18 19 0 37 436
4 Hr Totals 182 2160 0 0 2342 0 2761 193 1 2955 0 0 0 0 0 194 0 128 0 322 5619
1 Hr Totals
2:00 - 3:00 33 456 0 0 489 0 534 38 1 573 0 0 0 0 0 45 0 26 0 71 1133
2:15 - 3:15 41 468 0 0 509 0 542 31 0 573 0 0 0 0 0 38 0 27 0 65 1147
2:30 - 3:30 46 476 0 0 522 0 566 39 0 605 0 0 0 0 0 36 0 21 0 57 1184
2:45 - 3:45 41 495 0 0 536 0 627 43 0 670 0 0 0 0 0 35 0 21 0 56 1262
3:00 - 4:00 42 508 0 0 550 0 655 45 0 700 0 0 0 0 0 31 0 27 0 58 1308
3:15 - 4:15 42 527 0 0 569 0 686 50 0 736 0 0 0 0 0 32 0 27 0 59 1364
3:30 - 4:30 38 519 0 0 557 0 741 41 0 782 0 0 0 0 0 34 0 32 0 66 1405
3:45 - 4:45 37 560 0 0 597 0 735 38 0 773 0 0 0 0 0 38 0 35 0 73 1443
4:00 - 5:00 44 572 0 0 616 0 751 48 0 799 0 0 0 0 0 51 0 29 0 80 1495
4:15 - 5:15 45 594 0 0 639 0 783 53 0 836 0 0 0 0 0 58 0 30 0 88 1563
4:30 - 5:30 50 621 0 0 671 0 800 60 0 860 0 0 0 0 0 65 0 32 0 97 1628
4:45 - 5:45 58 599 0 0 657 0 817 61 0 878 0 0 0 0 0 70 0 33 0 103 1638
5:00 - 6:00 63 624 0 0 687 0 821 62 0 883 0 0 0 0 0 67 0 46 0 113 1683
PEAK HOUR
5:00 - 6:00 63 624 0 0 687 0 821 62 0 883 0 0 0 0 0 67 0 46 0 113 1683
TRAFFIC FROM NORTH TRAFFIC FROM SOUTH TRAFFIC FROM EAST TRAFFIC FROM WEST
8
Page 42
VEHICLES TURNING MOVEMENT COUNT - SUMMARYCounted by: VCU
Intersection of: MD 424 Date: June 08, 2016 Wednesday
and: Pleasant Meadow Road Weather: Light Rain, Warm
Location: Anne Arundel County, Maryland Entered by: BW Star Rating: 4
TOTALon: MD 424 on: MD 424 on: on: Pleasant Meadow Road N + S
TIME +RIGHT THRU LEFT U-TN TOTAL RIGHT THRU LEFT U-TN TOTAL RIGHT THRU LEFT U-TN TOTAL RIGHT THRU LEFT U-TN TOTAL E + W
AM
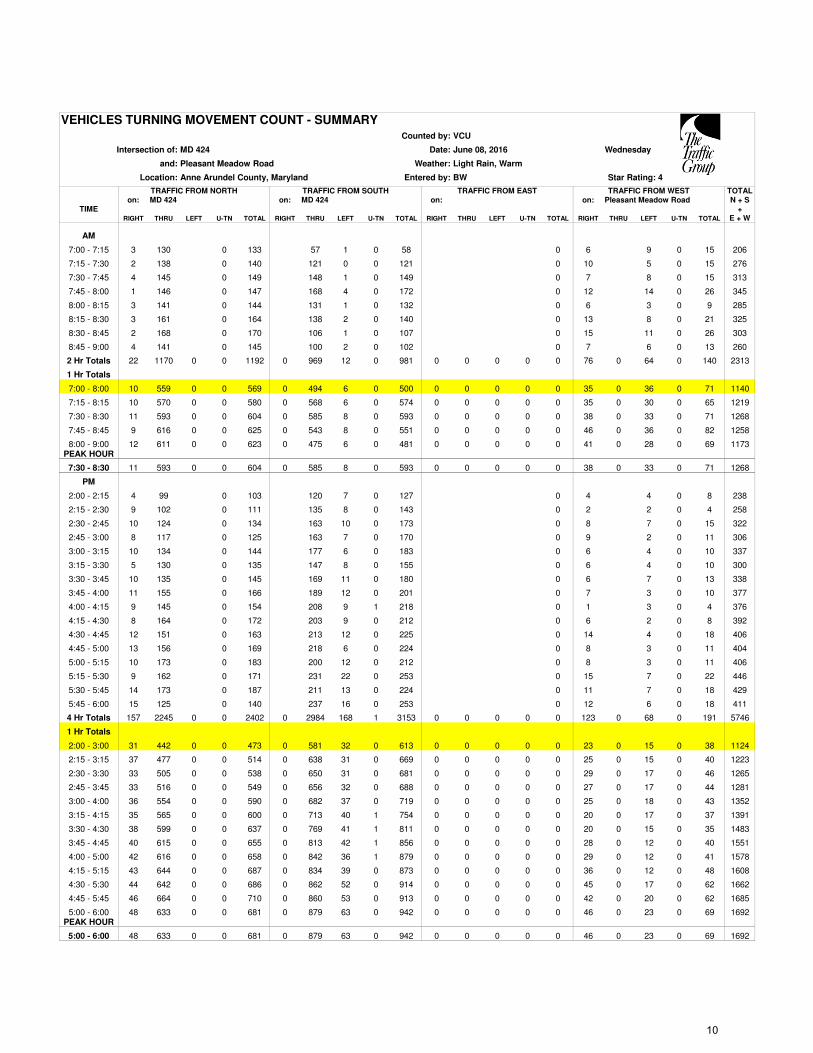
7:00 - 7:15 3 130 0 133 57 1 0 58 0 6 9 0 15 206
7:15 - 7:30 2 138 0 140 121 0 0 121 0 10 5 0 15 276
7:30 - 7:45 4 145 0 149 148 1 0 149 0 7 8 0 15 313
7:45 - 8:00 1 146 0 147 168 4 0 172 0 12 14 0 26 345
8:00 - 8:15 3 141 0 144 131 1 0 132 0 6 3 0 9 285
8:15 - 8:30 3 161 0 164 138 2 0 140 0 13 8 0 21 325
8:30 - 8:45 2 168 0 170 106 1 0 107 0 15 11 0 26 303
8:45 - 9:00 4 141 0 145 100 2 0 102 0 7 6 0 13 260
2 Hr Totals 22 1170 0 0 1192 0 969 12 0 981 0 0 0 0 0 76 0 64 0 140 2313
1 Hr Totals
7:00 - 8:00 10 559 0 0 569 0 494 6 0 500 0 0 0 0 0 35 0 36 0 71 1140
7:15 - 8:15 10 570 0 0 580 0 568 6 0 574 0 0 0 0 0 35 0 30 0 65 1219
7:30 - 8:30 11 593 0 0 604 0 585 8 0 593 0 0 0 0 0 38 0 33 0 71 1268
7:45 - 8:45 9 616 0 0 625 0 543 8 0 551 0 0 0 0 0 46 0 36 0 82 1258
8:00 - 9:00 12 611 0 0 623 0 475 6 0 481 0 0 0 0 0 41 0 28 0 69 1173
PEAK HOUR
7:30 - 8:30 11 593 0 0 604 0 585 8 0 593 0 0 0 0 0 38 0 33 0 71 1268
PM
2:00 - 2:15 4 99 0 103 120 7 0 127 0 4 4 0 8 238
2:15 - 2:30 9 102 0 111 135 8 0 143 0 2 2 0 4 258
2:30 - 2:45 10 124 0 134 163 10 0 173 0 8 7 0 15 322
2:45 - 3:00 8 117 0 125 163 7 0 170 0 9 2 0 11 306
3:00 - 3:15 10 134 0 144 177 6 0 183 0 6 4 0 10 337
3:15 - 3:30 5 130 0 135 147 8 0 155 0 6 4 0 10 300
3:30 - 3:45 10 135 0 145 169 11 0 180 0 6 7 0 13 338
3:45 - 4:00 11 155 0 166 189 12 0 201 0 7 3 0 10 377
4:00 - 4:15 9 145 0 154 208 9 1 218 0 1 3 0 4 376
4:15 - 4:30 8 164 0 172 203 9 0 212 0 6 2 0 8 392
4:30 - 4:45 12 151 0 163 213 12 0 225 0 14 4 0 18 406
4:45 - 5:00 13 156 0 169 218 6 0 224 0 8 3 0 11 404
5:00 - 5:15 10 173 0 183 200 12 0 212 0 8 3 0 11 406
5:15 - 5:30 9 162 0 171 231 22 0 253 0 15 7 0 22 446
5:30 - 5:45 14 173 0 187 211 13 0 224 0 11 7 0 18 429
5:45 - 6:00 15 125 0 140 237 16 0 253 0 12 6 0 18 411
4 Hr Totals 157 2245 0 0 2402 0 2984 168 1 3153 0 0 0 0 0 123 0 68 0 191 5746
1 Hr Totals
2:00 - 3:00 31 442 0 0 473 0 581 32 0 613 0 0 0 0 0 23 0 15 0 38 1124
2:15 - 3:15 37 477 0 0 514 0 638 31 0 669 0 0 0 0 0 25 0 15 0 40 1223
2:30 - 3:30 33 505 0 0 538 0 650 31 0 681 0 0 0 0 0 29 0 17 0 46 1265
2:45 - 3:45 33 516 0 0 549 0 656 32 0 688 0 0 0 0 0 27 0 17 0 44 1281
3:00 - 4:00 36 554 0 0 590 0 682 37 0 719 0 0 0 0 0 25 0 18 0 43 1352
3:15 - 4:15 35 565 0 0 600 0 713 40 1 754 0 0 0 0 0 20 0 17 0 37 1391
3:30 - 4:30 38 599 0 0 637 0 769 41 1 811 0 0 0 0 0 20 0 15 0 35 1483
3:45 - 4:45 40 615 0 0 655 0 813 42 1 856 0 0 0 0 0 28 0 12 0 40 1551
4:00 - 5:00 42 616 0 0 658 0 842 36 1 879 0 0 0 0 0 29 0 12 0 41 1578
4:15 - 5:15 43 644 0 0 687 0 834 39 0 873 0 0 0 0 0 36 0 12 0 48 1608
4:30 - 5:30 44 642 0 0 686 0 862 52 0 914 0 0 0 0 0 45 0 17 0 62 1662
4:45 - 5:45 46 664 0 0 710 0 860 53 0 913 0 0 0 0 0 42 0 20 0 62 1685
5:00 - 6:00 48 633 0 0 681 0 879 63 0 942 0 0 0 0 0 46 0 23 0 69 1692
PEAK HOUR
5:00 - 6:00 48 633 0 0 681 0 879 63 0 942 0 0 0 0 0 46 0 23 0 69 1692
TRAFFIC FROM NORTH TRAFFIC FROM SOUTH TRAFFIC FROM EAST TRAFFIC FROM WEST
10
Page 44
VEHICLES TURNING MOVEMENT COUNT - SUMMARYCounted by: VCU
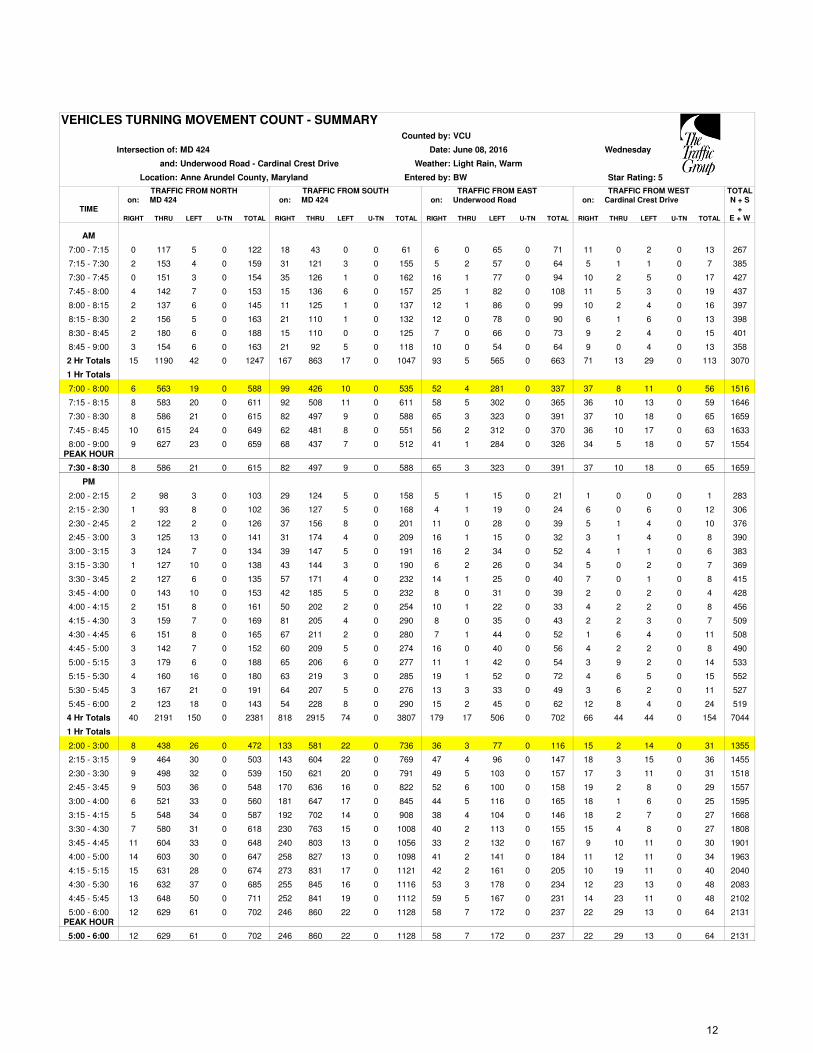
Intersection of: MD 424 Date: June 08, 2016 Wednesday
and: Underwood Road - Cardinal Crest Drive Weather: Light Rain, Warm
Location: Anne Arundel County, Maryland Entered by: BW Star Rating: 5
TOTALon: MD 424 on: MD 424 on: Underwood Road on: Cardinal Crest Drive N + S
TIME +RIGHT THRU LEFT U-TN TOTAL RIGHT THRU LEFT U-TN TOTAL RIGHT THRU LEFT U-TN TOTAL RIGHT THRU LEFT U-TN TOTAL E + W
AM
7:00 - 7:15 0 117 5 0 122 18 43 0 0 61 6 0 65 0 71 11 0 2 0 13 267
7:15 - 7:30 2 153 4 0 159 31 121 3 0 155 5 2 57 0 64 5 1 1 0 7 385
7:30 - 7:45 0 151 3 0 154 35 126 1 0 162 16 1 77 0 94 10 2 5 0 17 427
7:45 - 8:00 4 142 7 0 153 15 136 6 0 157 25 1 82 0 108 11 5 3 0 19 437
8:00 - 8:15 2 137 6 0 145 11 125 1 0 137 12 1 86 0 99 10 2 4 0 16 397
8:15 - 8:30 2 156 5 0 163 21 110 1 0 132 12 0 78 0 90 6 1 6 0 13 398
8:30 - 8:45 2 180 6 0 188 15 110 0 0 125 7 0 66 0 73 9 2 4 0 15 401
8:45 - 9:00 3 154 6 0 163 21 92 5 0 118 10 0 54 0 64 9 0 4 0 13 358
2 Hr Totals 15 1190 42 0 1247 167 863 17 0 1047 93 5 565 0 663 71 13 29 0 113 3070
1 Hr Totals
7:00 - 8:00 6 563 19 0 588 99 426 10 0 535 52 4 281 0 337 37 8 11 0 56 1516
7:15 - 8:15 8 583 20 0 611 92 508 11 0 611 58 5 302 0 365 36 10 13 0 59 1646
7:30 - 8:30 8 586 21 0 615 82 497 9 0 588 65 3 323 0 391 37 10 18 0 65 1659
7:45 - 8:45 10 615 24 0 649 62 481 8 0 551 56 2 312 0 370 36 10 17 0 63 1633
8:00 - 9:00 9 627 23 0 659 68 437 7 0 512 41 1 284 0 326 34 5 18 0 57 1554
PEAK HOUR
7:30 - 8:30 8 586 21 0 615 82 497 9 0 588 65 3 323 0 391 37 10 18 0 65 1659
PM
2:00 - 2:15 2 98 3 0 103 29 124 5 0 158 5 1 15 0 21 1 0 0 0 1 283
2:15 - 2:30 1 93 8 0 102 36 127 5 0 168 4 1 19 0 24 6 0 6 0 12 306
2:30 - 2:45 2 122 2 0 126 37 156 8 0 201 11 0 28 0 39 5 1 4 0 10 376
2:45 - 3:00 3 125 13 0 141 31 174 4 0 209 16 1 15 0 32 3 1 4 0 8 390
3:00 - 3:15 3 124 7 0 134 39 147 5 0 191 16 2 34 0 52 4 1 1 0 6 383
3:15 - 3:30 1 127 10 0 138 43 144 3 0 190 6 2 26 0 34 5 0 2 0 7 369
3:30 - 3:45 2 127 6 0 135 57 171 4 0 232 14 1 25 0 40 7 0 1 0 8 415
3:45 - 4:00 0 143 10 0 153 42 185 5 0 232 8 0 31 0 39 2 0 2 0 4 428
4:00 - 4:15 2 151 8 0 161 50 202 2 0 254 10 1 22 0 33 4 2 2 0 8 456
4:15 - 4:30 3 159 7 0 169 81 205 4 0 290 8 0 35 0 43 2 2 3 0 7 509
4:30 - 4:45 6 151 8 0 165 67 211 2 0 280 7 1 44 0 52 1 6 4 0 11 508
4:45 - 5:00 3 142 7 0 152 60 209 5 0 274 16 0 40 0 56 4 2 2 0 8 490
5:00 - 5:15 3 179 6 0 188 65 206 6 0 277 11 1 42 0 54 3 9 2 0 14 533
5:15 - 5:30 4 160 16 0 180 63 219 3 0 285 19 1 52 0 72 4 6 5 0 15 552
5:30 - 5:45 3 167 21 0 191 64 207 5 0 276 13 3 33 0 49 3 6 2 0 11 527
5:45 - 6:00 2 123 18 0 143 54 228 8 0 290 15 2 45 0 62 12 8 4 0 24 519
4 Hr Totals 40 2191 150 0 2381 818 2915 74 0 3807 179 17 506 0 702 66 44 44 0 154 7044
1 Hr Totals
2:00 - 3:00 8 438 26 0 472 133 581 22 0 736 36 3 77 0 116 15 2 14 0 31 1355
2:15 - 3:15 9 464 30 0 503 143 604 22 0 769 47 4 96 0 147 18 3 15 0 36 1455
2:30 - 3:30 9 498 32 0 539 150 621 20 0 791 49 5 103 0 157 17 3 11 0 31 1518
2:45 - 3:45 9 503 36 0 548 170 636 16 0 822 52 6 100 0 158 19 2 8 0 29 1557
3:00 - 4:00 6 521 33 0 560 181 647 17 0 845 44 5 116 0 165 18 1 6 0 25 1595
3:15 - 4:15 5 548 34 0 587 192 702 14 0 908 38 4 104 0 146 18 2 7 0 27 1668
3:30 - 4:30 7 580 31 0 618 230 763 15 0 1008 40 2 113 0 155 15 4 8 0 27 1808
3:45 - 4:45 11 604 33 0 648 240 803 13 0 1056 33 2 132 0 167 9 10 11 0 30 1901
4:00 - 5:00 14 603 30 0 647 258 827 13 0 1098 41 2 141 0 184 11 12 11 0 34 1963
4:15 - 5:15 15 631 28 0 674 273 831 17 0 1121 42 2 161 0 205 10 19 11 0 40 2040
4:30 - 5:30 16 632 37 0 685 255 845 16 0 1116 53 3 178 0 234 12 23 13 0 48 2083
4:45 - 5:45 13 648 50 0 711 252 841 19 0 1112 59 5 167 0 231 14 23 11 0 48 2102
5:00 - 6:00 12 629 61 0 702 246 860 22 0 1128 58 7 172 0 237 22 29 13 0 64 2131
PEAK HOUR
5:00 - 6:00 12 629 61 0 702 246 860 22 0 1128 58 7 172 0 237 22 29 13 0 64 2131
TRAFFIC FROM NORTH TRAFFIC FROM SOUTH TRAFFIC FROM EAST TRAFFIC FROM WEST
12
Page 46
VEHICLES TURNING MOVEMENT COUNT - SUMMARYCounted by: VCU
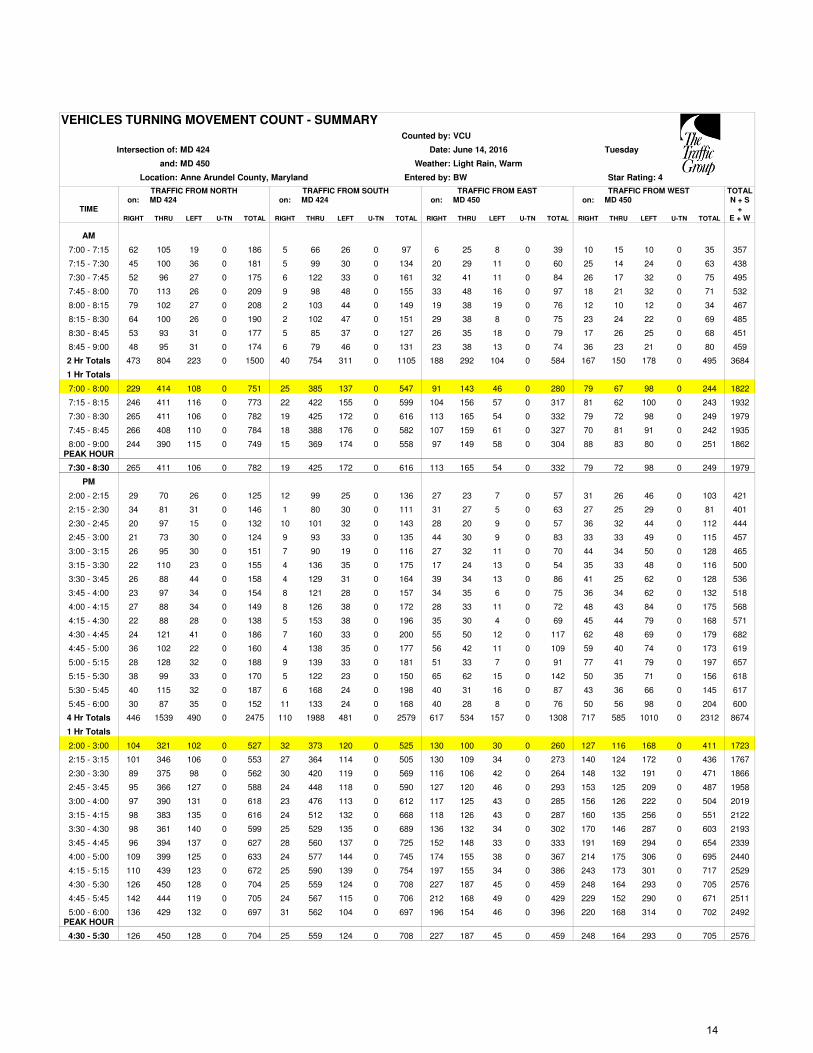
Intersection of: MD 424 Date: June 14, 2016 Tuesday
and: MD 450 Weather: Light Rain, Warm
Location: Anne Arundel County, Maryland Entered by: BW Star Rating: 4
TOTALon: MD 424 on: MD 424 on: MD 450 on: MD 450 N + S
TIME +RIGHT THRU LEFT U-TN TOTAL RIGHT THRU LEFT U-TN TOTAL RIGHT THRU LEFT U-TN TOTAL RIGHT THRU LEFT U-TN TOTAL E + W
AM
7:00 - 7:15 62 105 19 0 186 5 66 26 0 97 6 25 8 0 39 10 15 10 0 35 357
7:15 - 7:30 45 100 36 0 181 5 99 30 0 134 20 29 11 0 60 25 14 24 0 63 438
7:30 - 7:45 52 96 27 0 175 6 122 33 0 161 32 41 11 0 84 26 17 32 0 75 495
7:45 - 8:00 70 113 26 0 209 9 98 48 0 155 33 48 16 0 97 18 21 32 0 71 532
8:00 - 8:15 79 102 27 0 208 2 103 44 0 149 19 38 19 0 76 12 10 12 0 34 467
8:15 - 8:30 64 100 26 0 190 2 102 47 0 151 29 38 8 0 75 23 24 22 0 69 485
8:30 - 8:45 53 93 31 0 177 5 85 37 0 127 26 35 18 0 79 17 26 25 0 68 451
8:45 - 9:00 48 95 31 0 174 6 79 46 0 131 23 38 13 0 74 36 23 21 0 80 459
2 Hr Totals 473 804 223 0 1500 40 754 311 0 1105 188 292 104 0 584 167 150 178 0 495 3684
1 Hr Totals
7:00 - 8:00 229 414 108 0 751 25 385 137 0 547 91 143 46 0 280 79 67 98 0 244 1822
7:15 - 8:15 246 411 116 0 773 22 422 155 0 599 104 156 57 0 317 81 62 100 0 243 1932
7:30 - 8:30 265 411 106 0 782 19 425 172 0 616 113 165 54 0 332 79 72 98 0 249 1979
7:45 - 8:45 266 408 110 0 784 18 388 176 0 582 107 159 61 0 327 70 81 91 0 242 1935
8:00 - 9:00 244 390 115 0 749 15 369 174 0 558 97 149 58 0 304 88 83 80 0 251 1862
PEAK HOUR
7:30 - 8:30 265 411 106 0 782 19 425 172 0 616 113 165 54 0 332 79 72 98 0 249 1979
PM
2:00 - 2:15 29 70 26 0 125 12 99 25 0 136 27 23 7 0 57 31 26 46 0 103 421
2:15 - 2:30 34 81 31 0 146 1 80 30 0 111 31 27 5 0 63 27 25 29 0 81 401
2:30 - 2:45 20 97 15 0 132 10 101 32 0 143 28 20 9 0 57 36 32 44 0 112 444
2:45 - 3:00 21 73 30 0 124 9 93 33 0 135 44 30 9 0 83 33 33 49 0 115 457
3:00 - 3:15 26 95 30 0 151 7 90 19 0 116 27 32 11 0 70 44 34 50 0 128 465
3:15 - 3:30 22 110 23 0 155 4 136 35 0 175 17 24 13 0 54 35 33 48 0 116 500
3:30 - 3:45 26 88 44 0 158 4 129 31 0 164 39 34 13 0 86 41 25 62 0 128 536
3:45 - 4:00 23 97 34 0 154 8 121 28 0 157 34 35 6 0 75 36 34 62 0 132 518
4:00 - 4:15 27 88 34 0 149 8 126 38 0 172 28 33 11 0 72 48 43 84 0 175 568
4:15 - 4:30 22 88 28 0 138 5 153 38 0 196 35 30 4 0 69 45 44 79 0 168 571
4:30 - 4:45 24 121 41 0 186 7 160 33 0 200 55 50 12 0 117 62 48 69 0 179 682
4:45 - 5:00 36 102 22 0 160 4 138 35 0 177 56 42 11 0 109 59 40 74 0 173 619
5:00 - 5:15 28 128 32 0 188 9 139 33 0 181 51 33 7 0 91 77 41 79 0 197 657
5:15 - 5:30 38 99 33 0 170 5 122 23 0 150 65 62 15 0 142 50 35 71 0 156 618
5:30 - 5:45 40 115 32 0 187 6 168 24 0 198 40 31 16 0 87 43 36 66 0 145 617
5:45 - 6:00 30 87 35 0 152 11 133 24 0 168 40 28 8 0 76 50 56 98 0 204 600
4 Hr Totals 446 1539 490 0 2475 110 1988 481 0 2579 617 534 157 0 1308 717 585 1010 0 2312 8674
1 Hr Totals
2:00 - 3:00 104 321 102 0 527 32 373 120 0 525 130 100 30 0 260 127 116 168 0 411 1723
2:15 - 3:15 101 346 106 0 553 27 364 114 0 505 130 109 34 0 273 140 124 172 0 436 1767
2:30 - 3:30 89 375 98 0 562 30 420 119 0 569 116 106 42 0 264 148 132 191 0 471 1866
2:45 - 3:45 95 366 127 0 588 24 448 118 0 590 127 120 46 0 293 153 125 209 0 487 1958
3:00 - 4:00 97 390 131 0 618 23 476 113 0 612 117 125 43 0 285 156 126 222 0 504 2019
3:15 - 4:15 98 383 135 0 616 24 512 132 0 668 118 126 43 0 287 160 135 256 0 551 2122
3:30 - 4:30 98 361 140 0 599 25 529 135 0 689 136 132 34 0 302 170 146 287 0 603 2193
3:45 - 4:45 96 394 137 0 627 28 560 137 0 725 152 148 33 0 333 191 169 294 0 654 2339
4:00 - 5:00 109 399 125 0 633 24 577 144 0 745 174 155 38 0 367 214 175 306 0 695 2440
4:15 - 5:15 110 439 123 0 672 25 590 139 0 754 197 155 34 0 386 243 173 301 0 717 2529
4:30 - 5:30 126 450 128 0 704 25 559 124 0 708 227 187 45 0 459 248 164 293 0 705 2576
4:45 - 5:45 142 444 119 0 705 24 567 115 0 706 212 168 49 0 429 229 152 290 0 671 2511
5:00 - 6:00 136 429 132 0 697 31 562 104 0 697 196 154 46 0 396 220 168 314 0 702 2492
PEAK HOUR
4:30 - 5:30 126 450 128 0 704 25 559 124 0 708 227 187 45 0 459 248 164 293 0 705 2576
TRAFFIC FROM NORTH TRAFFIC FROM SOUTH TRAFFIC FROM EAST TRAFFIC FROM WEST
14
Page 48
VEHICLES TURNING MOVEMENT COUNT - SUMMARYCounted by: VCU
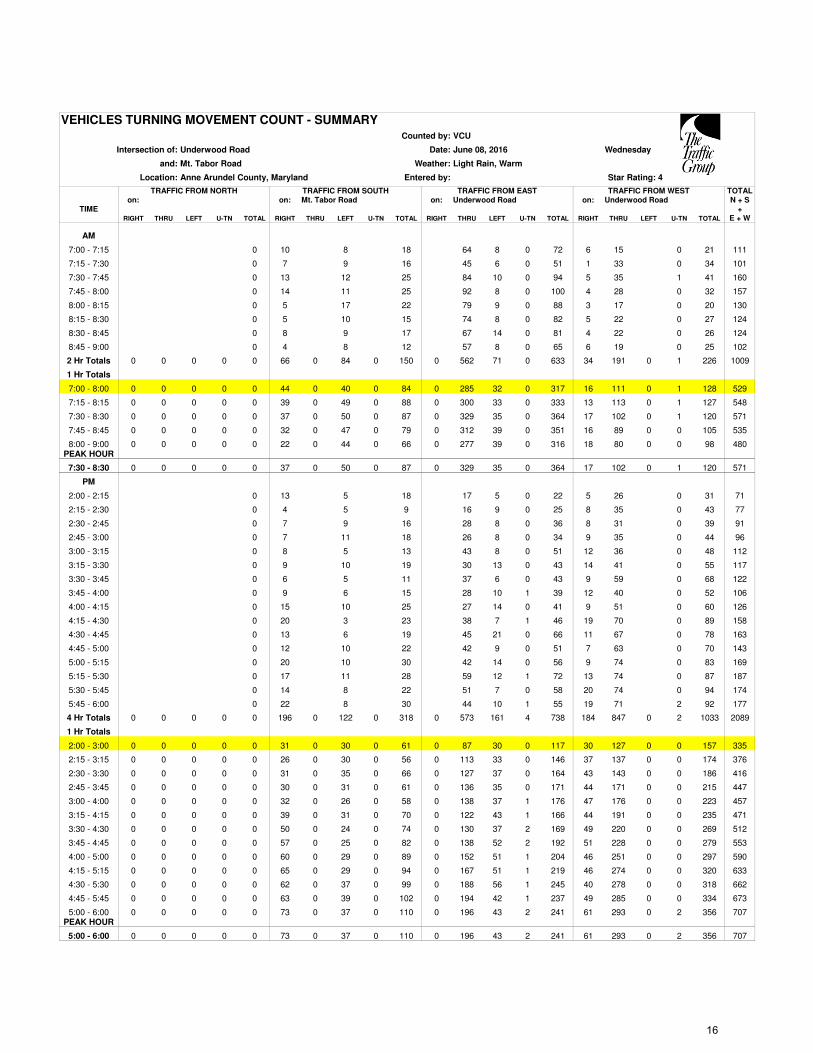
Intersection of: Underwood Road Date: June 08, 2016 Wednesday
and: Mt. Tabor Road Weather: Light Rain, Warm
Location: Anne Arundel County, Maryland Entered by: Star Rating: 4
TOTALon: on: Mt. Tabor Road on: Underwood Road on: Underwood Road N + S
TIME +RIGHT THRU LEFT U-TN TOTAL RIGHT THRU LEFT U-TN TOTAL RIGHT THRU LEFT U-TN TOTAL RIGHT THRU LEFT U-TN TOTAL E + W
AM
7:00 - 7:15 0 10 8 18 64 8 0 72 6 15 0 21 111
7:15 - 7:30 0 7 9 16 45 6 0 51 1 33 0 34 101
7:30 - 7:45 0 13 12 25 84 10 0 94 5 35 1 41 160
7:45 - 8:00 0 14 11 25 92 8 0 100 4 28 0 32 157
8:00 - 8:15 0 5 17 22 79 9 0 88 3 17 0 20 130
8:15 - 8:30 0 5 10 15 74 8 0 82 5 22 0 27 124
8:30 - 8:45 0 8 9 17 67 14 0 81 4 22 0 26 124
8:45 - 9:00 0 4 8 12 57 8 0 65 6 19 0 25 102
2 Hr Totals 0 0 0 0 0 66 0 84 0 150 0 562 71 0 633 34 191 0 1 226 1009
1 Hr Totals
7:00 - 8:00 0 0 0 0 0 44 0 40 0 84 0 285 32 0 317 16 111 0 1 128 529
7:15 - 8:15 0 0 0 0 0 39 0 49 0 88 0 300 33 0 333 13 113 0 1 127 548
7:30 - 8:30 0 0 0 0 0 37 0 50 0 87 0 329 35 0 364 17 102 0 1 120 571
7:45 - 8:45 0 0 0 0 0 32 0 47 0 79 0 312 39 0 351 16 89 0 0 105 535
8:00 - 9:00 0 0 0 0 0 22 0 44 0 66 0 277 39 0 316 18 80 0 0 98 480
PEAK HOUR
7:30 - 8:30 0 0 0 0 0 37 0 50 0 87 0 329 35 0 364 17 102 0 1 120 571
PM
2:00 - 2:15 0 13 5 18 17 5 0 22 5 26 0 31 71
2:15 - 2:30 0 4 5 9 16 9 0 25 8 35 0 43 77
2:30 - 2:45 0 7 9 16 28 8 0 36 8 31 0 39 91
2:45 - 3:00 0 7 11 18 26 8 0 34 9 35 0 44 96
3:00 - 3:15 0 8 5 13 43 8 0 51 12 36 0 48 112
3:15 - 3:30 0 9 10 19 30 13 0 43 14 41 0 55 117
3:30 - 3:45 0 6 5 11 37 6 0 43 9 59 0 68 122
3:45 - 4:00 0 9 6 15 28 10 1 39 12 40 0 52 106
4:00 - 4:15 0 15 10 25 27 14 0 41 9 51 0 60 126
4:15 - 4:30 0 20 3 23 38 7 1 46 19 70 0 89 158
4:30 - 4:45 0 13 6 19 45 21 0 66 11 67 0 78 163
4:45 - 5:00 0 12 10 22 42 9 0 51 7 63 0 70 143
5:00 - 5:15 0 20 10 30 42 14 0 56 9 74 0 83 169
5:15 - 5:30 0 17 11 28 59 12 1 72 13 74 0 87 187
5:30 - 5:45 0 14 8 22 51 7 0 58 20 74 0 94 174
5:45 - 6:00 0 22 8 30 44 10 1 55 19 71 2 92 177
4 Hr Totals 0 0 0 0 0 196 0 122 0 318 0 573 161 4 738 184 847 0 2 1033 2089
1 Hr Totals
2:00 - 3:00 0 0 0 0 0 31 0 30 0 61 0 87 30 0 117 30 127 0 0 157 335
2:15 - 3:15 0 0 0 0 0 26 0 30 0 56 0 113 33 0 146 37 137 0 0 174 376
2:30 - 3:30 0 0 0 0 0 31 0 35 0 66 0 127 37 0 164 43 143 0 0 186 416
2:45 - 3:45 0 0 0 0 0 30 0 31 0 61 0 136 35 0 171 44 171 0 0 215 447
3:00 - 4:00 0 0 0 0 0 32 0 26 0 58 0 138 37 1 176 47 176 0 0 223 457
3:15 - 4:15 0 0 0 0 0 39 0 31 0 70 0 122 43 1 166 44 191 0 0 235 471
3:30 - 4:30 0 0 0 0 0 50 0 24 0 74 0 130 37 2 169 49 220 0 0 269 512
3:45 - 4:45 0 0 0 0 0 57 0 25 0 82 0 138 52 2 192 51 228 0 0 279 553
4:00 - 5:00 0 0 0 0 0 60 0 29 0 89 0 152 51 1 204 46 251 0 0 297 590
4:15 - 5:15 0 0 0 0 0 65 0 29 0 94 0 167 51 1 219 46 274 0 0 320 633
4:30 - 5:30 0 0 0 0 0 62 0 37 0 99 0 188 56 1 245 40 278 0 0 318 662
4:45 - 5:45 0 0 0 0 0 63 0 39 0 102 0 194 42 1 237 49 285 0 0 334 673
5:00 - 6:00 0 0 0 0 0 73 0 37 0 110 0 196 43 2 241 61 293 0 2 356 707
PEAK HOUR
5:00 - 6:00 0 0 0 0 0 73 0 37 0 110 0 196 43 2 241 61 293 0 2 356 707
TRAFFIC FROM NORTH TRAFFIC FROM SOUTH TRAFFIC FROM EAST TRAFFIC FROM WEST
16
Page 50
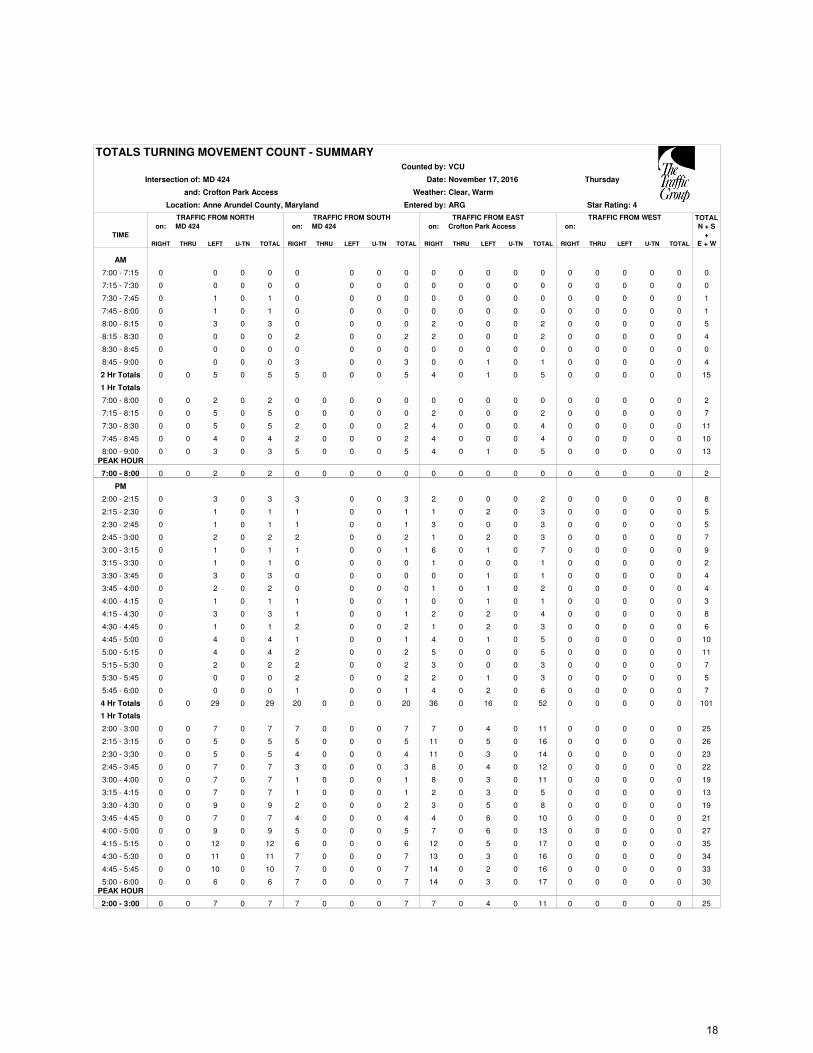
TOTALS TURNING MOVEMENT COUNT - SUMMARY
Counted by: VCU
Intersection of: MD 424 Date: November 17, 2016 Thursday
and: Crofton Park Access Weather: Clear, Warm
Location: Anne Arundel County, Maryland Entered by: ARG Star Rating: 4
TOTAL
on: MD 424 on: MD 424 on: Crofton Park Access on: N + S
TIME +
RIGHT THRU LEFT U-TN TOTAL RIGHT THRU LEFT U-TN TOTAL RIGHT THRU LEFT U-TN TOTAL RIGHT THRU LEFT U-TN TOTAL E + W
AM
7:00 - 7:15 0 0 0 0 0 0 0 0 0 0 0 0 0 0 0 0 0 0 0
7:15 - 7:30 0 0 0 0 0 0 0 0 0 0 0 0 0 0 0 0 0 0 0
7:30 - 7:45 0 1 0 1 0 0 0 0 0 0 0 0 0 0 0 0 0 0 1
7:45 - 8:00 0 1 0 1 0 0 0 0 0 0 0 0 0 0 0 0 0 0 1
8:00 - 8:15 0 3 0 3 0 0 0 0 2 0 0 0 2 0 0 0 0 0 5
8:15 - 8:30 0 0 0 0 2 0 0 2 2 0 0 0 2 0 0 0 0 0 4
8:30 - 8:45 0 0 0 0 0 0 0 0 0 0 0 0 0 0 0 0 0 0 0
8:45 - 9:00 0 0 0 0 3 0 0 3 0 0 1 0 1 0 0 0 0 0 4
2 Hr Totals 0 0 5 0 5 5 0 0 0 5 4 0 1 0 5 0 0 0 0 0 15
1 Hr Totals
7:00 - 8:00 0 0 2 0 2 0 0 0 0 0 0 0 0 0 0 0 0 0 0 0 2
7:15 - 8:15 0 0 5 0 5 0 0 0 0 0 2 0 0 0 2 0 0 0 0 0 7
7:30 - 8:30 0 0 5 0 5 2 0 0 0 2 4 0 0 0 4 0 0 0 0 0 11
7:45 - 8:45 0 0 4 0 4 2 0 0 0 2 4 0 0 0 4 0 0 0 0 0 10
8:00 - 9:00 0 0 3 0 3 5 0 0 0 5 4 0 1 0 5 0 0 0 0 0 13
PEAK HOUR
7:00 - 8:00 0 0 2 0 2 0 0 0 0 0 0 0 0 0 0 0 0 0 0 0 2
PM
2:00 - 2:15 0 3 0 3 3 0 0 3 2 0 0 0 2 0 0 0 0 0 8
2:15 - 2:30 0 1 0 1 1 0 0 1 1 0 2 0 3 0 0 0 0 0 5
2:30 - 2:45 0 1 0 1 1 0 0 1 3 0 0 0 3 0 0 0 0 0 5
2:45 - 3:00 0 2 0 2 2 0 0 2 1 0 2 0 3 0 0 0 0 0 7
3:00 - 3:15 0 1 0 1 1 0 0 1 6 0 1 0 7 0 0 0 0 0 9
3:15 - 3:30 0 1 0 1 0 0 0 0 1 0 0 0 1 0 0 0 0 0 2
3:30 - 3:45 0 3 0 3 0 0 0 0 0 0 1 0 1 0 0 0 0 0 4
3:45 - 4:00 0 2 0 2 0 0 0 0 1 0 1 0 2 0 0 0 0 0 4
4:00 - 4:15 0 1 0 1 1 0 0 1 0 0 1 0 1 0 0 0 0 0 3
4:15 - 4:30 0 3 0 3 1 0 0 1 2 0 2 0 4 0 0 0 0 0 8
4:30 - 4:45 0 1 0 1 2 0 0 2 1 0 2 0 3 0 0 0 0 0 6
4:45 - 5:00 0 4 0 4 1 0 0 1 4 0 1 0 5 0 0 0 0 0 10
5:00 - 5:15 0 4 0 4 2 0 0 2 5 0 0 0 5 0 0 0 0 0 11
5:15 - 5:30 0 2 0 2 2 0 0 2 3 0 0 0 3 0 0 0 0 0 7
5:30 - 5:45 0 0 0 0 2 0 0 2 2 0 1 0 3 0 0 0 0 0 5
5:45 - 6:00 0 0 0 0 1 0 0 1 4 0 2 0 6 0 0 0 0 0 7
4 Hr Totals 0 0 29 0 29 20 0 0 0 20 36 0 16 0 52 0 0 0 0 0 101
1 Hr Totals
2:00 - 3:00 0 0 7 0 7 7 0 0 0 7 7 0 4 0 11 0 0 0 0 0 25
2:15 - 3:15 0 0 5 0 5 5 0 0 0 5 11 0 5 0 16 0 0 0 0 0 26
2:30 - 3:30 0 0 5 0 5 4 0 0 0 4 11 0 3 0 14 0 0 0 0 0 23
2:45 - 3:45 0 0 7 0 7 3 0 0 0 3 8 0 4 0 12 0 0 0 0 0 22
3:00 - 4:00 0 0 7 0 7 1 0 0 0 1 8 0 3 0 11 0 0 0 0 0 19
3:15 - 4:15 0 0 7 0 7 1 0 0 0 1 2 0 3 0 5 0 0 0 0 0 13
3:30 - 4:30 0 0 9 0 9 2 0 0 0 2 3 0 5 0 8 0 0 0 0 0 19
3:45 - 4:45 0 0 7 0 7 4 0 0 0 4 4 0 6 0 10 0 0 0 0 0 21
4:00 - 5:00 0 0 9 0 9 5 0 0 0 5 7 0 6 0 13 0 0 0 0 0 27
4:15 - 5:15 0 0 12 0 12 6 0 0 0 6 12 0 5 0 17 0 0 0 0 0 35
4:30 - 5:30 0 0 11 0 11 7 0 0 0 7 13 0 3 0 16 0 0 0 0 0 34
4:45 - 5:45 0 0 10 0 10 7 0 0 0 7 14 0 2 0 16 0 0 0 0 0 33
5:00 - 6:00 0 0 6 0 6 7 0 0 0 7 14 0 3 0 17 0 0 0 0 0 30
PEAK HOUR
2:00 - 3:00 0 0 7 0 7 7 0 0 0 7 7 0 4 0 11 0 0 0 0 0 25
TRAFFIC FROM NORTH TRAFFIC FROM SOUTH TRAFFIC FROM EAST TRAFFIC FROM WEST
18
Page 52
TOTALS TURNING MOVEMENT COUNT - SUMMARY
Counted by: VCU
Intersection of: MD 424 Date: November 17, 2016 Thursday
and: Crofton Middle Access - Old Post Road Weather: Clear, Warm
Location: Anne Arundel County, Maryland Entered by: ARG Star Rating: 4
TOTAL
on: MD 424 on: MD 424 on: Crofton Middle Access on: Old Post Road N + S
TIME +
RIGHT THRU LEFT U-TN TOTAL RIGHT THRU LEFT U-TN TOTAL RIGHT THRU LEFT U-TN TOTAL RIGHT THRU LEFT U-TN TOTAL E + W
AM
7:00 - 7:15 0 2 0 2 2 0 0 2 1 0 0 0 1 0 0 0 0 0 5
7:15 - 7:30 0 16 0 16 4 0 0 4 11 0 5 0 16 0 0 0 0 0 36
7:30 - 7:45 0 2 0 2 2 0 0 2 3 0 6 0 9 0 0 0 0 0 13
7:45 - 8:00 0 28 1 29 13 0 0 13 27 0 4 0 31 0 0 0 0 0 73
8:00 - 8:15 1 16 0 17 8 0 0 8 15 0 3 0 18 1 0 0 0 1 44
8:15 - 8:30 0 7 0 7 13 0 0 13 1 0 2 0 3 0 0 0 0 0 23
8:30 - 8:45 0 41 0 41 29 0 0 29 16 0 3 0 19 0 0 0 0 0 89
8:45 - 9:00 0 82 0 82 51 0 0 51 94 0 22 0 116 0 0 0 0 0 249
2 Hr Totals 1 0 194 1 196 122 0 0 0 122 168 0 45 0 213 1 0 0 0 1 532
1 Hr Totals
7:00 - 8:00 0 0 48 1 49 21 0 0 0 21 42 0 15 0 57 0 0 0 0 0 127
7:15 - 8:15 1 0 62 1 64 27 0 0 0 27 56 0 18 0 74 1 0 0 0 1 166
7:30 - 8:30 1 0 53 1 55 36 0 0 0 36 46 0 15 0 61 1 0 0 0 1 153
7:45 - 8:45 1 0 92 1 94 63 0 0 0 63 59 0 12 0 71 1 0 0 0 1 229
8:00 - 9:00 1 0 146 0 147 101 0 0 0 101 126 0 30 0 156 1 0 0 0 1 405
PEAK HOUR
7:00 - 8:00 0 0 48 1 49 21 0 0 0 21 42 0 15 0 57 0 0 0 0 0 127
PM
2:00 - 2:15 0 2 0 2 1 0 0 1 7 0 1 0 8 1 0 0 0 1 12
2:15 - 2:30 0 3 0 3 0 0 0 0 1 0 2 0 3 0 0 0 0 0 6
2:30 - 2:45 0 2 0 2 2 0 0 2 0 0 0 0 0 0 0 0 0 0 4
2:45 - 3:00 0 2 0 2 2 0 0 2 3 0 2 0 5 0 0 0 0 0 9
3:00 - 3:15 0 5 0 5 3 0 0 3 1 0 0 0 1 0 0 0 0 0 9
3:15 - 3:30 0 9 0 9 4 0 0 4 9 0 2 0 11 0 0 0 0 0 24
3:30 - 3:45 0 25 0 25 13 1 0 14 8 0 5 0 13 0 0 0 0 0 52
3:45 - 4:00 0 16 0 16 12 0 0 12 34 0 9 0 43 0 0 0 0 0 71
4:00 - 4:15 0 2 0 2 1 1 0 2 45 0 11 0 56 0 0 0 0 0 60
4:15 - 4:30 1 0 0 1 2 1 0 3 10 0 9 0 19 0 0 0 0 0 23
4:30 - 4:45 1 6 0 7 2 0 0 2 1 0 4 0 5 1 0 0 0 1 15
4:45 - 5:00 0 10 0 10 17 0 0 17 15 0 9 0 24 0 0 0 0 0 51
5:00 - 5:15 0 4 0 4 2 0 0 2 24 0 10 0 34 0 0 1 0 1 41
5:15 - 5:30 0 1 0 1 1 0 0 1 3 0 2 0 5 0 0 0 0 0 7
5:30 - 5:45 0 2 0 2 0 0 0 0 7 0 3 0 10 1 0 1 0 2 14
5:45 - 6:00 0 2 0 2 1 1 0 2 4 0 2 0 6 1 0 0 0 1 11
4 Hr Totals 2 0 91 0 93 63 0 4 0 67 172 0 71 0 243 4 0 2 0 6 409
1 Hr Totals
2:00 - 3:00 0 0 9 0 9 5 0 0 0 5 11 0 5 0 16 1 0 0 0 1 31
2:15 - 3:15 0 0 12 0 12 7 0 0 0 7 5 0 4 0 9 0 0 0 0 0 28
2:30 - 3:30 0 0 18 0 18 11 0 0 0 11 13 0 4 0 17 0 0 0 0 0 46
2:45 - 3:45 0 0 41 0 41 22 0 1 0 23 21 0 9 0 30 0 0 0 0 0 94
3:00 - 4:00 0 0 55 0 55 32 0 1 0 33 52 0 16 0 68 0 0 0 0 0 156
3:15 - 4:15 0 0 52 0 52 30 0 2 0 32 96 0 27 0 123 0 0 0 0 0 207
3:30 - 4:30 1 0 43 0 44 28 0 3 0 31 97 0 34 0 131 0 0 0 0 0 206
3:45 - 4:45 2 0 24 0 26 17 0 2 0 19 90 0 33 0 123 1 0 0 0 1 169
4:00 - 5:00 2 0 18 0 20 22 0 2 0 24 71 0 33 0 104 1 0 0 0 1 149
4:15 - 5:15 2 0 20 0 22 23 0 1 0 24 50 0 32 0 82 1 0 1 0 2 130
4:30 - 5:30 1 0 21 0 22 22 0 0 0 22 43 0 25 0 68 1 0 1 0 2 114
4:45 - 5:45 0 0 17 0 17 20 0 0 0 20 49 0 24 0 73 1 0 2 0 3 113
5:00 - 6:00 0 0 9 0 9 4 0 1 0 5 38 0 17 0 55 2 0 2 0 4 73
PEAK HOUR
2:00 - 3:00 0 0 9 0 9 5 0 0 0 5 11 0 5 0 16 1 0 0 0 1 31
TRAFFIC FROM NORTH TRAFFIC FROM SOUTH TRAFFIC FROM EAST TRAFFIC FROM WEST
20
Page 54
APPENDIX B
Intersection Capacity
Analysis Worksheets
Page 55
rh, 160106\rev2\clv\1.xls-clv, f11/28/16
CRITICAL LANE VOLUME (CLV) METHODOLOGYfor MSHA
E/W Road: Riedel Road Date of Count: 6/8/2016
N/S Road: MD 424 Day of Count: Wednesday
Conditions: Existing Traffic Analyst: Richard Huang
MD 424
Peak: 7:00 -8:00
Peak: 2:00 -3:00 329 246 PM
270 84 AM
T L
T L
R R 402 227
L L 339 202
AM PM
RIEDEL ROAD
T R
T R
AM 339 232
PM 274 292
MD 424
Capacity Analysis
Morning Peak Hour Evening Peak Hour
Thru Volumes + Opposing Lefts AM Thru Volumes + Opposing Lefts PM
Dir VOL x LUF = Total VOL x LUF = Total CLV Dir VOL x LUF = Total VOL x LUF = Total CLV
WB 339 339 339 WB 202 202 202
NB 339 339 84 1.00 84 NB 274 274 246 1.00 246
423 520
SB 270 270 SB 329 329
CLV TOTAL= 762 CLV TOTAL= 722
Level of Service (LOS )= A Level of Service (LOS )= A
Scenario ID - EXIST1 CLV V/C =0.48 CLV V/C =0.45
1.00
1.00
1.00
1.00
1.00
1.00
1
Page 56
rh, 160106\rev2\clv\1.xls-clv, f11/28/16
CRITICAL LANE VOLUME (CLV) METHODOLOGYfor MSHA
E/W Road: Riedel Road Date of Count: 6/8/2016
N/S Road: MD 424 Day of Count: Wednesday
Conditions: Background Traffic Analyst: Richard Huang
MD 424
Peak: 7:00 -8:00
Peak: 2:00 -3:00 337 246 PM
284 84 AM
T L
T L
R R 402 227
L L 339 202
AM PM
RIEDEL ROAD
T R
T R
AM 353 232
PM 282 292
MD 424
Capacity Analysis
Morning Peak Hour Evening Peak Hour
Thru Volumes + Opposing Lefts AM Thru Volumes + Opposing Lefts PM
Dir VOL x LUF = Total VOL x LUF = Total CLV Dir VOL x LUF = Total VOL x LUF = Total CLV
WB 339 339 339 WB 202 202 202
NB 353 353 84 1.00 84 NB 282 282 246 1.00 246
437 528
SB 284 284 SB 337 337
CLV TOTAL= 776 CLV TOTAL= 730
Level of Service (LOS )= A Level of Service (LOS )= A
Scenario ID - BACK1 CLV V/C =0.49 CLV V/C =0.46
1.00
1.00
1.00
1.00
1.00
1.00
2
Page 57
rh, 160106\rev2\clv\1.xls-clv, f11/28/16
CRITICAL LANE VOLUME (CLV) METHODOLOGYfor MSHA
E/W Road: Riedel Road Date of Count: 6/8/2016
N/S Road: MD 424 Day of Count: Wednesday
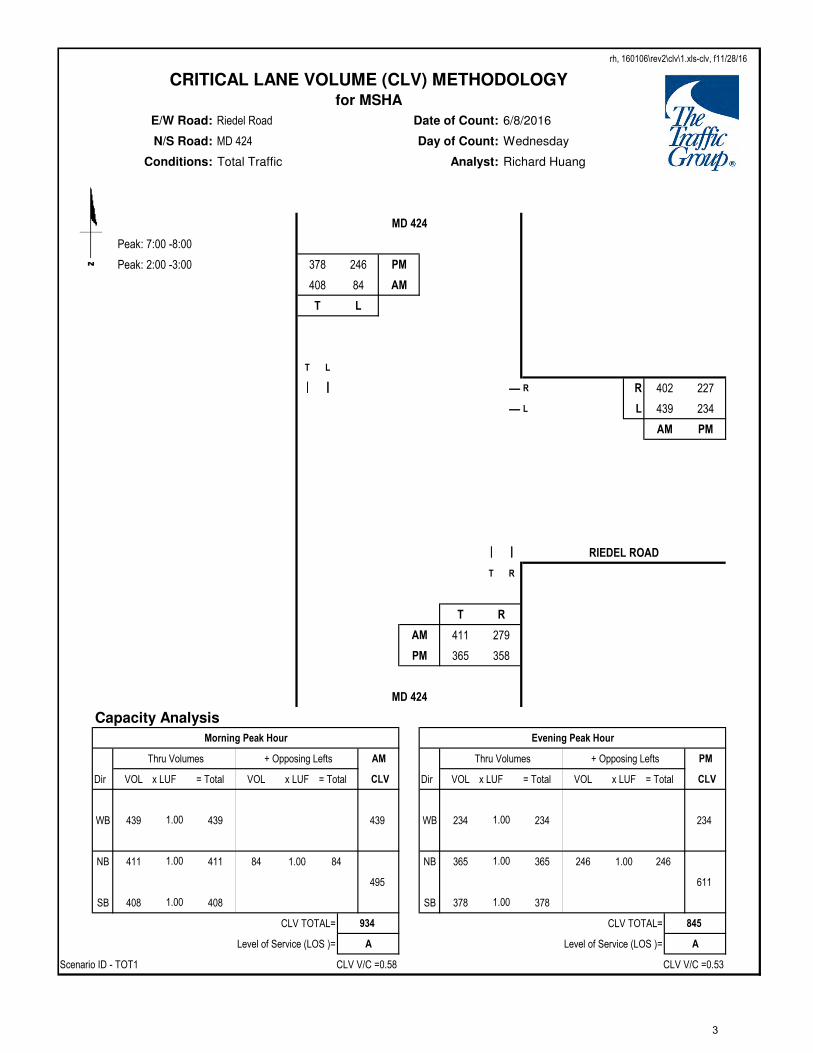
Conditions: Total Traffic Analyst: Richard Huang
MD 424
Peak: 7:00 -8:00
Peak: 2:00 -3:00 378 246 PM
408 84 AM
T L
T L
R R 402 227
L L 439 234
AM PM
RIEDEL ROAD
T R
T R
AM 411 279
PM 365 358
MD 424
Capacity Analysis
Morning Peak Hour Evening Peak Hour
Thru Volumes + Opposing Lefts AM Thru Volumes + Opposing Lefts PM
Dir VOL x LUF = Total VOL x LUF = Total CLV Dir VOL x LUF = Total VOL x LUF = Total CLV
WB 439 439 439 WB 234 234 234
NB 411 411 84 1.00 84 NB 365 365 246 1.00 246
495 611
SB 408 408 SB 378 378
CLV TOTAL= 934 CLV TOTAL= 845
Level of Service (LOS )= A Level of Service (LOS )= A
Scenario ID - TOT1 CLV V/C =0.58 CLV V/C =0.53
1.00
1.00
1.00
1.00
1.00
1.00
3
Page 58
rh, 160106\rev2\clv\2.xls-clv, f11/28/16
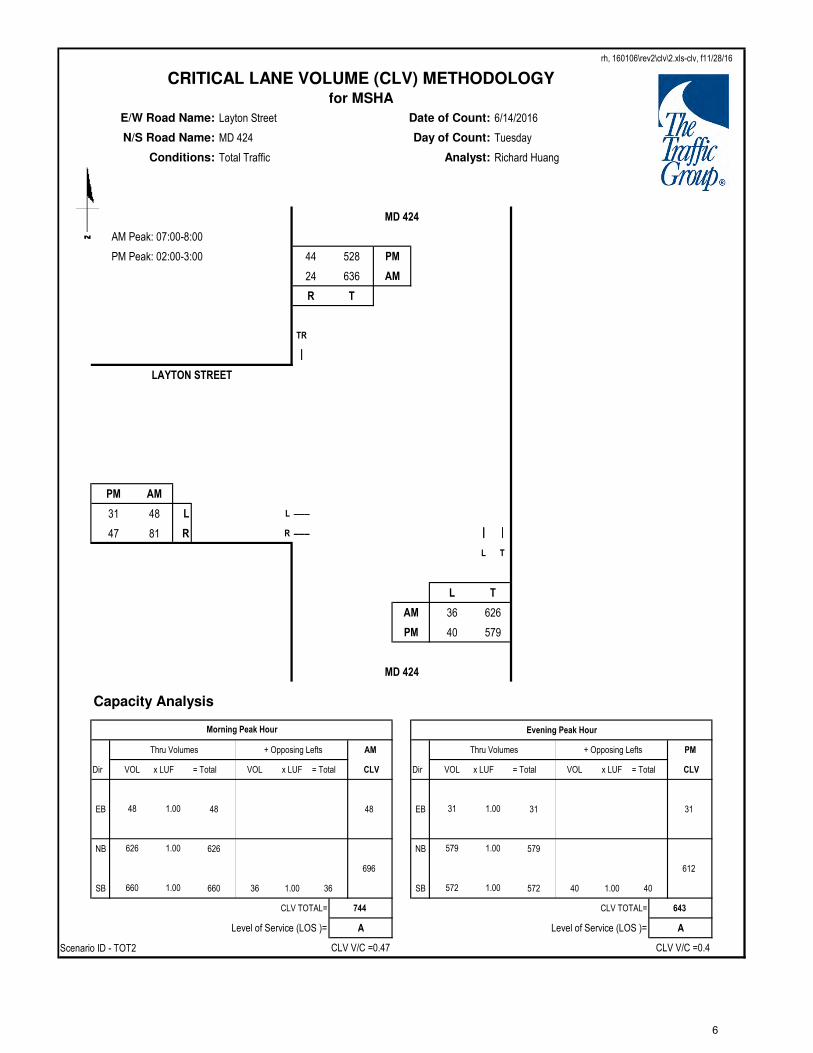
CRITICAL LANE VOLUME (CLV) METHODOLOGYfor MSHA
E/W Road Name: Layton Street Date of Count: 6/14/2016
N/S Road Name: MD 424 Day of Count: Tuesday
Conditions: Existing Traffic Analyst: Richard Huang
MD 424
AM Peak: 07:00-8:00
PM Peak: 02:00-3:00 33 456 PM
17 572 AM
R T
TR
LAYTON STREET
PM AM
26 30 L L −−−−−−−−−−−−
45 79 R R −−−−−−−−−−−−
L T
L T
AM 34 520
PM 38 534
MD 424
Capacity Analysis
Evening Peak Hour
Thru Volumes + Opposing Lefts AM Thru Volumes + Opposing Lefts PM
Dir VOL x LUF = Total VOL x LUF = Total CLV Dir VOL x LUF = Total VOL x LUF = Total CLV
EB 45 45 EB 26 26
NB 520 NB 534
623 534
SB 589 34 1.00 34 SB 489 38 1.00 38
CLV TOTAL= 668 CLV TOTAL= 560
Level of Service (LOS )= A Level of Service (LOS )= A
Scenario ID - EXIST2 CLV V/C =0.42 CLV V/C =0.35
1.00
1.00
1.00
45
589
26
534
489
Morning Peak Hour
1.00
520
1.00
1.00
4
Page 59
rh, 160106\rev2\clv\2.xls-clv, f11/28/16
CRITICAL LANE VOLUME (CLV) METHODOLOGYfor MSHA
E/W Road Name: Layton Street Date of Count: 6/14/2016
N/S Road Name: MD 424 Day of Count: Tuesday
Conditions: Background Traffic Analyst: Richard Huang
MD 424
AM Peak: 07:00-8:00
PM Peak: 02:00-3:00 33 464 PM
17 586 AM
R T
TR
LAYTON STREET
PM AM
26 30 L L −−−−−−−−−−−−
45 79 R R −−−−−−−−−−−−
L T
L T
AM 34 534
PM 38 542
MD 424
Capacity Analysis
Evening Peak Hour
Thru Volumes + Opposing Lefts AM Thru Volumes + Opposing Lefts PM
Dir VOL x LUF = Total VOL x LUF = Total CLV Dir VOL x LUF = Total VOL x LUF = Total CLV
EB 45 45 EB 26 26
NB 534 NB 542
637 542
SB 603 34 1.00 34 SB 497 38 1.00 38
CLV TOTAL= 682 CLV TOTAL= 568
Level of Service (LOS )= A Level of Service (LOS )= A
Scenario ID - BACK2 CLV V/C =0.43 CLV V/C =0.36
1.00
1.00
1.00
45
603
26
542
497
Morning Peak Hour
1.00
534
1.00
1.00
5
Page 60
rh, 160106\rev2\clv\2.xls-clv, f11/28/16
CRITICAL LANE VOLUME (CLV) METHODOLOGYfor MSHA
E/W Road Name: Layton Street Date of Count: 6/14/2016
N/S Road Name: MD 424 Day of Count: Tuesday
Conditions: Total Traffic Analyst: Richard Huang
MD 424
AM Peak: 07:00-8:00
PM Peak: 02:00-3:00 44 528 PM
24 636 AM
R T
TR
LAYTON STREET
PM AM
31 48 L L −−−−−−−−−−−−
47 81 R R −−−−−−−−−−−−
L T
L T
AM 36 626
PM 40 579
MD 424
Capacity Analysis
Evening Peak Hour
Thru Volumes + Opposing Lefts AM Thru Volumes + Opposing Lefts PM
Dir VOL x LUF = Total VOL x LUF = Total CLV Dir VOL x LUF = Total VOL x LUF = Total CLV
EB 48 48 EB 31 31
NB 626 NB 579
696 612
SB 660 36 1.00 36 SB 572 40 1.00 40
CLV TOTAL= 744 CLV TOTAL= 643
Level of Service (LOS )= A Level of Service (LOS )= A
Scenario ID - TOT2 CLV V/C =0.47 CLV V/C =0.4
1.00
1.00
1.00
48
660
31
579
572
Morning Peak Hour
1.00
626
1.00
1.00
6
Page 61
rh, 160106\rev2\clv\3.xls-clv, f11/28/16
CRITICAL LANE VOLUME (CLV) METHODOLOGYfor MSHA
E/W Road Name: Pleasant Meadow Road Date of Count: 6/8/2016
N/S Road Name: MD 424 Day of Count: Wednesday
Conditions: Existing Traffic Analyst: Richard Huang
MD 424
AM Peak: 07:00-8:00
PM Peak: 02:00-3:00 31 442 PM
10 559 AM
R T
TR
PLEASANT MEADOW ROAD
PM AM
15 36 L
23 35 R LR −−−−−−−−−−−−
L T
L T
AM 6 494
PM 32 581
MD 424
Capacity Analysis
Evening Peak Hour
Thru Volumes + Opposing Lefts AM Thru Volumes + Opposing Lefts PM
Dir VOL x LUF = Total VOL x LUF = Total CLV Dir VOL x LUF = Total VOL x LUF = Total CLV
EB 71 71 EB 38 38
NB 494 NB 581
575 581
SB 569 6 1.00 6 SB 473 32 1.00 32
CLV TOTAL= 646 CLV TOTAL= 619
Level of Service (LOS )= A Level of Service (LOS )= A
Scenario ID - EXIST3 CLV V/C =0.4 CLV V/C =0.39
1.00
1.00
1.00
71
569
38
581
473
Morning Peak Hour
1.00
494
1.00
1.00
7
Page 62
rh, 160106\rev2\clv\3.xls-clv, f11/28/16
CRITICAL LANE VOLUME (CLV) METHODOLOGYfor MSHA
E/W Road Name: Pleasant Meadow Road Date of Count: 6/8/2016
N/S Road Name: MD 424 Day of Count: Wednesday
Conditions: Background Traffic Analyst: Richard Huang
MD 424
AM Peak: 07:00-8:00
PM Peak: 02:00-3:00 31 450 PM
10 573 AM
R T
TR
PLEASANT MEADOW ROAD
PM AM
15 36 L
23 35 R LR −−−−−−−−−−−−
L T
L T
AM 6 508
PM 32 589
MD 424
Capacity Analysis
Evening Peak Hour
Thru Volumes + Opposing Lefts AM Thru Volumes + Opposing Lefts PM
Dir VOL x LUF = Total VOL x LUF = Total CLV Dir VOL x LUF = Total VOL x LUF = Total CLV
EB 71 71 EB 38 38
NB 508 NB 589
589 589
SB 583 6 1.00 6 SB 481 32 1.00 32
CLV TOTAL= 660 CLV TOTAL= 627
Level of Service (LOS )= A Level of Service (LOS )= A
Scenario ID - BACK3 CLV V/C =0.41 CLV V/C =0.39
1.00
1.00
1.00
71
583
38
589
481
Morning Peak Hour
1.00
508
1.00
1.00
8
Page 63
rh, 160106\rev2\clv\3.xls-clv, f11/28/16
CRITICAL LANE VOLUME (CLV) METHODOLOGYfor MSHA
E/W Road Name: Pleasant Meadow Road Date of Count: 6/8/2016
N/S Road Name: MD 424 Day of Count: Wednesday
Conditions: Total Traffic Analyst: Richard Huang
MD 424
AM Peak: 07:00-8:00
PM Peak: 02:00-3:00 44 503 PM
19 616 AM
R T
TR
PLEASANT MEADOW ROAD
PM AM
21 56 L
23 35 R LR −−−−−−−−−−−−
L T
L T
AM 6 582
PM 32 622
MD 424
Capacity Analysis
Evening Peak Hour
Thru Volumes + Opposing Lefts AM Thru Volumes + Opposing Lefts PM
Dir VOL x LUF = Total VOL x LUF = Total CLV Dir VOL x LUF = Total VOL x LUF = Total CLV
EB 91 91 EB 44 44
NB 582 NB 622
641 622
SB 635 6 1.00 6 SB 547 32 1.00 32
CLV TOTAL= 732 CLV TOTAL= 666
Level of Service (LOS )= A Level of Service (LOS )= A
Scenario ID - TOT3 CLV V/C =0.46 CLV V/C =0.42
1.00
1.00
1.00
91
635
44
622
547
Morning Peak Hour
1.00
582
1.00
1.00
9
Page 64
rh, 160106\rev2\clv\4.xls-clv, f11/28/16
CRITICAL LANE VOLUME (CLV) METHODOLOGYfor MSHA
E/W Road: Underwood Road/Cardinal Crest Drive Date of Count: 6/8/2016
N/S Road: MD 424 Day of Week: Wednesday
Conditions: Existing Traffic Analyst: Richard Huang
MD 424
Peak: 7:00 -8:00
Peak: 2:00 -3:00 8 438 26 PM
6 563 19 AM
R T L
R T L
CARDINAL CREST DRIVE R R 52 36
LT T 4 3
L 281 77
AM PM
PM AM
14 11 L
2 8 T LT
15 37 R R UNDERWOOD ROAD
L TR
L T R
AM 10 426 99
PM 22 581 133
MD 424
Capacity Analysis - East/West Split
Morning Peak Hour Evening Peak Hour
Thru Volumes + Opposing Lefts AM Thru Volumes + Opposing Lefts PM
Dir VOL x LUF = Total VOL x LUF = Total CLV Dir VOL x LUF = Total VOL x LUF = Total CLV
EB 27 1.00 27 27 EB 16 1.00 16 16
WB 285 1.00 285 285 WB 80 1.00 80 80
NB 525 1.00 525 19 1.00 19 NB 714 1.00 714 26 1.00 26
573 740
SB 563 1.00 563 10 1.00 10 SB 438 1.00 438 22 1.00 22
CLV TOTAL= 885 CLV TOTAL= 836
Level of Service (LOS )= A Level of Service (LOS )= A
Scenario ID - EXIST4 AM V/C =0.55 PM V/C =0.52
10
Page 65
rh, 160106\rev2\clv\4.xls-clv, f11/28/16
CRITICAL LANE VOLUME (CLV) METHODOLOGYfor MSHA
E/W Road: Underwood Road/Cardinal Crest Drive Date of Count: 6/8/2016
N/S Road: MD 424 Day of Week: Wednesday
Conditions: Background Traffic Analyst: Richard Huang
MD 424
Peak: 7:00 -8:00
Peak: 2:00 -3:00 8 446 26 PM
6 577 19 AM
R T L
R T L
CARDINAL CREST DRIVE R R 52 36
LT T 4 3
L 290 83
AM PM
PM AM
14 11 L
2 8 T LT
15 37 R R UNDERWOOD ROAD
L TR
L T R
AM 10 440 102
PM 22 589 143
MD 424
Capacity Analysis - East/West Split
Morning Peak Hour Evening Peak Hour
Thru Volumes + Opposing Lefts AM Thru Volumes + Opposing Lefts PM
Dir VOL x LUF = Total VOL x LUF = Total CLV Dir VOL x LUF = Total VOL x LUF = Total CLV
EB 27 1.00 27 27 EB 16 1.00 16 16
WB 294 1.00 294 294 WB 86 1.00 86 86
NB 542 1.00 542 19 1.00 19 NB 732 1.00 732 26 1.00 26
587 758
SB 577 1.00 577 10 1.00 10 SB 446 1.00 446 22 1.00 22
CLV TOTAL= 908 CLV TOTAL= 860
Level of Service (LOS )= A Level of Service (LOS )= A
Scenario ID - BACK4 AM V/C =0.57 PM V/C =0.54
11
Page 66
rh, 160106\rev2\clv\4.xls-clv, f11/28/16
CRITICAL LANE VOLUME (CLV) METHODOLOGYfor MSHA
E/W Road: Underwood Road/Cardinal Crest Drive Date of Count: 6/8/2016
N/S Road: MD 424 Day of Week: Wednesday
Conditions: Total Traffic Analyst: Richard Huang
MD 424
Peak: 7:00 -8:00
Peak: 2:00 -3:00 14 479 40 PM
11 601 33 AM
R T L
R T L
CARDINAL CREST DRIVE R R 66 50
LT T 4 3
L 290 83
AM PM
PM AM
17 21 L
2 8 T LT
15 37 R R UNDERWOOD ROAD
L TR
L T R
AM 10 490 102
PM 22 605 143
MD 424
Capacity Analysis - East/West Split
Morning Peak Hour Evening Peak Hour
Thru Volumes + Opposing Lefts AM Thru Volumes + Opposing Lefts PM
Dir VOL x LUF = Total VOL x LUF = Total CLV Dir VOL x LUF = Total VOL x LUF = Total CLV
EB 29 1.00 29 29 EB 19 1.00 19 19
WB 294 1.00 294 294 WB 86 1.00 86 86
NB 592 1.00 592 33 1.00 33 NB 748 1.00 748 40 1.00 40
625 788
SB 601 1.00 601 10 1.00 10 SB 479 1.00 479 22 1.00 22
CLV TOTAL= 948 CLV TOTAL= 893
Level of Service (LOS )= A Level of Service (LOS )= A
Scenario ID - TOT4 AM V/C =0.59 PM V/C =0.56
12
Page 67
rh, 160106\rev2\clv\5.xls-clv, f11/28/16
CRITICAL LANE VOLUME (CLV) METHODOLOGYfor MSHA
E/W Road: MD 450 Date of Count: 6/14/2016
N/S Road: MD 424 Day of Count: Tuesday
Conditions: Existing Traffic Analyst: Richard Huang
MD 424
Peak: 7:00 -8:00
Peak: 2:00 -3:00 104 321 102 PM
229 414 108 AM
R T L
R T L
MD 450 R R 91 130
T T 143 100
L L 46 30
AM PM
PM AM
168 98 L
116 67 T L
127 79 R TR
L TR
L T R
AM 137 385 25
PM 120 373 32
MD 424
Capacity Analysis
Morning Peak Hour Evening Peak Hour
Thru Volumes + Opposing Lefts AM Thru Volumes + Opposing Lefts PM
Dir VOL x LUF = Total VOL x LUF = Total CLV Dir VOL x LUF = Total VOL x LUF = Total CLV
NB 410 410 108 1.00 108 NB 405 1.00 405 102 1.00 102
551 507
SB 414 1.00 414 137 1.00 137 SB 321 1.00 321 120 1.00 120
EB 146 1.00 146 46 1.00 46 EB 243 1.00 243 30 1.00 30
241 273
WB 143 1.00 143 98 1.00 98 WB 100 1.00 100 168 1.00 168
CLV TOTAL= 792 CLV TOTAL= 780
Level of Service (LOS )= A Level of Service (LOS )= A
Scenario ID - EXIST5 AM V/C =0.5 PM V/C =0.49
1.00
MD 450
13
Page 68
rh, 160106\rev2\clv\5.xls-clv, f11/28/16
CRITICAL LANE VOLUME (CLV) METHODOLOGYfor MSHA
E/W Road: MD 450 Date of Count: 6/14/2016
N/S Road: MD 424 Day of Count: Tuesday
Conditions: Background Traffic Analyst: Richard Huang
MD 424
Peak: 7:00 -8:00
Peak: 2:00 -3:00 107 332 102 PM
233 433 108 AM
R T L
R T L
MD 450 R R 91 130
T T 143 100
L L 60 38
AM PM
PM AM
173 99 L
116 67 T L
135 93 R TR
L TR
L T R
AM 151 401 39
PM 128 386 40
MD 424
Capacity Analysis
Morning Peak Hour Evening Peak Hour
Thru Volumes + Opposing Lefts AM Thru Volumes + Opposing Lefts PM
Dir VOL x LUF = Total VOL x LUF = Total CLV Dir VOL x LUF = Total VOL x LUF = Total CLV
NB 440 440 108 1.00 108 NB 426 1.00 426 102 1.00 102
584 528
SB 433 1.00 433 151 1.00 151 SB 332 1.00 332 128 1.00 128
EB 160 1.00 160 60 1.00 60 EB 251 1.00 251 38 1.00 38
242 289
WB 143 1.00 143 99 1.00 99 WB 100 1.00 100 173 1.00 173
CLV TOTAL= 826 CLV TOTAL= 817
Level of Service (LOS )= A Level of Service (LOS )= A
Scenario ID - BACK5 AM V/C =0.52 PM V/C =0.51
1.00
MD 450
14
Page 69
rh, 160106\rev2\clv\5.xls-clv, f11/28/16
CRITICAL LANE VOLUME (CLV) METHODOLOGYfor MSHA
E/W Road: MD 450 Date of Count: 6/14/2016
N/S Road: MD 424 Day of Count: Tuesday
Conditions: Total Traffic Analyst: Richard Huang
MD 424
Peak: 7:00 -8:00
Peak: 2:00 -3:00 117 348 109 PM
240 445 113 AM
R T L
R T L
MD 450 R R 101 133
T T 143 100
L L 60 38
AM PM
PM AM
178 114 L
116 67 T L
135 93 R TR
L TR
L T R
AM 151 426 39
PM 128 394 40
MD 424
Capacity Analysis
Morning Peak Hour Evening Peak Hour
Thru Volumes + Opposing Lefts AM Thru Volumes + Opposing Lefts PM
Dir VOL x LUF = Total VOL x LUF = Total CLV Dir VOL x LUF = Total VOL x LUF = Total CLV
NB 465 465 113 1.00 113 NB 434 1.00 434 109 1.00 109
596 543
SB 445 1.00 445 151 1.00 151 SB 348 1.00 348 128 1.00 128
EB 160 1.00 160 60 1.00 60 EB 251 1.00 251 38 1.00 38
257 289
WB 143 1.00 143 114 1.00 114 WB 100 1.00 100 178 1.00 178
CLV TOTAL= 853 CLV TOTAL= 832
Level of Service (LOS )= A Level of Service (LOS )= A
Scenario ID - TOT5 AM V/C =0.53 PM V/C =0.52
1.00
MD 450
15
Page 70
rh, 160106\rev2\clv\7.xls-clv, f11/28/16
CRITICAL LANE VOLUME (CLV) METHODOLOGYfor MSHA
E/W Road: School Main Access Date of Count: 11/17/2016
N/S Road: MD 424 Day of Count: Thursday
Conditions: Existing Traffic Analyst: Richard Huang
Peak: 7:00 -8:00 MD 424
Peak: 2:00 -3:00
485 7 PM 14
589 2 AM 4
T L adjusted lefts
LT
LR R 0 7
L 0 4
AM PM
SCHOOL MAIN ACCESS
T R
T R
AM 550 0
PM 553 7
MD 424
Capacity Analysis
Morning Peak Hour Evening Peak Hour
Thru Volumes + Opposing Lefts AM Thru Volumes + Opposing Lefts PM
Dir VOL x LUF = Total VOL x LUF = Total CLV Dir VOL x LUF = Total VOL x LUF = Total CLV
WB 0 0 0 WB 11 11 11
NB 550 550 2 1.00 2 NB 553 553 7 1.00 7
593 560
SB 593 593 SB 499 499
CLV TOTAL= 593 CLV TOTAL= 571
Level of Service (LOS )= A Level of Service (LOS )= A
Scenario ID - EXIST7 CLV V/C =0.37 CLV V/C =0.36
1.00
1.00
1.00
1.00
1.00
1.00
16
Page 71
rh, 160106\rev2\clv\7.xls-clv, f11/28/16
CRITICAL LANE VOLUME (CLV) METHODOLOGYfor MSHA
E/W Road: School Main Access Date of Count: 11/17/2016
N/S Road: MD 424 Day of Count: Thursday
Conditions: Background Traffic Analyst: Richard Huang
Peak: 7:00 -8:00 MD 424
Peak: 2:00 -3:00
493 7 PM 14
603 2 AM 4
T L adjusted lefts
LT
LR R 0 7
L 0 4
AM PM
SCHOOL MAIN ACCESS
T R
T R
AM 564 0
PM 561 7
MD 424
Capacity Analysis
Morning Peak Hour Evening Peak Hour
Thru Volumes + Opposing Lefts AM Thru Volumes + Opposing Lefts PM
Dir VOL x LUF = Total VOL x LUF = Total CLV Dir VOL x LUF = Total VOL x LUF = Total CLV
WB 0 0 0 WB 11 11 11
NB 564 564 2 1.00 2 NB 561 561 7 1.00 7
607 568
SB 607 607 SB 507 507
CLV TOTAL= 607 CLV TOTAL= 579
Level of Service (LOS )= A Level of Service (LOS )= A
Scenario ID - BACK7 CLV V/C =0.38 CLV V/C =0.36
1.00
1.00
1.00
1.00
1.00
1.00
17
Page 72
rh, 160106\rev2\clv\7.xls-clv, f11/28/16
CRITICAL LANE VOLUME (CLV) METHODOLOGYfor MSHA
E/W Road: School Main Access Date of Count: 11/17/2016
N/S Road: MD 424 Day of Count: Thursday
Conditions: Total Traffic Analyst: Richard Huang
Peak: 7:00 -8:00 MD 424
Peak: 2:00 -3:00
511 62 PM 186
621 208 AM 624
T L adjusted lefts
LT
LR R 87 138
L 39 61
AM PM
SCHOOL MAIN ACCESS
T R
T R
AM 582 92
PM 579 31
MD 424
Capacity Analysis
Morning Peak Hour Evening Peak Hour
Thru Volumes + Opposing Lefts AM Thru Volumes + Opposing Lefts PM
Dir VOL x LUF = Total VOL x LUF = Total CLV Dir VOL x LUF = Total VOL x LUF = Total CLV
WB 126 126 126 WB 199 199 199
NB 582 582 208 1.00 208 NB 579 579 62 1.00 62
1245 697
SB 1245 1245 SB 697 697
CLV TOTAL= 1,371 CLV TOTAL= 896
Level of Service (LOS )= D Level of Service (LOS )= A
Scenario ID - TOT7 CLV V/C =0.86 CLV V/C =0.56
1.00
1.00
1.00
1.00
1.00
1.00
18
Page 73
rh, 160106\rev2\clv\7.xls-imp, f11/28/16
CRITICAL LANE VOLUME (CLV) METHODOLOGYfor MSHA
E/W Road: School Main Access Date of Count: 11/17/2016
N/S Road: MD 424 Day of Count: Thursday
Conditions: Total Traffic Analyst: Richard Huang
w/improvement
Peak: 7:00 -8:00 MD 424
Peak: 2:00 -3:00
511 62 PM
621 208 AM
T L
T L
R R 87 138
L L 39 61
AM PM
SCHOOL MAIN ACCESS
T R
T R
AM 582 92
PM 579 31
MD 424
Capacity Analysis
Morning Peak Hour Evening Peak Hour
Thru Volumes + Opposing Lefts AM Thru Volumes + Opposing Lefts PM
Dir VOL x LUF = Total VOL x LUF = Total CLV Dir VOL x LUF = Total VOL x LUF = Total CLV
WB 39 39 39 WB 76 76 76
NB 582 582 208 1.00 208 NB 579 579 62 1.00 62
790 641
SB 621 621 SB 511 511
CLV TOTAL= 829 CLV TOTAL= 717
Level of Service (LOS )= A Level of Service (LOS )= A
CLV V/C =0.52 CLV V/C =0.45
1.00 1.00
1.00 1.00
1.00 1.00
19
Page 74
rh, 160106\rev2\clv\8.xls-clv, f11/28/16
CRITICAL LANE VOLUME (CLV) METHODOLOGYfor MSHA
E/W Road: School Bus Access/Old Post Rd Date of Count:
N/S Road: MD 424 Day of Count:
Conditions: Existing Traffic Analyst: Richard Huang
Peak: 7:00 -8:00 MD 424
Peak: 2:00 -3:00
0 467 9 PM
0 554 49 AM
R T L
R T L
OLD POST RD R R 42 11
LT T 0 0
L 15 5
AM PM
0 0 adjusted lefts adjusted lefts 15 6
PM AM
0 0 L
0 0 T
1 0 R LTR
L TR
L T R
AM 0 509 21
PM 0 591 5
MD 424
Capacity Analysis
Morning Peak Hour Evening Peak Hour
Thru Volumes + Opposing Lefts AM Thru Volumes + Opposing Lefts PM
Dir VOL x LUF = Total VOL x LUF = Total CLV Dir VOL x LUF = Total VOL x LUF = Total CLV
NB 530 530 49 1.00 49 NB 596 1.00 596 9 1.00 9
579 605
SB 554 1.00 554 0 1.00 0 SB 467 1.00 467 0 1.00 0
EB 0 1.00 0 15 1.00 15 EB 1 1.00 1 5 1.00 5
15 6
WB 15 1.00 15 0 1.00 0 WB 6 1.00 6 0 1.00 0
CLV TOTAL= 594 CLV TOTAL= 611
Level of Service (LOS )= A Level of Service (LOS )= A
Scenario ID - EXIST8 AM V/C =0.37 PM V/C =0.38
1.00
SCHOOL BUS ACCESS
20
Page 75
rh, 160106\rev2\clv\8.xls-clv, f11/28/16
CRITICAL LANE VOLUME (CLV) METHODOLOGYfor MSHA
E/W Road: School Bus Access/Old Post Rd Date of Count:
N/S Road: MD 424 Day of Count:
Conditions: Background Traffic Analyst: Richard Huang
Peak: 7:00 -8:00 MD 424
Peak: 2:00 -3:00
0 475 9 PM
0 568 49 AM
R T L
R T L
OLD POST RD R R 42 11
LT T 0 0
L 15 5
AM PM
0 0 adjusted lefts adjusted lefts 15 6
PM AM
0 0 L
0 0 T
1 0 R LTR
L TR
L T R
AM 0 523 21
PM 0 599 5
MD 424
Capacity Analysis
Morning Peak Hour Evening Peak Hour
Thru Volumes + Opposing Lefts AM Thru Volumes + Opposing Lefts PM
Dir VOL x LUF = Total VOL x LUF = Total CLV Dir VOL x LUF = Total VOL x LUF = Total CLV
NB 544 544 49 1.00 49 NB 604 1.00 604 9 1.00 9
593 613
SB 568 1.00 568 0 1.00 0 SB 475 1.00 475 0 1.00 0
EB 0 1.00 0 15 1.00 15 EB 1 1.00 1 5 1.00 5
15 6
WB 15 1.00 15 0 1.00 0 WB 6 1.00 6 0 1.00 0
CLV TOTAL= 608 CLV TOTAL= 619
Level of Service (LOS )= A Level of Service (LOS )= A
Scenario ID - BACK8 AM V/C =0.38 PM V/C =0.39
1.00
SCHOOL BUS ACCESS
21
Page 76
rh, 160106\rev2\clv\8.xls-clv, f11/28/16
CRITICAL LANE VOLUME (CLV) METHODOLOGYfor MSHA
E/W Road: School Bus Access/Old Post Rd Date of Count:
N/S Road: MD 424 Day of Count:
Conditions: Total Traffic Analyst: Richard Huang
Peak: 7:00 -8:00 MD 424
Peak: 2:00 -3:00
0 521 29 PM
0 600 69 AM
R T L
R T L
OLD POST RD R R 62 31
LT T 0 0
L 35 25
AM PM
0 0 adjusted lefts adjusted lefts 35 28
PM AM
0 0 L
0 0 T
1 0 R LTR
L TR
L T R
AM 0 597 41
PM 0 618 25
MD 424
Capacity Analysis
Morning Peak Hour Evening Peak Hour
Thru Volumes + Opposing Lefts AM Thru Volumes + Opposing Lefts PM
Dir VOL x LUF = Total VOL x LUF = Total CLV Dir VOL x LUF = Total VOL x LUF = Total CLV
NB 638 638 69 1.00 69 NB 643 1.00 643 29 1.00 29
707 672
SB 600 1.00 600 0 1.00 0 SB 521 1.00 521 0 1.00 0
EB 0 1.00 0 35 1.00 35 EB 1 1.00 1 25 1.00 25
35 28
WB 35 1.00 35 0 1.00 0 WB 28 1.00 28 0 1.00 0
CLV TOTAL= 742 CLV TOTAL= 700
Level of Service (LOS )= A Level of Service (LOS )= A
Scenario ID - TOT8 AM V/C =0.46 PM V/C =0.44
1.00
SCHOOL BUS ACCESS
22
Page 77
SITE LAYOUT
Site: EA
Underwood Rd & Mt. Tabor RdExisting AMRoundabout
SIDRA INTERSECTION 6.1 | Copyright © 2000-2015 Akcelik and Associates Pty Ltd | sidrasolutions.comOrganisation: THE TRAFFIC GROUP | Created: Monday, November 28, 2016 5:21:02 PMProject: F:\2016\2016-0106_Crofton High School\ENG\REV2\HCM\6.sip6
23
Page 78
MOVEMENT SUMMARY
Site: EA
Underwood Rd & Mt. Tabor RdExisting AMRoundabout
Movement Performance - Vehicles
Demand Flows 95% Back of QueueMovID
ODMov
Deg.Satn
AverageDelay
Level ofService
Prop. Queued
Effective Stop Rate
AverageSpeed Total HV Vehicles Distance
veh/h % v/c sec veh ft per veh mphSouthEast: Mt. Tabor Rd
3x L2 43 3.0 0.094 10.1 LOS B 0.5 11.9 0.32 0.59 34.9
18x R2 48 3.0 0.094 5.3 LOS A 0.5 11.9 0.32 0.59 34.3
Approach 91 3.0 0.094 7.6 LOS A 0.5 11.9 0.32 0.59 34.6
NorthEast: Underwood Rd
1x L2 35 3.0 0.326 9.6 LOS A 2.2 55.3 0.24 0.46 35.7
6x T1 310 3.0 0.326 5.2 LOS A 2.2 55.3 0.24 0.46 35.9
Approach 345 3.0 0.326 5.6 LOS A 2.2 55.3 0.24 0.46 35.8
SouthWest: Underwood Rd
2x T1 121 3.0 0.129 5.0 LOS A 0.7 17.4 0.17 0.44 36.3
12x R2 17 3.0 0.129 4.7 LOS A 0.7 17.4 0.17 0.44 35.5
Approach 138 3.0 0.129 5.0 LOS A 0.7 17.4 0.17 0.44 36.2
All Vehicles 574 3.0 0.326 5.8 LOS A 2.2 55.3 0.24 0.48 35.7
Level of Service (LOS) Method: Delay & v/c (HCM 2010).
Roundabout LOS Method: Same as Sign Control.
Vehicle movement LOS values are based on average delay and v/c ratio (degree of saturation) per movement
LOS F will result if v/c > 1 irrespective of movement delay value (does not apply for approaches and intersection).
Intersection and Approach LOS values are based on average delay for all movements (v/c not used as specified in HCM 2010).
Roundabout Capacity Model: SIDRA Standard.
SIDRA Standard Delay Model is used. Control Delay includes Geometric Delay.
Gap-Acceptance Capacity: SIDRA Standard (Akçelik M3D).
HV (%) values are calculated for All Movement Classes of All Heavy Vehicle Model Designation.
SIDRA INTERSECTION 6.1 | Copyright © 2000-2015 Akcelik and Associates Pty Ltd | sidrasolutions.comOrganisation: THE TRAFFIC GROUP | Processed: Monday, November 28, 2016 5:19:37 PMProject: F:\2016\2016-0106_Crofton High School\ENG\REV2\HCM\6.sip6
24
Page 79
MOVEMENT SUMMARY
Site: EP
Underwood Rd & Mt. Tabor RdExisting PMRoundabout
Movement Performance - Vehicles
Demand Flows 95% Back of QueueMovID
ODMov
Deg.Satn
AverageDelay
Level ofService
Prop. Queued
Effective Stop Rate
AverageSpeed Total HV Vehicles Distance
veh/h % v/c sec veh ft per veh mphSouthEast: Mt. Tabor Rd
3x L2 33 3.0 0.070 10.2 LOS B 0.3 8.6 0.33 0.59 34.8
18x R2 34 3.0 0.070 5.4 LOS A 0.3 8.6 0.33 0.59 34.2
Approach 66 3.0 0.070 7.7 LOS A 0.3 8.6 0.33 0.59 34.5
NorthEast: Underwood Rd
1x L2 33 3.0 0.119 9.4 LOS A 0.6 16.2 0.17 0.50 35.6
6x T1 95 3.0 0.119 5.0 LOS A 0.6 16.2 0.17 0.50 35.8
Approach 127 3.0 0.119 6.1 LOS A 0.6 16.2 0.17 0.50 35.7
SouthWest: Underwood Rd
2x T1 138 3.0 0.159 5.0 LOS A 0.8 21.7 0.17 0.44 36.4
12x R2 33 3.0 0.159 4.7 LOS A 0.8 21.7 0.17 0.44 35.5
Approach 171 3.0 0.159 4.9 LOS A 0.8 21.7 0.17 0.44 36.2
All Vehicles 364 3.0 0.159 5.9 LOS A 0.8 21.7 0.20 0.49 35.7
Level of Service (LOS) Method: Delay & v/c (HCM 2010).
Roundabout LOS Method: Same as Sign Control.
Vehicle movement LOS values are based on average delay and v/c ratio (degree of saturation) per movement
LOS F will result if v/c > 1 irrespective of movement delay value (does not apply for approaches and intersection).
Intersection and Approach LOS values are based on average delay for all movements (v/c not used as specified in HCM 2010).
Roundabout Capacity Model: SIDRA Standard.
SIDRA Standard Delay Model is used. Control Delay includes Geometric Delay.
Gap-Acceptance Capacity: SIDRA Standard (Akçelik M3D).
HV (%) values are calculated for All Movement Classes of All Heavy Vehicle Model Designation.
SIDRA INTERSECTION 6.1 | Copyright © 2000-2015 Akcelik and Associates Pty Ltd | sidrasolutions.comOrganisation: THE TRAFFIC GROUP | Processed: Monday, November 28, 2016 5:19:39 PMProject: F:\2016\2016-0106_Crofton High School\ENG\REV2\HCM\6.sip6
25
Page 80
MOVEMENT SUMMARY
Site: BA
Underwood Rd & Mt. Tabor RdBackground AMRoundabout
Movement Performance - Vehicles
Demand Flows 95% Back of QueueMovID
ODMov
Deg.Satn
AverageDelay
Level ofService
Prop. Queued
Effective Stop Rate
AverageSpeed Total HV Vehicles Distance
veh/h % v/c sec veh ft per veh mphSouthEast: Mt. Tabor Rd
3x L2 43 3.0 0.095 10.1 LOS B 0.5 11.9 0.32 0.59 34.9
18x R2 48 3.0 0.095 5.3 LOS A 0.5 11.9 0.32 0.59 34.2
Approach 91 3.0 0.095 7.6 LOS A 0.5 11.9 0.32 0.59 34.6
NorthEast: Underwood Rd
1x L2 35 3.0 0.335 9.6 LOS A 2.3 57.6 0.24 0.46 35.7
6x T1 320 3.0 0.335 5.2 LOS A 2.3 57.6 0.24 0.46 35.9
Approach 354 3.0 0.335 5.6 LOS A 2.3 57.6 0.24 0.46 35.8
SouthWest: Underwood Rd
2x T1 124 3.0 0.132 5.0 LOS A 0.7 17.9 0.17 0.44 36.3
12x R2 17 3.0 0.132 4.7 LOS A 0.7 17.9 0.17 0.44 35.5
Approach 141 3.0 0.132 5.0 LOS A 0.7 17.9 0.17 0.44 36.2
All Vehicles 587 3.0 0.335 5.8 LOS A 2.3 57.6 0.24 0.48 35.7
Level of Service (LOS) Method: Delay & v/c (HCM 2010).
Roundabout LOS Method: Same as Sign Control.
Vehicle movement LOS values are based on average delay and v/c ratio (degree of saturation) per movement
LOS F will result if v/c > 1 irrespective of movement delay value (does not apply for approaches and intersection).
Intersection and Approach LOS values are based on average delay for all movements (v/c not used as specified in HCM 2010).
Roundabout Capacity Model: SIDRA Standard.
SIDRA Standard Delay Model is used. Control Delay includes Geometric Delay.
Gap-Acceptance Capacity: SIDRA Standard (Akçelik M3D).
HV (%) values are calculated for All Movement Classes of All Heavy Vehicle Model Designation.
SIDRA INTERSECTION 6.1 | Copyright © 2000-2015 Akcelik and Associates Pty Ltd | sidrasolutions.comOrganisation: THE TRAFFIC GROUP | Processed: Monday, November 28, 2016 5:19:42 PMProject: F:\2016\2016-0106_Crofton High School\ENG\REV2\HCM\6.sip6
26
Page 81
MOVEMENT SUMMARY
Site: BP
Underwood Rd & Mt. Tabor RdBackground PMRoundabout
Movement Performance - Vehicles
Demand Flows 95% Back of QueueMovID
ODMov
Deg.Satn
AverageDelay
Level ofService
Prop. Queued
Effective Stop Rate
AverageSpeed Total HV Vehicles Distance
veh/h % v/c sec veh ft per veh mphSouthEast: Mt. Tabor Rd
3x L2 33 3.0 0.071 10.2 LOS B 0.3 8.7 0.34 0.59 34.8
18x R2 34 3.0 0.071 5.5 LOS A 0.3 8.7 0.34 0.59 34.2
Approach 66 3.0 0.071 7.8 LOS A 0.3 8.7 0.34 0.59 34.5
NorthEast: Underwood Rd
1x L2 33 3.0 0.125 9.4 LOS A 0.7 17.2 0.17 0.49 35.6
6x T1 101 3.0 0.125 5.0 LOS A 0.7 17.2 0.17 0.49 35.8
Approach 134 3.0 0.125 6.1 LOS A 0.7 17.2 0.17 0.49 35.7
SouthWest: Underwood Rd
2x T1 149 3.0 0.169 5.0 LOS A 0.9 23.3 0.17 0.44 36.4
12x R2 33 3.0 0.169 4.7 LOS A 0.9 23.3 0.17 0.44 35.5
Approach 182 3.0 0.169 4.9 LOS A 0.9 23.3 0.17 0.44 36.2
All Vehicles 382 3.0 0.169 5.8 LOS A 0.9 23.3 0.20 0.49 35.7
Level of Service (LOS) Method: Delay & v/c (HCM 2010).
Roundabout LOS Method: Same as Sign Control.
Vehicle movement LOS values are based on average delay and v/c ratio (degree of saturation) per movement
LOS F will result if v/c > 1 irrespective of movement delay value (does not apply for approaches and intersection).
Intersection and Approach LOS values are based on average delay for all movements (v/c not used as specified in HCM 2010).
Roundabout Capacity Model: SIDRA Standard.
SIDRA Standard Delay Model is used. Control Delay includes Geometric Delay.
Gap-Acceptance Capacity: SIDRA Standard (Akçelik M3D).
HV (%) values are calculated for All Movement Classes of All Heavy Vehicle Model Designation.
SIDRA INTERSECTION 6.1 | Copyright © 2000-2015 Akcelik and Associates Pty Ltd | sidrasolutions.comOrganisation: THE TRAFFIC GROUP | Processed: Monday, November 28, 2016 5:19:45 PMProject: F:\2016\2016-0106_Crofton High School\ENG\REV2\HCM\6.sip6
27
Page 82
SITE LAYOUT
Site: TA
Underwood Rd & Mt. Tabor RdAM Peak HourRoundabout
SIDRA INTERSECTION 6.1 | Copyright © 2000-2015 Akcelik and Associates Pty Ltd | sidrasolutions.comOrganisation: THE TRAFFIC GROUP | Created: Monday, November 28, 2016 5:24:33 PMProject: F:\2016\2016-0106_Crofton High School\ENG\REV2\HCM\6.sip6
28
Page 83
MOVEMENT SUMMARY
Site: TA
Underwood Rd & Mt. Tabor RdAM Peak HourRoundabout
Movement Performance - Vehicles
Demand Flows 95% Back of QueueMovID
ODMov
Deg.Satn
AverageDelay
Level ofService
Prop. Queued
Effective Stop Rate
AverageSpeed Total HV Vehicles Distance
veh/h % v/c sec veh ft per veh mphSouthEast: Mt. Tabor Rd
3x L2 46 3.0 0.134 10.7 LOS B 0.7 17.5 0.42 0.61 34.8
8x T1 25 3.0 0.134 6.3 LOS A 0.7 17.5 0.42 0.61 34.9
18x R2 48 3.0 0.134 6.0 LOS A 0.7 17.5 0.42 0.61 34.1
Approach 118 3.0 0.134 7.9 LOS A 0.7 17.5 0.42 0.61 34.6
NorthEast: Underwood Rd
1x L2 35 3.0 0.507 10.1 LOS B 4.3 109.7 0.40 0.50 35.4
6x T1 333 3.0 0.507 5.7 LOS A 4.3 109.7 0.40 0.50 35.6
16x R2 149 3.0 0.507 5.4 LOS A 4.3 109.7 0.40 0.50 34.7
Approach 516 3.0 0.507 5.9 LOS A 4.3 109.7 0.40 0.50 35.3
NorthWest: School Access
7x L2 63 3.0 0.106 12.4 LOS B 0.5 13.9 0.58 0.73 33.1
4x T1 11 3.0 0.106 7.9 LOS A 0.5 13.9 0.58 0.73 33.2
14x R2 1 3.0 0.106 7.6 LOS A 0.5 13.9 0.58 0.73 32.5
Approach 75 3.0 0.106 11.6 LOS B 0.5 13.9 0.58 0.73 33.1
SouthWest: Underwood Rd
5x L2 1 3.0 0.162 10.1 LOS B 0.9 22.7 0.33 0.49 35.6
2x T1 137 3.0 0.162 5.6 LOS A 0.9 22.7 0.33 0.49 35.8
12x R2 20 3.0 0.162 5.3 LOS A 0.9 22.7 0.33 0.49 34.9
Approach 158 3.0 0.162 5.6 LOS A 0.9 22.7 0.33 0.49 35.7
All Vehicles 867 3.0 0.507 6.6 LOS A 4.3 109.7 0.41 0.53 35.1
Level of Service (LOS) Method: Delay & v/c (HCM 2010).
Roundabout LOS Method: Same as Sign Control.
Vehicle movement LOS values are based on average delay and v/c ratio (degree of saturation) per movement
LOS F will result if v/c > 1 irrespective of movement delay value (does not apply for approaches and intersection).
Intersection and Approach LOS values are based on average delay for all movements (v/c not used as specified in HCM 2010).
Roundabout Capacity Model: SIDRA Standard.
SIDRA Standard Delay Model is used. Control Delay includes Geometric Delay.
Gap-Acceptance Capacity: SIDRA Standard (Akçelik M3D).
HV (%) values are calculated for All Movement Classes of All Heavy Vehicle Model Designation.
SIDRA INTERSECTION 6.1 | Copyright © 2000-2015 Akcelik and Associates Pty Ltd | sidrasolutions.comOrganisation: THE TRAFFIC GROUP | Processed: Monday, November 28, 2016 5:19:48 PMProject: F:\2016\2016-0106_Crofton High School\ENG\REV2\HCM\6.sip6
29
Page 84
MOVEMENT SUMMARY
Site: TP
Underwood Rd & Mt. Tabor RdPM Peak HourRoundabout
Movement Performance - Vehicles
Demand Flows 95% Back of QueueMovID
ODMov
Deg.Satn
AverageDelay
Level ofService
Prop. Queued
Effective Stop Rate
AverageSpeed Total HV Vehicles Distance
veh/h % v/c sec veh ft per veh mphSouthEast: Mt. Tabor Rd
3x L2 35 3.0 0.090 11.1 LOS B 0.4 11.4 0.46 0.64 34.5
8x T1 7 3.0 0.090 6.6 LOS A 0.4 11.4 0.46 0.64 34.7
18x R2 34 3.0 0.090 6.3 LOS A 0.4 11.4 0.46 0.64 33.9
Approach 75 3.0 0.090 8.5 LOS A 0.4 11.4 0.46 0.64 34.2
NorthEast: Underwood Rd
1x L2 33 3.0 0.177 9.5 LOS A 1.0 26.2 0.21 0.49 35.7
6x T1 114 3.0 0.177 5.1 LOS A 1.0 26.2 0.21 0.49 35.9
16x R2 40 3.0 0.177 4.8 LOS A 1.0 26.2 0.21 0.49 35.0
Approach 187 3.0 0.177 5.8 LOS A 1.0 26.2 0.21 0.49 35.7
NorthWest: School Access
7x L2 95 3.0 0.124 10.6 LOS B 0.6 15.9 0.39 0.65 33.8
4x T1 16 3.0 0.124 6.1 LOS A 0.6 15.9 0.39 0.65 34.0
14x R2 1 3.0 0.124 5.8 LOS A 0.6 15.9 0.39 0.65 33.2
Approach 112 3.0 0.124 9.9 LOS A 0.6 15.9 0.39 0.65 33.8
SouthWest: Underwood Rd
5x L2 1 3.0 0.211 10.4 LOS B 1.2 30.1 0.39 0.52 35.5
2x T1 162 3.0 0.211 5.9 LOS A 1.2 30.1 0.39 0.52 35.6
12x R2 35 3.0 0.211 5.6 LOS A 1.2 30.1 0.39 0.52 34.8
Approach 198 3.0 0.211 5.9 LOS A 1.2 30.1 0.39 0.52 35.5
All Vehicles 572 3.0 0.211 7.0 LOS A 1.2 30.1 0.34 0.55 35.0
Level of Service (LOS) Method: Delay & v/c (HCM 2010).
Roundabout LOS Method: Same as Sign Control.
Vehicle movement LOS values are based on average delay and v/c ratio (degree of saturation) per movement
LOS F will result if v/c > 1 irrespective of movement delay value (does not apply for approaches and intersection).
Intersection and Approach LOS values are based on average delay for all movements (v/c not used as specified in HCM 2010).
Roundabout Capacity Model: SIDRA Standard.
SIDRA Standard Delay Model is used. Control Delay includes Geometric Delay.
Gap-Acceptance Capacity: SIDRA Standard (Akçelik M3D).
HV (%) values are calculated for All Movement Classes of All Heavy Vehicle Model Designation.
SIDRA INTERSECTION 6.1 | Copyright © 2000-2015 Akcelik and Associates Pty Ltd | sidrasolutions.comOrganisation: THE TRAFFIC GROUP | Processed: Monday, November 28, 2016 5:19:51 PMProject: F:\2016\2016-0106_Crofton High School\ENG\REV2\HCM\6.sip6
30
Page 85
HCS 2010 Two-Way Stop-Control Report
General Information Site Information
Analyst RH Intersection MD 424 & School Main Acce
Agency/Co. The Traffic Group, Inc. Jurisdiction Anne Arundel County
Date Performed 11/29/2016 East/West Street School Main Access
Analysis Year 2016 North/South Street MD 424
Time Analyzed Existing AM Peak Hour Peak Hour Factor 0.92
Intersection Orientation North-South Analysis Time Period (hrs) 0.25
Project Description Crofton High School
Lanes
Major Street: North-South
Vehicle Volumes and Adjustments
Approach Eastbound Westbound Northbound Southbound
Movement U L T R U L T R U L T R U L T R
Priority 10 11 12 7 8 9 1U 1 2 3 4U 4 5 6
Number of Lanes 0 0 0 0 0 0 0 0 1 1 0 0 1 0
Configuration LR T R LT
Volume, V (veh/h) 0 0 550 0 2 589
Percent Heavy Vehicles (%) 3 3 3
Proportion Time Blocked
Percent Grade (%) 0
Right Turn Channelized No No No No
Median Type/Storage Undivided
Critical and Follow-up Headways
Base Critical Headway (sec)
Critical Headway (sec)
Base Follow-Up Headway (sec)
Follow-Up Headway (sec)
Delay, Queue Length, and Level of Service
Flow Rate, v (veh/h) 0 2
Capacity, c (veh/h) 0 973
v/c Ratio 0.00
95% Queue Length, Q₉₅ (veh) 0.0
Control Delay (s/veh) 5.0 8.7
Level of Service, LOS A A
Approach Delay (s/veh) 5.0 0.1
Approach LOS A
Copyright © 2016 University of Florida. All Rights Reserved. HCS 2010™ TWSC Version 6.90 Generated: 11/29/2016 9:49:33 AM
7EA.xtw
31
Page 86
HCS 2010 Two-Way Stop-Control Report
General Information Site Information
Analyst RH Intersection MD 424 & School Main Acce
Agency/Co. The Traffic Group, Inc. Jurisdiction Anne Arundel County
Date Performed 11/29/2016 East/West Street School Main Access
Analysis Year 2016 North/South Street MD 424
Time Analyzed PM Peak Hour Peak Hour Factor 0.92
Intersection Orientation North-South Analysis Time Period (hrs) 0.25
Project Description Crofton High School
Lanes
Major Street: North-South
Vehicle Volumes and Adjustments
Approach Eastbound Westbound Northbound Southbound
Movement U L T R U L T R U L T R U L T R
Priority 10 11 12 7 8 9 1U 1 2 3 4U 4 5 6
Number of Lanes 0 0 0 0 0 0 0 0 1 1 0 0 1 0
Configuration LR T R LT
Volume, V (veh/h) 4 7 553 7 7 485
Percent Heavy Vehicles (%) 3 3 3
Proportion Time Blocked
Percent Grade (%) 0
Right Turn Channelized No No No No
Median Type/Storage Undivided
Critical and Follow-up Headways
Base Critical Headway (sec)
Critical Headway (sec)
Base Follow-Up Headway (sec)
Follow-Up Headway (sec)
Delay, Queue Length, and Level of Service
Flow Rate, v (veh/h) 12 8
Capacity, c (veh/h) 349 964
v/c Ratio 0.03 0.01
95% Queue Length, Q₉₅ (veh) 0.1 0.0
Control Delay (s/veh) 15.7 8.8
Level of Service, LOS C A
Approach Delay (s/veh) 15.7 0.2
Approach LOS C
Copyright © 2016 University of Florida. All Rights Reserved. HCS 2010™ TWSC Version 6.90 Generated: 11/29/2016 9:58:24 AM
7EP.xtw
32
Page 87
HCS 2010 Two-Way Stop-Control Report
General Information Site Information
Analyst RH Intersection MD 424 & School Main Acce
Agency/Co. The Traffic Group, Inc. Jurisdiction Anne Arundel County
Date Performed 11/29/2016 East/West Street School Main Access
Analysis Year 2016 North/South Street MD 424
Time Analyzed Background AM Peak Hour Peak Hour Factor 0.92
Intersection Orientation North-South Analysis Time Period (hrs) 0.25
Project Description Crofton High School
Lanes
Major Street: North-South
Vehicle Volumes and Adjustments
Approach Eastbound Westbound Northbound Southbound
Movement U L T R U L T R U L T R U L T R
Priority 10 11 12 7 8 9 1U 1 2 3 4U 4 5 6
Number of Lanes 0 0 0 0 0 0 0 0 1 1 0 0 1 0
Configuration LR T R LT
Volume, V (veh/h) 0 0 564 0 2 603
Percent Heavy Vehicles (%) 3 3 3
Proportion Time Blocked
Percent Grade (%) 0
Right Turn Channelized No No No No
Median Type/Storage Undivided
Critical and Follow-up Headways
Base Critical Headway (sec)
Critical Headway (sec)
Base Follow-Up Headway (sec)
Follow-Up Headway (sec)
Delay, Queue Length, and Level of Service
Flow Rate, v (veh/h) 0 2
Capacity, c (veh/h) 0 961
v/c Ratio 0.00
95% Queue Length, Q₉₅ (veh) 0.0
Control Delay (s/veh) 5.0 8.8
Level of Service, LOS A A
Approach Delay (s/veh) 5.0 0.1
Approach LOS A
Copyright © 2016 University of Florida. All Rights Reserved. HCS 2010™ TWSC Version 6.90 Generated: 11/29/2016 9:58:38 AM
7BA.xtw
33
Page 88
HCS 2010 Two-Way Stop-Control Report
General Information Site Information
Analyst RH Intersection MD 424 & School Main Acce
Agency/Co. The Traffic Group, Inc. Jurisdiction Anne Arundel County
Date Performed 11/29/2016 East/West Street School Main Access
Analysis Year 2016 North/South Street MD 424
Time Analyzed Background PM Peak Hour Peak Hour Factor 0.92
Intersection Orientation North-South Analysis Time Period (hrs) 0.25
Project Description Crofton High School
Lanes
Major Street: North-South
Vehicle Volumes and Adjustments
Approach Eastbound Westbound Northbound Southbound
Movement U L T R U L T R U L T R U L T R
Priority 10 11 12 7 8 9 1U 1 2 3 4U 4 5 6
Number of Lanes 0 0 0 0 0 0 0 0 1 1 0 0 1 0
Configuration LR T R LT
Volume, V (veh/h) 4 7 561 7 7 493
Percent Heavy Vehicles (%) 3 3 3
Proportion Time Blocked
Percent Grade (%) 0
Right Turn Channelized No No No No
Median Type/Storage Undivided
Critical and Follow-up Headways
Base Critical Headway (sec)
Critical Headway (sec)
Base Follow-Up Headway (sec)
Follow-Up Headway (sec)
Delay, Queue Length, and Level of Service
Flow Rate, v (veh/h) 12 8
Capacity, c (veh/h) 342 956
v/c Ratio 0.04 0.01
95% Queue Length, Q₉₅ (veh) 0.1 0.0
Control Delay (s/veh) 15.9 8.8
Level of Service, LOS C A
Approach Delay (s/veh) 15.9 0.2
Approach LOS C
Copyright © 2016 University of Florida. All Rights Reserved. HCS 2010™ TWSC Version 6.90 Generated: 11/29/2016 9:58:50 AM
7BP.xtw
34
Page 89
HCS 2010 Two-Way Stop-Control Report
General Information Site Information
Analyst RH Intersection MD 424 & School Main Acce
Agency/Co. The Traffic Group, Inc. Jurisdiction Anne Arundel County
Date Performed 11/29/2016 East/West Street School Main Access
Analysis Year 2016 North/South Street MD 424
Time Analyzed Total AM Peak Hour Peak Hour Factor 0.92
Intersection Orientation North-South Analysis Time Period (hrs) 0.25
Project Description Crofton High School
Lanes
Major Street: North-South
Vehicle Volumes and Adjustments
Approach Eastbound Westbound Northbound Southbound
Movement U L T R U L T R U L T R U L T R
Priority 10 11 12 7 8 9 1U 1 2 3 4U 4 5 6
Number of Lanes 0 0 0 0 0 0 0 0 1 1 0 0 1 0
Configuration LR T R LT
Volume, V (veh/h) 39 87 582 92 208 621
Percent Heavy Vehicles (%) 3 3 3
Proportion Time Blocked
Percent Grade (%) 0
Right Turn Channelized No No No No
Median Type/Storage Undivided
Critical and Follow-up Headways
Base Critical Headway (sec)
Critical Headway (sec)
Base Follow-Up Headway (sec)
Follow-Up Headway (sec)
Delay, Queue Length, and Level of Service
Flow Rate, v (veh/h) 137 226
Capacity, c (veh/h) 168 866
v/c Ratio 0.81 0.26
95% Queue Length, Q₉₅ (veh) 5.5 1.0
Control Delay (s/veh) 82.4 10.6
Level of Service, LOS F B
Approach Delay (s/veh) 82.4 6.0
Approach LOS F
Copyright © 2016 University of Florida. All Rights Reserved. HCS 2010™ TWSC Version 6.90 Generated: 11/29/2016 9:59:20 AM
7TA.xtw
35
Page 90
HCS 2010 Two-Way Stop-Control Report
General Information Site Information
Analyst RH Intersection MD 424 & School Main Acce
Agency/Co. The Traffic Group, Inc. Jurisdiction Anne Arundel County
Date Performed 11/29/2016 East/West Street School Main Access
Analysis Year 2016 North/South Street MD 424
Time Analyzed Total PM Peak Hour Peak Hour Factor 0.92
Intersection Orientation North-South Analysis Time Period (hrs) 0.25
Project Description Crofton High School
Lanes
Major Street: North-South
Vehicle Volumes and Adjustments
Approach Eastbound Westbound Northbound Southbound
Movement U L T R U L T R U L T R U L T R
Priority 10 11 12 7 8 9 1U 1 2 3 4U 4 5 6
Number of Lanes 0 0 0 0 0 0 0 0 1 1 0 0 1 0
Configuration LR T R LT
Volume, V (veh/h) 61 138 579 31 62 511
Percent Heavy Vehicles (%) 3 3 3
Proportion Time Blocked
Percent Grade (%) 0
Right Turn Channelized No No No No
Median Type/Storage Undivided
Critical and Follow-up Headways
Base Critical Headway (sec)
Critical Headway (sec)
Base Follow-Up Headway (sec)
Follow-Up Headway (sec)
Delay, Queue Length, and Level of Service
Flow Rate, v (veh/h) 216 67
Capacity, c (veh/h) 298 920
v/c Ratio 0.72 0.07
95% Queue Length, Q₉₅ (veh) 5.2 0.2
Control Delay (s/veh) 43.3 9.2
Level of Service, LOS E A
Approach Delay (s/veh) 43.3 1.9
Approach LOS E
Copyright © 2016 University of Florida. All Rights Reserved. HCS 2010™ TWSC Version 6.90 Generated: 11/29/2016 9:59:33 AM
7TP.xtw
36
Page 91
HCS 2010 Two-Way Stop-Control Report
General Information Site Information
Analyst RH Intersection MD 424 & School Main Acce
Agency/Co. The Traffic Group, Inc. Jurisdiction Anne Arundel County
Date Performed 11/29/2016 East/West Street School Main Access
Analysis Year 2016 North/South Street MD 424
Time Analyzed Total AM Peak Hour w/imp Peak Hour Factor 0.92
Intersection Orientation North-South Analysis Time Period (hrs) 0.25
Project Description Crofton High School
Lanes
Major Street: North-South
Vehicle Volumes and Adjustments
Approach Eastbound Westbound Northbound Southbound
Movement U L T R U L T R U L T R U L T R
Priority 10 11 12 7 8 9 1U 1 2 3 4U 4 5 6
Number of Lanes 0 0 0 1 0 1 0 0 1 1 0 1 1 0
Configuration L R T R L T
Volume, V (veh/h) 39 87 582 92 208 621
Percent Heavy Vehicles (%) 3 3 3
Proportion Time Blocked
Percent Grade (%) 0
Right Turn Channelized No No No No
Median Type/Storage Undivided
Critical and Follow-up Headways
Base Critical Headway (sec)
Critical Headway (sec)
Base Follow-Up Headway (sec)
Follow-Up Headway (sec)
Delay, Queue Length, and Level of Service
Flow Rate, v (veh/h) 42 95 226
Capacity, c (veh/h) 68 478 866
v/c Ratio 0.62 0.20 0.26
95% Queue Length, Q₉₅ (veh) 2.7 0.7 1.0
Control Delay (s/veh) 119.7 14.4 10.6
Level of Service, LOS F B B
Approach Delay (s/veh) 46.7 2.7
Approach LOS E
Copyright © 2016 University of Florida. All Rights Reserved. HCS 2010™ TWSC Version 6.90 Generated: 11/29/2016 9:59:46 AM
7TAimp.xtw
37
Page 92
HCS 2010 Two-Way Stop-Control Report
General Information Site Information
Analyst RH Intersection MD 424 & School Main Acce
Agency/Co. The Traffic Group, Inc. Jurisdiction Anne Arundel County
Date Performed 11/29/2016 East/West Street School Main Access
Analysis Year 2016 North/South Street MD 424
Time Analyzed Total PM Peak Hour w/imp Peak Hour Factor 0.92
Intersection Orientation North-South Analysis Time Period (hrs) 0.25
Project Description Crofton High School
Lanes
Major Street: North-South
Vehicle Volumes and Adjustments
Approach Eastbound Westbound Northbound Southbound
Movement U L T R U L T R U L T R U L T R
Priority 10 11 12 7 8 9 1U 1 2 3 4U 4 5 6
Number of Lanes 0 0 0 1 0 1 0 0 1 1 0 1 1 0
Configuration L R T R L T
Volume, V (veh/h) 61 138 579 31 62 511
Percent Heavy Vehicles (%) 3 3 3
Proportion Time Blocked
Percent Grade (%) 0
Right Turn Channelized No No No No
Median Type/Storage Undivided
Critical and Follow-up Headways
Base Critical Headway (sec)
Critical Headway (sec)
Base Follow-Up Headway (sec)
Follow-Up Headway (sec)
Delay, Queue Length, and Level of Service
Flow Rate, v (veh/h) 66 150 67
Capacity, c (veh/h) 160 480 920
v/c Ratio 0.41 0.31 0.07
95% Queue Length, Q₉₅ (veh) 1.8 1.3 0.2
Control Delay (s/veh) 42.4 15.9 9.2
Level of Service, LOS E C A
Approach Delay (s/veh) 24.0 1.0
Approach LOS C
Copyright © 2016 University of Florida. All Rights Reserved. HCS 2010™ TWSC Version 6.90 Generated: 11/29/2016 9:59:56 AM
7TPimp.xtw
38
Page 93
HCS 2010 Two-Way Stop-Control Report
General Information Site Information
Analyst RH Intersection MD 424 & School Main Acce
Agency/Co. The Traffic Group, Inc. Jurisdiction Anne Arundel County
Date Performed 11/29/2016 East/West Street School Main Access
Analysis Year 2016 North/South Street MD 424
Time Analyzed Total AM w/PHF=0.5 Peak Hour Factor 1.00
Intersection Orientation North-South Analysis Time Period (hrs) 0.25
Project Description Crofton High School
Lanes
Major Street: North-South
Vehicle Volumes and Adjustments
Approach Eastbound Westbound Northbound Southbound
Movement U L T R U L T R U L T R U L T R
Priority 10 11 12 7 8 9 1U 1 2 3 4U 4 5 6
Number of Lanes 0 0 0 0 0 0 0 0 1 1 0 0 1 0
Configuration LR T R LT
Volume, V (veh/h) 78 174 582 184 416 621
Percent Heavy Vehicles (%) 3 3 3
Proportion Time Blocked
Percent Grade (%) 0
Right Turn Channelized No No No No
Median Type/Storage Undivided
Critical and Follow-up Headways
Base Critical Headway (sec) 7.1 6.2 4.1
Critical Headway (sec) 6.43 6.23 4.13
Base Follow-Up Headway (sec) 3.5 3.3 2.2
Follow-Up Headway (sec) 3.53 3.33 2.23
Delay, Queue Length, and Level of Service
Flow Rate, v (veh/h) 252 416
Capacity, c (veh/h) 89 842
v/c Ratio 2.82 0.49
95% Queue Length, Q₉₅ (veh) 24.2 2.8
Control Delay (s/veh) 922.4 13.4
Level of Service, LOS F B
Approach Delay (s/veh) 922.4 11.4
Approach LOS F
Copyright © 2016 University of Florida. All Rights Reserved. HCS 2010™ TWSC Version 6.90 Generated: 11/29/2016 10:04:32 AM
7TA2.xtw
39
Page 94
HCS 2010 Two-Way Stop-Control Report
General Information Site Information
Analyst RH Intersection MD 424 & School Main Acce
Agency/Co. The Traffic Group, Inc. Jurisdiction Anne Arundel County
Date Performed 11/29/2016 East/West Street School Main Access
Analysis Year 2016 North/South Street MD 424
Time Analyzed Total PM w/PHF=0.5 Peak Hour Factor 1.00
Intersection Orientation North-South Analysis Time Period (hrs) 0.25
Project Description Crofton High School
Lanes
Major Street: North-South
Vehicle Volumes and Adjustments
Approach Eastbound Westbound Northbound Southbound
Movement U L T R U L T R U L T R U L T R
Priority 10 11 12 7 8 9 1U 1 2 3 4U 4 5 6
Number of Lanes 0 0 0 0 0 0 0 0 1 1 0 0 1 0
Configuration LR T R LT
Volume, V (veh/h) 122 276 579 62 124 511
Percent Heavy Vehicles (%) 3 3 3
Proportion Time Blocked
Percent Grade (%) 0
Right Turn Channelized No No No No
Median Type/Storage Undivided
Critical and Follow-up Headways
Base Critical Headway (sec) 7.1 6.2 4.1
Critical Headway (sec) 6.43 6.23 4.13
Base Follow-Up Headway (sec) 3.5 3.3 2.2
Follow-Up Headway (sec) 3.53 3.33 2.23
Delay, Queue Length, and Level of Service
Flow Rate, v (veh/h) 398 124
Capacity, c (veh/h) 289 938
v/c Ratio 1.38 0.13
95% Queue Length, Q₉₅ (veh) 20.8 0.5
Control Delay (s/veh) 223.9 9.4
Level of Service, LOS F A
Approach Delay (s/veh) 223.9 3.2
Approach LOS F
Copyright © 2016 University of Florida. All Rights Reserved. HCS 2010™ TWSC Version 6.90 Generated: 11/29/2016 10:05:57 AM
7TP2.xtw
40
Page 95
HCS 2010 Two-Way Stop-Control Report
General Information Site Information
Analyst RH Intersection MD 424 & School Main Acce
Agency/Co. The Traffic Group, Inc. Jurisdiction Anne Arundel County
Date Performed 11/29/2016 East/West Street School Main Access
Analysis Year 2016 North/South Street MD 424
Time Analyzed Total AM w/PHF=0.5 & Imp Peak Hour Factor 1.00
Intersection Orientation North-South Analysis Time Period (hrs) 0.25
Project Description Crofton High School
Lanes
Major Street: North-South
Vehicle Volumes and Adjustments
Approach Eastbound Westbound Northbound Southbound
Movement U L T R U L T R U L T R U L T R
Priority 10 11 12 7 8 9 1U 1 2 3 4U 4 5 6
Number of Lanes 0 0 0 1 0 1 0 0 1 1 0 1 1 0
Configuration L R T R L T
Volume, V (veh/h) 78 174 582 184 416 621
Percent Heavy Vehicles (%) 3 3 3
Proportion Time Blocked
Percent Grade (%) 0
Right Turn Channelized No No No No
Median Type/Storage Undivided
Critical and Follow-up Headways
Base Critical Headway (sec) 7.1 6.2 4.1
Critical Headway (sec) 6.43 6.23 4.13
Base Follow-Up Headway (sec) 3.5 3.3 2.2
Follow-Up Headway (sec) 3.53 3.33 2.23
Delay, Queue Length, and Level of Service
Flow Rate, v (veh/h) 78 174 416
Capacity, c (veh/h) 31 511 842
v/c Ratio 2.48 0.34 0.49
95% Queue Length, Q₉₅ (veh) 9.0 1.5 2.8
Control Delay (s/veh) 940.4 15.6 13.4
Level of Service, LOS F C B
Approach Delay (s/veh) 301.9 5.4
Approach LOS F
Copyright © 2016 University of Florida. All Rights Reserved. HCS 2010™ TWSC Version 6.90 Generated: 11/29/2016 10:06:49 AM
7TA2imp.xtw
41
Page 96
HCS 2010 Two-Way Stop-Control Report
General Information Site Information
Analyst RH Intersection MD 424 & School Main Acce
Agency/Co. The Traffic Group, Inc. Jurisdiction Anne Arundel County
Date Performed 11/29/2016 East/West Street School Main Access
Analysis Year 2016 North/South Street MD 424
Time Analyzed Total PM w/PHF=0.5 & Imp Peak Hour Factor 1.00
Intersection Orientation North-South Analysis Time Period (hrs) 0.25
Project Description Crofton High School
Lanes
Major Street: North-South
Vehicle Volumes and Adjustments
Approach Eastbound Westbound Northbound Southbound
Movement U L T R U L T R U L T R U L T R
Priority 10 11 12 7 8 9 1U 1 2 3 4U 4 5 6
Number of Lanes 0 0 0 1 0 1 0 0 1 1 0 1 1 0
Configuration L R T R L T
Volume, V (veh/h) 122 276 579 62 124 511
Percent Heavy Vehicles (%) 3 3 3
Proportion Time Blocked
Percent Grade (%) 0
Right Turn Channelized No No No No
Median Type/Storage Undivided
Critical and Follow-up Headways
Base Critical Headway (sec) 7.1 6.2 4.1
Critical Headway (sec) 6.43 6.23 4.13
Base Follow-Up Headway (sec) 3.5 3.3 2.2
Follow-Up Headway (sec) 3.53 3.33 2.23
Delay, Queue Length, and Level of Service
Flow Rate, v (veh/h) 122 276 124
Capacity, c (veh/h) 146 513 938
v/c Ratio 0.84 0.54 0.13
95% Queue Length, Q₉₅ (veh) 5.4 3.2 0.5
Control Delay (s/veh) 96.4 19.9 9.4
Level of Service, LOS F C A
Approach Delay (s/veh) 43.3 1.8
Approach LOS E
Copyright © 2016 University of Florida. All Rights Reserved. HCS 2010™ TWSC Version 6.90 Generated: 11/29/2016 10:07:47 AM
7TP2imp.xtw
42
Page 97
HCS 2010 Signalized Intersection Results Summary
General Information Intersection Information
Agency The Traffic Group, Inc Duration, h 0.25
Analyst RH Analysis Date 11/29/2016 Area Type Other
Jurisdiction Anne Arundel County Time Period Total AM PHF 0.92
Urban Street MD 424 Analysis Year 2016 Analysis Period 1> 7:00
Intersection MD 424 & School Main … File Name 7TA1.xus
Project Description Crofton High School
Demand Information EB WB NB SB
Approach Movement L T R L T R L T R L T R
Demand ( v ), veh/h 39 87 582 92 208 621
Signal Information
Green
Yellow
Red
14.8 30.0 5.6 0.0 0.0 0.0
4.0 4.0 4.0 0.0 0.0 0.0
1.0 1.0 1.0 0.0 0.0 0.0
1 2 3 4
5 7 8
Cycle, s 65.3 Reference Phase 2
Offset, s 0 Reference Point End
Uncoordinated Yes Simult. Gap E/W On
Force Mode Fixed Simult. Gap N/S On
Timer Results EBL EBT WBL WBT NBL NBT SBL SBT
Assigned Phase 4 6 5 2
Case Number 9.0 7.3 1.0 4.0
Phase Duration, s 10.6 35.0 19.8 54.8
Change Period, ( Y+R c ), s 5.0 5.0 5.0 5.0
Max Allow Headway ( MAH ), s 3.3 4.0 4.1 4.0
Queue Clearance Time ( g s ), s 5.8 20.2 4.7 10.8
Green Extension Time ( g e ), s 0.2 6.8 0.7 6.9
Phase Call Probability 0.92 1.00 0.98 1.00
Max Out Probability 0.00 0.01 0.00 0.01
Movement Group Results EB WB NB SB
Approach Movement L T R L T R L T R L T R
Assigned Movement 7 14 6 16 5 2
Adjusted Flow Rate ( v ), veh/h 42 95 633 100 226 675
Adjusted Saturation Flow Rate ( s ), veh/h/ln 1774 1579 1863 1579 1774 1863
Queue Service Time ( g s ), s 1.5 3.8 18.2 2.4 2.7 8.8
Cycle Queue Clearance Time ( g c ), s 1.5 3.8 18.2 2.4 2.7 8.8
Green Ratio ( g/C ) 0.09 0.09 0.46 0.46 0.72 0.76
Capacity ( c ), veh/h 151 134 856 725 654 1419
Volume-to-Capacity Ratio ( X ) 0.281 0.704 0.739 0.138 0.346 0.476
Back of Queue ( Q ), ft/ln ( 95 th percentile) 27.5 66.1 279.2 33.6 38.8 63.6
Back of Queue ( Q ), veh/ln ( 95 th percentile) 1.1 2.6 11.0 1.3 1.5 2.5
Queue Storage Ratio ( RQ ) ( 95 th percentile) 0.00 0.00 0.00 0.00 0.00 0.00
Uniform Delay ( d 1 ), s/veh 28.0 29.1 14.5 10.2 7.4 2.9
Incremental Delay ( d 2 ), s/veh 0.4 2.5 1.3 0.1 0.3 0.2
Initial Queue Delay ( d 3 ), s/veh 0.0 0.0 0.0 0.0 0.0 0.0
Control Delay ( d ), s/veh 28.4 31.6 15.7 10.3 7.7 3.2
Level of Service (LOS) C C B B A A
Approach Delay, s/veh / LOS 0.0 30.6 C 15.0 B 4.3 A
Intersection Delay, s/veh / LOS 10.8 B
Multimodal Results EB WB NB SB
Pedestrian LOS Score / LOS 2.3 B 2.3 B 2.2 B 0.6 A
Bicycle LOS Score / LOS F 1.7 A 2.0 A
Copyright © 2016 University of Florida, All Rights Reserved. HCS 2010™ Streets Version 6.90 Generated: 11/29/2016 11:54:33 AM
43
Page 98
HCS 2010 Signalized Intersection Results Summary
General Information Intersection Information
Agency The Traffic Group, Inc Duration, h 0.25
Analyst RH Analysis Date 11/29/2016 Area Type Other
Jurisdiction Anne Arundel County Time Period Total PM PHF 1.00
Urban Street MD 424 Analysis Year 2016 Analysis Period 1> 7:00
Intersection MD 424 & School Main … File Name 7TP1.xus
Project Description Crofton High School
Demand Information EB WB NB SB
Approach Movement L T R L T R L T R L T R
Demand ( v ), veh/h 61 138 579 31 62 511
Signal Information
Green
Yellow
Red
9.9 30.0 7.4 0.0 0.0 0.0
4.0 4.0 4.0 0.0 0.0 0.0
1.0 1.0 1.0 0.0 0.0 0.0
1 2 3 4
5 7 8
Cycle, s 62.3 Reference Phase 2
Offset, s 0 Reference Point End
Uncoordinated Yes Simult. Gap E/W On
Force Mode Fixed Simult. Gap N/S On
Timer Results EBL EBT WBL WBT NBL NBT SBL SBT
Assigned Phase 4 6 5 2
Case Number 9.0 7.3 1.0 4.0
Phase Duration, s 12.4 35.0 14.9 49.9
Change Period, ( Y+R c ), s 5.0 5.0 5.0 5.0
Max Allow Headway ( MAH ), s 3.3 4.0 4.1 4.0
Queue Clearance Time ( g s ), s 7.3 16.6 2.7 8.6
Green Extension Time ( g e ), s 0.4 4.9 0.1 4.9
Phase Call Probability 0.97 1.00 0.66 1.00
Max Out Probability 0.00 0.00 0.00 0.00
Movement Group Results EB WB NB SB
Approach Movement L T R L T R L T R L T R
Assigned Movement 7 14 6 16 5 2
Adjusted Flow Rate ( v ), veh/h 61 138 579 31 62 511
Adjusted Saturation Flow Rate ( s ), veh/h/ln 1774 1579 1863 1579 1774 1863
Queue Service Time ( g s ), s 2.0 5.3 14.6 0.6 0.7 6.6
Cycle Queue Clearance Time ( g c ), s 2.0 5.3 14.6 0.6 0.7 6.6
Green Ratio ( g/C ) 0.12 0.12 0.48 0.48 0.67 0.72
Capacity ( c ), veh/h 211 188 897 760 602 1342
Volume-to-Capacity Ratio ( X ) 0.288 0.733 0.646 0.041 0.103 0.381
Back of Queue ( Q ), ft/ln ( 95 th percentile) 35.8 88.6 224.8 8.7 8 58.8
Back of Queue ( Q ), veh/ln ( 95 th percentile) 1.4 3.5 8.8 0.3 0.3 2.3
Queue Storage Ratio ( RQ ) ( 95 th percentile) 0.00 0.00 0.00 0.00 0.00 0.00
Uniform Delay ( d 1 ), s/veh 25.0 26.5 12.2 8.5 5.9 3.4
Incremental Delay ( d 2 ), s/veh 0.3 2.1 0.8 0.0 0.1 0.2
Initial Queue Delay ( d 3 ), s/veh 0.0 0.0 0.0 0.0 0.0 0.0
Control Delay ( d ), s/veh 25.3 28.6 12.9 8.6 5.9 3.5
Level of Service (LOS) C C B A A A
Approach Delay, s/veh / LOS 0.0 27.6 C 12.7 B 3.8 A
Intersection Delay, s/veh / LOS 11.2 B
Multimodal Results EB WB NB SB
Pedestrian LOS Score / LOS 2.3 B 2.3 B 2.2 B 0.6 A
Bicycle LOS Score / LOS F 1.5 A 1.4 A
Copyright © 2016 University of Florida, All Rights Reserved. HCS 2010™ Streets Version 6.90 Generated: 11/29/2016 11:49:01 AM
44
Page 99
HCS 2010 Signalized Intersection Results Summary
General Information Intersection Information
Agency The Traffic Group, Inc Duration, h 0.25
Analyst RH Analysis Date 11/29/2016 Area Type Other
Jurisdiction Anne Arundel County Time Period Total AM w/
PHF=0.5
PHF 1.00
Urban Street MD 424 Analysis Year 2016 Analysis Period 1> 7:00
Intersection MD 424 & School Main … File Name 7TA2.xus
Project Description Crofton High School
Demand Information EB WB NB SB
Approach Movement L T R L T R L T R L T R
Demand ( v ), veh/h 78 174 582 184 416 621
Signal Information
Green
Yellow
Red
15.0 30.0 9.8 0.0 0.0 0.0
4.0 4.0 4.0 0.0 0.0 0.0
1.0 1.0 1.0 0.0 0.0 0.0
1 2 3 4
5 7 8
Cycle, s 69.8 Reference Phase 2
Offset, s 0 Reference Point End
Uncoordinated Yes Simult. Gap E/W On
Force Mode Fixed Simult. Gap N/S On
Timer Results EBL EBT WBL WBT NBL NBT SBL SBT
Assigned Phase 4 6 5 2
Case Number 9.0 7.3 1.0 4.0
Phase Duration, s 14.8 35.0 20.0 55.0
Change Period, ( Y+R c ), s 5.0 5.0 5.0 5.0
Max Allow Headway ( MAH ), s 3.3 4.1 4.1 4.1
Queue Clearance Time ( g s ), s 9.4 20.1 9.0 11.9
Green Extension Time ( g e ), s 0.5 6.6 1.2 6.6
Phase Call Probability 0.99 1.00 1.00 1.00
Max Out Probability 0.00 0.01 0.05 0.00
Movement Group Results EB WB NB SB
Approach Movement L T R L T R L T R L T R
Assigned Movement 7 14 6 16 5 2
Adjusted Flow Rate ( v ), veh/h 78 174 582 184 416 621
Adjusted Saturation Flow Rate ( s ), veh/h/ln 1774 1579 1863 1579 1774 1863
Queue Service Time ( g s ), s 2.8 7.4 18.1 5.3 7.0 9.9
Cycle Queue Clearance Time ( g c ), s 2.8 7.4 18.1 5.3 7.0 9.9
Green Ratio ( g/C ) 0.14 0.14 0.43 0.43 0.67 0.72
Capacity ( c ), veh/h 250 223 800 678 625 1333
Volume-to-Capacity Ratio ( X ) 0.312 0.782 0.727 0.271 0.666 0.466
Back of Queue ( Q ), ft/ln ( 95 th percentile) 51.4 127.4 288.9 77.6 108.6 106.8
Back of Queue ( Q ), veh/ln ( 95 th percentile) 2.0 5.0 11.4 3.1 4.3 4.2
Queue Storage Ratio ( RQ ) ( 95 th percentile) 0.00 0.00 0.00 0.00 0.00 0.00
Uniform Delay ( d 1 ), s/veh 27.0 29.0 16.5 12.9 10.2 4.2
Incremental Delay ( d 2 ), s/veh 0.3 2.3 1.3 0.2 1.7 0.3
Initial Queue Delay ( d 3 ), s/veh 0.0 0.0 0.0 0.0 0.0 0.0
Control Delay ( d ), s/veh 27.2 31.2 17.8 13.1 11.9 4.5
Level of Service (LOS) C C B B B A
Approach Delay, s/veh / LOS 0.0 30.0 C 16.7 B 7.5 A
Intersection Delay, s/veh / LOS 13.7 B
Multimodal Results EB WB NB SB
Pedestrian LOS Score / LOS 2.3 B 2.3 B 2.3 B 0.6 A
Bicycle LOS Score / LOS F 1.8 A 2.2 B
Copyright © 2016 University of Florida, All Rights Reserved. HCS 2010™ Streets Version 6.90 Generated: 11/29/2016 11:54:33 AM
45
Page 100
HCS 2010 Signalized Intersection Results Summary
General Information Intersection Information
Agency The Traffic Group, Inc Duration, h 0.25
Analyst RH Analysis Date 11/29/2016 Area Type Other
Jurisdiction Anne Arundel County Time Period Total PM w/
PHF=0.5
PHF 1.00
Urban Street MD 424 Analysis Year 2016 Analysis Period 1> 7:00
Intersection MD 424 & School Main … File Name 7TP2.xus
Project Description Crofton High School
Demand Information EB WB NB SB
Approach Movement L T R L T R L T R L T R
Demand ( v ), veh/h 122 276 579 62 124 511
Signal Information
Green
Yellow
Red
13.8 30.0 15.3 0.0 0.0 0.0
4.0 4.0 4.0 0.0 0.0 0.0
1.0 1.0 1.0 0.0 0.0 0.0
1 2 3 4
5 7 8
Cycle, s 74.1 Reference Phase 2
Offset, s 0 Reference Point End
Uncoordinated Yes Simult. Gap E/W On
Force Mode Fixed Simult. Gap N/S On
Timer Results EBL EBT WBL WBT NBL NBT SBL SBT
Assigned Phase 4 6 5 2
Case Number 9.0 7.3 1.0 4.0
Phase Duration, s 20.3 35.0 18.8 53.8
Change Period, ( Y+R c ), s 5.0 5.0 5.0 5.0
Max Allow Headway ( MAH ), s 3.3 4.0 4.1 4.0
Queue Clearance Time ( g s ), s 14.5 21.9 4.1 11.6
Green Extension Time ( g e ), s 0.8 5.0 0.3 5.1
Phase Call Probability 1.00 1.00 0.92 1.00
Max Out Probability 0.00 0.00 0.00 0.00
Movement Group Results EB WB NB SB
Approach Movement L T R L T R L T R L T R
Assigned Movement 7 14 6 16 5 2
Adjusted Flow Rate ( v ), veh/h 122 276 579 62 124 511
Adjusted Saturation Flow Rate ( s ), veh/h/ln 1774 1579 1863 1579 1774 1863
Queue Service Time ( g s ), s 4.3 12.5 19.9 1.8 2.1 9.6
Cycle Queue Clearance Time ( g c ), s 4.3 12.5 19.9 1.8 2.1 9.6
Green Ratio ( g/C ) 0.21 0.21 0.40 0.40 0.62 0.66
Capacity ( c ), veh/h 366 326 754 639 541 1227
Volume-to-Capacity Ratio ( X ) 0.333 0.846 0.768 0.097 0.229 0.417
Back of Queue ( Q ), ft/ln ( 95 th percentile) 80.2 207.7 322.3 27.5 30.1 130.1
Back of Queue ( Q ), veh/ln ( 95 th percentile) 3.2 8.2 12.7 1.1 1.2 5.1
Queue Storage Ratio ( RQ ) ( 95 th percentile) 0.00 0.00 0.00 0.00 0.00 0.00
Uniform Delay ( d 1 ), s/veh 25.1 28.3 19.1 13.7 9.6 6.0
Incremental Delay ( d 2 ), s/veh 0.2 2.4 1.7 0.1 0.2 0.2
Initial Queue Delay ( d 3 ), s/veh 0.0 0.0 0.0 0.0 0.0 0.0
Control Delay ( d ), s/veh 25.3 30.7 20.8 13.8 9.8 6.2
Level of Service (LOS) C C C B A A
Approach Delay, s/veh / LOS 0.0 29.0 C 20.1 C 6.9 A
Intersection Delay, s/veh / LOS 17.2 B
Multimodal Results EB WB NB SB
Pedestrian LOS Score / LOS 2.3 B 2.3 B 2.3 B 0.7 A
Bicycle LOS Score / LOS F 1.5 A 1.5 A
Copyright © 2016 University of Florida, All Rights Reserved. HCS 2010™ Streets Version 6.90 Generated: 11/29/2016 11:49:01 AM
46
Page 101
APPENDIX C
Trip Assignment for
Background Developments