94
United States Department of Agriculture National Agricultural Statistics Service Cr Pr 2-1 (09) Crop Production 2008 Summary January 2009
United States Department of Agriculture National Agricultural Statistics Service Cr Pr 2-1 (09)
Crop Production 2008 Summary January 2009


Crop Production 2008 Summary Agricultural Statistics Board January 2009 1 NASS, USDA
Corn for grain production in 2008 is estimated at 12.1 billion bushels, up 1 percent from the November forecast but 7 percent below last year’s record high. The average U.S. grain yield is estimated at 153.9 bushels per acre, up 0.1 bushel from the November forecast and 3.2 bushels above 2007. The 2008 yield is the second highest on record, behind 2004, and production is second largest, behind last year.
Sorghum grain production in 2008 is estimated at 472 million bushels, up 2 percent from the November forecast but 5 percent below 2007. Planted area is estimated at 8.28 million acres, up 7 percent from last year, and area harvested for grain, at 7.27 million acres, is up 7 percent from 2007. Average grain yield, at 65.0 bushels per acre, is up 2.0 bushels from the previous forecast but down 8.2 bushels from last year.
Rice production in 2008 is estimated at 204 million cwt, up slightly from the previous forecast and up 3 percent from 2007. Planted area is estimated at 3.00 million acres, up 8 percent from 2007. Area for harvest, at 2.98 million acres, is up 2 percent from the previous forecast and up 8 percent from the previous crop year. The average yield for all U.S. rice is estimated at 6,846 pounds per acre, down 113 pounds from the previous forecast and 373 pounds below the 2007 record yield of 7,219 pounds per acre.
Soybean production in 2008 totaled 2.96 billion bushels, up 1 percent from the November forecast and up 11 percent from 2007. U.S. production is the fourth largest on record. The average yield per acre is estimated at 39.6 bushels, 0.3 bushel above the November forecast but 2.1 bushels below last year=s yield. Harvested area is up 16 percent from 2007, to a record 74.6 million acres.
All cotton production is estimated at 13.0 million 480-pound bales, down 4 percent from last month and down 32 percent from 2007. The U.S. yield is estimated at 810 pounds per acre, down 33 pounds from the December forecast and down 69 pounds from last year’s record high. Harvested area, at 7.73 million acres, is down less than 1 percent from December and down 26 percent from last year. Upland cotton producers in Texas abandoned 1.60 million acres of the 5.00 million acres planted.
This report was approved on January 12, 2009.
Acting Secretary of
Agriculture Charles F. Conner
Agricultural Statistics Board
Chairperson Carol C. House

Crop Production 2008 Summary Agricultural Statistics Board January 2009 2 NASS, USDA
Contents
Page Principal Crops.............................................................3 Grains & Hay Barley ...........................................................................11 Corn for Grain ................................................................4 Ears Per Acre...............................................................7 Corn for Silage ...............................................................6 Forage...........................................................................28 Hay, Alfalfa..................................................................24 New Seedings of Alfalfa ...........................................32 Hay, All ........................................................................22 Hay, Other ....................................................................26 Haylage ........................................................................30 Oats ..............................................................................10 Proso Millet ..................................................................21 Rice ..............................................................................18 Rye ...............................................................................20 Sorghum for Grain .........................................................8 Sorghum for Silage.........................................................9 Wheat, All ....................................................................12 Wheat, By Class ...........................................................16 Wheat, Durum..............................................................16 Head Population ........................................................17 Wheat, Other Spring.....................................................17 Head Population ........................................................17 Wheat, Winter ..............................................................14 Oilseeds Canola ..........................................................................33 Flaxseed .......................................................................39 Peanuts .........................................................................33 Mustard Seed................................................................39 Rapeseed ......................................................................39 Safflower ......................................................................39 Soybeans ......................................................................36 Pods with Beans per 18 Square Feet .........................38 Sunflower .....................................................................34
Cotton, Tobacco & Sugar Crops Cotton...........................................................................40 Cottonseed....................................................................42 Sugarbeets ....................................................................46 Sugarcane .....................................................................47 Tobacco, by Class and Type.........................................44 Tobacco, by States........................................................43 Dry Beans, Peas & Lentils Dry Edible Beans .........................................................48 Lentils...........................................................................57 Dry Edible Peas............................................................58 Austrian Winter Peas....................................................58 Wrinkled Seed Peas......................................................57 Potatoes & Miscellaneous Crops Potatoes ........................................................................59 Sweet Potatoes .............................................................64 Coffee...........................................................................68 Ginger Root..................................................................68 Hops .............................................................................66 Maple Syrup .................................................................68 Mint Oil........................................................................65 Taro ..............................................................................68 Alaska ..........................................................................69 Crop Comments .........................................................77 Crop Summary ...........................................................70 Information Contacts .................................................90 Weather Summary .....................................................74
Crop Production 2008 Summary Agricultural Statistics Board January 2009 3 NASS, USDA
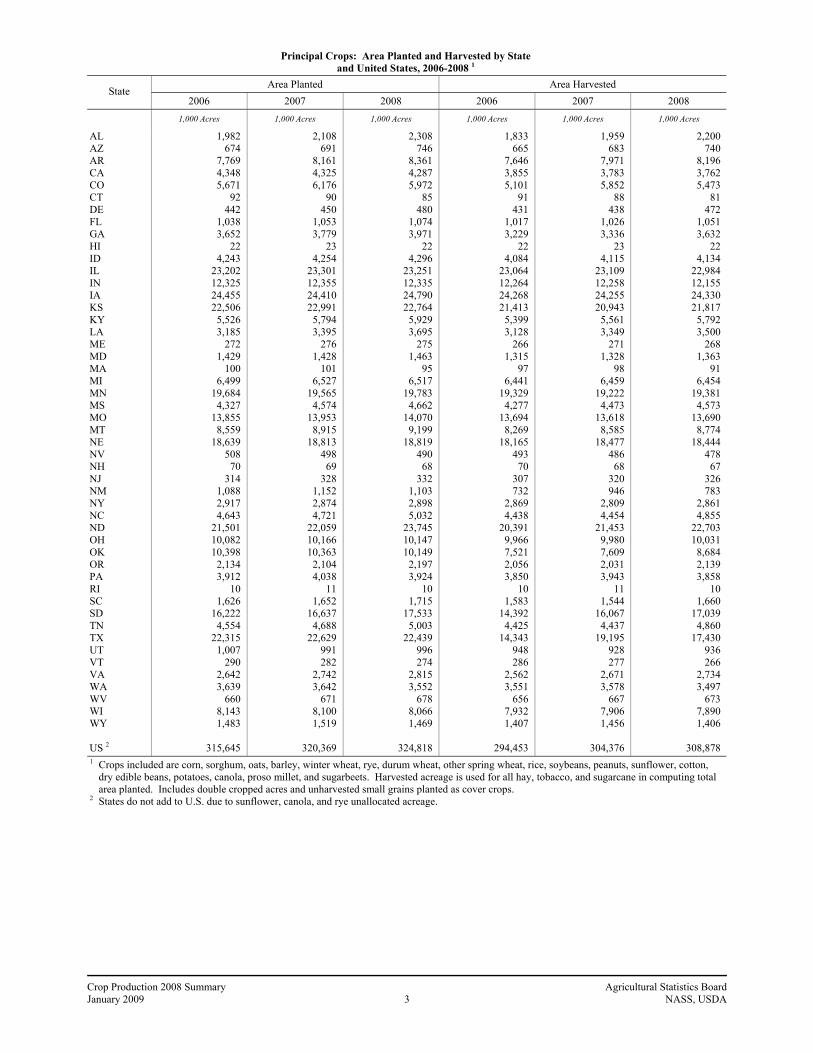
Principal Crops: Area Planted and Harvested by State and United States, 2006-2008 1
Area Planted Area Harvested State
2006 2007 2008 2006 2007 2008
1,000 Acres 1,000 Acres 1,000 Acres 1,000 Acres 1,000 Acres 1,000 Acres
AL AZ AR CA CO CT DE FL GA HI ID IL IN IA KS KY LA ME MD MA MI MN MS MO MT NE NV NH NJ NM NY NC ND OH OK OR PA RI SC SD TN TX UT VT VA WA WV WI WY US 2
1,982 674
7,769 4,348 5,671
92 442
1,038 3,652
22 4,243
23,202 12,325 24,455 22,506
5,526 3,185
272 1,429
100 6,499
19,684 4,327
13,855 8,559
18,639 508
70 314
1,088 2,917 4,643
21,501 10,082 10,398
2,134 3,912
10 1,626
16,222 4,554
22,315 1,007
290 2,642 3,639
660 8,143 1,483
315,645
2,108 691
8,161 4,325 6,176
90 450
1,053 3,779
23 4,254
23,301 12,355 24,410 22,991
5,794 3,395
276 1,428
101 6,527
19,565 4,574
13,953 8,915
18,813 498
69 328
1,152 2,874 4,721
22,059 10,166 10,363
2,104 4,038
11 1,652
16,637 4,688
22,629 991 282
2,742 3,642
671 8,100 1,519
320,369
2,308 746
8,361 4,287 5,972
85 480
1,074 3,971
22 4,296
23,251 12,335 24,790 22,764
5,929 3,695
275 1,463
95 6,517
19,783 4,662
14,070 9,199
18,819 490
68 332
1,103 2,898 5,032
23,745 10,147 10,149
2,197 3,924
10 1,715
17,533 5,003
22,439 996 274
2,815 3,552
678 8,066 1,469
324,818
1,833 665
7,646 3,855 5,101
91 431
1,017 3,229
22 4,084
23,064 12,264 24,268 21,413
5,399 3,128
266 1,315
97 6,441
19,329 4,277
13,694 8,269
18,165 493
70 307 732
2,869 4,438
20,391 9,966 7,521 2,056 3,850
10 1,583
14,392 4,425
14,343 948 286
2,562 3,551
656 7,932 1,407
294,453
1,959 683
7,971 3,783 5,852
88 438
1,026 3,336
23 4,115
23,109 12,258 24,255 20,943
5,561 3,349
271 1,328
98 6,459
19,222 4,473
13,618 8,585
18,477 486
68 320 946
2,809 4,454
21,453 9,980 7,609 2,031 3,943
11 1,544
16,067 4,437
19,195 928 277
2,671 3,578
667 7,906 1,456
304,376
2,200 740
8,196 3,762 5,473
81 472
1,051 3,632
22 4,134
22,984 12,155 24,330 21,817
5,792 3,500
268 1,363
91 6,454
19,381 4,573
13,690 8,774
18,444 478
67 326 783
2,861 4,855
22,703 10,031
8,684 2,139 3,858
10 1,660
17,039 4,860
17,430 936 266
2,734 3,497
673 7,890 1,406
308,878
1 Crops included are corn, sorghum, oats, barley, winter wheat, rye, durum wheat, other spring wheat, rice, soybeans, peanuts, sunflower, cotton, dry edible beans, potatoes, canola, proso millet, and sugarbeets. Harvested acreage is used for all hay, tobacco, and sugarcane in computing total area planted. Includes double cropped acres and unharvested small grains planted as cover crops.
2 States do not add to U.S. due to sunflower, canola, and rye unallocated acreage.

Crop Production 2008 Summary Agricultural Statistics Board January 2009 4 NASS, USDA
Corn: Area Planted for All Purposes and Harvested for Grain by State and United States, 2006-2008
Area Planted for All Purposes Area Harvested for Grain State
2006 2007 2008 2006 2007 2008
1,000 Acres 1,000 Acres 1,000 Acres 1,000 Acres 1,000 Acres 1,000 Acres
AL AZ AR CA CO CT 1 DE FL GA ID IL IN IA KS KY LA ME 1 MD MA 1 MI MN MS MO MT NE NV 1 NH 1 NJ NM NY NC ND OH OK OR PA RI 1 SC SD TN TX UT VT 1 VA WA WV WI WY US
200 50
190 520
1,000 27
170 60
280 270
11,300 5,500
12,600 3,350 1,120
300 26
490 18
2,200 7,300
340 2,700
65 8,100
4 14 80
130 950 790
1,690 3,150
270 51
1,350 2
310 4,500
550 1,760
65 85
480 140
45 3,650
85
78,327
340 55
610 650
1,200 26
195 70
510 320
13,200 6,500
14,200 3,900 1,440
740 28
540 18
2,650 8,400
930 3,450
84 9,400
5 14 95
135 1,060 1,090 2,560 3,850
320 60
1,430 2
400 4,950
860 2,150
70 92
540 195
48 4,050
95
93,527
260 50
440 670
1,250 27
160 70
370 300
12,100 5,700
13,300 3,850 1,210
520 29
460 19
2,400 7,700
720 2,800
78 8,800
5 15 85
140 1,090
900 2,550 3,300
370 60
1,350 2
355 4,750
690 2,300
70 94
470 165
43 3,800
95
85,982
165 18
180 110 860
161
30 225
65 11,150
5,380 12,350
3,000 1,040
290
425
1,950 6,850
325 2,630
18 7,750
64 45
480 740
1,400 2,960
220 29
960
290 3,220
500 1,450
17
345 75 26
2,800 45
70,638
280 22
590 190
1,060
185 35
450 105
13,050 6,370
13,900 3,680 1,340
730
465
2,340 7,850
910 3,270
38 9,200
82 54
550 1,010 2,350 3,610
270 35
980
370 4,480
790 1,970
22
405 115
27 3,280
60
86,520
235 15
430 170
1,080
152 35
310 80
11,900 5,460
12,800 3,630 1,120
510
400
2,140 7,200
700 2,650
35 8,550
74 55
640 830
2,300 3,120
320 33
880
315 4,400
630 2,030
23
340 90 26
2,880 52
78,640
1 Area harvested for grain not estimated.

Crop Production 2008 Summary Agricultural Statistics Board January 2009 5 NASS, USDA
Corn for Grain: Yield and Production by State and United States, 2006-2008
Yield Production State
2006 2007 2008 2006 2007 2008
Bushels Bushels Bushels 1,000 Bushels 1,000 Bushels 1,000 Bushels
AL AZ AR CA CO CT 1 DE FL GA ID IL IN IA KS KY LA ME 1 MD MA 1 MI MN MS MO MT NE NV 1 NH 1 NJ NM NY NC ND OH OK OR PA RI 1 SC SD TN TX UT VT 1 VA WA WV WI WY US
72.0 170.0 146.0 165.0 156.0
145.0
82.0 110.0 170.0 163.0 157.0 166.0 115.0 146.0 140.0
140.0
147.0 161.0 107.0 138.0 146.0 152.0
129.0 185.0 129.0 132.0 111.0 159.0 105.0 180.0 122.0
110.0
97.0 125.0 121.0 157.0
120.0 210.0 120.0 143.0 129.0
149.1
78.0 185.0 169.0 182.0 140.0
99.0 90.0
127.0 170.0 175.0 154.0 171.0 138.0 128.0 163.0
101.0
123.0 146.0 148.0 140.0 140.0 160.0
124.0 180.0 128.0 100.0 116.0 150.0 145.0 200.0 124.0
97.0
121.0 106.0 148.0 150.0
86.0
210.0 111.0 135.0 129.0
150.7
104.0 165.0 155.0 195.0 137.0
125.0 105.0 140.0 170.0 179.0 160.0 171.0 134.0 136.0 144.0
121.0
138.0 164.0 140.0 144.0 136.0 163.0
116.0 180.0 144.0
78.0 124.0 135.0 115.0 200.0 133.0
65.0
133.0 118.0 125.0 157.0
108.0 205.0 130.0 137.0 134.0
153.9
11,880 3,060
26,280 18,150
134,160
23,345 2,460
24,750 11,050
1,817,450 844,660
2,050,100 345,000 151,840 40,600
59,500
286,650
1,102,850 34,775
362,940 2,628
1,178,000
8,256 8,325
61,920 97,680
155,400 470,640 23,100
5,220 117,120
31,900
312,340 62,500
175,450 2,669
41,400 15,750
3,120 400,400
5,805
10,531,123
21,840 4,070
99,710 34,580
148,400
18,315 3,150
57,150 17,850
2,283,750 980,980
2,376,900 507,840 171,520 118,990
46,965
287,820
1,146,100 134,680 457,800
5,320 1,472,000
10,168 9,720
70,400 101,000 272,600 541,500 39,150
7,000 121,520
35,890
542,080 83,740
291,560 3,300
34,830 24,150
2,997 442,800
7,740
13,037,875
24,440 2,475
66,650 33,150
147,960
19,000 3,675
43,400 13,600
2,130,100 873,600
2,188,800 486,420 152,320 73,440
48,400
295,320
1,180,800 98,000
381,600 4,760
1,393,650
8,584 9,900
92,160 64,740
285,200 421,200 36,800
6,600 117,040
20,475
585,200 74,340
253,750 3,611
36,720 18,450
3,380 394,560
6,968
12,101,238 1 Not estimated.

Crop Production 2008 Summary Agricultural Statistics Board January 2009 6 NASS, USDA
Corn for Silage: Area Harvested, Yield, and Production by State and United States, 2006-2008
Area Harvested Yield Production State
2006 2007 2008 2006 2007 2008 2006 2007 2008
1,000 Acres 1,000 Acres 1,000 Acres Tons Tons Tons 1,000 Tons 1,000 Tons 1,000 Tons
AL AZ AR CA CO CT DE FL GA ID IL IN IA KS KY LA ME MD MA MI MN MS MO MT NE NV NH NJ NM NY NC ND OH OK OR PA RI SC SD TN TX UT VT VA WA WV WI WY US
10 31
4 405
90 26
8 27 40
200 105 100 220 300
75 5
24 60 15
240 400
10 60 45
280 4
14 15 84
460 45
220 150
35 22
380 2
14 850
47 160
47 81
130 65 18
830 34
6,487
10 33
4 455 110
24 7
30 40
210 100 110 250 160
85 5
25 65 15
295 450
15 70 44
170 5
13 11 80
505 60
180 180
30 25
430 2
12 400
55 150
47 87
130 80 20
745 31
6,060
10 35
4 495 120
23 6
30 45
215 100 110 200 170
85 5
25 55 15
250 400
15 50 41
160 5
14 10 83
445 55
220 140
30 27
450 2
28 300
55 180
47 86
125 75 16
875 33
5,965
8.0 26.0 12.0 27.0 20.5 17.5 20.0 18.0 17.0 27.5 18.0 21.0 18.5 12.0 18.0 14.0 17.0 17.0 19.0 16.5 15.0 14.0 13.0 22.0 15.0 25.0 18.0 17.0 25.0 18.0 18.0
5.9 17.0 17.0 26.0 18.0 20.5 15.0
6.0 16.0 15.0 22.0 13.0 17.5 27.0 17.0 17.0 22.0
16.2
8.0 27.0 15.0 26.5 22.5 19.5 10.0 18.0 18.0 27.0 18.0 18.5 19.5 18.0 13.5 18.0 18.0 12.0 20.0 14.5 13.5 13.0 15.0 22.0 17.0 25.0 20.5 15.0 25.0 17.0 11.0 11.0 17.0 19.5 25.5 16.5 20.0 14.0 11.5 11.0 23.0 21.0 19.0 14.0 26.0 14.0 16.0 20.0
17.5
15.0 30.0 14.0 26.5 21.5 21.5 13.0 17.0 18.0 27.0 17.0 20.0 20.5 17.0 16.0 14.0 18.0 15.0 19.5 16.5 16.0 13.0 14.0 22.0 17.0 26.0 21.5 17.0 25.0 20.0 15.0 10.0 17.0 16.5 27.0 18.5 20.5
9.0 12.0 15.0 21.0 23.0 19.0 16.0 26.0 17.0 17.5 23.0
18.7
80 806
48 10,935
1,845 455 160 486 680
5,500 1,890 2,100 4,070 3,600 1,350
70 408
1,020 285
3,960 6,000
140 780 990
4,200 100 252 255
2,100 8,280
810 1,298 2,550
595 572
6,840 41
210 5,100
752 2,400 1,034 1,053 2,275 1,755
306 14,110
748
105,294
80 891
60 12,058
2,475 468
70 540 720
5,670 1,800 2,035 4,875 2,880 1,148
90 450 780 300
4,278 6,075
195 1,050
968 2,890
125 267 165
2,000 8,585
660 1,980 3,060
585 638
7,095 40
168 4,600
605 3,450
987 1,653 1,820 2,080
280 11,920
620
106,229
150 1,050
56 13,118
2,580 495
78 510 810
5,805 1,700 2,200 4,100 2,890 1,360
70 450 825 293
4,125 6,400
195 700 902
2,720 130 301 170
2,075 8,900
825 2,200 2,380
495 729
8,325 41
252 3,600
825 3,780 1,081 1,634 2,000 1,950
272 15,313
759
111,619
Crop Production 2008 Summary Agricultural Statistics Board January 2009 7 NASS, USDA
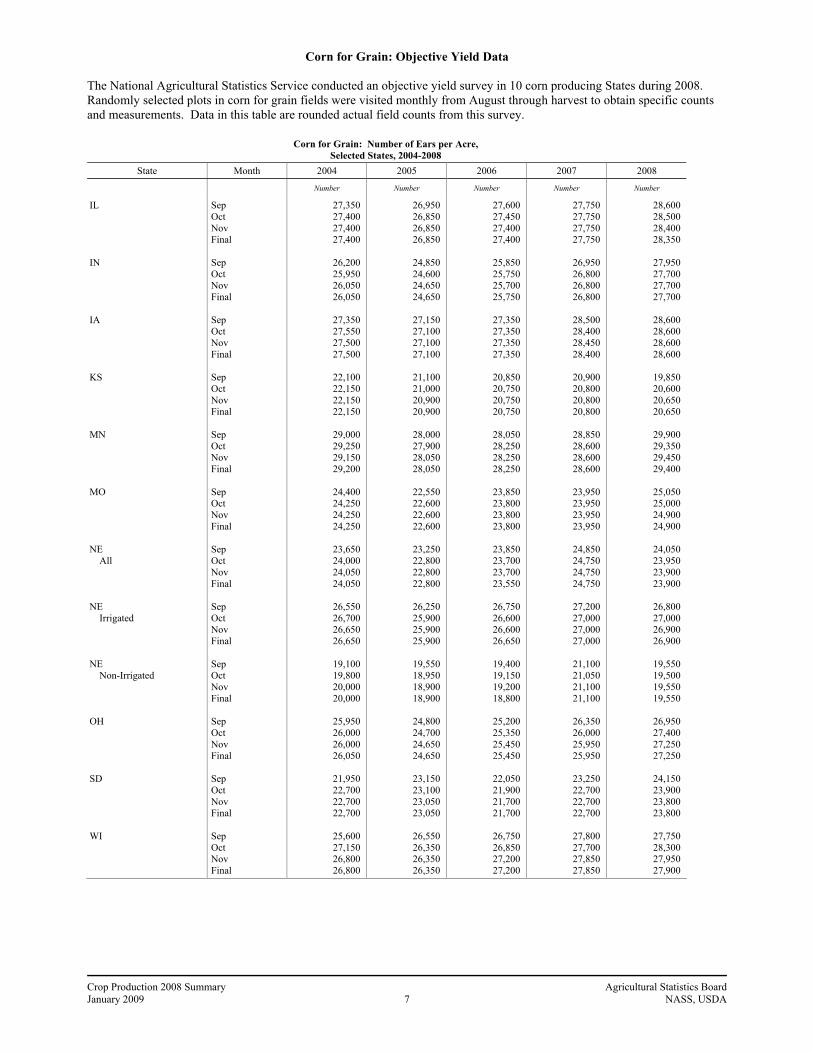
Corn for Grain: Objective Yield Data The National Agricultural Statistics Service conducted an objective yield survey in 10 corn producing States during 2008. Randomly selected plots in corn for grain fields were visited monthly from August through harvest to obtain specific counts and measurements. Data in this table are rounded actual field counts from this survey.
Corn for Grain: Number of Ears per Acre, Selected States, 2004-2008
State Month 2004 2005 2006 2007 2008
Number Number Number Number Number
IL IN IA KS MN MO NE All NE Irrigated NE Non-Irrigated OH SD WI
Sep Oct Nov Final Sep Oct Nov Final Sep Oct Nov Final Sep Oct Nov Final Sep Oct Nov Final Sep Oct Nov Final Sep Oct Nov Final Sep Oct Nov Final Sep Oct Nov Final Sep Oct Nov Final Sep Oct Nov Final Sep Oct Nov Final
27,350 27,400 27,400 27,400
26,200 25,950 26,050 26,050
27,350 27,550 27,500 27,500
22,100 22,150 22,150 22,150
29,000 29,250 29,150 29,200
24,400 24,250 24,250 24,250
23,650 24,000 24,050 24,050
26,550 26,700 26,650 26,650
19,100 19,800 20,000 20,000
25,950 26,000 26,000 26,050
21,950 22,700 22,700 22,700
25,600 27,150 26,800 26,800
26,950 26,850 26,850 26,850
24,850 24,600 24,650 24,650
27,150 27,100 27,100 27,100
21,100 21,000 20,900 20,900
28,000 27,900 28,050 28,050
22,550 22,600 22,600 22,600
23,250 22,800 22,800 22,800
26,250 25,900 25,900 25,900
19,550 18,950 18,900 18,900
24,800 24,700 24,650 24,650
23,150 23,100 23,050 23,050
26,550 26,350 26,350 26,350
27,600 27,450 27,400 27,400
25,850 25,750 25,700 25,750
27,350 27,350 27,350 27,350
20,850 20,750 20,750 20,750
28,050 28,250 28,250 28,250
23,850 23,800 23,800 23,800
23,850 23,700 23,700 23,550
26,750 26,600 26,600 26,650
19,400 19,150 19,200 18,800
25,200 25,350 25,450 25,450
22,050 21,900 21,700 21,700
26,750 26,850 27,200 27,200
27,750 27,750 27,750 27,750
26,950 26,800 26,800 26,800
28,500 28,400 28,450 28,400
20,900 20,800 20,800 20,800
28,850 28,600 28,600 28,600
23,950 23,950 23,950 23,950
24,850 24,750 24,750 24,750
27,200 27,000 27,000 27,000
21,100 21,050 21,100 21,100
26,350 26,000 25,950 25,950
23,250 22,700 22,700 22,700
27,800 27,700 27,850 27,850
28,600 28,500 28,400 28,350
27,950 27,700 27,700 27,700
28,600 28,600 28,600 28,600
19,850 20,600 20,650 20,650
29,900 29,350 29,450 29,400
25,050 25,000 24,900 24,900
24,050 23,950 23,900 23,900
26,800 27,000 26,900 26,900
19,550 19,500 19,550 19,550
26,950 27,400 27,250 27,250
24,150 23,900 23,800 23,800
27,750 28,300 27,950 27,900

Crop Production 2008 Summary Agricultural Statistics Board January 2009 8 NASS, USDA
Sorghum: Area Planted for All Purposes and Harvested for Grain, Yield, and Production by State and United States, 2006-2008
Area Planted for All Purposes Area Harvested for Grain State
2006 2007 2008 2006 2007 2008
1,000 Acres 1,000 Acres 1,000 Acres 1,000 Acres 1,000 Acres 1,000 Acres
AL AZ AR CA CO GA IL KS KY LA MS MO NE NM NC OK PA SC SD TN TX US
10 24 63 32
280 40 75
2,750 18 90 15
100 370 110
17 270
13 11
220 14
2,000
6,522
12 42
225 39
220 65 80
2,800 15
250 145 110 350 105
12 240
15 9
210 18
2,750
7,712
12 57
125 47
230 60 80
2,900 13
120 85 90
300 130
16 350
11 12
170 26
3,450
8,284
5 7
60 10
130 26 72
2,500 16 87 13 95
240 60 13
200 5 7
80 11
1,300
4,937
6 20
215 10
150 45 77
2,650 12
245 115 100 240
75 8
220 3 6
130 15
2,450
6,792
6 27
115 9
150 44 76
2,750 11
110 82 80
210 80 13
310 3 8
115 22
3,050
7,271 Yield Production
2006 2007 2008 2006 2007 2008
Bushels Bushels Bushels 1,000 Bushels 1,000 Bushels 1,000 Bushels
AL AZ AR CA CO GA IL KS KY LA MS MO NE NM NC OK PA SC SD TN TX US
38.0 90.0 85.0
105.0 26.0 45.0 89.0 58.0 85.0 94.0 80.0 85.0 78.0 35.0 47.0 34.0 66.0 51.0 36.0 95.0 48.0
56.1
40.0 90.0 96.0 85.0 37.0 46.0 81.0 79.0 90.0 95.0 85.0 96.0 94.0 40.0 55.0 56.0 56.0 35.0 60.0 82.0 65.0
73.2
53.0 90.0 88.0 95.0 30.0 45.0
103.0 78.0 90.0 87.0 71.0 97.0 91.0 43.0 56.0 45.0 37.0 46.0 64.0 91.0 52.0
65.0
190 630
5,100 1,050 3,380 1,170 6,408
145,000 1,360 8,178 1,040 8,075
18,720 2,100
611 6,800
330 357
2,880 1,045
62,400
276,824
240 1,800
20,640 850
5,550 2,070 6,237
209,350 1,080
23,275 9,775 9,600
22,560 3,000
440 12,320
168 210
7,800 1,230
159,250
497,445
318 2,430
10,120 855
4,500 1,980 7,828
214,500 990
9,570 5,822 7,760
19,110 3,440
728 13,950
111 368
7,360 2,002
158,600
472,342
Crop Production 2008 Summary Agricultural Statistics Board January 2009 9 NASS, USDA
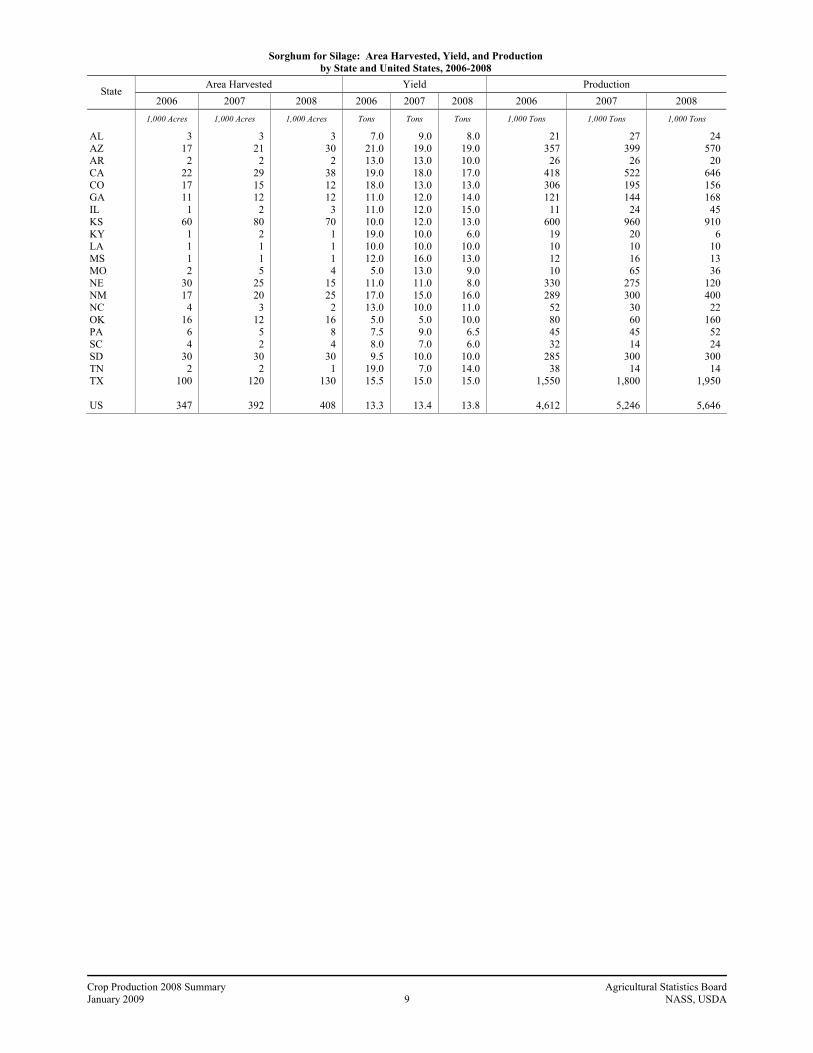
Sorghum for Silage: Area Harvested, Yield, and Production by State and United States, 2006-2008
Area Harvested Yield Production State
2006 2007 2008 2006 2007 2008 2006 2007 2008
1,000 Acres 1,000 Acres 1,000 Acres Tons Tons Tons 1,000 Tons 1,000 Tons 1,000 Tons
AL AZ AR CA CO GA IL KS KY LA MS MO NE NM NC OK PA SC SD TN TX US
3 17
2 22 17 11
1 60
1 1 1 2
30 17
4 16
6 4
30 2
100
347
3 21
2 29 15 12
2 80
2 1 1 5
25 20
3 12
5 2
30 2
120
392
3 30
2 38 12 12
3 70
1 1 1 4
15 25
2 16
8 4
30 1
130
408
7.0 21.0 13.0 19.0 18.0 11.0 11.0 10.0 19.0 10.0 12.0
5.0 11.0 17.0 13.0
5.0 7.5 8.0 9.5
19.0 15.5
13.3
9.0 19.0 13.0 18.0 13.0 12.0 12.0 12.0 10.0 10.0 16.0 13.0 11.0 15.0 10.0
5.0 9.0 7.0
10.0 7.0
15.0
13.4
8.0 19.0 10.0 17.0 13.0 14.0 15.0 13.0
6.0 10.0 13.0
9.0 8.0
16.0 11.0 10.0
6.5 6.0
10.0 14.0 15.0
13.8
21 357
26 418 306 121
11 600
19 10 12 10
330 289
52 80 45 32
285 38
1,550
4,612
27 399
26 522 195 144
24 960
20 10 16 65
275 300
30 60 45 14
300 14
1,800
5,246
24 570
20 646 156 168
45 910
6 10 13 36
120 400
22 160
52 24
300 14
1,950
5,646

Crop Production 2008 Summary Agricultural Statistics Board January 2009 10 NASS, USDA
Oats: Area Planted and Harvested, Yield, and Production by State and United States, 2006-2008
Area Planted 1 Area Harvested State
2006 2007 2008 2006 2007 2008
1,000 Acres 1,000 Acres 1,000 Acres 1,000 Acres 1,000 Acres 1,000 Acres
AL CA CO GA ID IL IN IA KS ME MI MN MO MT NE NY NC ND OH OK OR PA SC SD TX UT VA WA WI WY US
50 270 85 70 90 60 25
210 100 29 80
290 40 70
160 85 60
420 70 35 50
135 33
380 760 45 16 30
370 48
4,166
45 215 75 70 70 35 25
145 90 29 70
270 25 75
120 100 50
460 75 80 60
115 33
330 710 35 16 30
270 40
3,763
50 230 45 65 70 45 15
150 60 32 75
250 15 60 95 80 60
320 75 50 45
105 33
220 600 40 12 20
270 30
3,217
10 20 10 30 20 40 14
110 40 28 65
200 28 24 45 67 26
120 55
8 20
110 18 95
100 7 4 8
230 12
1,564
16 25 10 30 20 24
8 67 35 28 55
180 8
35 35 60 15
260 50 15 18 80 14
130 100
4 5 9
160 8
1,504
15 20
7 25 20 30
5 75 25 31 60
175 6
30 35 64 30
130 50 10 18 80 19
120 100
4 4 5
190 12
1,395
Yield Production State
2006 2007 2008 2006 2007 2008 Bushels Bushels Bushels 1,000 Bushels 1,000 Bushels 1,000 Bushels
AL CA CO GA ID IL IN IA KS ME MI MN MO MT NE NY NC ND OH OK OR PA SC SD TX UT VA WA WI WY US
40.0 90.0 70.0 53.0 72.0 77.0 80.0 76.0 46.0 55.0 62.0 56.0 65.0 46.0 45.0 74.0 65.0 41.0 75.0 30.0 95.0 64.0 50.0 57.0 37.0 77.0 50.0 84.0 63.0 57.0
59.8
58.0 99.0 55.0 56.0 61.0 62.0 53.0 71.0 45.0 70.0 56.0 60.0 50.0 50.0 61.0 58.0 55.0 59.0 62.0 31.0 78.0 56.0 42.0 72.0 40.0 80.0 60.0 50.0 67.0 47.0
60.1
50.0 75.0 70.0 69.0 69.0 70.0 75.0 65.0 53.0 65.0 66.0 68.0 55.0 51.0 70.0 66.0 80.0 51.0 70.0 40.0
100.0 58.0 64.0 73.0 50.0 75.0 70.0 80.0 62.0 50.0
63.5
400 1,800
700 1,590 1,440 3,080 1,120 8,360 1,840 1,540 4,030
11,200 1,820 1,104 2,025 4,958 1,690 4,920 4,125
240 1,900 7,040
900 5,415 3,700
539 200 672
14,490 684
93,522
928 2,475
550 1,680 1,220 1,488
424 4,757 1,575 1,960 3,080
10,800 400
1,750 2,135 3,480
825 15,340
3,100 465
1,404 4,480
588 9,360 4,000
320 300 450
10,720 376
90,430
750 1,500
490 1,725 1,380 2,100
375 4,875 1,325 2,015 3,960
11,900 330
1,530 2,450 4,224 2,400 6,630 3,500
400 1,800 4,640 1,216 8,760 5,000
300 280 400
11,780 600
88,635
1 Includes area planted in preceding fall.
Crop Production 2008 Summary Agricultural Statistics Board January 2009 11 NASS, USDA
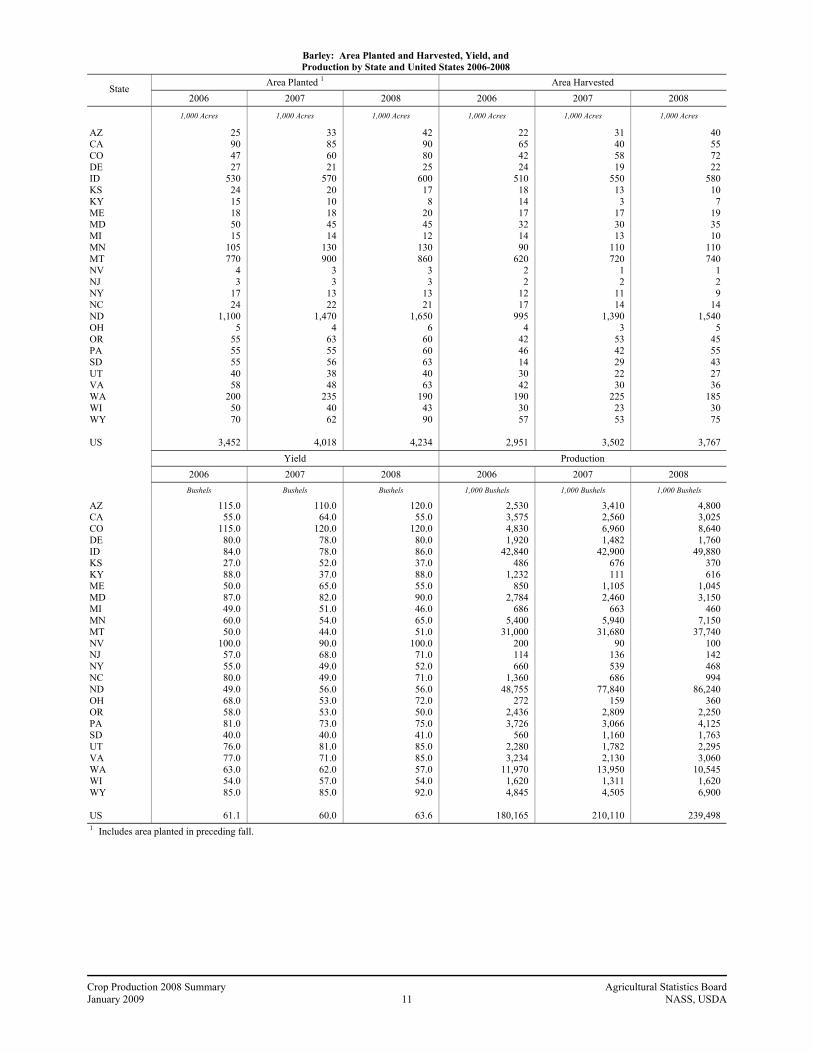
Barley: Area Planted and Harvested, Yield, and Production by State and United States 2006-2008
Area Planted 1 Area Harvested State
2006 2007 2008 2006 2007 2008
1,000 Acres 1,000 Acres 1,000 Acres 1,000 Acres 1,000 Acres 1,000 Acres
AZ CA CO DE ID KS KY ME MD MI MN MT NV NJ NY NC ND OH OR PA SD UT VA WA WI WY US
25 90 47 27
530 24 15 18 50 15
105 770
4 3
17 24
1,100 5
55 55 55 40 58
200 50 70
3,452
33 85 60 21
570 20 10 18 45 14
130 900
3 3
13 22
1,470 4
63 55 56 38 48
235 40 62
4,018
42 90 80 25
600 17
8 20 45 12
130 860
3 3
13 21
1,650 6
60 60 63 40 63
190 43 90
4,234
22 65 42 24
510 18 14 17 32 14 90
620 2 2
12 17
995 4
42 46 14 30 42
190 30 57
2,951
31 40 58 19
550 13
3 17 30 13
110 720
1 2
11 14
1,390 3
53 42 29 22 30
225 23 53
3,502
40 55 72 22
580 10
7 19 35 10
110 740
1 2 9
14 1,540
5 45 55 43 27 36
185 30 75
3,767
Yield Production
2006 2007 2008 2006 2007 2008 Bushels Bushels Bushels 1,000 Bushels 1,000 Bushels 1,000 Bushels
AZ CA CO DE ID KS KY ME MD MI MN MT NV NJ NY NC ND OH OR PA SD UT VA WA WI WY US
115.0 55.0
115.0 80.0 84.0 27.0 88.0 50.0 87.0 49.0 60.0 50.0
100.0 57.0 55.0 80.0 49.0 68.0 58.0 81.0 40.0 76.0 77.0 63.0 54.0 85.0
61.1
110.0 64.0
120.0 78.0 78.0 52.0 37.0 65.0 82.0 51.0 54.0 44.0 90.0 68.0 49.0 49.0 56.0 53.0 53.0 73.0 40.0 81.0 71.0 62.0 57.0 85.0
60.0
120.0 55.0
120.0 80.0 86.0 37.0 88.0 55.0 90.0 46.0 65.0 51.0
100.0 71.0 52.0 71.0 56.0 72.0 50.0 75.0 41.0 85.0 85.0 57.0 54.0 92.0
63.6
2,530 3,575 4,830 1,920
42,840 486
1,232 850
2,784 686
5,400 31,000
200 114 660
1,360 48,755
272 2,436 3,726
560 2,280 3,234
11,970 1,620 4,845
180,165
3,410 2,560 6,960 1,482
42,900 676 111
1,105 2,460
663 5,940
31,680 90
136 539 686
77,840 159
2,809 3,066 1,160 1,782 2,130
13,950 1,311 4,505
210,110
4,800 3,025 8,640 1,760
49,880 370 616
1,045 3,150
460 7,150
37,740 100 142 468 994
86,240 360
2,250 4,125 1,763 2,295 3,060
10,545 1,620 6,900
239,498
1 Includes area planted in preceding fall.
Crop Production 2008 Summary Agricultural Statistics Board January 2009 12 NASS, USDA
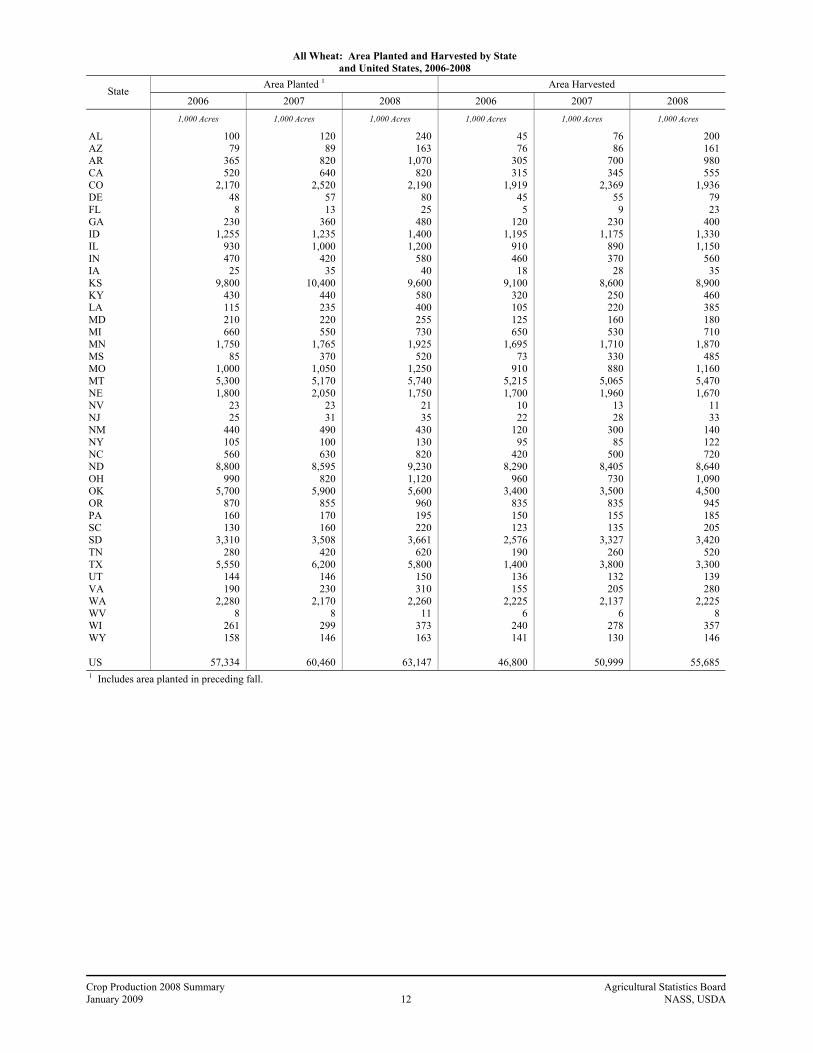
All Wheat: Area Planted and Harvested by State and United States, 2006-2008
Area Planted 1 Area Harvested State
2006 2007 2008 2006 2007 2008
1,000 Acres 1,000 Acres 1,000 Acres 1,000 Acres 1,000 Acres 1,000 Acres
AL AZ AR CA CO DE FL GA ID IL IN IA KS KY LA MD MI MN MS MO MT NE NV NJ NM NY NC ND OH OK OR PA SC SD TN TX UT VA WA WV WI WY US
100 79
365 520
2,170 48
8 230
1,255 930 470
25 9,800
430 115 210 660
1,750 85
1,000 5,300 1,800
23 25
440 105 560
8,800 990
5,700 870 160 130
3,310 280
5,550 144 190
2,280 8
261 158
57,334
120 89
820 640
2,520 57 13
360 1,235 1,000
420 35
10,400 440 235 220 550
1,765 370
1,050 5,170 2,050
23 31
490 100 630
8,595 820
5,900 855 170 160
3,508 420
6,200 146 230
2,170 8
299 146
60,460
240 163
1,070 820
2,190 80 25
480 1,400 1,200
580 40
9,600 580 400 255 730
1,925 520
1,250 5,740 1,750
21 35
430 130 820
9,230 1,120 5,600
960 195 220
3,661 620
5,800 150 310
2,260 11
373 163
63,147
45 76
305 315
1,919 45
5 120
1,195 910 460
18 9,100
320 105 125 650
1,695 73
910 5,215 1,700
10 22
120 95
420 8,290
960 3,400
835 150 123
2,576 190
1,400 136 155
2,225 6
240 141
46,800
76 86
700 345
2,369 55
9 230
1,175 890 370
28 8,600
250 220 160 530
1,710 330 880
5,065 1,960
13 28
300 85
500 8,405
730 3,500
835 155 135
3,327 260
3,800 132 205
2,137 6
278 130
50,999
200 161 980 555
1,936 79 23
400 1,330 1,150
560 35
8,900 460 385 180 710
1,870 485
1,160 5,470 1,670
11 33
140 122 720
8,640 1,090 4,500
945 185 205
3,420 520
3,300 139 280
2,225 8
357 146
55,685
1 Includes area planted in preceding fall.

Crop Production 2008 Summary Agricultural Statistics Board January 2009 13 NASS, USDA
All Wheat: Yield and Production by State and United States, 2006-2008
Yield Production State
2006 2007 2008 2006 2007 2008
Bushels Bushels Bushels 1,000 Bushels 1,000 Bushels 1,000 Bushels
AL AZ AR CA CO DE FL GA ID IL IN IA KS KY LA MD MI MN MS MO MT NE NV NJ NM NY NC ND OH OK OR PA SC SD TN TX UT VA WA WV WI WY US
57.0 99.7 61.0 66.5 21.6 67.0 42.0 49.0 75.6 67.0 68.0 66.0 32.0 71.0 53.0 67.0 73.0 47.4 59.0 54.0 29.4 36.0
105.6 60.0 34.0 61.0 59.0 30.3 68.0 24.0 51.7 59.0 50.0 32.6 64.0 24.0 45.0 68.0 62.1 61.0 76.2 27.5
38.6
42.0 101.4
41.0 85.4 39.2 68.0 55.0 40.0 71.2 55.0 56.0 48.0 33.0 48.0 54.0 66.0 65.0 47.9 56.0 43.0 29.6 43.0 99.2 51.0 28.0 53.0 40.0 35.6 61.0 28.0 52.3 58.0 30.0 43.1 41.0 37.0 42.8 64.0 58.7 57.0 67.1 25.4
40.2
71.0 97.8 57.0 90.6 30.8 77.0 55.0 56.0 73.8 64.0 69.0 48.0 40.0 71.0 57.0 73.0 69.0 55.9 62.0 48.0 30.1 44.0
100.1 61.0 30.0 63.0 60.0 36.0 68.0 37.0 55.7 64.0 54.0 50.5 63.0 30.0 41.4 71.0 52.8 60.0 64.5 29.4
44.9
2,565 7,580
18,605 20,935 41,515
3,015 210
5,880 90,315 60,970 31,280
1,188 291,200 22,720
5,565 8,375
47,450 80,340
4,307 49,140
153,075 61,200
1,056 1,320 4,080 5,795
24,780 251,590 65,280 81,600 43,190
8,850 6,150
84,090 12,160 33,600
6,120 10,540
138,250 366
18,290 3,879
1,808,416
3,192 8,724
28,700 29,465 92,980
3,740 495
9,200 83,645 48,950 20,720
1,344 283,800 12,000 11,880 10,560 34,450 81,900 18,480 37,840
149,820 84,280
1,290 1,428 8,400 4,505
20,000 298,875 44,530 98,000 43,680
8,990 4,050
143,515 10,660
140,600 5,656
13,120 125,342
342 18,640
3,300
2,051,088
14,200 15,742 55,860 50,275 59,700
6,083 1,265
22,400 98,170 73,600 38,640
1,680 356,000 32,660 21,945 13,140 48,990
104,440 30,070 55,680
164,730 73,480
1,101 2,013 4,200 7,686
43,200 311,200 74,120
166,500 52,600 11,840 11,070
172,540 32,760 99,000
5,756 19,880
117,530 480
23,012 4,286
2,499,524
Crop Production 2008 Summary Agricultural Statistics Board January 2009 14 NASS, USDA
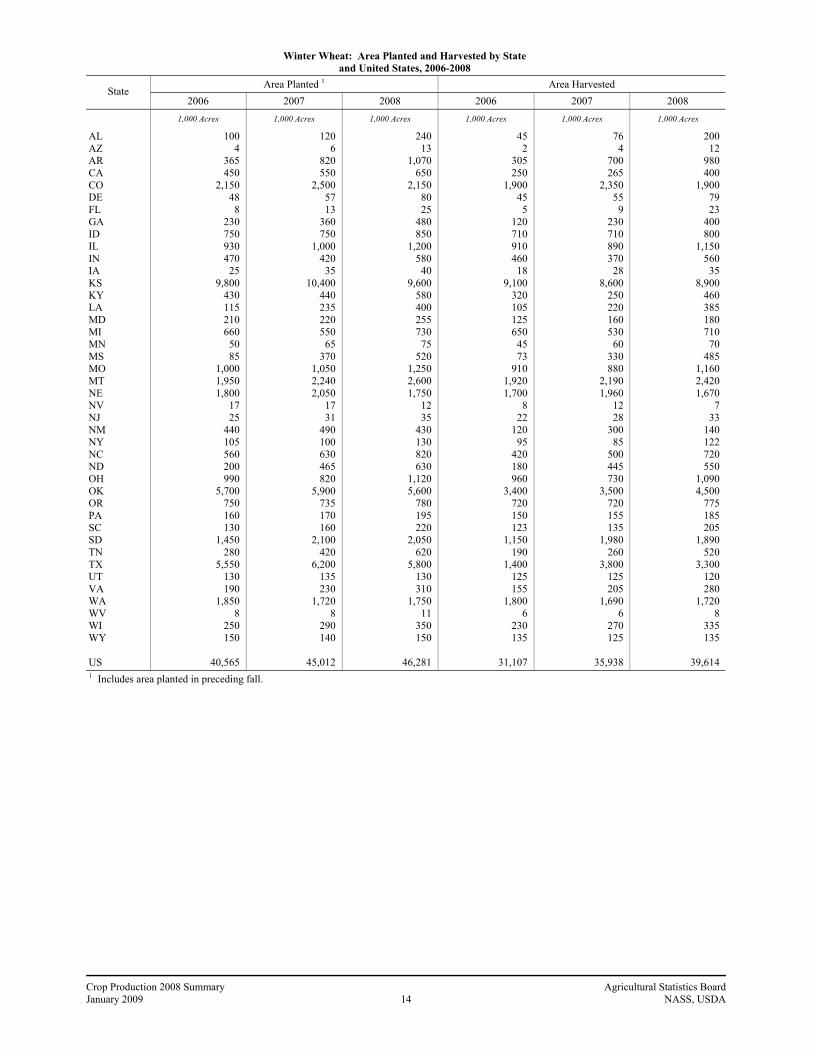
Winter Wheat: Area Planted and Harvested by State and United States, 2006-2008
Area Planted 1 Area Harvested State
2006 2007 2008 2006 2007 2008
1,000 Acres 1,000 Acres 1,000 Acres 1,000 Acres 1,000 Acres 1,000 Acres
AL AZ AR CA CO DE FL GA ID IL IN IA KS KY LA MD MI MN MS MO MT NE NV NJ NM NY NC ND OH OK OR PA SC SD TN TX UT VA WA WV WI WY US
100 4
365 450
2,150 48
8 230 750 930 470
25 9,800
430 115 210 660
50 85
1,000 1,950 1,800
17 25
440 105 560 200 990
5,700 750 160 130
1,450 280
5,550 130 190
1,850 8
250 150
40,565
120 6
820 550
2,500 57 13
360 750
1,000 420
35 10,400
440 235 220 550
65 370
1,050 2,240 2,050
17 31
490 100 630 465 820
5,900 735 170 160
2,100 420
6,200 135 230
1,720 8
290 140
45,012
240 13
1,070 650
2,150 80 25
480 850
1,200 580
40 9,600
580 400 255 730
75 520
1,250 2,600 1,750
12 35
430 130 820 630
1,120 5,600
780 195 220
2,050 620
5,800 130 310
1,750 11
350 150
46,281
45 2
305 250
1,900 45
5 120 710 910 460
18 9,100
320 105 125 650
45 73
910 1,920 1,700
8 22
120 95
420 180 960
3,400 720 150 123
1,150 190
1,400 125 155
1,800 6
230 135
31,107
76 4
700 265
2,350 55
9 230 710 890 370
28 8,600
250 220 160 530
60 330 880
2,190 1,960
12 28
300 85
500 445 730
3,500 720 155 135
1,980 260
3,800 125 205
1,690 6
270 125
35,938
200 12
980 400
1,900 79 23
400 800
1,150 560
35 8,900
460 385 180 710
70 485
1,160 2,420 1,670
7 33
140 122 720 550
1,090 4,500
775 185 205
1,890 520
3,300 120 280
1,720 8
335 135
39,614
1 Includes area planted in preceding fall.

Crop Production 2008 Summary Agricultural Statistics Board January 2009 15 NASS, USDA
Winter Wheat: Yield and Production by State and United States, 2006-2008
Yield Production State
2006 2007 2008 2006 2007 2008
Bushels Bushels Bushels 1,000 Bushels 1,000 Bushels 1,000 Bushels
AL AZ AR CA CO DE FL GA ID IL IN IA KS KY LA MD MI MN MS MO MT NE NV NJ NM NY NC ND OH OK OR PA SC SD TN TX UT VA WA WV WI WY US
57.0 90.0 61.0 58.0 21.0 67.0 42.0 49.0 77.0 67.0 68.0 66.0 32.0 71.0 53.0 67.0 73.0 62.0 59.0 54.0 43.0 36.0
110.0 60.0 34.0 61.0 59.0 43.0 68.0 24.0 52.0 59.0 50.0 36.0 64.0 24.0 45.0 68.0 65.0 61.0 78.0 27.0
41.6
42.0 90.0 41.0 81.0 39.0 68.0 55.0 40.0 73.0 55.0 56.0 48.0 33.0 48.0 54.0 66.0 65.0 45.0 56.0 43.0 38.0 43.0
100.0 51.0 28.0 53.0 40.0 49.0 61.0 28.0 53.0 58.0 30.0 46.0 41.0 37.0 42.0 64.0 62.0 57.0 68.0 25.0
41.7
71.0 95.0 57.0 85.0 30.0 77.0 55.0 56.0 75.0 64.0 69.0 48.0 40.0 71.0 57.0 73.0 69.0 52.0 62.0 48.0 39.0 44.0
103.0 61.0 30.0 63.0 60.0 41.0 68.0 37.0 58.0 64.0 54.0 55.0 63.0 30.0 41.0 71.0 56.0 60.0 66.0 28.0
47.2
2,565 180
18,605 14,500 39,900
3,015 210
5,880 54,670 60,970 31,280
1,188 291,200 22,720
5,565 8,375
47,450 2,790 4,307
49,140 82,560 61,200
880 1,320 4,080 5,795
24,780 7,740
65,280 81,600 37,440
8,850 6,150
41,400 12,160 33,600
5,625 10,540
117,000 366
17,940 3,645
1,294,461
3,192 360
28,700 21,465 91,650
3,740 495
9,200 51,830 48,950 20,720
1,344 283,800 12,000 11,880 10,560 34,450
2,700 18,480 37,840 83,220 84,280
1,200 1,428 8,400 4,505
20,000 21,805 44,530 98,000 38,160
8,990 4,050
91,080 10,660
140,600 5,250
13,120 104,780
342 18,360
3,125
1,499,241
14,200 1,140
55,860 34,000 57,000
6,083 1,265
22,400 60,000 73,600 38,640
1,680 356,000 32,660 21,945 13,140 48,990
3,640 30,070 55,680 94,380 73,480
721 2,013 4,200 7,686
43,200 22,550 74,120
166,500 44,950 11,840 11,070
103,950 32,760 99,000
4,920 19,880 96,320
480 22,110
3,780
1,867,903

Crop Production 2008 Summary Agricultural Statistics Board January 2009 16 NASS, USDA
Durum Wheat: Area Planted, Harvested, Yield, and Production by State and United States, 2006-2008
Area Planted Area Harvested State
2006 2007 2008 2006 2007 2008
1,000 Acres 1,000 Acres 1,000 Acres 1,000 Acres 1,000 Acres 1,000 Acres
AZ CA ID MT ND SD US
75 70 15
400 1,300
10
1,870
83 90 15
480 1,480
8
2,156
150 170
10 590
1,800 11
2,731
74 65 15
395 1,260
6
1,815
82 80 15
475 1,460
7
2,119
149 155
10 570
1,690 10
2,584
Yield Production
2006 2007 2008 2006 2007 2008 Bushels Bushels Bushels 1,000 Bushels 1,000 Bushels 1,000 Bushels
AZ CA ID MT ND SD US
100.0 99.0 89.0 17.0 25.0 15.0
29.5
102.0 100.0
81.0 24.0 29.5 25.0
34.1
98.0 105.0
73.0 19.0 25.0 19.0
32.8
7,400 6,435 1,335 6,715
31,500 90
53,475
8,364 8,000 1,215
11,400 43,070
175
72,224
14,602 16,275
730 10,830 42,250
190
84,877
Wheat: Production by Class, United States, 2006-2008 1 Winter
Year Hard Red
Soft Red
Hard White
Soft White
All White
1,000 Bushels 1,000 Bushels 1,000 Bushels 1,000 Bushels 1,000 Bushels
2006 2007 2008
681,921 955,555
1,035,235
389,535 352,026 613,578
13,284 21,454 22,730
209,721 170,206 196,360
223,005 191,660 219,090
Spring Hard
Red Hard White
Soft White
All White Durum
Total
1,000 Bushels 1,000 Bushels 1,000 Bushels 1,000 Bushels 1,000 Bushels 1,000 Bushels
2006 2007 2008
432,339 450,070 511,508
6,226 5,585 6,315
21,915 23,968 28,921
28,141 29,553 35,236
53,475 72,224 84,877
1,808,416 2,051,088 2,499,524
1 Wheat class estimates are based on the latest available data including both survey and administrative data.
Crop Production 2008 Summary Agricultural Statistics Board January 2009 17 NASS, USDA
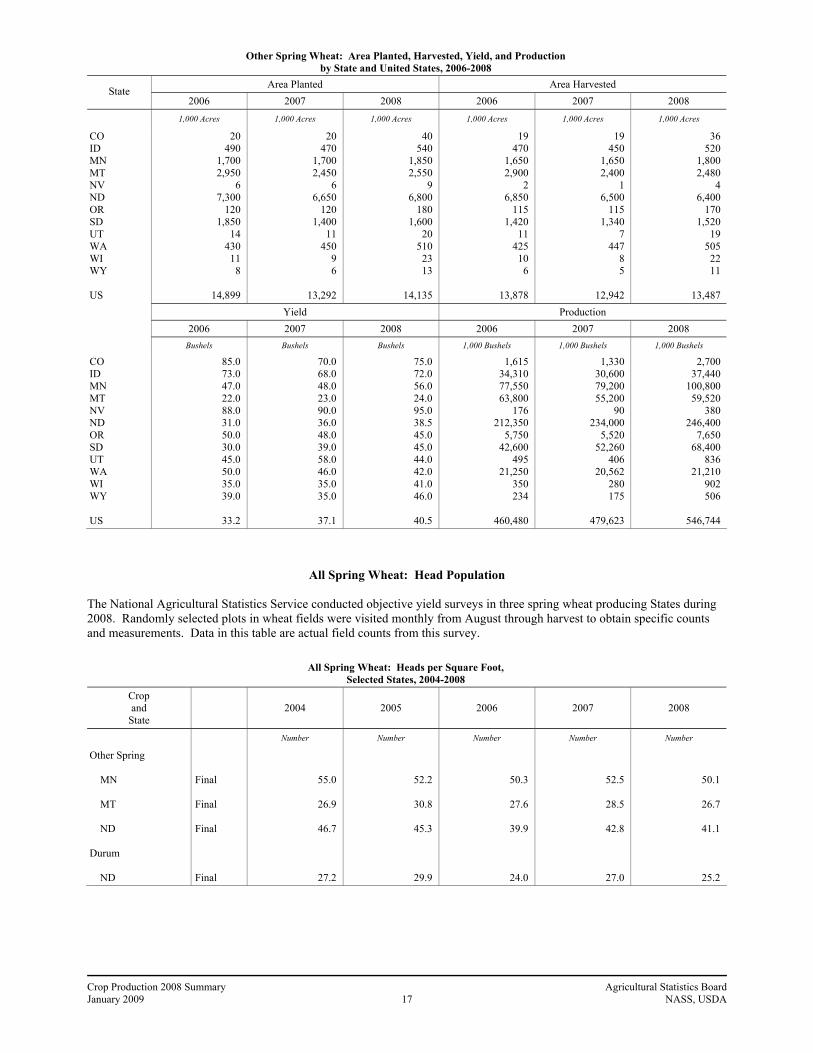
Other Spring Wheat: Area Planted, Harvested, Yield, and Production by State and United States, 2006-2008
Area Planted Area Harvested State
2006 2007 2008 2006 2007 2008
1,000 Acres 1,000 Acres 1,000 Acres 1,000 Acres 1,000 Acres 1,000 Acres
CO ID MN MT NV ND OR SD UT WA WI WY US
20 490
1,700 2,950
6 7,300
120 1,850
14 430
11 8
14,899
20 470
1,700 2,450
6 6,650
120 1,400
11 450
9 6
13,292
40 540
1,850 2,550
9 6,800
180 1,600
20 510
23 13
14,135
19 470
1,650 2,900
2 6,850
115 1,420
11 425
10 6
13,878
19 450
1,650 2,400
1 6,500
115 1,340
7 447
8 5
12,942
36 520
1,800 2,480
4 6,400
170 1,520
19 505
22 11
13,487
Yield Production
2006 2007 2008 2006 2007 2008 Bushels Bushels Bushels 1,000 Bushels 1,000 Bushels 1,000 Bushels
CO ID MN MT NV ND OR SD UT WA WI WY US
85.0 73.0 47.0 22.0 88.0 31.0 50.0 30.0 45.0 50.0 35.0 39.0
33.2
70.0 68.0 48.0 23.0 90.0 36.0 48.0 39.0 58.0 46.0 35.0 35.0
37.1
75.0 72.0 56.0 24.0 95.0 38.5 45.0 45.0 44.0 42.0 41.0 46.0
40.5
1,615 34,310 77,550 63,800
176 212,350
5,750 42,600
495 21,250
350 234
460,480
1,330 30,600 79,200 55,200
90 234,000
5,520 52,260
406 20,562
280 175
479,623
2,700 37,440
100,800 59,520
380 246,400
7,650 68,400
836 21,210
902 506
546,744
All Spring Wheat: Head Population The National Agricultural Statistics Service conducted objective yield surveys in three spring wheat producing States during 2008. Randomly selected plots in wheat fields were visited monthly from August through harvest to obtain specific counts and measurements. Data in this table are actual field counts from this survey.
All Spring Wheat: Heads per Square Foot, Selected States, 2004-2008
Crop and
State 2004 2005 2006 2007 2008
Number Number Number Number Number
Other Spring MN MT ND Durum ND
Final Final Final Final
55.0
26.9
46.7
27.2
52.2
30.8
45.3
29.9
50.3
27.6
39.9
24.0
52.5
28.5
42.8
27.0
50.1
26.7
41.1
25.2

Crop Production 2008 Summary Agricultural Statistics Board January 2009 18 NASS, USDA
Rice: Area Planted and Harvested by Class, State, and United States, 2006-2008
Area Planted Area Harvested 2006 2007 2008 2006 2007 2008
Class and
State Long Grain
1,000 Acres 1,000 Acres 1,000 Acres 1,000 Acres 1,000 Acres 1,000 Acres
AR CA LA MS MO TX US
1,300.0 6.0
340.0 190.0 215.0 149.0
2,200.0
1,185.0 9.0
357.0 190.0 179.0 143.0
2,063.0
1,300.0 9.0
455.0 230.0 198.0 173.0
2,365.0
1,295.0 5.0
335.0 189.0 213.0 149.0
2,186.0
1,180.0 9.0
355.0 189.0 177.0 142.0
2,052.0
1,295.0 9.0
450.0 229.0 197.0 170.0
2,350.0
Medium Grain AR CA LA MO TX US
105.0 460.0
10.0 1.0 1.0
577.0
145.0 460.0
23.0 1.0 3.0
632.0
100.0 460.0
15.0 2.0 2.0
579.0
104.0 458.0
10.0 1.0 1.0
574.0
144.0 459.0
23.0 1.0 3.0
630.0
99.0 458.0
14.0 2.0 2.0
575.0
Short Grain 1 AR CA US
1.0 60.0
61.0
1.0 65.0
66.0
1.0 50.0
51.0
1.0 60.0
61.0
1.0 65.0
66.0
1.0 50.0
51.0
All AR CA LA MS MO TX US
1,406.0 526.0 350.0 190.0 216.0 150.0
2,838.0
1,331.0 534.0 380.0 190.0 180.0 146.0
2,761.0
1,401.0 519.0 470.0 230.0 200.0 175.0
2,995.0
1,400.0 523.0 345.0 189.0 214.0 150.0
2,821.0
1,325.0 533.0 378.0 189.0 178.0 145.0
2,748.0
1,395.0 517.0 464.0 229.0 199.0 172.0
2,976.0
1 Sweet rice acreage included with short grain.

Crop Production 2008 Summary Agricultural Statistics Board January 2009 19 NASS, USDA
Rice: Yield and Production by Class, State, and United States, 2006-2008
Yield Production 2006 2007 2008 2006 2007 2008
Class and
State Long Grain
Pounds Pounds Pounds 1,000 Cwt 1,000 Cwt 1,000 Cwt
AR CA LA MS MO TX US
6,910 5,800 5,880 7,000 6,400 7,200
6,727
7,230 7,100 6,150 7,350 6,900 6,580
6,980
6,640 6,900 5,820 6,850 6,620 6,900
6,522
89,485 290
19,698 13,230 13,632 10,728
147,063
85,314 639
21,833 13,892 12,213
9,344
143,235
85,988 621
26,190 15,687 13,041 11,730
153,257
Medium Grain AR CA LA MO TX US
6,750 7,880 5,960 6,400 3,200
7,631
7,250 8,500 6,040 6,600 5,100
8,105
6,960 8,550 6,050 6,600 6,900
8,203
7,020 36,090
596 64 32
43,802
10,440 39,015
1,389 66
153
51,063
6,890 39,159
847 132 138
47,166
Short Grain 1 AR CA US
6,000 6,100
6,098
6,000 6,200
6,197
6,000 6,500
6,490
60 3,660
3,720
60 4,030
4,090
60 3,250
3,310
All AR CA LA MS MO TX US
6,900 7,660 5,880 7,000 6,400 7,170
6,898
7,230 8,200 6,140 7,350 6,900 6,550
7,219
6,660 8,320 5,830 6,850 6,620 6,900
6,846
96,565 40,040 20,294 13,230 13,696 10,760
194,585
95,814 43,684 23,222 13,892 12,279
9,497
198,388
92,938 43,030 27,037 15,687 13,173 11,868
203,733
1 Sweet rice yield and production included with short grain.
Crop Production 2008 Summary Agricultural Statistics Board January 2009 20 NASS, USDA
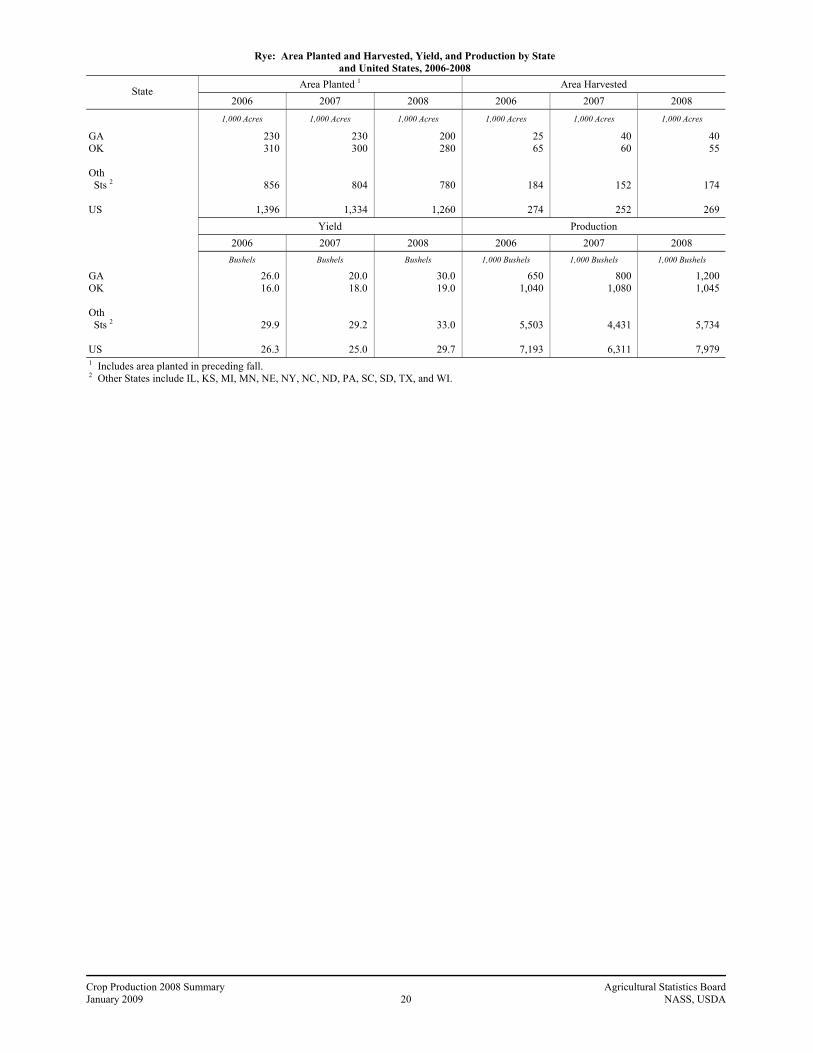
Rye: Area Planted and Harvested, Yield, and Production by State and United States, 2006-2008
Area Planted 1 Area Harvested State
2006 2007 2008 2006 2007 2008
1,000 Acres 1,000 Acres 1,000 Acres 1,000 Acres 1,000 Acres 1,000 Acres
GA OK Oth Sts 2 US
230 310
856
1,396
230 300
804
1,334
200 280
780
1,260
25 65
184
274
40 60
152
252
40 55
174
269 Yield Production
2006 2007 2008 2006 2007 2008
Bushels Bushels Bushels 1,000 Bushels 1,000 Bushels 1,000 Bushels
GA OK Oth Sts 2 US
26.0 16.0
29.9
26.3
20.0 18.0
29.2
25.0
30.0 19.0
33.0
29.7
650 1,040
5,503
7,193
800 1,080
4,431
6,311
1,200 1,045
5,734
7,979 1 Includes area planted in preceding fall. 2 Other States include IL, KS, MI, MN, NE, NY, NC, ND, PA, SC, SD, TX, and WI.
Crop Production 2008 Summary Agricultural Statistics Board January 2009 21 NASS, USDA
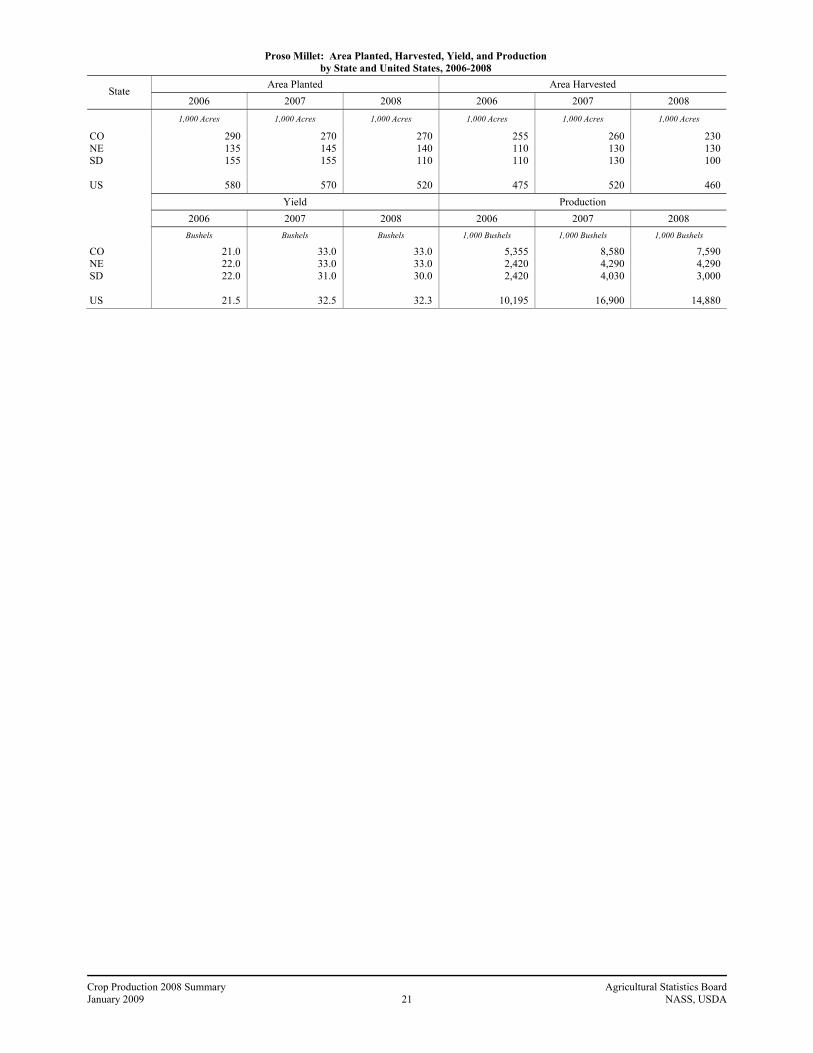
Proso Millet: Area Planted, Harvested, Yield, and Production by State and United States, 2006-2008
Area Planted Area Harvested State
2006 2007 2008 2006 2007 2008
1,000 Acres 1,000 Acres 1,000 Acres 1,000 Acres 1,000 Acres 1,000 Acres
CO NE SD US
290 135 155
580
270 145 155
570
270 140 110
520
255 110 110
475
260 130 130
520
230 130 100
460
Yield Production
2006 2007 2008 2006 2007 2008 Bushels Bushels Bushels 1,000 Bushels 1,000 Bushels 1,000 Bushels
CO NE SD US
21.0 22.0 22.0
21.5
33.0 33.0 31.0
32.5
33.0 33.0 30.0
32.3
5,355 2,420 2,420
10,195
8,580 4,290 4,030
16,900
7,590 4,290 3,000
14,880

Crop Production 2008 Summary Agricultural Statistics Board January 2009 22 NASS, USDA
All Hay: Area Harvested and Yield by State and United States, 2006-2008 Area Harvested Yield
State 2006 2007 2008 2006 2007 2008
1,000 Acres 1,000 Acres 1,000 Acres Tons Tons Tons
AL AZ AR CA CO CT DE FL GA ID IL IN IA KS KY LA ME MD MA MI MN MS MO MT NE NV NH NJ NM NY NC ND OH OK OR PA RI SC SD TN TX UT VT VA WA WV WI WY US
720 295
1,465 1,680 1,530
62 14
300 650
1,470 730 630
1,470 3,050 2,480
390 140 205
78 1,120 2,070
780 4,140 2,260 2,750
470 56
115 320
1,520 690
2,720 1,210 3,160 1,050 1,750
7 360
3,100 1,830 5,150
710 205
1,230 770 590
2,090 1,050
60,632
840 295
1,465 1,570 1,570
61 15
320 670
1,450 680 610
1,380 2,900 2,680
420 144 215
79 1,050 1,800
800 4,050 2,600 2,650
460 55
115 350
1,360 699
2,680 1,160 3,140 1,010 1,800
8 330
3,750 1,775 5,340
700 190
1,290 790 600
1,970 1,120
61,006
900 295
1,405 1,520 1,570
55 18
300 720
1,410 620 590
1,550 2,750 2,640
430 138 205
73 1,020 1,950
720 4,200 2,400 2,570
455 53
115 340
1,320 808
3,220 1,140 2,910 1,025 1,750
7 330
3,850 1,870 4,430
695 180
1,270 710 605
1,900 1,030
60,062
2.00 7.63 1.72 5.70 2.87 1.94 2.86 2.30 1.80 3.74 3.27 3.36 3.53 2.15 2.55 2.50 1.81 2.78 2.03 2.87 2.74 2.00 1.68 1.91 2.03 3.44 2.05 2.03 4.07 1.84 2.41 1.15 2.83 1.13 3.10 2.93 2.43 1.90 1.35 2.32 1.68 3.58 1.59 2.31 4.04 1.77 2.52 2.01
2.32
1.80 7.43 2.11 5.76 2.84 1.95 2.07 3.00 1.90 3.69 2.82 2.32 3.58 2.25 1.53 2.70 1.85 2.19 1.87 2.31 2.36 2.30 1.86 1.96 2.33 3.36 1.95 1.79 4.32 1.99 1.50 1.89 2.42 2.18 2.91 2.33 1.88 1.70 1.94 1.51 2.76 3.69 2.12 1.86 4.23 1.54 2.23 2.10
2.41
2.20 8.08 2.21 5.80 2.54 2.18 2.56 3.00 2.20 3.96 3.03 3.16 3.44 2.46 1.95 2.50 1.57 3.05 2.11 2.58 2.70 2.70 2.10 1.70 2.42 3.58 1.98 2.08 4.46 2.04 2.01 1.28 2.46 1.90 2.88 2.18 2.00 1.90 2.04 2.11 2.08 3.78 1.70 2.16 3.68 1.85 2.53 2.17
2.43

Crop Production 2008 Summary Agricultural Statistics Board January 2009 23 NASS, USDA
All Hay: Production by State and United States, 2006-2008 Production
State 2006 2007 2008
1,000 Tons 1,000 Tons 1,000 Tons
AL AZ AR CA CO CT DE FL GA ID IL IN IA KS KY LA ME MD MA MI MN MS MO MT NE NV NH NJ NM NY NC ND OH OK OR PA RI SC SD TN TX UT VT VA WA WV WI WY US
1,440 2,251 2,519 9,568 4,389
120 40
690 1,170 5,505 2,385 2,119 5,189 6,550 6,316
975 253 569 158
3,212 5,679 1,560 6,944 4,320 5,588 1,619
115 234
1,302 2,790 1,663 3,137 3,421 3,556 3,256 5,125
17 684
4,180 4,251 8,675 2,540
325 2,846 3,113 1,046 5,264 2,115
140,783
1,512 2,192 3,084 9,042 4,459
119 31
960 1,273 5,345 1,916 1,416 4,944 6,530 4,104 1,134
266 470 148
2,429 4,240 1,840 7,528 5,090 6,185 1,544
107 206
1,512 2,700 1,050 5,063 2,804 6,858 2,941 4,200
15 561
7,275 2,685
14,740 2,585
402 2,394 3,338
924 4,392 2,348
146,901
1,980 2,383 3,111 8,816 3,981
120 46
900 1,584 5,588 1,878 1,867 5,330 6,765 5,160 1,075
217 626 154
2,633 5,265 1,944 8,820 4,080 6,232 1,629
105 239
1,516 2,691 1,622 4,118 2,802 5,536 2,951 3,810
14 627
7,840 3,945 9,211 2,629
306 2,748 2,614 1,117 4,810 2,237
145,672
Crop Production 2008 Summary Agricultural Statistics Board January 2009 24 NASS, USDA
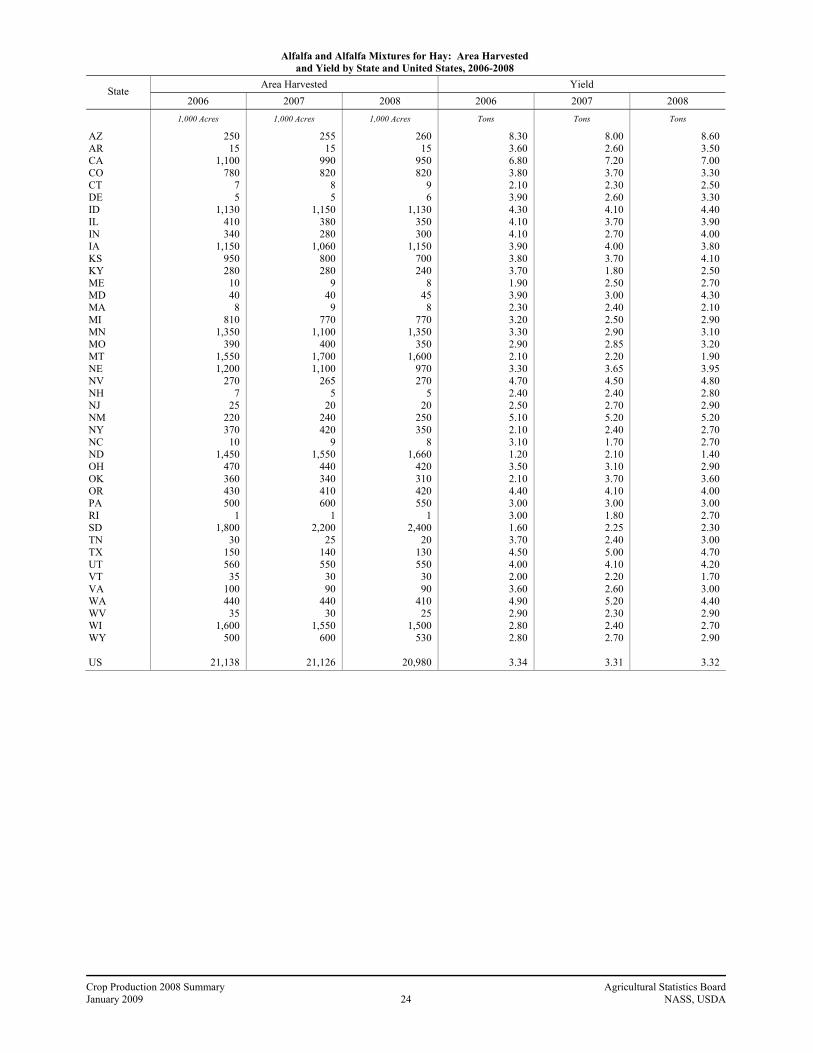
Alfalfa and Alfalfa Mixtures for Hay: Area Harvested and Yield by State and United States, 2006-2008
Area Harvested Yield State
2006 2007 2008 2006 2007 2008
1,000 Acres 1,000 Acres 1,000 Acres Tons Tons Tons
AZ AR CA CO CT DE ID IL IN IA KS KY ME MD MA MI MN MO MT NE NV NH NJ NM NY NC ND OH OK OR PA RI SD TN TX UT VT VA WA WV WI WY US
250 15
1,100 780
7 5
1,130 410 340
1,150 950 280
10 40
8 810
1,350 390
1,550 1,200
270 7
25 220 370
10 1,450
470 360 430 500
1 1,800
30 150 560
35 100 440
35 1,600
500
21,138
255 15
990 820
8 5
1,150 380 280
1,060 800 280
9 40
9 770
1,100 400
1,700 1,100
265 5
20 240 420
9 1,550
440 340 410 600
1 2,200
25 140 550
30 90
440 30
1,550 600
21,126
260 15
950 820
9 6
1,130 350 300
1,150 700 240
8 45
8 770
1,350 350
1,600 970 270
5 20
250 350
8 1,660
420 310 420 550
1 2,400
20 130 550
30 90
410 25
1,500 530
20,980
8.30 3.60 6.80 3.80 2.10 3.90 4.30 4.10 4.10 3.90 3.80 3.70 1.90 3.90 2.30 3.20 3.30 2.90 2.10 3.30 4.70 2.40 2.50 5.10 2.10 3.10 1.20 3.50 2.10 4.40 3.00 3.00 1.60 3.70 4.50 4.00 2.00 3.60 4.90 2.90 2.80 2.80
3.34
8.00 2.60 7.20 3.70 2.30 2.60 4.10 3.70 2.70 4.00 3.70 1.80 2.50 3.00 2.40 2.50 2.90 2.85 2.20 3.65 4.50 2.40 2.70 5.20 2.40 1.70 2.10 3.10 3.70 4.10 3.00 1.80 2.25 2.40 5.00 4.10 2.20 2.60 5.20 2.30 2.40 2.70
3.31
8.60 3.50 7.00 3.30 2.50 3.30 4.40 3.90 4.00 3.80 4.10 2.50 2.70 4.30 2.10 2.90 3.10 3.20 1.90 3.95 4.80 2.80 2.90 5.20 2.70 2.70 1.40 2.90 3.60 4.00 3.00 2.70 2.30 3.00 4.70 4.20 1.70 3.00 4.40 2.90 2.70 2.90
3.32

Crop Production 2008 Summary Agricultural Statistics Board January 2009 25 NASS, USDA
Alfalfa and Alfalfa Mixtures for Hay: Production by State and United States, 2006-2008
Production State
2006 2007 2008
1,000 Tons 1,000 Tons 1,000 Tons
AZ AR CA CO CT DE ID IL IN IA KS KY ME MD MA MI MN MO MT NE NV NH NJ NM NY NC ND OH OK OR PA RI SD TN TX UT VT VA WA WV WI WY US
2,075 54
7,480 2,964
15 20
4,859 1,681 1,394 4,485 3,610 1,036
19 156
18 2,592 4,455 1,131 3,255 3,960 1,269
17 63
1,122 777
31 1,740 1,645
756 1,892 1,500
3 2,880
111 675
2,240 70
360 2,156
102 4,480 1,400
70,548
2,040 39
7,128 3,034
18 13
4,715 1,406
756 4,240 2,960
504 23
120 22
1,925 3,190 1,140 3,740 4,015 1,193
12 54
1,248 1,008
15 3,255 1,364 1,258 1,681 1,800
2 4,950
60 700
2,255 66
234 2,288
69 3,720 1,620
69,880
2,236 53
6,650 2,706
23 20
4,972 1,365 1,200 4,370 2,870
600 22
194 17
2,233 4,185 1,120 3,040 3,832 1,296
14 58
1,300 945
22 2,324 1,218 1,116 1,680 1,650
3 5,520
60 611
2,310 51
270 1,804
73 4,050 1,537
69,620
Crop Production 2008 Summary Agricultural Statistics Board January 2009 26 NASS, USDA
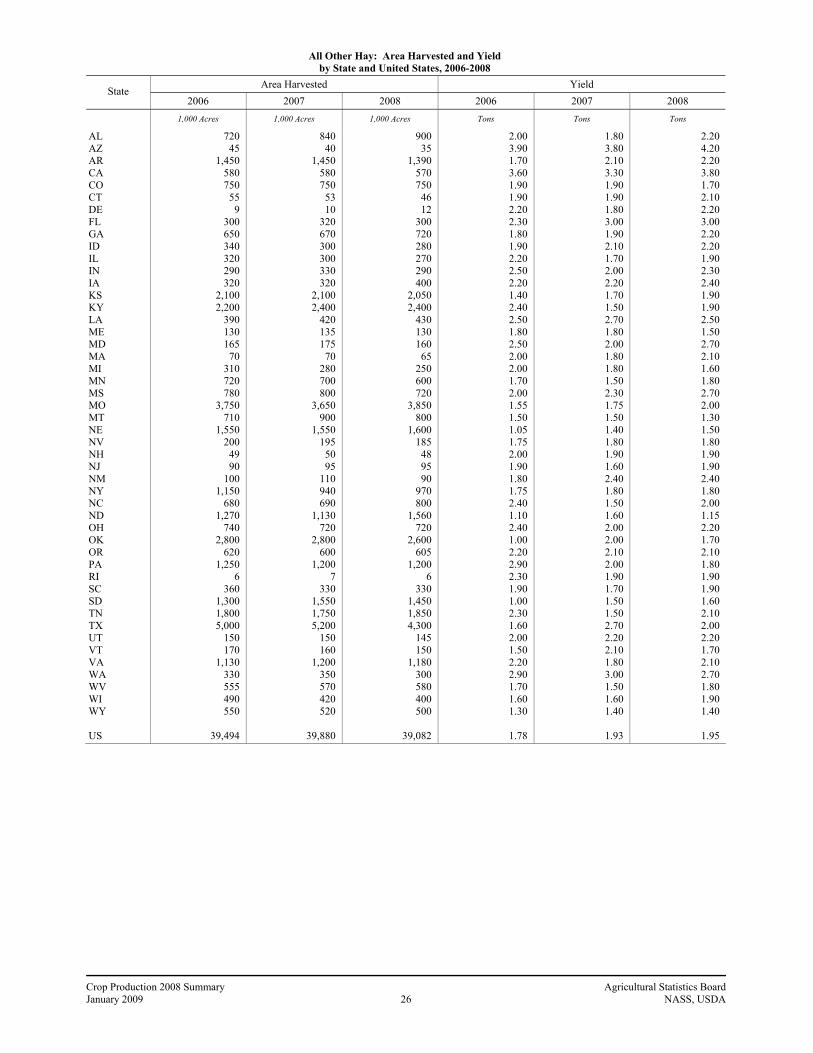
All Other Hay: Area Harvested and Yield by State and United States, 2006-2008
Area Harvested Yield State
2006 2007 2008 2006 2007 2008
1,000 Acres 1,000 Acres 1,000 Acres Tons Tons Tons
AL AZ AR CA CO CT DE FL GA ID IL IN IA KS KY LA ME MD MA MI MN MS MO MT NE NV NH NJ NM NY NC ND OH OK OR PA RI SC SD TN TX UT VT VA WA WV WI WY US
720 45
1,450 580 750
55 9
300 650 340 320 290 320
2,100 2,200
390 130 165
70 310 720 780
3,750 710
1,550 200
49 90
100 1,150
680 1,270
740 2,800
620 1,250
6 360
1,300 1,800 5,000
150 170
1,130 330 555 490 550
39,494
840 40
1,450 580 750
53 10
320 670 300 300 330 320
2,100 2,400
420 135 175
70 280 700 800
3,650 900
1,550 195
50 95
110 940 690
1,130 720
2,800 600
1,200 7
330 1,550 1,750 5,200
150 160
1,200 350 570 420 520
39,880
900 35
1,390 570 750
46 12
300 720 280 270 290 400
2,050 2,400
430 130 160
65 250 600 720
3,850 800
1,600 185
48 95 90
970 800
1,560 720
2,600 605
1,200 6
330 1,450 1,850 4,300
145 150
1,180 300 580 400 500
39,082
2.00 3.90 1.70 3.60 1.90 1.90 2.20 2.30 1.80 1.90 2.20 2.50 2.20 1.40 2.40 2.50 1.80 2.50 2.00 2.00 1.70 2.00 1.55 1.50 1.05 1.75 2.00 1.90 1.80 1.75 2.40 1.10 2.40 1.00 2.20 2.90 2.30 1.90 1.00 2.30 1.60 2.00 1.50 2.20 2.90 1.70 1.60 1.30
1.78
1.80 3.80 2.10 3.30 1.90 1.90 1.80 3.00 1.90 2.10 1.70 2.00 2.20 1.70 1.50 2.70 1.80 2.00 1.80 1.80 1.50 2.30 1.75 1.50 1.40 1.80 1.90 1.60 2.40 1.80 1.50 1.60 2.00 2.00 2.10 2.00 1.90 1.70 1.50 1.50 2.70 2.20 2.10 1.80 3.00 1.50 1.60 1.40
1.93
2.20 4.20 2.20 3.80 1.70 2.10 2.20 3.00 2.20 2.20 1.90 2.30 2.40 1.90 1.90 2.50 1.50 2.70 2.10 1.60 1.80 2.70 2.00 1.30 1.50 1.80 1.90 1.90 2.40 1.80 2.00 1.15 2.20 1.70 2.10 1.80 1.90 1.90 1.60 2.10 2.00 2.20 1.70 2.10 2.70 1.80 1.90 1.40
1.95

Crop Production 2008 Summary Agricultural Statistics Board January 2009 27 NASS, USDA
All Other Hay: Production by State and United States, 2006-2008
Production State
2006 2007 2008
1,000 Tons 1,000 Tons 1,000 Tons
AL AZ AR CA CO CT DE FL GA ID IL IN IA KS KY LA ME MD MA MI MN MS MO MT NE NV NH NJ NM NY NC ND OH OK OR PA RI SC SD TN TX UT VT VA WA WV WI WY US
1,440 176
2,465 2,088 1,425
105 20
690 1,170
646 704 725 704
2,940 5,280
975 234 413 140 620
1,224 1,560 5,813 1,065 1,628
350 98
171 180
2,013 1,632 1,397 1,776 2,800 1,364 3,625
14 684
1,300 4,140 8,000
300 255
2,486 957 944 784 715
70,235
1,512 152
3,045 1,914 1,425
101 18
960 1,273
630 510 660 704
3,570 3,600 1,134
243 350 126 504
1,050 1,840 6,388 1,350 2,170
351 95
152 264
1,692 1,035 1,808 1,440 5,600 1,260 2,400
13 561
2,325 2,625
14,040 330 336
2,160 1,050
855 672 728
77,021
1,980 147
3,058 2,166 1,275
97 26
900 1,584
616 513 667 960
3,895 4,560 1,075
195 432 137 400
1,080 1,944 7,700 1,040 2,400
333 91
181 216
1,746 1,600 1,794 1,584 4,420 1,271 2,160
11 627
2,320 3,885 8,600
319 255
2,478 810
1,044 760 700
76,052
Crop Production 2008 Summary Agricultural Statistics Board January 2009 28 NASS, USDA
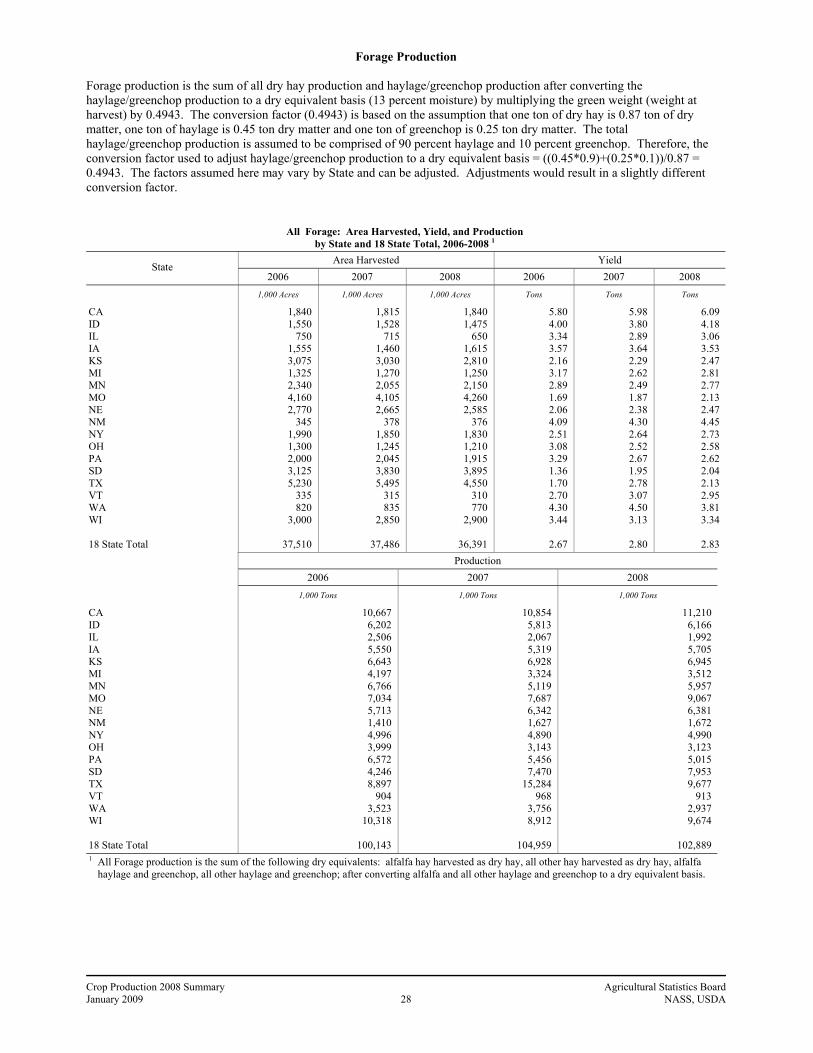
Forage Production Forage production is the sum of all dry hay production and haylage/greenchop production after converting the haylage/greenchop production to a dry equivalent basis (13 percent moisture) by multiplying the green weight (weight at harvest) by 0.4943. The conversion factor (0.4943) is based on the assumption that one ton of dry hay is 0.87 ton of dry matter, one ton of haylage is 0.45 ton dry matter and one ton of greenchop is 0.25 ton dry matter. The total haylage/greenchop production is assumed to be comprised of 90 percent haylage and 10 percent greenchop. Therefore, the conversion factor used to adjust haylage/greenchop production to a dry equivalent basis = ((0.45*0.9)+(0.25*0.1))/0.87 = 0.4943. The factors assumed here may vary by State and can be adjusted. Adjustments would result in a slightly different conversion factor.
All Forage: Area Harvested, Yield, and Production by State and 18 State Total, 2006-2008 1
Area Harvested Yield State
2006 2007 2008 2006 2007 2008
1,000 Acres 1,000 Acres 1,000 Acres Tons Tons Tons
CA ID IL IA KS MI MN MO NE NM NY OH PA SD TX VT WA WI 18 State Total
1,840 1,550
750 1,555 3,075 1,325 2,340 4,160 2,770
345 1,990 1,300 2,000 3,125 5,230
335 820
3,000
37,510
1,815 1,528
715 1,460 3,030 1,270 2,055 4,105 2,665
378 1,850 1,245 2,045 3,830 5,495
315 835
2,850
37,486
1,840 1,475
650 1,615 2,810 1,250 2,150 4,260 2,585
376 1,830 1,210 1,915 3,895 4,550
310 770
2,900
36,391
5.80 4.00 3.34 3.57 2.16 3.17 2.89 1.69 2.06 4.09 2.51 3.08 3.29 1.36 1.70 2.70 4.30 3.44
2.67
5.98 3.80 2.89 3.64 2.29 2.62 2.49 1.87 2.38 4.30 2.64 2.52 2.67 1.95 2.78 3.07 4.50 3.13
2.80
6.09 4.18 3.06 3.53 2.47 2.81 2.77 2.13 2.47 4.45 2.73 2.58 2.62 2.04 2.13 2.95 3.81 3.34
2.83
Production
2006 2007 2008
1,000 Tons 1,000 Tons 1,000 Tons
CA ID IL IA KS MI MN MO NE NM NY OH PA SD TX VT WA WI 18 State Total
10,667 6,202 2,506 5,550 6,643 4,197 6,766 7,034 5,713 1,410 4,996 3,999 6,572 4,246 8,897
904 3,523
10,318
100,143
10,854 5,813 2,067 5,319 6,928 3,324 5,119 7,687 6,342 1,627 4,890 3,143 5,456 7,470
15,284 968
3,756 8,912
104,959
11,210 6,166 1,992 5,705 6,945 3,512 5,957 9,067 6,381 1,672 4,990 3,123 5,015 7,953 9,677
913 2,937 9,674
102,889
1 All Forage production is the sum of the following dry equivalents: alfalfa hay harvested as dry hay, all other hay harvested as dry hay, alfalfa haylage and greenchop, all other haylage and greenchop; after converting alfalfa and all other haylage and greenchop to a dry equivalent basis.

Crop Production 2008 Summary Agricultural Statistics Board January 2009 29 NASS, USDA
All Alfalfa Forage: Area Harvested, Yield, and Production by State and 18 State Total, 2006-2008 1
Area Harvested Yield State
2006 2007 2008 2006 2007 2008
1,000 Acres 1,000 Acres 1,000 Acres Tons Tons Tons
CA ID IL IA KS MI MN MO NE NM NY OH PA SD TX VT WA WI 18 State Total
1,120 1,195
430 1,230
965 1,005 1,585
400 1,215
229 610 550 660
1,820 160 85
455 2,400
16,114
1,015 1,215
400 1,130
830 980
1,300 415
1,110 250 700 500 745
2,245 160 75
450 2,350
15,870
970 1,190
370 1,200
740 990
1,515 360 980 259 690 470 665
2,430 140 75
425 2,450
15,919
6.94 4.59 4.17 3.92 3.81 3.53 3.44 2.96 3.34 5.06 3.31 3.99 3.81 1.61 4.42 3.55 4.92 3.83
3.79
7.30 4.22 3.81 4.04 3.73 2.85 3.03 2.89 3.73 5.12 3.63 3.33 3.71 2.26 4.63 3.92 5.28 3.43
3.69
7.08 4.65 3.94 3.91 4.05 3.12 3.17 3.32 4.03 5.16 3.86 3.17 3.97 2.31 4.61 4.00 4.40 3.55
3.76
Production
2006 2007 2008
1,000 Tons 1,000 Tons 1,000 Tons
CA ID IL IA KS MI MN MO NE NM NY OH PA SD TX VT WA WI 18 State Total
7,769 5,482 1,795 4,816 3,677 3,547 5,455 1,184 4,061 1,159 2,021 2,192 2,512 2,934
707 302
2,240 9,186
61,039
7,405 5,130 1,524 4,569 3,098 2,790 3,944 1,200 4,135 1,279 2,543 1,663 2,765 5,076
740 294
2,377 8,057
58,589
6,864 5,536 1,457 4,686 2,994 3,087 4,801 1,194 3,953 1,336 2,664 1,490 2,638 5,603
645 300
1,868 8,687
59,803
1 All alfalfa forage production is the sum of alfalfa harvested as dry hay and alfalfa haylage and greenchop production after converting it to a dry equivalent basis.
Crop Production 2008 Summary Agricultural Statistics Board January 2009 30 NASS, USDA
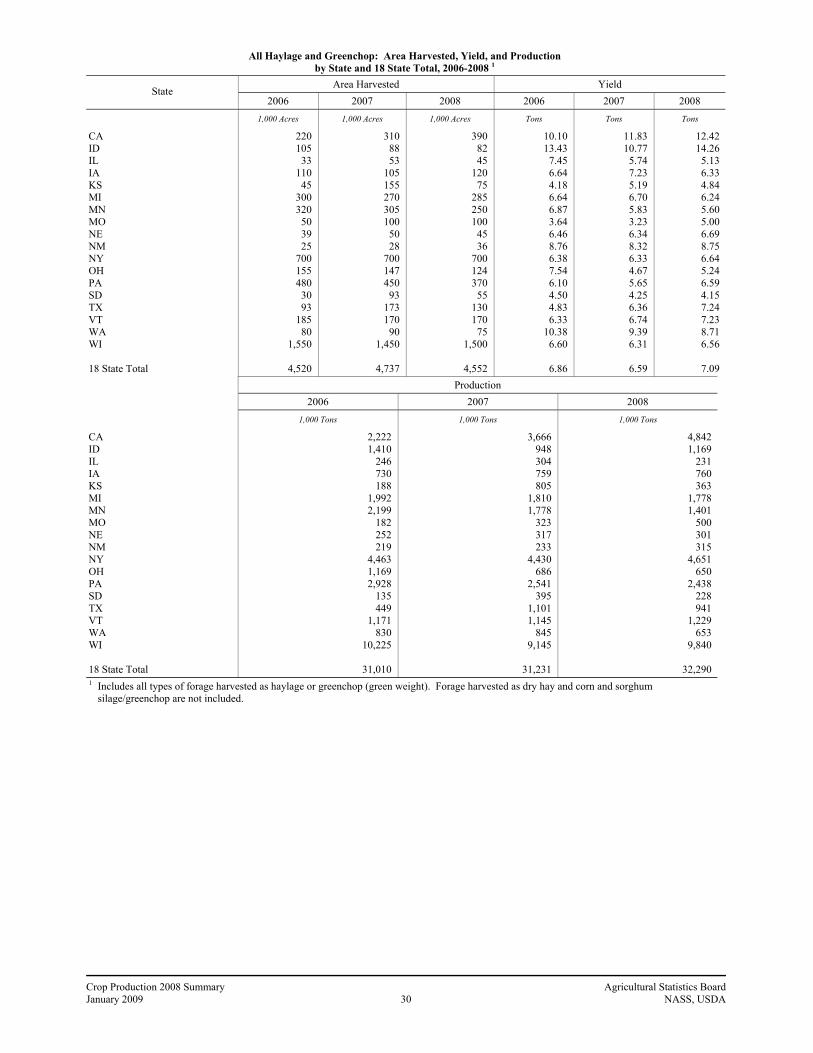
All Haylage and Greenchop: Area Harvested, Yield, and Production by State and 18 State Total, 2006-2008 1
Area Harvested Yield State
2006 2007 2008 2006 2007 2008
1,000 Acres 1,000 Acres 1,000 Acres Tons Tons Tons
CA ID IL IA KS MI MN MO NE NM NY OH PA SD TX VT WA WI 18 State Total
220 105
33 110
45 300 320
50 39 25
700 155 480
30 93
185 80
1,550
4,520
310 88 53
105 155 270 305 100
50 28
700 147 450
93 173 170
90 1,450
4,737
390 82 45
120 75
285 250 100
45 36
700 124 370
55 130 170
75 1,500
4,552
10.10 13.43
7.45 6.64 4.18 6.64 6.87 3.64 6.46 8.76 6.38 7.54 6.10 4.50 4.83 6.33
10.38 6.60
6.86
11.83 10.77
5.74 7.23 5.19 6.70 5.83 3.23 6.34 8.32 6.33 4.67 5.65 4.25 6.36 6.74 9.39 6.31
6.59
12.42 14.26
5.13 6.33 4.84 6.24 5.60 5.00 6.69 8.75 6.64 5.24 6.59 4.15 7.24 7.23 8.71 6.56
7.09
Production
2006 2007 2008
1,000 Tons 1,000 Tons 1,000 Tons
CA ID IL IA KS MI MN MO NE NM NY OH PA SD TX VT WA WI 18 State Total
2,222 1,410
246 730 188
1,992 2,199
182 252 219
4,463 1,169 2,928
135 449
1,171 830
10,225
31,010
3,666 948 304 759 805
1,810 1,778
323 317 233
4,430 686
2,541 395
1,101 1,145
845 9,145
31,231
4,842 1,169
231 760 363
1,778 1,401
500 301 315
4,651 650
2,438 228 941
1,229 653
9,840
32,290 1 Includes all types of forage harvested as haylage or greenchop (green weight). Forage harvested as dry hay and corn and sorghum
silage/greenchop are not included.
Crop Production 2008 Summary Agricultural Statistics Board January 2009 31 NASS, USDA
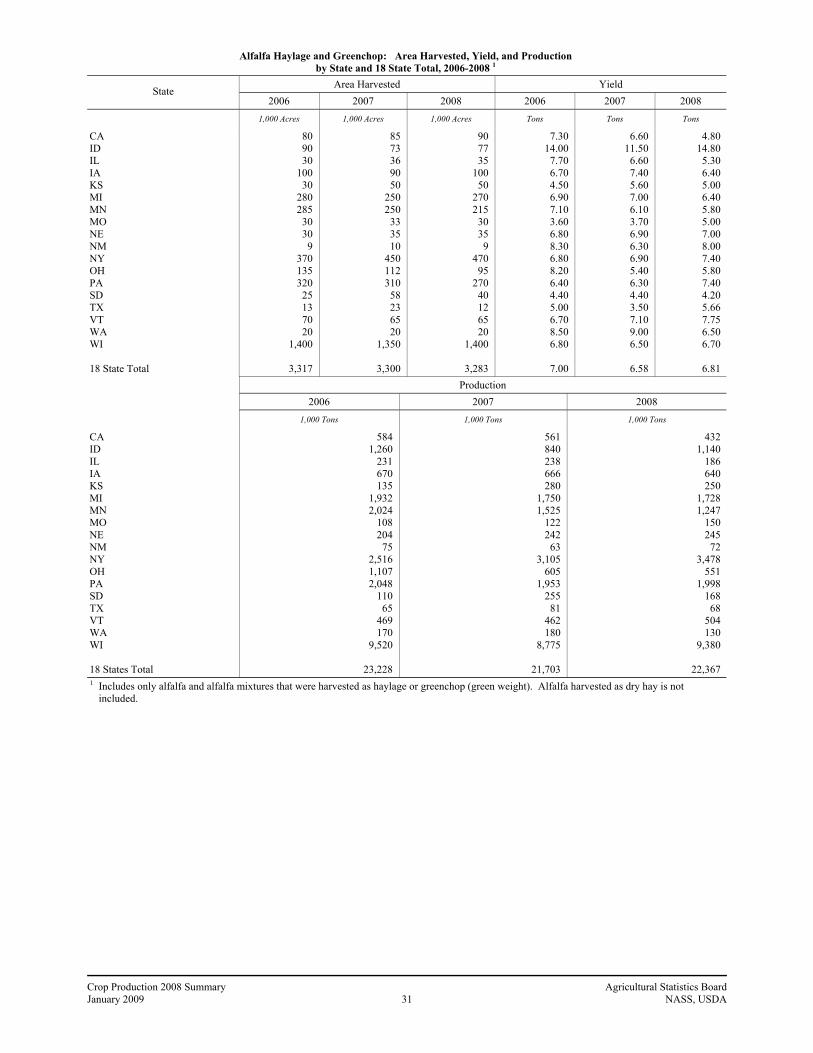
Alfalfa Haylage and Greenchop: Area Harvested, Yield, and Production by State and 18 State Total, 2006-2008 1
Area Harvested Yield State
2006 2007 2008 2006 2007 2008
1,000 Acres 1,000 Acres 1,000 Acres Tons Tons Tons
CA ID IL IA KS MI MN MO NE NM NY OH PA SD TX VT WA WI 18 State Total
80 90 30
100 30
280 285
30 30
9 370 135 320
25 13 70 20
1,400
3,317
85 73 36 90 50
250 250
33 35 10
450 112 310
58 23 65 20
1,350
3,300
90 77 35
100 50
270 215
30 35
9 470
95 270
40 12 65 20
1,400
3,283
7.30 14.00
7.70 6.70 4.50 6.90 7.10 3.60 6.80 8.30 6.80 8.20 6.40 4.40 5.00 6.70 8.50 6.80
7.00
6.60 11.50
6.60 7.40 5.60 7.00 6.10 3.70 6.90 6.30 6.90 5.40 6.30 4.40 3.50 7.10 9.00 6.50
6.58
4.80 14.80
5.30 6.40 5.00 6.40 5.80 5.00 7.00 8.00 7.40 5.80 7.40 4.20 5.66 7.75 6.50 6.70
6.81
Production
2006 2007 2008
1,000 Tons 1,000 Tons 1,000 Tons
CA ID IL IA KS MI MN MO NE NM NY OH PA SD TX VT WA WI 18 States Total
584 1,260
231 670 135
1,932 2,024
108 204
75 2,516 1,107 2,048
110 65
469 170
9,520
23,228
561 840 238 666 280
1,750 1,525
122 242
63 3,105
605 1,953
255 81
462 180
8,775
21,703
432 1,140
186 640 250
1,728 1,247
150 245
72 3,478
551 1,998
168 68
504 130
9,380
22,367 1 Includes only alfalfa and alfalfa mixtures that were harvested as haylage or greenchop (green weight). Alfalfa harvested as dry hay is not
included.
Crop Production 2008 Summary Agricultural Statistics Board January 2009 32 NASS, USDA
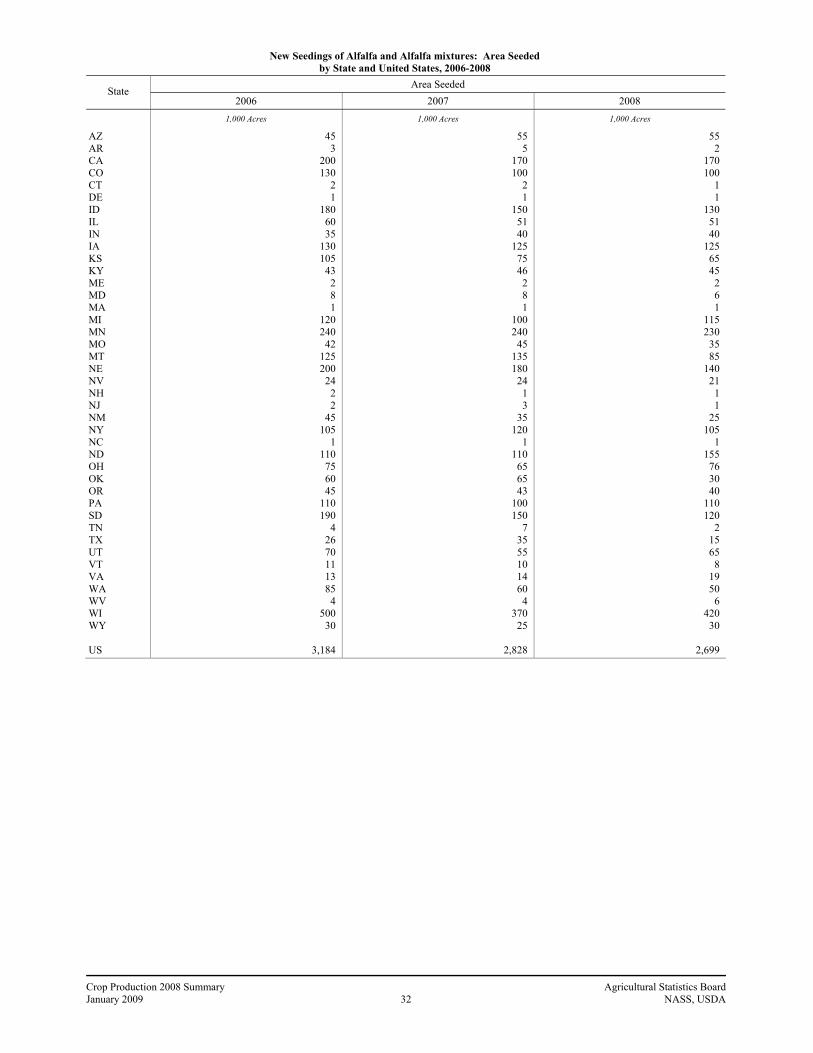
New Seedings of Alfalfa and Alfalfa mixtures: Area Seeded by State and United States, 2006-2008
Area Seeded State
2006 2007 2008
1,000 Acres 1,000 Acres 1,000 Acres
AZ AR CA CO CT DE ID IL IN IA KS KY ME MD MA MI MN MO MT NE NV NH NJ NM NY NC ND OH OK OR PA SD TN TX UT VT VA WA WV WI WY US
45 3
200 130
2 1
180 60 35
130 105
43 2 8 1
120 240
42 125 200
24 2 2
45 105
1 110
75 60 45
110 190
4 26 70 11 13 85
4 500
30
3,184
55 5
170 100
2 1
150 51 40
125 75 46
2 8 1
100 240
45 135 180
24 1 3
35 120
1 110
65 65 43
100 150
7 35 55 10 14 60
4 370
25
2,828
55 2
170 100
1 1
130 51 40
125 65 45
2 6 1
115 230
35 85
140 21
1 1
25 105
1 155
76 30 40
110 120
2 15 65
8 19 50
6 420
30
2,699
Crop Production 2008 Summary Agricultural Statistics Board January 2009 33 NASS, USDA
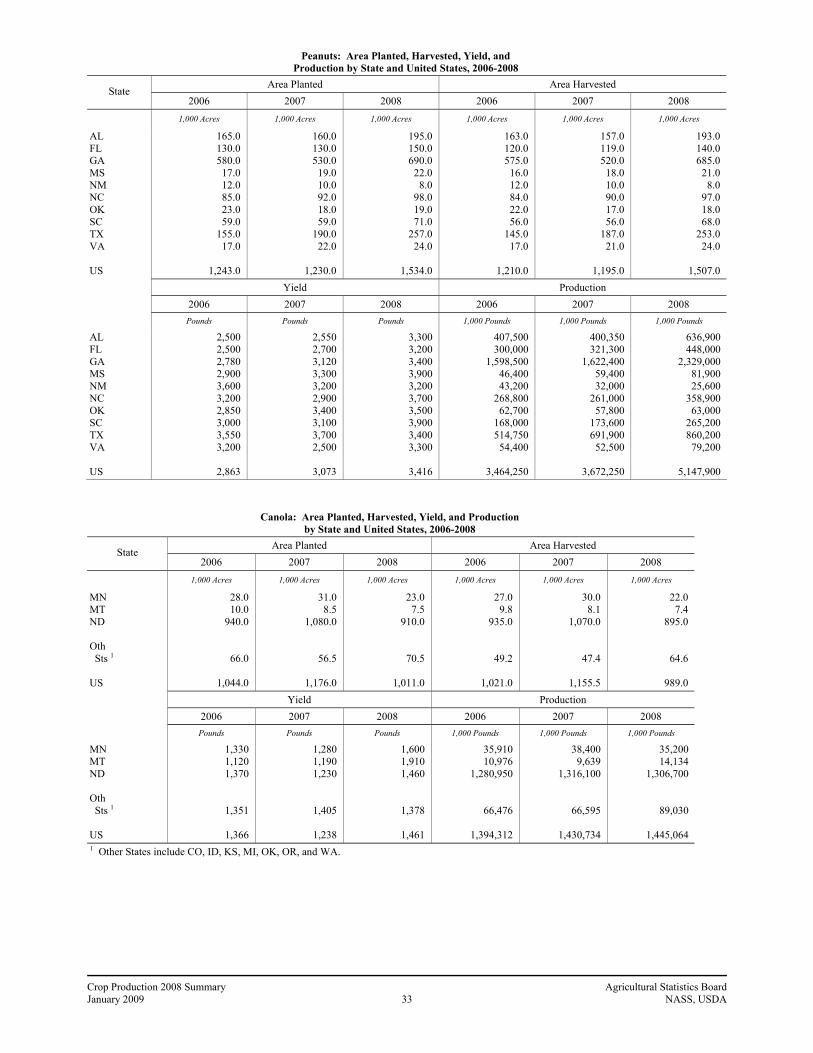
Peanuts: Area Planted, Harvested, Yield, and Production by State and United States, 2006-2008
Area Planted Area Harvested State
2006 2007 2008 2006 2007 2008
1,000 Acres 1,000 Acres 1,000 Acres 1,000 Acres 1,000 Acres 1,000 Acres
AL FL GA MS NM NC OK SC TX VA US
165.0 130.0 580.0
17.0 12.0 85.0 23.0 59.0
155.0 17.0
1,243.0
160.0 130.0 530.0
19.0 10.0 92.0 18.0 59.0
190.0 22.0
1,230.0
195.0 150.0 690.0
22.0 8.0
98.0 19.0 71.0
257.0 24.0
1,534.0
163.0 120.0 575.0
16.0 12.0 84.0 22.0 56.0
145.0 17.0
1,210.0
157.0 119.0 520.0
18.0 10.0 90.0 17.0 56.0
187.0 21.0
1,195.0
193.0 140.0 685.0
21.0 8.0
97.0 18.0 68.0
253.0 24.0
1,507.0
Yield Production
2006 2007 2008 2006 2007 2008 Pounds Pounds Pounds 1,000 Pounds 1,000 Pounds 1,000 Pounds
AL FL GA MS NM NC OK SC TX VA US
2,500 2,500 2,780 2,900 3,600 3,200 2,850 3,000 3,550 3,200
2,863
2,550 2,700 3,120 3,300 3,200 2,900 3,400 3,100 3,700 2,500
3,073
3,300 3,200 3,400 3,900 3,200 3,700 3,500 3,900 3,400 3,300
3,416
407,500 300,000
1,598,500 46,400 43,200
268,800 62,700
168,000 514,750 54,400
3,464,250
400,350 321,300
1,622,400 59,400 32,000
261,000 57,800
173,600 691,900 52,500
3,672,250
636,900 448,000
2,329,000 81,900 25,600
358,900 63,000
265,200 860,200 79,200
5,147,900
Canola: Area Planted, Harvested, Yield, and Production by State and United States, 2006-2008
Area Planted Area Harvested State
2006 2007 2008 2006 2007 2008
1,000 Acres 1,000 Acres 1,000 Acres 1,000 Acres 1,000 Acres 1,000 Acres
MN MT ND Oth Sts 1 US
28.0 10.0
940.0
66.0
1,044.0
31.0 8.5
1,080.0
56.5
1,176.0
23.0 7.5
910.0
70.5
1,011.0
27.0 9.8
935.0
49.2
1,021.0
30.0 8.1
1,070.0
47.4
1,155.5
22.0 7.4
895.0
64.6
989.0 Yield Production
2006 2007 2008 2006 2007 2008
Pounds Pounds Pounds 1,000 Pounds 1,000 Pounds 1,000 Pounds
MN MT ND Oth Sts 1 US
1,330 1,120 1,370
1,351
1,366
1,280 1,190 1,230
1,405
1,238
1,600 1,910 1,460
1,378
1,461
35,910 10,976
1,280,950
66,476
1,394,312
38,400 9,639
1,316,100
66,595
1,430,734
35,200 14,134
1,306,700
89,030
1,445,064 1 Other States include CO, ID, KS, MI, OK, OR, and WA.
Crop Production 2008 Summary Agricultural Statistics Board January 2009 34 NASS, USDA
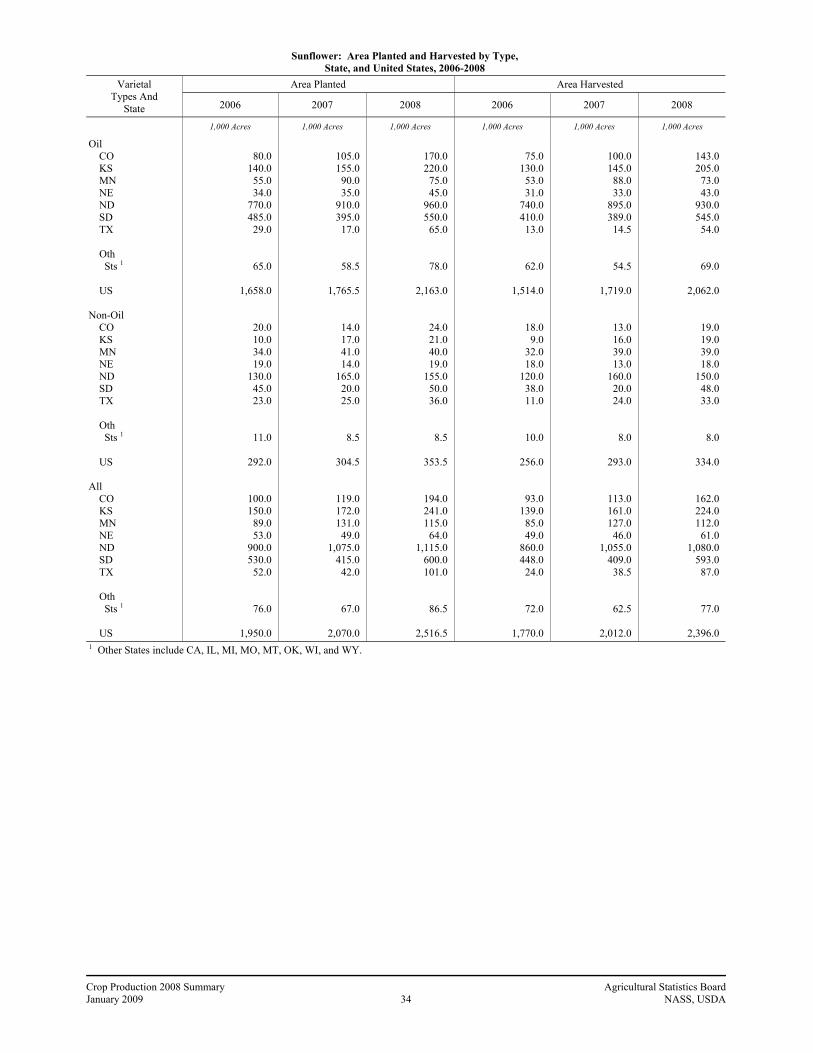
Sunflower: Area Planted and Harvested by Type, State, and United States, 2006-2008
Area Planted Area Harvested Varietal Types And
State 2006 2007 2008 2006 2007 2008
1,000 Acres 1,000 Acres 1,000 Acres 1,000 Acres 1,000 Acres 1,000 Acres
Oil CO KS MN NE ND SD TX Oth Sts 1 US Non-Oil CO KS MN NE ND SD TX Oth Sts 1 US All CO KS MN NE ND SD TX Oth Sts 1 US
80.0
140.0 55.0 34.0
770.0 485.0
29.0
65.0
1,658.0
20.0 10.0 34.0 19.0
130.0 45.0 23.0
11.0
292.0
100.0 150.0
89.0 53.0
900.0 530.0
52.0
76.0
1,950.0
105.0 155.0
90.0 35.0
910.0 395.0
17.0
58.5
1,765.5
14.0 17.0 41.0 14.0
165.0 20.0 25.0
8.5
304.5
119.0 172.0 131.0
49.0 1,075.0
415.0 42.0
67.0
2,070.0
170.0 220.0
75.0 45.0
960.0 550.0
65.0
78.0
2,163.0
24.0 21.0 40.0 19.0
155.0 50.0 36.0
8.5
353.5
194.0 241.0 115.0
64.0 1,115.0
600.0 101.0
86.5
2,516.5
75.0
130.0 53.0 31.0
740.0 410.0
13.0
62.0
1,514.0
18.0 9.0
32.0 18.0
120.0 38.0 11.0
10.0
256.0
93.0 139.0
85.0 49.0
860.0 448.0
24.0
72.0
1,770.0
100.0 145.0
88.0 33.0
895.0 389.0
14.5
54.5
1,719.0
13.0 16.0 39.0 13.0
160.0 20.0 24.0
8.0
293.0
113.0 161.0 127.0
46.0 1,055.0
409.0 38.5
62.5
2,012.0
143.0 205.0
73.0 43.0
930.0 545.0
54.0
69.0
2,062.0
19.0 19.0 39.0 18.0
150.0 48.0 33.0
8.0
334.0
162.0 224.0 112.0
61.0 1,080.0
593.0 87.0
77.0
2,396.0 1 Other States include CA, IL, MI, MO, MT, OK, WI, and WY.
Crop Production 2008 Summary Agricultural Statistics Board January 2009 35 NASS, USDA
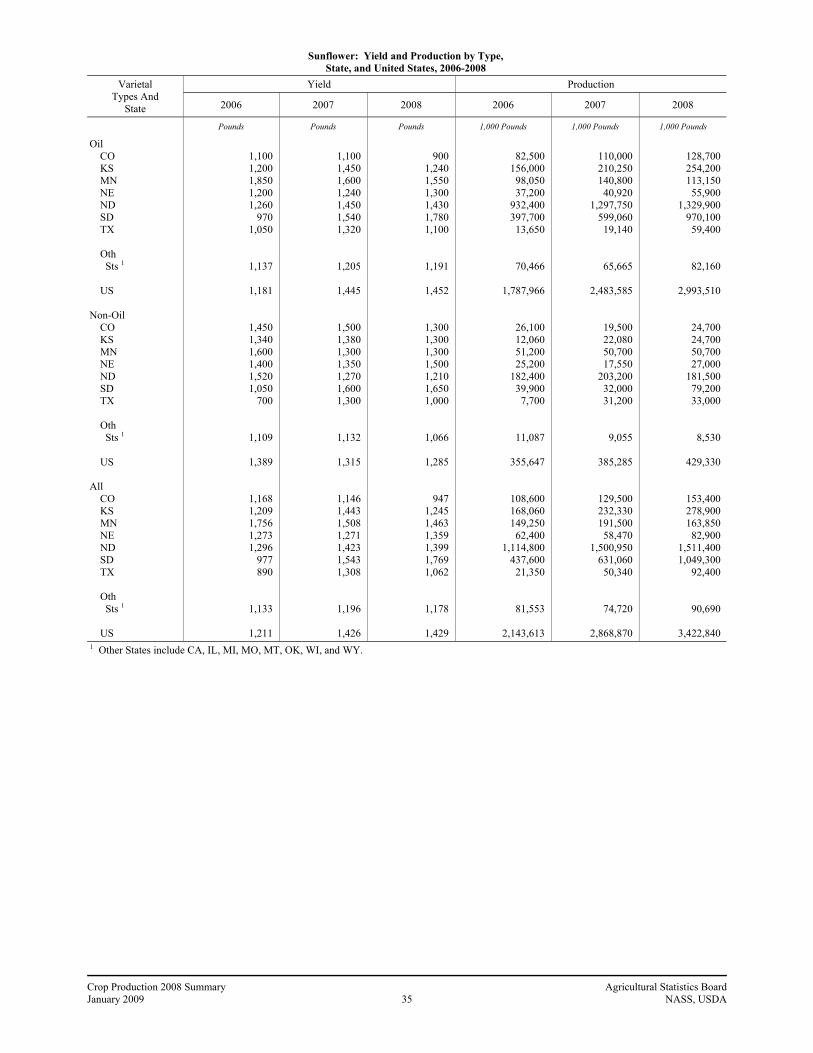
Sunflower: Yield and Production by Type, State, and United States, 2006-2008
Yield Production Varietal Types And
State 2006 2007 2008 2006 2007 2008
Pounds Pounds Pounds 1,000 Pounds 1,000 Pounds 1,000 Pounds
Oil CO KS MN NE ND SD TX Oth Sts 1 US Non-Oil CO KS MN NE ND SD TX Oth Sts 1 US All CO KS MN NE ND SD TX Oth Sts 1 US
1,100 1,200 1,850 1,200 1,260
970 1,050
1,137
1,181
1,450 1,340 1,600 1,400 1,520 1,050
700
1,109
1,389
1,168 1,209 1,756 1,273 1,296
977 890
1,133
1,211
1,100 1,450 1,600 1,240 1,450 1,540 1,320
1,205
1,445
1,500 1,380 1,300 1,350 1,270 1,600 1,300
1,132
1,315
1,146 1,443 1,508 1,271 1,423 1,543 1,308
1,196
1,426
900
1,240 1,550 1,300 1,430 1,780 1,100
1,191
1,452
1,300 1,300 1,300 1,500 1,210 1,650 1,000
1,066
1,285
947 1,245 1,463 1,359 1,399 1,769 1,062
1,178
1,429
82,500
156,000 98,050 37,200
932,400 397,700 13,650
70,466
1,787,966
26,100 12,060 51,200 25,200
182,400 39,900
7,700
11,087
355,647
108,600 168,060 149,250 62,400
1,114,800 437,600 21,350
81,553
2,143,613
110,000 210,250 140,800 40,920
1,297,750 599,060 19,140
65,665
2,483,585
19,500 22,080 50,700 17,550
203,200 32,000 31,200
9,055
385,285
129,500 232,330 191,500 58,470
1,500,950 631,060 50,340
74,720
2,868,870
128,700 254,200 113,150 55,900
1,329,900 970,100 59,400
82,160
2,993,510
24,700 24,700 50,700 27,000
181,500 79,200 33,000
8,530
429,330
153,400 278,900 163,850 82,900
1,511,400 1,049,300
92,400
90,690
3,422,840 1 Other States include CA, IL, MI, MO, MT, OK, WI, and WY.
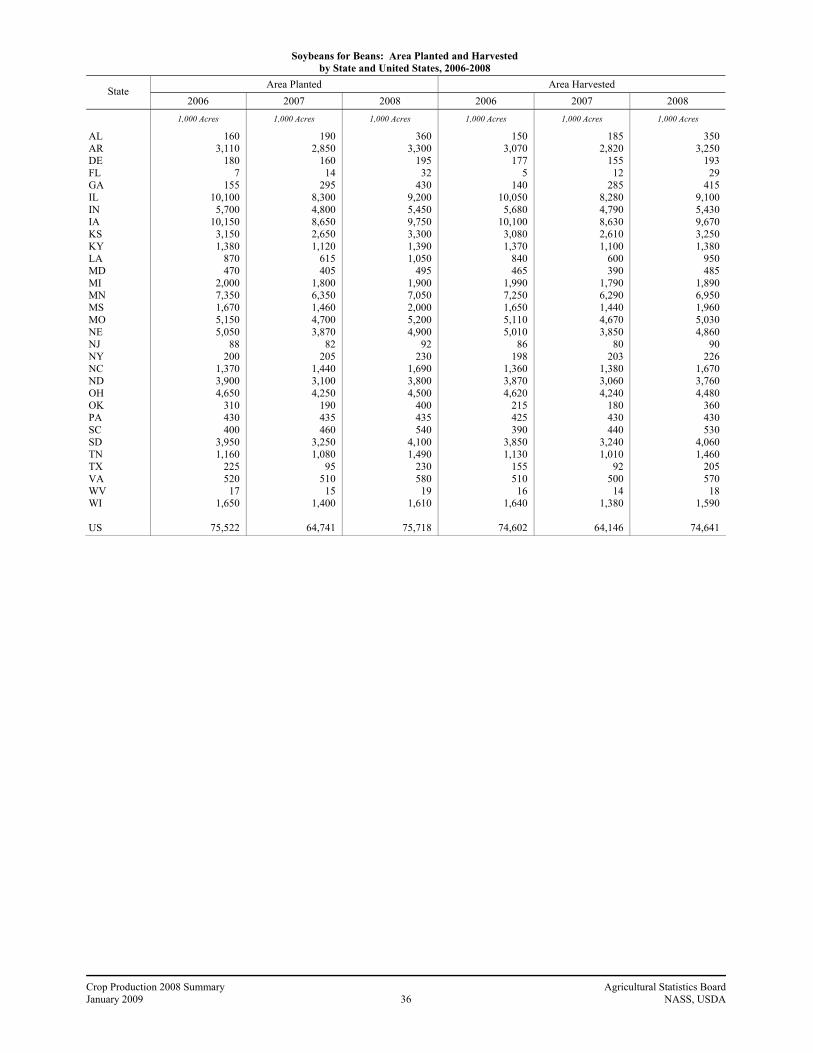
Crop Production 2008 Summary Agricultural Statistics Board January 2009 36 NASS, USDA
Soybeans for Beans: Area Planted and Harvested by State and United States, 2006-2008
Area Planted Area Harvested State
2006 2007 2008 2006 2007 2008
1,000 Acres 1,000 Acres 1,000 Acres 1,000 Acres 1,000 Acres 1,000 Acres
AL AR DE FL GA IL IN IA KS KY LA MD MI MN MS MO NE NJ NY NC ND OH OK PA SC SD TN TX VA WV WI US
160 3,110
180 7
155 10,100
5,700 10,150
3,150 1,380
870 470
2,000 7,350 1,670 5,150 5,050
88 200
1,370 3,900 4,650
310 430 400
3,950 1,160
225 520
17 1,650
75,522
190 2,850
160 14
295 8,300 4,800 8,650 2,650 1,120
615 405
1,800 6,350 1,460 4,700 3,870
82 205
1,440 3,100 4,250
190 435 460
3,250 1,080
95 510
15 1,400
64,741
360 3,300
195 32
430 9,200 5,450 9,750 3,300 1,390 1,050
495 1,900 7,050 2,000 5,200 4,900
92 230
1,690 3,800 4,500
400 435 540
4,100 1,490
230 580
19 1,610
75,718
150 3,070
177 5
140 10,050
5,680 10,100
3,080 1,370
840 465
1,990 7,250 1,650 5,110 5,010
86 198
1,360 3,870 4,620
215 425 390
3,850 1,130
155 510
16 1,640
74,602
185 2,820
155 12
285 8,280 4,790 8,630 2,610 1,100
600 390
1,790 6,290 1,440 4,670 3,850
80 203
1,380 3,060 4,240
180 430 440
3,240 1,010
92 500
14 1,380
64,146
350 3,250
193 29
415 9,100 5,430 9,670 3,250 1,380
950 485
1,890 6,950 1,960 5,030 4,860
90 226
1,670 3,760 4,480
360 430 530
4,060 1,460
205 570
18 1,590
74,641

Crop Production 2008 Summary Agricultural Statistics Board January 2009 37 NASS, USDA
Soybeans for Beans: Yield and Production by State and United States, 2006-2008
Yield Production State
2006 2007 2008 2006 2007 2008
Bushels Bushels Bushels 1,000 Bushels 1,000 Bushels 1,000 Bushels
AL AR DE FL GA IL IN IA KS KY LA MD MI MN MS MO NE NJ NY NC ND OH OK PA SC SD TN TX VA WV WI US
20.0 35.0 31.5 27.0 25.0 48.0 50.0 50.5 32.0 44.0 36.0 34.0 46.0 44.5 26.0 38.0 50.0 35.0 46.0 32.0 31.5 47.0 17.0 40.0 29.0 34.0 39.0 24.0 31.0 42.0 44.0
42.9
21.0 36.0 26.0 24.0 30.0 43.5 46.0 52.0 33.0 27.5 43.0 27.5 40.0 42.5 40.5 37.5 51.0 31.0 39.0 22.0 35.5 47.0 26.0 41.0 18.5 42.0 19.0 37.5 27.5 33.0 40.5
41.7
35.0 38.0 27.5 38.0 30.0 47.0 45.0 46.0 37.0 34.0 33.0 30.0 37.0 38.0 40.0 38.0 46.5 29.0 46.0 33.0 28.0 36.0 25.0 40.0 32.0 34.0 34.0 24.0 32.0 41.0 35.0
39.6
3,000 107,450
5,576 135
3,500 482,400 284,000 510,050 98,560 60,280 30,240 15,810 91,540
322,625 42,900
194,180 250,500
3,010 9,108
43,520 121,905 217,140
3,655 17,000 11,310
130,900 44,070
3,720 15,810
672 72,160
3,196,726
3,885 101,520
4,030 288
8,550 360,180 220,340 448,760 86,130 30,250 25,800 10,725 71,600
267,325 58,320
175,125 196,350
2,480 7,917
30,360 108,630 199,280
4,680 17,630
8,140 136,080 19,190
3,450 13,750
462 55,890
2,677,117
12,250 123,500
5,308 1,102
12,450 427,700 244,350 444,820 120,250 46,920 31,350 14,550 69,930
264,100 78,400
191,140 225,990
2,610 10,396 55,110
105,280 161,280
9,000 17,200 16,960
138,040 49,640
4,920 18,240
738 55,650
2,959,174
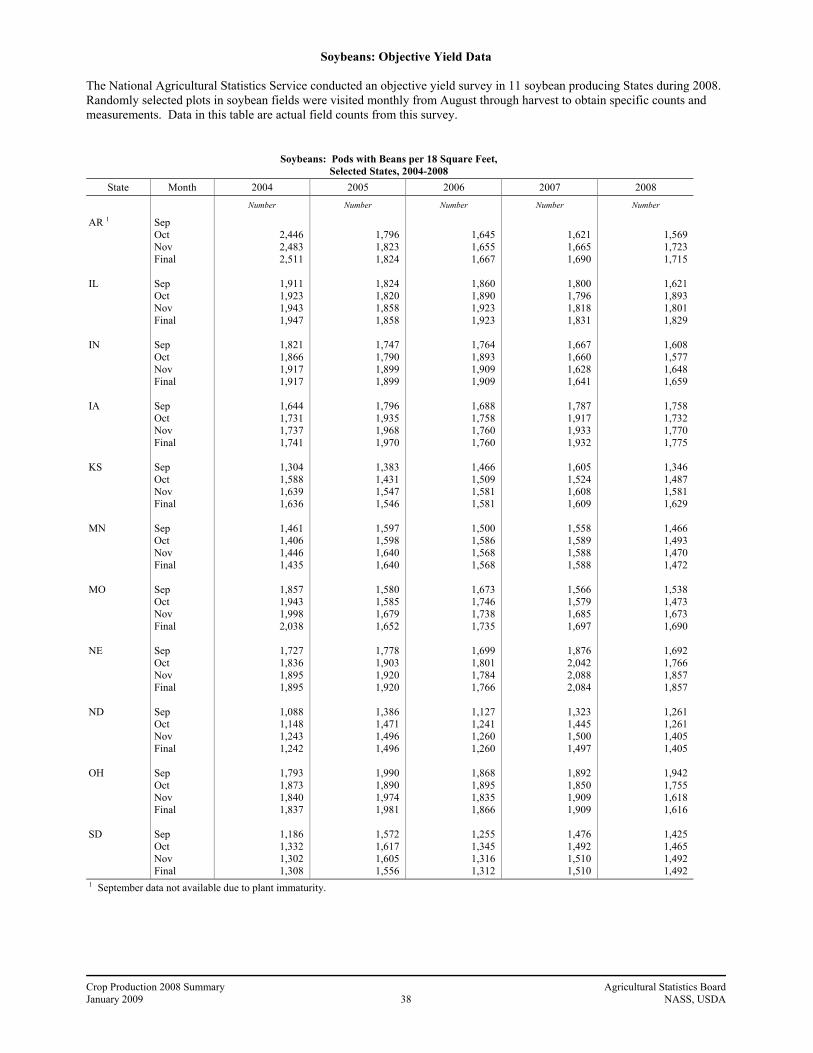
Crop Production 2008 Summary Agricultural Statistics Board January 2009 38 NASS, USDA
Soybeans: Objective Yield Data The National Agricultural Statistics Service conducted an objective yield survey in 11 soybean producing States during 2008. Randomly selected plots in soybean fields were visited monthly from August through harvest to obtain specific counts and measurements. Data in this table are actual field counts from this survey.
Soybeans: Pods with Beans per 18 Square Feet, Selected States, 2004-2008
State Month 2004 2005 2006 2007 2008
Number Number Number Number Number
AR 1 IL IN IA KS MN MO NE ND OH SD
Sep Oct Nov Final Sep Oct Nov Final Sep Oct Nov Final Sep Oct Nov Final Sep Oct Nov Final Sep Oct Nov Final Sep Oct Nov Final Sep Oct Nov Final Sep Oct Nov Final Sep Oct Nov Final Sep Oct Nov Final
2,446 2,483 2,511
1,911 1,923 1,943 1,947
1,821 1,866 1,917 1,917
1,644 1,731 1,737 1,741
1,304 1,588 1,639 1,636
1,461 1,406 1,446 1,435
1,857 1,943 1,998 2,038
1,727 1,836 1,895 1,895
1,088 1,148 1,243 1,242
1,793 1,873 1,840 1,837
1,186 1,332 1,302 1,308
1,796 1,823 1,824
1,824 1,820 1,858 1,858
1,747 1,790 1,899 1,899
1,796 1,935 1,968 1,970
1,383 1,431 1,547 1,546
1,597 1,598 1,640 1,640
1,580 1,585 1,679 1,652
1,778 1,903 1,920 1,920
1,386 1,471 1,496 1,496
1,990 1,890 1,974 1,981
1,572 1,617 1,605 1,556
1,645 1,655 1,667
1,860 1,890 1,923 1,923
1,764 1,893 1,909 1,909
1,688 1,758 1,760 1,760
1,466 1,509 1,581 1,581
1,500 1,586 1,568 1,568
1,673 1,746 1,738 1,735
1,699 1,801 1,784 1,766
1,127 1,241 1,260 1,260
1,868 1,895 1,835 1,866
1,255 1,345 1,316 1,312
1,621 1,665 1,690
1,800 1,796 1,818 1,831
1,667 1,660 1,628 1,641
1,787 1,917 1,933 1,932
1,605 1,524 1,608 1,609
1,558 1,589 1,588 1,588
1,566 1,579 1,685 1,697
1,876 2,042 2,088 2,084
1,323 1,445 1,500 1,497
1,892 1,850 1,909 1,909
1,476 1,492 1,510 1,510
1,569 1,723 1,715
1,621 1,893 1,801 1,829
1,608 1,577 1,648 1,659
1,758 1,732 1,770 1,775
1,346 1,487 1,581 1,629
1,466 1,493 1,470 1,472
1,538 1,473 1,673 1,690
1,692 1,766 1,857 1,857
1,261 1,261 1,405 1,405
1,942 1,755 1,618 1,616
1,425 1,465 1,492 1,492
1 September data not available due to plant immaturity.
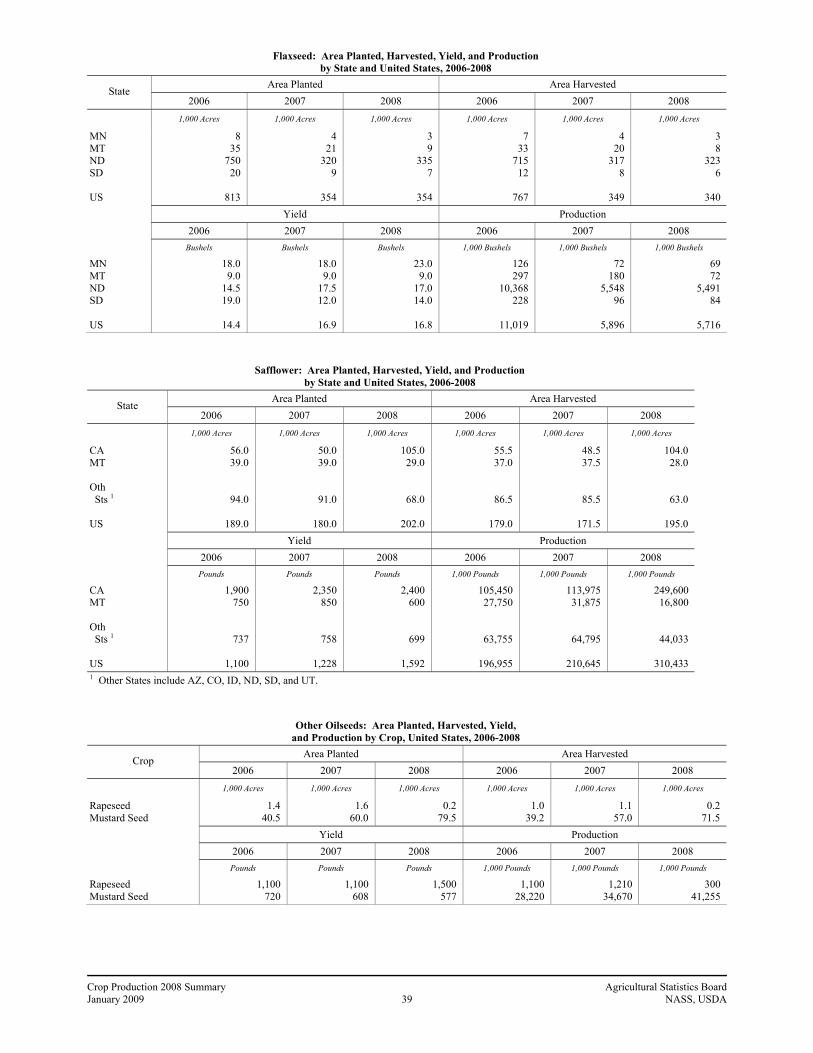
Crop Production 2008 Summary Agricultural Statistics Board January 2009 39 NASS, USDA
Flaxseed: Area Planted, Harvested, Yield, and Production by State and United States, 2006-2008
Area Planted Area Harvested State
2006 2007 2008 2006 2007 2008
1,000 Acres 1,000 Acres 1,000 Acres 1,000 Acres 1,000 Acres 1,000 Acres
MN MT ND SD US
8 35
750 20
813
4 21
320 9
354
3 9
335 7
354
7 33
715 12
767
4 20
317 8
349
3 8
323 6
340
Yield Production
2006 2007 2008 2006 2007 2008 Bushels Bushels Bushels 1,000 Bushels 1,000 Bushels 1,000 Bushels
MN MT ND SD US
18.0 9.0
14.5 19.0
14.4
18.0 9.0
17.5 12.0
16.9
23.0 9.0
17.0 14.0
16.8
126 297
10,368 228
11,019
72 180
5,548 96
5,896
69 72
5,491 84
5,716
Safflower: Area Planted, Harvested, Yield, and Production by State and United States, 2006-2008
Area Planted Area Harvested State
2006 2007 2008 2006 2007 2008
1,000 Acres 1,000 Acres 1,000 Acres 1,000 Acres 1,000 Acres 1,000 Acres
CA MT Oth Sts 1 US
56.0 39.0
94.0
189.0
50.0 39.0
91.0
180.0
105.0 29.0
68.0
202.0
55.5 37.0
86.5
179.0
48.5 37.5
85.5
171.5
104.0 28.0
63.0
195.0 Yield Production
2006 2007 2008 2006 2007 2008
Pounds Pounds Pounds 1,000 Pounds 1,000 Pounds 1,000 Pounds
CA MT Oth Sts 1 US
1,900 750
737
1,100
2,350 850
758
1,228
2,400 600
699
1,592
105,450 27,750
63,755
196,955
113,975 31,875
64,795
210,645
249,600 16,800
44,033
310,433 1 Other States include AZ, CO, ID, ND, SD, and UT.
Other Oilseeds: Area Planted, Harvested, Yield, and Production by Crop, United States, 2006-2008
Area Planted Area Harvested Crop
2006 2007 2008 2006 2007 2008
1,000 Acres 1,000 Acres 1,000 Acres 1,000 Acres 1,000 Acres 1,000 Acres
Rapeseed Mustard Seed
1.4 40.5
1.6 60.0
0.2 79.5
1.0 39.2
1.1 57.0
0.2 71.5
Yield Production
2006 2007 2008 2006 2007 2008 Pounds Pounds Pounds 1,000 Pounds 1,000 Pounds 1,000 Pounds
Rapeseed Mustard Seed
1,100 720
1,100 608
1,500 577
1,100 28,220
1,210 34,670
300 41,255
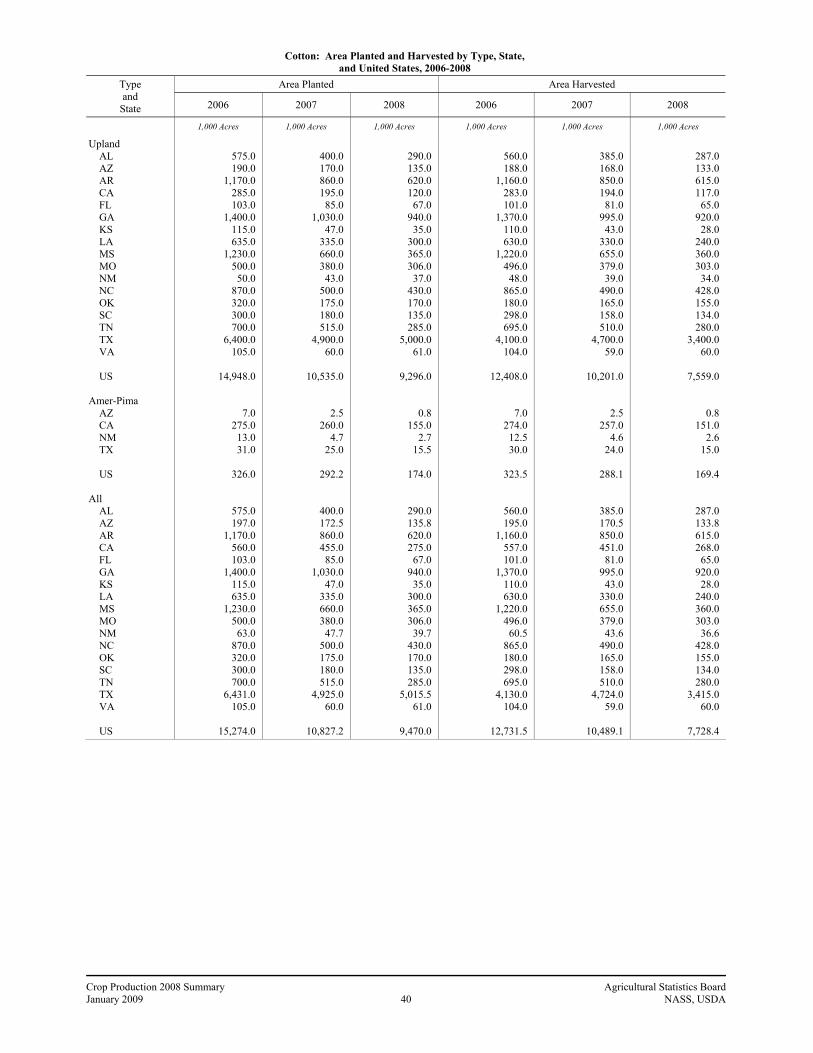
Crop Production 2008 Summary Agricultural Statistics Board January 2009 40 NASS, USDA
Cotton: Area Planted and Harvested by Type, State, and United States, 2006-2008
Area Planted Area Harvested Type and
State 2006 2007 2008 2006 2007 2008
1,000 Acres 1,000 Acres 1,000 Acres 1,000 Acres 1,000 Acres 1,000 Acres
Upland AL AZ AR CA FL GA KS LA MS MO NM NC OK SC TN TX VA US Amer-Pima AZ CA NM TX US All AL AZ AR CA FL GA KS LA MS MO NM NC OK SC TN TX VA US
575.0 190.0
1,170.0 285.0 103.0
1,400.0 115.0 635.0
1,230.0 500.0
50.0 870.0 320.0 300.0 700.0
6,400.0 105.0
14,948.0
7.0 275.0
13.0 31.0
326.0
575.0 197.0
1,170.0 560.0 103.0
1,400.0 115.0 635.0
1,230.0 500.0
63.0 870.0 320.0 300.0 700.0
6,431.0 105.0
15,274.0
400.0 170.0 860.0 195.0
85.0 1,030.0
47.0 335.0 660.0 380.0
43.0 500.0 175.0 180.0 515.0
4,900.0 60.0
10,535.0
2.5 260.0
4.7 25.0
292.2
400.0 172.5 860.0 455.0
85.0 1,030.0
47.0 335.0 660.0 380.0
47.7 500.0 175.0 180.0 515.0
4,925.0 60.0
10,827.2
290.0 135.0 620.0 120.0
67.0 940.0
35.0 300.0 365.0 306.0
37.0 430.0 170.0 135.0 285.0
5,000.0 61.0
9,296.0
0.8 155.0
2.7 15.5
174.0
290.0 135.8 620.0 275.0
67.0 940.0
35.0 300.0 365.0 306.0
39.7 430.0 170.0 135.0 285.0
5,015.5 61.0
9,470.0
560.0 188.0
1,160.0 283.0 101.0
1,370.0 110.0 630.0
1,220.0 496.0
48.0 865.0 180.0 298.0 695.0
4,100.0 104.0
12,408.0
7.0 274.0
12.5 30.0
323.5
560.0 195.0
1,160.0 557.0 101.0
1,370.0 110.0 630.0
1,220.0 496.0
60.5 865.0 180.0 298.0 695.0
4,130.0 104.0
12,731.5
385.0 168.0 850.0 194.0
81.0 995.0
43.0 330.0 655.0 379.0
39.0 490.0 165.0 158.0 510.0
4,700.0 59.0
10,201.0
2.5 257.0
4.6 24.0
288.1
385.0 170.5 850.0 451.0
81.0 995.0
43.0 330.0 655.0 379.0
43.6 490.0 165.0 158.0 510.0
4,724.0 59.0
10,489.1
287.0 133.0 615.0 117.0
65.0 920.0
28.0 240.0 360.0 303.0
34.0 428.0 155.0 134.0 280.0
3,400.0 60.0
7,559.0
0.8 151.0
2.6 15.0
169.4
287.0 133.8 615.0 268.0
65.0 920.0
28.0 240.0 360.0 303.0
36.6 428.0 155.0 134.0 280.0
3,415.0 60.0
7,728.4
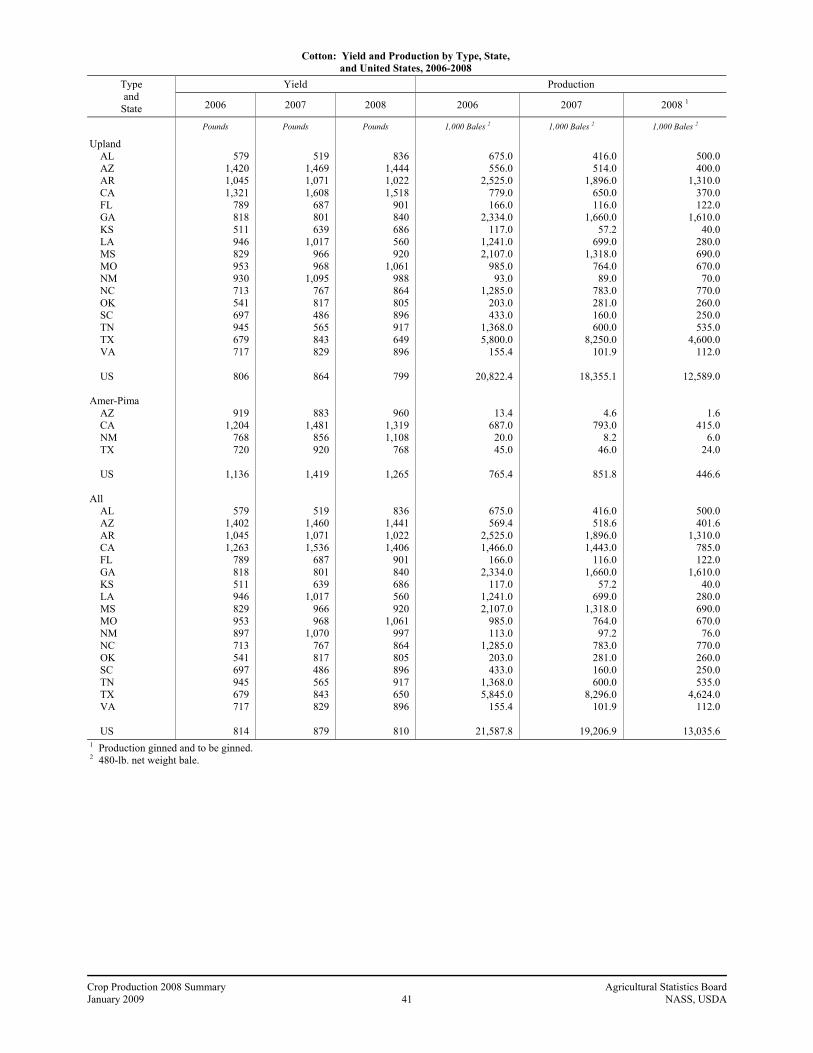
Crop Production 2008 Summary Agricultural Statistics Board January 2009 41 NASS, USDA
Cotton: Yield and Production by Type, State, and United States, 2006-2008
Yield Production Type and
State 2006 2007 2008 2006 2007 2008 1
Pounds Pounds Pounds 1,000 Bales 2 1,000 Bales 2 1,000 Bales 2
Upland AL AZ AR CA FL GA KS LA MS MO NM NC OK SC TN TX VA US Amer-Pima AZ CA NM TX US All AL AZ AR CA FL GA KS LA MS MO NM NC OK SC TN TX VA US
579
1,420 1,045 1,321
789 818 511 946 829 953 930 713 541 697 945 679 717
806
919 1,204
768 720
1,136
579 1,402 1,045 1,263
789 818 511 946 829 953 897 713 541 697 945 679 717
814
519
1,469 1,071 1,608
687 801 639
1,017 966 968
1,095 767 817 486 565 843 829
864
883 1,481
856 920
1,419
519 1,460 1,071 1,536
687 801 639
1,017 966 968
1,070 767 817 486 565 843 829
879
836
1,444 1,022 1,518
901 840 686 560 920
1,061 988 864 805 896 917 649 896
799
960 1,319 1,108
768
1,265
836 1,441 1,022 1,406
901 840 686 560 920
1,061 997 864 805 896 917 650 896
810
675.0 556.0
2,525.0 779.0 166.0
2,334.0 117.0
1,241.0 2,107.0
985.0 93.0
1,285.0 203.0 433.0
1,368.0 5,800.0
155.4
20,822.4
13.4 687.0
20.0 45.0
765.4
675.0 569.4
2,525.0 1,466.0
166.0 2,334.0
117.0 1,241.0 2,107.0
985.0 113.0
1,285.0 203.0 433.0
1,368.0 5,845.0
155.4
21,587.8
416.0 514.0
1,896.0 650.0 116.0
1,660.0 57.2
699.0 1,318.0
764.0 89.0
783.0 281.0 160.0 600.0
8,250.0 101.9
18,355.1
4.6 793.0
8.2 46.0
851.8
416.0 518.6
1,896.0 1,443.0
116.0 1,660.0
57.2 699.0
1,318.0 764.0
97.2 783.0 281.0 160.0 600.0
8,296.0 101.9
19,206.9
500.0 400.0
1,310.0 370.0 122.0
1,610.0 40.0
280.0 690.0 670.0
70.0 770.0 260.0 250.0 535.0
4,600.0 112.0
12,589.0
1.6 415.0
6.0 24.0
446.6
500.0 401.6
1,310.0 785.0 122.0
1,610.0 40.0
280.0 690.0 670.0
76.0 770.0 260.0 250.0 535.0
4,624.0 112.0
13,035.6
1 Production ginned and to be ginned. 2 480-lb. net weight bale.
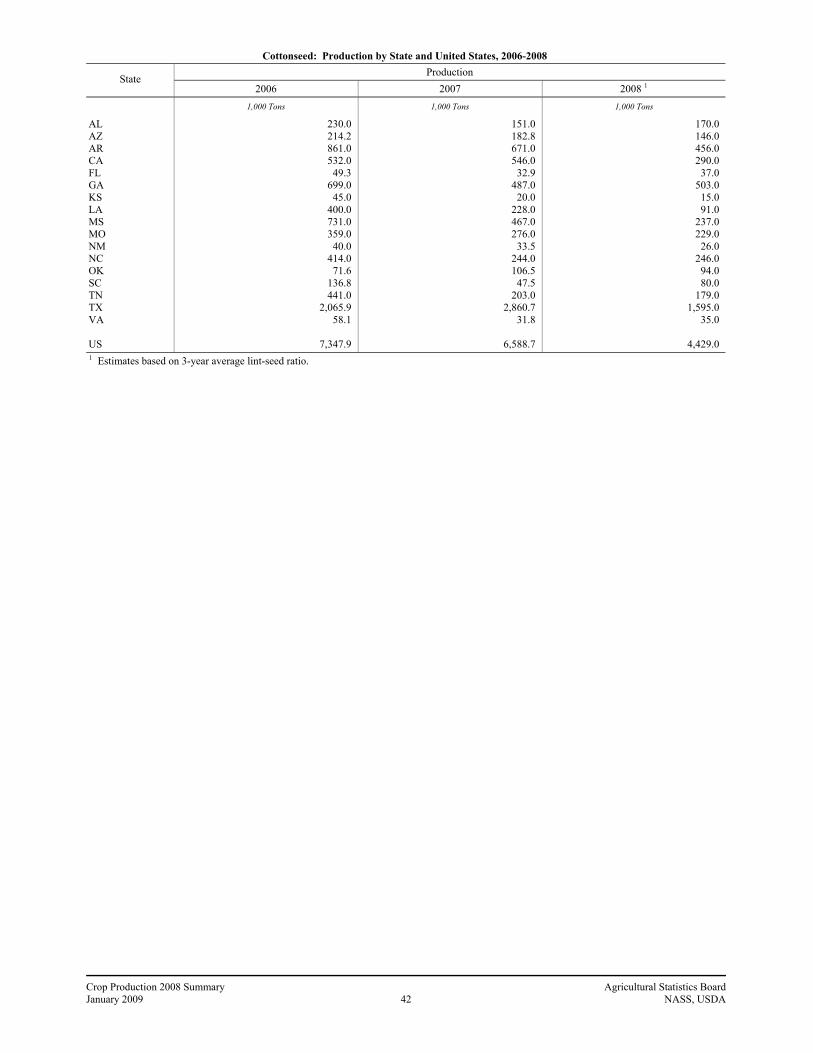
Crop Production 2008 Summary Agricultural Statistics Board January 2009 42 NASS, USDA
Cottonseed: Production by State and United States, 2006-2008 Production
State 2006 2007 2008 1
1,000 Tons 1,000 Tons 1,000 Tons
AL AZ AR CA FL GA KS LA MS MO NM NC OK SC TN TX VA US
230.0 214.2 861.0 532.0
49.3 699.0
45.0 400.0 731.0 359.0
40.0 414.0
71.6 136.8 441.0
2,065.9 58.1
7,347.9
151.0 182.8 671.0 546.0
32.9 487.0
20.0 228.0 467.0 276.0
33.5 244.0 106.5
47.5 203.0
2,860.7 31.8
6,588.7
170.0 146.0 456.0 290.0
37.0 503.0
15.0 91.0
237.0 229.0
26.0 246.0
94.0 80.0
179.0 1,595.0
35.0
4,429.0 1 Estimates based on 3-year average lint-seed ratio.

Crop Production 2008 Summary Agricultural Statistics Board January 2009 43 NASS, USDA
Tobacco: Area Harvested, Yield, and Production by State and United States, 2006-2008
Area Harvested Yield State
2006 2007 2008 2006 2007 2008
Acres Acres Acres Pounds Pounds Pounds
CT FL 1 GA KY MA MO NC OH PA SC TN VA US
2,500 1,100
17,000 83,000
1,150 1,500
158,900 3,500 7,900
23,000 19,800 19,650
339,000
2,900
18,500 89,200
1,320 1,600
170,000 3,500 7,900
20,500 19,980 20,600
356,000
2,600
16,000 87,800
690 1,500
174,000 3,400 7,900
19,000 21,800 19,500
354,190
1,549 2,600 1,770 2,250 1,558 2,250 2,080 2,000 2,125 2,100 2,482 2,408
2,147
1,733
2,150 2,209 1,725 2,330 2,255 2,050 2,318 2,250 1,934 2,240
2,213
1,546
2,100 2,345 1,445 2,240 2,241 2,050 2,232 2,100 2,403 2,357
2,260
Production
2006 2007 2008
1,000 Pounds 1,000 Pounds 1,000 Pounds
CT FL 1 GA KY MA MO NC OH PA SC TN VA US
3,873 2,860
30,090 186,780
1,792 3,375
330,580 7,000
16,790 48,300 49,135 47,322
727,897
5,025
39,775 197,040
2,277 3,728
383,420 7,175
18,310 46,125 38,636 46,142
787,653
4,020
33,600 205,850
997 3,360
389,850 6,970
17,630 39,900 52,380 45,970
800,527
1 Estimates discontinued in 2007.
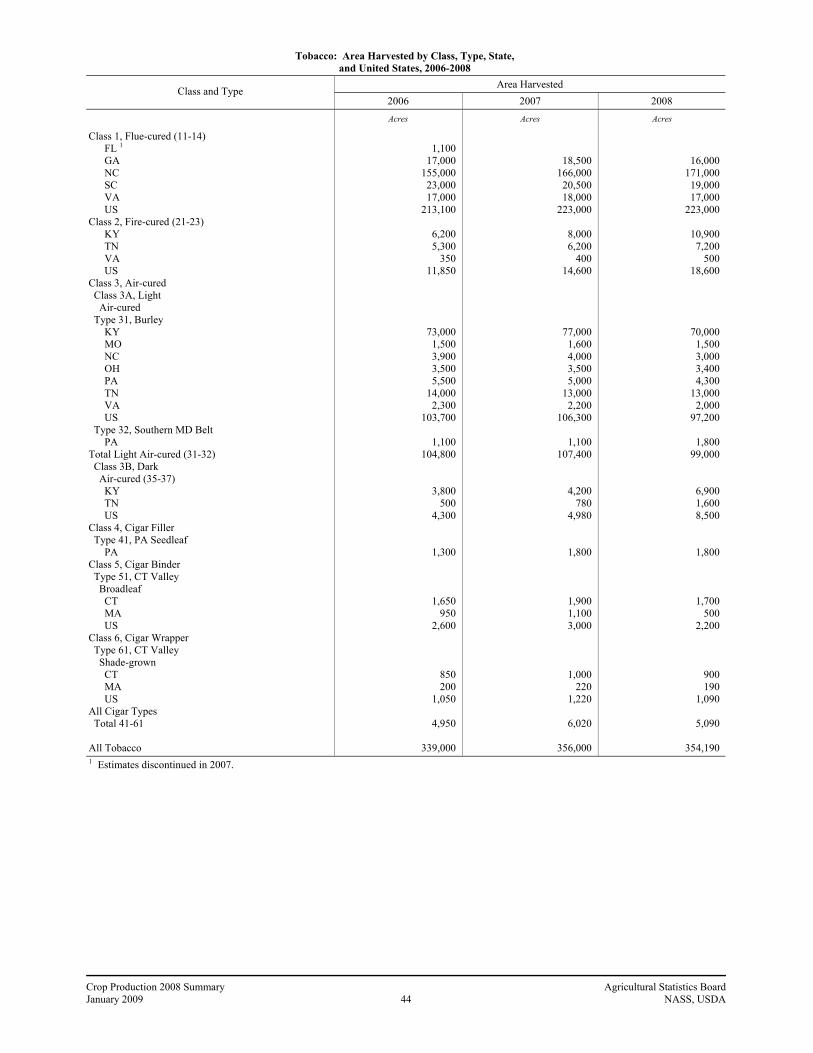
Crop Production 2008 Summary Agricultural Statistics Board January 2009 44 NASS, USDA
Tobacco: Area Harvested by Class, Type, State, and United States, 2006-2008
Area Harvested Class and Type
2006 2007 2008
Acres Acres Acres
Class 1, Flue-cured (11-14) FL 1 GA NC SC VA US Class 2, Fire-cured (21-23) KY TN VA US Class 3, Air-cured Class 3A, Light Air-cured Type 31, Burley KY MO NC OH PA TN VA US Type 32, Southern MD Belt PA Total Light Air-cured (31-32) Class 3B, Dark Air-cured (35-37) KY TN US Class 4, Cigar Filler Type 41, PA Seedleaf PA Class 5, Cigar Binder Type 51, CT Valley Broadleaf CT MA US Class 6, Cigar Wrapper Type 61, CT Valley Shade-grown CT MA US All Cigar Types Total 41-61 All Tobacco
1,100
17,000 155,000 23,000 17,000
213,100
6,200 5,300
350 11,850
73,000 1,500 3,900 3,500 5,500
14,000 2,300
103,700
1,100 104,800
3,800 500
4,300
1,300
1,650 950
2,600
850 200
1,050
4,950
339,000
18,500 166,000 20,500 18,000
223,000
8,000 6,200
400 14,600
77,000 1,600 4,000 3,500 5,000
13,000 2,200
106,300
1,100 107,400
4,200 780
4,980
1,800
1,900 1,100 3,000
1,000 220
1,220
6,020
356,000
16,000 171,000 19,000 17,000
223,000
10,900 7,200
500 18,600
70,000 1,500 3,000 3,400 4,300
13,000 2,000
97,200
1,800 99,000
6,900 1,600 8,500
1,800
1,700 500
2,200
900 190
1,090
5,090
354,190 1 Estimates discontinued in 2007.

Crop Production 2008 Summary Agricultural Statistics Board January 2009 45 NASS, USDA
Tobacco: Yield and Production by Class, Type, State, and United States, 2006-2008
Yield Production Class and Type
2006 2007 2008 2006 2007 2008
Pounds Pounds Pounds 1,000 Pounds 1,000 Pounds 1,000 Pounds
Class 1, Flue-cured (11-14) FL 1 GA NC SC VA US Class 2, Fire-cured (21-23) KY TN VA US Class 3, Air-cured Class 3A, Light Air-cured Type 31, Burley KY MO NC OH PA TN VA US Type 32, Southern MD Belt PA Total Light Air-cured (31-32) Class 3B, Dark Air-cured (35-37) KY TN US Class 4, Cigar Filler Type 41, PA Seedleaf PA Class 5, Cigar Binder Type 51, CT Valley Broadleaf CT MA US Class 6, Cigar Wrapper Type 61, CT Valley Shade-grown CT MA US All Cigar Types Total 41-61 All Tobacco
2,600 1,770 2,090 2,100 2,470 2,098
3,500 3,200 2,090 3,324
2,100 2,250 1,700 2,000 2,200 2,200 2,000 2,100
1,900 2,098
3,100 2,750 3,059
2,000
1,760 1,610 1,705
1,140 1,310 1,172
1,670
2,147
2,150 2,270 2,250 2,280 2,259
3,000 2,600 1,920 2,801
2,100 2,330 1,650 2,050 2,350 1,600 1,970 2,033
2,200 2,035
2,700 2,200 2,622
2,300
1,850 1,780 1,824
1,510 1,450 1,499
1,901
2,213
2,100 2,250 2,100 2,410 2,239
3,500 3,200 2,000 3,344
2,100 2,240 1,700 2,050 2,300 1,900 2,000 2,068
2,100 2,069
3,000 2,900 2,981
2,200
1,650 1,500 1,616
1,350 1,300 1,341
1,764
2,260
2,860
30,090 323,950 48,300 41,990
447,190
21,700 16,960
732 39,392
153,300 3,375 6,630 7,000
12,100 30,800
4,600 217,805
2,090
219,895
11,780 1,375
13,155
2,600
2,904 1,530 4,434
969 262
1,231
8,265
727,897
39,775 376,820 46,125 41,040
503,760
24,000 16,120
768 40,888
161,700 3,728 6,600 7,175
11,750 20,800
4,334 216,087
2,420
218,507
11,340 1,716
13,056
4,140
3,515 1,958 5,473
1,510 319
1,829
11,442
787,653
33,600 384,750 39,900 40,970
499,220
38,150 23,040
1,000 62,190
147,000 3,360 5,100 6,970 9,890
24,700 4,000
201,020
3,780 204,800
20,700 4,640
25,340
3,960
2,805 750
3,555
1,215 247
1,462
8,977
800,527 1 Estimates discontinued in 2007.
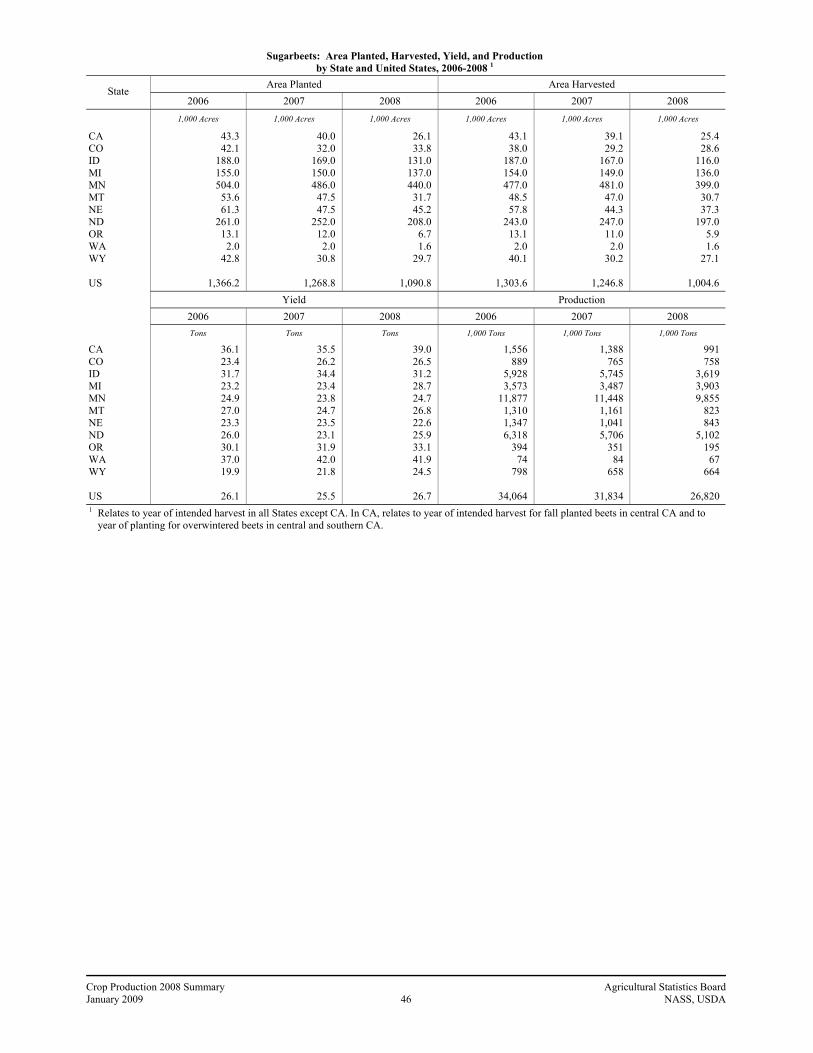
Crop Production 2008 Summary Agricultural Statistics Board January 2009 46 NASS, USDA
Sugarbeets: Area Planted, Harvested, Yield, and Production by State and United States, 2006-2008 1
Area Planted Area Harvested State
2006 2007 2008 2006 2007 2008
1,000 Acres 1,000 Acres 1,000 Acres 1,000 Acres 1,000 Acres 1,000 Acres
CA CO ID MI MN MT NE ND OR WA WY US
43.3 42.1
188.0 155.0 504.0
53.6 61.3
261.0 13.1
2.0 42.8
1,366.2
40.0 32.0
169.0 150.0 486.0
47.5 47.5
252.0 12.0
2.0 30.8
1,268.8
26.1 33.8
131.0 137.0 440.0
31.7 45.2
208.0 6.7 1.6
29.7
1,090.8
43.1 38.0
187.0 154.0 477.0
48.5 57.8
243.0 13.1
2.0 40.1
1,303.6
39.1 29.2
167.0 149.0 481.0
47.0 44.3
247.0 11.0
2.0 30.2
1,246.8
25.4 28.6
116.0 136.0 399.0
30.7 37.3
197.0 5.9 1.6
27.1
1,004.6 Yield Production
2006 2007 2008 2006 2007 2008
Tons Tons Tons 1,000 Tons 1,000 Tons 1,000 Tons
CA CO ID MI MN MT NE ND OR WA WY US
36.1 23.4 31.7 23.2 24.9 27.0 23.3 26.0 30.1 37.0 19.9
26.1
35.5 26.2 34.4 23.4 23.8 24.7 23.5 23.1 31.9 42.0 21.8
25.5
39.0 26.5 31.2 28.7 24.7 26.8 22.6 25.9 33.1 41.9 24.5
26.7
1,556 889
5,928 3,573
11,877 1,310 1,347 6,318
394 74
798
34,064
1,388 765
5,745 3,487
11,448 1,161 1,041 5,706
351 84
658
31,834
991 758
3,619 3,903 9,855
823 843
5,102 195
67 664
26,820
1 Relates to year of intended harvest in all States except CA. In CA, relates to year of intended harvest for fall planted beets in central CA and to year of planting for overwintered beets in central and southern CA.
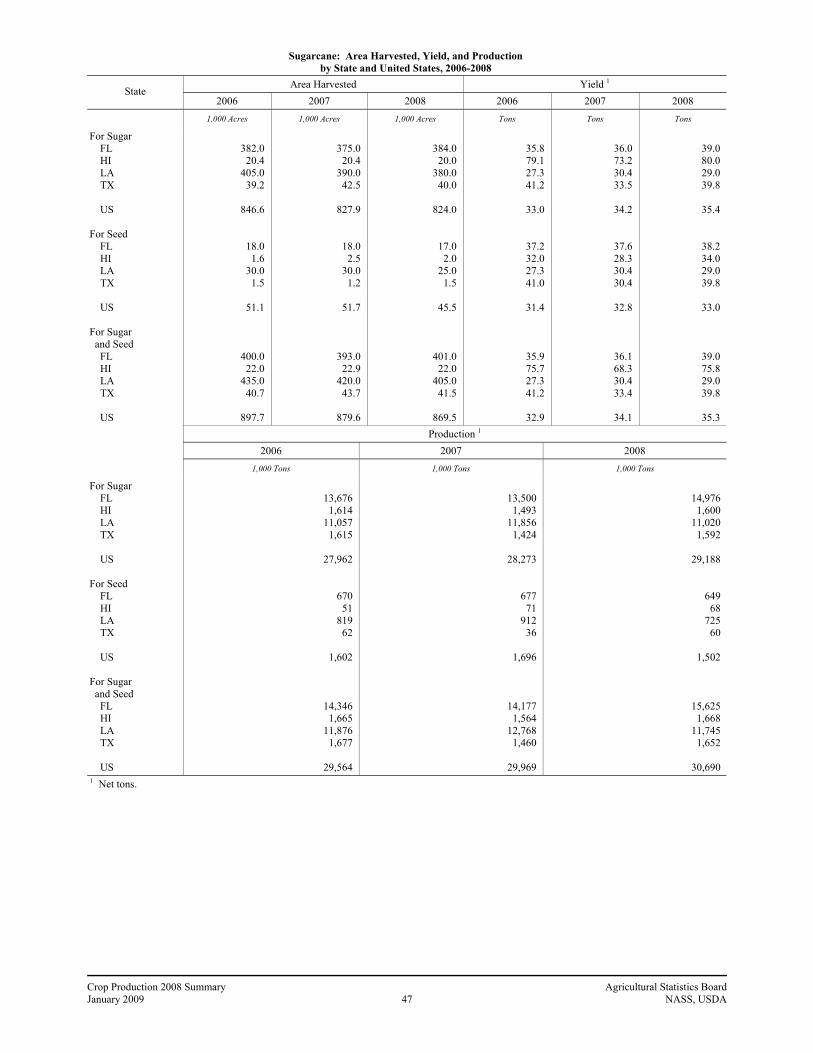
Crop Production 2008 Summary Agricultural Statistics Board January 2009 47 NASS, USDA
Sugarcane: Area Harvested, Yield, and Production by State and United States, 2006-2008
Area Harvested Yield 1 State
2006 2007 2008 2006 2007 2008
1,000 Acres 1,000 Acres 1,000 Acres Tons Tons Tons
For Sugar FL HI LA TX US For Seed FL HI LA TX US For Sugar and Seed FL HI LA TX US
382.0
20.4 405.0
39.2
846.6
18.0 1.6
30.0 1.5
51.1
400.0 22.0
435.0 40.7
897.7
375.0
20.4 390.0
42.5
827.9
18.0 2.5
30.0 1.2
51.7
393.0 22.9
420.0 43.7
879.6
384.0
20.0 380.0
40.0
824.0
17.0 2.0
25.0 1.5
45.5
401.0 22.0
405.0 41.5
869.5
35.8 79.1 27.3 41.2
33.0
37.2 32.0 27.3 41.0
31.4
35.9 75.7 27.3 41.2
32.9
36.0 73.2 30.4 33.5
34.2
37.6 28.3 30.4 30.4
32.8
36.1 68.3 30.4 33.4
34.1
39.0 80.0 29.0 39.8
35.4
38.2 34.0 29.0 39.8
33.0
39.0 75.8 29.0 39.8
35.3
Production 1
2006 2007 2008
1,000 Tons 1,000 Tons 1,000 Tons
For Sugar FL HI LA TX US For Seed FL HI LA TX US For Sugar and Seed FL HI LA TX US
13,676
1,614 11,057
1,615
27,962
670 51
819 62
1,602
14,346 1,665
11,876 1,677
29,564
13,500
1,493 11,856
1,424
28,273
677 71
912 36
1,696
14,177 1,564
12,768 1,460
29,969
14,976
1,600 11,020
1,592
29,188
649 68
725 60
1,502
15,625 1,668
11,745 1,652
30,690
1 Net tons.

Crop Production 2008 Summary Agricultural Statistics Board January 2009 48 NASS, USDA
Dry Edible Beans: Area Planted and Harvested by Commercial Class, State, and Total, 2006-2008 1 Area Planted Area Harvested Class
and State 2006 2007 2008 2006 2007 2008
1,000 Acres 1,000 Acres 1,000 Acres 1,000 Acres 1,000 Acres 1,000 Acres
Large Lima - CA Baby Lima - CA Navy ID MI MN NE ND OR SD WA WY Total Great Northern ID MI NE ND WY Total Small White ID OR WA Total Pinto CO ID KS MI MN MT NE NM ND OR SD UT WA WY Total
12.9
13.5
5.2 80.0 62.0
3.1 120.0
0.8 7.5 0.6 1.5
280.7
2.7 0.5
58.0 7.5 1.0
69.7
1.2 0.4 0.5
2.1
53.0 26.0 11.0
5.0 16.0 10.7 64.3
8.2 453.0
1.0 2.4 3.0 6.3
25.0
684.9
13.9
16.0
3.3 61.0 56.0
96.0
0.6 4.0
1.0
221.9
2.0
48.0 8.0 1.5
59.5
0.4
0.4
37.0 25.0
6.5 4.0
22.0 8.5
48.0 7.6
502.0 0.4 1.9 1.5 8.3
21.5
694.2
15.5
11.7
3.2 62.0 58.0
123.0
3.4
1.0
250.6
2.6
64.3 6.7 2.5
76.1
36.0 20.5
5.4 1.8
15.7 8.6
51.2 8.5
446.0 0.7 1.7 1.2 7.0
25.0
629.3
12.5
13.0
5.1 77.5 56.4
2.7 113.0
0.8 6.4 0.6 1.4
263.9
2.6 0.5
49.0 6.5 0.7
59.3
1.2 0.4 0.5
2.1
45.0 25.5 10.0
4.9 15.3 10.5 59.5
8.2 435.0
0.9 2.1 0.5 6.2
24.0
647.6
13.8
15.6
3.3 59.5 54.0
89.0
0.6 3.9
0.9
211.2
2.0
45.9 7.7 1.4
57.0
0.4
0.4
36.0 24.7
6.0 3.9
21.0 8.4
47.4 7.6
487.0 0.4 1.9 1.3 8.3
20.8
674.7
15.5
11.7
3.2 60.5 56.2
118.0
3.3
0.9
242.1
2.5
59.7 6.5 2.4
71.1
34.0 20.2
5.0 1.7
15.2 7.2
47.3 8.5
433.0 0.7 1.6 1.2 7.0
24.3
606.9 1 Missing data are included in "Other" class to avoid disclosure of individual operations or no data were reported.

Crop Production 2008 Summary Agricultural Statistics Board January 2009 49 NASS, USDA
Dry Edible Beans: Yield and Production by Commercial Class, State, and Total, 2006-2008 1
Yield per Acre 2 Production 2 Class and
State 2006 2007 2008 2006 2007 2008
Pounds Pounds Pounds 1,000 Cwt 1,000 Cwt 1,000 Cwt
Large Lima - CA Baby Lima - CA Navy ID MI MN NE ND OR SD WA WY Total Great Northern ID MI NE ND WY Total Small White ID OR WA Total Pinto CO ID KS MI MN MT NE NM ND OR SD UT WA WY Total
1,910
2,340
2,470 1,960 1,650 2,000 1,400 1,650 1,200 2,170 2,500
1,649
2,420 2,000 2,100 1,080 2,430
2,007
2,330 1,990 2,000
2,190
1,900 2,500 2,100 1,900 1,500 2,230 2,290 2,400 1,150 2,250 1,900
350 2,310 2,130
1,471
2,140
2,420
2,670 1,660 1,850
1,840 2,200 2,200
2,220
1,814
2,450
2,160 1,470 2,360
2,081
2,500
2,500
1,560 2,510 2,300 1,490 1,750 2,280 2,390 2,300 1,590 2,500 2,600
400 2,770 2,310
1,746
2,050
2,040
2,470 1,920 2,000
1,770
2,100
2,330
1,876
2,360
2,290 1,690 2,500
2,248
1,460 2,300 2,100 1,880 1,800 2,420 2,270 2,300 1,540 2,100 2,500
550 2,290 2,300
1,690
239
304
126 1,520
930 54
1,585 13 77 13 35
4,353
63 10
1,030 70 17
1,190
28 8
10
46
855 638 210
93 230 234
1,363 197
4,988 20 40
2 143 510
9,523
302
377
88 990 999
1,636
13 86
20
3,832
49
991 113
33
1,186
10
10
562 620 138
58 367 192
1,132 175
7,760 10 49
5 230 480
11,778
317
239
79 1,162 1,124
2,087
69
21
4,542
59
1,369 110
60
1,598
496 465 105
32 274 174
1,075 196
6,660 15 40
7 160 558
10,257
1 Missing data are included in "Other" class to avoid disclosure of individual operations or no data were reported. 2 Clean basis.
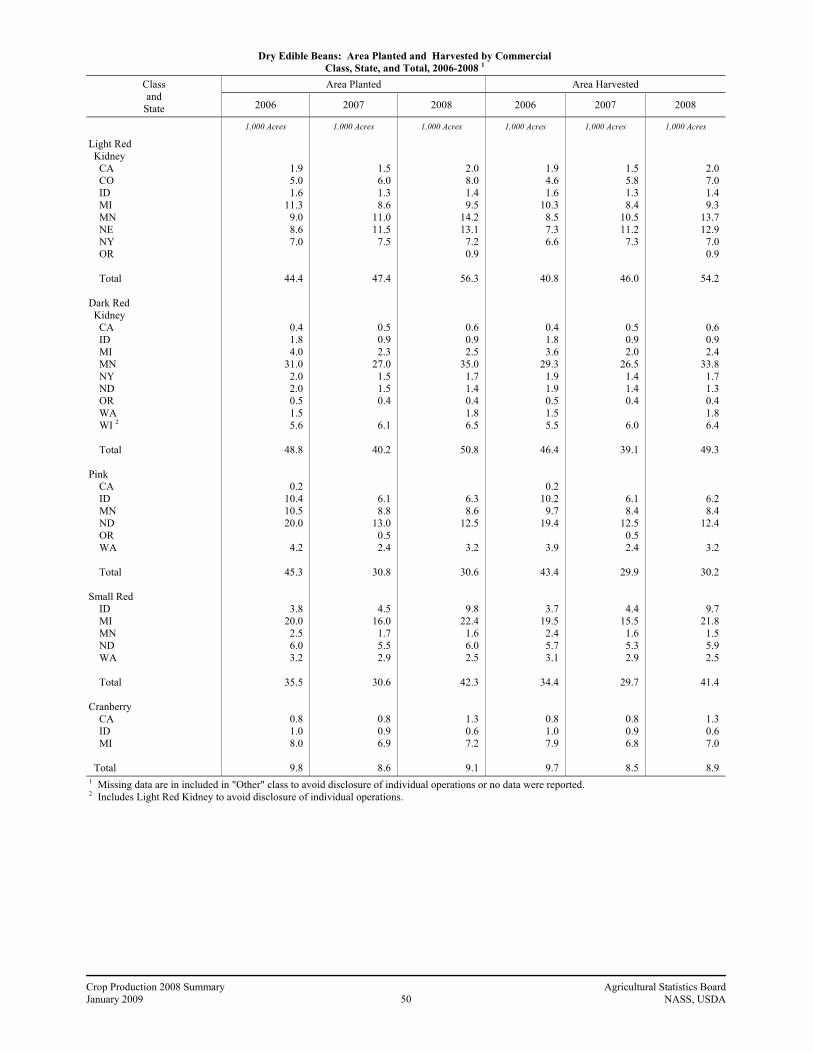
Crop Production 2008 Summary Agricultural Statistics Board January 2009 50 NASS, USDA
Dry Edible Beans: Area Planted and Harvested by Commercial Class, State, and Total, 2006-2008 1 Area Planted Area Harvested Class
and State 2006 2007 2008 2006 2007 2008
1,000 Acres 1,000 Acres 1,000 Acres 1,000 Acres 1,000 Acres 1,000 Acres
Light Red Kidney CA CO ID MI MN NE NY OR Total Dark Red Kidney CA ID MI MN NY ND OR WA WI 2 Total Pink CA ID MN ND OR WA Total Small Red ID MI MN ND WA Total Cranberry CA ID MI Total
1.9 5.0 1.6
11.3 9.0 8.6 7.0
44.4
0.4 1.8 4.0
31.0 2.0 2.0 0.5 1.5 5.6
48.8
0.2 10.4 10.5 20.0
4.2
45.3
3.8 20.0
2.5 6.0 3.2
35.5
0.8 1.0 8.0
9.8
1.5 6.0 1.3 8.6
11.0 11.5
7.5
47.4
0.5 0.9 2.3
27.0 1.5 1.5 0.4
6.1
40.2
6.1 8.8
13.0 0.5 2.4
30.8
4.5 16.0
1.7 5.5 2.9
30.6
0.8 0.9 6.9
8.6
2.0 8.0 1.4 9.5
14.2 13.1
7.2 0.9
56.3
0.6 0.9 2.5
35.0 1.7 1.4 0.4 1.8 6.5
50.8
6.3 8.6
12.5
3.2
30.6
9.8 22.4
1.6 6.0 2.5
42.3
1.3 0.6 7.2
9.1
1.9 4.6 1.6
10.3 8.5 7.3 6.6
40.8
0.4 1.8 3.6
29.3 1.9 1.9 0.5 1.5 5.5
46.4
0.2 10.2
9.7 19.4
3.9
43.4
3.7 19.5
2.4 5.7 3.1
34.4
0.8 1.0 7.9
9.7
1.5 5.8 1.3 8.4
10.5 11.2
7.3
46.0
0.5 0.9 2.0
26.5 1.4 1.4 0.4
6.0
39.1
6.1 8.4
12.5 0.5 2.4
29.9
4.4 15.5
1.6 5.3 2.9
29.7
0.8 0.9 6.8
8.5
2.0 7.0 1.4 9.3
13.7 12.9
7.0 0.9
54.2
0.6 0.9 2.4
33.8 1.7 1.3 0.4 1.8 6.4
49.3
6.2 8.4
12.4
3.2
30.2
9.7 21.8
1.5 5.9 2.5
41.4
1.3 0.6 7.0
8.9
1 Missing data are in included in "Other" class to avoid disclosure of individual operations or no data were reported. 2 Includes Light Red Kidney to avoid disclosure of individual operations.

Crop Production 2008 Summary Agricultural Statistics Board January 2009 51 NASS, USDA
Dry Edible Beans: Yield and Production by Commercial Class, State, and Total, 2006-2008 1
Yield per Acre 2 Production 2 Class and
State 2006 2007 2008 2006 2007 2008
Pounds Pounds Pounds 1,000 Cwt 1,000 Cwt 1,000 Cwt
Light Red Kidney CA CO ID MI MN NE NY OR Total Dark Red Kidney CA ID MI MN NY ND OR WA WI 3 Total Pink CA ID MN ND OR WA Total Small Red ID MI MN ND WA Total Cranberry CA ID MI Total
1,470 1,800 1,880 1,700 2,150 2,400 1,450
1,887
2,250 1,940 1,170 1,850
840 1,630 2,200 2,000 1,960
1,776
1,500 2,400 1,200 1,430
2,310
1,684
2,460 2,000 1,330 1,190 2,190
1,887
1,880 1,900 1,460
1,536
1,470 2,190 2,150 1,180 1,900 2,170 1,300
1,767
1,000 1,780
900 1,800 1,570 1,790 2,030
1,530
1,696
2,390 1,600 1,870 2,230 2,210
1,933
2,360 1,630 1,810 1,430 2,590
1,808
2,250 2,000 1,290
1,459
1,300 1,660 2,360 1,260 2,000 2,300 2,010 2,100
1,887
1,330 1,890 1,210 2,100 2,290 1,540 2,100 1,390 2,130
2,012
2,260 1,700 1,700
1,970
1,844
2,220 1,950 1,950 1,440 2,480
1,971
1,620 2,000 1,540
1,584
28 83 30
175 183 175
96
770
9 35 42
542 16 31 11 30
108
824
3 245 116 277
90
731
91 390
32 68 68
649
15 19
115
149
22 127
28 99
199 243
95
813
5 16 18
477 22 25
8
92
663
146 134 234
11 53
578
104 253
29 76 75
537
18 18 88
124
26 116
33 117 274 297 141
19
1,023
8 17 29
710 39 20
8 25
136
992
140 143 211
63
557
215 425
29 85 62
816
21 12
108
141 1 Missing data are included in "Other" class to avoid disclosure of individual operations or no data were reported. 2 Clean basis. 3 Includes Light Red Kidney to avoid disclosure of individual operations.

Crop Production 2008 Summary Agricultural Statistics Board January 2009 52 NASS, USDA
Dry Edible Beans: Area Planted and Harvested by Commercial Class, State, and Total, 2006-2008 1
Area Planted Area Harvested Class and
State 2006 2007 2008 2006 2007 2008
1,000 Acres 1,000 Acres 1,000 Acres 1,000 Acres 1,000 Acres 1,000 Acres
Black CA ID MI MN NE NY ND OR WA Total Blackeye CA TX Total Small Chickpeas 2 ID MT ND SD WA Total Large Chickpeas 2 CA ID MT NE ND OR SD WA Total
0.6 2.8
91.6 12.3
2.9 9.0
46.0
2.2
167.4
12.6 18.8
31.4
4.0 2.4 7.5
3.5
17.4
16.0 40.0
6.4 1.1 5.5 3.5 9.4
37.5
119.4
0.4 2.4
96.5 22.0
7.0
45.0 0.5 1.9
175.7
12.5 15.3
27.8
3.5 1.6 4.5
1.5
11.1
6.5 38.0
8.2
12.5 3.2 5.7
40.0
114.1
1.7 91.0 12.6
3.1 7.4
53.5 0.6 2.0
171.9
7.1 22.2
29.3
4.3 0.9 4.0 0.9
10.1
6.4 26.7
1.7
5.3 0.7 1.5
29.5
71.8
0.6 2.8
86.6 11.8
2.7 8.6
44.0
2.2
159.3
12.5 16.9
29.4
3.9 1.9 7.0
3.5
16.3
15.3 39.3
6.2 1.0 5.2 3.5 8.6
37.5
116.6
0.4 2.3
94.5 21.6
6.9
43.5 0.5 1.9
171.6
12.5 14.6
27.1
3.4 1.5 4.4
1.5
10.8
6.0 37.6
6.7
12.4 3.2 4.6
40.0
110.5
1.7 89.0 12.2
3.0 7.4
53.0 0.6 2.0
168.9
7.1 20.2
27.3
4.2 0.9 3.3 0.9
9.3
6.3 26.4
1.7
5.1 0.7 1.5
29.5
71.2 1 Missing data are included in "Other" class to avoid disclosure of individual operations or no data were reported. 2 Garbanzo beans. Small chickpeas smaller than 20/64 in. and large chickpeas larger than 20/64 in.

Crop Production 2008 Summary Agricultural Statistics Board January 2009 53 NASS, USDA
Dry Edible Beans: Yield and Production by Commercial Class, State, and Total, 2006-2008 1
Yield per Acre 2 Production 2 Class and
State 2006 2007 2008 2006 2007 2008
Pounds Pounds Pounds 1,000 Cwt 1,000 Cwt 1,000 Cwt
Black CA ID MI MN NE NY ND OR WA Total Blackeye CA TX Total Small Chickpeas 3 ID MT ND SD WA Total Large Chickpeas 3 CA ID MT NE ND OR SD WA Total
1,670 2,320 1,930 1,400 2,110 1,600 1,180
2,180
1,678
2,420 1,360
1,813
1,130 800 690
1,200
914
1,290 1,100
900 900
1,210 1,830
850 1,320
1,192
2,000 2,000 1,630 1,750
1,650 1,500 2,320 2,790
1,633
2,150 1,560
1,834
970 960
1,410
1,330
1,194
1,900 1,060 1,080
1,500 1,600
950 1,300
1,254
2,240 1,900 1,650 2,300 1,800 1,380 2,300 2,300
1,731
1,760 1,330
1,443
1,070 1,350 1,330
900
1,172
1,840 1,200
320
1,470 1,300 1,400 1,510
1,389
10 65
1,670 165
57 138 520
48
2,673
303 230
533
44 15 48
42
149
198 432
56 9
63 64 73
495
1,390
8
46 1,540
378
114 652
12 53
2,803
269 228
497
33 14 62
20
129
114 399
72
186 51 44
520
1,386
38 1,691
201 69
133 731
14 46
2,923
125 269
394
45 12 44
8
109
116 317
5
75 9
21 446
989
1 Missing data are included in "Other" class to avoid disclosure of individual operations or no data were reported. 2 Clean basis. 3 Garbanzo beans. Small chickpeas smaller than 20/64 in. and large chickpeas larger than 20/64 in.
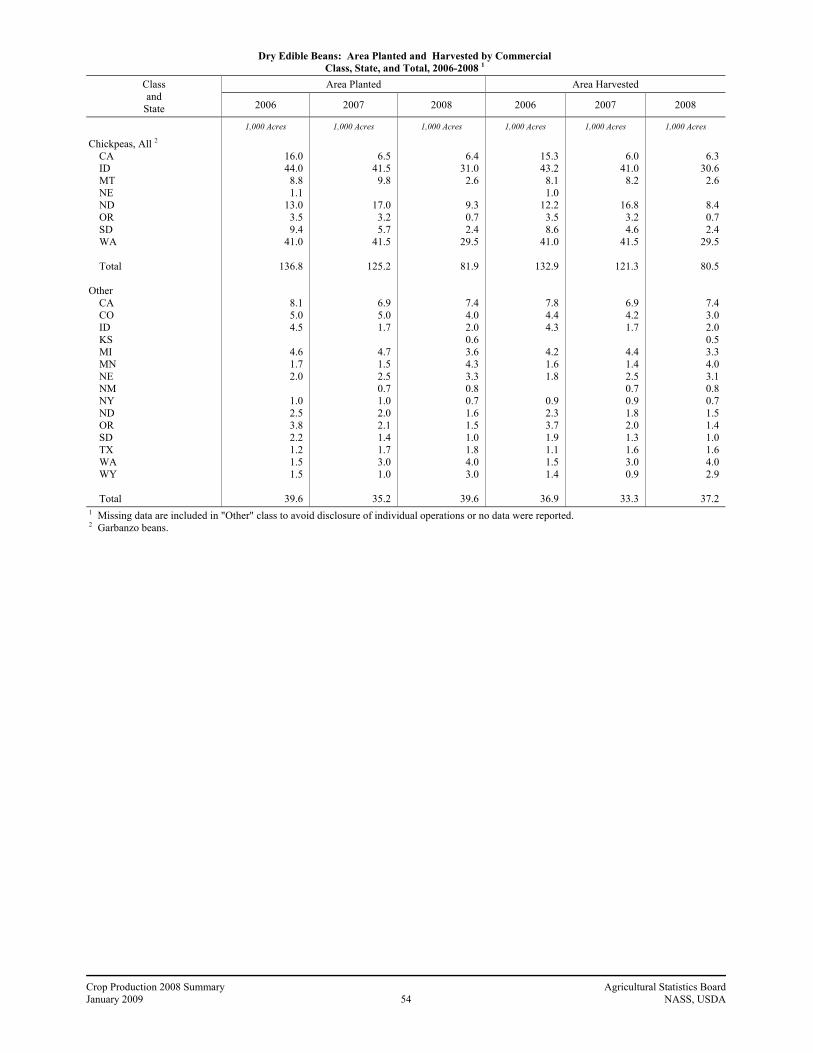
Crop Production 2008 Summary Agricultural Statistics Board January 2009 54 NASS, USDA
Dry Edible Beans: Area Planted and Harvested by Commercial Class, State, and Total, 2006-2008 1 Area Planted Area Harvested Class
and State 2006 2007 2008 2006 2007 2008
1,000 Acres 1,000 Acres 1,000 Acres 1,000 Acres 1,000 Acres 1,000 Acres
Chickpeas, All 2 CA ID MT NE ND OR SD WA Total Other CA CO ID KS MI MN NE NM NY ND OR SD TX WA WY Total
16.0 44.0
8.8 1.1
13.0 3.5 9.4
41.0
136.8
8.1 5.0 4.5
4.6 1.7 2.0
1.0 2.5 3.8 2.2 1.2 1.5 1.5
39.6
6.5
41.5 9.8
17.0
3.2 5.7
41.5
125.2
6.9 5.0 1.7
4.7 1.5 2.5 0.7 1.0 2.0 2.1 1.4 1.7 3.0 1.0
35.2
6.4
31.0 2.6
9.3 0.7 2.4
29.5
81.9
7.4 4.0 2.0 0.6 3.6 4.3 3.3 0.8 0.7 1.6 1.5 1.0 1.8 4.0 3.0
39.6
15.3 43.2
8.1 1.0
12.2 3.5 8.6
41.0
132.9
7.8 4.4 4.3
4.2 1.6 1.8
0.9 2.3 3.7 1.9 1.1 1.5 1.4
36.9
6.0
41.0 8.2
16.8
3.2 4.6
41.5
121.3
6.9 4.2 1.7
4.4 1.4 2.5 0.7 0.9 1.8 2.0 1.3 1.6 3.0 0.9
33.3
6.3
30.6 2.6
8.4 0.7 2.4
29.5
80.5
7.4 3.0 2.0 0.5 3.3 4.0 3.1 0.8 0.7 1.5 1.4 1.0 1.6 4.0 2.9
37.2
1 Missing data are included in "Other" class to avoid disclosure of individual operations or no data were reported. 2 Garbanzo beans.

Crop Production 2008 Summary Agricultural Statistics Board January 2009 55 NASS, USDA
Dry Edible Beans: Yield and Production by Commercial Class, State, and Total, 2006-2008 1
Yield per Acre 2 Production 2 Class and
State 2006 2007 2008 2006 2007 2008
Pounds Pounds Pounds 1,000 Cwt 1,000 Cwt 1,000 Cwt
Chickpeas, All 3 CA ID MT NE ND OR SD WA Total Other CA CO ID KS MI MN NE NM NY ND OR SD TX WA WY Total
1,290 1,100
880 900 910
1,830 850
1,310
1,158
1,280 2,000 2,090
1,670 1,880 2,220
1,220 1,300 2,000 1,800
690 1,935 2,000
1,713
1,900 1,050 1,050
1,480 1,600
950 1,300
1,249
1,410 1,120 2,650
1,680 1,930 2,080
880 1,890 1,610 2,200 2,100
940 2,300 2,440
1,715
1,840 1,180
650
1,420 1,290 1,210 1,510
1,364
1,460 1,600 2,100 2,100 1,300 1,830 2,420 2,250 1,570 1,670 2,080 1,500
875 2,075 2,280
1,777
198 476
71 9
111 64 73
537
1,539
100 88 90
70 30 40
11 30 74 34
8 29 28
632
114 432
86
248 51 44
540
1,515
97 47 45
74 27 52
6 17 29 44 27 15 69 22
571
116 362
17
119 9
29 446
1,098
108 48 42 11 43 73 75 18 11 25 29 15 14 83 66
661
1 Missing data are included in "Other" class to avoid disclosure of individual operations or no data were reported. 2 Clean Basis. 3 Garbanzo beans.
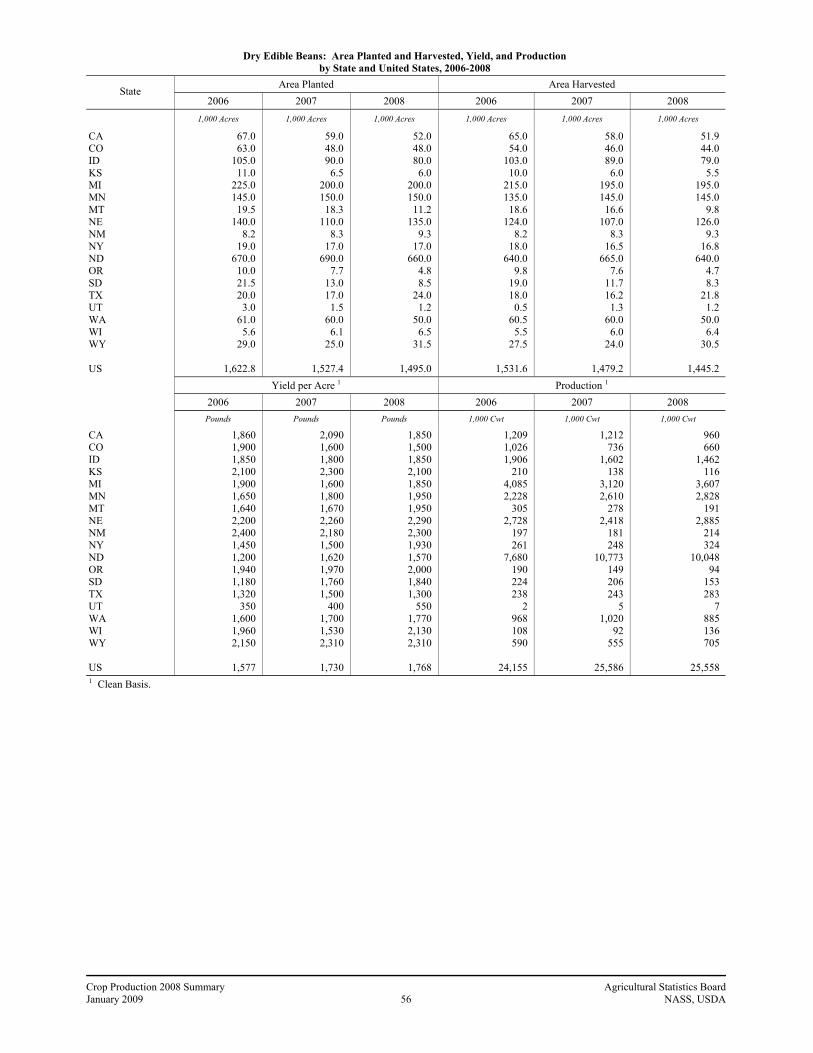
Crop Production 2008 Summary Agricultural Statistics Board January 2009 56 NASS, USDA
Dry Edible Beans: Area Planted and Harvested, Yield, and Production by State and United States, 2006-2008
Area Planted Area Harvested State
2006 2007 2008 2006 2007 2008
1,000 Acres 1,000 Acres 1,000 Acres 1,000 Acres 1,000 Acres 1,000 Acres
CA CO ID KS MI MN MT NE NM NY ND OR SD TX UT WA WI WY US
67.0 63.0
105.0 11.0
225.0 145.0
19.5 140.0
8.2 19.0
670.0 10.0 21.5 20.0
3.0 61.0
5.6 29.0
1,622.8
59.0 48.0 90.0
6.5 200.0 150.0
18.3 110.0
8.3 17.0
690.0 7.7
13.0 17.0
1.5 60.0
6.1 25.0
1,527.4
52.0 48.0 80.0
6.0 200.0 150.0
11.2 135.0
9.3 17.0
660.0 4.8 8.5
24.0 1.2
50.0 6.5
31.5
1,495.0
65.0 54.0
103.0 10.0
215.0 135.0
18.6 124.0
8.2 18.0
640.0 9.8
19.0 18.0
0.5 60.5
5.5 27.5
1,531.6
58.0 46.0 89.0
6.0 195.0 145.0
16.6 107.0
8.3 16.5
665.0 7.6
11.7 16.2
1.3 60.0
6.0 24.0
1,479.2
51.9 44.0 79.0
5.5 195.0 145.0
9.8 126.0
9.3 16.8
640.0 4.7 8.3
21.8 1.2
50.0 6.4
30.5
1,445.2 Yield per Acre 1 Production 1
2006 2007 2008 2006 2007 2008
Pounds Pounds Pounds 1,000 Cwt 1,000 Cwt 1,000 Cwt
CA CO ID KS MI MN MT NE NM NY ND OR SD TX UT WA WI WY US
1,860 1,900 1,850 2,100 1,900 1,650 1,640 2,200 2,400 1,450 1,200 1,940 1,180 1,320
350 1,600 1,960 2,150
1,577
2,090 1,600 1,800 2,300 1,600 1,800 1,670 2,260 2,180 1,500 1,620 1,970 1,760 1,500
400 1,700 1,530 2,310
1,730
1,850 1,500 1,850 2,100 1,850 1,950 1,950 2,290 2,300 1,930 1,570 2,000 1,840 1,300
550 1,770 2,130 2,310
1,768
1,209 1,026 1,906
210 4,085 2,228
305 2,728
197 261
7,680 190 224 238
2 968 108 590
24,155
1,212 736
1,602 138
3,120 2,610
278 2,418
181 248
10,773 149 206 243
5 1,020
92 555
25,586
960 660
1,462 116
3,607 2,828
191 2,885
214 324
10,048 94
153 283
7 885 136 705
25,558
1 Clean Basis.
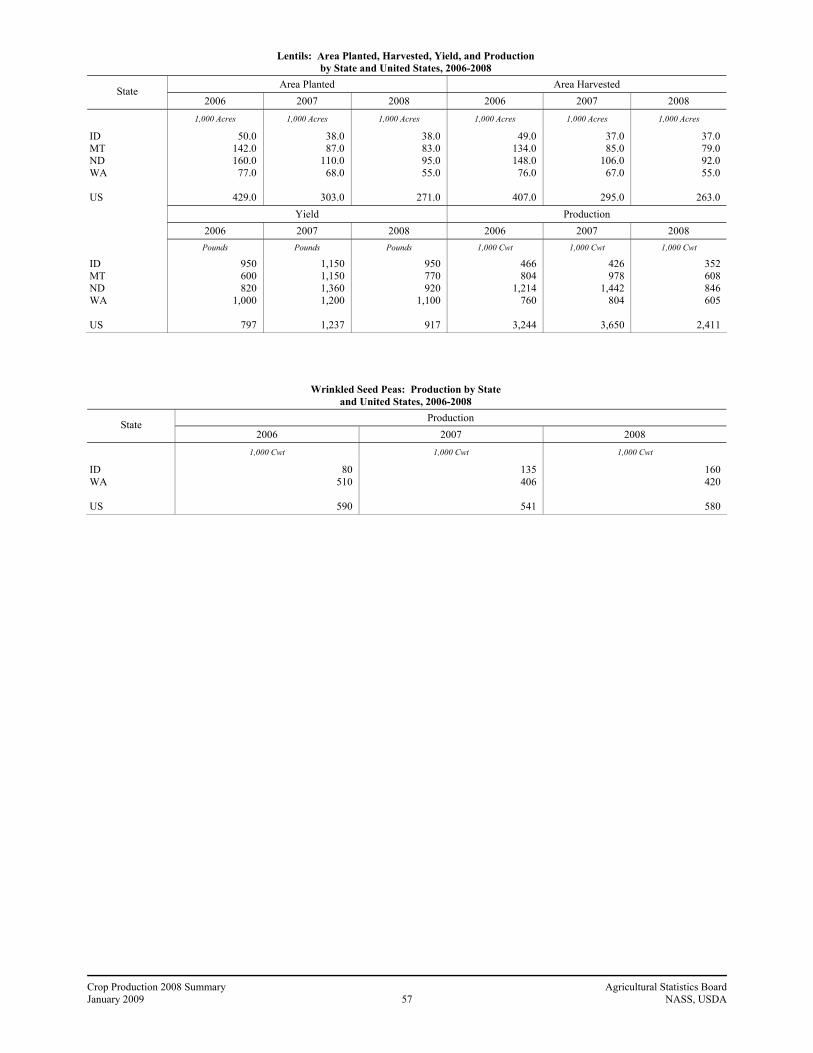
Crop Production 2008 Summary Agricultural Statistics Board January 2009 57 NASS, USDA
Lentils: Area Planted, Harvested, Yield, and Production by State and United States, 2006-2008
Area Planted Area Harvested State
2006 2007 2008 2006 2007 2008
1,000 Acres 1,000 Acres 1,000 Acres 1,000 Acres 1,000 Acres 1,000 Acres
ID MT ND WA US
50.0 142.0 160.0
77.0
429.0
38.0 87.0
110.0 68.0
303.0
38.0 83.0 95.0 55.0
271.0
49.0 134.0 148.0
76.0
407.0
37.0 85.0
106.0 67.0
295.0
37.0 79.0 92.0 55.0
263.0
Yield Production
2006 2007 2008 2006 2007 2008 Pounds Pounds Pounds 1,000 Cwt 1,000 Cwt 1,000 Cwt
ID MT ND WA US
950 600 820
1,000
797
1,150 1,150 1,360 1,200
1,237
950 770 920
1,100
917
466 804
1,214 760
3,244
426 978
1,442 804
3,650
352 608 846 605
2,411
Wrinkled Seed Peas: Production by State and United States, 2006-2008
Production State
2006 2007 2008
1,000 Cwt 1,000 Cwt 1,000 Cwt
ID WA US
80 510
590
135 406
541
160 420
580
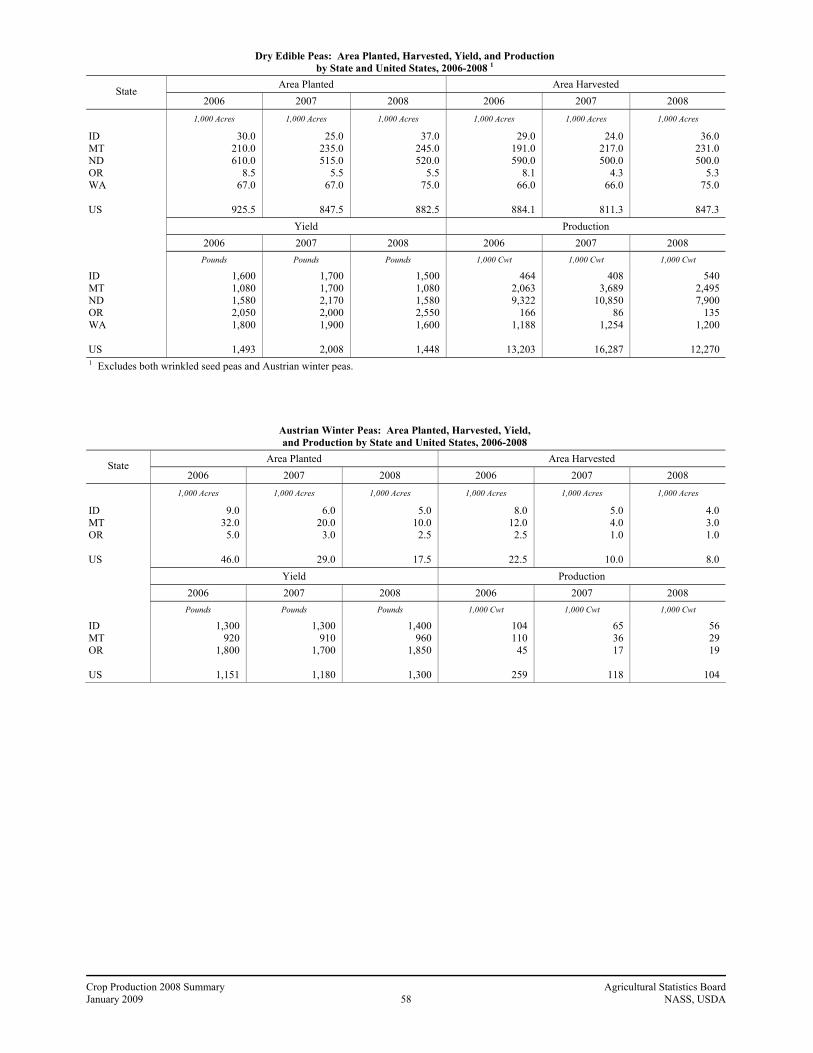
Crop Production 2008 Summary Agricultural Statistics Board January 2009 58 NASS, USDA
Dry Edible Peas: Area Planted, Harvested, Yield, and Production by State and United States, 2006-2008 1
Area Planted Area Harvested State
2006 2007 2008 2006 2007 2008
1,000 Acres 1,000 Acres 1,000 Acres 1,000 Acres 1,000 Acres 1,000 Acres
ID MT ND OR WA US
30.0 210.0 610.0
8.5 67.0
925.5
25.0 235.0 515.0
5.5 67.0
847.5
37.0 245.0 520.0
5.5 75.0
882.5
29.0 191.0 590.0
8.1 66.0
884.1
24.0 217.0 500.0
4.3 66.0
811.3
36.0 231.0 500.0
5.3 75.0
847.3
Yield Production
2006 2007 2008 2006 2007 2008 Pounds Pounds Pounds 1,000 Cwt 1,000 Cwt 1,000 Cwt
ID MT ND OR WA US
1,600 1,080 1,580 2,050 1,800
1,493
1,700 1,700 2,170 2,000 1,900
2,008
1,500 1,080 1,580 2,550 1,600
1,448
464 2,063 9,322
166 1,188
13,203
408 3,689
10,850 86
1,254
16,287
540 2,495 7,900
135 1,200
12,270
1 Excludes both wrinkled seed peas and Austrian winter peas.
Austrian Winter Peas: Area Planted, Harvested, Yield, and Production by State and United States, 2006-2008
Area Planted Area Harvested State
2006 2007 2008 2006 2007 2008
1,000 Acres 1,000 Acres 1,000 Acres 1,000 Acres 1,000 Acres 1,000 Acres
ID MT OR US
9.0 32.0
5.0
46.0
6.0 20.0
3.0
29.0
5.0 10.0
2.5
17.5
8.0 12.0
2.5
22.5
5.0 4.0 1.0
10.0
4.0 3.0 1.0
8.0
Yield Production
2006 2007 2008 2006 2007 2008 Pounds Pounds Pounds 1,000 Cwt 1,000 Cwt 1,000 Cwt
ID MT OR US
1,300 920
1,800
1,151
1,300 910
1,700
1,180
1,400 960
1,850
1,300
104 110
45
259
65 36 17
118
56 29 19
104
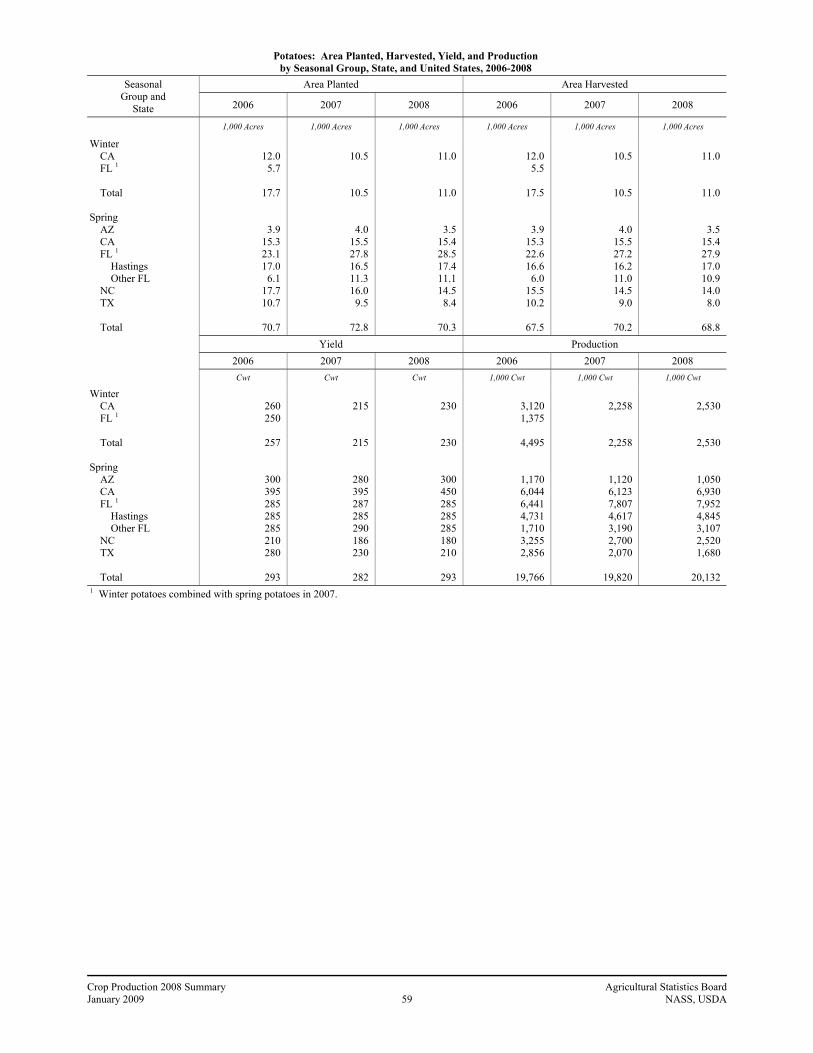
Crop Production 2008 Summary Agricultural Statistics Board January 2009 59 NASS, USDA
Potatoes: Area Planted, Harvested, Yield, and Production by Seasonal Group, State, and United States, 2006-2008
Area Planted Area Harvested Seasonal Group and
State 2006 2007 2008 2006 2007 2008
1,000 Acres 1,000 Acres 1,000 Acres 1,000 Acres 1,000 Acres 1,000 Acres
Winter CA FL 1 Total Spring AZ CA FL 1 Hastings Other FL NC TX Total
12.0
5.7
17.7
3.9 15.3 23.1 17.0
6.1 17.7 10.7
70.7
10.5
10.5
4.0 15.5 27.8 16.5 11.3 16.0
9.5
72.8
11.0
11.0
3.5 15.4 28.5 17.4 11.1 14.5
8.4
70.3
12.0
5.5
17.5
3.9 15.3 22.6 16.6
6.0 15.5 10.2
67.5
10.5
10.5
4.0 15.5 27.2 16.2 11.0 14.5
9.0
70.2
11.0
11.0
3.5 15.4 27.9 17.0 10.9 14.0
8.0
68.8 Yield Production
2006 2007 2008 2006 2007 2008
Cwt Cwt Cwt 1,000 Cwt 1,000 Cwt 1,000 Cwt
Winter CA FL 1 Total Spring AZ CA FL 1 Hastings Other FL NC TX Total
260 250
257
300 395 285 285 285 210 280
293
215
215
280 395 287 285 290 186 230
282
230
230
300 450 285 285 285 180 210
293
3,120 1,375
4,495
1,170 6,044 6,441 4,731 1,710 3,255 2,856
19,766
2,258
2,258
1,120 6,123 7,807 4,617 3,190 2,700 2,070
19,820
2,530
2,530
1,050 6,930 7,952 4,845 3,107 2,520 1,680
20,132
1 Winter potatoes combined with spring potatoes in 2007.

Crop Production 2008 Summary Agricultural Statistics Board January 2009 60 NASS, USDA
Potatoes: Area Planted and Harvested by Seasonal Group, State, and United States, 2006-2008
Area Planted Area Harvested Seasonal Group and
State 2006 2007 2008 2006 2007 2008
1,000 Acres 1,000 Acres 1,000 Acres 1,000 Acres 1,000 Acres 1,000 Acres
Summer AL CA CO DE IL KS MD MO NJ TX VA Total Fall CA CO ID 10 SW Co Other ID ME MA MI MN MT NE NV NM NY ND OH OR Malheur Other OR PA RI WA WI Total US
1.7 3.6 3.7 3.0 6.5 6.0 4.0 7.8 2.5
10.5 6.0
55.3
8.6 59.9
335.0 21.0
314.0 58.5
3.1 43.5 53.0 10.6 19.5
6.6 5.0
20.6 100.0
3.3 35.0
3.5 31.5 11.0
0.5 156.0
66.0
995.7
1,139.4
1.2 4.3 3.0 2.0 6.3 5.0 3.0 6.8 2.4
11.2 5.6
50.8
7.9 59.2
350.0 21.0
329.0 57.1
2.7 42.5 52.0 11.3 21.0
7.3 5.5
19.0 97.0
3.2 36.5
3.0 33.5 10.5
0.6 160.0
64.5
1,007.8
1,141.9
1.3 3.6 4.4 1.7 5.5 5.0 2.5 7.2 2.0 7.0 5.8
46.0
7.8 57.0
305.0 15.0
290.0 56.0
2.8 43.0 50.0 10.9 19.5
5.8 5.9
18.0 82.0
2.5 35.3
2.8 32.5 10.0
0.5 155.0
63.5
930.5
1,057.8
1.6 3.6 3.6 2.1 6.3 5.7 2.9 7.6 2.5 9.7 5.6
51.2
8.6 59.7
334.0 21.0
313.0 57.0
3.1 43.0 50.0 10.5 19.4
6.6 5.0
19.0 98.0
3.1 35.0
3.5 31.5 10.5
0.5 155.0
66.0
984.0
1,120.2
1.1 4.3 2.7 2.0 6.1 4.9 3.0 6.6 2.4 9.8 5.4
48.3
7.9 59.1
349.0 21.0
328.0 56.5
2.6 42.0 49.0 11.2 19.8
7.3 5.4
18.3 91.0
3.0 36.5
3.0 33.5 10.0
0.6 160.0
64.0
993.2
1,122.2
1.2 3.6 4.0 1.7 5.3 4.8 2.5 6.5 2.0 6.5 5.7
43.8
7.8 56.9
304.0 15.0
289.0 54.7
2.4 42.5 48.0 10.5 19.4
5.8 5.9
17.8 81.0
2.1 35.3
2.8 32.5
9.5 0.5
155.0 62.0
921.1
1,044.7

Crop Production 2008 Summary Agricultural Statistics Board January 2009 61 NASS, USDA
Potatoes: Yield and Production by Seasonal Group, State, and United States, 2006-2008
Yield Production Seasonal Group and
State 2006 2007 2008 2006 2007 2008
Cwt Cwt Cwt 1,000 Cwt 1,000 Cwt 1,000 Cwt
Summer AL CA CO DE IL KS MD MO NJ TX VA Total Fall CA CO ID 10 SW Co Other ID ME MA MI MN MT NE NV NM NY ND OH OR Malheur Other OR PA RI WA WI Total US
150 335 360 240 395 320 320 315 240 440 270
337
450 380 386 475 380 305 240 330 425 335 450 445 420 300 260 325 530 435 540 260 260 580 445
406
393
140 360 350 270 400 365 320 300 265 395 210
331
480 355 373 490 365 295 320 350 440 330 415 390 370 285 260 330 556 455 565 220 300 630 440
410
396
170 390 360 250 395 320 300 190 230 420 220
309
505 375 378 525 370 270 270 350 425 330 430 410 390 320 280 325 529 460 535 265 285 600 415
409
395
240
1,206 1,296
504 2,489 1,824
928 2,394
600 4,268 1,512
17,261
3,870 22,686
128,915 9,975
118,940 17,385
744 14,190 21,250
3,518 8,730 2,937 2,100 5,700
25,480 1,008
18,533 1,523
17,010 2,730
130 89,900 29,370
399,176
440,698
154
1,548 945 540
2,440 1,789
960 1,980
636 3,871 1,134
15,997
3,792 20,981
130,010 10,290
119,720 16,668
832 14,700 21,560
3,696 8,217 2,847 1,998 5,216
23,660 990
20,293 1,365
18,928 2,200
180 100,800 28,160
406,800
444,875
204
1,404 1,440
425 2,094 1,536
750 1,235
460 2,730 1,254
13,532
3,939 21,338
114,805 7,875
106,930 14,769
648 14,875 20,400
3,465 8,342 2,378 2,301 5,696
22,680 683
18,676 1,288
17,388 2,518
143 93,000 25,730
376,386
412,580
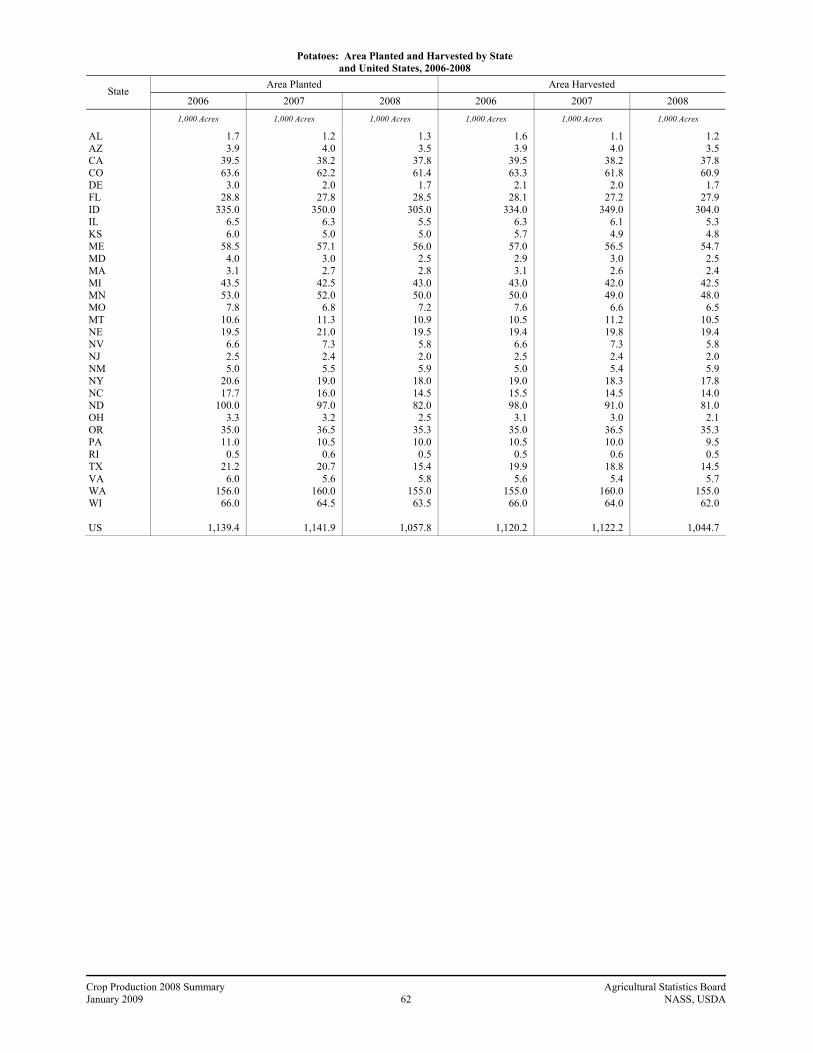
Crop Production 2008 Summary Agricultural Statistics Board January 2009 62 NASS, USDA
Potatoes: Area Planted and Harvested by State and United States, 2006-2008
Area Planted Area Harvested State
2006 2007 2008 2006 2007 2008
1,000 Acres 1,000 Acres 1,000 Acres 1,000 Acres 1,000 Acres 1,000 Acres
AL AZ CA CO DE FL ID IL KS ME MD MA MI MN MO MT NE NV NJ NM NY NC ND OH OR PA RI TX VA WA WI US
1.7 3.9
39.5 63.6
3.0 28.8
335.0 6.5 6.0
58.5 4.0 3.1
43.5 53.0
7.8 10.6 19.5
6.6 2.5 5.0
20.6 17.7
100.0 3.3
35.0 11.0
0.5 21.2
6.0 156.0
66.0
1,139.4
1.2 4.0
38.2 62.2
2.0 27.8
350.0 6.3 5.0
57.1 3.0 2.7
42.5 52.0
6.8 11.3 21.0
7.3 2.4 5.5
19.0 16.0 97.0
3.2 36.5 10.5
0.6 20.7
5.6 160.0
64.5
1,141.9
1.3 3.5
37.8 61.4
1.7 28.5
305.0 5.5 5.0
56.0 2.5 2.8
43.0 50.0
7.2 10.9 19.5
5.8 2.0 5.9
18.0 14.5 82.0
2.5 35.3 10.0
0.5 15.4
5.8 155.0
63.5
1,057.8
1.6 3.9
39.5 63.3
2.1 28.1
334.0 6.3 5.7
57.0 2.9 3.1
43.0 50.0
7.6 10.5 19.4
6.6 2.5 5.0
19.0 15.5 98.0
3.1 35.0 10.5
0.5 19.9
5.6 155.0
66.0
1,120.2
1.1 4.0
38.2 61.8
2.0 27.2
349.0 6.1 4.9
56.5 3.0 2.6
42.0 49.0
6.6 11.2 19.8
7.3 2.4 5.4
18.3 14.5 91.0
3.0 36.5 10.0
0.6 18.8
5.4 160.0
64.0
1,122.2
1.2 3.5
37.8 60.9
1.7 27.9
304.0 5.3 4.8
54.7 2.5 2.4
42.5 48.0
6.5 10.5 19.4
5.8 2.0 5.9
17.8 14.0 81.0
2.1 35.3
9.5 0.5
14.5 5.7
155.0 62.0
1,044.7

Crop Production 2008 Summary Agricultural Statistics Board January 2009 63 NASS, USDA
Potatoes: Yield and Production by State and United States, 2006-2008
Yield 1 Production State
2006 2007 2008 2006 2007 2008
Cwt Cwt Cwt 1,000 Cwt 1,000 Cwt 1,000 Cwt
AL AZ CA CO DE FL ID IL KS ME MD MA MI MN MO MT NE NV NJ NM NY NC ND OH OR PA RI TX VA WA WI US
150 300 361 379 240 278 386 395 320 305 320 240 330 425 315 335 450 445 240 420 300 210 260 325 530 260 260 358 270 580 445
393
140 280 359 355 270 287 373 400 365 295 320 320 350 440 300 330 415 390 265 370 285 186 260 330 556 220 300 316 210 630 440
396
170 300 392 374 250 285 378 395 320 270 300 270 350 425 190 330 430 410 230 390 320 180 280 325 529 265 286 304 220 600 415
395
240 1,170
14,240 23,982
504 7,816
128,915 2,489 1,824
17,385 928 744
14,190 21,250
2,394 3,518 8,730 2,937
600 2,100 5,700 3,255
25,480 1,008
18,533 2,730
130 7,124 1,512
89,900 29,370
440,698
154 1,120
13,721 21,926
540 7,807
130,010 2,440 1,789
16,668 960 832
14,700 21,560
1,980 3,696 8,217 2,847
636 1,998 5,216 2,700
23,660 990
20,293 2,200
180 5,941 1,134
100,800 28,160
444,875
204 1,050
14,803 22,778
425 7,952
114,805 2,094 1,536
14,769 750 648
14,875 20,400
1,235 3,465 8,342 2,378
460 2,301 5,696 2,520
22,680 683
18,676 2,518
143 4,410 1,254
93,000 25,730
412,580
1 Derived

Crop Production 2008 Summary Agricultural Statistics Board January 2009 64 NASS, USDA
Sweet Potatoes: Area Planted and Harvested, Yield, and Production by State and United States, 2006-2008
Area Planted Area Harvested State
2006 2007 2008 2006 2007 2008
1,000 Acres 1,000 Acres 1,000 Acres 1,000 Acres 1,000 Acres 1,000 Acres
AL CA LA MS NJ NC SC TX VA US
2.4 12.7 18.0 18.0
1.2 40.0
0.7 2.2 0.5
95.7
2.4 13.5 16.0 20.5
1.2 44.0
0.6 1.9 0.4
100.5
2.6 14.5 15.0 20.0
1.2 47.0
0.6 1.7 0.3
102.9
2.3 12.7 13.5 15.5
1.2 39.0
0.6 2.1 0.4
87.3
2.3 13.3 15.0 20.0
1.2 43.0
0.5 1.8 0.3
97.4
2.5 14.5 11.0 19.5
1.2 46.0
0.5 1.5 0.3
97.0
Yield Production
2006 2007 2008 2006 2007 2008 Cwt Cwt Cwt 1,000 Cwt 1,000 Cwt 1,000 Cwt
AL CA LA MS NJ NC SC TX VA US
160 305 165 160 135 180 140
65 120
188
120 320 200 175 100 155 110
90 120
186
175 295 100 172 125 190
90 140 100
189
368 3,874 2,228 2,480
162 7,020
84 137
48
16,401
276 4,256 3,000 3,500
120 6,665
55 162
36
18,070
438 4,278 1,100 3,354
150 8,740
45 210
30
18,345
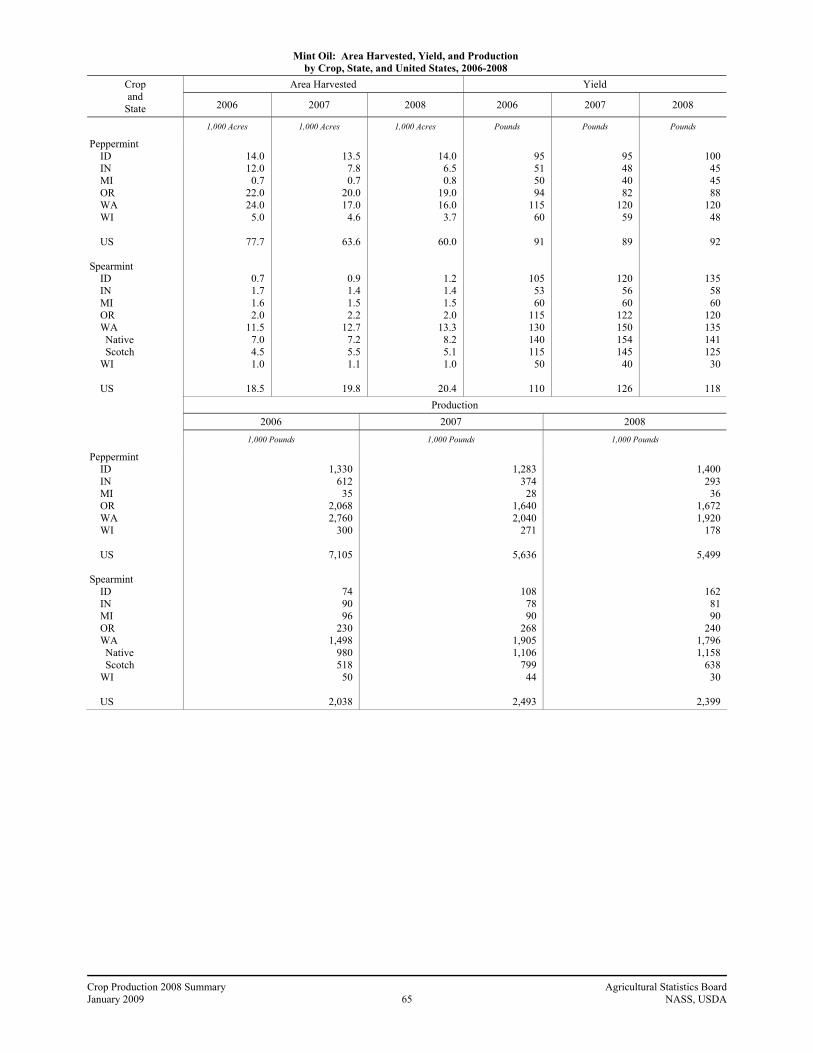
Crop Production 2008 Summary Agricultural Statistics Board January 2009 65 NASS, USDA
Mint Oil: Area Harvested, Yield, and Production by Crop, State, and United States, 2006-2008
Area Harvested Yield Crop and
State 2006 2007 2008 2006 2007 2008
1,000 Acres 1,000 Acres 1,000 Acres Pounds Pounds Pounds
Peppermint ID IN MI OR WA WI US Spearmint ID IN MI OR WA Native Scotch WI US
14.0 12.0
0.7 22.0 24.0
5.0
77.7
0.7 1.7 1.6 2.0
11.5 7.0 4.5 1.0
18.5
13.5
7.8 0.7
20.0 17.0
4.6
63.6
0.9 1.4 1.5 2.2
12.7 7.2 5.5 1.1
19.8
14.0
6.5 0.8
19.0 16.0
3.7
60.0
1.2 1.4 1.5 2.0
13.3 8.2 5.1 1.0
20.4
95 51 50 94
115 60
91
105 53 60
115 130 140 115
50
110
95 48 40 82
120 59
89
120 56 60
122 150 154 145
40
126
100
45 45 88
120 48
92
135 58 60
120 135 141 125
30
118 Production
2006 2007 2008
1,000 Pounds 1,000 Pounds 1,000 Pounds
Peppermint ID IN MI OR WA WI US Spearmint ID IN MI OR WA Native Scotch WI US
1,330
612 35
2,068 2,760
300
7,105
74 90 96
230 1,498
980 518
50
2,038
1,283
374 28
1,640 2,040
271
5,636
108 78 90
268 1,905 1,106
799 44
2,493
1,400
293 36
1,672 1,920
178
5,499
162 81 90
240 1,796 1,158
638 30
2,399

Crop Production 2008 Summary Agricultural Statistics Board January 2009 66 NASS, USDA
Hops: Area Harvested and Yield by Variety, State, and United States, 2006-2008
Area Harvested Yield State and
Variety 2006 2007 2008 2006 2007 2008
Acres Acres Acres Pounds Pounds Pounds
ID Total 1 OR Cascade Golding Millenium Mt. Hood Nugget Sterling Willamette Other Varieties Total WA Ahtanum Apollo R Bravo R Cascade Centennial Chelan Chinook Cluster Columbus/Tomahawk R Galena Glacier Golding Hallertauer Millenium Mt. Hood Nugget Simcoe Sterling Summit R Super Galena R Vanguard Willamette YCR4 - Palisade R YCR5 - Warrior R Zeus Other Varieties Total U.S. Total
2,797
* 117 293 161
1,590 123
2,301 451
5,036
40 * *
1,116 *
505 365 352
2,772 3,809
17 53 49
910 44
1,100 *
62 66
* *
4,554 54
421 3,982 1,261
21,532
29,365
2,896
* 115 294 178
1,675 95
2,396 517
5,270
42 * *
1,303 *
505 311 366
3,342 3,030
21 52 56
728 43
1,093 * *
632 *
64 4,462
91 339
4,737 1,528
22,745
30,911
3,933
76 135 343 186
2,135 95
2,593 807
6,370
* 698 222
2,073 253 739 285 420
4,891 2,584
56 38
* 716
29 1,086
129 * *
793 *
4,664 307 394
6,779 3,439
30,595
40,898
1,613
* 1,371 2,540 1,544 2,164 1,766 1,459 1,508 1,757
2,110 * *
1,954 *
2,187 1,871 2,184 2,660 1,820 1,441
992 812
2,324 1,109 1,841
* 1,419 1,864
* *
1,222 2,998 2,159 2,962 1,775 2,058
1,964
1,417
* 1,403 2,323 1,640 2,231 1,665 1,577 1,416 1,811
1,964 * *
2,031 *
2,364 1,818 2,030 2,533 1,776 1,619 1,500
763 2,350 1,316 1,909
* *
1,822 *
1,470 1,318 2,519 1,903 2,839 1,355 2,049
1,949
1,841
1,068 1,307 2,179 1,552 1,758 1,667 1,539
992 1,569
* 2,229 2,340 1,781 1,452 2,178 1,775 2,038 2,585 1,826 1,795 1,385
* 2,440 1,572 2,068 1,758
* *
2,104 *
1,351 2,091 1,846 2,618 1,576 2,072
1,971 * Included in "Other Varieties" to avoid disclosure of individual operations. R Registered 1 Only State totals published for Idaho to avoid disclosure of individual operations.
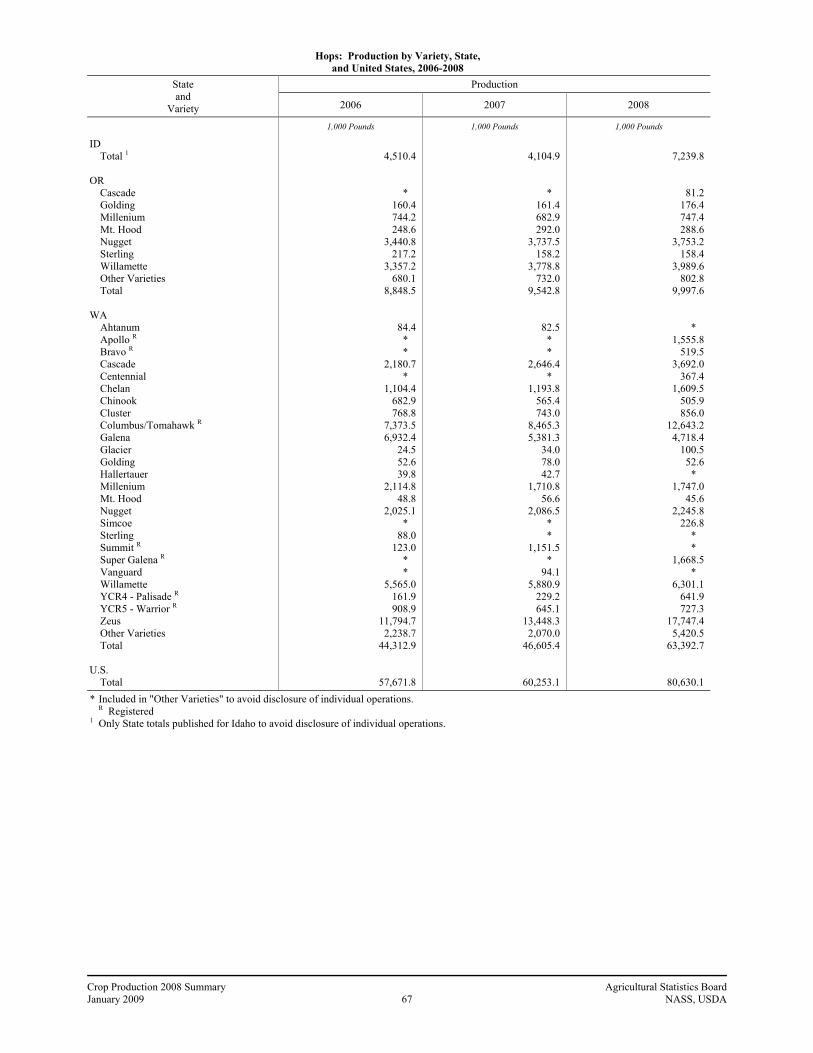
Crop Production 2008 Summary Agricultural Statistics Board January 2009 67 NASS, USDA
Hops: Production by Variety, State, and United States, 2006-2008
Production State and
Variety 2006 2007 2008
1,000 Pounds 1,000 Pounds 1,000 Pounds
ID Total 1 OR Cascade Golding Millenium Mt. Hood Nugget Sterling Willamette Other Varieties Total WA Ahtanum Apollo R Bravo R Cascade Centennial Chelan Chinook Cluster Columbus/Tomahawk R Galena Glacier Golding Hallertauer Millenium Mt. Hood Nugget Simcoe Sterling Summit R Super Galena R Vanguard Willamette YCR4 - Palisade R YCR5 - Warrior R Zeus Other Varieties Total U.S. Total
4,510.4
* 160.4 744.2 248.6
3,440.8 217.2
3,357.2 680.1
8,848.5
84.4 * *
2,180.7 *
1,104.4 682.9 768.8
7,373.5 6,932.4
24.5 52.6 39.8
2,114.8 48.8
2,025.1 *
88.0 123.0
* *
5,565.0 161.9 908.9
11,794.7 2,238.7
44,312.9
57,671.8
4,104.9
* 161.4 682.9 292.0
3,737.5 158.2
3,778.8 732.0
9,542.8
82.5 * *
2,646.4 *
1,193.8 565.4 743.0
8,465.3 5,381.3
34.0 78.0 42.7
1,710.8 56.6
2,086.5 * *
1,151.5 *
94.1 5,880.9
229.2 645.1
13,448.3 2,070.0
46,605.4
60,253.1
7,239.8
81.2 176.4 747.4 288.6
3,753.2 158.4
3,989.6 802.8
9,997.6
* 1,555.8
519.5 3,692.0
367.4 1,609.5
505.9 856.0
12,643.2 4,718.4
100.5 52.6
* 1,747.0
45.6 2,245.8
226.8 * *
1,668.5 *
6,301.1 641.9 727.3
17,747.4 5,420.5
63,392.7
80,630.1 * Included in "Other Varieties" to avoid disclosure of individual operations. R Registered 1 Only State totals published for Idaho to avoid disclosure of individual operations.

Crop Production 2008 Summary Agricultural Statistics Board January 2009 68 NASS, USDA
Maple Syrup: Taps, Yield, and Production by State and United States, 2006-2008 1
Number of Taps Yield per Tap Production State
2006 2007 2008 2006 2007 2008 2006 2007 2008
1,000 Taps 1,000 Taps 1,000 Taps Gallons Gallons Gallons 1,000 Gallons 1,000 Gallons 1,000 Gallons
CT ME MA MI NH NY OH PA VT WI US
72 1,490
255 375 375
1,460 325 449
2,770 500
8,071
73 1,485
250 390 400
1,440 325 445
2,770 600
8,178
62 1,270
220 405 360
1,480 395 475
2,250 540
7,457
0.153 0.232 0.157 0.208 0.171 0.173 0.218 0.147 0.235 0.200
0.208
0.151 0.168 0.160 0.167 0.175 0.158 0.194 0.124 0.231 0.158
0.185
0.242 0.169 0.250 0.247 0.236 0.218 0.299 0.200 0.222 0.241
0.219
11 345
40 78 64
253 71 66
650 100
1,678
11 250
40 65 70
228 63 55
640 95
1,517
15 215
55 100
85 322 118
95 500 130
1,635
1 Estimates for 2008 are carried forward from the June 2008 Crop Production. Any revisions will appear in the June 2009 Crop Production.
Coffee: Area Harvested, Yield, and Production, Hawaii and Puerto Rico, 2006-2008
Area Harvested Yield Production 1 State
2006-07 2007-08 2008-09 2006-07 2007-08 2008-09 2006-07 2007-08 2008-09
Acres Acres Acres Pounds Pounds Pounds 1,000 Pounds 1,000 Pounds 1,000 Pounds
HI PR
6,300
40,000
6,400
39,000
6,300
38,000
1,170
450
1,170
450
1,160
435
7,400
18,000
7,500
17,500
7,300
16,500 1 Parchment basis.
Taro: Area in Crop and Production, Hawaii, 2006-2008 1
Area in Crop Yield Production State
2006 2007 2008 2006 2007 2008 2006 2007 2008
Acres Acres Acres Pounds Pounds Pounds 1,000 Pounds 1,000 Pounds 1,000 Pounds
HI 380 380 390 4,500 4,000 4,400 1 Area is total acres in crop, not harvested acreage. Yield is not estimated.
Ginger Root: Area Harvested, Yield, and Production, Hawaii, 2006-2008
Area Harvested Yield Production State
2005-06 2006-07 2007-08 2005-06 2006-07 2007-08 2005-06 2006-07 2007-08
Acres Acres Acres Pounds Pounds Pounds 1,000 Pounds 1,000 Pounds 1,000 Pounds
HI 100 80 60 43,000 35,000 30,000 4,300 2,800 1,800

Crop Production 2008 Summary Agricultural Statistics Board January 2009 69 NASS, USDA
Alaska: Area Planted and Harvested, Yield, and Production, 2006-2008
Area Planted for All Purposes Area Harvested State
2006 2007 2008 2006 2007 2008
Acres Acres Acres Acres Acres Acres
Oats Barley All Hay 1 Potatoes
2,000 4,500
860
1,900 4,100
890
1,700 4,100
800
800 4,200
20,000 840
1,000 3,900
23,000 870
500 3,400
18,000 780
Yield Production
2006 2007 2008 2006 2007 2008 Oats, Bu Barley, Bu All Hay, Tons Potatoes, Cwt
35.0 37.4 1.10 221
47.0 40.5 1.35 202
26.0 29.1 1.11 173
28,000 157,000 22,000
186,000
47,000 158,000 31,000
176,000
13,000 99,000 20,000
135,000 1 Area planted not estimated.

Crop Production 2008 Summary Agricultural Statistics Board January 2009 70 NASS, USDA
Crop Summary: Area Planted and Harvested, United States, 2007-2008 (Domestic Units) 1
Area Planted Area Harvested Crop
2007 2008 2007 2008 1,000 Acres 1,000 Acres 1,000 Acres 1,000 Acres
Grains & Hay Barley Corn for Grain 2 Corn for Silage Hay, All Alfalfa All Other Oats Proso Millet Rice Rye Sorghum for Grain 2 Sorghum for Silage Wheat, All Winter Durum Other Spring Oilseeds Canola Cottonseed 3 Flaxseed Mustard Seed Peanuts Rapeseed Safflower Soybeans for Beans Sunflower Cotton, Tobacco & Sugar Crops Cotton, All Upland Amer-Pima Sugarbeets Sugarcane Tobacco Dry Beans, Peas & Lentils Austrian Winter Peas Dry Edible Beans Dry Edible Peas Lentils Wrinkled Seed Peas 3 Potatoes & Misc. Coffee (HI) Ginger Root (HI) Hops Peppermint Oil Potatoes, All Winter Spring Summer Fall Spearmint Oil Sweet Potatoes Taro (HI) 4
4,018.0
93,527.0
3,763.0 570.0
2,761.0 1,334.0 7,712.0
60,460.0 45,012.0
2,156.0 13,292.0
1,176.0
354.0 60.0
1,230.0 1.6
180.0 64,741.0
2,070.0
10,827.2 10,535.0
292.2 1,268.8
29.0 1,527.4
847.5 303.0
1,141.9 10.5 72.8 50.8
1,007.8
100.5
4,234.0
85,982.0
3,217.0 520.0
2,995.0 1,260.0 8,284.0
63,147.0 46,281.0
2,731.0 14,135.0
1,011.0
354.0 79.5
1,534.0 0.2
202.0 75,718.0
2,516.5
9,470.0 9,296.0
174.0 1,090.8
17.5 1,495.0
882.5 271.0
1,057.8 11.0 70.3 46.0
930.5
102.9
3,502.0
86,520.0 6,060.0
61,006.0 21,126.0 39,880.0
1,504.0 520.0
2,748.0 252.0
6,792.0 392.0
50,999.0 35,938.0
2,119.0 12,942.0
1,155.5
349.0 57.0
1,195.0 1.1
171.5 64,146.0
2,012.0
10,489.1 10,201.0
288.1 1,246.8
879.6 356.0
10.0 1,479.2
811.3 295.0
6.4 0.1
30.9 63.6
1,122.2 10.5 70.2 48.3
993.2 19.8 97.4
0.4
3,767.0
78,640.0 5,965.0
60,062.0 20,980.0 39,082.0
1,395.0 460.0
2,976.0 269.0
7,271.0 408.0
55,685.0 39,614.0
2,584.0 13,487.0
989.0
340.0 71.5
1,507.0 0.2
195.0 74,641.0
2,396.0
7,728.4 7,559.0
169.4 1,004.6
869.5 354.2
8.0 1,445.2
847.3 263.0
6.3 0.1
40.9 60.0
1,044.7 11.0 68.8 43.8
921.1 20.4 97.0
0.4 1 Data are the latest estimates available, either from the current report or from previous reports. Current year estimates are for the full 2008 crop
year. 2 Area planted for all purposes. 3 Acreage is not estimated. 4 Area is total acres in crop, not harvested acreage.

Crop Production 2008 Summary Agricultural Statistics Board January 2009 71 NASS, USDA
Crop Summary: Yield and Production, United States, 2007-2008 (Domestic Units) 1
Yield Production Crop Units
2007 2008 2007 2008
1,000 1,000
Grains & Hay Barley Corn for Grain Corn for Silage Hay, All Alfalfa All Other Oats Proso Millet Rice 2 Rye Sorghum for Grain Sorghum for Silage Wheat, All Winter Durum Other Spring Oilseeds Canola Cottonseed 3 Flaxseed Mustard Seed Peanuts Rapeseed Safflower Soybeans for Beans Sunflower Cotton, Tobacco & Sugar Crops Cotton, All 2 Upland 2 Amer-Pima 2 Sugarbeets Sugarcane Tobacco Dry Beans, Peas & Lentils Austrian Winter Peas 2 Dry Edible Beans 2 Dry Edible Peas 2 Lentils 2 Wrinkled Seed Peas 3 Potatoes & Misc. Coffee (HI) Ginger Root (HI) Hops Peppermint Oil Potatoes, All Winter Spring Summer Fall Spearmint Oil Sweet Potatoes Taro (HI) 3
Bu " Tons " " " Bu " Cwt Bu " Tons Bu " " " Lbs Tons Bu Lbs " " " Bu Lbs Bales " " Tons " Lbs Cwt " " " " Lbs " " " Cwt " " " " Lbs Cwt Lbs
60.0
150.7 17.5 2.41 3.31 1.93 60.1 32.5
7,219 25.0 73.2 13.4 40.2 41.7 34.1 37.1
1,238
16.9 608
3,073 1,100 1,228
41.7 1,426
879 864
1,419 25.5 34.1
2,213
1,180 1,730 2,008 1,237
1,170 35,000
1,949 89
396 215 282 331 410 126 186
63.6
153.9 18.7 2.43 3.32 1.95 63.5 32.3
6,846 29.7 65.0 13.8 44.9 47.2 32.8 40.5
1,461
16.8 577
3,416 1,500 1,592
39.6 1,429
810 799
1,265 26.7 35.3
2,260
1,300 1,768 1,448
917
1,160 30,000
1,971 92
395 230 293 309 409 118 189
210,110
13,037,875 106,229 146,901 69,880 77,021 90,430 16,900
198,388 6,311
497,445 5,246
2,051,088 1,499,241
72,224 479,623
1,430,734 6,588.7
5,896 34,670
3,672,250 1,210
210,645 2,677,117 2,868,870
19,206.9 18,355.1
851.8 31,834 29,969
787,653
118 25,586 16,287
3,650 541
7,500 2,800
60,253.1 5,636
444,875 2,258
19,820 15,997
406,800 2,493
18,070 4,000
239,498
12,101,238 111,619 145,672 69,620 76,052 88,635 14,880
203,733 7,979
472,342 5,646
2,499,524 1,867,903
84,877 546,744
1,445,064 4,429.0
5,716 41,255
5,147,900 300
310,433 2,959,174 3,422,840
13,035.6 12,589.0
446.6 26,820 30,690
800,527
104 25,558 12,270
2,411 580
7,300 1,800
80,630.1 5,499
412,580 2,530
20,132 13,532
376,386 2,399
18,345 4,400
1 Data are the latest estimates available, either from the current report or from previous reports. Current year estimates are for the full 2008 crop year.
2 Yield in pounds. 3 Yield is not estimated.
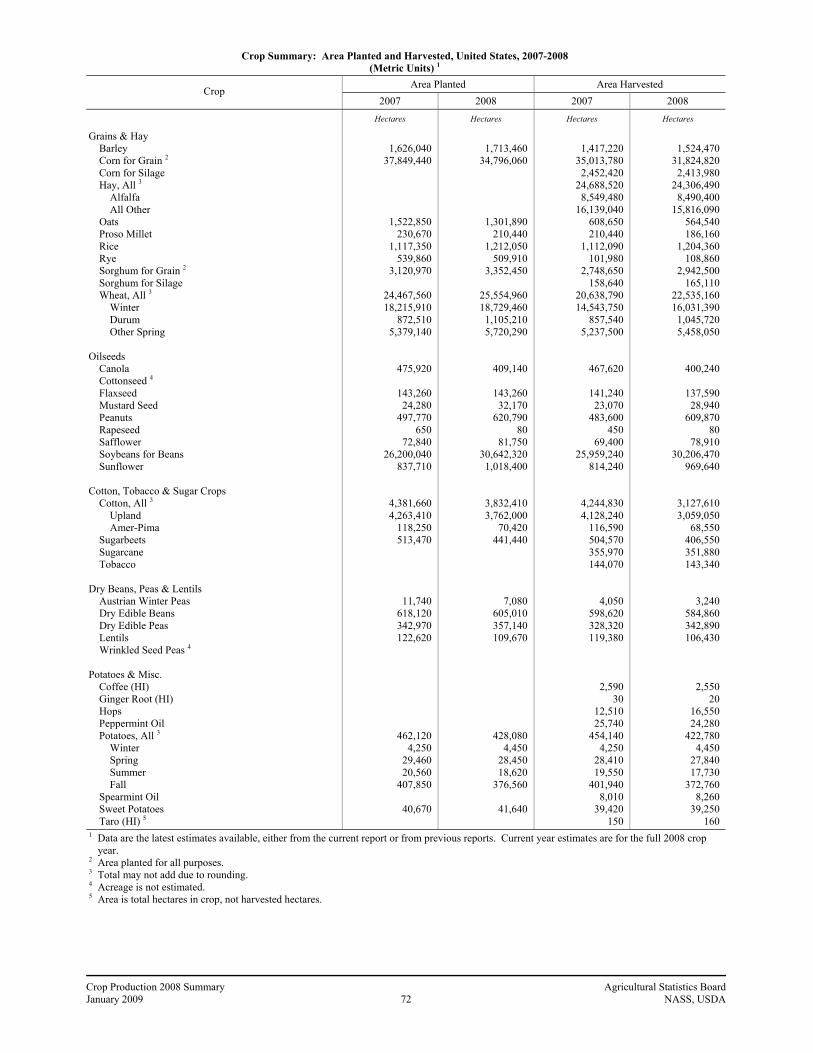
Crop Production 2008 Summary Agricultural Statistics Board January 2009 72 NASS, USDA
Crop Summary: Area Planted and Harvested, United States, 2007-2008 (Metric Units) 1
Area Planted Area Harvested Crop
2007 2008 2007 2008 Hectares Hectares Hectares Hectares
Grains & Hay Barley Corn for Grain 2 Corn for Silage Hay, All 3 Alfalfa All Other Oats Proso Millet Rice Rye Sorghum for Grain 2 Sorghum for Silage Wheat, All 3 Winter Durum Other Spring Oilseeds Canola Cottonseed 4 Flaxseed Mustard Seed Peanuts Rapeseed Safflower Soybeans for Beans Sunflower Cotton, Tobacco & Sugar Crops Cotton, All 3 Upland Amer-Pima Sugarbeets Sugarcane Tobacco Dry Beans, Peas & Lentils Austrian Winter Peas Dry Edible Beans Dry Edible Peas Lentils Wrinkled Seed Peas 4 Potatoes & Misc. Coffee (HI) Ginger Root (HI) Hops Peppermint Oil Potatoes, All 3 Winter Spring Summer Fall Spearmint Oil Sweet Potatoes Taro (HI) 5
1,626,040
37,849,440
1,522,850 230,670
1,117,350 539,860
3,120,970
24,467,560 18,215,910
872,510 5,379,140
475,920
143,260 24,280
497,770 650
72,840 26,200,040
837,710
4,381,660 4,263,410
118,250 513,470
11,740 618,120 342,970 122,620
462,120 4,250
29,460 20,560
407,850
40,670
1,713,460
34,796,060
1,301,890 210,440
1,212,050 509,910
3,352,450
25,554,960 18,729,460
1,105,210 5,720,290
409,140
143,260 32,170
620,790 80
81,750 30,642,320
1,018,400
3,832,410 3,762,000
70,420 441,440
7,080 605,010 357,140 109,670
428,080 4,450
28,450 18,620
376,560
41,640
1,417,220
35,013,780 2,452,420
24,688,520 8,549,480
16,139,040 608,650 210,440
1,112,090 101,980
2,748,650 158,640
20,638,790 14,543,750
857,540 5,237,500
467,620
141,240 23,070
483,600 450
69,400 25,959,240
814,240
4,244,830 4,128,240
116,590 504,570 355,970 144,070
4,050 598,620 328,320 119,380
2,590 30
12,510 25,740
454,140 4,250
28,410 19,550
401,940 8,010
39,420 150
1,524,470
31,824,820 2,413,980
24,306,490 8,490,400
15,816,090 564,540 186,160
1,204,360 108,860
2,942,500 165,110
22,535,160 16,031,390
1,045,720 5,458,050
400,240
137,590 28,940
609,870 80
78,910 30,206,470
969,640
3,127,610 3,059,050
68,550 406,550 351,880 143,340
3,240 584,860 342,890 106,430
2,550 20
16,550 24,280
422,780 4,450
27,840 17,730
372,760 8,260
39,250 160
1 Data are the latest estimates available, either from the current report or from previous reports. Current year estimates are for the full 2008 crop year.
2 Area planted for all purposes. 3 Total may not add due to rounding. 4 Acreage is not estimated. 5 Area is total hectares in crop, not harvested hectares.
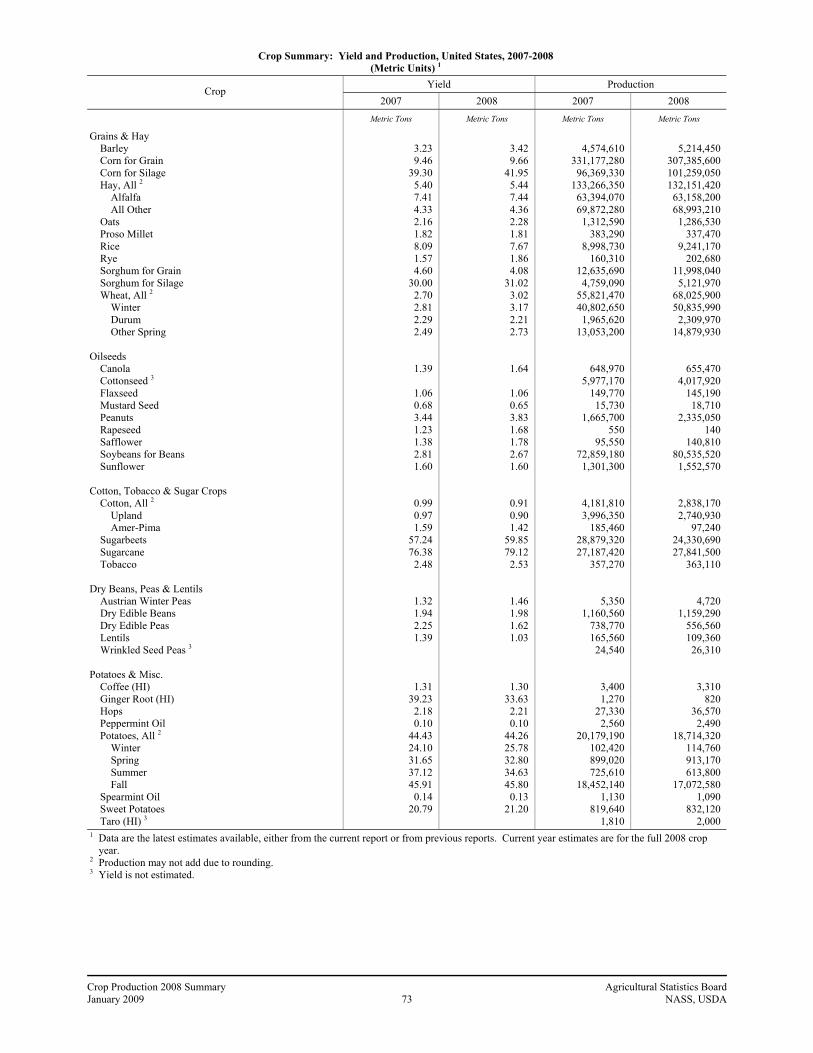
Crop Production 2008 Summary Agricultural Statistics Board January 2009 73 NASS, USDA
Crop Summary: Yield and Production, United States, 2007-2008 (Metric Units) 1
Yield Production Crop
2007 2008 2007 2008 Metric Tons Metric Tons Metric Tons Metric Tons
Grains & Hay Barley Corn for Grain Corn for Silage Hay, All 2 Alfalfa All Other Oats Proso Millet Rice Rye Sorghum for Grain Sorghum for Silage Wheat, All 2 Winter Durum Other Spring Oilseeds Canola Cottonseed 3 Flaxseed Mustard Seed Peanuts Rapeseed Safflower Soybeans for Beans Sunflower Cotton, Tobacco & Sugar Crops Cotton, All 2 Upland Amer-Pima Sugarbeets Sugarcane Tobacco Dry Beans, Peas & Lentils Austrian Winter Peas Dry Edible Beans Dry Edible Peas Lentils Wrinkled Seed Peas 3 Potatoes & Misc. Coffee (HI) Ginger Root (HI) Hops Peppermint Oil Potatoes, All 2 Winter Spring Summer Fall Spearmint Oil Sweet Potatoes Taro (HI) 3
3.23 9.46
39.30 5.40 7.41 4.33 2.16 1.82 8.09 1.57 4.60
30.00 2.70 2.81 2.29 2.49
1.39
1.06 0.68 3.44 1.23 1.38 2.81 1.60
0.99 0.97 1.59
57.24 76.38
2.48
1.32 1.94 2.25 1.39
1.31 39.23
2.18 0.10
44.43 24.10 31.65 37.12 45.91
0.14 20.79
3.42 9.66
41.95 5.44 7.44 4.36 2.28 1.81 7.67 1.86 4.08
31.02 3.02 3.17 2.21 2.73
1.64
1.06 0.65 3.83 1.68 1.78 2.67 1.60
0.91 0.90 1.42
59.85 79.12
2.53
1.46 1.98 1.62 1.03
1.30 33.63
2.21 0.10
44.26 25.78 32.80 34.63 45.80
0.13 21.20
4,574,610
331,177,280 96,369,330
133,266,350 63,394,070 69,872,280
1,312,590 383,290
8,998,730 160,310
12,635,690 4,759,090
55,821,470 40,802,650
1,965,620 13,053,200
648,970 5,977,170
149,770 15,730
1,665,700 550
95,550 72,859,180
1,301,300
4,181,810 3,996,350
185,460 28,879,320 27,187,420
357,270
5,350 1,160,560
738,770 165,560 24,540
3,400 1,270
27,330 2,560
20,179,190 102,420 899,020 725,610
18,452,140 1,130
819,640 1,810
5,214,450
307,385,600 101,259,050 132,151,420
63,158,200 68,993,210
1,286,530 337,470
9,241,170 202,680
11,998,040 5,121,970
68,025,900 50,835,990
2,309,970 14,879,930
655,470 4,017,920
145,190 18,710
2,335,050 140
140,810 80,535,520
1,552,570
2,838,170 2,740,930
97,240 24,330,690 27,841,500
363,110
4,720 1,159,290
556,560 109,360 26,310
3,310 820
36,570 2,490
18,714,320 114,760 913,170 613,800
17,072,580 1,090
832,120 2,000
1 Data are the latest estimates available, either from the current report or from previous reports. Current year estimates are for the full 2008 crop year.
2 Production may not add due to rounding. 3 Yield is not estimated.
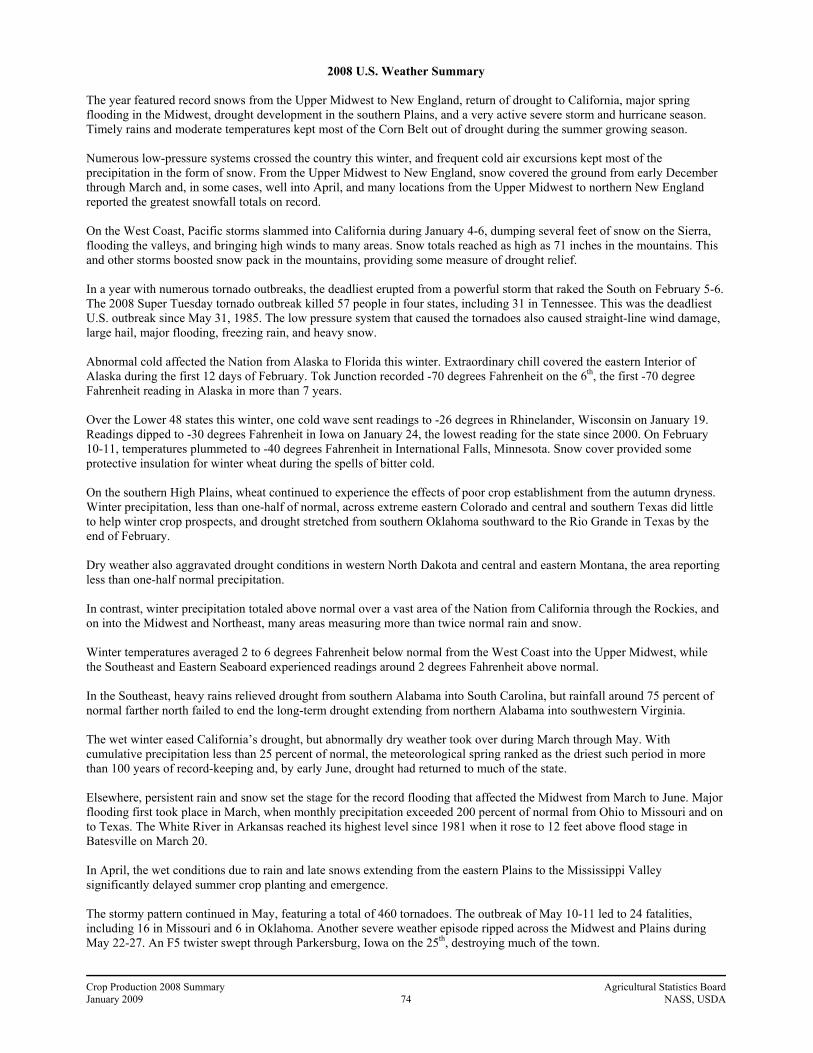
Crop Production 2008 Summary Agricultural Statistics Board January 2009 74 NASS, USDA
2008 U.S. Weather Summary
The year featured record snows from the Upper Midwest to New England, return of drought to California, major spring flooding in the Midwest, drought development in the southern Plains, and a very active severe storm and hurricane season. Timely rains and moderate temperatures kept most of the Corn Belt out of drought during the summer growing season. Numerous low-pressure systems crossed the country this winter, and frequent cold air excursions kept most of the precipitation in the form of snow. From the Upper Midwest to New England, snow covered the ground from early December through March and, in some cases, well into April, and many locations from the Upper Midwest to northern New England reported the greatest snowfall totals on record. On the West Coast, Pacific storms slammed into California during January 4-6, dumping several feet of snow on the Sierra, flooding the valleys, and bringing high winds to many areas. Snow totals reached as high as 71 inches in the mountains. This and other storms boosted snow pack in the mountains, providing some measure of drought relief. In a year with numerous tornado outbreaks, the deadliest erupted from a powerful storm that raked the South on February 5-6. The 2008 Super Tuesday tornado outbreak killed 57 people in four states, including 31 in Tennessee. This was the deadliest U.S. outbreak since May 31, 1985. The low pressure system that caused the tornadoes also caused straight-line wind damage, large hail, major flooding, freezing rain, and heavy snow. Abnormal cold affected the Nation from Alaska to Florida this winter. Extraordinary chill covered the eastern Interior of Alaska during the first 12 days of February. Tok Junction recorded -70 degrees Fahrenheit on the 6th, the first -70 degree Fahrenheit reading in Alaska in more than 7 years. Over the Lower 48 states this winter, one cold wave sent readings to -26 degrees in Rhinelander, Wisconsin on January 19. Readings dipped to -30 degrees Fahrenheit in Iowa on January 24, the lowest reading for the state since 2000. On February 10-11, temperatures plummeted to -40 degrees Fahrenheit in International Falls, Minnesota. Snow cover provided some protective insulation for winter wheat during the spells of bitter cold. On the southern High Plains, wheat continued to experience the effects of poor crop establishment from the autumn dryness. Winter precipitation, less than one-half of normal, across extreme eastern Colorado and central and southern Texas did little to help winter crop prospects, and drought stretched from southern Oklahoma southward to the Rio Grande in Texas by the end of February. Dry weather also aggravated drought conditions in western North Dakota and central and eastern Montana, the area reporting less than one-half normal precipitation. In contrast, winter precipitation totaled above normal over a vast area of the Nation from California through the Rockies, and on into the Midwest and Northeast, many areas measuring more than twice normal rain and snow. Winter temperatures averaged 2 to 6 degrees Fahrenheit below normal from the West Coast into the Upper Midwest, while the Southeast and Eastern Seaboard experienced readings around 2 degrees Fahrenheit above normal. In the Southeast, heavy rains relieved drought from southern Alabama into South Carolina, but rainfall around 75 percent of normal farther north failed to end the long-term drought extending from northern Alabama into southwestern Virginia. The wet winter eased California’s drought, but abnormally dry weather took over during March through May. With cumulative precipitation less than 25 percent of normal, the meteorological spring ranked as the driest such period in more than 100 years of record-keeping and, by early June, drought had returned to much of the state. Elsewhere, persistent rain and snow set the stage for the record flooding that affected the Midwest from March to June. Major flooding first took place in March, when monthly precipitation exceeded 200 percent of normal from Ohio to Missouri and on to Texas. The White River in Arkansas reached its highest level since 1981 when it rose to 12 feet above flood stage in Batesville on March 20. In April, the wet conditions due to rain and late snows extending from the eastern Plains to the Mississippi Valley significantly delayed summer crop planting and emergence. The stormy pattern continued in May, featuring a total of 460 tornadoes. The outbreak of May 10-11 led to 24 fatalities, including 16 in Missouri and 6 in Oklahoma. Another severe weather episode ripped across the Midwest and Plains during May 22-27. An F5 twister swept through Parkersburg, Iowa on the 25th, destroying much of the town.
Crop Production 2008 Summary Agricultural Statistics Board January 2009 75 NASS, USDA
Less than 25 percent of normal precipitation during March-May resulted in the driest such period in at least 114 years in California. In Texas, drought intensified over south-central parts of the State, as San Antonio measured its driest September-May since 1872, with only 6.57 inches of rain. In contrast, the series of low pressure areas crossing the Midwest brought about the fifth wettest spring (March-May) in 114 years. An area extending from southeastern Missouri to southwestern Indiana saw its wettest spring on record. Farther north, spring precipitation less than 50 percent of normal resulted in worsening drought in North Dakota. The wet spring set the stage for historic flooding in June. The trigger was a storm that dumped over 4 inches of rain from Iowa to Wisconsin on June 7-8, and 6 to 10 inches of rain in central Indiana on June 6-7. Several Mississippi River tributaries rose to record levels on June 7, and floods affected parts of the Mississippi River basin from June 7-21. On June 13, the Cedar River inundated Cedar Rapids, Iowa, as the river exceeded the previous record crest by 11.12 feet and topped the flood stage by 19.12 feet. This was also a very active tropical cyclone season. A total of 16 named storms formed in the Atlantic, including eight hurricanes. For the first time, six consecutive tropical cyclones (Dolly, Edouard, Fay, Gustav, Hanna, and Ike) made landfall on the U.S. mainland. Tropical Storm Fay became the only storm on record to make landfall four times in a single State, when it crisscrossed Florida in August. Fay, which first made landfall on Florida’s west coast on August 18, dumped up to 2 feet of water on the State. On the positive side, Fay brought much-needed moisture to the Southeast drought region, eliminating drought in most of Alabama and across southern Georgia, while shrinking drought to the north. The record dry spring contributed to high fire danger in California. Dry lightning strikes during June 21-22 ignited some 800 fires over northern California. Below-normal rainfall in July and August led to drought over parts of Minnesota, while August dryness contributed to drought in parts of Wisconsin. Despite a dry August, the bulk of the Corn Belt escaped drought once more this year. Lack of sustained high temperatures benefited crop prospects, with June-August temperatures averaging near normal in the Ohio Valley and slightly below normal over the rest of the Midwest. Following heavy, flooding rains in February, a dry spring and summer brought drought to many parts of Hawaii. By the end of August, drought intensity reached severe to extreme levels over eastern Oahu, western Maui, and western parts of the Big Island. In Alaska, south-central areas experienced abnormally cool weather this summer. Anchorage reported its coolest May-August since 1982. Hurricane Gustav weakened to category-two strength before making landfall along the central coast of Louisiana on September 1. The storm led to the State’s largest evacuation in history, as 1.9 million people fled the storm. The storm dropped as much as 11 inches of rain in the Baton Rouge area, and Gustav’s winds toppled thousands of trees. Category two Hurricane Ike struck Galveston during the night of September 12. The Bolivar Peninsula just north of Galveston sustained the most damage, as the storm surge inundated the Peninsula. Galveston also suffered major damage, as the estimated storm surge reached 14 feet. The storm drove inland and damaged buildings in Houston, and then tracked northwestward and northward. Ike maintained a strong punch as its remains later tracked through the Midwest, bringing winds of 50 to 60 mph and drenching rains to several States. Santa Ana winds fanned the flames of fires in the Los Angeles area in October, but the most damaging event took place in November when canyon winds reaching 70 mph fanned the flames of three fires in the Los Angeles area that scorched over 700 homes. The end of 2008 featured extreme wintry weather as a series of storms brought heavy snow, bitter cold, high winds, freezing rain, tornadoes, and flooding rains to many parts of the Nation. One low pressure system affected a vast area from Texas to New England on December 9-12, bringing snow to the Deep South, 16 tornadoes to Mississippi, flooding in several Southeastern States, and a historic ice storm to New York into New England. One-half to 1-inch of ice on December 11-12 left more than 1.25 million utility customers without electricity, some for more than a week.

Crop Production 2008 Summary Agricultural Statistics Board January 2009 76 NASS, USDA
A major cold air mass plunged southward from Canada on December 12, triggering a blizzard that paralyzed transportation in the northern Plains. By December 15, temperatures had plummeted to -30 degrees Fahrenheit in Montana and -19 degrees Fahrenheit in Denver. An intense upper level low brought snow deep into southern California and Nevada on December 17, blanketing Las Vegas with 3.6 inches of snow, a record for the month. Record cold and snow struck the Pacific Northwest during December 13-22. Portland, Oregon experienced its heaviest December snowstorm since 1968 as up to a foot of snow fell on December 20-22. Heavy snow from this storm and others gave Spokane, Washington, a new December snowfall record (61.5 inches) plus a record for any month of the year. December snowfall records were also established in North Dakota and Wisconsin. Melting snow and heavy rains led to Midwestern flooding late in the month, while continued dry weather allowed drought to worsen over Texas. The year’s rainfall totaled as little as one-half of normal in south-central Texas, resulting in extreme drought over the San Antonio and Austin areas. With much of the Nation seeing abundant rain and snow in December, concluding an unusually wet year for many States, U.S. drought coverage dropped to its lowest levels in more than 3 years.
2008 Annual Crop Summary April: Wet conditions persisted or intensified in most areas from the eastern Plains to the Mississippi Valley, accompanied by near to below normal temperatures. In contrast, warm, mostly dry weather prevailed from the lower Great Lakes region into the Northeast and parts of the Deep South. By month’s end, corn growers had planted only 10 percent of the Nation’s intended acreage, 25 points behind the normal pace. Small grain and rice planting and emergence significantly lagged the 5-year average for most States. By April 27, cotton planting was ahead of pace in Arizona, California, Louisiana, and Texas but behind in Arkansas, Mississippi, and the Southeast States. May: Midwestern downpours continued to delay corn and soybean planting and cool conditions existed across the northern half of the Plains. Rainfall eased drought in the High Plains region while drought continued to adversely affect winter wheat from eastern Colorado and western Kansas southward. By month’s end, only 74 percent of the corn crop had emerged, 15 points behind the 5-year average. Small grain planting was nearly complete by June 1 but delays in emergence were evident in every State, ranging from slightly behind in North Dakota to 39 points behind in Illinois. By May 25, cotton planting was nearly complete and rice emergence was ahead of the normal pace. June: The Midwest experienced excessive amounts of rainfall during the month, reaching up to 400 percent of normal in areas of southern Wisconsin. Rainfall amounts up to 12 inches fell throughout the area with flooding occurring along the Mississippi River. Excessive moisture also fell in eastern Kansas, Oklahoma, and Texas with the northeast corner of Oklahoma and southeast corner of Kansas receiving 8 to 12 inches of rain during the month. Despite flooding in the eastern Corn Belt, 61 percent of corn acreage was rated good to excellent on June 29. By month’s end, 36 percent of the winter wheat crop had been harvested and half of the remaining crop was rated in good to excellent condition. Spring wheat growing areas remained cooler than average during the month, and scattered rains of up to 4 inches in some areas caused crop development to lag behind the average. Soybean blooming was evident in the Delta and parts of the Corn Belt by June 22, but was behind the normal pace, largely due to initial planting delays. Peanut pegging gained momentum and by month's end reached 27 percent, 2 points ahead of the 5-year average. July: Abundant rainfall and near normal temperatures provided nearly ideal conditions for Midwestern corn and soybeans, much of which entered the reproductive stage of development during July. During the 5-week period from June 29 to August 3, seventy-four percent of the Nation's soybeans began to bloom, while 80 percent of the corn began to silk. Twenty-two percent of the sorghum crop was mature at the end of the month, ahead of the normal pace. Small grain harvests were behind the 5-year average with 34 percent of the oats, 8 percent of the barley, 86 percent of the winter wheat, and 6 percent of the spring wheat harvested by the end of the month. Peanut development remained near normal the entire month as average temperatures were reported throughout the growing region. Cotton crop development trailed the normal pace throughout July. August: An August dry spell adversely affected Midwestern soybeans and late-developing corn. Rainfall totals were less than 25 percent of normal at several Midwestern locations. Corn and soybean condition ratings declined during the month. In contrast, abundant August rainfall soaked the South beneficial for drought-stressed pastures and immature summer crops. The rain, however, became excessive with monthly totals as high as 1 to 2 feet in some areas from the lower Mississippi Valley to Florida which was hit by slow moving Hurricane Fay. Harvest of wheat, oats, and barley were nearing completion

Crop Production 2008 Summary Agricultural Statistics Board January 2009 77 NASS, USDA
by month’s end. Rice harvest in Louisiana was significantly delayed, trailing the average by 30 percentage points on August 31 and cotton development in the top producing States was delayed. September: Hurricanes Gustav and Ike struck the Gulf Coast fewer than two weeks apart, causing extensive storm-surge flooding and resulting in rain and wind damage to a variety of crops. The remnants of both Gustav and Ike crossed the Midwest, contributing to record-setting wetness in the central Corn Belt during the first half of September. In the Ohio and upper Mississippi Valleys, dry weather slowed progress of crop development. Farther west, winter wheat planting gained momentum on the Plains. Rain and cool temperatures delayed wheat planting in west-central Texas into eastern Kansas. Elsewhere, very warm, mostly dry weather promoted fieldwork in the West, while dry weather in much of the Southeast contrasted with wet conditions along the Atlantic Coast. By the end of the month, rice harvest, at 52 percent, was 18 points behind the normal pace. Peanut harvesting began mid-month, keeping pace with the 5-year average of 14 percent by September 28. October: Heavy precipitation soaked much of the Nation’s mid-section, hampering fieldwork, but providing abundant moisture for emerging winter wheat. The Midwestern corn harvest was significantly delayed mainly due to late maturation. In the eastern Corn Belt, favorable dryness allowed crop dry down and harvesting, but threatened winter wheat development. Elsewhere, fieldwork advanced across the South and East with few delays. Cotton harvesting remained more than one week behind throughout the month. In Louisiana, harvesting of rice and sorghum was complete by November 2, and cotton and soybean harvests were nearly complete. At month’s end, much-needed precipitation spread into California and the Northwest. November: A mid-month pattern change brought repeated surges of cold air into the Midwest, South, and East, following a mild start to November. As a result, hard freezes as far south as northern Florida slowed the growth of winter grains in the Southeast. In contrast, temperatures averaged as much as 5 to 10 degrees Fahrenheit above normal from the Great Basin to the northern High Plains. Despite drier-than-normal November weather in many winter wheat-producing areas, conditions remained mostly favorable as the crop began to slip into dormancy. Harvesting of cotton and sorghum advanced on the Plains, while the much-delayed corn harvest neared completion by month’s end across the northern and western Corn Belt.
Crop Comments
Corn: U.S. corn for grain production is estimated at 12.1 billion bushels, up 1 percent from the November forecast but 7 percent lower than last year’s record high. The average U.S. grain yield is estimated at 153.9 bushels per acre, up 0.1 bushel from the November forecast and 3.2 bushels above 2007. Yield is the second highest on record, behind 2004, and production is the second largest, behind last year. Regionally, estimated yields are equal to or higher than last year across the western and central Corn Belt and northern half of the Great Plains, where heavy spring and early summer precipitation and timely rainfall during late summer provided adequate soil moisture supplies. Yields are lower than last year across parts of the Ohio Valley, southern half of the Great Plains, and the Carolinas where drought-like conditions stressed the crop. Yields are also lower in the Delta where excessive moisture and high winds from Hurricanes Gustav and Ike reduced yield potential. Corn planted area, at 86.0 million acres, is down 8 percent from last year. Planted acreage decreased in most States as a result of favorable prices for other crops, high fertilizer prices, and a return to normal crop rotation patterns. Area harvested for grain, at 78.6 million acres, is down 9 percent from 2007. The 2008 corn objective yield data indicate a record high number of ears per acre for the combined 10 objective yield States (Illinois, Indiana, Iowa, Kansas, Minnesota, Missouri, Nebraska, Ohio, South Dakota, and Wisconsin). Record high ear counts were recorded in all objective yield States, except Kansas and Nebraska. Corn silage production is estimated at 112 million tons in 2008, up 5 percent from 2007. The U.S. silage yield is estimated at 18.7 tons per acre, up 1.2 tons from last year while area harvested for silage, at 5.97 million acres, is down 2 percent from a year ago. Corn planting was delayed across much of the Corn Belt, northern half of the Great Plains, middle Mississippi Valley, and Ohio Valley as frequent precipitation and cool temperatures during March and April left many fields too soggy and cold for field preparations and planting. On April 13, corn planting had yet to begin in any Corn Belt State, except Missouri which was only 2 percent complete, down 30 points from their 5-year average. Periods of dry, but cool weather across the Corn Belt and central and northern Great Plains during late April and early May promoted a gradual drying of soils and allowed fieldwork to slowly resume. By May 4, corn was 27 percent planted, 32 points behind the 5-year average. Planting progress was more than 45 points behind normal in the Mississippi Valley and was at least 16 points behind in the northern and central Great Plains, eastern Corn Belt, and Ohio Valley.

Crop Production 2008 Summary Agricultural Statistics Board January 2009 78 NASS, USDA
Planting operations proceeded at a rapid pace during May in many Midwestern locations as producers rushed to complete as much as possible. Despite intermittent rain showers and below normal temperatures, producers made rapid progress and by June 1, corn was 95 percent planted, 3 points behind the average. Producers in Iowa, Minnesota, North Dakota, South Dakota, and Wisconsin planted more than three-fourths of their corn crop between May 4 and June 1. The cooler-than-normal spring temperatures and slow planting pace pushed corn emergence behind normal. The crop was 26 percent emerged on May 18, thirty points behind average. The middle Mississippi Valley was furthest behind, ranging from 39 points behind normal in Iowa to 51 points behind in Missouri. Emergence in the northern and central Great Plains, eastern Corn Belt, and Ohio and Tennessee Valleys was more than 16 points behind. Heavy showers across the Corn Belt, middle Mississippi Valley, and northern half of the Great Plains during early June halted final corn planting efforts and caused lowland and river flooding. Severe flooding continued during the second week of June as heavy rains continued across the Mississippi Valley and eastern Corn Belt. Rains subsided by mid-June: however, excess water continued to strain levees and submerged large areas of farmland across the Mississippi Valley as flood waters drained into the Mississippi River. Several storms moved across the Midwest in late June and early July, maintaining excessively wet conditions in some areas. However, by mid-July, very warm, mostly dry weather returned, alleviating flooding and promoting corn growth. On July 20, thirty-four percent of the corn acreage was at or beyond the silking stage compared with 60 percent for the 5-year average. Mostly dry conditions during August depleted soil moisture levels and lowered crop condition ratings in the eastern Corn Belt and Ohio Valley. The crop continued to progress behind normal due to the late planting and below normal temperatures early in the season and on August 10, thirty percent of the crop was in the dough stage and beyond, 20 points behind normal. By August 24, twenty-six percent of the corn acreage was in the dent stage and beyond, 21 points behind average. Corn condition continued to decline during September in the eastern Corn Belt and Ohio Valley as dry conditions continued to adversely affect the late developing crop. Meanwhile, crop condition improved in the northern Great Plains and upper Mississippi Valley as late September rains brought much needed moisture to the regions. On September 21, one-third of the acreage was rated mature and beyond compared with 63 percent for the 5-year average. States in the Mississippi Valley were more than 35 points behind their normal pace for development while States in the central and northern Great Plains were between 24 and 33 points behind. The late developing crop continued to push toward maturity during October under generally cool, wet conditions. The northern Corn Belt received a light frost in early October while the rest of the Midwest did not experience a widespread freeze until late October. On October 26, ninety-six percent of the acreage was mature and beyond, 3 points behind normal. Corn harvesting proceeded behind the normal pace due to the crop’s late maturation and wet conditions during October. Most of the harvest progress during October was made in the eastern Corn Belt and Ohio Valley where periods of warm, dry weather, particularly late in the month, promoted crop maturation and harvesting. Meanwhile, intermittent showers across the northern and western Corn Belt and northern half of the Great Plains continued to hamper harvest progress. By November 2, corn harvesting was 55 percent complete, 24 points behind average. North Dakota was 58 points behind their average pace while Nebraska and South Dakota were 39 and 35 points behind, respectively. States in the Mississippi Valley trailed their average harvest pace between 26 and 36 points. The first half of November brought cold temperatures and wet conditions to the western half of the Corn Belt and northern Great Plains, severely slowing the already delayed corn harvest. Dry weather returned to these areas by mid-month which helped promote corn harvesting and by November 23, corn harvesting was 89 percent complete, 8 points behind normal. Harvest progress was 40 points behind normal in North Dakota and 22 points behind in South Dakota. Harvest was lagging at least 10 points in Iowa, Missouri, and Nebraska. Sorghum: Grain production in 2008 is estimated at 472 million bushels, up 2 percent from the November forecast but 5 percent below 2007. Planted area is estimated at 8.28 million acres, up 7 percent from last year. Area harvested for grain, at 7.27 million acres, is up 7 percent from 2007. Average grain yield, at 65.0 bushels per acre, is up 2.0 bushels from the previous forecast but down 8.2 bushels from last year. Texas led the Nation in area planted for all purposes and silage production, while Kansas led the Nation in grain production. Although area harvested for grain decreased from last year in 15 of the 21 estimating States, Texas and Kansas increased their acres by 25 and 4 percent, respectively, to boost the U.S. total above 2007. The yield in the two largest sorghum-producing States of Kansas and Texas decreased 1 and 13 bushels per acre, respectively, from 2007.
Crop Production 2008 Summary Agricultural Statistics Board January 2009 79 NASS, USDA
Silage production is estimated at 5.65 million tons, up 8 percent from 2007. Area cut for silage is 408,000 acres, up 4 percent from the previous year. Silage yields averaged 13.8 tons per acre, up 0.40 tons per acre from last year. In the two largest producing States, Kansas producers experienced a record yield of 13.0 tons while Texas yield, at 15.0 tons, was unchanged from last year’s record yield. Planting was delayed in some areas due to floods and hurricanes, however nearly all the crop was planted by the end of June. Adequate to abundant precipitation throughout the major producing States aided the crop condition considerably. Cool weather conditions delayed maturation and harvest of the crop. By October 26, eighty-three percent of the acreage was at or beyond maturity, 7 points behind the normal pace. Harvest was 88 percent complete by November 23, three points behind the 5-year average. Oats: The 2008 production is estimated at a record low 88.6 million bushels, down 2 percent from last year. The estimated yield is 63.5 bushels per acre, up 3.4 bushels from the previous year. Area planted to oats is estimated at a record low 3.22 million acres, down 15 percent from 2007. Harvested area, at 1.40 million acres, is 7 percent below last year. This is the smallest acreage harvested for grain on record, continuing a steady downward trend. The largest decline occurred in North Dakota, where area harvested for grain decreased 130,000 acres from last year. In Washington, favorable growing conditions led to a 30 bushel increase in yield from last year’s 50 bushels. In North Carolina and Texas, producers reported large increases of 25 bushels and 10 bushels per acre, respectively, while in North Dakota, average yield declined 24 bushels from last year. During early spring, planting of the oat crop lagged behind the normal pace. By April 27, growers had planted 54 percent of the acreage, 14 points behind normal. During April, emergence also trailed behind the normal pace. By the end of April, emergence was 33 percent complete, 9 points behind the average. However, by May 25 the crop had advanced to the 5-year average of 98 percent planted and 84 percent emerged, 7 points behind the normal pace. Through June, crop development was behind normal in all major oat-producing States. As of June 29, sixty-two percent of the oat acreage was headed, 15 points behind the 5-year average. The crop was most advanced in Texas and Ohio, where 100 percent and 94 percent, respectively, was at or beyond the heading stage. Progress was well behind the normal pace in all major producing States except Texas, Ohio, and Pennsylvania. By August 3, thirty-four percent of the oat acreage was harvested, 18 points behind the normal pace. Harvest in Texas was complete with Nebraska following closely behind at 86 percent. In North Dakota, only 12 percent of the oat crop was harvested, 10 points behind normal. By August 24, harvest was 88 percent complete in the major producing States, 3 points behind the 5-year average. Barley: Production is estimated at 239 million bushels, unchanged from the Small Grains 2008 Summary but 14 percent above 2007. Average yield per acre, at 63.6 bushels, is up 3.6 bushels from last year. The area harvested for grain is estimated at 3.77 million acres, 8 percent above a year ago. Harvested area increased from last year in the top two producing States, up 150,000 acres in North Dakota and up 30,000 acres in Idaho. These increases in harvested acres coupled with increased or unchanged yields in the top producing States resulted in the increased production. Planting was delayed early in the season, especially in Idaho and Washington. By May 18, planting progress had caught up to last year’s pace and was 6 points ahead of the 5-year average. Emergence was slow early due to planting delays, cooler weather in the west, and wet weather in the upper Mississippi Valley. By June 1, ninety-one percent of the crop had emerged, 2 points ahead of normal. Despite early delays, heading progress was at the average pace by July 20. Harvest began in mid-July and progressed about a week behind the 5-year average. Condition ratings declined each week in July, finishing the month with 53 percent rated good to excellent. Condition ratings remained relatively unchanged for the remainder of the growing season. All Wheat: Production totals 2.50 billion bushels in 2008, unchanged from the Small Grains 2008 Summary but up 22 percent from 2007. Grain area is 55.7 million acres, up 9 percent from last year. The U.S. yield is 44.9 bushels per acre, up 4.7 bushels from last year. The levels of production and changes from last year by type are winter wheat, 1.87 billion bushels, up 25 percent; other spring wheat, 547 million bushels, up 14 percent; and Durum wheat, 84.9 million bushels, up 18 percent. Winter Wheat: The 2008 winter wheat production is estimated at 1.87 billion bushels, unchanged from the Small Grains 2008 Summary but up 25 percent from last year. The U.S. yield is 47.2 bushels per acre, up 5.5 bushels from last year’s final yield. Planted acreage is up fractionally from the Small Grains 2008 Summary. This change to the acreage estimate is based

Crop Production 2008 Summary Agricultural Statistics Board January 2009 80 NASS, USDA
on updated administrative data received after the Small Grains 2008 Summary. Area harvested for grain is estimated at 39.6 million acres, up 10 percent from the previous year. Hard Red Winter harvested acreage is up about 1 percent from the previous year while Soft Red Winter harvested acreage is up about 43 percent. Hard Red Winter (HRW) planted acreage is down from last year due to dry conditions at planting time in the Great Plains States. Although fewer acres of wheat were planted in Kansas and Oklahoma, producers saw good harvest conditions compared with last year’s flood and freeze damaged crops which resulted in an increase in harvested acres in these States in 2008. Oklahoma’s production is up 70 percent from 2007 and Kansas’ production is up 25 percent. Colorado and Texas experienced drought situations that reduced production 38 percent and 30 percent, respectively. Overall, HRW production totals 1.0 billion bushels, up 8 percent from last year’s 956 million bushels. Favorable conditions along with high wheat prices during the fall resulted in more acreage planted to wheat across all of the Soft Red Winter (SRW) growing region. This is the third straight year of larger planted area in the southern SRW growing areas with harvested area also increasing sharply. Production of SRW wheat is up from last year when yields were reduced by an early April freeze. Good growing conditions resulted in record yields in many States. Overall, SRW production is 614 million bushels, up 74 percent from last year when 352 million bushels were produced. White Winter production is 219 million bushels, up 14 percent from last year. Harvested acreage in the Pacific Northwest States (Idaho, Oregon, and Washington) is above last year’s level. In Washington, yields are down from last year due to a lack of rain and unseasonably high temperatures during the growing season. Although the Idaho and Oregon crops faced dry weather in May and June, conditions improved and yields were up 2 bushels and 5 bushels from a year ago, respectively. Other Spring Wheat: Production for 2008 is estimated at 547 million bushels, unchanged from the Small Grains 2008 Summary but up 14 percent from last year. Harvested area is 13.5 million acres, up 4 percent from 2007. The U.S. yield is 40.5 bushels per acre, up 3.4 bushels from last year. Yields are above last year’s level in all States except Colorado, Oregon, Utah, and Washington. Spring wheat planting in the six major producing States started off at normal or ahead of normal; however, crop development and maturation continued behind normal throughout the growing season. Hot and dry weather during July caused the crop condition ratings to decline and accelerated maturation, but crop progress remained behind normal. Harvest progress lagged behind the normal pace in all States in the growing area. Durum Wheat: Production for 2008 totaled 84.9 million bushels, unchanged from the Small Grains 2008 Summary but up 18 percent from 2007. Grain area harvested is 2.58 million acres, up 22 percent from the previous year. The U.S. yield is estimated at 32.8 bushels per acre, down 1.3 bushels from 2007. In the northern Great Plains, warm, dry conditions during the months of June and July accelerated crop development and decreased the yield from last year. Yields are below last year’s level in all States except California. Rice: Production in 2008 is estimated at 204 million cwt, up slightly from the previous forecast and up 3 percent from 2007. Planted area is estimated at 3.00 million acres, up 8 percent from 2007. Area for harvest, at 2.98 million acres, is up 2 percent from the previous forecast and up 8 percent from the previous crop year. The average yield for all U.S. rice is estimated at 6,846 pounds per acre, down 113 pounds from the previous forecast and 373 pounds below the 2007 record high yield of 7,219 pounds per acre. Planted and harvested acreage were up from 2007 in all rice producing States except California. Arkansas, the largest rice producing State, planted 1.40 million acres in 2008, up 5 percent from the previous year. Historically high prices, due in part to export restrictions in several rice producing countries in the first part of 2008, were the main reason for the increase in acreage. Lower yields in 2008 were largely caused by Hurricanes Gustav and Ike which brought heavy rains and wind to the Lower Mississippi Valley and Texas during the first half of September. Gustav made landfall on September 1 in Louisiana and Ike made landfall on Galveston Island, Texas on September 13. Most growers in the southern part of Louisiana and the costal areas of Texas were able to harvest their crop prior to the storms. However, damage was reported from northern Louisiana through Mississippi, Arkansas, and Missouri. Many growers in Louisiana and Texas were unable to get a second crop this year due to flooding. Crop maturity and harvest ran behind normal in Arkansas, Mississippi, and Missouri due to late planting caused by wet field conditions in the spring. Long grain rice yielded 6,522 pounds per acre across the Nation with production at 153 million cwt. Medium grain rice yielded 8,203 pounds per acre in 2008 with production at 47.2 million cwt. Short grain rice yielded 6,490 pounds per acre with production at 3.31 million cwt.

Crop Production 2008 Summary Agricultural Statistics Board January 2009 81 NASS, USDA
Rye: Production for 2008 is estimated at 7.98 million bushels, up 26 percent from last year. Harvested area totaled 269,000 acres, up 17,000 acres from 2007. The U.S. yield, at 29.7 bushels per acre, is up 4.7 bushels from last year. Georgia leads the Nation in production with 1.20 million bushels produced in 2008. Good moisture conditions in the State contributed to higher yields and production compared with the 2007 crop. Proso Millet: Production of proso millet in 2008 totaled 14.9 million bushels, down 12 percent from 2007 but 46 percent higher than 2006. Planted area, at 520,000 acres, is down 9 percent while harvested area, at 460,000 acres, is down 12 percent from last year. Of the three States in the estimating program, harvested acreage was unchanged from 2007 in Nebraska but decreased in Colorado and South Dakota. The average yield is estimated at 32.3 bushels per acre, down 0.2 bushel from last year. All Hay: Production of dry hay for 2008 is estimated at 146 million tons, down 3 percent from the October 1 forecast and down 1 percent from the 2007 total. Area harvested, at 60.1 million acres, is down 1 percent from the October forecast and down 2 percent from 2007. The average yield, at 2.43 tons per acre, is down 0.06 ton from October but up 0.02 ton from the previous year. Alfalfa and Alfalfa Mixtures: Hay production in 2008 is estimated at 69.6 million tons, down 3 percent from the October 1 forecast and down slightly from 2007. Harvested area, at 21.0 million acres, is 1 percent above the October forecast but 1 percent below the previous year. The average yield is 3.32 tons per acre, 0.12 ton below the previous forecast but 0.01 ton above 2007. Compared with 2007, Minnesota showed the largest increase in harvested acres, up 250,000 acres from last year. South Dakota and North Dakota growers harvested 200,000 and 110,000 acres more than last year, respectively. States with the largest decreases in harvested acres included Nebraska, down 130,000 acres, and Kansas and Montana, each down 100,000 acres. Yields are up in nearly all Corn Belt States, Rocky Mountain States, and the eastern portions of the U.S. Yields are down in the extreme Western States as well as the northern Missouri Valley area and extreme southern Great Plains. All Other Hay: Production in 2008 totaled 76.1 million tons, down 4 percent from the October 1 forecast and down 1 percent from 2007. Area for harvest, at 39.1 million acres, is down 1 percent from October and 2 percent below last year. The average yield is estimated at 1.95 tons per acre, down 0.04 ton from October but up 0.02 ton from last year. Nearly all States east of the Mississippi experienced higher yields or unchanged yields from the previous year except Louisiana, Michigan, Pennsylvania, Maine, and Vermont. The Corn Belt States also experienced yield increases with Indiana, Minnesota, and Wisconsin leading the way with 0.30 ton increases from last year’s yields. Texas yields decreased the most with a 0.70 ton per acre decrease from last year followed by North Dakota with a decrease of 0.45 tons per acre. The Western State’s yields were mostly unchanged, except in California and Arizona where yields increased 0.50 and 0.40 tons per acre, respectively. Decreases in acreage were widespread west of the Mississippi while nearly half the States east of the Mississippi decreased and half increased acreage. The largest decrease occurred in Texas, down 900,000 acres from last year. Oklahoma was second with a 200,000 acre decrease. Forage: Eighteen States participate in the forage estimation program, which measures annual production of forage crops, with an emphasis on total alfalfa production. Haylage and greenchop production is converted to 13 percent moisture and combined with dry hay production to derive the total forage production. The total 2008 all haylage and greenchop production for the 18 States in the forage program is 32.3 million tons, of which 22.4 million tons are from alfalfa and alfalfa mixtures. Wisconsin, the leading haylage and greenchop producing State, harvested 1.50 million acres of all haylage and greenchop in 2008, of which 1.40 million were alfalfa and alfalfa mixtures. All haylage and greenchop acreage in Wisconsin for 2008 is 3 percent higher than the previous year. The 18 State total forage area harvested is 36.4 million acres, including 15.9 million acres from alfalfa and alfalfa mixtures. The total forage harvested area is 1.1 million acres lower than 2007 and the total forage production is down 2 percent from the last year. New Seedings of Alfalfa and Alfalfa Mixtures: Growers seeded 2.70 million acres of alfalfa and alfalfa mixtures during 2008, down 5 percent from the 2007 seeded area of 2.83 million acres. The largest decrease occurred in Montana, down 50,000 acres from 2007 while the largest increase was in Wisconsin with an additional 50,000 acres. The new seedings of alfalfa and alfalfa mixtures will normally be harvested for the first time in the year following planting. Peanuts: Production is estimated at 5.15 billion pounds, up 3 percent from the previous forecast and 40 percent more than was produced in 2007. The 2008 crop is the largest U.S. crop on record. Planted area is estimated at 1.53 million acres, up 25 percent from 2007. Higher prices received in 2007, coupled with attractive contract prices in 2008, were the main reasons
Crop Production 2008 Summary Agricultural Statistics Board January 2009 82 NASS, USDA
for the increase in acreage. Area for harvest is estimated at 1.51 million acres, up 26 percent from 2007. Yields are estimated at a record high 3,416 pounds per acre, up 74 pounds from the previous forecast and up 343 pounds from 2007. The 2008 average yield is 257 pounds above the previous record of 3,159 pounds per acre set in 2003. Timely rainfall, crop rotation, and minimal insect and disease pressure led to the record high yields. Production in the Southeast States (Alabama, Florida, Georgia, Mississippi, and South Carolina) is estimated at 3.76 billion pounds, up 3 percent from the previous forecast and up 46 percent from 2007. Planted area is estimated at 1.13 million acres, up 26 percent from 2007. Harvested area is estimated at 1.11 million acres, up 27 percent from the previous crop year. Yields in the region are estimated at 3,397 pounds per acre, up 71 pounds from the previous forecast and 435 pounds higher than the 2007 average yield. Yields in all the Southeast States are up from 2007, and record yields are estimated in Alabama, Mississippi, and South Carolina. Virginia-North Carolina production is estimated at 438 million pounds, up 4 percent from the previous forecast and up 40 percent from 2007. Planted area is estimated at 122,000 acres, up 7 percent from the previous crop year. Area for harvest, which is estimated at 121,000 acres, is up 9 percent from 2007. The average yield is estimated at 3,621 pounds per acre, up 140 pounds from the previous forecast and up 796 pounds from 2007. Yields in both States are record highs. Southwest peanut production (New Mexico, Oklahoma, and Texas) is estimated at 949 million pounds, up 3 percent from the previous forecast and up 21 percent from 2007. Planted area is estimated at 284,000 acres, up 30 percent from the previous crop year. Acreage for harvest is estimated at 279,000, up 30 percent from 2007. The average yield for the region is estimated at 3,401 pounds per acre, up 56 pounds from the previous forecast but down 252 pounds from the previous year. Disease pressure and dry conditions in some areas of Texas led to lower yields in the State compared with 2007, and is the main reason for the decline in the regional yield. Canola: Production in 2008 is 1.45 billion pounds, up 1 percent from 2007 but down 3 percent from the October forecast. The yield, at 1,461 pounds per acre, is up 223 pounds from last year’s yield but down 53 pounds from October. The yield is the third highest since records began in 1991. Planted area is estimated at 1.01 million acres, 14 percent below last year’s acreage. Harvested area, at 989,000 acres, is also down 14 percent from 2007. Production in North Dakota, the leading canola-producing State, is estimated at 1.31 billion pounds, down less than 1 percent from last year. Although the yield in North Dakota was up 230 pounds from 2007, harvested area was down 16 percent from the previous year. Sunflower: The 2008 sunflower production totaled 3.42 billion pounds, up 19 percent from 2007. The U.S. average yield per acre increased 3 pounds from last year to 1,429 pounds. Planted area, at 2.52 million acres, is 22 percent above last year. Area harvested increased 19 percent from last year to 2.40 million acres. Production in North Dakota, the leading sunflower-producing State, is estimated at 1.51 billion pounds, up less than 1 percent from 2007. The yield in North Dakota, at 1,399 pounds per acre, is down 24 pounds from 2007. Compared with last year, planted and harvested area in North Dakota increased by 4 and 2 percent, respectively. Yields, compared with last year, are down in all major sunflower-producing States except Nebraska and South Dakota. The yield in South Dakota, at 1,769 pounds per acre, is up 226 pounds from last year and is the highest yield on record. U.S. production of oil-type sunflower varieties, at 2.99 billion pounds, increased 21 percent from 2007. Harvested acres are up 20 percent from the previous year and the yield increased by 7 pounds to 1,452 pounds per acre. A record high yield for oil-type sunflower varieties in South Dakota was set at 1,780 pounds per acre. Production of non-oil sunflower varieties, at 429 million pounds, increased 11 percent from last year. Area harvested, at 334,000 acres, is up 14 percent from 2007. The average yield decreased by 30 pounds from last year to 1,285 pounds per acre. As harvest of sunflowers began in early October, progress in Colorado was well ahead of normal but lagged behind normal in Kansas, North Dakota, and South Dakota. As of October 5, harvest was 29 percent complete in Colorado, compared with the 5-year average of 24 percent. Meanwhile, Kansas, North Dakota, and South Dakota were 14, 6, and 11 percentage points behind normal, respectively. Through October, harvest in Kansas and the Dakotas progressed behind last year and the 5-year average as periods of heavy rain during the month slowed harvest. By October 26, harvest was only 22 percent complete Nationwide, compared with the 5-year average of 53 percent. By November 23, harvest progressed to 85 percent complete, 12 points behind normal. Soybeans: Production in 2008 totaled 2.96 billion bushels, up 1 percent from the November forecast and up 11 percent from 2007. U.S. production is the fourth largest on record. The average yield per acre is estimated at 39.6 bushels, 0.3 bushel above the November forecast but 2.1 bushels below last year=s yield. Planted area for the Nation, at a record 75.7 million

Crop Production 2008 Summary Agricultural Statistics Board January 2009 83 NASS, USDA
acres, is up 17 percent from 2007. Soybean growers harvested a record 74.6 million acres, up 16 percent from last year and up slightly from November. Yields are down from last year across most of the Great Plains and the northern Corn Belt, as well as in Louisiana, Mississippi, New Jersey, and Pennsylvania. The biggest declines from last year occurred in Louisiana, Ohio, and Texas, as yields in all three States were down 10 bushels or more from 2007. Yields were down in Louisiana and parts of Texas due to the torrential rains and flooding caused by Hurricanes Gustav and Ike. In Ohio, yields were lower due to the combination of wet weather early in the year and very dry weather for the remainder of the growing season. Yields are much higher than last year in Tennessee, Kentucky, and across most of the Southeast, as timely rains fell during the season which was a significant improvement from last year when drought conditions affected much of the region. Record high yields were set in Florida and South Carolina, and the record high yield was tied in New York. The 2008 soybean objective yield survey data indicate that final average pod counts were lower than last year in eight of the eleven objective yield States. Compared with last year, pod counts were down more than 10 percent in Nebraska and down more than 15 percent in Ohio. The only States that showed an increase in pod counts from last year were Arkansas, Indiana, and Kansas. Planting of the 2008 soybean crop began slowly as wet, cool weather during April across most of the major growing areas delayed progress. The month of May began with all States, except Louisiana and Nebraska, behind last year’s pace; and with the exception of Louisiana, all States were at or behind their 5-year average. Planting progress continued to be hampered in early May as heavy spring rains fell across much of the Great Plains and Corn Belt, and below normal temperatures were felt from the southern Plains into the eastern Corn Belt and the Mid-Atlantic States. As of May 18, only 27 percent of the soybean acreage was planted, 25 points behind last year and 20 points behind the 5-year average. Progress was 40 points or more behind last year’s pace in Illinois, Indiana, Minnesota, and Ohio. Planting progressed well through the rest of the month as fields began to dry, advancing to 69 percent complete by June 1, but remaining 12 points behind the 5-year average. In turn, the crop began emerging well behind normal, as only 32 percent of the crop had emerged by June 1, twenty-three points behind the 5-year average. In early June, planting was delayed further by flooding rains in parts of the Corn Belt, but beneficial conditions during the remainder of the month allowed planting to reach 95 percent complete by June 29. Emergence of the crop continued to progress behind normal throughout the month, and as of June 29, was 6 points behind the 5-year average. Emergence was the farthest behind in Missouri, where only 61 percent of the crop had emerged by the end of June, 32 points behind the 5-year average. In general, the U.S. crop developed well during July, but blooming and pod setting remained behind the normal pace due to the late start. By August 3, seventy-eight percent of the Nation’s crop was blooming, 12 points behind last year and 10 points behind normal. Thirty-seven percent of the acreage was setting pods by August 3, compared the 5-year average of 58 percent. The percentage of the crop setting pods was behind normal in all States except Michigan, North Carolina, and Tennessee. The crop developed rapidly during August and progress had nearly returned to normal by the end of the month. As of August 31, ninety-four percent of the U.S. crop was at or beyond the pod-setting stage, behind last year and the 5-year average by only 4 and 3 points, respectively. The only State where pod-setting was not within 4 points of the normal pace was Missouri, where only 69 percent of the soybeans were at or beyond the pod-setting stage, 25 points behind normal. As of August 31, fifty-seven percent of the U.S. soybean crop was rated in good to excellent condition, a decrease of 6 points from the rating of 63 percent on August 3. Crop conditions declined or remained unchanged during August across the Corn Belt and Great Plains, with the exception of Kansas. Decreases of more than 10 points in percent rated good to excellent occurred in Indiana, Kentucky, Ohio, Michigan, Tennessee, and Wisconsin as abnormally dry conditions prevailed in those areas. Nationally, the soybean crop continued to mature later than normal during September as plants dropped leaves at a pace that was behind normal in all major soybean-producing States except Louisiana, Michigan, and North Dakota. As of September 28, sixty-eight percent of the acreage was dropping leaves or beyond, 13 points behind the 5-year average. The percent of acreage dropping leaves was more than 20 points behind the 5-year average in Arkansas, Illinois, Mississippi, and Missouri. As of September 28, fifty-seven percent of the U.S. soybean crop was rated in good to excellent condition, unchanged from both the end of August and the same week in 2007. With the exception of Illinois, Kansas, and Nebraska, crop conditions declined or remained unchanged during September across the Corn Belt and Great Plains. The biggest decline in percent rated good to excellent occurred in Louisiana, down 20 points from the previous month due to the excessive wind and rain from Hurricane Gustav at the beginning of September. Harvesting began later than normal as only 9 percent of the U.S. crop was harvested by September 28, compared with the 5-year average of 21 percent. Harvest progress was behind normal in all major soybean-producing States except Ohio, which was 1 point ahead of normal.

Crop Production 2008 Summary Agricultural Statistics Board January 2009 84 NASS, USDA
During October, there were some minor harvest delays due to periods of rain. However, in general, harvest progressed well during October, and by the end of the month was within a few percentage points of normal. As of November 2, growers had harvested 86 percent of their acreage, compared with 90 percent last year and the 5-year average of 89 percent. Harvest progress lagged behind normal in the majority of States, but was at or ahead of normal in the Great Lakes States, Kentucky, Louisiana, and Ohio Valley. By November 16, conditions had allowed harvest to progress to 95 percent complete, 2 points behind last year and 1 point behind the 5-year average. Flaxseed: Production of flaxseed in 2008 totaled 5.72 million bushels, down 3 percent from last year and 48 percent below 2006. Harvested area totaled 340,000 acres in 2008, down 3 percent from last year while the average yield, at 16.8 bushels per acre, is down 0.1 bushel from 2007. Production decreased from the previous year in all four States in the estimating program (Minnesota, Montana, North Dakota, and South Dakota). In North Dakota, the leading flaxseed-producing State, production totaled 5.49 million bushels in 2008, down 1 percent from 2007. Growers harvested 323,000 acres of flaxseed, up 2 percent from last year. The average yield in North Dakota is estimated at 17.0 bushels per acre, down 0.5 bushel from last year. Safflower: Production of safflower in 2008, at 310 million pounds, is up 47 percent from 2007 and is the largest production since 1999. Growers planted 202,000 acres in 2008, an increase of 12 percent from last year, while harvested area, at 195,000 acres, is up 14 percent from the previous year. The yield, at 1,592 pounds per acre, increased 364 pounds from 2007. California producers led the Nation, producing 250 million pounds of safflower which was more than double their production for 2007. Other Oilseeds: Mustard seed production for 2008 increased 19 percent from last year to 41.3 million pounds. Planted area, at 79,500 acres, is up 33 percent and harvested area, at 71,500 acres, is up 25 percent from 2007. Yields averaged 577 pounds per acre, 31 pounds below a year ago. Rapeseed production decreased 75 percent from 2007 to 300,000 pounds, which is the lowest production since estimates began in 1991. Growers planted 200 acres of rapeseed in 2008, a decrease of 1,400 acres from last year. Harvested area, at 200 acres, is down 900 acres from last year. The average yield is 1,500 pounds per acre, up 400 pounds from last year. Cotton: Upland cotton production is estimated at 12.6 million 480-pound bales, down 4 percent from the December 1 forecast and down 31 percent from last year. The U.S. yield for upland cotton is estimated at 799 pounds per acre, down 34 pounds from last month and down 65 pounds from last year’s record high. Harvested area, at 7.56 million acres, is down slightly from last month and down 26 percent from last year. Upland planted area, estimated at 9.30 million acres, is down 12 percent from last year. Upland growers in the Southeastern States (Alabama, Florida, Georgia, North Carolina, South Carolina, and Virginia) finished planting by late June. By late summer, producers battled hot, dry conditions which allowed the crop to develop ahead of normal. During late August and early September, the region was hit by two storms, Tropical Storm Faye and Hurricane Hannah. Both of these weather patterns brought beneficial rains to the region. By the end of September, dry conditions and cooler temperatures allowed producers to begin defoliation and harvest to begin throughout the region. Harvest was complete by early December. Objective yield measurements in Georgia showed boll counts to be slightly higher than the 5-year average. Producers in Alabama and South Carolina reported record high yields, surpassing the records set in 1985 and 2004, respectively. In the Delta States (Arkansas, Louisiana, Mississippi, Missouri, and Tennessee) producers finished planting by the middle of June, behind normal due to the unseasonable cool, wet spring. Due to the later planted crop and the cool summer, the crop developed slightly behind normal except in Louisiana where the crop matured rapidly during the summer months. By the end of August, defoliation and harvest was underway in Louisiana, ahead of normal. On September 1, Hurricane Gustav made landfall in Louisiana bringing excessive amounts of rain to the South Delta region. By the second week of September, the region was hit by Hurricane Ike. Warmer temperatures and drier weather moved into the region by late September allowing producers to resume defoliation. Harvest was underway throughout the region by the first week of October, behind normal, and complete by the end November. The objective yield data show Mississippi bolls per acre to be the second lowest in the last 5 years. In Arkansas, objective measurements show the largest bolls per acre in the last 10 years. Data from the objective yield survey showed Louisiana bolls per acre and boll weight to be the lowest in the last 6 years. Due to the effects of Hurricane Gustav, Louisiana producers abandoned 60,000 acres and harvested their lowest area on record. Producers in Missouri reported record high yield surpassing the record set in 2004. Texas producers finished planting the upland crop by mid-June, slightly ahead of normal. Continual hot, dry weather allowed the crop to develop ahead of normal. Due to the early developing crop, harvest was underway in South Texas by late-July.
Crop Production 2008 Summary Agricultural Statistics Board January 2009 85 NASS, USDA
Harvest in South Texas was delayed during the first part of August when the region was hit with Hurricane Dolly. Producers in the High Plains of Texas battled hot, dry conditions throughout the summer and early fall months. During the second week of September, Hurricane Ike made landfall bringing high winds and rain throughout Texas. During the fall, cool, wet weather moved through the High Plains delaying crop development and harvest activities. In late October, the Panhandle of Texas was hit with a hard freeze which allowed for defoliation to expand rapidly. During November, producers received ideal weather and were able to harvest the crop without interruptions. Harvest was virtually complete by late-December. Objective yield measurements show Texas boll weights to be the second heaviest in the last ten years. Due to the drought conditions during the summer and abnormally cool weather in the fall, Texas producers abandoned 1.60 million acres of the 5.00 million acres planted. In Kansas and Oklahoma, planting was complete by the end of June. Throughout the summer and fall, the crop developed normally with harvest underway by the end of October. Harvest was complete by the last week of December. Producers in Kansas expect a record high yield surpassing last year’s record. Upland producers in California and Arizona completed planting by mid-May. During the late summer, California producers battled intensely hot, dry weather. By late August, harvest was underway in the Desert Southwest, slightly ahead of normal. By the middle of September, cooler temperatures in California allowed for defoliation and harvest to begin throughout the State. Harvest was complete in California and Arizona by mid-December. California producers planted and harvested the lowest acreage since records began for upland cotton. American-Pima producers planted 174,000 acres, down 40 percent from last year. Harvested area, at 169,400 acres, is down 41 percent from last year. Production is estimated at 446,600 bales (480-pound), up 1 percent from December but down 48 percent from last year’s record high. The U.S. yield is estimated at 1,265 pounds per acre, up 11 pounds from December but down 154 pounds from last year. Producers were finished planting by the end of June. The crop developed normally throughout the summer and fall. Harvest got underway by late September and was complete by mid-December. American-Pima acreage in Arizona for both planted and harvested is the lowest on record. All cotton ginnings totaled 11,611,650 running bales prior to January 1, compared with 15,700,350 running bales prior to the same date last year and 19,211,850 running bales ginned to January 1, 2007. Cottonseed: Production for 2008, based on a 3-year average lint-seed ratio, is expected to total 4.43 million tons, down 33 percent from last year. Tobacco: U.S. all tobacco production for 2008 totaled 801 million pounds, 1 percent below the October forecast but up 2 percent from 2007. Growers harvested 354,190 acres, down 1 percent from the previous forecast and a year ago. Yield averaged 2,260 pounds per acre, down 1 pound from the previous forecast but 47 pounds greater than 2007. Flue-cured tobacco production totaled 499 million pounds, 2 percent below the previous forecast and down 1 percent from last year. Harvested acre totaled 223,000 acres in 2008, down 2 percent from the October 1 forecast but unchanged from a year ago. Acreage in North Carolina increased while acreage decreased in all other flue-cured States. Yields averaged 2,239 pounds per acre, 6 pounds below the last forecast and down 20 pounds from 2007. Yield per acre decreased from a year ago in all States except Virginia. Dry conditions early in the growing season combined with excessive rains later on reduced yields in most States. Burley production totaled 201 million pounds, up 2 percent from the October forecast but 7 percent below last year. Growers harvested 97,200 acres, down 1 percent from the previous forecast and 9 percent below 2007. This is the lowest acreage on record. The previous low of 100,150 acres was in 2005, the first year after the tobacco buyout eliminated quotas. Yields averaged 2,068 pounds per acre, 9 pounds above October and 35 pounds above a year ago. Growers in Tennessee, the second largest burley producing State, experienced the most significant increase in yield. Yields in Tennessee were up 300 pounds per acre over last year’s drought afflicted crop. Yields also increased in Virginia and North Carolina. In Kentucky and Ohio yields remained unchanged from a year ago, while yields in Pennsylvania and Missouri declined. Sugarbeets: Production for 2008 is estimated at 26.8 million tons, 5 percent below the November forecast and 16 percent below the 2007 estimate. Estimated yield, at 26.7 tons per acre, is 1.2 tons higher than last year but 0.1 ton below November. Growers harvested 1.00 million acres, 19 percent below last year. Area planted, at 1.09 million acres, is 14 percent below the 2007 estimate. Growers in Colorado and Michigan saw record high yields in 2008. Yields were up from last year in all States except Idaho, Nebraska, and Washington; however, production was down in all States except Michigan and Washington. The lower production resulted from fewer acres planted and harvested.

Crop Production 2008 Summary Agricultural Statistics Board January 2009 86 NASS, USDA
Sugarbeet planting started behind normal in all States. However, producers were able to make rapid progress and completed planting on schedule in most areas. In the Red River Valley, the effects of an extremely wet fall prevented farmers from starting harvest on time and some from finishing their harvest. When soil conditions became favorable, little time remained for producers to harvest their sugarbeets. Harvest in all States was complete by late November. Sugarcane: Production of sugarcane for sugar and seed in 2008 was 30.7 million tons, 29.2 million tons for sugar and 1.50 million tons for seed. Production of cane for sugar and seed is up 3 percent from the December forecast and up 2 percent from the 2007 production. Sugarcane growers harvested 869,500 acres for sugar and seed during the 2008 crop year, 1 percent less than last year. This is the lowest area harvested for sugar and seed since 1990. Yield is estimated at 35.3 tons per acre, up 0.9 ton from December and up 1.2 tons from last year. Harvested area is down from last year in all States except Florida, which is up 8,000 acres. Harvest was complete in both Florida and Louisiana by late December. Yields are above last year in Florida, Hawaii, and Texas but lower in Louisiana. Dry Beans: U.S. dry edible bean production is estimated at 25.6 million cwt for 2008, down 1 percent from the December forecast and slightly below last year. Harvested area is estimated at 1.45 million acres, virtually unchanged from the December forecast but 2 percent below 2007. The average U.S. yield is estimated at a record high 1,768 pounds per acre, a decrease of 6 pounds from the last forecast but 38 pounds higher than last year. Production increased from a year ago for large lima, navy, great northern, light red kidney, dark red kidney, small red, and cranberry beans. Production in North Dakota is estimated at 10.0 million cwt, 7 percent below 2007. Harvested acres decreased 4 percent, while the average yield, at 1,570 pounds per acre, was down 50 pounds from last year. Harvest was essentially complete by the beginning of November, slightly behind last year and the 5-year average. In Idaho, production is estimated at 1.46 million cwt, 9 percent below last year. The average yield, at 1,850 pounds per acre, is down 50 pounds from last season. Reduced yields for most small seeded classes were due to fields being planted at later than average dates. Chickpea yields in the northern part of the State recovered somewhat from last year’s low yields. California growers produced 960,000 cwt, down 21 percent from last year. The average yield, at 1,850 pounds per acre, is down 240 pounds from 2007. Washington production is estimated at 885,000 cwt, down 13 percent from 2007. Despite an increase in the average yield, production is down due to a decrease of 17 percent in harvested acres. In Michigan, production is estimated at 3.61 million cwt, 16 percent above last year. Harvested area, at 195,000 acres, is unchanged from 2007, while the average yield of 1,850 pounds per acre is 250 pounds higher than last season. For the week ending October 5, the dry bean crop condition was rated 67 percent good to excellent, 42 points above the same time last year. Harvest was mostly complete by the end of October. Nebraska growers produced 2.89 million cwt of dry beans, 19 percent more than last year. Harvested acres increased 18 percent from 2007. The average yield, at 2,290 pounds per acre, is up 30 pounds from the previous year and is a new record high. Production in Minnesota, at 2.83 million cwt, is 8 percent more than last year. The average yield, at 1,950 pounds per acre, is up 150 pounds from the previous year and is a new record high. Lentils: Production of lentils is forecast at 2.41 million cwt, down 34 percent from last year. Area for harvest is forecast at 263,000 acres, down 11 percent from the previous year. Average yield is expected to be 917 pounds per acre, down 320 pounds per acre from 2007. North Dakota=s production, at 846,000 cwt, is down 41 percent from 2007. Harvested area is down 13 percent from last year, while the average yield decreased by 440 pounds per acre to 920. Planting started in mid-April and was complete by the third week of May. Soil moisture supplies were rated mostly short through May, improved to adequate during June, and regressed back to short during the remainder of the season. Additionally, below normal temperatures delayed crop development. Harvest of the crop started the last week of July and was essentially complete by early September. Wet conditions during August hampered harvest progress in some areas. Montana=s production is forecast at 608,000 cwt, down 38 percent from last year. Harvested area decreased 7 percent from 2007, while yields decreased by 380 pounds per acre to 770. During most of April and the beginning of May, Montana received light precipitation. Northeastern Montana experienced drought-like conditions during the season, which reduced yields. Washington=s production, at 605,000 cwt, is down 25 percent from 2007. Harvested area decreased by 18 percent to 55,000 acres with yields decreasing by 100 pounds per acre to 1,100. By mid-April, producers were able to begin planting. Temperatures were colder than normal but spring-like weather finally arrived in May. In July and August, conditions were hot and dry with temperatures reaching 100 degrees in some areas. Rain in late August slowed harvest, but afterwards, harvesting progressed normally and ended in late September.

Crop Production 2008 Summary Agricultural Statistics Board January 2009 87 NASS, USDA
Production in Idaho, at 352,000 cwt, is down 17 percent from last year. Harvested area is the same as last year at 37,000 acres. Average yield decreased 200 pounds per acre to 950. Wrinkled Seed Peas: Production is estimated at 580,000 cwt in 2008, up 7 percent from 2007. Idaho production, at 160,000 cwt, is up 19 percent from 2007. Production in Washington, at 420,000 cwt, increased 3 percent from last year. Dry Edible Peas: Production of dry edible peas is estimated at 12.3 million cwt, down 25 percent from the 2007 estimate. Area for harvest, at 847,300 acres, is 4 percent above a year ago. Average yield is estimated at 1,448 pounds per acre, down 560 pounds from last season. North Dakota’s dry edible pea production is estimated at 7.90 million cwt, down 27 percent from last season. Harvested acres, at 500,000, remained unchanged from last year’s level but yield decreased 590 pounds per acre from last season. Soil moisture supplies were rated mostly short through May, adequate during June, and short the remainder of the growing season. Below normal temperatures during the growing season delayed crop development. Harvest was essentially complete by the end of August, slightly behind last year. Production in Montana, at 2.50 million cwt, is down 32 percent from the 2007 estimate. Harvested area increased by 6 percent to 231,000 acres but yield decreased by 620 pounds per acre to 1,080. Drought-like conditions in northeastern Montana reduced yields for the 2008 crop. Production in Idaho is estimated at 540,000 cwt, up 32 percent from 2007. Harvested area, at 36,000 acres, increased 50 percent, while yield, at 1,500 pounds per acre, decreased 200 pounds from last year. Favorable dry pea prices encouraged farmers to increase planted acres. Washington’s production, at 1.20 million cwt, is 4 percent below last year. Area for harvest, at 75,000 acres, increased 14 percent from last season, while yield, at 1,600 pounds per acre, decreased 300 pounds. Mid-June temperatures set cold records throughout the growing region. In July and August conditions were hot and dry with temperatures reaching 100 degrees. Austrian Winter Peas: Production for the 2008 season is estimated at 104,000 cwt, down 6 percent from the November 1 forecast and 12 percent below 2007. Area harvested, at 8,000 acres, is 20 percent below last season. Average yield, at 1,300 pounds per acre, increased 120 pounds from 2007. Idaho production, at 56,000 cwt, is down 14 percent from last year. Montana’s production, at 29,000 cwt, is down 19 percent from last year, while Oregon’s production, at 19,000 cwt, increased 12 percent from a year ago. Winter Potatoes: California’s 2008 winter potato production is estimated at 2.53 million cwt, down 4 percent from the April estimate but 12 percent above 2007. Planted and harvested area in California remain unchanged from April, each at 11,000 acres, up 5 percent from 2007. Average yield is 230 cwt per acre, 10 cwt below the April estimate but 15 cwt above last year. Spring Potatoes: Production for 2008 is estimated at 20.1 million cwt, up 3 percent from the May forecast and 2 percent above 2007. Harvested area totaled 68,800 acres, up 2 percent from the previous forecast but down 2 percent from a year ago. The average yield of 293 cwt per acre is up 4 cwt from the May forecast and 11 cwt above 2007. Florida production is estimated at 7.95 million cwt, down 1 percent from the May 1 forecast but 2 percent above the 2007 production. In California, production increased 13 percent from last year due to a yield increase of 55 cwt per acre. Most growers reported excellent growing conditions with better than average yields. Production in Texas decreased 19 percent from 2007 largely due to an 11 percent decrease in harvested acres. Growers in North Carolina produced 7 percent fewer spring potatoes than in the previous year and production in Arizona decreased 6 percent from last year. Summer Potatoes: Growers produced 13.5 million cwt of summer potatoes in 2008, down 9 percent from the September forecast and down 15 percent from 2007. Harvested area, at 43,800 acres, is down 9 percent from last year. The average yield of 309 cwt per acre is 22 cwt below 2007. Production declined from the previous year in 8 of the 11 producing States. In Texas, production decreased 29 percent, largely due to a decline in harvested acres. Missouri potato fields received excessive rainfall during the spring, reducing yields by 110 cwt per acre from the previous year. In Virginia, weather conditions in the spring were fairly good for potato fields and the crop was reported in good condition. Colorado summer potato production increased 52 percent from the previous year due to an increase in harvested acres. In Alabama, production
Crop Production 2008 Summary Agricultural Statistics Board January 2009 88 NASS, USDA
increased 32 percent from 2007. Spring rains benefitted crop growth and growers reported good yields. In New Jersey, growing conditions improved after a dry summer and sufficient moisture late in the season helped tubers to size. Fall Potatoes: Production of fall potatoes for 2008 is estimated at 376 million cwt, up 1 percent from the December forecast but down 7 percent from last year. Area harvested, at 921,100 acres, is virtually unchanged from December but 7 percent lower than last year. The average yield is estimated at 409 cwt per acre, up 3 cwt from December but 1 cwt below last year’s record high. Idaho’s yield is forecast at 378 cwt per acre. This is the second highest yield on record, 8 cwt below the record yield set in 2006. Production in Idaho is down from last year due to a 13 percent decrease in harvested acres. In eastern Washington, potatoes were planted on time, but growth was delayed due to cool, wet weather in the early summer, which also delayed planting in the western part of the State. Potato size was smaller than last year, but quality was good. In Colorado, the growing season was favorable in the San Luis Valley, however, severe hail storms in August damaged plants just before vine killing. As a result, potato sizes were variable. Despite a slow start for the potato crop in Oregon, most growers reported normal to slightly below normal yields. In California, favorable weather conditions resulted in excellent crop quality and yields. In North Dakota, crop condition was rated fair to good throughout the growing season. Wisconsin growers reported a smaller crop than last year with good quality potatoes. In Michigan, there were low disease and insect pressures across the State and harvest was mostly complete by early November. In Maine, a wet growing season resulted in below average potato yields. Dry weather in September promoted excellent harvest and storage conditions. Massachusetts potato farmers battled wet conditions during the season, while growing conditions were excellent in Rhode Island. All Potatoes: Total 2008 U.S. potato production from all four seasons is estimated at 413 million cwt, 7 percent below the 2007 crop and down 6 percent from 2006. Harvested area, at 1.04 million acres, is down 7 percent from both 2007 and 2006. The average yield, at 395 cwt per acre, is down 1 cwt from last year’s record high yield but 2 cwt above 2006. By season, fall production is down 7 percent from the previous year, summer is down 15 percent, spring increased 2 percent, and winter increased 12 percent from 2007. Sweet Potatoes: Production of sweet potatoes in 2008 is estimated at 18.3 million cwt, up 1 percent from last season and 12 percent above 2006. Growers harvested 97,000 acres, down 1 percent from last year. Yield per acre, at 189 cwt, is up 3 cwt from last year and is a new record high. In North Carolina, record highs were set for both yield and production. Yield was up 35 cwt and production was up 31 percent from 2007. In Mississippi, delays from Hurricanes Fay, Gustav, and Ike actually benefitted sweet potato production, giving the potatoes more time to increase size in the fields. Unlike in Mississippi, Hurricanes Gustav and Ike damaged sweet potato fields in Louisiana, decreasing the number of fields harvested and reducing yields by 100 cwt from 2007. In California, yield was down 25 cwt from 2007, but the 9 percent increase in harvested acres resulted in increased production from last year. Peppermint Oil: Production in 2008 is estimated at 5.50 million pounds, down 2 percent from last year. Harvested area is estimated at 60,000 acres, down 6 percent from 2007. Washington’s harvested area, at 16,000 acres, is down 1,000 acres from a year ago. Acreage in Indiana, Oregon, and Wisconsin dropped from 2007, while Idaho and Michigan showed an increase from a year ago. Production decreased in Indiana, Washington and Wisconsin, while Idaho, Michigan and Oregon reported higher production than in 2007. Spearmint Oil: Production is estimated at 2.40 million pounds for 2008, down 4 percent from last year. Harvested area is estimated at 20,400 acres, up 3 percent from 2007. Average yield is estimated at 118 pounds of oil per acre, down 8 pounds from last year. Growers in Idaho and Washington showed increases in harvested acreage from a year ago, while Oregon and Wisconsin producers showed acreage decreases. Indiana and Michigan acres remained the same. Production increased in Idaho and Indiana, while Oregon, Washington, and Wisconsin showed a decrease. Hops: Production for Idaho, Oregon, and Washington in 2008 totaled 80.6 million pounds, up 34 percent from the 2007 crop of 60.3 million pounds and 40 percent above the 2006 production of 57.7 million pounds. Idaho’s production increased 76 percent in 2008. Production in Washington and Oregon increased 36 percent and 5 percent, respectively. Acreage in 2008 was up in all three hop producing States with a 32 percent increase overall. Yields increased from last year in Washington to 2,072 pounds per acre, and in Idaho to 1,841 pounds per acre. Oregon yields dropped to 1,569 pounds per acre.
Crop Production 2008 Summary Agricultural Statistics Board January 2009 89 NASS, USDA
Washington growers produced 79 percent of the U.S. hop crop for 2008. Zeus, Columbus/Tomahawk, Willamette, Galena, and Cascade were the leading varieties in Washington, accounting for 71 percent of the State’s hop crop. In Oregon, Willamette and Nugget were the major varieties, accounting for 77 percent of the State’s hop production. Maple Syrup: The preliminary 2008 U.S. maple syrup production totaled 1.64 million gallons, up 8 percent from last year but 3 percent below 2006. The preliminary number of taps is estimated at 7.46 million, down 9 percent from 2007 and 8 percent below two years ago. Yield per tap is estimated to be 0.219 gallons, up 18 percent from the previous season and 5 percent above 2006. Yields increased from 2007 in all States except Vermont, where yields decreased 4 percent. Temperatures were reported to be mostly favorable for sap flow in 2008 except in Maine and Vermont. Producers in Maine reported temperatures that were mostly too warm for sap flow while producers in Vermont reported temperatures that were mostly too cool. Coffee: Hawaii coffee production is estimated at 7.30 million pounds (parchment basis) for the 2008-09 season, down 3 percent from the previous season. Harvested area is estimated at 6,300 acres, down 2 percent from the 2007-08 season. Coffee production in Maui, Honolulu, and Kauai Counties is up from the previous season. In Kona, the primary growing area on the island of Hawaii, coffee harvest for the 2008-09 season is down. Bean quality was reported as good, but some farmers were expecting lower yields due to dry weather and vog (volcanic haze). Puerto Rico coffee production for the 2008-09 season is estimated at 16.5 million pounds (parchment basis), down 6 percent from the previous season. Heavy rain, landslides, flooding, and high winds from a tropical depression in September had a negative impact on the 2008-09 coffee crop. Taro: Hawaii taro production for the 2008 crop year is estimated at 4.40 million pounds, up 10 percent from the previous year. Area in crop, at 390 acres, was up 10 acres from 2007. The 2008 taro crop was aided by favorable weather conditions during the growing season. Although production was up from last season, major taro producing areas continued to be infested with apple snails, which feed on taro plants and provide an infection point for diseases. Taro pocket rot and leaf blight also affected production for many growers. Ginger Root: Hawaii ginger root production for the 2007-08 season is estimated at 1.80 million pounds, down 36 percent from the previous season. Harvested area, at 60 acres, is down 25 percent from 2007. The average yield is 30,000 pounds per harvested acre, down 14 percent from the previous season. Below-normal rainfall and disease problems contributed to the decrease in yield. An increase in cheaper ginger root imports has reduced the number of growers and acreage of locally-grown ginger root.
Crop Production 2008 Summary Agricultural Statistics Board January 2009 90 NASS, USDA
Information Contacts Listed below are the commodity statisticians in the Crops Branch of the National Agricultural Statistics Service to contact for additional information. Lance Honig, Chief ...........................................................................................................................(202) 720-2127 Field Crops Section
Jacqueline Moore, Head .............................................................................................(202) 720-2127 Todd Ballard - Wheat, Rye .........................................................................................(202) 720-8068 Shiela Corley - Cotton, Cotton Ginnings ....................................................................(202) 720-5944 Don Gephart - Hay, Oats, Sorghum............................................................................(202) 690-3234 Ty Kalaus - Corn, Proso Millet, Flaxseed...................................................................(202) 720-9526 Jacqueline Moore - Crop Weather, Barley, Sugar Crops ............................................(202) 720-2127 Anthony Prillaman - Peanuts, Rice .............................................................................(202) 720-7688 Travis Thorson - Soybeans, Sunflower, Other Oilseeds .............................................(202) 720-7369
Fruits, Vegetables & Special Crops Section
Jorge Garcia-Pratts, Head ...........................................................................................(202) 720-2127 Leslie Colburn - Berries, Grapes, Maple Syrup, Tobacco ..........................................(202) 720-7235 Debbie Flippin - Fresh and Processing Vegetables,
Onions, Strawberries.................................................................(202) 720-2157 Mike Jacobsen - Apples, Apricots, Cherries, Cranberries,
Plums, Prunes............................................................................(202) 720-4288 Dawn Keen - Floriculture, Nursery, Tree Nuts...........................................................(202) 720-4215 Dan Norris - Austrian Winter Peas, Dry Edible Peas,
Lentils, Mint, Mushrooms, Peaches, Pears, Wrinkled Seed Peas..........................................................................(202) 720-3250
Suzanne Avilla - Citrus, Coffee, Tropical Fruits ........................................................(202) 720-5412 Faye Propsom - Dry Beans, Potatoes, Sweet Potatoes................................................(202) 720-4285 Kim Ritchie - Hops .....................................................................................................(360) 902-1940
ACCESS TO REPORTS!! For your convenience, there are several ways to obtain NASS reports, data products, and services:
INTERNET ACCESS All NASS reports are available free of charge on the worldwide Internet. For access, connect to the Internet and go to the NASS Home Page at: www.nass.usda.gov.
E-MAIL SUBSCRIPTION All NASS reports are available by subscription free of charge direct to your e-mail address. Starting with the NASS Home Page at www.nass.usda.gov, under the right navigation, Receive reports by Email, click on National or State. Follow the instructions on the screen.
- - - - - - - - - - - - - - - - - - - - - - - - - - - - - - - - -
PRINTED REPORTS OR DATA PRODUCTS
CALL OUR TOLL-FREE ORDER DESK: 800-999-6779 (U.S. and Canada) Other areas, please call 703-605-6220 FAX: 703-605-6900
(Visa, MasterCard, check, or money order acceptable for payment.)
- - - - - - - - - - - - - - - - - - - - - - - - - - - - - - - - - -
ASSISTANCE For assistance with general agricultural statistics or further information about NASS or its products or services, contact the Agricultural Statistics Hotline at 800-727-9540, 7:30 a.m. to 4:00 p.m. ET, or e-mail: [email protected]. The U.S. Department of Agriculture (USDA) prohibits discrimination in all its programs and activities on the basis of race, color, national origin, age, disability, and where applicable, sex, marital status, familial status, parental status, religion, sexual orientation, genetic information, political beliefs, reprisal, or because all or a part of an individual’s income is derived from any public assistance program. (Not all prohibited bases apply to all programs.) Persons with disabilities who require alternative means for communication of program information (Braille, large print, audiotape, etc.) should contact USDA’s TARGET Center at (202) 720-2600 (voice and TDD). To file a complaint of discrimination, write to USDA, Director, Office of Civil Rights, 1400 Independence Avenue, S.W., Washington, D.C. 20250-9410, or call (800) 795-3272 (voice) or (202) 720-6382 (TDD). USDA is an equal opportunity provider and employer.
Global Agriculture & Rural America in Transition
Food & Energy: Expectations & Realities
February 26-27, 2009 Crystal Gateway Marriott Hotel
Arlington, Virginia
www.usda.gov/oce/forum
Early Bird Registration $350 until January 23, 2009 * $375 after January 23
Topical Sessions Will Address:
*Commodity Markets *Rural America *Trade & Farm Policy *Food Safety & Food Security *Conservation *Energy
*Risk Management *Biotechnology *Food Prices *World Markets


