26
EY-Parthenon Perspectives Investing in the agricultural crop industry Sean Levy, Managing Director, EY-Parthenon Greg Miller, Managing Director, EY-Parthenon
EY-Parthenon PerspectivesInvesting in the agricultural crop industry
Sean Levy, Managing Director, EY-ParthenonGreg Miller, Managing Director, EY-Parthenon
EY-Parthenon | Page 2
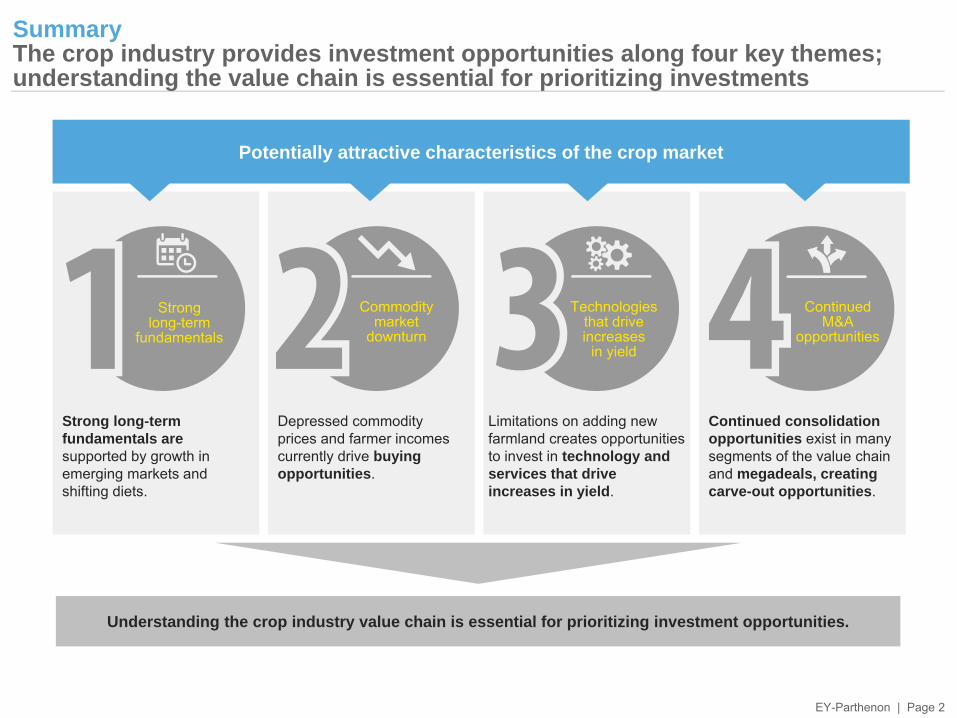
Continued consolidation opportunities exist in many segments of the value chain and megadeals, creating carve-out opportunities.
Limitations on adding new farmland creates opportunities to invest in technology and services that drive increases in yield.
Depressed commodity prices and farmer incomes currently drive buying opportunities.
Strong long-term fundamentals are supported by growth in emerging markets and shifting diets.
SummaryThe crop industry provides investment opportunities along four key themes; understanding the value chain is essential for prioritizing investments
Strong long-term
fundamentals
Commodity market
downturn
Technologies that drive increases
in yield
Continued M&A
opportunities
Potentially attractive characteristics of the crop market
Understanding the crop industry value chain is essential for prioritizing investment opportunities.
EY-Parthenon | Page 3
Agenda► Agriculture industry overview► Crop market investment themes► Crop market value chain
EY-Parthenon | Page 4
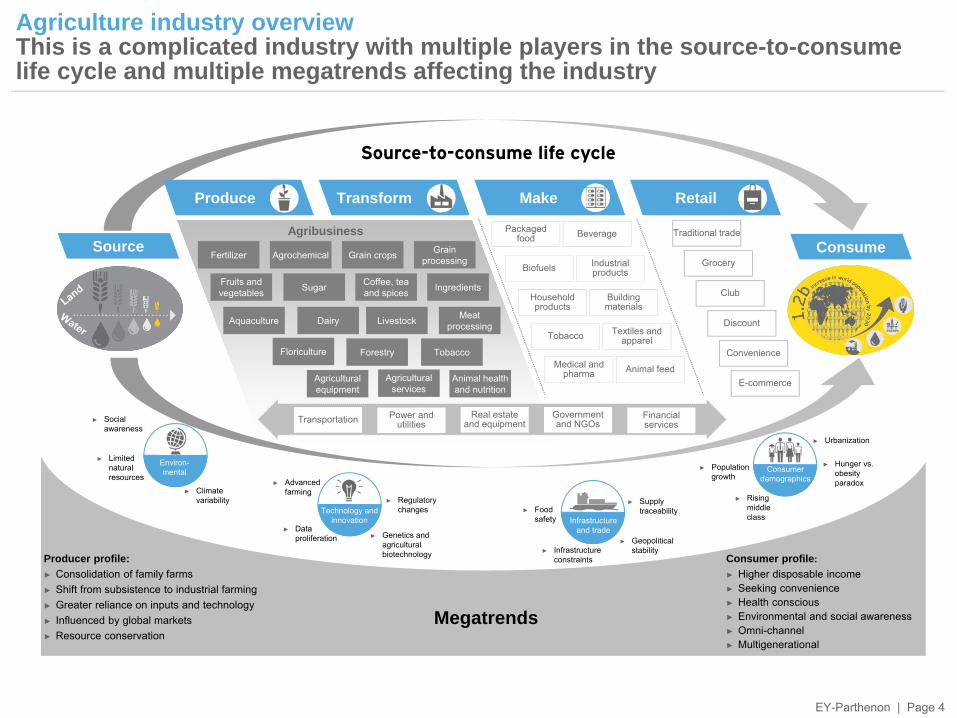
Agriculture industry overviewThis is a complicated industry with multiple players in the source-to-consume life cycle and multiple megatrends affecting the industry
► Geopolitical stability► Infrastructure
constraints
► Supply traceability► Food
safety Infrastructure and trade
► Population growth
► Urbanization
► Hunger vs. obesity paradox
Consumer demographics
► Rising middle class
► Regulatory changes
► Advanced farming
► Data proliferation
Technology and innovation
► Genetics and agricultural biotechnology Consumer profile:
► Higher disposable income ► Seeking convenience► Health conscious► Environmental and social awareness► Omni-channel► Multigenerational
Source-to-consume life cycle
Agricultural equipment
Ingredients
Animal health and nutrition
Agricultural services
Fertilizer
Coffee, tea and spices
Forestry
Grain processingGrain crops
Aquaculture
Fruits and vegetables
Tobacco
Dairy
Sugar
Agrochemical
Livestock
Agribusiness
Transform Make Retail
Source ConsumeBeveragePackaged
food
Household products
Tobacco Textiles and apparel
Medical and pharma
Industrial products
Building materials
Biofuels
Animal feedE-commerce
Convenience
Grocery
Discount
Club
Traditional trade
Transportation Real estate and equipment
Power and utilities
Government and NGOs
Financial services
Produce
Producer profile:► Consolidation of family farms► Shift from subsistence to industrial farming► Greater reliance on inputs and technology► Influenced by global markets► Resource conservation
Megatrends
► Limited natural resources
► Climate variability
► Social awareness
Environ-mental
Floriculture
Meat processing
EY-Parthenon | Page 5
0
20
40
60
80
100%
Agriculture-related deals
Horticulture
Upstream services
Machinery and equipment
Seeds
Livestock, dairy, aquaculture
Ground and environmental services
Specialty crop production
Agricultural chemicals and fertilizer
Specialty crop inputs
Distributors/retailers
Other101
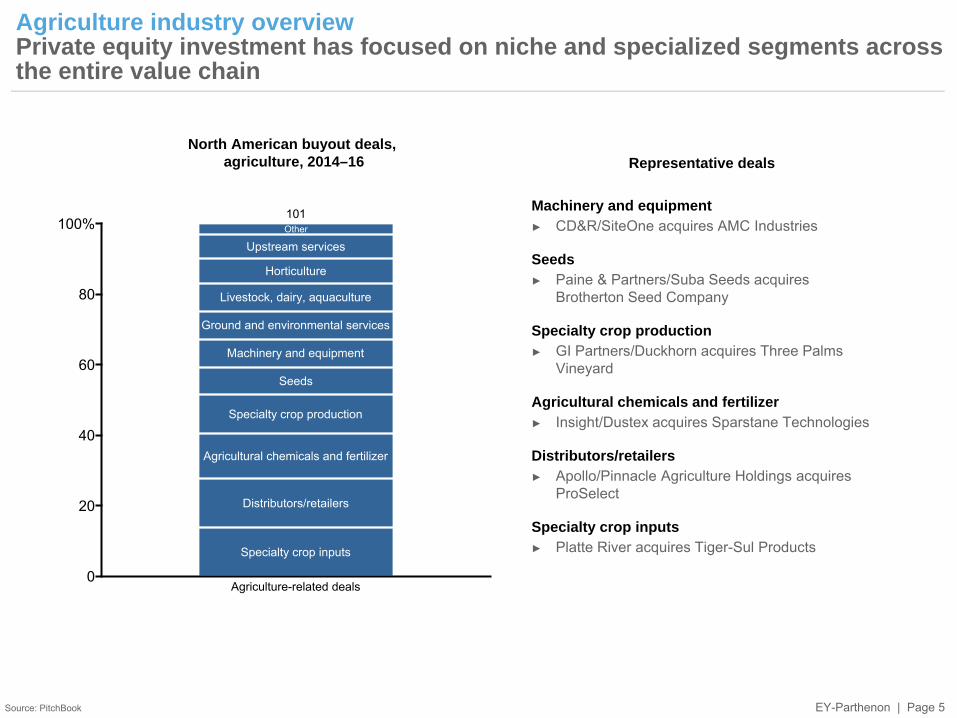
Agriculture industry overviewPrivate equity investment has focused on niche and specialized segments across the entire value chain
Source: PitchBook
North American buyout deals, agriculture, 2014–16 Representative deals
Machinery and equipment► CD&R/SiteOne acquires AMC Industries
Seeds► Paine & Partners/Suba Seeds acquires
Brotherton Seed Company
Specialty crop production► GI Partners/Duckhorn acquires Three Palms
Vineyard
Agricultural chemicals and fertilizer► Insight/Dustex acquires Sparstane Technologies
Distributors/retailers► Apollo/Pinnacle Agriculture Holdings acquires
ProSelect
Specialty crop inputs► Platte River acquires Tiger-Sul Products
EY-Parthenon | Page 6
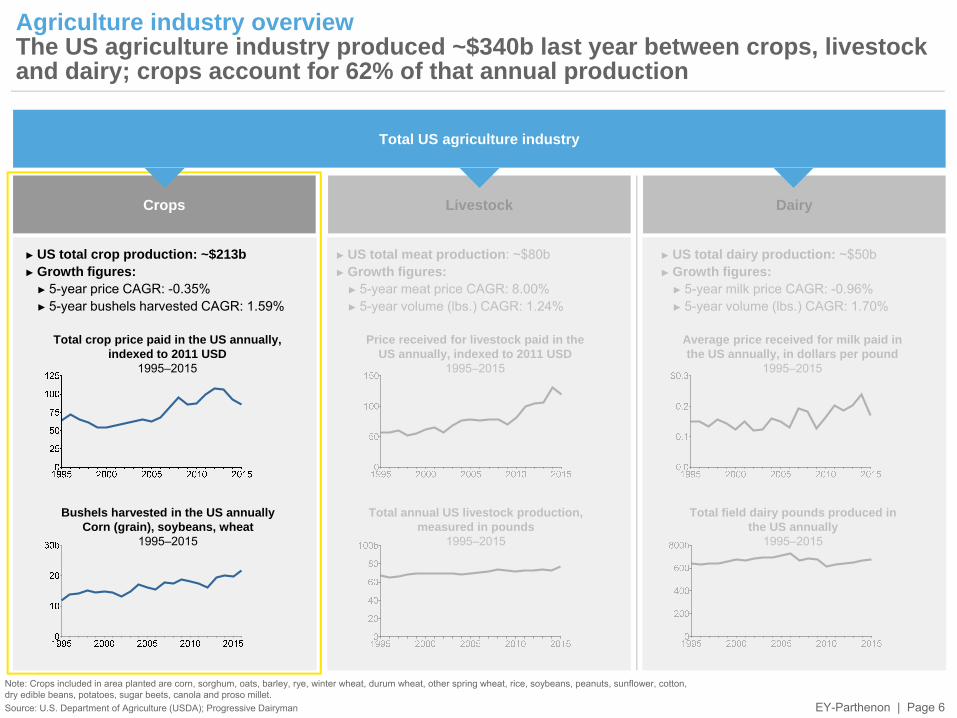
Agriculture industry overviewThe US agriculture industry produced ~$340b last year between crops, livestock and dairy; crops account for 62% of that annual production
Note: Crops included in area planted are corn, sorghum, oats, barley, rye, winter wheat, durum wheat, other spring wheat, rice, soybeans, peanuts, sunflower, cotton, dry edible beans, potatoes, sugar beets, canola and proso millet.Source: U.S. Department of Agriculture (USDA); Progressive Dairyman
Total US agriculture industry
Crops Livestock Dairy
Price received for livestock paid in the US annually, indexed to 2011 USD
1995–2015
Average price received for milk paid in the US annually, in dollars per pound
1995–2015
► US total meat production: ~$80b► Growth figures:
► 5-year meat price CAGR: 8.00%► 5-year volume (lbs.) CAGR: 1.24%
► US total dairy production: ~$50b► Growth figures:
► 5-year milk price CAGR: -0.96%► 5-year volume (lbs.) CAGR: 1.70%
► US total crop production: ~$213b► Growth figures:
► 5-year price CAGR: -0.35%► 5-year bushels harvested CAGR: 1.59%
Total crop price paid in the US annually, indexed to 2011 USD
1995–2015
Total annual US livestock production, measured in pounds
1995–2015
Total field dairy pounds produced inthe US annually
1995–2015
Bushels harvested in the US annuallyCorn (grain), soybeans, wheat
1995–2015
EY-Parthenon | Page 7
0
20
40
60
80
100%
Southern Plains
Corn
Soybeans
Hay and haylage
Wheat
Cotton
Other crops
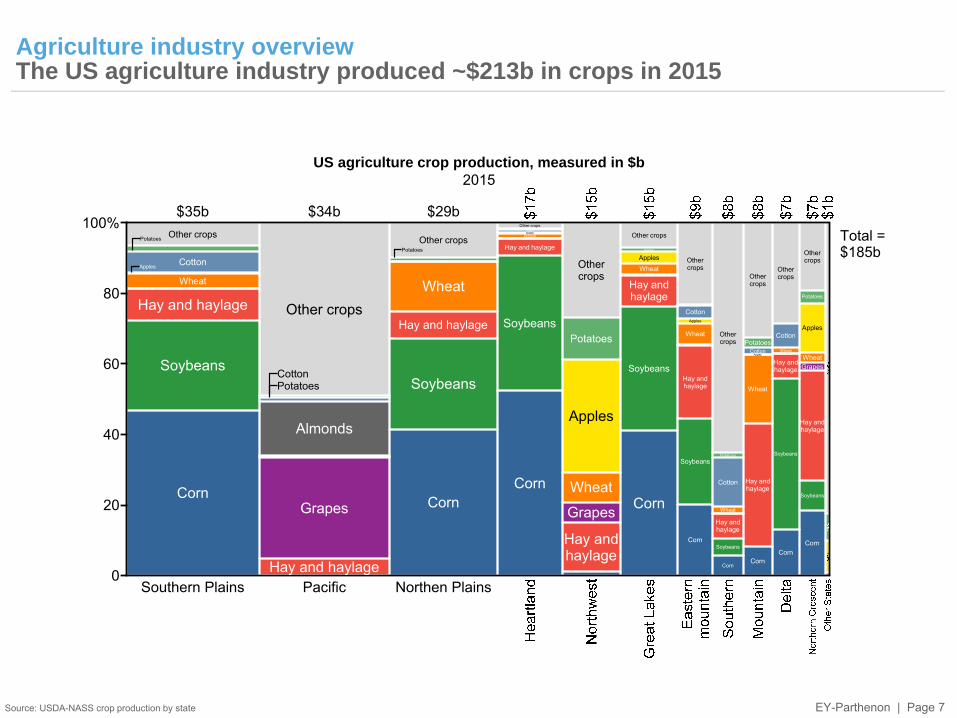
$35b
PacificHay and haylage
Grapes
Almonds
Other crops
$34b
Northen Plains
Corn
Soybeans
Hay and haylage
Wheat
Cotton
Other crops
$29b
Corn
Soybeans
Hay and haylage
WheatApplesCotton
PotatoesOther crops
Hay andhaylage
Grapes
Wheat
Apples
Potatoes
Othercrops
Corn
Soybeans
Hay andhaylage
Grapes
WheatApples
Potatoes
Other crops
Corn
Soybeans
Hay andhaylage
Wheat
Apples
CottonPotatoes
Othercrops
Corn
Soybeans
Hay andhaylage
GrapesWheat
Cotton
Potatoes
Othercrops
Corn
Hay andhaylage
Wheat
ApplesCotton
Potatoes
Othercrops
Corn
Soybeans
Hay andhaylage
GrapesWheat
Cotton
Othercrops
Corn
Soybeans
Hay andhaylage
GrapesWheat
Apples
Potatoes
Othercrops
Apples
Potatoes
CottonPotatoes
Potatoes
Total =$185b
Agriculture industry overviewThe US agriculture industry produced ~$213b in crops in 2015
Source: USDA-NASS crop production by state
US agriculture crop production, measured in $b2015
EY-Parthenon | Page 8
Agenda► Agriculture industry overview► Crop market investment themes► Crop market value chain
EY-Parthenon | Page 9
Strong long-term fundamentals
Commodity market downturn
Technologies that drive increases yield
Continued M&A opportunities
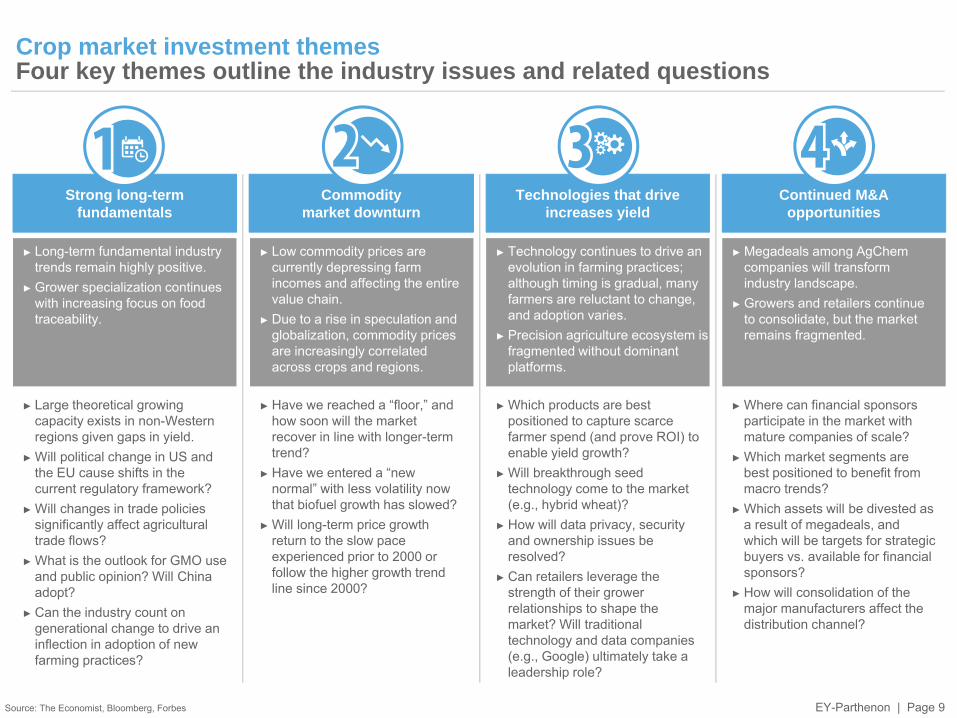
Crop market investment themesFour key themes outline the industry issues and related questions
Source: The Economist, Bloomberg, Forbes
► Low commodity prices are currently depressing farm incomes and affecting the entire value chain.
► Due to a rise in speculation and globalization, commodity prices are increasingly correlated across crops and regions.
► Technology continues to drive an evolution in farming practices; although timing is gradual, many farmers are reluctant to change, and adoption varies.
► Precision agriculture ecosystem is fragmented without dominant platforms.
► Megadeals among AgChemcompanies will transform industry landscape.
► Growers and retailers continue to consolidate, but the market remains fragmented.
► Have we reached a “floor,” and how soon will the market recover in line with longer-term trend?
► Have we entered a “new normal” with less volatility now that biofuel growth has slowed?
► Will long-term price growth return to the slow pace experienced prior to 2000 or follow the higher growth trend line since 2000?
► Which products are best positioned to capture scarce farmer spend (and prove ROI) to enable yield growth?
► Will breakthrough seed technology come to the market (e.g., hybrid wheat)?
► How will data privacy, security and ownership issues be resolved?
► Can retailers leverage the strength of their grower relationships to shape the market? Will traditional technology and data companies (e.g., Google) ultimately take a leadership role?
► Where can financial sponsors participate in the market with mature companies of scale?
► Which market segments are best positioned to benefit from macro trends?
► Which assets will be divested as a result of megadeals, and which will be targets for strategic buyers vs. available for financial sponsors?
► How will consolidation of the major manufacturers affect the distribution channel?
► Long-term fundamental industry trends remain highly positive.
► Grower specialization continues with increasing focus on food traceability.
► Large theoretical growing capacity exists in non-Western regions given gaps in yield.
► Will political change in US and the EU cause shifts in the current regulatory framework?
► Will changes in trade policies significantly affect agricultural trade flows?
► What is the outlook for GMO use and public opinion? Will China adopt?
► Can the industry count on generational change to drive an inflection in adoption of new farming practices?
EY-Parthenon | Page 10
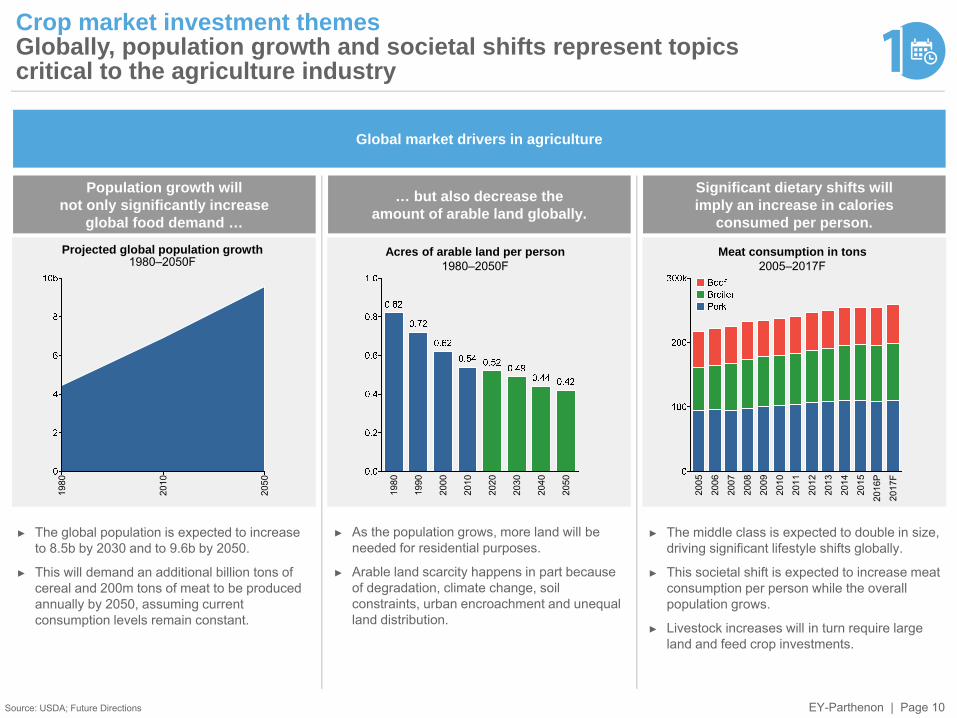
Crop market investment themesGlobally, population growth and societal shifts represent topics critical to the agriculture industry
Source: USDA; Future Directions
Global market drivers in agriculture
Population growth will not only significantly increase
global food demand …
… but also decrease the amount of arable land globally.
Significant dietary shifts will imply an increase in calories
consumed per person.
2005
2006
2007
2008
2009
2010
2011
2012
2013
2014
2015
2016
P
2017
F
1980
1990
2000
2010
2020
2030
2040
2050
1980
2010
2050
Acres of arable land per person1980–2050F
Meat consumption in tons2005–2017F
Projected global population growth1980–2050F
► The global population is expected to increase to 8.5b by 2030 and to 9.6b by 2050.
► This will demand an additional billion tons of cereal and 200m tons of meat to be produced annually by 2050, assuming current consumption levels remain constant.
► As the population grows, more land will be needed for residential purposes.
► Arable land scarcity happens in part because of degradation, climate change, soil constraints, urban encroachment and unequal land distribution.
► The middle class is expected to double in size, driving significant lifestyle shifts globally.
► This societal shift is expected to increase meat consumption per person while the overall population grows.
► Livestock increases will in turn require large land and feed crop investments.
EY-Parthenon | Page 114% 4% 5% 5% 5% 5% 6%
9% 10%
10% 12
%17
% 21%
27% 30
%39
% 40% 42
%39
%39
%39
%
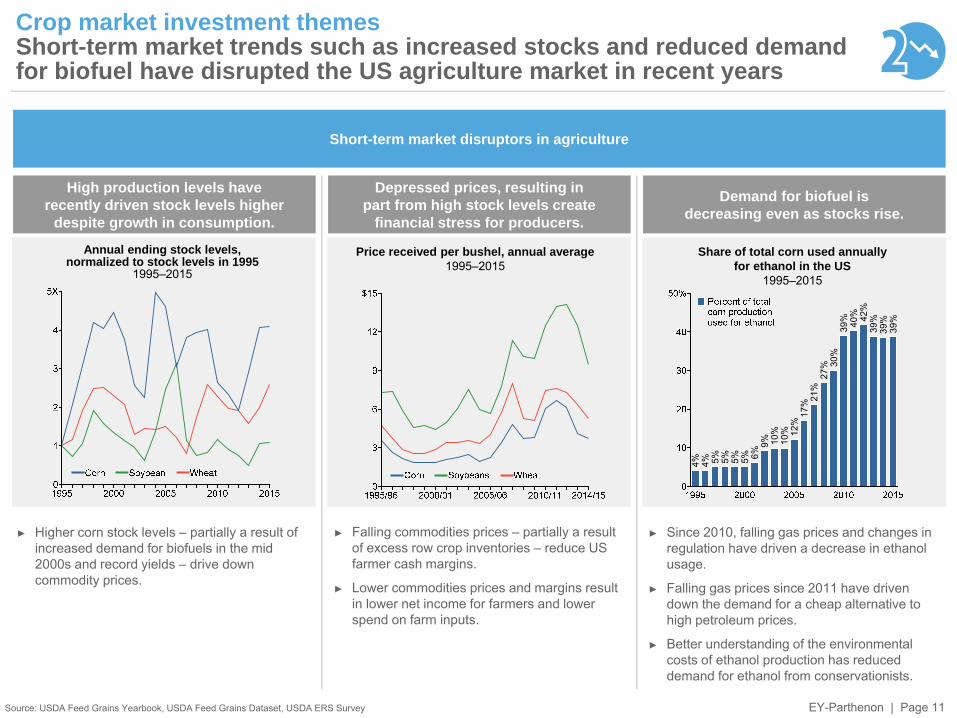
Crop market investment themesShort-term market trends such as increased stocks and reduced demand for biofuel have disrupted the US agriculture market in recent years
Source: USDA Feed Grains Yearbook, USDA Feed Grains Dataset, USDA ERS Survey
Short-term market disruptors in agriculture
High production levels have recently driven stock levels higher
despite growth in consumption.
Depressed prices, resulting in part from high stock levels create
financial stress for producers.
Demand for biofuel is decreasing even as stocks rise.
Price received per bushel, annual average1995–2015
Share of total corn used annually for ethanol in the US
1995–2015
Annual ending stock levels, normalized to stock levels in 1995
1995–2015
► Higher corn stock levels – partially a result of increased demand for biofuels in the mid 2000s and record yields – drive down commodity prices.
► Falling commodities prices – partially a result of excess row crop inventories – reduce US farmer cash margins.
► Lower commodities prices and margins result in lower net income for farmers and lower spend on farm inputs.
► Since 2010, falling gas prices and changes in regulation have driven a decrease in ethanol usage.
► Falling gas prices since 2011 have driven down the demand for a cheap alternative to high petroleum prices.
► Better understanding of the environmental costs of ethanol production has reduced demand for ethanol from conservationists.
EY-Parthenon | Page 12
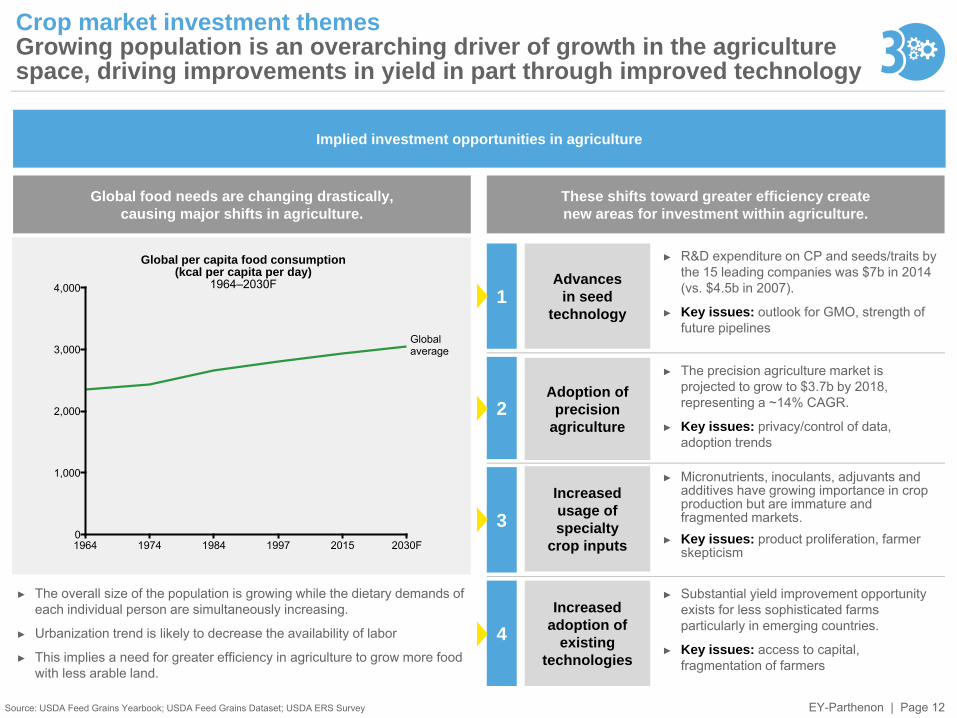
Crop market investment themesGrowing population is an overarching driver of growth in the agriculture space, driving improvements in yield in part through improved technology
Source: USDA Feed Grains Yearbook; USDA Feed Grains Dataset; USDA ERS Survey
Implied investment opportunities in agriculture
Global food needs are changing drastically, causing major shifts in agriculture.
These shifts toward greater efficiency create new areas for investment within agriculture.
Advances in seed
technology
Adoption of precision
agriculture
Increased usage of specialty
crop inputs
Increased adoption of
existing technologies
1
2
3
4
► R&D expenditure on CP and seeds/traits by the 15 leading companies was $7b in 2014 (vs. $4.5b in 2007).
► Key issues: outlook for GMO, strength of future pipelines
► The precision agriculture market is projected to grow to $3.7b by 2018, representing a ~14% CAGR.
► Key issues: privacy/control of data, adoption trends
► Micronutrients, inoculants, adjuvants and additives have growing importance in crop production but are immature and fragmented markets.
► Key issues: product proliferation, farmer skepticism
► Substantial yield improvement opportunity exists for less sophisticated farms particularly in emerging countries.
► Key issues: access to capital, fragmentation of farmers
► The overall size of the population is growing while the dietary demands of each individual person are simultaneously increasing.
► Urbanization trend is likely to decrease the availability of labor
► This implies a need for greater efficiency in agriculture to grow more food with less arable land.
Global per capita food consumption (kcal per capita per day)
1964–2030F
0
1,000
2,000
3,000
4,000
1964 1974 1984 1997 2015 2030F
Globalaverage
EY-Parthenon | Page 13
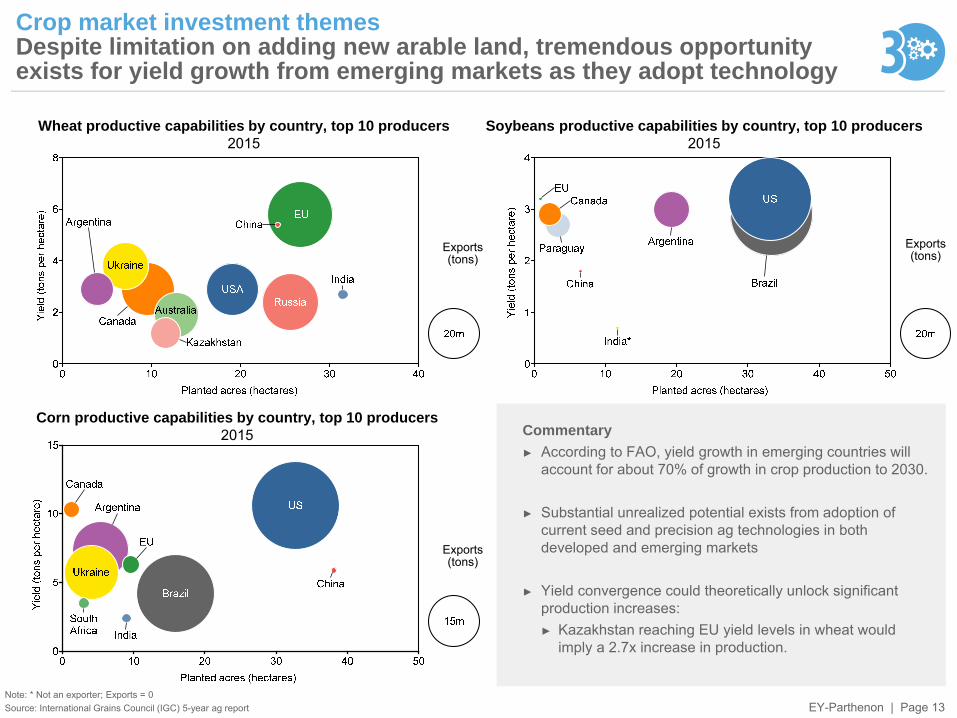
Crop market investment themesDespite limitation on adding new arable land, tremendous opportunity exists for yield growth from emerging markets as they adopt technology
Note: * Not an exporter; Exports = 0Source: International Grains Council (IGC) 5-year ag report
Wheat productive capabilities by country, top 10 producers2015
Corn productive capabilities by country, top 10 producers2015
Soybeans productive capabilities by country, top 10 producers2015
Exports(tons)
Exports(tons)
Exports(tons)
Commentary► According to FAO, yield growth in emerging countries will
account for about 70% of growth in crop production to 2030.
► Substantial unrealized potential exists from adoption of current seed and precision ag technologies in both developed and emerging markets
► Yield convergence could theoretically unlock significant production increases:► Kazakhstan reaching EU yield levels in wheat would
imply a 2.7x increase in production.
EY-Parthenon | Page 14
(Acr
es)
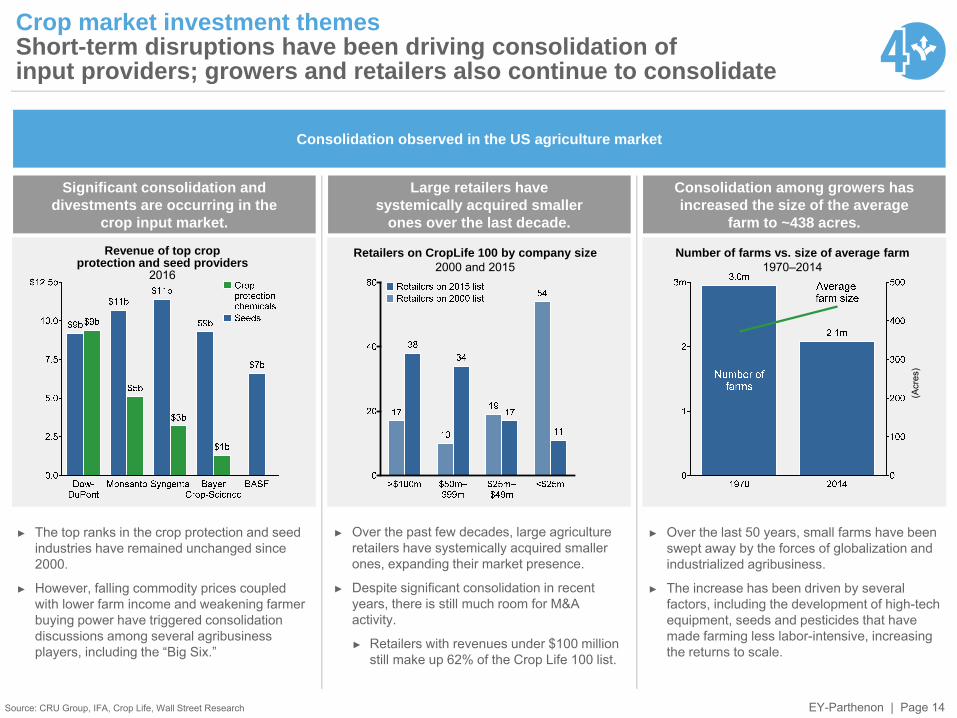
Crop market investment themesShort-term disruptions have been driving consolidation of input providers; growers and retailers also continue to consolidate
Source: CRU Group, IFA, Crop Life, Wall Street Research
Consolidation observed in the US agriculture market
Significant consolidation and divestments are occurring in the
crop input market.
Large retailers have systemically acquired smaller
ones over the last decade.
Consolidation among growers has increased the size of the average
farm to ~438 acres.
Retailers on CropLife 100 by company size2000 and 2015
Number of farms vs. size of average farm1970–2014
Revenue of top crop protection and seed providers
2016
► The top ranks in the crop protection and seed industries have remained unchanged since 2000.
► However, falling commodity prices coupled with lower farm income and weakening farmer buying power have triggered consolidation discussions among several agribusiness players, including the “Big Six.”
► Over the past few decades, large agriculture retailers have systemically acquired smaller ones, expanding their market presence.
► Despite significant consolidation in recent years, there is still much room for M&A activity.
► Retailers with revenues under $100 million still make up 62% of the Crop Life 100 list.
► Over the last 50 years, small farms have been swept away by the forces of globalization and industrialized agribusiness.
► The increase has been driven by several factors, including the development of high-tech equipment, seeds and pesticides that have made farming less labor-intensive, increasing the returns to scale.
EY-Parthenon | Page 15
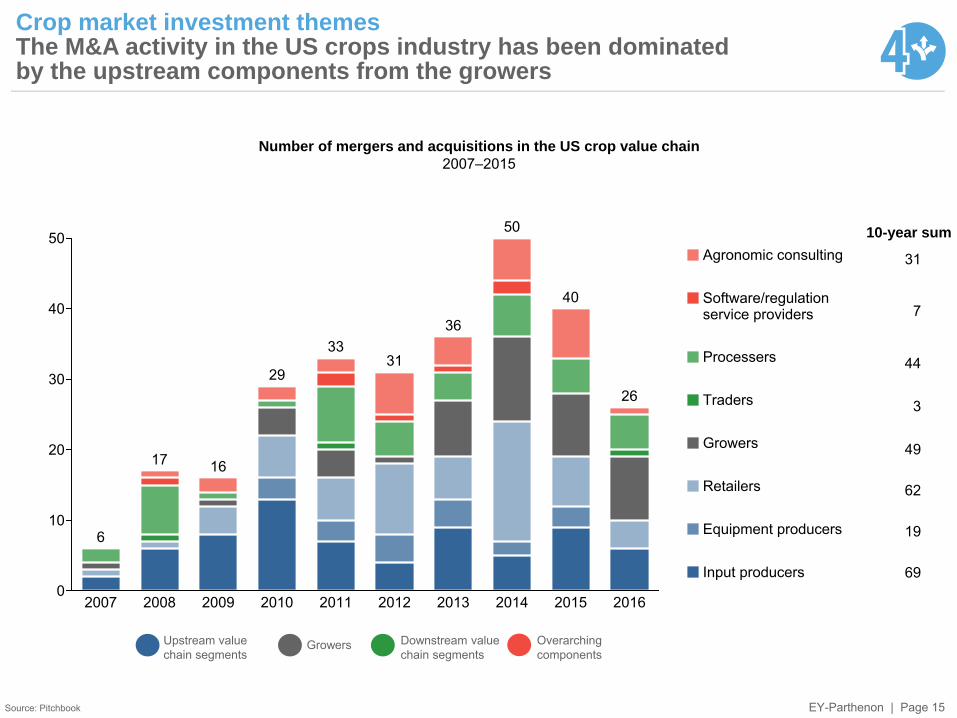
Crop market investment themesThe M&A activity in the US crops industry has been dominated by the upstream components from the growers
Source: Pitchbook
0
10
20
30
40
50
2007
6
2008
17
2009
16
2010
29
2011
33
2012
31
2013
36
2014
50
2015
40
2016
26
69
19
62
49
3
44
7
31
10-year sum
Input producers
Equipment producers
Retailers
Growers
Traders
Processers
Software/regulationservice providers
Agronomic consulting
Number of mergers and acquisitions in the US crop value chain2007–2015
Upstream valuechain segments
Growers Downstream valuechain segments
Overarchingcomponents

EY-Parthenon | Page 16
Agenda► Agriculture industry overview► Crop market investment themes► Crop market value chain segmentation
EY-Parthenon | Page 17
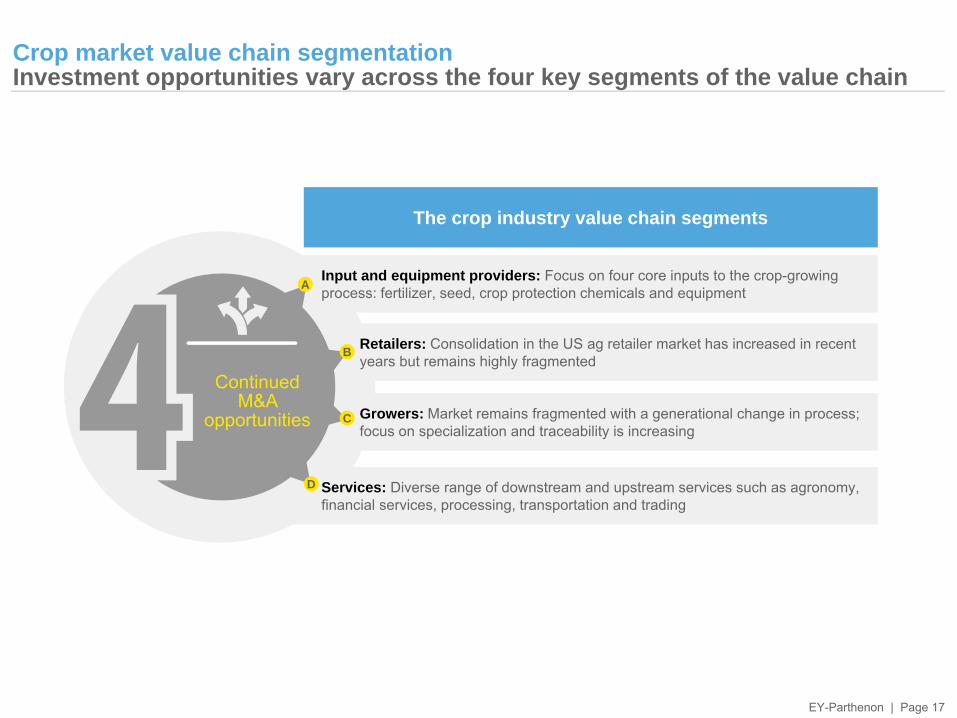
Crop market value chain segmentationInvestment opportunities vary across the four key segments of the value chain
Retailers: Consolidation in the US ag retailer market has increased in recent years but remains highly fragmented
Services: Diverse range of downstream and upstream services such as agronomy, financial services, processing, transportation and trading
Input and equipment providers: Focus on four core inputs to the crop-growing process: fertilizer, seed, crop protection chemicals and equipment
Growers: Market remains fragmented with a generational change in process; focus on specialization and traceability is increasing
Continued M&A
opportunities
A
B
C
D
The crop industry value chain segments
EY-Parthenon | Page 18
Power
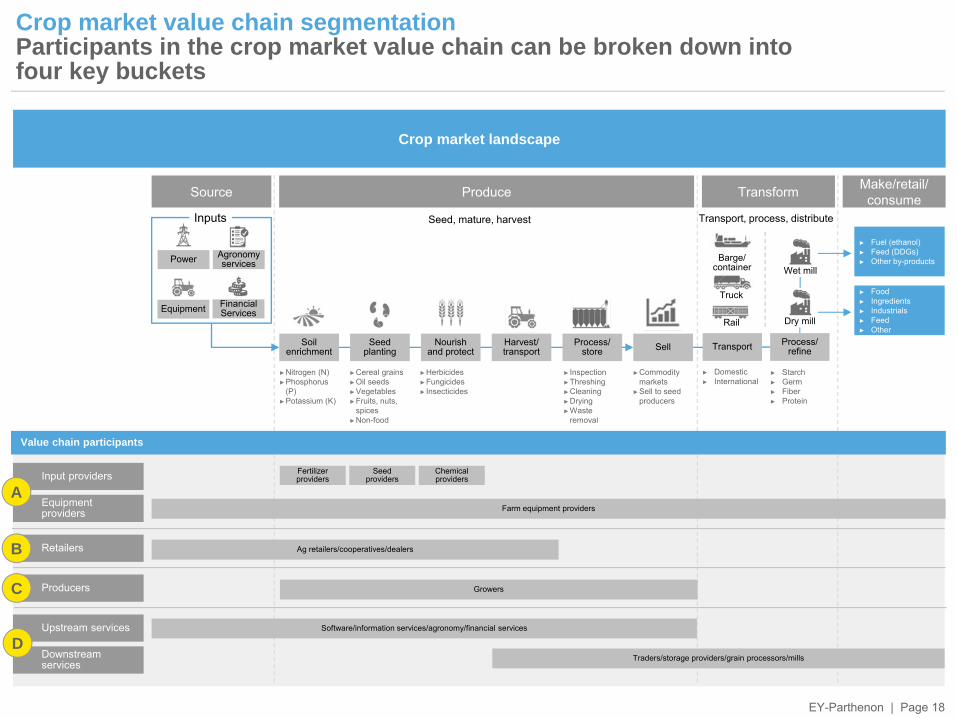
Crop market value chain segmentationParticipants in the crop market value chain can be broken down into four key buckets
Crop market landscape
Produce Transform Make/retail/ consume
Inputs
Soil enrichment
Seed planting
Nourish and protect
Harvest/ transport
Process/store Sell
►Nitrogen (N)►Phosphorus
(P)►Potassium (K)
Agronomy services
Equipment Financial Services
►Cereal grains►Oil seeds►Vegetables►Fruits, nuts,
spices►Non-food
►Herbicides►Fungicides► Insecticides
► Inspection►Threshing►Cleaning►Drying►Waste
removal
►Commodity markets
►Sell to seed producers
Seed, mature, harvest Transport, process, distribute
Transport
► Domestic► International
Process/refine
► Starch► Germ► Fiber► Protein
Barge/container
Truck
Rail
Wet mill
Dry mill
► Fuel (ethanol)► Feed (DDGs)► Other by-products
► Food► Ingredients► Industrials► Feed► Other
Input providers
Equipment providers
Retailers
Producers
Upstream services
Downstream services
A
B
C
D
Fertilizer providers
Seed providers
Chemical providers
Farm equipment providers
Ag retailers/cooperatives/dealers
Growers
Software/information services/agronomy/financial services
Traders/storage providers/grain processors/mills
Value chain participants
Source
EY-Parthenon | Page 19
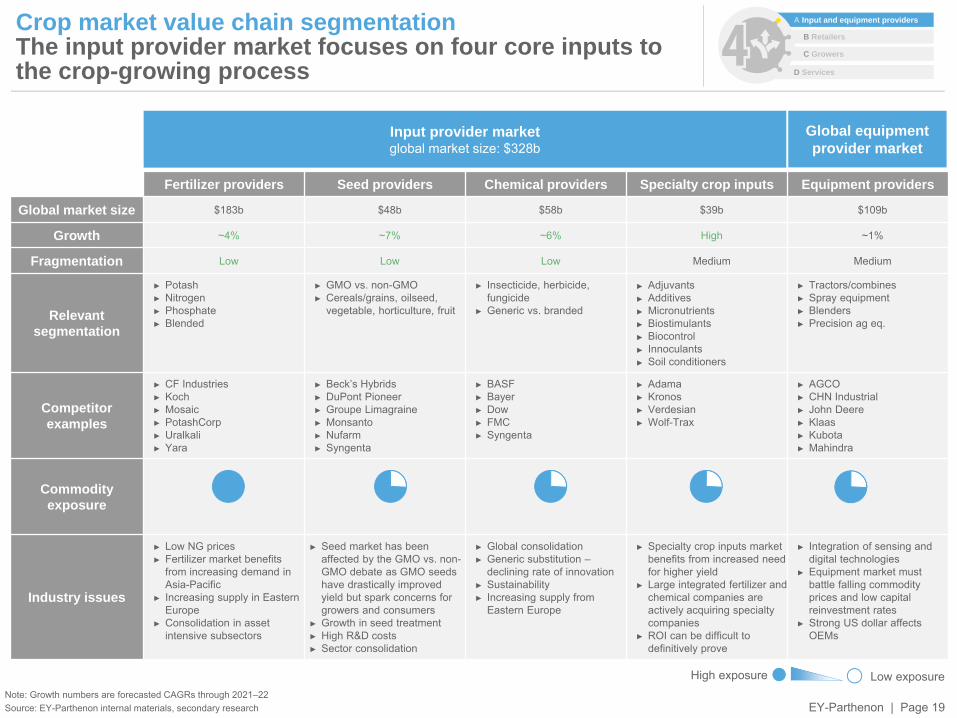
Crop market value chain segmentation The input provider market focuses on four core inputs to the crop-growing process
Note: Growth numbers are forecasted CAGRs through 2021–22Source: EY-Parthenon internal materials, secondary research
Input provider market global market size: $328b
Global equipment provider market
Fertilizer providers Seed providers Chemical providers Specialty crop inputs Equipment providers
Global market size $183b $48b $58b $39b $109b
Growth ~4% ~7% ~6% High ~1%
Fragmentation Low Low Low Medium Medium
Relevant segmentation
► Potash► Nitrogen► Phosphate► Blended
► GMO vs. non-GMO► Cereals/grains, oilseed,
vegetable, horticulture, fruit
► Insecticide, herbicide, fungicide
► Generic vs. branded
► Adjuvants► Additives► Micronutrients► Biostimulants► Biocontrol► Innoculants► Soil conditioners
► Tractors/combines► Spray equipment► Blenders► Precision ag eq.
Competitorexamples
► CF Industries► Koch► Mosaic► PotashCorp► Uralkali► Yara
► Beck’s Hybrids► DuPont Pioneer► Groupe Limagraine► Monsanto► Nufarm► Syngenta
► BASF► Bayer► Dow► FMC► Syngenta
► Adama► Kronos► Verdesian► Wolf-Trax
► AGCO► CHN Industrial► John Deere► Klaas► Kubota► Mahindra
Commodityexposure
Industry issues
► Low NG prices► Fertilizer market benefits
from increasing demand in Asia-Pacific
► Increasing supply in Eastern Europe
► Consolidation in asset intensive subsectors
► Seed market has been affected by the GMO vs. non-GMO debate as GMO seeds have drastically improved yield but spark concerns for growers and consumers
► Growth in seed treatment► High R&D costs► Sector consolidation
► Global consolidation► Generic substitution –
declining rate of innovation► Sustainability► Increasing supply from
Eastern Europe
► Specialty crop inputs market benefits from increased need for higher yield
► Large integrated fertilizer and chemical companies are actively acquiring specialty companies
► ROI can be difficult to definitively prove
► Integration of sensing and digital technologies
► Equipment market must battle falling commodity prices and low capital reinvestment rates
► Strong US dollar affects OEMs
Low exposureHigh exposure
B Retailers
D Services
C Growers
A Input and equipment providers
EY-Parthenon | Page 20
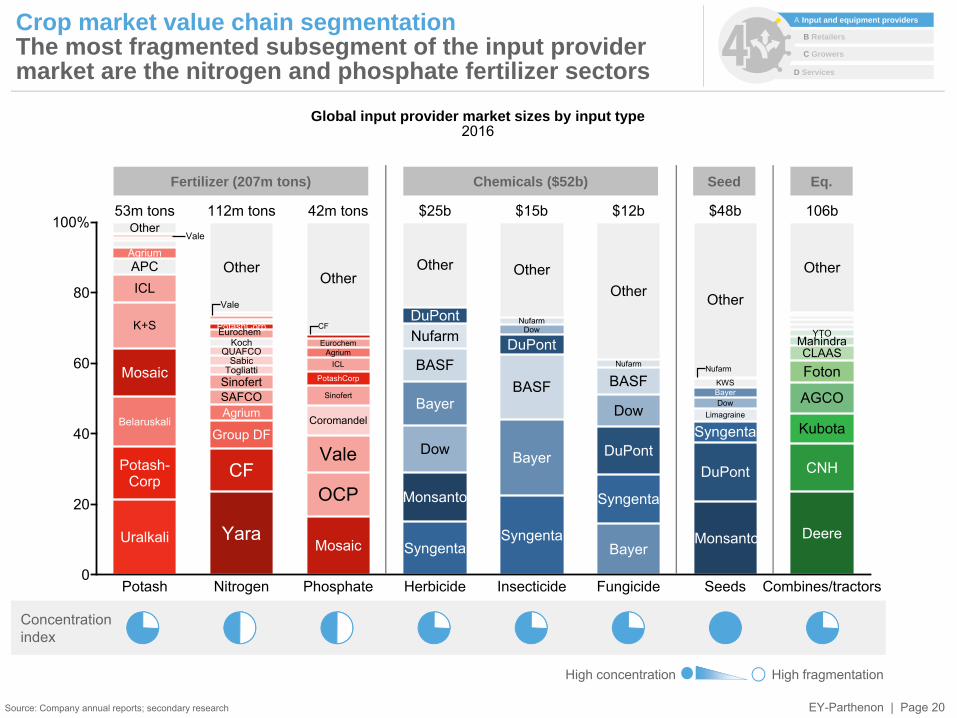
Crop market value chain segmentationThe most fragmented subsegment of the input provider market are the nitrogen and phosphate fertilizer sectors
Source: Company annual reports; secondary research
0
20
40
60
80
100%
Potash
Mosaic
Potash-Corp
Uralkali
Agrium
Belaruskali
K+S
ICLAPC
Other53m tons
Nitrogen
Yara
CF
PotashCorp
Group DF
Agrium
SinofertSAFCO
SabicTogliatti
QUAFCOKoch
Other
112m tons
Phosphate
Mosaic
PotashCorp
Agrium
Sinofert
Vale
ICL
OCP
Eurochem
Coromandel
Other
42m tons
Herbicide
Monsanto
DuPont
Syngenta
Bayer
Dow
BASF
Nufarm
Other
$25b
Insecticide
DuPont
Syngenta
Bayer
Dow
BASF
Nufarm
Other
$15b
Fungicide
DuPont
Syngenta
Bayer
Dow
BASFNufarm
Other
$12b
Seeds
DuPont
Syngenta
BayerDow
Limagraine
KWS
Other
$48b
Combines/tractors
Deere
CNH
Kubota
AGCO
FotonCLAAS
MahindraYTO
Other
106bVale
Vale
EurochemCF
Monsanto
Nufarm
Global input provider market sizes by input type2016
Fertilizer (207m tons) Chemicals ($52b) Seed
Concentrationindex
High fragmentationHigh concentration
Eq.
B Retailers
D Services
C Growers
A Input and equipment providers
EY-Parthenon | Page 21
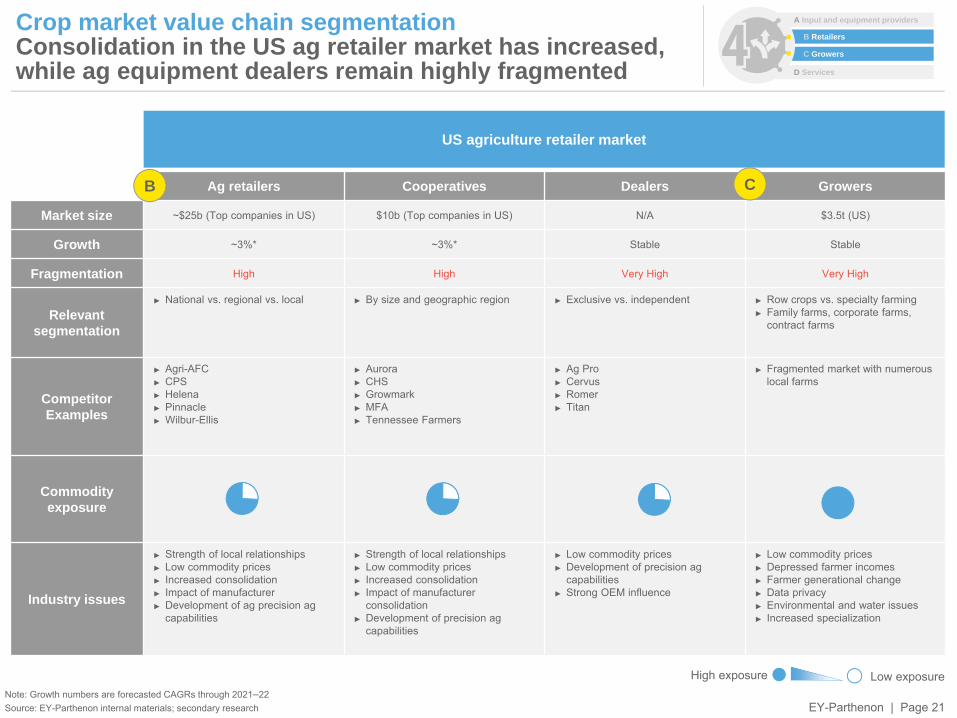
Crop market value chain segmentation Consolidation in the US ag retailer market has increased, while ag equipment dealers remain highly fragmented
Note: Growth numbers are forecasted CAGRs through 2021–22Source: EY-Parthenon internal materials; secondary research
US agriculture retailer market
Ag retailers Cooperatives Dealers Growers
Market size ~$25b (Top companies in US) $10b (Top companies in US) N/A $3.5t (US)
Growth ~3%* ~3%* Stable Stable
Fragmentation High High Very High Very High
Relevant segmentation
► National vs. regional vs. local ► By size and geographic region ► Exclusive vs. independent ► Row crops vs. specialty farming► Family farms, corporate farms,
contract farms
CompetitorExamples
► Agri-AFC► CPS► Helena► Pinnacle► Wilbur-Ellis
► Aurora► CHS► Growmark► MFA► Tennessee Farmers
► Ag Pro► Cervus► Romer► Titan
► Fragmented market with numerous local farms
Commodityexposure
Industry issues
► Strength of local relationships► Low commodity prices► Increased consolidation► Impact of manufacturer► Development of ag precision ag
capabilities
► Strength of local relationships► Low commodity prices► Increased consolidation► Impact of manufacturer
consolidation► Development of precision ag
capabilities
► Low commodity prices► Development of precision ag
capabilities► Strong OEM influence
► Low commodity prices► Depressed farmer incomes► Farmer generational change► Data privacy► Environmental and water issues► Increased specialization
B
Low exposureHigh exposure
C
B Retailers
D Services
C Growers
A Input and equipment providers
EY-Parthenon | Page 22
0
20
40
60
80
100%
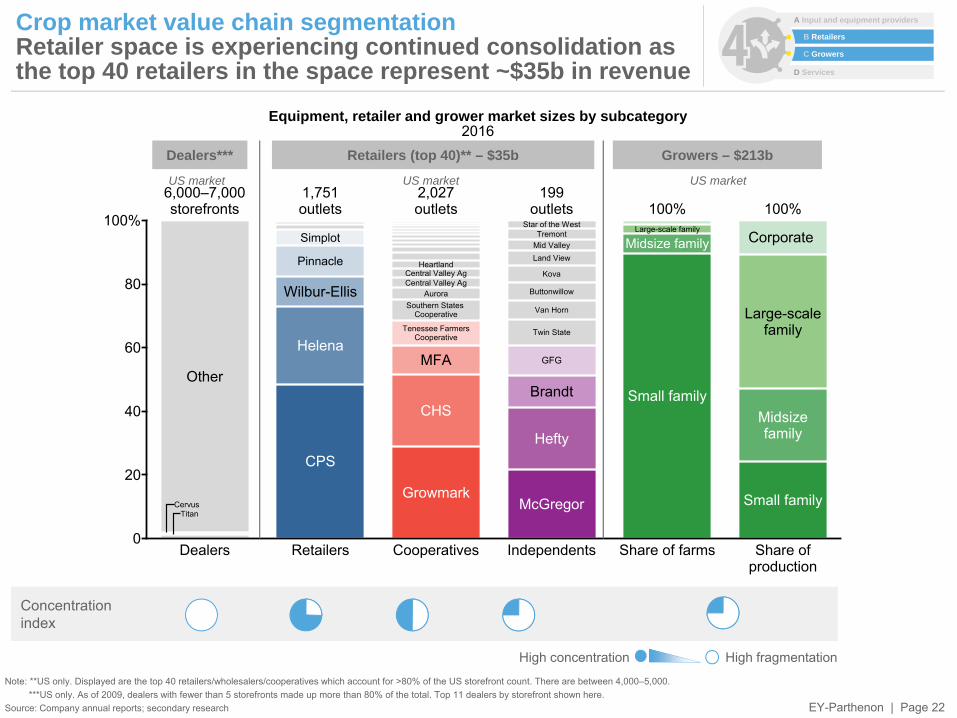
Dealers
Other
6,000–7,000storefronts
Retailers
CPS
Helena
Wilbur-Ellis
Pinnacle
Simplot
1,751outlets
Cooperatives
Growmark
CHS
MFA
Tenessee FarmersCooperative
Southern StatesCooperative
AuroraCentral Valley AgCentral Valley Ag
Heartland
2,027outlets
Independents
McGregor
Hefty
Brandt
GFG
Twin State
Van Horn
Buttonwillow
Kova
Land ViewMid ValleyTremont
Star of the West
199outlets
Share of farms
Small family
Midsize familyLarge-scale family
100%
Share ofproduction
Small family
Midsizefamily
Large-scalefamily
Corporate
100%
TitanCervus
Equipment, retailer and grower market sizes by subcategory2016
Dealers***
Concentrationindex
High fragmentationHigh concentration
Crop market value chain segmentation Retailer space is experiencing continued consolidation as the top 40 retailers in the space represent ~$35b in revenue
Note: **US only. Displayed are the top 40 retailers/wholesalers/cooperatives which account for >80% of the US storefront count. There are between 4,000–5,000.***US only. As of 2009, dealers with fewer than 5 storefronts made up more than 80% of the total. Top 11 dealers by storefront shown here.
Source: Company annual reports; secondary research
Retailers (top 40)** – $35b
US market US market
Growers – $213b
B Retailers
D Services
C Growers
A Input and equipment providers
US market
EY-Parthenon | Page 23
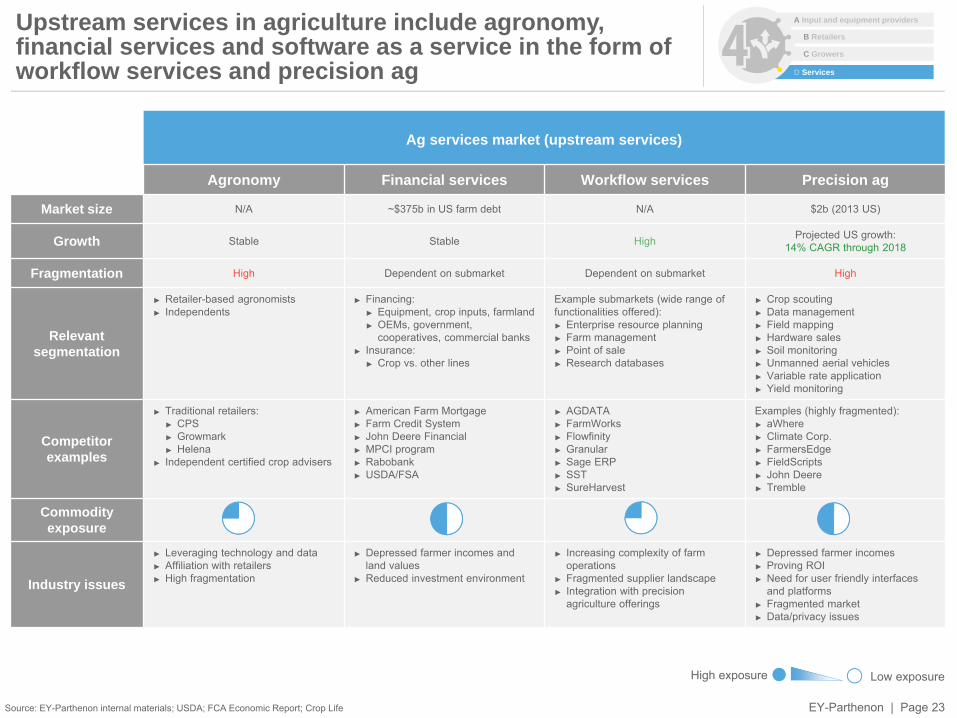
Upstream services in agriculture include agronomy, financial services and software as a service in the form of workflow services and precision ag
Source: EY-Parthenon internal materials; USDA; FCA Economic Report; Crop Life
Ag services market (upstream services)
Agronomy Financial services Workflow services Precision ag
Market size N/A ~$375b in US farm debt N/A $2b (2013 US)
Growth Stable Stable High Projected US growth: 14% CAGR through 2018
Fragmentation High Dependent on submarket Dependent on submarket High
Relevant segmentation
► Retailer-based agronomists ► Independents
► Financing:► Equipment, crop inputs, farmland► OEMs, government,
cooperatives, commercial banks► Insurance:
► Crop vs. other lines
Example submarkets (wide range of functionalities offered):► Enterprise resource planning► Farm management► Point of sale► Research databases
► Crop scouting► Data management► Field mapping► Hardware sales► Soil monitoring► Unmanned aerial vehicles► Variable rate application► Yield monitoring
Competitorexamples
► Traditional retailers:► CPS► Growmark► Helena
► Independent certified crop advisers
► American Farm Mortgage► Farm Credit System► John Deere Financial► MPCI program► Rabobank► USDA/FSA
► AGDATA► FarmWorks► Flowfinity► Granular► Sage ERP► SST► SureHarvest
Examples (highly fragmented):► aWhere► Climate Corp.► FarmersEdge► FieldScripts► John Deere► Tremble
Commodityexposure
Industry issues
► Leveraging technology and data► Affiliation with retailers► High fragmentation
► Depressed farmer incomes and land values
► Reduced investment environment
► Increasing complexity of farm operations
► Fragmented supplier landscape► Integration with precision
agriculture offerings
► Depressed farmer incomes► Proving ROI► Need for user friendly interfaces
and platforms► Fragmented market► Data/privacy issues
Low exposureHigh exposure
B Retailers
D Services
C Growers
A Input and equipment providers
EY-Parthenon | Page 24
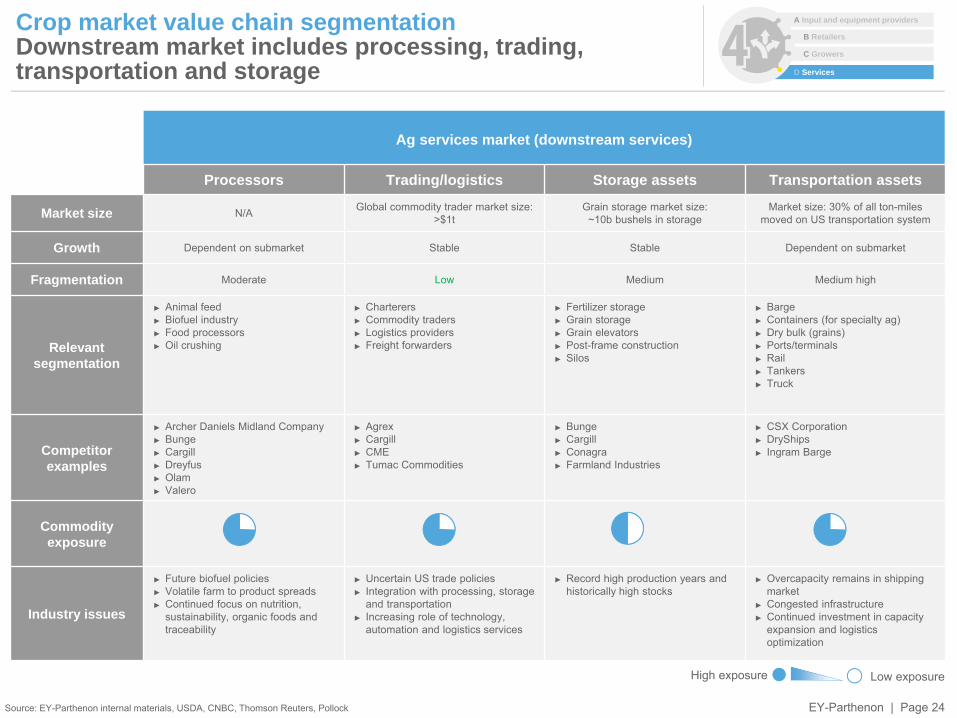
Crop market value chain segmentationDownstream market includes processing, trading, transportation and storage
Source: EY-Parthenon internal materials, USDA, CNBC, Thomson Reuters, Pollock
Ag services market (downstream services)
Processors Trading/logistics Storage assets Transportation assets
Market size N/A Global commodity trader market size: >$1t
Grain storage market size: ~10b bushels in storage
Market size: 30% of all ton-miles moved on US transportation system
Growth Dependent on submarket Stable Stable Dependent on submarket
Fragmentation Moderate Low Medium Medium high
Relevant segmentation
► Animal feed► Biofuel industry► Food processors► Oil crushing
► Charterers► Commodity traders► Logistics providers► Freight forwarders
► Fertilizer storage► Grain storage► Grain elevators ► Post-frame construction► Silos
► Barge► Containers (for specialty ag)► Dry bulk (grains)► Ports/terminals► Rail► Tankers► Truck
Competitorexamples
► Archer Daniels Midland Company► Bunge► Cargill► Dreyfus► Olam► Valero
► Agrex► Cargill► CME► Tumac Commodities
► Bunge► Cargill► Conagra► Farmland Industries
► CSX Corporation► DryShips► Ingram Barge
Commodityexposure
Industry issues
► Future biofuel policies► Volatile farm to product spreads► Continued focus on nutrition,
sustainability, organic foods and traceability
► Uncertain US trade policies► Integration with processing, storage
and transportation► Increasing role of technology,
automation and logistics services
► Record high production years and historically high stocks
► Overcapacity remains in shipping market
► Congested infrastructure► Continued investment in capacity
expansion and logistics optimization
Low exposureHigh exposure
B Retailers
D Services
C Growers
A Input and equipment providers
EY-Parthenon | Page 25
About EY-ParthenonParthenon joined Ernst & Young LLP on August 29, 2014. EY-Parthenon is a strategy consultancy, committed to bringing unconventional yet pragmatic thinking together with our clients’ smarts to deliver actionable strategies for real impact in today’s complex business landscape. Innovation has become a necessary ingredient for sustained success. Critical to unlocking opportunities is EY-Parthenon’s ideal balance of strengths – specialized experience with broad executional capabilities – to help you optimize your portfolio of businesses, uncover industry insights to make investment decisions, find effective paths for strategic growth opportunities and make acquisitions more rewarding. Our proven methodologies along with a progressive spirit can deliver intelligent services for our clients, amplify the impact of our strategies and make us the global advisor of choice for business leaders.
About EY-Parthenon’s Private Equity practicePrivate equity firms are constantly looking to make better-informed investment decisions, improve portfolio company performance and increase realized value. Over the last 15 years, our private equity strategy professionals have worked with clients to address these challenges utilizing our deep sector knowledge and efficient and flexible processes to complete more than 2,500 strategic due diligence projects around the globe. We have a winning combination for the entire range of private equity strategy and transaction needs.
Contact us
Sean LevyManaging DirectorEY-Parthenon, Ernst & Young [email protected] +1 202 327 7386
Twitter | @EY_Parthenon
Facebook | facebook.com/EYParthenon/
LinkedIn | linkedin.com/company/ey-parthenon
Follow us for regular updates
www.parthenon.ey.com
Greg MillerManaging DirectorEY-Parthenon, Ernst & Young [email protected] +1 617 478 4668
Rob DongoskiPartnerGlobal Agribusiness LeaderErnst & Young [email protected] +1 312 879 4352
EY | Assurance | Tax | Transactions | Advisory
About EYEY is a global leader in assurance, tax, transaction andadvisory services. The insights and quality services wedeliver help build trust and confidence in the capitalmarkets and in economies the world over. We developoutstanding leaders who team to deliver on ourpromises to all of our stakeholders. In so doing, we playa critical role in building a better working world for ourpeople, for our clients and for our communities.
EY refers to the global organization, and may refer toone or more, of the member firms of Ernst & YoungGlobal Limited, each of which is a separate legal entity.Ernst & Young Global Limited, a UK company limited byguarantee, does not provide services to clients.
EY-Parthenon refers to the combined group of Ernst & Young LLP and other EY member firm professionals providing strategy services worldwide. For more information about our organization, please visit parthenon.ey.com.
Ernst & Young LLP is a client-serving member firm ofErnst & Young Global Limited operating in the US.
© 2017 Ernst & Young LLP.All Rights Reserved.
This material has been prepared for general informational purposesonly and is not intended to be relied upon as accounting, tax or otherprofessional advice. Please refer to your advisors for specific advice.
ey.com


