Crustal deformation during 6 years spanning the Mw = 7.2 1995 Nuweiba earthquake,analyzed by Interferometric Synthetic Aperture Radar
Gidon Baer,a Gadi Shamir,b David Sandwell,c and Yehuda Bockc
aGeological Survey of Israel, 30 Malkhe Yisrael Street, Jerusalem 95501, IsraelbThe Geophysical Institute of Israel, P.O. Box 182, Lod 71100, Israel
cCecil H. and Ida M. Green Institute of Geophysics and Planetary Physics,Scripps Institution of Oceanography, La Jolla, California 92093, USA
(Received 15 March 2001; accepted in revised form 31 May 2001)
ABSTRACT
Baer, G., Shamir, G., Sandwell, D., Bock, Y. 2001. Crustal deformation during 6years spanning the M
w = 7.2 1995 Nuweiba earthquake, analyzed by Interfero-
metric Synthetic Aperture Radar. Isr. J. Earth Sci. 50: 9–22.
The November 22, 1995, Mw = 7.2 Nuweiba earthquake occurred along one of the
left-stepping segments of the Dead Sea Transform in the Gulf of Elat (Aqaba). Weexamine the surface deformation patterns in the region by Interferometric SyntheticAperture Radar (InSAR) for the period 1993 to 1999, which includes the end of oneseismic cycle and the beginning of the next. Because the main rupture was underwater, ERS coverage is limited to distances of approximately 5 km or more awayfrom the rupture. Pre-earthquake interferograms do not show any detectable deforma-tion along the Gulf. Coseismic interferograms show deformation at distances of up to50 km from the main rupture, with the highest fringe rate (strain) NW of the rupturetermination. Coseismic phase gradient maps show triggered slip along faults parallelto the main rupture (sinistral or normal with the Gulf side down) along the westernshore of the Gulf, and in a belt of extensional faults along the eastern shore, striking atangles of about 30° to the major rupture. Postseismic deformation is observed only ina time window of up to 6 months following the mainshock. It was concentrated in theregion of the high coseismic strain, and seems to be related to the M
L > 4.5 aftershocks
in the respective time window.
INTRODUCTION
The temporally and spatially varying behavior ofearthquakes in the Earth’s crust has been recognizedfor almost a century (e.g., Gilbert, 1909; Reid, 1910),yet the mechanisms by which the Earth deformsthroughout an earthquake cycle are still inadequatelyunderstood. The cycle of large earthquakes is oftendivided into four phases: preseismic, coseismic,postseismic, and interseismic. Geodetic observations
from various locations have detected surface displace-ments associated with each of these phases. Quantify-ing the temporal deformation patterns is of greatimportance, because they reflect the way strain accu-mulates and is released, and have implications for themechanism of strain accumulation, earthquake recur-rence times, and crustal rheology.
In this respect a great step has been made in the last
10 Israel Journal of Earth Sciences Vol. 50, 2001
two decades, with the introduction of two precisespace-based geodetic techniques: Global PositioningSystem (GPS), and Interferometric Synthetic ApertureRadar (InSAR). These techniques, which provide dis-placement measurements at sub-centimeter accuracy,enable the determination of deformation rates and pat-terns over broader areas, and over considerably shortertime intervals than previously possible. InSAR hasbeen shown to be particularly effective for mappingthe displacement fields associated with earthquakes(e.g., Massonnet and Feigl, 1998, and referencestherein). As deformation rates are higher (and thus morereadily measurable) in the coseismic and postseismicphases of the earthquake cycle, a large number of recentgeodetic studies have focused on these two phases.
Continuous and periodic GPS measurements in the3.5 years following the 1992 Landers earthquake insouthern California suggest that postseismic strain re-leased 10% to 20% of the seismic moment of the main-shock (e.g., Shen et al., 1994). The temporal behavior ofthis strain relaxation and its mechanism are still poorlyunderstood, but it has been generally described as ashort-term exponential relaxation superimposed upon along-term linear trend. One way of identifying the strainrelease mechanism is by observing the rate of decayand the spatial extent of deformation following anearthquake. A larger extent of deformation withslower decay rates is generally attributed to visco-elastic relaxation or slip on the downward extension ofthe rupture (e.g., Thatcher, 1983), whereas small-scalerelaxation patterns may be attributed to shallower pro-cesses closer to the fault zone, possibly related to fluidflow.
The November 22, 1995 Mw = 7.2 Nuweiba earth-
quake occurred along one of the left-stepping seg-ments of the Dead Sea Transform (DST) in the Gulf ofElat (Fig. 1). It was the largest earthquake along theDST in the last few centuries (e.g., Ambraseys andMelville, 1989). The earthquake was preceded byearthquake swarms near both its rupture ends (Shamir,1997). The mainshock was followed by intense after-shock activity, including nearly 200 events of M
L ≥ 4
in the year following the mainshock (Hofstetter et al.,1998). The epicenter of the Nuweiba earthquake wasat 28.76°N, 34.66°E, with an estimated nucleationdepth of about 12.5 km. The earthquake initiated witha small sub-event which had a pronounced normalcomponent, while the overall rupture was dominantlyleft lateral strike slip (Kikuchi, 1995; Shamir, 1996;Pinar and Turkelli, 1997; Hofstetter et al., 1998).
In a previous study (Baer et al., 1999) we analyzed
the coseismic deformation of the earthquake usingInSAR. In this study, we present improved InSARresults of the coseismic deformation due to extendeddata in the near range of the radar and a better digitalelevation model (DEM). We extend the analyzedperiod to six years (1993–1999), spanning the end ofone seismic cycle and the beginning of the next.
INTERFEROMETRIC SYNTHETICAPERTURE RADAR (INSAR)
Method
Interferometric analysis of SAR images has become awidespread, effective technique to measure subtle dis-placements at the ground surface (Gabriel et al., 1989;Massonnet and Feigl, 1998, and references therein).When two radar scans are made at different times fromthe same viewing angle, a small change in the positionof the target (ground surface) may create a detectablechange in the phase of reflected signals. This phasechange is proportional to the path difference betweenthe two signals, and thus may be translated to displace-ment along the satellite-to-ground line of sight. Acomponent of this phase change is always generatedby the topography in the target area; the topographiceffect increases with the growing separation (baseline)between the two viewing antennae. To isolate thephase change caused by ground displacements fromthe topographic phase, the latter is removed. A low-resolution digital elevation model (DEM) is projectedinto the radar coordinates and removed from the fullresolution interferogram. In addition to removing thecrude DEM, the residual phase from a suitable TandemERS-1 to ERS-2 pair is unwrapped and added to thecrude topographic phase model to form a full resolu-tion topography model needed for isolating the phasesignal due to ground motion. This hybrid approach oftopographic phase construction retains the long-wave-length accuracy of the two-pass method (Massonnetand Feigl, 1998) and the full topographic resolution ofthe 4-pass method (Zebker et al., 1994).
The resulting (change) interferogram reflects therange changes primarily due to ground displacement,but also includes some artifacts due to orbital or signalpropagation (atmospheric) errors and temporal and/orspatial decorrelation of the land surface. Repeat orbitsare usually not parallel, necessitating the computationof a new baseline at every point in both azimuth andrange within an image frame (e.g., Gabriel andGoldstein, 1988). In contrast to previous studies,which estimated baseline parameters from imagery,
G. Baer et al. Crustal deformation during 6 years spanning the Nuweiba EQ 11
topography data, and perhaps known ground controlpoints, we compute baselines from ERS-1/2 preciseorbits provided by Scharroo and Visser (1997). Theseorbits have radial accuracy of 50 mm and cross-overrepeatability within 70 mm, giving an overall baselineaccuracy better than 70 mm. The advantage of thisapproach is that surface displacements and long-wave-length atmospheric artifacts are not absorbed into thebaseline estimate.
Methods of filtering interferograms range fromsimple averaging over pixels (taking looks) (e.g.,Gabriel et al., 1989), to spatially variable filters whosepower spectra are matched to that of the local phase(Goldstein et al., 1988; Werner et al., 1992). We fil-tered the real and imaginary parts of the complexinterferogram (with pixel spacing as sampled by theradar) separately, using a low-pass Gaussian 5 point by17 point filter that has a 0.5 gain at a wavelength of200 m (Sandwell and Price, 1998).
Because we cannot yet remove the atmosphericsignal from the topographic phase-corrected interfero-grams, it is important to be able to recognize atmo-spheric artifacts so they are not confused with deforma-tion. Short-wavelength atmospheric artifacts (whichcould be confused with small-scale tectonic deforma-tions) typically have length scales on the order of 5–10km and can cause as much as 6 cm of excess two-waypath length (2 interferogram fringes). Examples can befound in Massonnet and Feigl (1995), Rosen et al.
(1996), Zebker et al. (1997), and Hanssen (2001). Inter-ferograms showing obvious atmospheric contaminationare discarded. Regional atmospheric effects corre-sponding to long-wavelength, ionospheric perturba-tions, and differences in the hydrostatic component ofthe troposphere manifest themselves as a planar phasetrend in an interferogram (Tarayre and Massonnet,1996). This phase trend makes it necessary eitherto compute an “artificial baseline” (Tarayre andMassonnet, 1996) or to remove the long-wavelengthatmospheric effect from the interferogram at somepoint in the data processing. If these regional effectsare not removed, they could be interpreted as a re-gional tilt. Each fringe cycle in the topography- andorbital-corrected change interferogram corresponds tocontours of 28-mm ground displacement along thesatellite-to-ground line of sight.
DATA
SAR data for this study were collected by the Euro-pean Space Agency Remote Sensing Satellites ERS-1,which imaged the area between April 1992 and Octo-ber 1997, and ERS-2, which has been imaging the areasince July 1995. The SAR operates in C-band at awavelength of 56.5 mm, with a nominal orbital cycleof 35 days for each satellite. During the overlappingperiod of the two satellites (1995–1997), they per-formed tandem missions at one-day intervals. For this
Figs. 4, 5b-f, 10Elat Basin
Aragonese Basin
Fig. 7d
••
585
567
ElatAqaba
Nuweiba
0
km
3015
50
Fig. 1. Location map of the Gulf of Elat(Aqaba), showing the major faults, and theepicenter and general rupture trace of theNuweiba earthquake (marked by arrow).Also shown are the SAR frames selected forinterferometric analysis, and locations ofFigs. 4,5,7, and 10.
12 Israel Journal of Earth Sciences Vol. 50, 2001
study, we selected three 100 × 100 km SAR frames(Figs. 1,2): frames 567 and 585 (ascending track), andframe 3015 (descending track). Change (deformation)interferograms were generated for different time inter-vals of 3 to 71 months between 1993 and 1999 (Fig. 2).Only the descending track (frame 3015) has suitabledata for interferometric analysis of the 3 pre-earth-quake years (Fig. 2).
RESULTS
Coseismic and postseismic interferograms
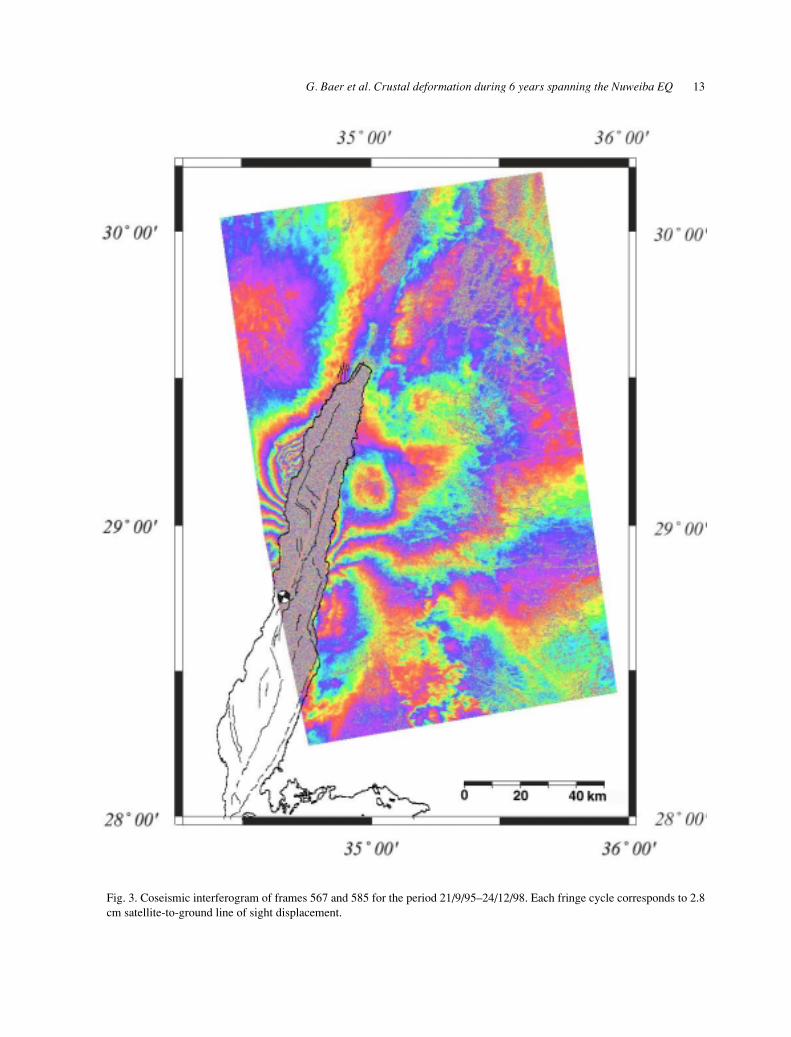
We have generated a new interferogram in the twoeastern (ascending track) frames for the period21/9/95–24/12/98 (Fig. 3). The interferogram shows 3zones of pronounced (coseismic + postseismic) dis-placements, one on the western side of the Gulf, with a
maximum satellite-to-ground range change of about15 cm, and two zones on the eastern side of the Gulf,with range changes of less than 10 cm. The sense ofdisplacement in the two northern lobes (as determinedby the color order in each lobe) is away from thesatellite, opposite to the displacement sense in thesouthern lobe.
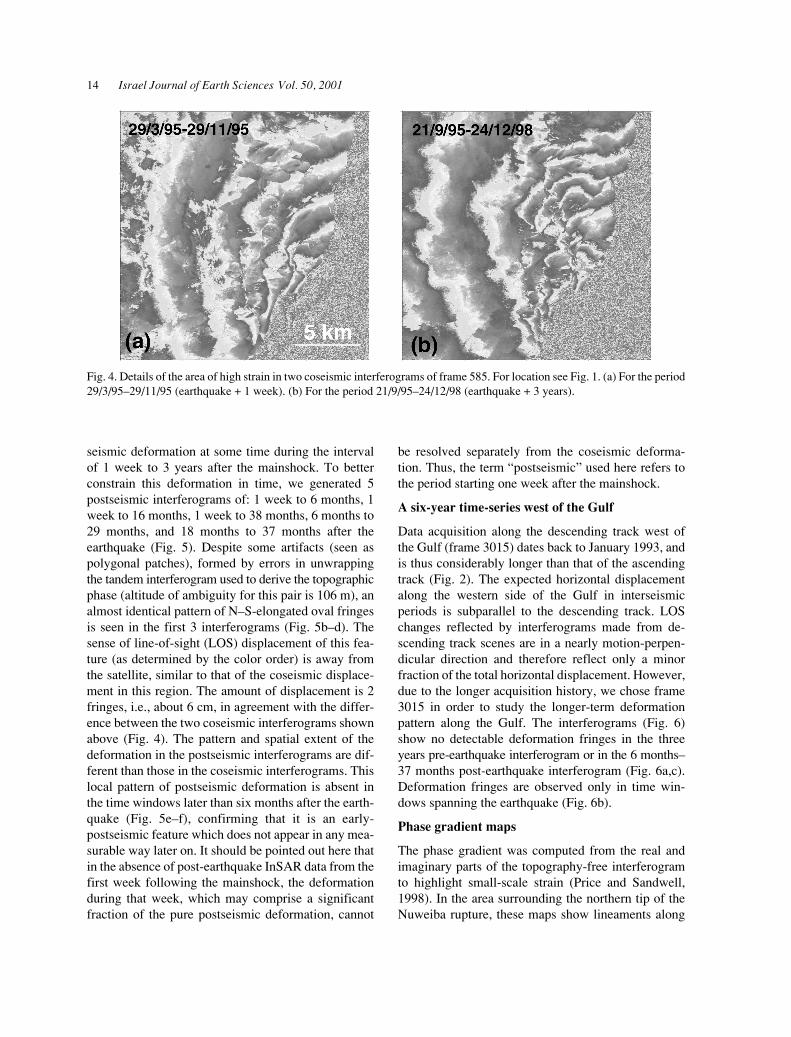
Postseismic deformation may be estimated in twoways. First, by comparing a coseismic interferogramthat spans the earthquake + 1 week (Baer et al., 1999)with that of the earthquake + 3 years (Fig. 3). On theregional scale, there is no apparent difference betweenthe two interferograms in most of the area. In moredetail, however, two additional fringes are seen in the3-year interferogram (Fig. 4b) compared to the 1-weekinterferogram (Fig. 4a) in the high-strained northwest-ern lobe. This difference may be attributed to post-
1993 1994 1995 1996 1997 1998 1999 2000
1993 1994 1995 1996 1997 1998 1999 2000
0
100
150
-100
50
-150
-50
0
100 150
-100
50
-150
-50
-200 -250
200250
19369 22876
25381
10217
10718
15728
19235
19736
25388
0571500705
20378 19743
192421051508010
02201
03203
05708
Date
Date
Per
pen
dic
ula
r b
asel
ine
(m)
Per
pend
icul
ar b
asel
ine
(m)
Mainshock
567+585
3015
Mainshock
ERS-1ERS-2
Fig. 2. Acquisition times and perpendicular baselines of orbits checked for this study. Grey solid and dashed lines representpairs used for change and topographic interferograms, respectively. Top, frames 567 and 585, bottom, frame 3015.
G. Baer et al. Crustal deformation during 6 years spanning the Nuweiba EQ 13
Fig. 3. Coseismic interferogram of frames 567 and 585 for the period 21/9/95–24/12/98. Each fringe cycle corresponds to 2.8cm satellite-to-ground line of sight displacement.
14 Israel Journal of Earth Sciences Vol. 50, 2001
seismic deformation at some time during the intervalof 1 week to 3 years after the mainshock. To betterconstrain this deformation in time, we generated 5postseismic interferograms of: 1 week to 6 months, 1week to 16 months, 1 week to 38 months, 6 months to29 months, and 18 months to 37 months after theearthquake (Fig. 5). Despite some artifacts (seen aspolygonal patches), formed by errors in unwrappingthe tandem interferogram used to derive the topographicphase (altitude of ambiguity for this pair is 106 m), analmost identical pattern of N–S-elongated oval fringesis seen in the first 3 interferograms (Fig. 5b–d). Thesense of line-of-sight (LOS) displacement of this fea-ture (as determined by the color order) is away fromthe satellite, similar to that of the coseismic displace-ment in this region. The amount of displacement is 2fringes, i.e., about 6 cm, in agreement with the differ-ence between the two coseismic interferograms shownabove (Fig. 4). The pattern and spatial extent of thedeformation in the postseismic interferograms are dif-ferent than those in the coseismic interferograms. Thislocal pattern of postseismic deformation is absent inthe time windows later than six months after the earth-quake (Fig. 5e–f), confirming that it is an early-postseismic feature which does not appear in any mea-surable way later on. It should be pointed out here thatin the absence of post-earthquake InSAR data from thefirst week following the mainshock, the deformationduring that week, which may comprise a significantfraction of the pure postseismic deformation, cannot
be resolved separately from the coseismic deforma-tion. Thus, the term “postseismic” used here refers tothe period starting one week after the mainshock.
A six-year time-series west of the Gulf
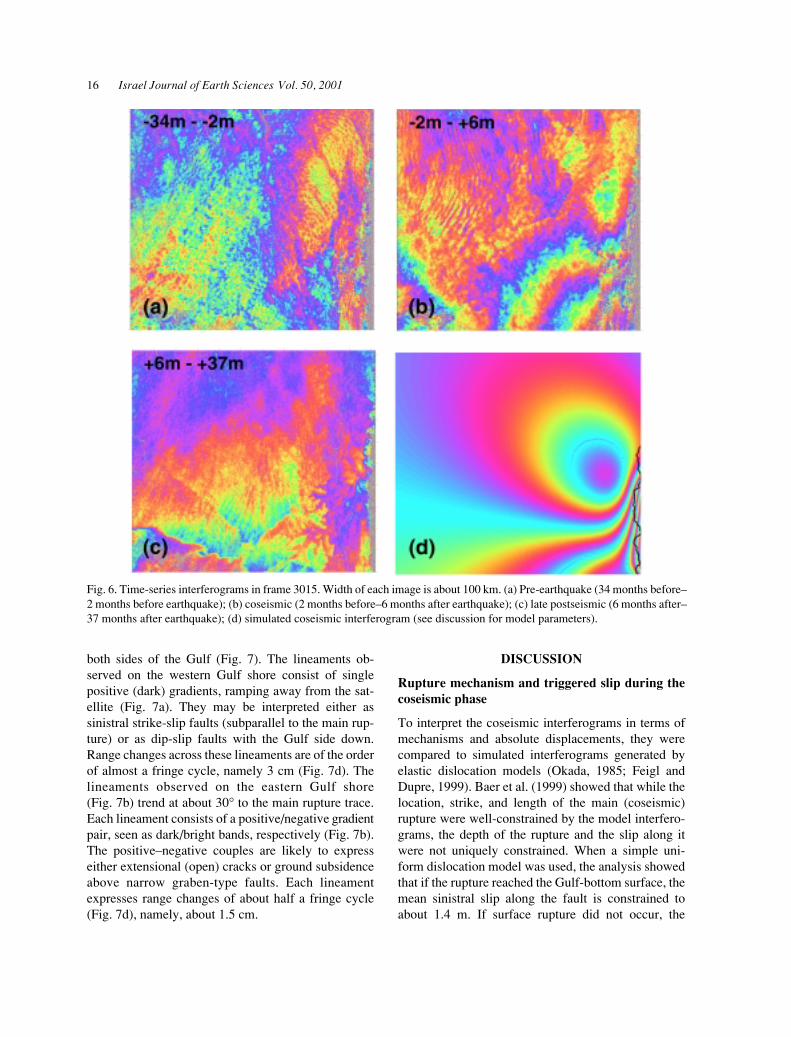
Data acquisition along the descending track west ofthe Gulf (frame 3015) dates back to January 1993, andis thus considerably longer than that of the ascendingtrack (Fig. 2). The expected horizontal displacementalong the western side of the Gulf in interseismicperiods is subparallel to the descending track. LOSchanges reflected by interferograms made from de-scending track scenes are in a nearly motion-perpen-dicular direction and therefore reflect only a minorfraction of the total horizontal displacement. However,due to the longer acquisition history, we chose frame3015 in order to study the longer-term deformationpattern along the Gulf. The interferograms (Fig. 6)show no detectable deformation fringes in the threeyears pre-earthquake interferogram or in the 6 months–37 months post-earthquake interferogram (Fig. 6a,c).Deformation fringes are observed only in time win-dows spanning the earthquake (Fig. 6b).
Phase gradient maps
The phase gradient was computed from the real andimaginary parts of the topography-free interferogramto highlight small-scale strain (Price and Sandwell,1998). In the area surrounding the northern tip of theNuweiba rupture, these maps show lineaments along
Fig. 4. Details of the area of high strain in two coseismic interferograms of frame 585. For location see Fig. 1. (a) For the period29/3/95–29/11/95 (earthquake + 1 week). (b) For the period 21/9/95–24/12/98 (earthquake + 3 years).
G. Baer et al. Crustal deformation during 6 years spanning the Nuweiba EQ 15
(a)
(b) (c)
(d) (e)
(f)
1w–6m 1w–16m
1w–38m 6m–29m
18m–37m
Fig. 5. (a) Postseismic interferogram of frame 585 for theperiod 1 week–38 months after the earthquake. (b–f) Detailsof the area of high strain (inset at SW corner of frame 585)for different time periods after the earthquake: (b) 1 week–6months, (c) 1 week–16 months, (d) 1 week–38 months, (e) 6months–29 months, (f) 18 months–37 months.
16 Israel Journal of Earth Sciences Vol. 50, 2001
both sides of the Gulf (Fig. 7). The lineaments ob-served on the western Gulf shore consist of singlepositive (dark) gradients, ramping away from the sat-ellite (Fig. 7a). They may be interpreted either assinistral strike-slip faults (subparallel to the main rup-ture) or as dip-slip faults with the Gulf side down.Range changes across these lineaments are of the orderof almost a fringe cycle, namely 3 cm (Fig. 7d). Thelineaments observed on the eastern Gulf shore(Fig. 7b) trend at about 30° to the main rupture trace.Each lineament consists of a positive/negative gradientpair, seen as dark/bright bands, respectively (Fig. 7b).The positive–negative couples are likely to expresseither extensional (open) cracks or ground subsidenceabove narrow graben-type faults. Each lineamentexpresses range changes of about half a fringe cycle(Fig. 7d), namely, about 1.5 cm.
DISCUSSION
Rupture mechanism and triggered slip during thecoseismic phase
To interpret the coseismic interferograms in terms ofmechanisms and absolute displacements, they werecompared to simulated interferograms generated byelastic dislocation models (Okada, 1985; Feigl andDupre, 1999). Baer et al. (1999) showed that while thelocation, strike, and length of the main (coseismic)rupture were well-constrained by the model interfero-grams, the depth of the rupture and the slip along itwere not uniquely constrained. When a simple uni-form dislocation model was used, the analysis showedthat if the rupture reached the Gulf-bottom surface, themean sinistral slip along the fault is constrained toabout 1.4 m. If surface rupture did not occur, the
Fig. 6. Time-series interferograms in frame 3015. Width of each image is about 100 km. (a) Pre-earthquake (34 months before–2 months before earthquake); (b) coseismic (2 months before–6 months after earthquake); (c) late postseismic (6 months after–37 months after earthquake); (d) simulated coseismic interferogram (see discussion for model parameters).
G. Baer et al. Crustal deformation during 6 years spanning the Nuweiba EQ 17
Fig. 7. Coseismic phase gradient maps showing (a) NNE-striking faults along the western shoreline of the Gulf; (b) NNW-striking extensional lineaments along the eastern shore of the Gulf. (c) Air photograph showing step fault scarps in recentalluvial fans, Wadi Huwet, eastern Sinai (from Bowman and Gerson, 1986). (d) Details of the Gulf region in the 3-yearcoseismic interferogram (Fig. 3). Green line marks the northern end of the earthquake rupture (see Fig. 1 for location). Note thephase discontinuities that correspond to the lineaments in the phase gradient maps (a,b) and the Gulf-parallel phasediscontinuity along the western shoreline that is found at the northward continuation of the fault scarps shown in (c).
18 Israel Journal of Earth Sciences Vol. 50, 2001
average sinistral slip could be as high as 3 m for a faultpatch buried 4 km below the Gulf bottom. Differentcombinations of slip and burial depth could yieldsimulated interferograms showing good agreementwith the coseismic interferogram (Baer et al., 1999).Independent evidence for the burial depth (or for Gulf-bottom surface rupturing) is currently not available.
Two examples of such coseismic simulated inter-ferograms are shown in Figs. 6d and 8, for the de-scending and ascending tracks, respectively. A uni-form slip of 2 m has been applied along the entirerupture, with burial depth of 1.5 km below the Gulf
bottom. Both interferograms show good agreementwith the coseismic interferograms (Figs. 3,6,8). Amore detailed and rigorous modeling of the coseismicdeformation, is currently in progress (Shamir et al., inpreparation).
The lineaments described above (Fig. 7) are foundonly in the coseismic phase gradient maps, suggestingthat they express coseismic deformation. Price andSandwell (1998) and Sandwell et al. (2000) haveshown lineaments of similar appearance in phase gra-dient maps of the Landers and Hector Mine earth-quakes in southern California, parallel to the main
Fig. 8. Simulated interferogram showing fringes calculated from a dislocation model with one fault patch 45 km long, buried1.5 km below sea level, with a uniform slip of 2 m. Note the good agreement with the coseismic interferogram (Fig. 3).
G. Baer et al. Crustal deformation during 6 years spanning the Nuweiba EQ 19
rupture, and related them to triggered slip on pre-existing faults. The phase gradient maps shown heremay also suggest that the Nuweiba earthquake hastriggered slip on secondary faults parallel to and atangles of 30° to the main rupture (Fig. 7). Fresh faultswere observed immediately after the earthquake alongthe western shores of the Gulf (Wust, 1997; Fig. 9).Faults of similar orientations offset the Plio-Pleis-tocene Garof Conglomerate along the Gulf and thewestern margins of the southern Arava Valley(Garfunkel, 1970), and Late-Quaternary alluvial fansalong the Gulf shorelines (Bowman and Gerson, 1986;Fig. 7c). Collectively, these faults suggest a long his-tory of similar earthquakes in the Gulf and may ex-press one of the causes of Gulf subsidence since thePliocene.
Postseismic deformation
Various mechanisms were proposed for postseismicdeformation and strain relaxation following previous
earthquakes. In general, they include viscous relax-ation processes at depth, slip on the original rupture oron its downward extension, and fault-zone processessuch as collapse or fluid pressure buildup (e.g.,Thatcher, 1983; Savage et al., 1994; Massonnet et al.,1996; Peltzer et al., 1996; Bock et al., 1997; Savageand Svarc, 1997; Reilinger et al., 2000).
We suggest that the postseismic deformation fol-lowing the Nuweiba earthquake may be associatedwith the aftershock sequence during the first 6 monthsafter the earthquake (Fig. 10). Almost 200 aftershocksin the magnitude range of 4.0 < M
L < 5.6 were re-
corded by the Israel Seismic Network (ISN) duringthis period. For 58 aftershocks, regional broadbandseismograms were used by Hofstetter et al. (1998) toobtain the seismic moment and the source mechanisms.In the area of postseismic deformation NW of the mainrupture, several M
L > 4 aftershocks with normal fault
mechanisms are aligned in a N–S orientation (Fig. 10).Shamir et al. (in preparation) show a good agreement
Fig. 9. Small faults observed along the Gulf ofElat immediately after the Nuweiba earthquake.(a) 2-cm vertical offset in an alluvial fan south ofNuweiba. (b) Sinistral slip indicated by trans-pression between two right-stepping segments ofa fault across the main road north of Nuweiba.
20 Israel Journal of Earth Sciences Vol. 50, 2001
between the observed deformation and model interfero-grams of the postseismic stage with a normal fault thatcoincides with the location of this aftershock sequence.
SUMMARY AND CONCLUSIONS
We used InSAR to analyze the surface deformationpatterns in the region surrounding the November 1995Nuweiba earthquake rupture during six years that spanthe end of one seismic cycle and the beginning of thenext. Three 100 × 100 km SAR frames were used toproduce interferograms for time intervals preceding,including, and following the earthquake. The pre-earthquake interferograms do not show any detectabledeformation. Coseismic interferograms were made fordifferent earthquake-spanning intervals. Comparison
between the period earthquake + 1 week and earth-quake + three years shows slight differences in thefringe pattern around the earthquake rupture. Thesedifferences indicate postseismic deformation later thanone week after the mainshock. Detailed examinationof interferograms generated for various postseismicintervals indicates that postseismic deformation is infact limited to the first 6 months after the earthquake,is concentrated in the region of the high coseismicstrain observed, and is most likely related to elasticstrain relaxation by aftershocks.
The Nuweiba earthquake has presumably triggeredslip on secondary faults parallel to and at angles of 30°to the main rupture. Faults of similar orientations andcomparable displacements are found in Plio-Pleis-tocene sedimentary units (Garof Conglomerate) and
Fig. 10. Aftershocks in the range of 4.0 < ML < 5.6 during the first 6 months after the mainshock shown with the 1 week–6
months postseismic interferogram. The blue line marks the northern end of the earthquake rupture (see Fig. 1 for location).
G. Baer et al. Crustal deformation during 6 years spanning the Nuweiba EQ 21
late Quaternary alluvial fans along the Gulf shores.New scarps were identified immediately after themainshock, suggesting a long history of similar earth-quakes within the Gulf.
ACKNOWLEDGMENTS
This study was supported by Grant No. 98-00134 fromthe United States-Israel Binational Science Founda-tion (BSF), Jerusalem, Israel. We would like to thankRoland Bürgmann and Kurt Feigl for their thoroughand constructive reviews of this paper, which im-proved it significantly. Simon Williams is thanked forthe dislocation modeling and InSAR simulation pro-grams. ERS data were provided by the EuropeanSpace Agency (ESA), and distributed by Eurimage,Research and Demonstration category program.
REFERENCES
Ambraseys, N.N., Melville, C.P. 1989. Evidence for intra-plate earthquakes in northwest Arabia. Bull. Seismol.Soc. Am. 79: 1279–1281.
Baer, G., Sandwell, D., Williams, S., Shamir, G., Bock, Y.1999. Coseismic deformation associated with the No-vember 1995, M
W = 7.1 Nuweiba earthquake, Gulf of
Elat (Aqaba), detected by synthetic aperture radar inter-ferometry. J. Geophys. Res. 104: 25221–25232.
Bock, Y., et al. 1997. Southern California permanent GPSgeodetic array: continuous measurements of regionalcrustal deformation between the 1992 Landers and 1994Northridge earthquakes. J. Geophys. Res. 102: 18013–18033.
Bowman, D., Gerson, R. 1986. Morphology of the latestQuaternary surface faulting in the Gulf of Elat region,eastern Sinai. Tectonophysics 128: 97–119.
Feigl, K.L., Dupre, E. 1999. RNGCHN: a program to calcu-late displacement components from dislocations in anelastic half-space with applications for modeling geo-detic measurements of crustal deformation. Comput.Geosci. 25: 695–704, .
Gabriel, A.K., Goldstein, R.M. 1988. Crossed orbit interfer-ometry: theory and experimental results from SIR-B. Int.J. Remote Sensing 9: 857–872.
Gabriel, A.K., Goldstein, R.M., Zebker, H.A. 1989. Map-ping small elevation changes over large areas: differen-tial radar interferometry. J. Geophys. Res. 94: 9183–9191.
Garfunkel, Z. 1970. The tectonics of the western margins ofthe southern Arava. Ph.D. thesis, Hebrew Univ., Jerusa-lem, 204 pp. (in Hebrew, English abstr.).
Hanssen, R. 2001. Radar interferometry: data interpretationand error analysis. Ph.D. thesis, Delft Univ. of Technol-ogy, 308 pp.
Hofstetter, A., Shamir, G., Thio, H.K. 1998. The 1995Nuweiba source complexity and its relation with theaftershock sequence. 26th General Assembly of the Eu-ropean Seismological Commission, 1998, Tel Aviv, p.28 (Abstract).
Kikuchi, M. 1995. Teleseismic analysis of the Gulf ofAqaba, Egypt, earthquake of Nov. 22, 1995. YCU, Seis-mology Note #49,
Massonnet, D., Feigl, K. 1995. Discriminating geophysicalphenomena in satellite radar interferograms. Geophys.Res. Lett. 22: 1537–1540.
Massonnet, D., Feigl, K. 1998. Radar interferometry and itsapplication to changes in the Earth’s surface. Rev.Geophys. 36: 441–500.
Massonnet, D., Thatcher, W., Vadon, H. 1996. Detection ofpostseismic fault-zone collapse following the Landersearthquake. Nature 382: 612–616.
Okada, Y. 1985. Surface deformation to shear and tensilefaults in a half-space. Bull. Seismol. Soc. Am. 75: 1135–1154.
Peltzer, G., Rosen, P., Rogez, F., Hudnut, K. 1996. Post-seismic rebound in fault step-over caused by pore fluidflow. Science 273: 1202–1204.
Pinar, A., Turkelli, N. 1997. Source inversion of the 1993and 1995 Gulf of Aqaba earthquakes. Tectonophysics283: 279–288.
Price, E.J., Sandwell, D.T. 1998. Small-scale deformationassociated with the 1992 Landers, California earthquakemapped by synthetic aperture radar interferometry phasegradients. J. Geophys. Res. 103: 27001–27016.
Reid, H.F. 1910. The mechanics of the earthquake. In: TheCalifornia earthquake of April 18, 1906. Rep. StateEarthquake Invest. Comm., Vol. 2. Carnegie Inst. Publ.87, 192 pp., Washington, D.C.
Reilinger, R.E., et al. 2000. Coseismic and postseismic faultslip for the 17 August 1999, M = 7.5 Izmit, Turkeyearthquake. Science 289: 1519–1524.
Rosen, P.A., Hensley, S., Zebker, H.A., Webb, F.H., Field-ing, E. 1996. Surface deformation and coherence mea-surements of Kilauea Volcano, Hawaii from SIR-C radarinterferometry. J. Geophys. Res. 101: 23109–23125.
Sandwell, D.T., Sichoix, L., Agnew, D., Bock, Y., Minster,J.B. 2000. Near real-time radar interferometry of the M
w
7.1 Hector Mine Earthquake. Geophys. Res. Lett. 27:3101–3104.
Savage, J.C., Svarc, J.L. 1997. Postseismic deformationassociated with the 1992 M
w = 7.3 Landers earthquake,
22 Israel Journal of Earth Sciences Vol. 50, 2001
southern California. J. Geophys. Res. 102: 7565–7577.Savage, J.C., Lisowski, M., Svarc, J.L. 1994. Postseismic
deformation following the 1989 (M = 7.1) Loma Prieta,California, earthquake. J. Geophys. Res. 99: 13,757–13,765.
Scharroo, R., Visser, P. 1998. Precise orbit determinationand gravity field improvement for the ERS satellites. J.Geophys. Res. 103: 8113–8127.
Shamir, G. 1996. The November 22, 1995, Nuweiba earth-quake, Gulf of Elat (Aqaba): mechanical analysis.Geophys. Inst. Isr., Lod, Rep. 550/87/96 (114).
Shamir, G. 1997. Seismicity of the southern Dead Sea Trans-form. Annu. Mtg. Isr. Geol. Soc., Kfar Gil’adi, p. 104(Abstract).
Shen, Z.K., Jackson, D.D., Feng, Y., Cline, M., Kim. M.,Fang, P., Bock, Y. 1994. Postseismic deformation fol-lowing the Landers earthquake, California, June 28,1992. Bull. Seismol. Soc. Am. 84: 780–791.
Tarayre, H., Massonnet, D. 1996. Atmospheric propagationheterogeneities revealed by ERS-1 interferometry.Geophys. Res. Lett. 23: 989–992.
Thatcher, W. 1983. Nonlinear strain buildup and the earth-quake cycle on the San Andreas fault. J. Geophys. Res.88: 5893–5902.
Werner, C.L., Hensley, S., Goldstein, R.M., Rosen, P.A.,Zebker, H. 1992. Techniques and applications of SARinterferometry for ERS-1: topographic mapping, changedetection and slope measurement. Paper presented at FirstERS-1 Symposium: Space at the Service of Our Environ-ment. European Space Agency, Cannes, France.
Wust, H. 1997. The November 22, 1995 Nuweiba earth-quake, Gulf of Elat (Aqaba): post-seismic analysis offailure features and seismic hazard implications. Geol.Surv. Isr. Rep. GSI/3/97, 58 pp.
Zebker, H.A., Werner, C.L., Rosen, P.A., Hensley, S. 1994.Accuracy of topographic maps derived from ERS-1 inter-ferometric radar. IEEE Trans. Geosci. Remote Sensing32: 823–836.
Zebker, H.A., Rosen, P.A., Hensley, S. 1997. Atmosphericeffects in interferometric synthetic aperture radar surfacedeformation and topographic maps. J. Geophys. Res.102: 7547–7563.