LETTERSPUBLISHED ONLINE: 11 APRIL 2010 | DOI: 10.1038/NGEO830
Crustal deformation of the eastern Tibetanplateau revealed by magnetotelluric imagingDenghai Bai1*, Martyn J. Unsworth2, Max A. Meju3, Xiaobing Ma1, Jiwen Teng1, Xiangru Kong1,Yi Sun4, Jie Sun5, LifengWang5, Chaosong Jiang6, Ciping Zhao6, Pengfei Xiao1 and Mei Liu1
The ongoing collision of the Indian and Asian continentshas created the Himalaya and Tibetan plateau througha range of deformation processes. These include crustalthickening, detachment of the lower lithosphere from the plate(delamination) and flow in a weakened lower crust1–6. Debatecontinues as to which of these processes are most significant7.In eastern Tibet, large-scale motion of the surface occurs,but the nature of deformation at depth remains unresolved.A large-scale crustal flow channel has been proposed as anexplanation for regional uplift in eastern Tibet6,8,9, but existinggeophysical data10,11 do not constrain the pattern of flow.Magnetotellurics uses naturally occurring electromagneticwaves to image the Earth’s subsurface. Here we presentmagnetotelluric data that image two major zones or channelsof high electrical conductivity at a depth of 20-40 km. Thechannels extend horizontally more than 800 km from theTibetan plateau into southwest China. The electrical propertiesof the channels imply an elevated fluid content consistent witha weak crust12,13 that permits flow on a geological timescale.These findings support the hypothesis that crustal flow canoccur in orogenic belts and contribute to uplift of plateaux. Ourresults reveal the previously unknown complexities of thesepatterns of crustal flow.
Many previous studies of the India–Asia collision zone tookplace on the southern boundary of the Tibetan plateau in theHimalaya. However, the deformation of the eastern margin of theplateau is also important to developing a full understanding ofthis continent–continent collision (Fig. 1). Geologic1 and geodeticstudies14 confirm that crustal blocks move clockwise around theeastern Himalayan syntaxis (EHS). Deformation at mid-crustallevels is not directly constrained by geodetic measurements andmotion may be different from that observed at the surface. Seismicstudies indicate that the crust and mantle might move coherentlyaround the EHS (ref. 15). Geological studies in southeast Tibetindicate that the region of high elevation between the Sichuan basinand the EHS may have been uplifted with only small amounts ofinternal deformation6,8. It has been suggested that this uplift hasbeen caused by an influx of lower crustal flow, as shown in Fig. 1. Inthis type of deformation, the flow is forced around regions of thick,stable lithosphere such as the Sichuan basin.
Geophysical imaging of the subsurface structure is needed todetermine whether crustal flow is active in a region such aseastern Tibet. It is anticipated that such a flow channel wouldbe characterized by a reduced seismic velocity and an elevatedelectrical conductivity (reduced resistivity), compared with stable
1State Key Laboratory of Lithospheric Evolution, Institute of Geology and Geophysics, Chinese Academy of Sciences, Beijing 100029, China, 2Departmentof Physics, University of Alberta, Edmonton, T6G 2J1, Canada, 3Lancaster Environmental Centre, Lancaster University, Lancaster LA1 4YQ, UK, 4DalianUniversity of Technology, Dalian 116024, China, 5Institute of Geology, China Earthquake Administration, Beijing 100029, China, 6EarthquakeAdministration of Yunnan Province, Kunming 650041, China. *e-mail: [email protected].
continental crust. Seismic exploration in eastern Tibet has detecteda widespread crustal low-velocity zone, with its upper surface atdepths of 15–25 km, that was interpreted as a layer of aqueous fluidsand/or partial melt10,11. This low-velocity layer was spatially variableand thinned to the southeast, but the large inter-station spacing didnot permit detailed images of the inferred flow channel.
Magnetotelluric exploration can determine the electrical resistiv-ity (or its reciprocal quantity, conductivity) of the crust and uppermantle. Conductivity is important in studies of crustal structurebecause it is sensitive to the presence of fluids. Magnetotelluricstudies in southern Tibet gave images of a southward-directedcrustal flow channel12 and showed that the fluid content of the crustinferred from themagnetotelluric data was consistent with rheolog-ical conditions required for crustal flow13. The crustal flow patternproposed for eastern Tibet6,8 is geographically distinct from that in-ferred in southernTibet and occurring over a larger horizontal scale.Magnetotelluric data on the INDEPTH-600 line in northern Tibet16and on profile P3 in Sichuan17 (Fig. 1) detected a layer with elevatedmid-crustal conductivity thatmay represent fluid-rich regions asso-ciated with crustal flow. However, the distance between these twomagnetotelluric surveys was too large to reliably correlate featuresfrom one profile to another. This Letter describes the results of anew magnetotelluric survey in eastern Tibet that has detected twomajor zones of high-crustal-conductivity crust that seem to be partsof a regionally extensive layer, and which are inferred to be zoneswith elevated fluid contentwhere deformation occursmost rapidly.
Broadband magnetotelluric data were recorded between 2004and 2007 at 325 locations in the easternHimalaya syntaxis (EHS3D)survey with a total profile length of 2,110 km (Fig. 1). Details of themagnetotelluric data analysis are presented in the SupplementaryInformation. Geoelectric strike directions were computed usingtensor decomposition18 and were found to be generally parallel tomajor surface geological features. The relatively two-dimensional(2D) nature of themagnetotelluric data permitted the application of2D inversion19 to generate electrical resistivity/conductivity modelsfor each profile (Fig. 2a). In each model the upper crust has ahigh electrical resistivity (low conductivity), which is typical ofdry crustal rocks. The most conspicuous feature in the modelsis a layer of elevated conductivity in the mid-crust, beginning atan average depth of 25 km. The conductivity of the layer varieshorizontally, and there are two regions with very high conductivity.Beneath this conductive layer, the lithosphere seems to have alower conductivity, although magnetotelluric data cannot reliablylocate the base of such a conductive layer. Near-surface zones oflow resistivity are coincident with major strike-slip faults20 and
Figure 1 | Map showing surface relief of the eastern Tibetan plateau and the adjacent area. a, The red dots denote magnetotelluric stations and theshaded rectangles are regions of the magnetotelluric profiles with high crustal conductance (>10,000 S). P1–P4 denote the magnetotelluric profilesEHS3D-3, EHS3D-2, CZMT-WE and EHS3D-1, respectively. The light blue dot shows the epicentre of the 2008 Wenchuan M= 7.9 earthquake and theblack dots show major aftershocks. BNS= Bangong–Nujiang suture; EHS= eastern Himalayan syntaxis; EKF= east Kunlun fault;LMF= Longmenshan fault; LSB= Lhasa block; MFT=main frontal thrust; NJF=Nujiang fault; QTT=QiangTang terrane; RRF=Red River fault;SB= Sichuan basin; SYRB= Sichuan–Yunnan rhombic block; XJF=Xiaojiang fault; XSF=Xianshuihe fault; YZS=Yarlung–Zangbo suture; A and B denotethe two zones with the highest conductance. The white arrows connect the regions of highest conductance and inferred location of flow channels.b, Regional setting. The black arrows define the pattern of lower crustal flow proposed to explain the topographic slope8.
regions with geothermal phenomena21. Zones of elevated mid-crustal conductivity have previously been reported in Tibet andother active orogens, and have been attributed to the presence ofeither aqueous fluids or partial melts22–24. The presence of fluidsis significant because it weakens the crust and may define regionswhere crustal flow could occur13. The new magnetotelluric data setin eastern Tibet has a large spatial extent, and the distribution ofthe high-conductivity layer provides information to understand thespatial distribution of deformation in eastern Tibet8,9.
Magnetotelluric data are primarily sensitive to the depth-integrated conductivity of a layer (conductance), and not to the
individual values of conductivity and thickness. Therefore, the dataanalysis was focused on the spatial variations in the conductanceof the conductive mid-crustal layer. The conductance of this layerwas computed using a constrained 2D inversion in which thelithosphere below a specified depth was forced to have a lowconductivity. A range of depths was chosen and the final layerconductance was found to be insensitive to the choice of value inthe range 50–100 km. Note that Fig. 2a shows the unconstrainedinversions. The conductance of the layer in the final model wascomputed, with shallow features excluded from the integration. Theconductance values shown in Fig. 2b are 1–2 orders of magnitude
Figure 2 | Electrical resistivity cross-sections for eastern Tibet. a, Resistivity models for the magnetotelluric profiles shown in Fig. 1. b, The solid lineshows the conductance of the model constrained to be resistive below 60 km depth. Similar conductance values were obtained when the inversion wasunconstrained. For abbreviations see Fig. 1. The dashed line shows a conductance of 10,000 S.
higher than those found in regions of stable continental crust(200–500 S) and locally exceed 20,000 S. Figure 2 shows two zonesof high conductance that can be correlated between the EHS3Dprofiles. Thewestern conductive zone (A) is located close to the EHSand the eastern conductive zone (B) follows the surface trace of theXianshuihe and Xiaojiang faults.
To use these models to constrain the pattern of deformation ineastern Tibet, it is first necessary to compute the quantity of fluidsrequired to produce the observed crustal conductance. Elevatedcrustal conductivities can be due to thermal effects, aqueousfluids, partial melt, mineralization or graphite22. The large spatialextent of A and B probably excludes metallic mineralization asan explanation. The dominant effect of increasing temperature
occurs when melting causes a significant increase in conductivity.The preferred explanation for the high conductivity in a regionof active tectonics is some combination of aqueous fluids and/orpartialmelt5,22. The conductance can be used to estimate the volumeof fluid/melt that is present in the crust. Laboratory experimentsshow that pure melts have an electrical conductivity in the range3–10 Sm−1 (resistivity 0.1–0.3�m), whereas aqueous fluids haveslightly higher conductivity values25. The geometric distributionof the fluid within the pore space of the rock controls the bulkconductivity, and laboratory studies indicate that a high degree ofinterconnection may occur in partial melts and aqueous fluids26.The values of fluid content (porosity) and layer thickness requiredto produce a given conductance can be computed (Fig. 3). Note
Figure 3 | Variation of thickness and fluid content (porosity) for a crustallayer with a conductance of 10,000 S. The three curves used values ofresistivity for a fluid phase of 0.05, 0.1 and 0.2 � m. The fluid is assumed tobe relatively well interconnected and the bulk resistivity is estimated withArchie’s Law.
that, as the layer thickness increases, the fluid fraction required togive a particular conductance decreases.
The conductance values can be used to give quantitativeestimates of fluid content along each EHS3D profile. This requiresan extra constraint to overcome the inherent trade-off betweenthickness and fluid content. If it is assumed that the conductorhas a thickness of 20 km, on the basis of the thickness of seismiclow-velocity zones10,11, then the required fluid content can becomputed (Fig. 4). In zones A and B a fluid content of 5–20% isrequired to account for the observed conductivity. A fluid contentgreater than 5% is sufficient to produce a factor of 10 strengthreduction compared with the surrounding material with the samecomposition13. Geodynamic modelling indicates that this strengthcontrast is sufficient for crustal flow to occur4. Analysis of themechanical and electrical properties of a fluid-rich layer has shownthat flow velocities increase with conductance, and conductancevalues greater than 7,000–10,000 S correspond to average flow ratesof 1 cm yr−1 (ref. 27). The fluids could be derived from progrademetamorphism in a thickened crust or from underplating. Thespatial extent of A and B supports the idea that they are channelsof flow, because their boundaries avoid stable regions, such asthe Sichuan basin, predicted to be barriers to crustal flow8,9. Forexample, the northern extent of the low-resistivity zone B coincideswith the East Kunlun fault (P2 in Fig. 2), and its eastern limit onP3 coincides with the Xianshuihe fault and the western edge ofthe Sichuan basin. Although not well sampled, it seems that theconductor terminates at the southwest end of line P2, near theYarlung–Zangbo suture.
The fact that the high conductivity is localized in two channels(A and B) indicates a more complex pattern of deformation thanthe crustal flow previously suggested8. The properties of A and B,described in the previous section, are consistent with flow occurringin these channels. In contrast, the relatively high resistivity ofthe mid-crust between A and B does not require an elevatedfluid content, and the arguments presented above suggest a weakmid-crustal layer is absent. Seismic measurements show that thecrust and upper mantle are mechanically coupled and deformcoherently15. Together these arguments suggest that zones A andB could also act as shear zones that permit the relative motion oflithospheric blocks. Laboratory studies have shown that shearingof mid and lower crustal rocks will form and maintain a networkof aligned, interconnected fluid-filled cracks28. This change in fluiddistribution will also enhance the conductivity of these regions.Further evidence for A and B being shear zones comes from theobservation that on profiles P2 and P4, the conductors are locatedwhere the horizontal surface velocity changesmost rapidly.
Distance (km)
Distance (km)Profile P4
Flui
d co
nten
t (%
) Profile P1
South North
Flui
d co
nten
t (%
)
0.2 Ω m
0.1 Ω m
0.05 Ω m
0.05 Ω m
0.1 Ω m
0.2 Ω m EastWest
0
10
20
30
0
10
20
30
0 100 200 300 400 500 600
0 100 200 300 400 500 600
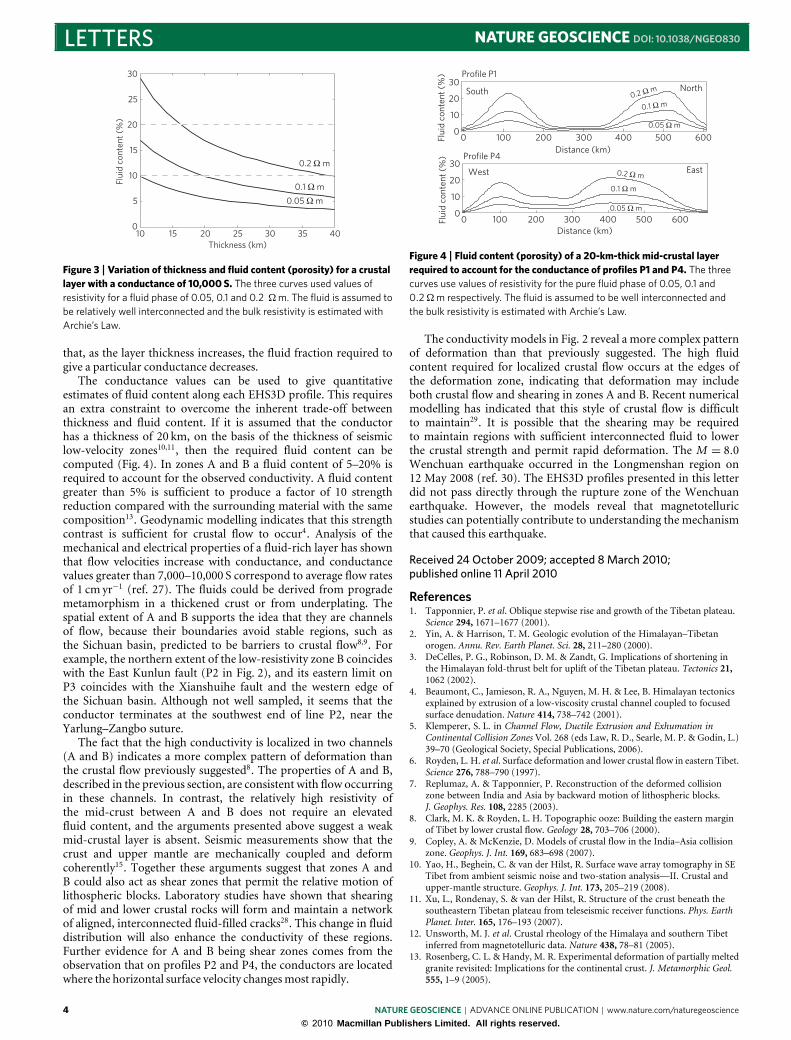
Figure 4 | Fluid content (porosity) of a 20-km-thick mid-crustal layerrequired to account for the conductance of profiles P1 and P4. The threecurves use values of resistivity for the pure fluid phase of 0.05, 0.1 and0.2 � m respectively. The fluid is assumed to be well interconnected andthe bulk resistivity is estimated with Archie’s Law.
The conductivity models in Fig. 2 reveal a more complex patternof deformation than that previously suggested. The high fluidcontent required for localized crustal flow occurs at the edges ofthe deformation zone, indicating that deformation may includeboth crustal flow and shearing in zones A and B. Recent numericalmodelling has indicated that this style of crustal flow is difficultto maintain29. It is possible that the shearing may be requiredto maintain regions with sufficient interconnected fluid to lowerthe crustal strength and permit rapid deformation. The M = 8.0Wenchuan earthquake occurred in the Longmenshan region on12 May 2008 (ref. 30). The EHS3D profiles presented in this letterdid not pass directly through the rupture zone of the Wenchuanearthquake. However, the models reveal that magnetotelluricstudies can potentially contribute to understanding the mechanismthat caused this earthquake.
Received 24 October 2009; accepted 8 March 2010;published online 11 April 2010
References1. Tapponnier, P. et al. Oblique stepwise rise and growth of the Tibetan plateau.
Science 294, 1671–1677 (2001).2. Yin, A. & Harrison, T. M. Geologic evolution of the Himalayan–Tibetan
orogen. Annu. Rev. Earth Planet. Sci. 28, 211–280 (2000).3. DeCelles, P. G., Robinson, D. M. & Zandt, G. Implications of shortening in
the Himalayan fold-thrust belt for uplift of the Tibetan plateau. Tectonics 21,1062 (2002).
4. Beaumont, C., Jamieson, R. A., Nguyen, M. H. & Lee, B. Himalayan tectonicsexplained by extrusion of a low-viscosity crustal channel coupled to focusedsurface denudation. Nature 414, 738–742 (2001).
5. Klemperer, S. L. in Channel Flow, Ductile Extrusion and Exhumation inContinental Collision Zones Vol. 268 (eds Law, R. D., Searle, M. P. & Godin, L.)39–70 (Geological Society, Special Publications, 2006).
6. Royden, L. H. et al. Surface deformation and lower crustal flow in eastern Tibet.Science 276, 788–790 (1997).
7. Replumaz, A. & Tapponnier, P. Reconstruction of the deformed collisionzone between India and Asia by backward motion of lithospheric blocks.J. Geophys. Res. 108, 2285 (2003).
8. Clark, M. K. & Royden, L. H. Topographic ooze: Building the eastern marginof Tibet by lower crustal flow. Geology 28, 703–706 (2000).
9. Copley, A. & McKenzie, D. Models of crustal flow in the India–Asia collisionzone. Geophys. J. Int. 169, 683–698 (2007).
10. Yao, H., Beghein, C. & van der Hilst, R. Surface wave array tomography in SETibet from ambient seismic noise and two-station analysis—II. Crustal andupper-mantle structure. Geophys. J. Int. 173, 205–219 (2008).
11. Xu, L., Rondenay, S. & van der Hilst, R. Structure of the crust beneath thesoutheastern Tibetan plateau from teleseismic receiver functions. Phys. EarthPlanet. Inter. 165, 176–193 (2007).
12. Unsworth, M. J. et al. Crustal rheology of the Himalaya and southern Tibetinferred from magnetotelluric data. Nature 438, 78–81 (2005).
13. Rosenberg, C. L. & Handy, M. R. Experimental deformation of partially meltedgranite revisited: Implications for the continental crust. J. Metamorphic Geol.555, 1–9 (2005).
NATURE GEOSCIENCE DOI: 10.1038/NGEO830 LETTERS14. Zhang, P. et al. Continuous deformation of the Tibetan plateau from global
positioning system data. Geology 32, 809–812 (2004).15. Sol, S. et al. Geodynamics of the southeastern Tibetan plateau from seismic
anisotropy and geodesy. Geology 35, 563–566 (2007).16. Unsworth, M. J. et al. Crustal and upper mantle structure of northern Tibet
imaged with magnetotelluric data. J. Geophys. Res. 109, B02403 (2004).17. Sun, J., Jin, G., Bai, D. & Wang, L. Sounding of electrical structure of the crust
and upper mantle along the eastern border of Qinghai–Tibet plateau and itstectonic significance. Sci. China 46, 243–253 (2003).
18. McNeice, G. M. & Jones, A. G. Multisite, multifrequency tensor decompositionof magnetotelluric data. Geophysics 66, 158–173 (2001).
19. Rodi, W. & Mackie, R. L. Nonlinear conjugate gradients algorithm for 2Dmagnetotelluric inversion. Geophysics 66, 174–187 (2001).
20. Leloup, P. H. et al. New constraints on the structure, thermochronology andtime of the Ailao Shan–Red River shear zone, Southeast Asia. J. Geophys. Res.106, 6683–6732 (2001).
21. Hochstein, M. P. & Regenauer-Lieb, K. Heat generation associated withcollision of two plates: The Himalayan geothermal belt. J. Volcanol.Geotherm. Res. 83, 75–92 (1998).
22. Li, S. et al. Partial melt or aqueous fluid in the mid-crust of southern Tibet?Constraints from INDEPTH magnetotelluric data. Geophys. J. Int. 153,289–304 (2003).
23. Brasse, H. et al. The Bolivian Altiplano conductivity anomaly. J. Geophys. Res.107, 2096 (2002).
24. Türkoğlu, E., Unsworth, M. J., Çağlar, l̇., Tuncer, V. & Avşar, Ü. Lithosphericstructure of the Arabia–Eurasia collision zone in eastern Anatolia frommagnetotelluric exploration: Evidence for widespread weakening by fluids.Geology 36, 619–622 (2008).
25. Nesbitt, B. Electrical resistivities of crustal fluids. J. Geophys. Res. 98,4301–4310 (1993).
26. tenGrotenhuis, S. M., Drury,M. R., Spiers, C. J. & Peach, C. J.Melt distributionin olivine rocks based on electrical conductivity measurements. J. Geophys. Res.110, B12201 (2005).
27. Rippe, D. & Unsworth, M. J. Quantifying crustal flow in Tibet withmagnetotelluric data. Phys. Earth Planet. Inter. 179, 107–121 (2010).
28. Tullis, J., Yund, R. & Farver, J. Deformation enhanced fluid distributionin feldspar aggregates and implications for ductile shear zones. Geology 24,63–66 (1996).
29. Teyssier, C., Whitney, D. L & Rey, P. F. The rheologic implications of partialmelting in Continental plateaux. Eos. Trans. AGU (Fall Meeting Suppl.)90, abstr. T32C-07 (2009).
30. Burchfiel, B. C. et al. A geological and geophysical context for the Wenchuanearthquake of 12 May 2008, Sichuan, People’s Republic of China. GSA Today18, 4–11 (2008).
AcknowledgementsThe authors thank Z. J. Ma, Q. D. Deng, Y. P. Wang and D. L. Zhong for theirencouragement and valuable discussions. Project EHS3D is sponsored by the ChinaNational Science Foundation grants, No. 40634025, 40374034. Reviews by M. Leech,R. Law and P. Wannamaker significantly improved this manuscript and are greatlyappreciated. We thank G. McNeice and A. G. Jones for the use of theirdecomposition software.
Author contributionsD.B. designed the project, collected and interpreted data and wrote the paper. M.J.U.processed and interpreted data and wrote the paper. M.A.M. designed the project,interpreted data and wrote the paper. X.M. and Y.S. designed the project and processeddata. J.T., X.K., J.S. and C.J. designed the project and interpreted data. L.W. and C.Z.designed the project and collected data. P.X. and M.L. collected the data.
Additional informationThe authors declare no competing financial interests. Supplementary informationaccompanies this paper on www.nature.com/naturegeoscience. Reprints and permissionsinformation is available online at http://npg.nature.com/reprintsandpermissions.Correspondence and requests for materials should be addressed to D.B.