j ourna l homepage: www.e lsev ie r .com/ locate /gr
Crustal shear-wave velocity structure of northeastern Tibet revealed byambient seismic noise and receiver functions
Zhenbo Wu a,b, Tao Xu a,c,⁎, José Badal d, Huajian Yao e,f, Chenglong Wu a,b, Jiwen Teng a
a State Key Laboratory of the Lithosphere Evolution, Institute of Geology and Geophysics, Chinese Academy of Sciences, Beijing 100029, Chinab University of Chinese Academy of Sciences, Beijing 100049, Chinac CAS Center for Excellence in Tibetan Plateau Earth Sciences, Beijing 100101, Chinad Physics of the Earth, Sciences B, University of Zaragoza, Pedro Cerbuna 12, 50009 Zaragoza, Spaine Laboratory of Seismology and Physics of Earth's Interior, School of Earth and Space Sciences, University of Science and Technology of China, Hefei 230026, Chinaf National Geophysical Observatory at Mengcheng, Anhui, China
⁎ Corresponding author at: State Key Laboratory of theof Geology and Geophysics, Chinese Academy of Sciences
The Tibetan plateau is formed by the persistent convergence between the Indian and Eurasian plates. Thenortheastern Tibetan plateau is undergoing young deformation that has beennoticed for a long time.We conducta passive-source seismic profile with 22 stations in NE Tibet in order to investigate the crustal shear-wavevelocity structure and its relationship with tectonic processes. In this paper we obtain the Rayleigh-wavephase velocity dispersion data among all station pairs within the period bandwidth of 5–20 s from the methodof ambient noise cross-correlations. Phase velocity variations correlate well with surface geological boundariesand tectonic features, for instance, low phase velocity beneath the Songpan–Ganzi block and the Guide basin.Wealso compute P-wave receiver functions based on the selected teleseismic eventswith similar ray parameters,and perform the joint inversion of surface wave dispersion data and receiver functions to obtain the 2-D crustalshear-wave velocity structure along the profile. The inversion results show that low shear-wave velocitiesbeneath the Songpan–Ganzi block are widespread in the middle-to-lower crust. In together with high crustalVp/Vs ratios and high temperature suggested by the P-wave velocities obtained from the active-source seismicstudy, we suggest that the low velocity zone beneath the Songpan–Ganzi block is probably attributed to partialmelting. Across the North Kunlun fault, there is no crustal LVZ found beneath the Kunlun block. This structuraldifference may have already existed before the collision of the two blocks, or due to limit of the northwardextension for the crustal LVZ across the North Kunlun fault.
Uplift of the Tibetan plateau is the most spectacular tectonic eventduring the Cenozoic created by the collision of India and Eurasia.Fundamental questions persist concerning the initiation of the conver-gence (e.g., Molnar and Tapponnier, 1975; Rowley, 1996; Aitchisonet al., 2011; Sun et al., 2012; Zhang et al., 2012; Hu et al., 2015) andthe mechanism of lithospheric deformation (e.g., Tapponnier andMolnar 1976; England and Houseman, 1989; Royden et al., 1997;Replumaz et al., 2014; Chen et al., 2015). Many models have been pro-posed to explain its dynamic responses to collision and its consequentdeformation patterns. To this respect, three models have receivedwide attention, that is, the rigid block extrusion (Tapponnier andMolnar 1976; Tapponnier et al., 1982), the thin-viscous-sheet model
Lithosphere Evolution, Institute, Beijing 100029, China.
na Research. Published by Elsevier B.
(England and Houseman, 1986, 1989), and the crustal channel flowmodel (Royden et al., 1997).
The northeastern (NE) Tibetan plateau, viewed as a young out-growth of its evolution and deformation (Meyer et al., 1998), has beena focus of many studies (e.g., Galvé et al., 2002; Vergne et al., 2002;Clark et al., 2010; Duvall and Clark, 2010; Karplus et al., 2013; Tianand Zhang, 2013; Xia et al., 2011; Deng et al., 2015). Deformationmech-anisms that work here at present may resemble what happened in thecentral plateau and participated in the formation of the Tibetan plateau.This is one of the motivations for this study, which will help us under-stand the earlier deformation of central Tibet. On the other hand,some studies in the southeastern (SE) Tibetan plateau have found thatlow shear-wave velocities exist in the middle-to-lower crust (Yaoet al., 2008, 2010; Liu et al., 2014). We are concerned about whetherthis phenomenon also exists in the NE Tibetan plateau. It will be veryhelpful to understand how the eastward expansion of the Tibetanplateau material is bifurcated by the rigid Sichuan Basin on thebasis of comparing deformation patterns in the NE and SE Tibetanplateaus. Many works have been done from different perspectives
401Z. Wu et al. / Gondwana Research 41 (2017) 400–410
to discuss this issue. There may exist a mechanically weak lowercrust that accounts for crustal channel flow in the surrounding re-gions of the Sichuan Basin (Clark and Royden, 2000). Resistivitymodels obtained from magnetotelluric data show evidences for pene-tration of partial melting crust across the Kunlun Fault into northernTibet (Pape et al., 2012).
Galvé et al. (2002) collect the wide-angle reflection–refraction databy active-source seismic survey. The obtained P- and S-wave velocitiessupport predominant felsic composition for the crust and suggest thatonly the upper crust has been thickened to the north of the Kunlunfault; to the south of this fault the thicker crust is composed by twolayers, which could be the superposition of the originally thin crust ofthe Bayar Har Terrane on the lower crust of the domain to the north.However, Liu et al. (2006) suggest that crustal thickening mainlyhappens in the lower crust in the NE Tibetan plateau, based on theDarlag–Lanzhou–Jingbian seismic refraction profile.
Seismic interferometry technique using ambient seismic noise hasrapidly become an important method to investigate the Earth structureat different scales. In fact, surface wave tomography based on the ambi-ent noisemethod has provided essential constraints on crustal structurein theworld (e.g. Shapiro et al., 2005; Yao et al., 2010; Zheng et al., 2011;Badal et al., 2013). Ambient-noise tomography results of northern Tibetbased on INDEPTH-IV data (Yang et al., 2012; Karplus et al., 2013)show that the low velocities are widely distributed in the mid-lowercrust of the Tibetan plateau. However, Poisson's ratio observationsprovided by a series of passive-source seismic surveys revealmore felsiccomposition of the whole crust and suggest that the upper crust isthickened to accommodate the north–south shortening from thecollision of the India–Eurasia plates (Vergne et al., 2002; Jiang et al.,2006; Zhang et al., 2011; Xu et al., 2014).
In this study, we use the continuous ambient noise data as wellas teleseismic P-wave data from a passive-source seismic experiment(a linear array with 22 stations) in the NE Tibetan plateau. We performa joint inversion of short-period Rayleigh wave phase dispersion datafrom ambient noise tomography and P-wave receiver functions toconstruct the 2-D crustal shear-wave velocity structure beneath thearray profile. Finally we discuss the tectonic implications of the crustalstructure obtained in this study.
2. Tectonic setting
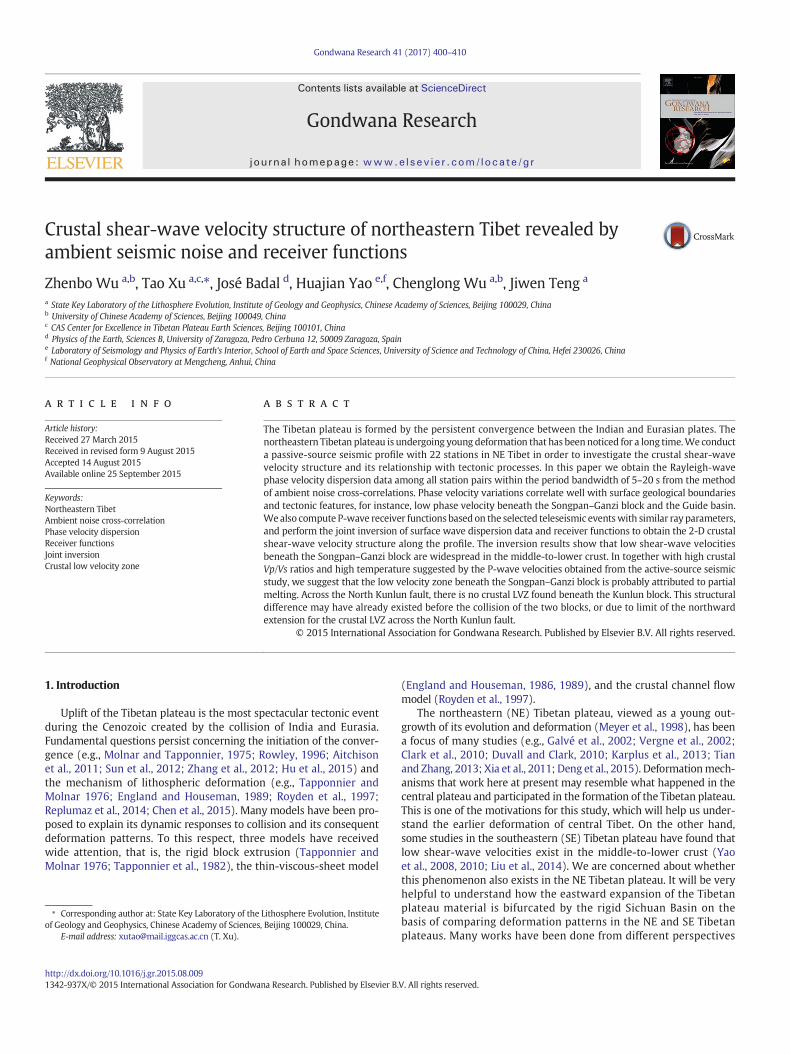
The inset in Fig. 1a denotes the study area in the NE Tibetan plateauand shows the northeast–southwest trending seismograph stationsdeployed between the cities of Xining (to the north) and Moba (to thesouth). The passive-source seismic survey line crosses the Songpan–Ganzi block and Kunlun block, and reaches the southern edge of theQilian block from south to north. Regional tectonic characteristicsare quite complicated, including several intracontinental sutures,strike-slip faults, thrust faults and Cenozoic basins (Fig. 1b). Herewe briefly introduce them in the following content.
2.1. Songpan–Ganzi Block
The easternmost part of Songpan–Ganzi block is a roughlytriangular-shaped tectonic unit surrounded by the Kunlun block tothe north, the Qiangtang block to the south and the Sichuan Basinto the east (Fig. 1a). It is an ancient remnant ocean basin filled byTriassic turbidite sediments with thickness over 10 km, which is awitness of the evolutive history and deformation undergone in theadjacent blocks such as Qiangtang, east Kunlun, North China, westernQingling blocks, and even the Qinling–Tongbai–Hong'an–Dabie forma-tion located several hundred kilometers to the east (Enkelmann et al.,2007). The closure of the Songpan–Ganzi remanent ocean during theTriassic to Early Jurassic partially sank the Songpan–Ganzi terrane be-neath the Kunlun arc along the Animaqing–Kunlun–Muztagh suture(Burchfiel et al., 1995; Yin and Harrison, 2000). The eastern boundary
of the Songpan–Ganzi Terranemeets thewestern edge of the Late Trias-sic/Early Jurassic Longmenshan thrust belts, which lies along the west-ern edge of the South China (Yangtze) craton (Burchfiel et al., 1995;Zhang et al., 2010). Triassic strata overlies the Paleozoic shallowmarinesequences of South China (Burchfiel et al., 1995), which suggests thata slope–shelf transition overlies a continental basement, at least in theeasternmost part of the Songpan–Ganzi block (Yin and Harrison, 2000).
2.2. Kunlun Block
The Kunlun and Songpan–Ganzi blocks are separated by the Kunlunstrike-slip fault, which probably began left-lateral slipping since ~10Maago (Fu and Awata, 2007; Clark et al., 2010) and partially follows thetrace of the Animaqing–Kunlun–Muztagh suture (Fig. 1b). This faulthas already provoked five Mw N 7.0 earthquakes in the past centuryand more recently the 11/14/2001 Mw 8.1 Hoh Xil earthquake thatresults in a 430-km-long surface rupture. These earthquakes indicatethat the Kunlun fault is still keeping active. GPS measurements alongthe Kunlun fault (Duvall and Clark, 2010) support that the deformationfrom the continental collision dissipates northward rather thaneastward in the NE Tibetan plateau. The similar conclusion hasbeen made based on shear-wave splitting parameters obtainedfrom the previous work (see Fig. 7 in Chen et al., 2015).
The Kunlun fault, as a major sinistral strike-slip fault in the NETibetan plateau, plays an important role on the northward growth ofTibet. Many geophysical studies have been conducted to observe howthe lithosphere of microcontinent plates deforms from the relativemotions among different rigid blocks. However, how the blocks havebeen contacted along the Kunlun fault is still under debate, and bothnorthward subduction and southward subduction beneath the plateauhave been suggested (Yin and Harrison, 2000; Tapponnier et al., 2001;Kind et al., 2002; Zhang et al., 2010).
Further north, South Qilian suture separates the Kunlun block fromthe Qilian block (Fig. 1b). Previous tectonic studies indicate that theQilian Shan thrust belt collides with the Qaidam–Kunlun block duringthe Early Paleozoic (Yu et al., 2012). The Kunlun block develops a seriesof intracontinental strike-slip faults and thrust faults, and most of themare younger than 10 Ma (Clark et al., 2010). The study of average sliprates for the Elashan and Riyue Shan faults, two north-northwest-trending dextral strike-slip faults, west and east of the Qinghai Lake,clearly shows the tectonic deformation in the northeastern marginof the Tibetan plateau since ca. 8–12 Ma (Yuan et al., 2011). Theintramontane basins such as the Gonghe–Guide basin and the Xiningbasin are strongly controlled by these regional faults. The Gonghe–Guide basin is a typical intramontane sedimentary basin similar to thelarger Qaidam basin to the west. The course of the Yellow River andits tributaries has exposed a rather complete Neogene sequence (Fanget al., 2005). Further north the Xining subbasin of the Langzhou basinhas the largest and continuous Cenozoic sedimentary layer (Dai et al.,2006). Usually, these Cenozoic basins at the northeastern margin ofthe Tibetan plateau preserve the important stratigraphic records thatprovide the evidence of the deformation and evolution of this area.
3. Data acquisition
With the purpose on probing the response of the India–Eurasia tec-tonic collision in the NE Tibetan plateau, we conduct a passive-sourceseismic experiment between Xining andMoba (Fig. 1a) fromNovember2010 to June 2011, using 22 seismograph stations with Reftek-72A dataloggers and Guralp CMG3-ESP sensors with bandwidths 0.02–30 sor 60 s. The station spacing is about 10 to 15 km (Fig. 1b). StationsS00–S01 are installed in the Qilian block, S02–S16 in the Kunlunblock and S17–S27 in the Songpan–Ganzi block. Three-componentground movements are recorded with 40s sample-per-second (sps) ateach station.
80˚
80˚
85˚
85˚
90˚
90˚
95˚
95˚
100˚
100˚
105˚
105˚
25˚ 25˚
30˚ 30˚
35˚ 35˚
40˚ 40˚
Lhasa Block
Qiangtang Block
Songpan-Ganzi
Qaidam
Tarim
India
Sichuan Basin
North China Block
Qilian Block
Xining
Himalaya BlockMBT MCT
YZS
BNS
JRS
NKFSKF
ATF
Moba
(a)
99˚
99˚
100˚
100˚
101˚
101˚
102˚
102˚
103˚
103˚
33˚ 33˚
34˚ 34˚
35˚ 35˚
36˚ 36˚
37˚ 37˚
Maqin
Xining
AKMSNorth Kunlun F.
Laji ShanGonghe Basin
Qinghai LakeH
aiyan F.
Qinghai Nan Shan
Elashan F. R
iyue Shan F.
SQS
Guide
Yellow riv
er
Songpan-Ganz lock
Kunlun Block
Qilian Block
Moba
Gonghe
Nan Shan
Mado-G
ande F.
Animaqing F.
(b)
i B
Fig. 1. (a) Tectonicmapof the Tibetan plateau and surrounding areas. The red box shows the study region in northeastern Tibet and the seismic array deployed between the cities of Xining(to the north) and Moba (to the south). (b) Zoom-in view of the study area and location of the passive-source seismic survey line. Red triangles denote the seismic broad-band stationsused in this study. Gray triangles and blue stars denote the seismic receivers and shots fired in the active-source seismic experiment (Zhang et al., 2011). Green crosses denote the piercingpoints at the depth 60 km of the calculated receiver functions. Acronyms for sutures and faults: YZS, Indus–Zangbo suture; BNS, Bangong–Nujiang suture; JRS, Jinsha suture; AKMS,Animaqing–Kunlun–Muztagh suture; SQS, South Qilian suture; SKF, South Kunlun fault; NKF, North Kunlun fault; ATF, Altyn–Tagh fault; MCT, main central thrust; MBT, main boundarythrust.
402 Z. Wu et al. / Gondwana Research 41 (2017) 400–410
In order to avoid any ambiguity arising from propagation effectscaused by different ray paths and unequal anisotropic properties fromdifferent azimuths, we select teleseismic events located in theWest Pa-cific subduction zone near Japan to compute the receiver functions,these events have similar back azimuths and ray parameters (Fig. 2).
4. Method
Deep structure along this seismic survey linehas been studied in twoways: the wide-angle reflection–refraction (Zhang et al., 2011) and thereceiver function imaging (Xu et al., 2014). However, the steeplyincident body waves used in the wide-angle reflection–refraction areless sensitive to the shallow heterogeneity than dispersion curves of
short-period surface waves, and usually it is hard to obtain the highresolution shear-wave velocity structure mainly due to the low signal-to-noise ratio (SNR) of shear-wave data. Receiver function is good atdetecting interfaces with a large velocity contrast, but it is less sensitiveto the absolute value of wave speed. We combine dispersion curves ofshort-period surface waves from ambient noise cross-correlation andteleseismic P-wave receiver functions together to obtain the highresolution shear-wave velocity structure in the crust.
4.1. Surface wave empirical Green's functions
Based on an assumption of randomly distributed ambient noisesources, monthly or longer continuous data can be cross-correlated to
152 days
-200 -150 -100 -50 0 50 100 150 200
152 days
time (s)
(a)
(b)
Fig. 3. (a)–(b)Daily cross-correlation functionswithin the period band10–20 s after beingstacked for a total of 152 days between the stations S06 and S17. The difference is that theformer (a) is computed without spectral whitening, while the latter (b) is the result withspectral whitening. SNR increases markedly in the latter case.
403Z. Wu et al. / Gondwana Research 41 (2017) 400–410
compute the surface wave empirical Green's functions (EGFs) with suf-ficient SNR for dispersion analysis and to produce reliable tomographicimages (Shapiro et al., 2005; Yao et al., 2006; Bensen et al., 2007).
A series of preprocessing steps should be applied to the waveformdata to improve the SNR of the EGFs. Commonly, the ambient seismicdata preprocessing consists of band-pass filtering, in our case usingthe bandwidth 0.2–50 s, cutting the continuous data to one day length,de-trending the zero line slope, removing instrument response, andre-sampling the data to improve the computational efficiency, and inour case from 40 sps to 10 sps, normalization in time domain andspectral whitening in frequency domain (Bensen et al., 2007; Badalet al., 2013). Cross-correlations of ambient seismic noise would beseriously contaminated by the local or teleseismic events without thenormalization in the time domain. On the other hand, since the ampli-tude spectrum of ambient seismic noise is normally not flat in thefrequency domain, we use a spectral whitening technique to smooththe amplitude spectrum. This operation can produce comparable ampli-tudes for the concerned frequency band and mute the influence fromthe persistent monochromatic seismic sources (Villaseñor et al., 2007;Zheng et al., 2011).
Cross-correlations of vertical-component ambient seismic noise arecalculated for each available station pair of the 22 stations using thedaily time series, and the cross-correlations consist of positive and neg-ative lags with apparent Rayleighwave signals. Fig. 3 shows the stackedcross-correlation functions (CFs) in the frequency band 10–20 s extract-ed from ambient noise cross-correlations with a total of 152-day recordbetween the stations S06 and S17. The difference between Fig. 3(a) and(b) is that the result plotted in (a) is computedwithout spectralwhiten-ing in frequency domain but for (b) with spectral whitening. The latterone has a markedly increased SNR as expected. A common phenome-non is that the causal and acausal parts of the CFs are asymmetric inamplitude but nearly symmetric in travel time (Fig. 3a–b). This is prob-ably due to inhomogeneous distribution of ambient noise sources andthe attenuation that mainly affects the signal amplitude (Stehly et al.,2006). Zheng et al. (2011) point out that most EGFs between stationsin north China are disturbed by a persistent localized microseismicsource on the Kyushu Island. In our study, the EGFs extracted from
10
20
30
Fig. 2. Global map showing the selected earthquakes (green circles) for calculatingreceiver functions, which are located roughly in the same area and have similar epicentraldistances (around 35°), back azimuths and ray parameters. The red triangle indicates theapproximate location of the seismic array.
the time-derivative of CFs emerge clear surface wave signals withoutthe existence of undesired signals in the time window shown as Fig. 4.So we think the asymmetric amplitudes are mainly caused by the inho-mogeneous distribution of noise sources. To obtain the reliabledispersion measurement, the positive and negative EGF signals areaveraged to create symmetric components (Bensen et al., 2007;Yang et al., 2007).
There are a total of 231 EGFs obtained from all possible station pairs.Fig. 4a shows the stacked EGFswithin the period band 10–20 s betweenthe station S00 and all other stations during the recording period. Fig. 4bshows the daily EGFs corresponding to the station pair S02–S11, and thestacked trace is showed as the heavy solid line on the top. Aswe can see,the recovered surface wave signal is quite stable.
4.2. Phase velocity dispersion mapping
We measure the phase velocity dispersion curves from the EGFsbased on a far-field approximation and an image transformationtechnique (Yao et al., 2006). There are two constraints to be satisfied:one is that the distance between station pair has to be at least threewavelengths of the surface wave signal in order to satisfy thefar-field approximation; the other is that the SNR has to be greaterthan 5 to ensure the reliability of phase velocity measurements.Here SNR is defined as the ratio of the maximum amplitude of thesignal window and the mean envelope amplitude of the 150 s longnoise window right after the signal window around the central period.As an example, the EGF extracted from the data at two stations (Fig. 5a)is shown in Fig. 5b, the SNR value is shown in Fig. 5c. Fig. 5d shows thevelocity-period image and the red circles represent themeasured phasevelocities within the period band 5–20 s.
In order to ensure the reliability of themeasurements, we repeat theabove process for different monthly data of each station pair. The dis-persion curves with significant discrepancies from most of the resultsare discarded.Wemeasure the Rayleigh-wave phase velocity dispersioncurves for all possible station pairs and finally obtain 89 dispersioncurves at periods from 5 to 20 s. These curves are plotted together inFig. 5e. Both the average phase velocity dispersion curve and itsstandard deviation at different periods are shown in Fig. 5f.
Weuse the continuous regionalization and the generalized inversionscheme to invert path-averaged phase velocities at each period for 2-Dphase velocity distribution (Tarantola and Valette, 1982; Montagner,1986; Yao et al., 2010). We set a proper 2D inversion region containingour survey line and the grid interval used for inversion is 0.5° × 0.5°. Yaoet al. (2010) introduce the details about this scheme that includeinversion for both isotropic phase velocities and azimuthal anisotropy.Here, we are only concerned of the isotropic phase velocity variation.For each period, we first obtain period-dependent 2D phase velocityvariations. Then we interpolate the phase velocity maps of differentperiods to the station locations along the survey line. The short-periodphase velocities are very sensitive to the shallow geological features.
0
20
40
60
80
100
120
140
160
-200 -150 -100 -50 0 50 100 150 200time (s)
day
(b)100
150
200
250
300
350
400
dist
ance
(km
)
-200 -150 -100 -50 0 50 100 150 200time (s)
(a)
Fig. 4. (a) Symmetric EGFs extracted from the daily cross-correlations of the vertical component data recorded at the station S00 with the other stations, stacked within the periodband 10–20 s and sorted from top to bottom by the interstation distance. (b) Daily EGFs for a single station pair S02–S11. The stacked trace for all daily EGFs is shown as the heavysolid line on top.
period (s)
Ph
ase
Ve
locity (
km
/s)
5 10 15 20
2.5
3.5
4.5
4.0
3.0
2.0
(dd)
S27
S17
S08
S00
99˚
99˚
100˚
100˚
101˚
101˚
102˚
102˚
103˚
103˚
33˚ 33˚
34˚ 34˚
35˚ 35˚
36˚ 36˚
37˚ 37˚
Xining
0
signal
noise
(b)
0 100 200 300 400
-1
1
2
3
100
101
102
SN
R
(c)
5 10 15 20
time (s)
(a)
5 10 15 20
period (s)
No. curves = 89
2.4
2.6
2.8
3.2
3.4
3.6
ph
ase
ve
locity (
km
/s)
3.0
3.8 (e)
5 10 15 20
period (s)
2.4
2.6
2.8
3.2
3.4
3.6
ph
ase
ve
locity (
km
/s)
3.0
3.8 (f)
Fig. 5. (a) Passive-source seismic array deployed in northeastern Tibet (triangles) that is used in this study. (b) EGF for the station pair S06–S27 (red triangles). (c) Signal-to-noise ratio(SNR) versus period for the EGF in (b). (d) Velocity-period diagram and the selected phase velocity dispersion curve (red dotted line) within the phase velocity window 2.0–4.5 km/s atperiods 5–20 s. (e) All 89 phase velocity dispersion curves measured from EGFs. (f) Averaged phase velocity dispersion curve with vertical bars representing the standard deviations atdifferent periods.
404 Z. Wu et al. / Gondwana Research 41 (2017) 400–410
2
4
Mado-Gande F.North Kunlun F.
Animaqing F.Gonghe Nan Shan F.
Riyue Shan F.SQS
S00S01
S02
S03S04S05S06
S07
S08
S09S11S12
S15S16S17S18S19
S21
S23S24S25S27
Elv
(km
)
Kunlun BlockSongpan-Ganzi Block QilianBlock
5
10
15
2033.5
2.8
2.9
3.0
3.1
3.2
3.3
phas
e ve
loci
ty (
km/s
)
34.0 34.5 35.0 35.5 36.0
Per
iod
(s)
Guide B.
Latitude (°)
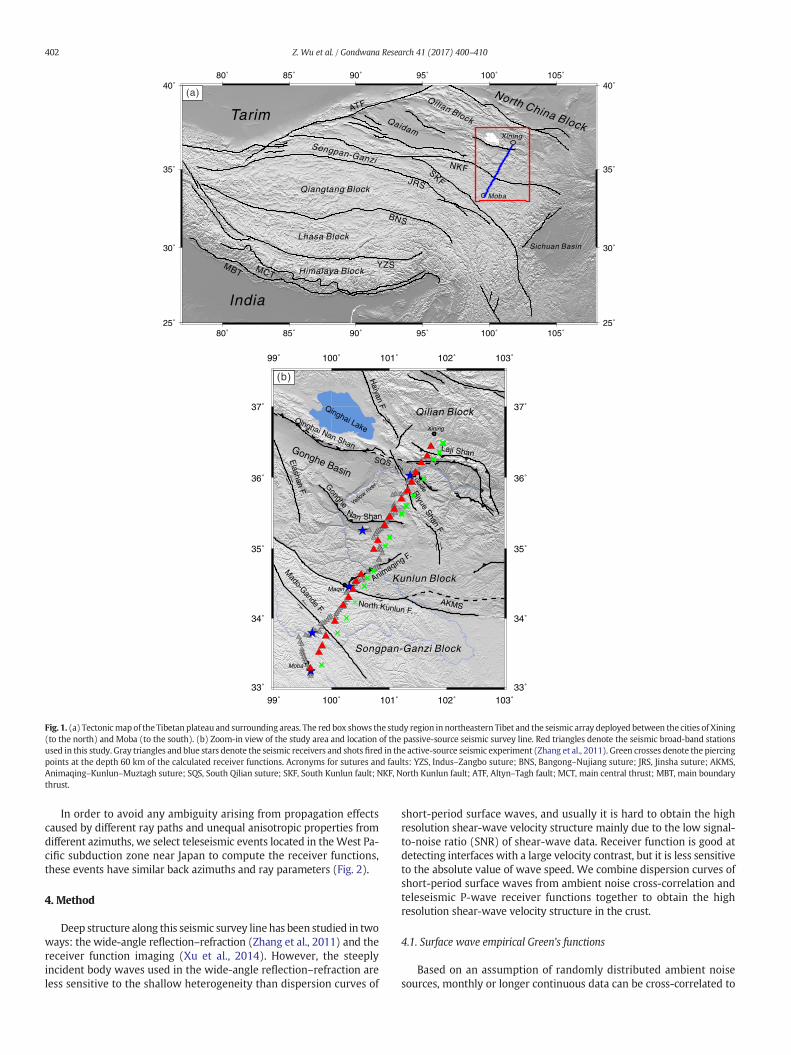
Fig. 6. Rayleigh-wave phase velocities versus periods along the seismic array. On top: surface topography along the survey linewith the elevation decreasing very smoothly from south tonorth, and geographic location of the array stations (red triangles). The faults in Fig. 1b are also indicated here.
405Z. Wu et al. / Gondwana Research 41 (2017) 400–410
As it can be seen in Fig. 6, the spatial distribution of phase velocity alongthe survey line is correlatedwith the surface tectonic features. Phase ve-locities as low as 2.8 km/s at periods of 5–8 s appear in the vicinity of theNorth Kunlun fault, a zone crossed by strike-slip and thrust faults. Thecause of these low velocities is associated with the Triassic turbidite sed-iments in the Songpan–Ganzi block. At greater periods, phase velocitiesclose to 3.0 km/s appear under the southernmost transect of the surveyline and stretch northward up to the North Kunlun fault. In the southernKunlun block, there shows a uniform phase velocity of ~3.1 km/s. Acrossthe Gonghe Nan Shan fault, the phase velocity changes from 3.2 km/s be-tween the GongheNan Shan and Riyue Shan faults to 3.3 km/s northwardof the Qilian block. However, velocities as low as 2.9–3.0 km/s at periodsof 5–8 s appear again in the Guide basin, between the Riyue Shan faultand the South Qilian suture.
4.3. Receiver functions
We compute P-wave receiver functions by iterative deconvolutionof the vertical component from the radial component from these select-ed events in the time domain (Ligorría and Ammon, 1999). As shown inFig. 1bwith green cross symbols, thepiercingpoints at 60 kmdepth (av-erage Moho depth) of these receiver functions parallel the survey line,which indicates that the shear-wave velocity structures constrainedby these receiver functions are capable of representing the shear-wavestructures of the study area. On the other hand, the piercing points ofeach station are almost overlapped, which indicates that the receiverfunctions have similar travel time for the P-to-S converted phases andallow us to stack them by a simple linear scheme. However, if we useall global events to compute the receiver functions, the move-out tech-niquemust be applied before stacking. Themove-out value could be rel-atively large and produce artificial errors when the individual epicentraldistance of the event is far away from the reference epicentral distance.We have totally avoided this disadvantage by only selecting the eventslocated in the same region. In Fig. 7a we show the receiver functionswith the Gaussian coefficient 1.0 for the selected events at the stationS04 and the stacked result is plotted on the top. In Fig. 7b we arrangethese stacked results for all stations along the survey line and sketchthe Moho structure from south to north.
5. Joint inversion of surface wave dispersion and receiver function
5.1. Implementation
Receiver functions dominated by P-to-S converted phases canprovide good constraints for the shear-wave velocity discontinuitiesof the Earth, and surface wave dispersion can provide constraintson the average shear-wave velocities in different depth ranges.Joint inversion of these two data sets can provide much betterconstraints on the crustal shear-wave velocity structure beneathour survey line.
We perform a damped least-squares scheme (Tarantola and Valette,1982) and follow the joint inversion procedure based on the minimiza-tion of an objective function including both surface wave dispersiondata and receiver functions (Julià et al., 2000). The computer programpackage developed by Herrmann and Ammon (2004) is used to obtainthe 1-D shear-wave velocity structure for each station. According tothe least-squares scheme, we shall provide an initial shear velocitymodel as accurate as possible to greatly reduce the non-uniquenessof the inversion results. Here we interpolate a 3D Vsv model of thecrust and uppermost mantle beneath Tibet from ambient noisetomography provided by Yang et al. (2012) as our initial shear wavevelocity model. We calculate the P-wave velocity based on the Vp/Vsratio given by the previous receiver function study (Xu et al., 2014).Then, we determine the density by using the empirical formulaρ= 0.77 + 0.32Vp. The initial model is parameterized by thin layerswith 1 km thickness to get an almost continuous velocity model withdepth to avoid interfaces from sharply changed velocities (Ammon,et al., 1990).
The objective function that we minimize is shown as follows:
s ¼ 1−pð ÞNr
XNr
i¼0
Ori−Pri
σ ri
� �2
þ pNs
XNs
j¼0
Os j−Ps j
σ s j
!2
where,
Ori observed receiver function at time tiPri predicted receiver function at time ti
-5 0 5 10 15time (s)
0
5
10
15
20
25
30
35
40
0.07
5
0.08
0
0.08
5
Ray para.
RF
Num
ber
Stack
S04
(a)
0
2
4
Mado-Gande F.North Kunlun F.
Animaqing F.Gonghe Nan Shan F.
Riyue Shan F.SQS
S00S01
S02
S03S04S05S06
S07S08
S09S11S12
S15S16S17S18S19S21
S23S24S25S27
Elv
(km
)
Kunlun BlockSongpan-Ganzi Terrane QilianBlock
Guide B.
−5
0
5
10
1533.0 33.5 34.0 34.5 35.0 35.5 36.0 36.5 37.0
Latitude (°)
tim
e (s
)
(b)
Fig. 7. (a) Receiver functions calculated at the station S04 basing on the selected teleseismic events. The left panel shows the corresponding ray parameters. (b) Stacked receiver functionswith the Gaussian coefficient 1.0 for all available stations along the survey line from south to north. The signals at ~7–8 s depict the Moho signature.
406 Z. Wu et al. / Gondwana Research 41 (2017) 400–410
σ ri standard error of observation at tiOs j jth observed surface wave phase velocityPs j jth predicted surface wave phase velocityσ si standard error of jth surface wave phase velocityNr total number of receiver function pointsNs total number of surface wave phase velocity pointsp data weighting factor: 0 ≤ p ≤ 1.
The parameter p controls the weight of two data sets in the joint in-version. In practice, considering that the Rayleighwave phase velocitiesat periods from 5 to 20 s aremainly sensitive to the upper-middle crust-al structure, we first set p=0 thus forcing the solution to be exclusivelybased on the receiver functions, and use a damping factor 10 to avoid anovershoot of the firstly determinedmodel. Then, we take both data setsby changing the weight p = 0.2 to allow both of them to participate inthe inversion. The damping factor is also revised to 0.1. In this way,both data sets are fitted simultaneously during the inversion process.Since the periods of phase velocities are too short to constrain themiddle-to-lower crustal structure well, we gradually decrease theweight of each layer from 1.0 to 0.1 as the depth increases from 30 kmto 50 km, and no weight is applied to layers with depths above 50 km.
5.2. Inversion results
The inversion results for the stations S04 and S16 are shown in Fig. 8.The synthetic receiver functions based on the inversion results (redcurves) have really high correlation coefficients of 0.9092 and 0.9522with the observed receiver functions, respectively. The theoreticaldispersion curves (continuous red lines) calculated from the inversion
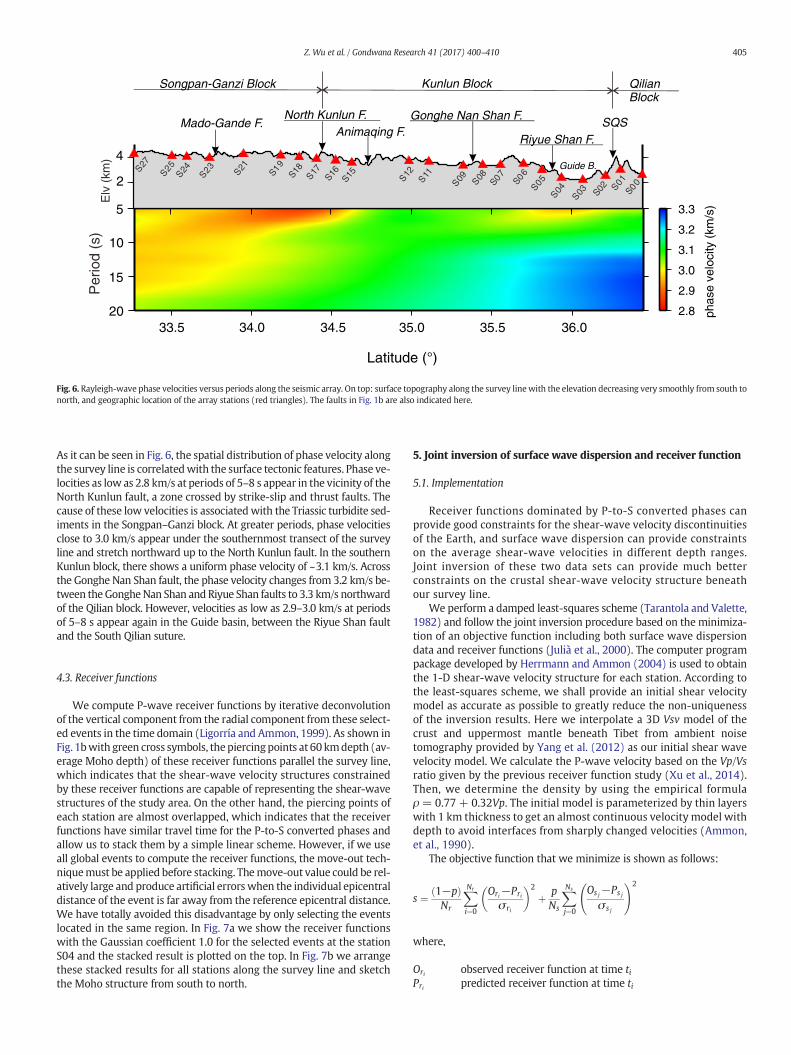
results also fit the observed phase velocities (dotted lines) well.In Fig. 9b, we show the shear-wave velocity image of the crust alongthe survey line. For comparison, the initial shear-wave velocity modelderived from the study of Yang et al. (2012) is also shown in Fig. 9a.In order to check the reliability of the inversion results, we change thelayer thickness of the initialmodel to 2 kmand2.5 km, and the inversionresults shown in Fig. 10 are also very similar.
6. Discussion and conclusion
In view of the inversion result, the variation of the shear-wavevelocities in the upper crust along the survey line is consistent withthe Rayleigh wave phase velocities (Fig. 6). Low phase velocities at5–17 s periods are obtained at the south of the Kunlun fault, and lowshear-wave velocities at depths up to ~20 km are observed correspond-ingly at the same location. This can be attributed to the Middle to LateTriassic Songpan–Ganzi complex, with an estimated stratigraphicthickness of 10 km and reaching 15 km locally (Weislogel, 2008). Atthe north part of the survey line, low shear-wave velocities underliethe intramontane Guide basin, probably due to the Cenozoic fill andscattered Neogene/Quaternary deposits, or the tectonic destruction ofupper crust from the Riyue Shan fault and South Qilan suture to thesurrounding regions. Strike-slip faults mainly develop in the regionsouth of Kunlun fault, such as Mado–Gande fault, and thrust faultsdevelop north of the Kunlun fault, such as Animaqing, Gonghe NanShan, Laji Shan, and Qinghai Nan Shan. Considering lateral variationsof the upper-crustal shear-wave velocity and the surface tectonic fea-tures along the survey line, we suggest that the upper-crustal propertiesbetween Songpan–Ganzi block andKunlun block are probably different:
1 0
3 . 0 3 . 5 4 . 0 4 . 5
2 0
3 1
4 1
5 1
6 1
7 1
8 2
9 2
2 . 5 5 . 0
V s ( k m / s )D
ep
th (
km
)
I n i t i a l
C u r r e n t2 . 8 3
3 . 0 0
3 . 1 7
3 . 3 3
5 6 7 8 9 1 0 2 0
P e r i o d ( s )
0 4 8 12
t i m e ( s )
S 0 4
R a y l e i g h w a v e
1 0
3 . 0 3 . 5 4 . 0 4 . 5
2 0
3 1
4 1
5 1
6 1
7 1
8 2
9 2
2 . 5 5 . 0
V s ( k m / s )
De
pth
(k
m)
I n i t i a l
C u r r e n t
0 4 8 12
t i m e ( s )
S 1 6
R a y l e i g h w a v e
2 . 8 3
3 . 0 0
3 . 1 7
3 . 3 3
5 6 7 8 9 1 0 2 0
P e r i o d ( s )
Fig. 8. 1-D shear-wave velocity inversion results for the stations S04 and S16. For both of them, we show the initial shear-wave velocity model (blue dashed line) and the inversion result(red line) on the left velocity–depth panel. On the right the upper panel shows the observed receiver function (blue curve) and the synthetic result from the inversion model (red curve)with the correlation coefficients 0.9092 and 0.9522, respectively. The lower panel shows the measured Rayleigh-wave phase velocities (black circle) and the synthetic result (red line).
407Z. Wu et al. / Gondwana Research 41 (2017) 400–410
the upper crust in the Songpan–Ganzi block is more ductile, and in theKunlun block shows more brittle feature.
There is an obvious phenomenon in the shear-wave velocity struc-ture, that is, a low velocity zone (LVZ) is found in the middle-to-lowercrust within the depth range about 40–60 km beneath the Songpan–Ganzi block. The mechanism that causes this LVZ is an importantissue. The P-wave velocity model from the active-source seismic study(Zhang et al., 2011) shows that the P-wave velocity gradient agreeswell with the average continental crust in the Songpan–Ganzi block,but the absolute value is lower by 0.5 km/s than the continental average.
Mado-Gande F.North Kunlun F.
Animaqing
S15S16S17S18S19S21
S23S24S25S27
Songpan-Ganzi Block
2
4
Elv
(km
)
0
0
20
40
60
Dep
th (
km)
(a)
80
0
20
40
60
Dep
th (
km)
(b)
8033.5 34.0 34.5
Latitude
Fig. 9. On top: surface topography along the survey line and geographic locations of the broadvelocity model with the layer thickness 1.0 km provided by Yang et al. (2012). (b) Shear-wRayleigh-wave phase velocity dispersion and receiver functions.
There are two possible explanations for this observation providedby Zhang et al. (2011). One is that the crust of the Songpan–Ganziblock ismore felsic thannormal crustal composition; if true, the averagecrustal Vp/Vs ratio should become lower than normal values. The otherreason is related to the crustal temperature beneath the Songpan–Ganziblock, which needs to be 500 °C above the typical continental geother-mal curves (Christensen, 1979). If so, the crustal Vp/Vs ratio shouldbe much higher than 1.73 since the Vs values would be significantlysmaller. The average crustal Vp/Vs in the Songpan–Ganzi block is~1.81 provided by the previous receiver function study (Xu et al.,
F.Gonghe Nan Shan F.
Riyue Shan F.SQS
S00S01
S02
S03S04S05S06
S07S08
S09S11S12
Kunlun Block QilianBlock
Guide B.
2.8
3.0
3.2
3.4
3.6
3.8
4.0
4.2
Vs
(km
/s)
35.0 35.5 36.0
(°)
-band stations (red triangles). The faults in Fig. 1b are added. (a) The initial shear-waveave velocity image of the crust along the study line based on the joint inversion of the
0
20
40
60
Dep
th (
km)
80
0
20
40
60
Dep
th (
km)
8033.5 34.0 34.5 35.0 35.5 36.0
Latitude (°)
33.5 34.0 34.5 35.0 35.5 36.0
Latitude (°)
a
b
a’
b’
2.8 3.0 3.2 3.4 3.6 3.8 4.0 4.2
Vs (km/s)
Fig. 10. Similar as Fig. 9 butwith the layer thickness changed to 2 km (top) and 2.5 km (bottom), respectively. correspond to the initialmodelwith the layer thickness 2 km and the
joint inversion result. correspond to the initial model with the layer thickness 2.5 km and the joint inversion result.
408 Z. Wu et al. / Gondwana Research 41 (2017) 400–410
2014), which is higher than 1.73 at stations S17–S27. All these observa-tions are located in the Songpan–Ganzi block (Fig. 1b). Considering thehigh average crustal Vp/Vs ratio and corresponding high temperature inthe crust here, the LVZ in the middle-to-lower crust beneath theSongpan–Ganzi block probably resulted from partial melting.
Several previous studies performed in the northeastern Tibetanplateau have found the existence of the LVZ, but the distributionareas are still obscure. Unsworth et al. (2004) report the existence ofwidespread fluids at depths 25–50 km in the region 32.5°N–35.5°Nand 92°E–94°E. Later, Karplus et al. (2013) extend this region to32°N–36°N and 92°E–98°E by means of low group velocities found atperiods 34–40 s,which are sensitive to themiddle-to-lower crust veloc-ity at depths of ~30–60 km. Yang et al. (2012) observe lowvelocities in arange of 2.9 to 3.3 km/s at depths 20–40 km in the Songpan–Ganzi blockand suggest that the reason is partial melting. Two recent studies basedon ambient noise surface wave tomography show a prominent LVZ inthe middle crust of the Songpan–Ganzi block at depths 20–40 km(H.Y. Li et al., 2014; X.F. Li et al., 2014). These studies show that theLVZ in the NE Tibetan plateau only exists in the region south of theNorth Kunlun fault, but Jiang et al. (2014) suggest that the LVZ in theNE Tibetan plateau is confined to the region south of the Kunlun faultand west of 98°E, and it penetrates northward into the Qinling orogensto the region north of the Kunlun fault and east of 98°E. In our shear-wave velocity structure, we do not observe LVZ under the Kunlunblock north of Kunlun fault. This difference may reflect intrinsicvariations of two blocks before their collision, or it is because the Kunlunfault limits the northward extension of the LVZ. According to all theobservations, the north limit of the LVZs in the NE Tibetan plateauprobably distributes non-uniformly in different regions and morestudies need to investigate its distribution in detail.
The LVZ in the northeastern Tibetan plateau is comparable to that inother parts of the plateau, such as the eastern, central and southernTibet. Geophysical studies using different methods also find highelectrical conductivity, high temperature and low strength zones withlow seismic velocities in the middle-to-lower crust beneath the plateau(e.g. Clark and Royden, 2000; Yao et al., 2008; Guo et al., 2009; Li et al.,2009; Zheng et al., 2010; Yang et al., 2012; Zheng et al., 2013; Liu et al.,2014). The effects of this LVZ on the dynamic mechanism and deforma-tion of the NE Tibetan plateau are still controversial topics. Clark andRoyden (2000) propose the channel flow model to explain the surfacetopography of the surrounding regions of the Tibetan plateau. To theeast, they suggest that the adjacent crust of the Sichuan Basin ismechanically weak, and the middle-to-lower crust of the plateau can
escape to these regions, thus producing the broader plateau marginwith a smoother topographic gradient. Yang et al. (2012) point thatthe LVZ observed in the middle-to-lower crust only based on Rayleighwave observations is not strong enough to support the argument ofthe channel flow model. Liu et al. (2014) conclude that the eastwardextension of the Tibetan plateau is accommodated by a combinationof local crustal flow and strain partitioning across deep faults such asthe Longmen Shan fault, and propose that rigid blockmotion and crustalflow may be reconcilable as mutual modes in the framework of crustaldeformation in southeastern Tibet. In order to determine whether thechannel flow model could dominantly explain the tectonic process inthe NE Tibetan plateau, we should perform more work in the futuresuch as accurate Love wave phase velocity measurements for radialanisotropy, inversion of azimuthal anisotropy, and investigation oflithospheric shear-wave velocities in this region.
Acknowledgments
We want to bring here the memory of Prof. Zhongjie Zhang, whountil recently was the leader of the research group in the IGGCAS andalso our dear friend, who unexpectedly passed away on September6th, 2013 at the early age of 49 years old. It was Zhongjie who led,together with other colleagues, most of the fieldworks and researchprojects in Tibet, including the deployment of the seismic array usedin this study. We are thankful to Prof. Robert Herrmann, Saint LouisUniversity, for providing us the computer software package, andProf. Xiaobo Tian, and Dr. Yun Chen and Xiaofeng Liang for their kindhelp on this research work. We are also thankful for the constructivecriticisms from anonymous reviewers for helping us to improve thispaper.Wegratefully acknowledge thefinancial support for thiswork con-tributed by the Chinese Academy of Sciences (XDB03010700), the ChinaEarthquake Administration (201408023), the National Natural ScienceFoundation of China (41174075 and 41474068) and the FundamentalResearch Funds for the Central Universities (WK2080000053).
References
Aitchison, J.C., Xia, X., Baxter, A.T., Ali, J.R., 2011. Detrital zircon U–Pb ages alongthe Yarlung–Tsangpo suture zone, Tibet: implications for oblique convergence andcollision between India and Asia. Gondwana Research 20, 691–709.
Ammon, C.J., Randall, G.E., Zandt, G., 1990. On the nonuniqueness of receiver functioninversions. Journal of Geophysical Research 95, 15,303–15,318.
Badal, J., Chen, Y., Chourak, M., Stankiewicz, J., 2013. S-wave velocity images ofthe Dead Sea Basin provided by ambient seismic noise. Journal of Asian Earth Sciences75, 26–35.
Burchfiel, B.C., Chen, Z., Liu, Y., Royden, L.H., 1995. Tectonics of the Longmenshan andadjacent regions. International Geology Review 37, 661–735.
Chen, Y., Li, W., Yuan, X., Badal, J., Teng, J., 2015. Tearing of the Indian lithospheric slabbeneath southern Tibet revealed by SKS-wave splitting measurements. Earth andPlanetary Science Letters 413, 13–24.
Christensen, N.I., 1979. Compressional wave velocities in rocks at high temperaturesand pressures, critical thermal gradients, and crustal low-velocity zones. Journal ofGeophysical Research 84, 6489–6857.
Clark, M.K., Royden, L.H., 2000. Topographic ooze: building the eastern margin of Tibet bylower crustal flow. Geology 28 (8), 703–706.
Clark, M.K., Farley, K.A., Zheng, D.W.,Wang, Z.C., Duvall, A.R., 2010. Early Cenozoic faultingof the northern Tibetan Plateau margin from apatite (U–Th)/He ages. Earth andPlanetary Science Letters 296, 78–88.
Dai, S., Fang, X.M., Dupont-Nivet, G., Song, C.H., Gao, J.P., Krijgsman, W., Langereis, C.,Zhang, W.L., 2006. Magnetostratigraphy of Cenozoic sediments from the XiningBasin: tectonic implications for the northeastern Tibetan Plateau. Journal ofGeophysical Research 111, B11102.
Deng, Y.F., Shen, W., Xu, T., Ritzwoller, M.H., 2015. Crustal layering in northeastern Tibet:a case study on joint inversion of receiver functions and surface wave dispersion.Geophysical Journal International 203, 692–706.
Duvall, A.R., Clark, M.K., 2010. Dissipation of fast strike-slip faulting within and beyondnortheastern Tibet. Geology 38 (3), 223–226.
England, P., Houseman, G., 1986. Finite strain calculations of continental deformation. 2.Comparison with the India–Asia collision zone. Journal of Geophysical Research 91(B3), 3664–3676.
England, P., Houseman, G., 1989. Extension during continental convergence with applica-tion to the Tibetan plateau. Journal of Geophysical Research 94 (B12), 17,561–17,579.
Enkelmann, E., Weislogel, A., Ratschbacher, L., Eide, E., Renno, A., Wooden, J., 2007.How was the Triassic Songpan–Ganzi basin filled? A provenance study. Tectonics26, TC4007. http://dx.doi.org/10.1029/2006TC002078.
Fang, X.M., Yan, M., der Voo, R.V., Rea, D.K., Song, C.H., 2005. Late Cenozoic deforma-tion and uplift of the NE Tibetan Plateau: evidence from high-resolutionmagnetostratigraphy of the Guide Basin, Qinghai Province, China. GSA Bulletin117, 1208–1225.
Fu, B.H., Awata, Y., 2007. Displacement and timing of left-lateral faulting in the KunlunFault Zone, northern Tibet, inferred geologic and geomorphic features. Journal ofAsian Earth Sciences 29, 253–265.
Galvé, A., Hirn, A., Jiang, M., Gallart, J., de Voogd, B., Lepine, J.C., Diaz, J., Wang, Y.X., Qian,H., 2002. Modes of raising northeastern Tibet probed by explosion seismology. Earthand Planetary Science Letters 203, 35–43.
Guo, Z., Gao, X., Yao, H.J., Li, J., Wang, W.M., 2009. Mid crustal low-velocity layerbeneath the central Himalaya and southern Tibet revealed by ambient noise arraytomography. Geochemistry, Geophysics, Geosystems 10, Q05007. http://dx.doi.org/10.1029/2009GC002458.
Herrmann, R.B., Ammon, C.J., 2004. Surface Waves, Receiver Functions and CrustalStructure. Computer Programs in Seismology, Version 3.30. Saint Louis University(http://www.eas.slu.edu/PeopleRBHerrmann/CPS330.html).
Hu, X.M.,Wang, J.G., BouDagher-Fadel, M., Garzanti, E., 2015. New insights into the timingof the India–Asia collision from the Paleogene Quxia and Jialazi Formations of theXigaze forearc basin, South Tibet. Gondwana Research http://dx.doi.org/10.1016/j.gr.2015.02.007.
Jiang, M., Galvé, A., Hirn, A., de Voogd, B., Laigle, M., Su, H.P., Diaz, J., Lépine, J.C., Wang,Y.X., 2006. Crustal thickening and variations in architecture from the Qaidambasin to the Qang Tang (North-Central Tibetan Plateau) from wide-angle reflectionseismology. Tectonophysics 412, 121–140.
Jiang, C.X., Yang, Y.J., Zheng, Y., 2014. Penetration of mid-crustal low velocity zone crossthe Kunlun Fault in the NE Tibetan Plateau revealed by ambient noise tomography.Earth and Planetary Science Letters 406, 81–92.
Li, H.Y., Shen, Y., Huang, Z.X., Li, X.F., Gong, M., Shi, D.N., Sandvol, E., Li, A.B., 2014a. Thedistribution of the mid-to-lower crustal low-velocity zone beneath thenortheastern Tibetan Plateau revealed from ambient noise tomography. Journalof Geophysical Research, Solid Earth 119, 1954–1970.
Li, X.F., Li, H.Y., Shen, Y., Gong, M., Shi, D.N., Sandvol, E., Li, A.B., 2014b. Crustal velocitystructure of the Northeastern Tibetan Plateau from ambient noise surface-wavetomography and its tectonic implications. Bulletin of the Seismological Society ofAmerica 104. http://dx.doi.org/10.1785/0120130019.
Ligorría, J.P., Ammon, C.J., 1999. Iterative deconvolution and receiver-function estimation.Bulletin of the Seismological Society of America 89, 1395–1400.
Liu, M.J., Mooney, W., Li, S.L., Okaya, N., Detweiler, S., 2006. Crustal structure of thenortheastern margin of the Tibetan plateau from the Songpan–Ganzi terrane to theOrdos basin. Tectonophysics 420, 253–266.
Liu, Q.Y., van der Hilst, R.D., Li, Y., Yao, H.J., Chen, J.H., Guo, B., Qi, S.H., Wang, J., Huang, H.,Li, S., 2014. Eastward expansion of the Tibet Plateau by crustal flow and strainpartitioning across faults. Nature Geoscience 30, 361–365.
Meyer, B., Tapponnier, P., Bourjot, L., Métivier, F., Gaudemer, Y., Peltzer, G., Shunmin, G.,Zhitai, C., 1998. Crustal thickening in Gansu–Qinghai, lithospheric mantle subduction,and oblique, strike-slip controlled growth of the Tibet plateau. Geophysical JournalInternational 135, 1–47.
Molnar, P., Tapponnier, P., 1975. Cenozoic tectonics of Asia: effects of a continentalcollision. Science 189, 419–426.
Montagner, J.P., 1986. Regional three-dimensional structures using long period surfacewaves. Geophysicae 4, 283–294.
Replumaz, A., Capitanio, F.A., Guillot, S., Negredo, A.M., Villaseñor, A., 2014. Thecoupling of Indian subduction and Asian continental tectonics. Gondwana Research26, 608–626.
Rowley, D.B., 1996. Age of initiation of collision between India and Asia a review ofstratigraphic data. Earth and Planetary Science Letters 145, 1–13.
Shapiro, N.M., Campillo, M., Stehly, L., Ritzwoller, M.H., 2005. High-resolution surfacewave tomography from ambient seismic noise. Science 307, 1615–1618.
Stehly, L., Campillo, M., Shapiro, N.M., 2006. A study of the seismic noise from its long-range correlation properties. Journal of Geophysical Research 111, B10306.
Sun, Z., Pei, J., Li, H., Xu, W., Zhu, Z., Wang, X., Yang, Z., 2012. Palaeomagnetism of lateCretaceous sediments from southern Tibet: evidence for the consistentpalaeolatitudes of the southern margin of Eurasia prior to the collision withIndia. Gondwana Research 21, 53–63.
Tapponnier, P., Molnar, P., 1976. Slip-line field theory and large-scale continental tectonics.Nature 264 (25), 319–324.
Tapponnier, P., Peltzer, G., Dain, A.Y., Armijo, R., 1982. Propagating extrusion tectonics inAsia: new insights from simple experiments with plasticine. Geology 10, 611–616.
Tapponnier, P., Xu, Z., Roger, F., Meyer, B., Arnaud, N., Wittlinger, G., Yang, J., 2001. Obliquestepwise rise and growth of the Tibet plateau. Science 294, 1671–1677.
Tarantola, A., Valette, B., 1982. Generalized nonlinear inverse problem solvedusing the least squares criterion. Reviews of Geophysics and Space Physics 20(2), 219–232.
Tian, X.B., Zhang, Z.J., 2013. Bulk crustal properties in NE Tibet and their implications fordeformation model. Gondwana Research 24, 548–559.
Unsworth, M., Wei, W.B., Jones, A.G., Li, S.H., Bedrosian, P., Booker, J., Sheng, J., Ming, D.,Tan, H.D., 2004. Crustal and upper mantle structure of northern Tibet imaged withmagnetotelluric data. Journal of Geophysical Research 109, B02403. http://dx.doi.org/10.1029/2002 JB002305.
Vergne, J., Wittlinger, G., Hui, Q., Tapponnier, P., Poupinet, G., Mei, J., Herquel, G., Paul, A.,2002. Seismic evidence for stepwise thickening of the crust across the NE Tibetanplateau. Earth and Planetary Science Letters 203, 25–33.
Villaseñor, A., Yang, Y., Ritzwoller, M.H., Gallart, J., 2007. Ambient noise surfacewave tomography of the Iberian Peninsula: implications for shallow seismicstructure. Geophysical Research Letters 34, L11304. http://dx.doi.org/10.1029/2007GL030164.
Weislogel, A.L., 2008. Tectonostratigraphic and geochronologic constraints on evolutionof the northeast Paleotethys from the Songpan–Ganzi Complex, central China.Tectonophysics 451, 331–345.
Xia, L., Liu, X., Ma, Z., Xu, X., Xia, Z., 2011. Cenozoic volcanism and tectonic evolution of theTibetan plateau. Gondwana Research 19, 850–866.
Xu, T., Wu, Z.B., Zhang, Z.J., Tian, X.B., Deng, Y.F., Wu, C.L., Teng, J.W., 2014. Crustalstructure across the Kunlun fault from passive source seismic profiling in East Tibet.Tectonophysics 627, 98–107.
Yang, Y.J., Ritzwoller, M.H., Levshin, A.L., Shapiro, N.M., 2007. Ambient noise wavetomography across Europe. Geophysical Journal International 168, 259–274.
Yang, Y.J., Ritzwoller, Zheng, Y., Shen, W.S., Levshin, A.L., Xie, Z.J., 2012. A synoptic viewof the distribution and connectivity of the mid-crustal low velocity zone beneathTibet. Journal of Geophysical Research 117, B04303. http://dx.doi.org/10.1029/2011JB008810.
Yao, H.J., van der Hilst, R.D., de Hoop, M.V., 2006. Surface-wave array tomography in SETibet from ambient seismic noise and two-station analysis: I— phase velocity maps.Geophysical Journal International 166, 732–744.
Yao, H.J., Beghein, C., van der Hilst, R.D., 2008. Surface-wave array tomography in SE Tibetfrom ambient seismic noise and two-station analysis: II— crustal and upper-mantlestructure. Geophysical Journal International 173, 205–219.
Yao, H.J., van der Hilst, R.D., Montagner, J.-P., 2010. Heterogeneity and anisotropy of thelithosphere of SE Tibet from surface wave array tomography. Journal of GeophysicalResearch 115, B12307. http://dx.doi.org/10.1029/2009JB007142.
Yin, A., Harrison, T.M., 2000. Geologic evolution of the Himalayan–Tibetan orogen. AnnualReview of Earth and Planetary Sciences 28, 211–280.
Yu, S.Y., Zhang, J.X., Real, P.G.D., 2012. Geochemistry and zircon U–PB ages of adakiticrocks from the Dulan area of the North Qaidam UHP terrane, north Tibet: constraintson the timing and nature of regional tectonothermal events associatedwith collision-al orogeny. Gondwana Research 21, 167–179.
Yuan, D.Y., Champagnac, J.D., Ge, W.P., Molnar, P., Zhang, P.Z., Zheng, W.J., Zhang, H.P.,Liu, X.W., 2011. Late Quaternary right-lateral slip rates of faults adjacent tothe lake Qinghai, northeastern margin of the Tibetan Plateau. GSA Bulletin 123(9/10), 2016–2030.
Zhang, Z.J., Yuan, X.H., Chen, Y., Tian, X.B., Kind, R., Li, X.Q., Teng, J.W., 2010. Seismicsignature of the collision between the east Tibetan escape flow and the SichuanBasin. Earth and Planetary Science Letters 292, 254–264.
410 Z. Wu et al. / Gondwana Research 41 (2017) 400–410
Zhang, Z.J., Klemperer, S., Bai, Z.M., Chen, Y., Teng, J.W., 2011. Crustal structure of thePaleozoic Kunlun orogeny from an active-source seismic profile between Moba andGuide in East Tibet, China. Gondwana Research 19, 994–1007.
Zhang, J.J., Santosh, M., Wang, X.X., Guo, L., Yang, X.Y., Zhang, B., 2012. Tectonics of thenorthern Himalaya since the India–Asia collision. Gondwana Research 21, 939–960.
Zheng, Y., Yang, Y.J., Ritzwoller, M.H., Zheng, X.F., Xiong, X., Li, Z.N., 2010. Crustal structureof the northeastern Tibetan plateau, the Ordos block and the Sichuan basin fromambient noise tomography. Earthquake Science 23, 465–476.
Zheng, Y., Shen, W.S., Zhou, L.Q., Yang, Y.J., Xie, Z.J., Ritzwoller, M.H., 2011. Crust anduppermost mantle beneath the North China Craton, northeastern China, and theSea of Japan from ambient noise tomography. Journal of Geophysical Research116. http://dx.doi.org/10.1029/2011JB008637.
Zheng, Y., Can,G.E., Xie, Z.J., Yang, Y.J., Xiong, X., Hsu,H.T., 2013. Crustal anduppermantle struc-ture and the deep seismogenic environment in the source regions of the Lushan earth-quake and theWenchuan earthquake. Science China Earth Sciences 56 (7), 1158–1168.


![Crustal d eformation of the Y ellowstone Ð Snake River Plain … · 2012-02-28 · [8] Late Quaternary silicic volcanism is centered at the Y ellowstone Plateau, located at the northeastern](https://static.documents.pub/doc/80x56/5e9abe67357086729f4603cb/crustal-d-eformation-of-the-y-ellowstone-snake-river-plain-2012-02-28-8-late.jpg)

