Page 1
RESEARCH PAPER
Crustal thickness and vP/vS ratio in Shanxi Graben, China
Yutao Shi • Yuan Gao • Honglin Jing
Received: 22 September 2014 / Accepted: 24 October 2014 / Published online: 30 November 2014
� The Seismological Society of China, Institute of Geophysics, China Earthquake Administration and Springer-Verlag Berlin Heidelberg 2014
Abstract Shanxi Graben is in the middle part of the
North China Craton, from south to north. With the telese-
ismic data recorded by Regional Seismograph Networks
and the temporary ZBnet-W Seismic Array around east
part of Shanxi Graben, we measured the crustal thickness
and vP/vS ratio beneath each station using the H-j stack of
receiver functions. The observed crustal thickness shows
obvious lateral variation, increasing gradually from east to
west in the Shanxi Graben. Beneath the Shanxi Graben the
crust is relatively thicker than both sides of the south and
the north. In addition, the vP/vS ratio in the north of study
zone is higher than that in the south. The highest vP/vS ratio
exists in the crust of the Xinding basin and the Datong
basin. Our study also suggests that high velocity ratio
might result from the strong activities of the magmation
and volcanism.
Keywords Shanxi Graben � North China Craton (NCC) �Receiver function � Crustal thickness � Crustal vP/vS ratio
1 Introduction
Under the push from the Qinghai–Tibet Plateau and the
pull of the westward subduction of Pacific Plate and Phil-
ippine Plate, the lithosphere of the North China Craton
(NCC) is suffering from destruction at different levels
(Zhang et al. 2003; Liu et al. 2004; Zhu and Zheng 2009).
Many studies have shown that there are regional variations
of rock compositions and velocity structure in the crust and
the upper mantle in the North China Craton (Gao et al.
2010; Xu et al. 2011). At present, there are two contro-
versial hypotheses about what leads to the destruction in
the NCC: one is plate edge effect caused by plate move-
ment (Gao et al. 2002; Wu et al. 2005), and the other is
driven primarily by plate basal force associated with small-
scale mantle convection (Xu 2001).
The Shanxi Graben divides the North China Craton
into eastern and western segments (Kusky and Li 2003;
Chen et al. 2009) (Fig. 1). the Ordos block became very
stable during the Archean era, with negligible destruction
(Qiu et al. 2005). From the Mesozoic to the Cenozoic
Era, the eastern region of the North China Craton was not
a typical Craton due to reconstruction and disruption
(Zhai and Liu 2003). Therefore, the lithosphere of the
North China Craton presents a feature of ‘‘East West Thin
Thick.’’ However, the crustal structure in the Shanxi
Graben displays complicated characteristics of spatial
distribution (Jia et al. 2005; Tian et al. 2009; Chen et al.
2009). Previous studies suggest that there is a large lateral
variations on the crustal thickness and the constituents of
the Shanxi Graben (Liu et al. 2011). The crustal Poisson’s
ratio in north of Shanxi Graben increases as the crustal
thickness reduces, and this indicates that the stretching of
lithosphere resulted in a reduction of crustal thickness,
together with magmatic underplating in this area (Ji et al.
2009). The spatial variation of crustal structure in the
Shanxi Graben shows not only the overall stability of the
heritage Craton but also regional transformation and
thickness reduction.
Shanxi Graben, located in the east side of the Ordos
block and the west side of the North China Basin, consists
of the Xuanhua basin, Yanhuai basin, Datong basin, Xin-
ding basin, Taiyuan basin, Linfen basin, and Yuncheng
basin from north to south (Fig. 1). There were many strong
Y. Shi (&) � Y. Gao � H. Jing
Institute of Earthquake Science, China Earthquake
Administration, Beijing 100036, People’s Republic of China
e-mail: [email protected]
123
Earthq Sci (2014) 27(6):589–597
DOI 10.1007/s11589-014-0100-1
Page 2
earthquakes in the region of the Shanxi Graben, such as the
Hongdong M8.0 earthquake in 1303. Thus, Shanxi Graben
is one of the most important seismic active belts in east
China. The renowned Datong volcano is a quaternary
volcanic cluster, which is mainly distributed around the
eastern part of Datong basin in Shanxi Graben. Volcanic
activities not only modify the crustal structure, but also
provide mineral resources, such as coal and oil. Therefore,
research on the crustal structure under the Shanxi Graben
will help in illuminating the mechanism and characteristics
of the earthquakes which occurred in the region, and pro-
viding deep geophysical information for earthquake fore-
casting in the Central Orogenic belt.
Receiver function is one of the most effective approa-
ches to study crustal deformation and dynamic modifica-
tion (Gao and Zhou 1998; Liu et al. 1997; Owens and
Zandt 1997; Tian et al. 2005a, 2005b; Wu and Zeng 1998;
Zhang et al. 2013). Our study of the crustal structure of the
Shanxi Graben was based on the teleseismic data recorded
by Shanxi Regional Seismograph Network and ZBnet-W
seismic array. From the data on crustal thickness and
average velocity ratio (vP/vS) from the receiver function
beneath each seismic station, we infer the geologic struc-
ture of Shanxi Graben, which significantly helps us get
more information of the evolution of the Central Orogenic
belt and the NCC, and provides useful information on the
Datong volcano and its resources.
2 Data and method
In order to increase the distribution density of seismic
stations, the Shanxi Regional Seismograph Network was
expanded to 32 broadband seismic stations (Red triangles,
Fig. 1). These stations have provided a variety of wave-
form data for the study on crustal structure. In July 2008,
the Institute of Earthquake Science, China Earthquake
Administration set up ZBnet-W seismic array with 12
temporary seismic stations to observe for 14 months in the
west of Zhangjiakou-Bohai Seismic belt (ZB-belt) (Blue
triangles, Fig. 1), and got plenty of teleseismic data. The
types of seismographs are CMG-3ESP and BKD, with
100 Hz and 62.5 Hz sample frequencies in Regional
Seismograph Network and ZBnet-W seismic array,
respectively.
We utilized the teleseismic events from Shanxi Regional
Seismograph Network and the part of Hebei Regional
Seismograph Network during August 2007–July 2010 and
the teleseismic events recorded by ZBnet-W seismic array.
All clear teleseismic events with phases in the epicenter
distance range between 30� and 90� with magnitude of 5.5
or greater were selected.
N N N N
E
E
E
E
E
Fig. 1 The structure map of Shanxi Graben area, the distribution of
seismic stations around Shanxi Graben area, and the temporary
seismic stations of ZBnet-W used in this study. XH, YH, DT, XD,
TY, LF, and YC are Xuanhua Basin, Yanhuai Basin, Datong Basin,
Xiding Basin, Taiyuan Basin, Linfen Basin, and Yuncheng Basin,
respectively
Fig. 2 The epicentral distribution of teleseismic events (red dots)
used in this study
590 Earthq Sci (2014) 27(6):589–597
123
Page 3
Data selection and processing are crucial points in
seismologic research. Therefore, in this study, seismic
waves were adopted with high signal-to-noise ratios for
each station and filtered every waveform with 0.02–0.5 Hz
bandwidth with Gaussian filter for receiver function study
by the frequency-domain deconvolution. Most of the
events were distributed on the south of the study region
(Fig. 2). Finally, 6204 receiver functions for estimation of
crustal thickness (H) and the velocity ratio (vP/vS) were
calculated from 40 seismic stations.
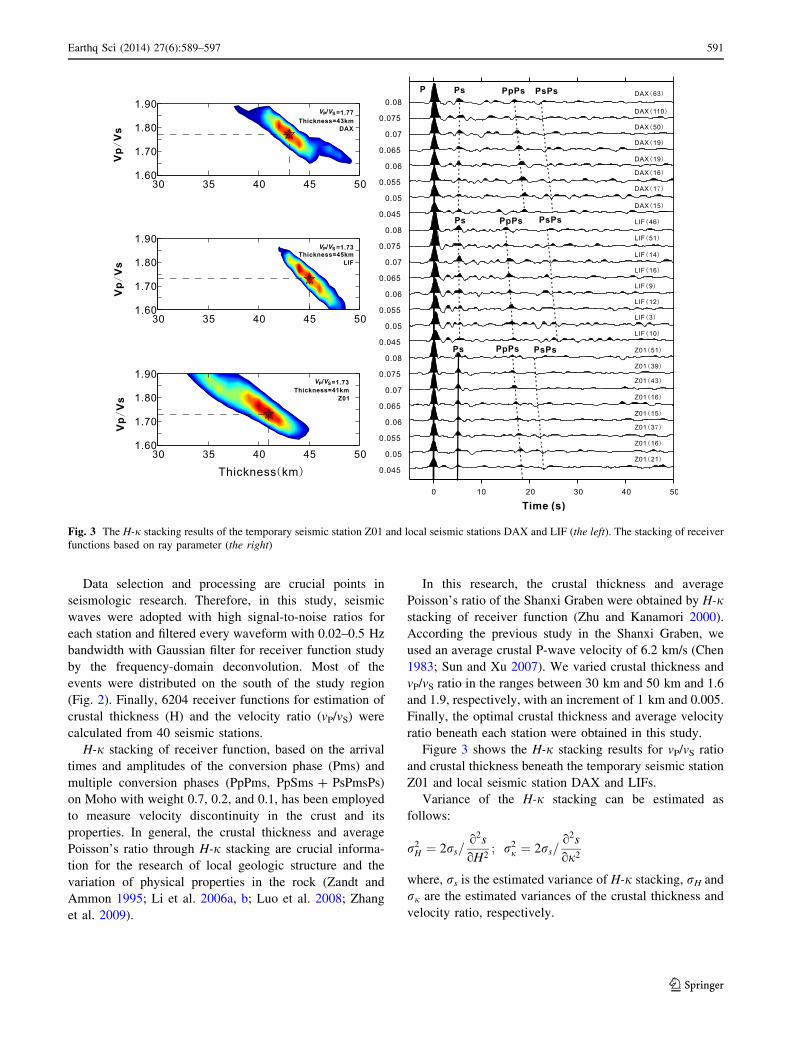
H-j stacking of receiver function, based on the arrival
times and amplitudes of the conversion phase (Pms) and
multiple conversion phases (PpPms, PpSms ? PsPmsPs)
on Moho with weight 0.7, 0.2, and 0.1, has been employed
to measure velocity discontinuity in the crust and its
properties. In general, the crustal thickness and average
Poisson’s ratio through H-j stacking are crucial informa-
tion for the research of local geologic structure and the
variation of physical properties in the rock (Zandt and
Ammon 1995; Li et al. 2006a, b; Luo et al. 2008; Zhang
et al. 2009).
In this research, the crustal thickness and average
Poisson’s ratio of the Shanxi Graben were obtained by H-jstacking of receiver function (Zhu and Kanamori 2000).
According the previous study in the Shanxi Graben, we
used an average crustal P-wave velocity of 6.2 km/s (Chen
1983; Sun and Xu 2007). We varied crustal thickness and
vP/vS ratio in the ranges between 30 km and 50 km and 1.6
and 1.9, respectively, with an increment of 1 km and 0.005.
Finally, the optimal crustal thickness and average velocity
ratio beneath each station were obtained in this study.
Figure 3 shows the H-j stacking results for vP/vS ratio
and crustal thickness beneath the temporary seismic station
Z01 and local seismic station DAX and LIFs.
Variance of the H-j stacking can be estimated as
follows:
r2H ¼ 2rs=
o2s
oH2; r2
j ¼ 2rs=o2s
oj2
where, rs is the estimated variance of H-j stacking, rH and
rj are the estimated variances of the crustal thickness and
velocity ratio, respectively.
Fig. 3 The H-j stacking results of the temporary seismic station Z01 and local seismic stations DAX and LIF (the left). The stacking of receiver
functions based on ray parameter (the right)
Earthq Sci (2014) 27(6):589–597 591
123
Page 4
3 Moho interfacial morphology and the distribution
of crustal velocity ratio
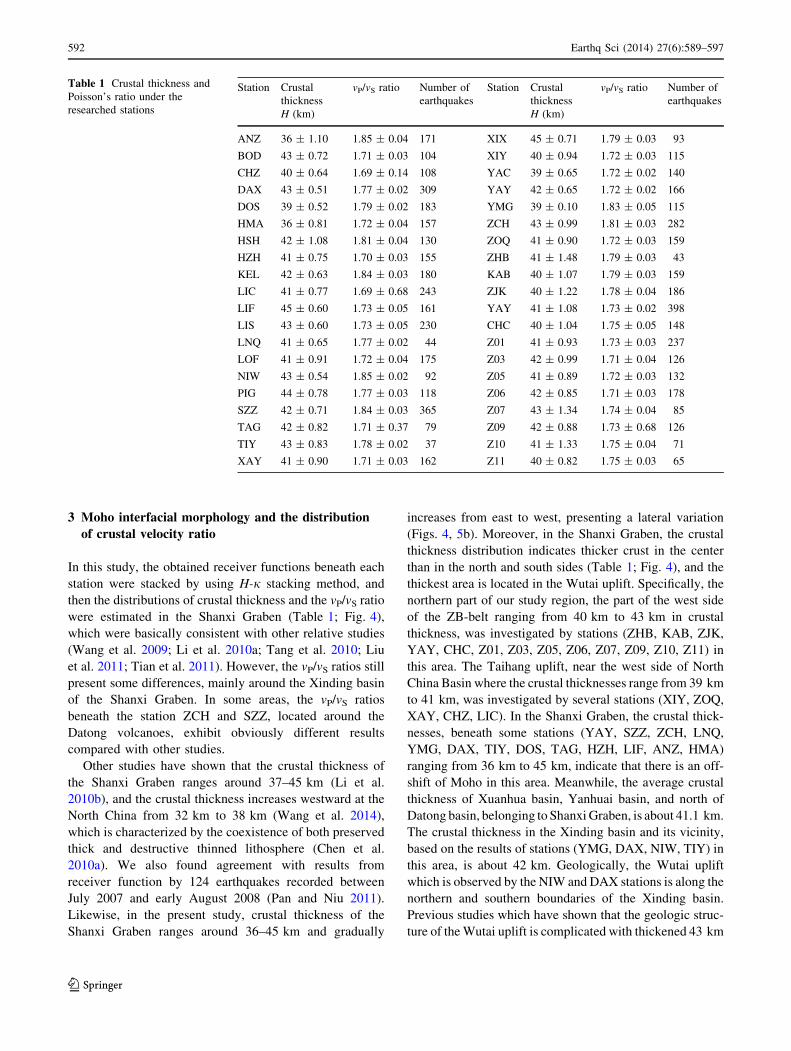
In this study, the obtained receiver functions beneath each
station were stacked by using H-j stacking method, and
then the distributions of crustal thickness and the vP/vS ratio
were estimated in the Shanxi Graben (Table 1; Fig. 4),
which were basically consistent with other relative studies
(Wang et al. 2009; Li et al. 2010a; Tang et al. 2010; Liu
et al. 2011; Tian et al. 2011). However, the vP/vS ratios still
present some differences, mainly around the Xinding basin
of the Shanxi Graben. In some areas, the vP/vS ratios
beneath the station ZCH and SZZ, located around the
Datong volcanoes, exhibit obviously different results
compared with other studies.
Other studies have shown that the crustal thickness of
the Shanxi Graben ranges around 37–45 km (Li et al.
2010b), and the crustal thickness increases westward at the
North China from 32 km to 38 km (Wang et al. 2014),
which is characterized by the coexistence of both preserved
thick and destructive thinned lithosphere (Chen et al.
2010a). We also found agreement with results from
receiver function by 124 earthquakes recorded between
July 2007 and early August 2008 (Pan and Niu 2011).
Likewise, in the present study, crustal thickness of the
Shanxi Graben ranges around 36–45 km and gradually
increases from east to west, presenting a lateral variation
(Figs. 4, 5b). Moreover, in the Shanxi Graben, the crustal
thickness distribution indicates thicker crust in the center
than in the north and south sides (Table 1; Fig. 4), and the
thickest area is located in the Wutai uplift. Specifically, the
northern part of our study region, the part of the west side
of the ZB-belt ranging from 40 km to 43 km in crustal
thickness, was investigated by stations (ZHB, KAB, ZJK,
YAY, CHC, Z01, Z03, Z05, Z06, Z07, Z09, Z10, Z11) in
this area. The Taihang uplift, near the west side of North
China Basin where the crustal thicknesses range from 39 km
to 41 km, was investigated by several stations (XIY, ZOQ,
XAY, CHZ, LIC). In the Shanxi Graben, the crustal thick-
nesses, beneath some stations (YAY, SZZ, ZCH, LNQ,
YMG, DAX, TIY, DOS, TAG, HZH, LIF, ANZ, HMA)
ranging from 36 km to 45 km, indicate that there is an off-
shift of Moho in this area. Meanwhile, the average crustal
thickness of Xuanhua basin, Yanhuai basin, and north of
Datong basin, belonging to Shanxi Graben, is about 41.1 km.
The crustal thickness in the Xinding basin and its vicinity,
based on the results of stations (YMG, DAX, NIW, TIY) in
this area, is about 42 km. Geologically, the Wutai uplift
which is observed by the NIW and DAX stations is along the
northern and southern boundaries of the Xinding basin.
Previous studies which have shown that the geologic struc-
ture of the Wutai uplift is complicated with thickened 43 km
Table 1 Crustal thickness and
Poisson’s ratio under the
researched stations
Station Crustal
thickness
H (km)
vP/vS ratio Number of
earthquakes
Station Crustal
thickness
H (km)
vP/vS ratio Number of
earthquakes
ANZ 36 ± 1.10 1.85 ± 0.04 171 XIX 45 ± 0.71 1.79 ± 0.03 93
BOD 43 ± 0.72 1.71 ± 0.03 104 XIY 40 ± 0.94 1.72 ± 0.03 115
CHZ 40 ± 0.64 1.69 ± 0.14 108 YAC 39 ± 0.65 1.72 ± 0.02 140
DAX 43 ± 0.51 1.77 ± 0.02 309 YAY 42 ± 0.65 1.72 ± 0.02 166
DOS 39 ± 0.52 1.79 ± 0.02 183 YMG 39 ± 0.10 1.83 ± 0.05 115
HMA 36 ± 0.81 1.72 ± 0.04 157 ZCH 43 ± 0.99 1.81 ± 0.03 282
HSH 42 ± 1.08 1.81 ± 0.04 130 ZOQ 41 ± 0.90 1.72 ± 0.03 159
HZH 41 ± 0.75 1.70 ± 0.03 155 ZHB 41 ± 1.48 1.79 ± 0.03 43
KEL 42 ± 0.63 1.84 ± 0.03 180 KAB 40 ± 1.07 1.79 ± 0.03 159
LIC 41 ± 0.77 1.69 ± 0.68 243 ZJK 40 ± 1.22 1.78 ± 0.04 186
LIF 45 ± 0.60 1.73 ± 0.05 161 YAY 41 ± 1.08 1.73 ± 0.02 398
LIS 43 ± 0.60 1.73 ± 0.05 230 CHC 40 ± 1.04 1.75 ± 0.05 148
LNQ 41 ± 0.65 1.77 ± 0.02 44 Z01 41 ± 0.93 1.73 ± 0.03 237
LOF 41 ± 0.91 1.72 ± 0.04 175 Z03 42 ± 0.99 1.71 ± 0.04 126
NIW 43 ± 0.54 1.85 ± 0.02 92 Z05 41 ± 0.89 1.72 ± 0.03 132
PIG 44 ± 0.78 1.77 ± 0.03 118 Z06 42 ± 0.85 1.71 ± 0.03 178
SZZ 42 ± 0.71 1.84 ± 0.03 365 Z07 43 ± 1.34 1.74 ± 0.04 85
TAG 42 ± 0.82 1.71 ± 0.37 79 Z09 42 ± 0.88 1.73 ± 0.68 126
TIY 43 ± 0.83 1.78 ± 0.02 37 Z10 41 ± 1.33 1.75 ± 0.04 71
XAY 41 ± 0.90 1.71 ± 0.03 162 Z11 40 ± 0.82 1.75 ± 0.03 65
592 Earthq Sci (2014) 27(6):589–597
123
Page 5
crust (Zhao et al. 2006), and even thicker crust in the vicinity,
are consistent with this study. The crustal thickness displays
large variation from some stations (HMA, HZH, LIF, ANZ)
located in the Linfen basin and the northern Yuncheng Basin.
The crustal thickness in the western area we observed at
several stations (PIG, BOD, KEL, LOF, LIS, XIX), namely
the Luliang uplift belonging to the Ordos block, is about
43 km. Wu et al. (2011) found that the Luliang uplift was the
dividing point between the western side and the central
subterranean section of the NCC. In addition, we observed
that the crustal thickness of the Ordos block is about
44–46 km, which is higher than that of the Luliang uplift
(Fig. 3). Thus, the distinctive discontinuity of crustal thick-
ness which exists in Luliang uplift might be caused by the
differential crustal structure between the western side and the
central section of the NCC
The Poisson’s ratio indicates the variations of the crustal
constituent and physical property (Ji et al. 2009; Tian and
Zhang 2013). The vP/vS ratios in the Shanxi Graben and the
surrounding region range from 1.69 to 1.85 (Table 1;
Fig. 4) and the corresponding Poisson’s ratio from 0.23 to
0.29. On the whole, the vP/vS ratio constantly increases
while the crustal thickness decreases based on the results
from the stations located in the Shanxi Graben (Fig. 5a).
Thus, we conclude that the lithospheric stretching results in
the reduction of crustal thickness under the effect of the
mafic magma in Shanxi Graben. Taking the junction of the
Xinding basin and the Taiyuan basin as the boundary in the
Shanxi Graben, the vP/vS ratio in the north is higher than
that in the south (Figs. 4, 5a). However, there are little
variations of vP/vS ratio along the longitude direction in this
area (Figs. 4, 5b). In the Taiyuan basin and its southern
region, small variations of vP/vS ratio indicate a heteroge-
neous crust. There is a variation with latitude in vP/vS ratio
in the north of Shanxi Graben, which ranges from 1.71 to
1.75 beneath several stations (Z01, Z03, Z05, Z06, Z07,
Z09, Z10, Z11). The ratio increases as the crustal thickness
reduces (Fig. 5d). Previous study indicates that the average
vP/vS ratio and Poisson’s ratio in China Mainland are 1.73
and 0.25, respectively (Chen et al. 2010b). The vP/vS ratios
in the Xinding basin and its surrounding area are obviously
high, which were measured by several stations (DAX,
NIW, TIY, YMG) with values of 1.77, 1.85, 1.78, and 1.83,
respectively. In addition, large-scaled low-velocity anom-
alies exist in the upper crust with strong reflection waves
beneath the Wutai uplift from the active seismic study in
the area (Zhao et al. 2006). Therefore, we suggest there are
intense activities of magmatism under the Wutai uplift.
Because magmatism causes richer mafic materials in sur-
rounding crust (Ji et al. 2009), the vP/vS ratio is higher in
the Xinding basin and its surroundings than those in the
other areas. The vP/vS ratios measured by Station ANZ and
1.70
1.75
1.80
1.85
36
38
40
42
44
Km
XH
LF
YC
YHDT
XD
TY
XH
LF
YC
YHDT
XD
TY
StationBoundary of
NCC
Nor
thC
hina
Bas
in
Nor
thC
hina
Bas
in
Ordos block Ordos block
StationBoundary of
NCC
Wutai uplift
lulia
ngup
lift Wutai uplift
lulia
ngup
lift
NNNN
E
E
E
E
E
E
E
E
E
E
NNNN
Fig. 4 The distributions of crustal thickness (the left) and the vP/vS ratio (the right) in the Shanxi Graben obtained from the H-j stack of receiver
function. The black triangle indicates the locations of seismic station
Earthq Sci (2014) 27(6):589–597 593
123
Page 6
XIX located at the Linfen basin were also high with values
of 1.85 and 1.79, respectively. This is probably related to
an especial geologic structure and complicated dynamics in
Shanxi Graben, which is caused by the effect of the ten-
sion-shear, mantle material upwelling (Tang et al. 2010).
The vP/vS ratios measured by several stations (SZZ,
ZCH, HSH, YMG) in Datong basin are higher than those in
the other areas. These results indicate there are rich mafic
materials or particle melting in the Datong basin. Espe-
cially, the crustal vP/vS ratios beneath station SZZ (1.84)
and ZCH (1.85) in this research (Fig. 6) are different from
the corresponding results of Li et al. (2010), which are 1.72
(SZZ) and 1.75 (ZCH). In addition, the Ps amplitudes of
receiver function beneath the stations SZZ and ZCH are not
clear, and display various characteristics with the changes
in azimuth, even which are indistinct (Fig. 6).
Datong volcano, where the stations SZZ and ZCH are
located, is an active quaternary volcano caused by sub-
duction of the western Pacific plate and lateral compression
of the India Plate (Chen et al. 1997; Chen et al. 2010a). The
high vP/vS ratio exists in Datong volcanic rock in this
research. Therefore, we suggest that the high vP/vS ratios in
Datong volcano and its surrounding area are caused by
volcanic activity, because alkali basalts and tholeiitic bas-
alts separately dominate the mineral in northeast and
southeast areas in Datong basin and Xiding basin (Zhang
VP/V
SV
P/V
S
VP/V
S
a
b
c d
Fig. 5 The latitude versus vP/vS ratio (a) and the longitude versus crustal thickness (b) for all stations considered in this study. The vP/vS ratio
versus crustal thickness in the Shanxi Graben (c) and Zhangjiakou area (d)
594 Earthq Sci (2014) 27(6):589–597
123
Page 7
et al. 1997). These rocks were generated by magmatism of
the Datong volcano and changed the surface and internal
crustal constitution.
The vP/vS ratios from these two stations show obvi-
ous azimuthal variation. Its value obtained from the
earthquakes in northwest direction is smaller than that
from earthquakes in other directions (Fig. 7). This may
suggest that the amount of mafic material or partial
melting is low in northwest direction compared to those in
other azimuths.
Fig. 6 The receiver functions from SZZ and ZCH stations. The top is the summation of all receiver functions (dash black line) and the individual
receiver functions (gray line)
E
E
E
E
EN N N N
E
E
E
N N N N
Fig. 7 The variations of thickness and vP/vS ratio with azimuths of earthquake at stations of SZZ and ZCH
Earthq Sci (2014) 27(6):589–597 595
123
Page 8
4 Conclusions
The Shanxi Graben, one of the main rifts forming in the
North China Craton, results from material flowing from the
Tibetan Plateau (Tapponnier and Molnar 1977). Under the
effect of the large extension by the subduction of the
Pacific plate, material flows up from the eastern Astheno-
sphere and is blocked by the Ordos block. These mantle
materials are leading to upwelling in the Shanxi Graben,
together with volcanic activity and earthquakes. All of
these present as a thinner crust and a higher Poisson’s ratio
(Ge et al. 2011).
In this study, 6204 receiver functions were obtained
from teleseismic events recorded at 40 digital seismic
stations in Shanxi Regional Seismograph Network and
temporary seismic stations (ZBnet-W) that were deployed
by the Institute of Earthquake Science, China Earthquake
Administration. The crustal thickness and vP/vS ratio under
the Shanxi Graben and its surroundings were inverted. Our
result shows the crustal thickness in Shanxi Graben ranging
from 36 km to 45 km, and the vP/vS ratio ranging from 1.68
to 1.85. In addition, the result reveals obvious lateral var-
iation in crustal thickness, which increases gradually from
the east to the west. Along the NS direction across the
Graben, crust changes from thin to thick, and then to thin
again, with the deepest Moho located beneath the central
part. Specifically, the crustal thickness of Xinding basin, in
the middle of the orogenic belt, is 43 km, which is higher
than that of northern and southern regions. In the north of
the confluence of the Xinding basin and Taiyuan basin, the
average vP/vS ratio is higher than that in the south. Fur-
thermore, the highest vP/vS ratio exists in the crust of the
Xinding basin and Datong basin.
According to this study, due to the fierce activities of the
magmatism under the Wutai uplift, the crustal thickness of
Xinding basin and its vicinity area is greater, as is the vP/vS
ratio, compared to those in other areas of the Shanxi
Graben. In addition, due to the magmatism of the Datong
volcano caused by subduction of the western Pacific plate
and lateral compression of the India Plate, we note a high
vP/vS ratio which indicates richer mafic materials or higher
partial melting in the crust, and that the amount of mafic
material or partial melting is low in the northwest direction
compared to those in other azimuths.
In general, P wave velocity is positivity correlated with
crustal depth, and negatively correlated with the velocity
ratio. There is some influence for the crustal depth in
complex crustal structure with the variation of P wave (Li
et al. 2010). The sediment layer in Shanxi Graben is
thinner, and the influence is smaller for the receiver func-
tion result. Therefore, we did not take into account the
effect of sediment structure on the top crust in this
research, and the suggested velocity P wave was 6.2 km/s
from the some previous study.
Acknowledgments Waveform data for this study were provided by
the Data Management Center of China National Seismic Network at
Institute of Geophysics, China Earthquake Administration (Zheng
et al. 2010). We thank Prof. Fenglin Niu for constructive comments
and helpful revision. This research is supported by the National
Natural Science Foundation of China (No. 41230210), the Projects of
International Cooperation and Exchanges from the Ministry of Sci-
ence and Technology of China (Grant No. 2010DFB20190), and the
Fundamental Research Funds for the Institute of Earthquake Science,
China Earthquake Administration. We sincerely thank two anony-
mous referees for their constructive comments and suggestions which
helped improving the manuscript.
References
Chen GS (1983) Some cognitions about the evolution of Datong
Graben Basin, North China. Earthq Sci 1(2):31–34 (in Chinese
with English Abstract)
Chen L, Ai YS (2009) Discontinuity structure of the mantle transition
zone beneath the North China Craton from receiver function
migration. Chin J Geophys 114:B06307
Chen XD, Lin CY, Zhang XO, Shi LB (1997) Deformation features of
mantle xenoliths from quaternary basalts in Datong, Shanxi
Province and their rheological implications. Seismol Geol
19(4):313–320
Chen L, Cheng C, Wei ZG (2009) Seismic evidence for significant
lateral variations in lithospheric thickness beneath the central
and western North China Carton, Earth Planet. Sci Lett 286:
171–183
Chen L, Wei ZG, Cheng C (2010a) Significant structural variations in
the Central and Western North China Craton and its implications
for the Craton destruction. Earth Sci Front 17(1):212–228 (in
Chinese with English Abstract)
Chen YL, Niu FL, Liu RF, Huang Z, Hrvoje T, Sun L, Chan W
(2010b) Crustal structure beneath China from receiver function
analysis. Chin J Geophys 115:B03307
Gao Y, Zhou HL (1998) Study of transition zone in upper mantle
from digital seismic data. Adv Earth Sci 13(1):34–37 (in Chinese
with English Abstract)
Gao S, Rudnick RL, Carlson RW, McDonough WF, Liu YS (2002)
Re-Os evidence for replacement of ancient mantle lithosphere
beneath the North China Craton. Earth Planet Sci Lett 198:
307–322
Gao Y, Suetsugu D, Fukao Y, Obayashi M, Shi Y, Liu R (2010)
Seismic discontinuities in the mantle transition zone and at the
top of the lower mantle beneath eastern China and Korea:
influence of the stagnant Pacific slab. Phys Earth Planet Inter
183(1):288–295
Ge C, Zheng Y, Xiong X (2011) Study of crustal thickness and
Poisson ratio of the North China Craton. Chin J Geophys
54(10):2538–2548 (in Chinese with English Abstract)
Ji SC, Wang Q, Salisbury MH (2009) Composition and tectonic
evolution of the Chinese continental crust constrained by
Poisson’s ratio. Tectonophysics 463(1):15–30
Jia SX, Qi C, Wang FY, Chen QF, Zhang XK, Chen Y (2005) Three
dimensional crustal gridded structure of the Capital area. Chin J
Geophys 48(6):1316–1324 (in Chinese with English Abstract)
Kusky TM, Li JH (2003) Paleoproterozoic tectonic evolution of the
North China Craton. J Asian Earth Sci 22(4):383–397
596 Earthq Sci (2014) 27(6):589–597
123
Page 9
Li YH, Tian XB, Wu QJ, Zeng RS, Zhang RQ (2006a) The poisson
ratio and crustal structure of the central Qinghai-Xizang inferred
from INDEPTH-III teleseismic waveforms: Geological and
geophysical implications. Chin J Geophys 49(4):1037–1104 (in
Chinese with English Abstract)
Li YH, Wu QJ, An ZH, Tian XB, Zeng RS, Zhang RQ, Li HG
(2006b) The poisson ratio and crustal structure across the NE
Tibetan Plateau determined from receiver functions. Chin J
Geophys 49(5):1359–1368 (in Chinese with English Abstract)
Li CJ, Xu PF, Sun YJ, Jia JX (2010) The Jinzhong transition belt and
its geological significance by receiver function in Shanxi region.
J Geophys Res 53(5):1143–1148 (in Chinese with English
Abstract)
Li CQ, Shen XZ, Qin MZ (2014) The effect of P wave velocity on the
H-j stacking results of receiver functions. Acta Seismol Sin
36(3):480–490. doi:10.3969/j.issn.0253-3728.2014.03.013 (in
Chinese with English Abstract)
Liu QY, Li SC, Shen Y, Chen JH (1997) Brodband seismic array
study of the crust and upper mantle velocity structure beneath
Yanhuai basin and its neighbouring region. Chin J Geophys
40(6):763–771 (in Chinese with English Abstract)
Liu M, Cui XJ, Liu FT (2004) Cenozoic rifting and volcanism in
eastern China: a mantle dynamic link to the Indo-Asian
collision? Tectonophysics 393(1–4):29–42
Liu QL, Wang CY, Yao ZX, Chang LJ, Lou H (2011) Study on
crustal thickness and velocity ratio in mid-western North China
Craton. Chin J Geophys 54(9):2213–2224 (in Chinese with
English Abstract)
Luo Y, Chong JJ, Ni SD, Chen QF, Chen Y (2008) Moho depth and
sedimentary thickness in Capital region. Chin J Geophys
51(4):1135–1145 (in Chinese with English Abstract)
Owens TJ, Zandt G (1997) Implications of crustal property variations
for models of Tibetan plateau evolution. Nature 387:37–43
Pan S, Niu F (2011) Large contrasts in crustal structure and
composition between the Ordos plateau and the NE Tibetan
plateau from receiver function analysis. Earth Planet Sci Lett
303:291–298. doi:10.1016/j.epsl.2011.01.007
Qiu RZ, Deng JF, Zhou X, Li JF, Xiao QH, Wu ZX, Liu C (2005)
Lithosphere types in North China-Evidences from geology and
geophysics. Sci China (Ser D) 48(11):1809–1827 (in Chinese
with English Abstract)
Sun JM, Xu LL (2007) River Terraces in the Fenwei Graben, Central
China, and the relation with the tectonic history of the India-Asia
collision system during the Quaternary. Quat Sci 7(1):20–26 (in
Chinese with English Abstract)
Tang YC, Feng YG, Chen YS, Zhou SY, Ning JY, Wei SQ, Li P, Yu
CQ, Fan WY, Wang HY (2010) Receiver function analysis at
Shanxi Rift. Chin J Geophys 53(9):2102–2109 (in Chinese with
English Abstract)
Tapponnier P, Molnar P (1977) Active faulting and tectonics in
China. J Geophys Res 82(20):2905–2930
Tian X, Zhang Z (2013) Bulk crustal properties in NE Tibet and their
implications for deformation model. Gondwana Res. doi:10.
1016/j.gr.2012.12.024
Tian XB, Wu QJ, Zhang ZJ, Teng JW, Zeng RS (2005a) Identification
of multiple reflected phases from migration receiver function
profile: An example for the INDEPTH-III passive teleseismic P
waveform data. Geophys Res Lett 32:L08301
Tian XB, Wu QJ, Zhang ZJ, Teng JW, Zeng RS (2005b) Joint
imaging by teleseismic converted and multiple waves and its
application in the INDEPTH-III passive seismic array. Geophys
Res Lett 32:L21315
Tian Y, Zhao DP, Sun RM, Teng JW (2009) Seismic imaging of the
crust and upper mantle beneath the North China Craton. Phys
Earth Planet Inter 172(1):169–182
Tian X, Teng J, Zhang H, Zhang ZJ, Zhang YQ, Yang H (2011)
Structure of crust and upper mantle beneath the Ordos Block and
the Yinshan Mountains revealed by receiver function analysis.
Phys Earth Planet Inter 184:186–193
Wang J, Liu QY, Chen JH, Li SC, Guo B, Li Y (2009) The crustal
thickness and Poisson S ratio beneath the Capital Circle Region.
Chin J Geophys 52(1):57–66 (in Chinese with English Abstract)
Wang CY, Sandvolb E, Zhu L, Lou H, Yao ZX, Luo XH (2014)
Lateral variation of crustal structure in the Ordos block and
surrounding regions, North China, and its tectonic implications.
Earth Planet Sci Lett 387:198–211
Wu QJ, Zeng RS (1998) The crustal structure of Qinghai-Xizang
Plateau inferred from broadband teleseismic waveforms. Chin J
Geophys 41(5):669–679 (in Chinese with English Abstract)
Wu FY, Lin JQ, Wilde SA, Zhang XO, Yang JH (2005) Nature and
significance of the early cretaceous giant igneous event in
eastern China. Earth Planet Sci Lett 233:103–119
Wu Y, Ding ZF, Zhu LP (2011) Crustal structure of the North China
Carton from teleseismic receiver function by the common
conversion Point stacking method. Chin J Geophys 54(10):
2528–2537 (in Chinese with English Abstract)
Xu YG (2001) Thermo-tectonic destruction of the Archean litho-
spheric keel beneath the Sino-Korean Craton in China: evidence,
timing and mechanism. Phys Chem Earth 26:747–757
Xu WW, Zheng TY, Zhao L (2011) Mantle dynamics of the
reactivating North China Craton: Constraints from the topogra-
phies of the 410 and 660-km discontinuities. Sci China (Ser D)
54:881–887. doi:10.1007/s11430-010-4163-0 (in Chinese with
English Abstract)
Zandt G, Ammon CJ (1995) Continental crust composition con-
strained by measurement S of crustal Poisson S ratio. Nature
374:152–154
Zhai MG, Liu WJ (2003) Paleoproterozoic tectonic history of the
North China craton: a review. Precambr Res 122:183–199
Zhang SM, Dou SQ, Yang JC (1997) Characteristics of the Datong
quaternary volcanic cluster. Collect Works Crustal Tecton
Crustal Stress 00:103–111
Zhang YQ, Ma YS, Yang N, Shi W, Dong S (2003) Cenozoic
extensional stress evolution in North China. J Geodyn 36(5):
591–613
Zhang HS, Tian XB, Liu F, Cao JQ, Teng JW (2009) Structure of
crust and mantle beneath the Hubao basin and its adjacentregion. Prog Geophys 24(5):1609–1615 (in Chinese with English
Abstract)
Zhang YY, Gao Y, Shi YT (2013) The Crustal Possion ratio and
thickness beneath Zhangjiakou-Bohai seismic belt and its
vicinity areas. Acta Seismol Sin, submitted
Zhao JR, Zhang XK, Zhang CK, Zhang JS, Liu BF, Pan SZ (2006)
Features of deep crustal structure beneath the Wutai mountain
area of Shanxi province. Chin J Geophys 49(1):123–129 (in
Chinese with English Abstract)
Zheng XF, Yao ZX, Liang JH, Zheng J (2010) The role played and
opportunities provided by IGP DMC of China national seismic
network in Wenchuan. Bull Seismol Soc Am 100(5B):
2866–2872
Zhu L, Kanamori H (2000) Moho depth variation in Southern
California from teleseismic receiver functions. J Geophys Res
105:2969–2980
Zhu RX, Zheng TY (2009) Destruction geodynamics of the North
China Craton and its Paleoproterozoic plate tectonics. Chin Sci
Bull 54:1950–1961. doi:10.1007/s11434-009-0451-5 (in Chinese
with English Abstract)
Earthq Sci (2014) 27(6):589–597 597
123