CSCE555 Bioinformatics CSCE555 Bioinformatics Lecture 9 Gene Finding & Comparative genomics Meeting: MW 4:00PM-5:15PM SWGN2A21 Instructor: Dr. Jianjun Hu Course page: http://www.scigen.org/csce555 University of South Carolina Department of Computer Science and Engineering 2008 www.cse.sc.edu. HAPPY CHINESE NEW YEAR
Transcript
CSCE555 BioinformaticsCSCE555 Bioinformatics
Lecture 9 Gene Finding & Comparative genomics
Meeting: MW 4:00PM-5:15PM SWGN2A21Instructor: Dr. Jianjun HuCourse page: http://www.scigen.org/csce555
University of South CarolinaDepartment of Computer Science and Engineering2008 www.cse.sc.edu.
HAPPY CHINESE NEW YEAR
OutlineOutline
Performance Evaluation of Gene Finding programs
Comparative genomics: ◦What to do◦Tools◦Databases◦Application case
04/20/23 2
Accuracy Measures of Gene-Finding Accuracy Measures of Gene-Finding ProgramsPrograms
Sensitivity vs. Specificity (adapted from Burset&Guigo 1996)
Sensitivity (Sn) Fraction of actual coding regions that are correctly predicted as coding
Specificity (Sp) Fraction of the prediction that is actually correct
Correlation
Coefficient (CC)
Combined measure of Sensitivity & Specificity
Range: -1 (always wrong) +1 (always right)
TP FP TN FN TP FN TN
Actual
Predicted
Coding / No Coding
TNFN
FPTP
Pre
dic
ted
Actual
No
Cod
ing
/ C
odin
g
Test DatasetsTest DatasetsSample Tests reported by
Literature◦Test on the set of 570 vertebrate
gene seqs (Burset&Guigo 1996) as a standard for comparison of gene finding methods.
◦Test on the set of 195 seqs of human, mouse or rat origin (named HMR195) (Rogic 2001).
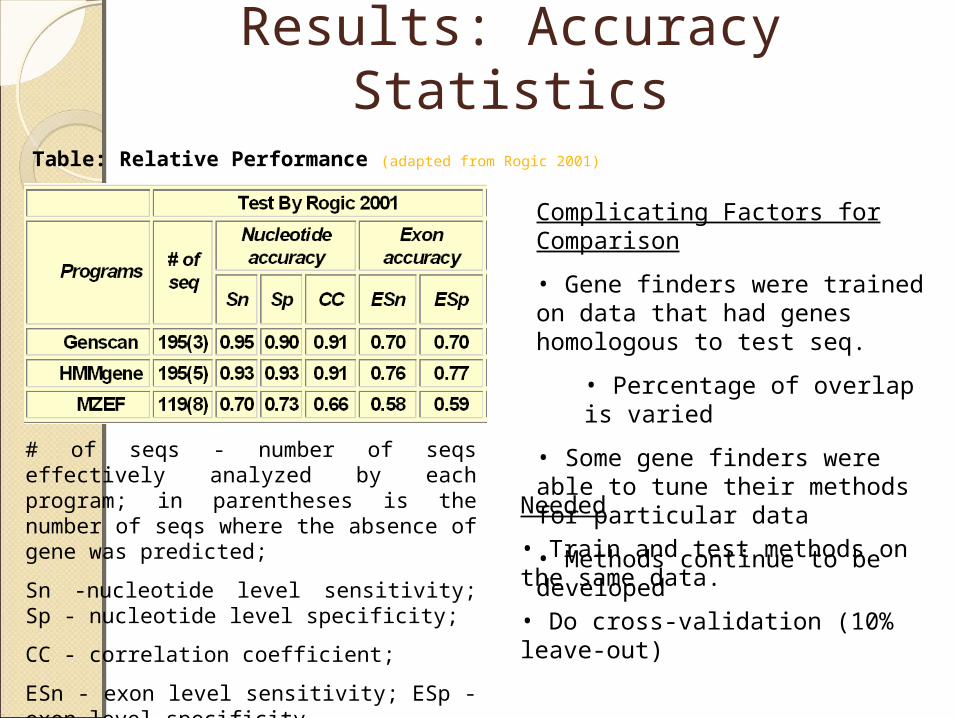
Table: Relative Performance (adapted from Rogic 2001)
# of seqs - number of seqs effectively analyzed by each program; in parentheses is the number of seqs where the absence of gene was predicted;
Sn -nucleotide level sensitivity; Sp - nucleotide level specificity;
• Gene finders were trained on data that had genes homologous to test seq.
• Percentage of overlap is varied
• Some gene finders were able to tune their methods for particular data
• Methods continue to be developedNeeded
• Train and test methods on the same data.
• Do cross-validation (10% leave-out)
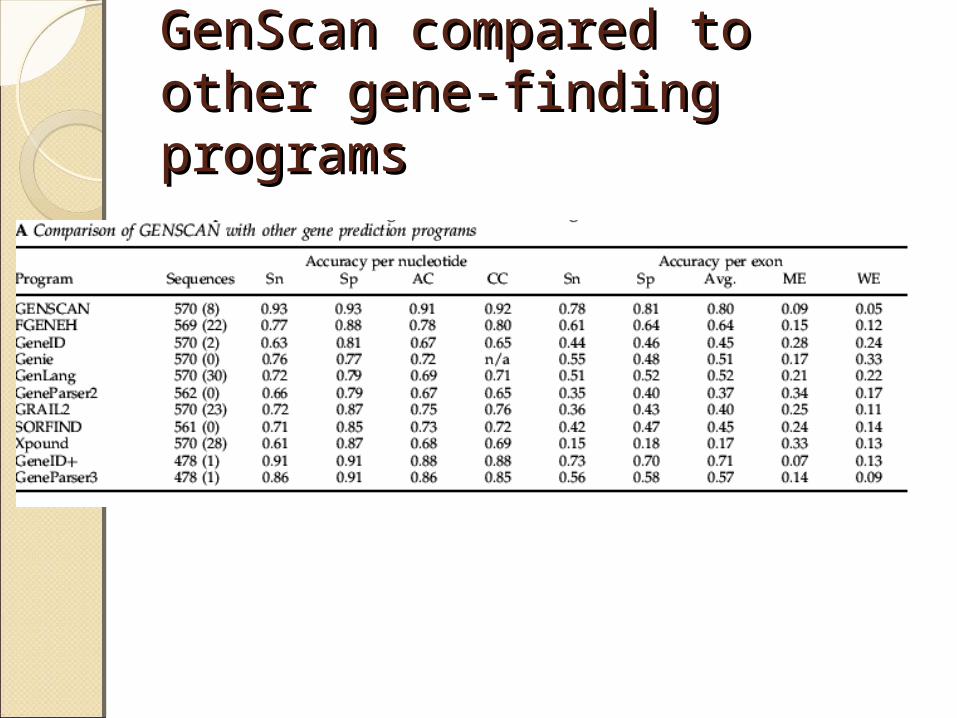
GenScan compared to other GenScan compared to other gene-finding programsgene-finding programs
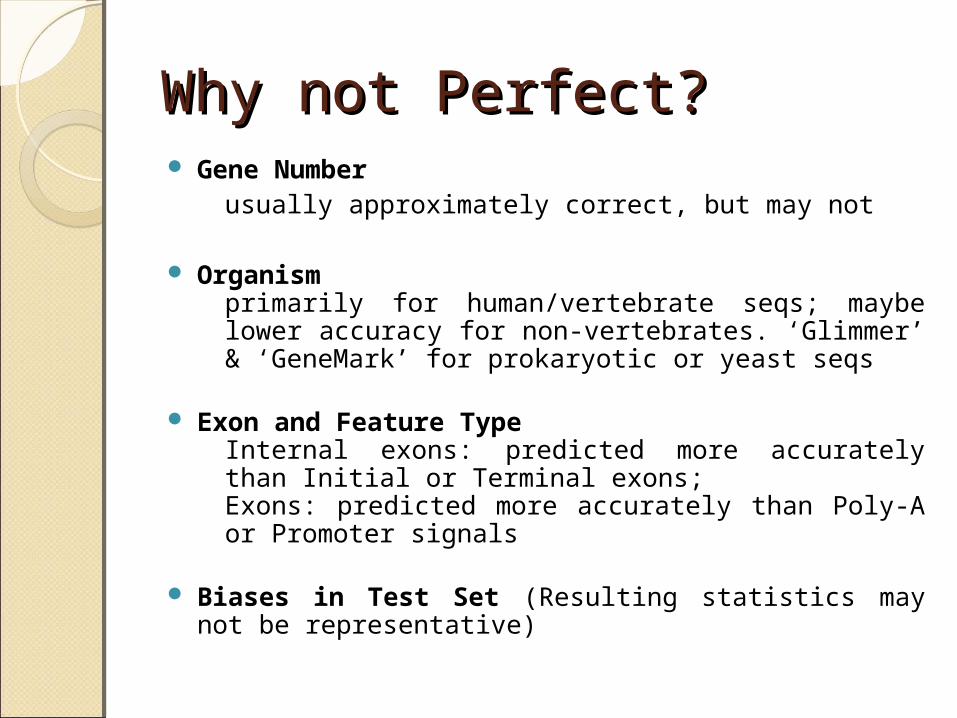
Why not Perfect?Why not Perfect? Gene Number
usually approximately correct, but may not
Organismprimarily for human/vertebrate seqs; maybe lower accuracy for non-vertebrates. ‘Glimmer’ & ‘GeneMark’ for prokaryotic or yeast seqs
Exon and Feature Type
Internal exons: predicted more accurately than Initial or Terminal exons;Exons: predicted more accurately than Poly-A or Promoter signals
Biases in Test Set (Resulting statistics may not be
representative)
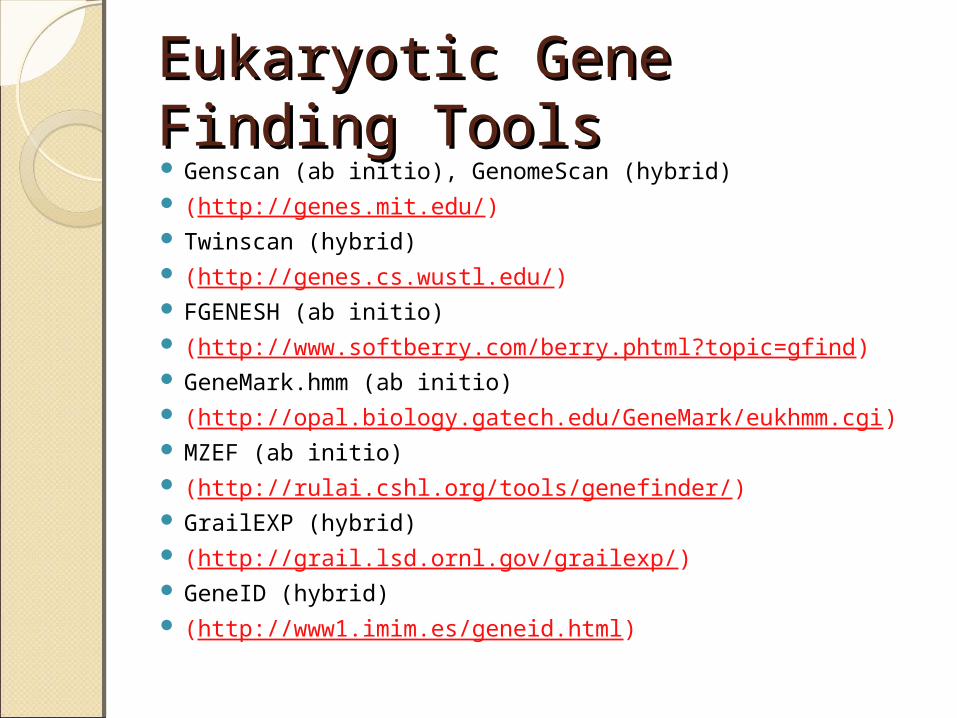
Eukaryotic Gene Finding Eukaryotic Gene Finding ToolsTools Genscan (ab initio), GenomeScan (hybrid) (http://genes.mit.edu/) Twinscan (hybrid) (http://genes.cs.wustl.edu/) FGENESH (ab initio) (http://www.softberry.com/berry.phtml?topic=gfind) GeneMark.hmm (ab initio) (http://opal.biology.gatech.edu/GeneMark/eukhmm.cgi) MZEF (ab initio) (http://rulai.cshl.org/tools/genefinder/) GrailEXP (hybrid) (http://grail.lsd.ornl.gov/grailexp/) GeneID (hybrid) (http://www1.imim.es/geneid.html)
Comparative GenomicsComparative Genomics
Outline for Comparative Outline for Comparative GenomicsGenomicsOverviewWhy do comparative genomic analysis?Assumptions/LimitationsGenome Analysis and Annotation Standard
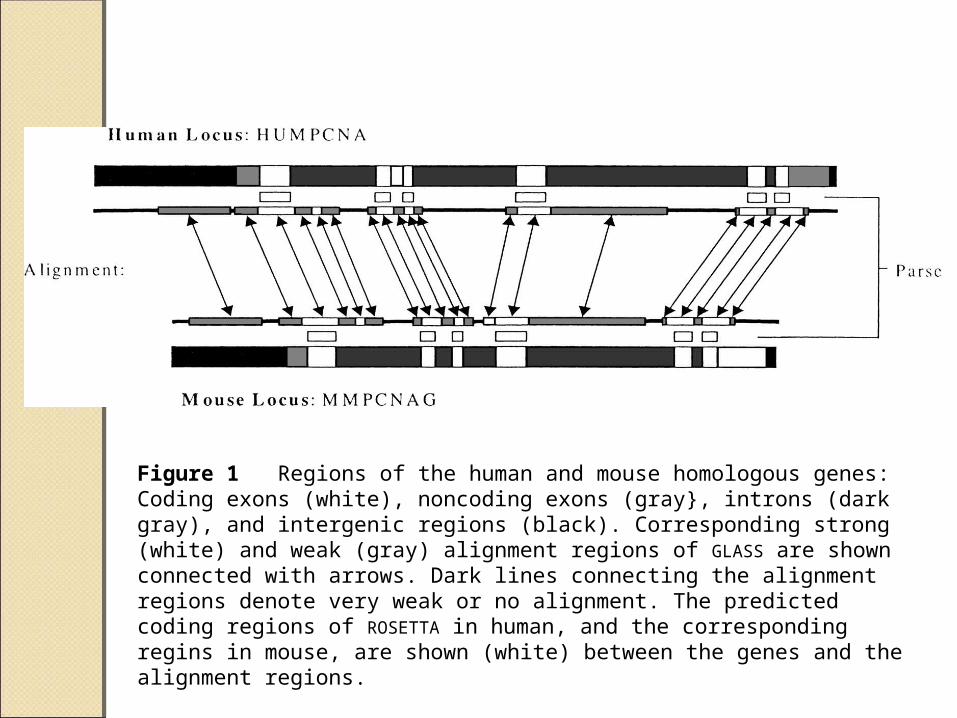
Figure 1 Regions of the human and mouse homologous genes: Coding exons (white), noncoding exons (gray}, introns (dark gray), and intergenic regions (black). Corresponding strong (white) and weak (gray) alignment regions of GLASS are shown connected with arrows. Dark lines connecting the alignment regions denote very weak or no alignment. The predicted coding regions of ROSETTA in human, and the corresponding regins in mouse, are shown (white) between the genes and the alignment regions.
•Most genome will be sequenced and can be sequenced;
few problem are unsolvable.
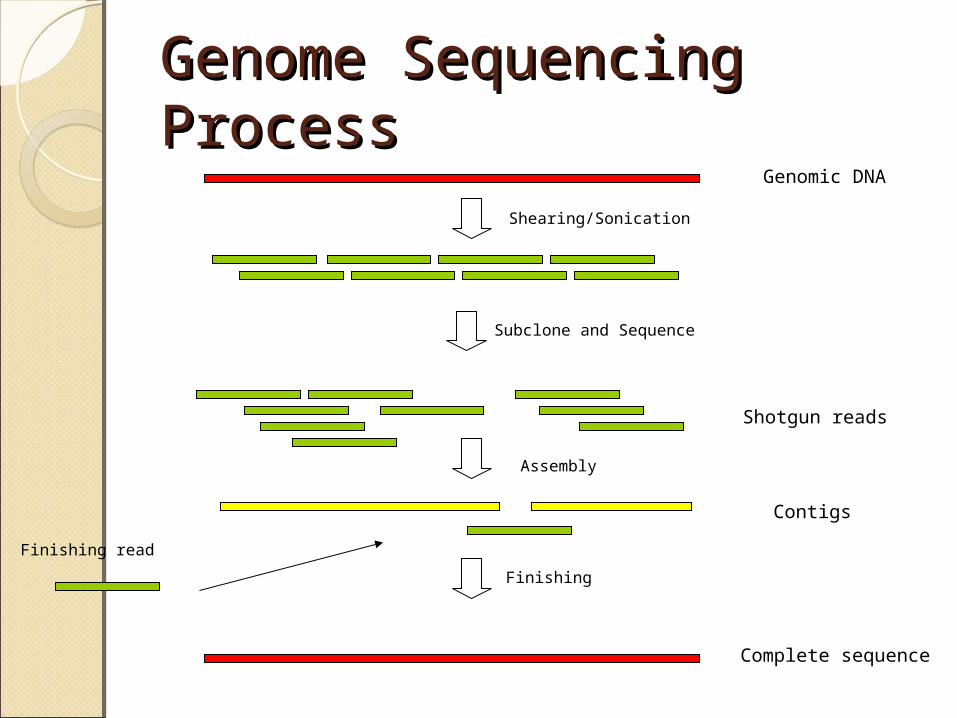
Clone by clone vs whole genome shotgun
•Problem lies in understanding what you have:
•Gene prediction/gene finding
•Annotation
Subcloning; generate small insert libraries
Assembly: Process of taking raw single-pass reads into contiguous consensus sequence (Phred/Phrap)
Assembly
Libraries
Strategy
Sequencing
Closure: Process of ordering and merging consensus sequences into a single contiguous sequence
Closure
Annotation -DNA features (repeats/similarities)-Gene finding-Peptide features-Initial role assignment-Others- regulatory regions
Release Release data to the public e.g. EMBL or GenBank
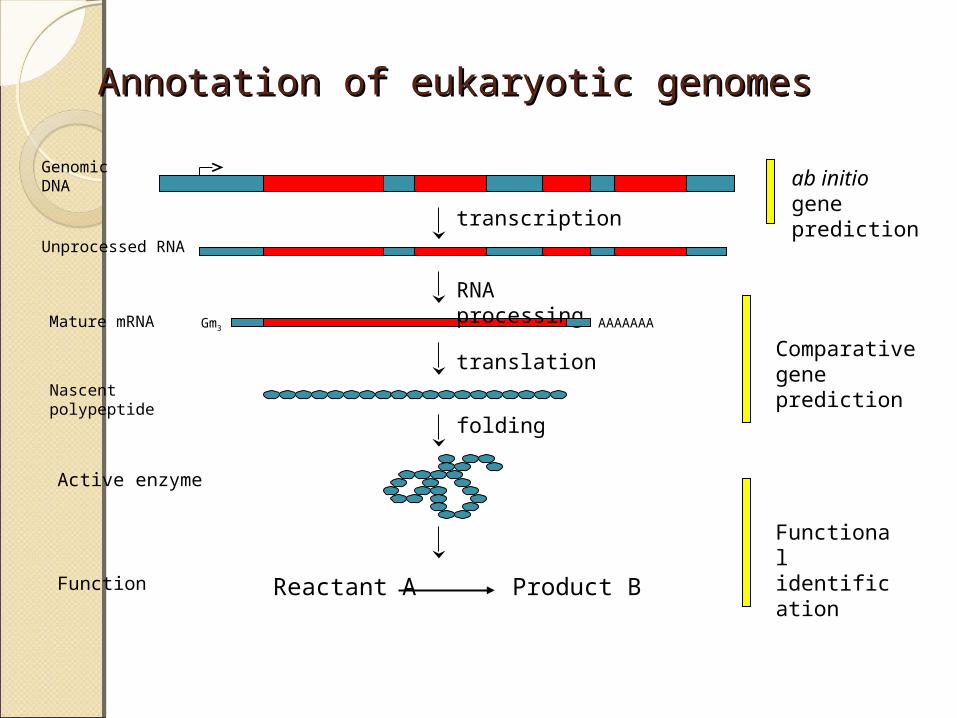
Annotation of eukaryotic genomesAnnotation of eukaryotic genomes
transcription
RNA processing
translation
AAAAAAA
Genomic DNA
Unprocessed RNA
Mature mRNA
Nascent polypeptide
folding
Reactant A Product BFunction
Active enzyme
ab initio gene prediction
Comparative gene prediction
Functional identification
Gm3
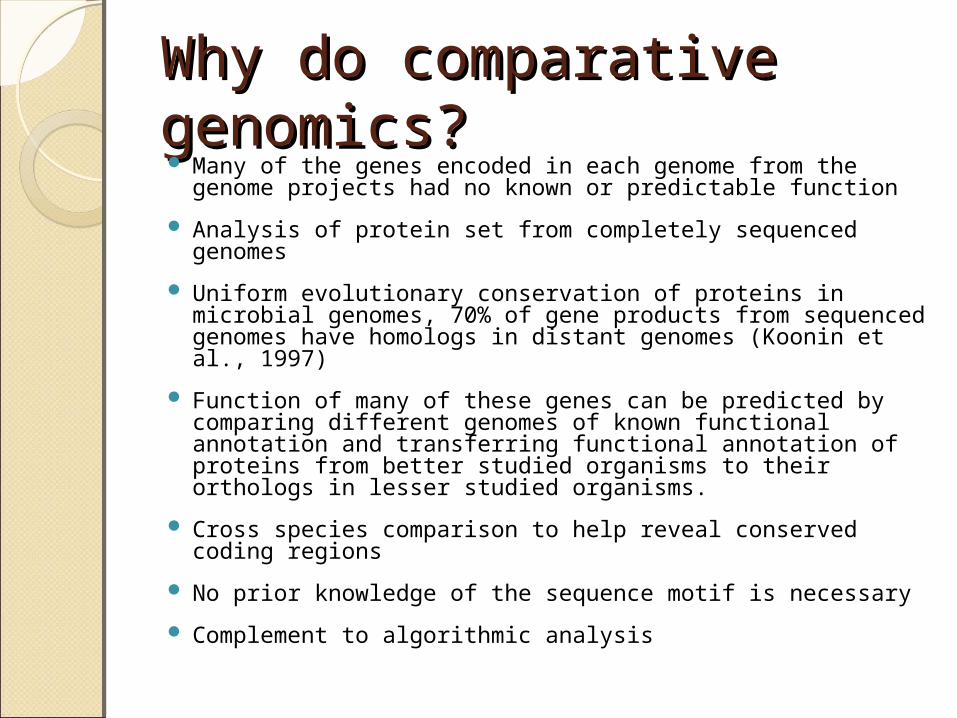
Why do comparative Why do comparative genomics?genomics? Many of the genes encoded in each genome from the
genome projects had no known or predictable function
Analysis of protein set from completely sequenced genomes
Uniform evolutionary conservation of proteins in microbial genomes, 70% of gene products from sequenced genomes have homologs in distant genomes (Koonin et al., 1997)
Function of many of these genes can be predicted by comparing different genomes of known functional annotation and transferring functional annotation of proteins from better studied organisms to their orthologs in lesser studied organisms.
Cross species comparison to help reveal conserved coding regions
No prior knowledge of the sequence motif is necessary
Complement to algorithmic analysis
Assumptions/LimitationAssumptions/LimitationHomologous genes are relatively well
preserved while noncoding regions tend to show varying degrees of conservation. Conserved noncoding regions are believed to be important in regulating gene expression, maintaiing structural organization of the genome and most likely other possible functions.
Cross species comparative genomics is influenced by the evolutionary distance of the compared species.
Genome Analysis and Annotation: General Genome Analysis and Annotation: General ProcedureProcedure
Basic procedure to determine the functional and structural annotation of uncharacterized proteins:
Use a sequence similarity search programs such as BLAST or FASTA to identify all the functional regions in the sequence. If greater sensitivity is required then the Smith-Waterman algorithm based programs are preferred with the trade-off greater analysis time.
Identify functional motifs and structural domains by comparing the protein sequence against PROSITE, BLOCKS, SMART, CDD, or Pfam.
Predict structural features of the protein such as signal peptides, transmembrane segments, coiled-coil regions, and other regions of low sequence complexity
Generate a secondary and tertiary (if possible) structure prediction
Annotation:
◦ Transfer of function information from a well-characterized organism to a lesser studied organism and/or
◦ Use phylogenetic patterns (or profiles) and/or ◦ Use the phylogenetic pattern search tools (e.g. through COGs) to perform a
systematic formal logical operations (AND, OR, NOT) on gene sets -- differential genome display (Huynen et al., 1997).
Problems with existing sequence Problems with existing sequence alignments algorithms for genomic alignments algorithms for genomic analysisanalysis Most algorithms were developed for comparing single
protein sequences or DNA sequences containing a single gene
Most algorithms were based on assigning a score to all the possible alignments (usually by the sum of the similarity/identity values for each aligned residue minus a penalty for the introduction of gaps) and then finding the optimal or near-optimal alignment based on the chosen scoring scheme.
Unfortunately, most of these programs cannot accurately handle long alignments.
Linear-space type of Smith-Waterman variants are too computationally intensive requiring specialized hardware (memory-limited) or very time-consuming. Higher speed vs increased sensitivity.
Genome-size comparative alignment toolsGenome-size comparative alignment tools ASSIRC - Accelerated Search for SImilarity Regions in Chromosomes
◦ ftp://ftp.biologie.ens.fr/pub/molbio/ (Vincens et al. 1998) BLAT –
SSAHASSAHASequence Search and Alignment by Hashing
AlgorithmSoftware tool for very fast matching and
alignment of DNA sequences.Achieves fast search speed by converting
sequence information into a hash table data structure which can then be searched very rapidly for matches
http://www.sanger.ac.uk/Software/analysis/SSAHA/Run from the Unix command lineNeed > 1GB RAM (needs a lot of memory)SSAHA algorithm best for application requiring
exact or “almost exact” matches between two sequences – e.g. SNP detection, fast sequence assembly, ordering and orientation of contigs
Problems with Visualizing GenomesProblems with Visualizing Genomes
Alignment programs output often were visualized by text file, which can be intuitively difficult to interpret when comparing genomes.
Visualization tools needed to handle the complexity and volume of data and present the information in a comprehensive and comprehensible manner to a biologist for interpretation.
Genome Alignment Visualization tools need to provide: ◦ interpretable alignments,
◦ gene prediction and database homologies from different sources
◦ Interactive features: real time capabilities, zooming, searching specific regions of homologies
◦ Represent breaks in synteny
◦ Multiple alignments display
◦ Displaying contigs of unfinished genomes with finished genomes
PipMaker (displays BlastZ alignments)◦ http://bio.cse.psu.edu/pipmaker/ (Schwartz et al. 2000)
Enteric/Menteric/Maj (displays Blastz alignments)◦ http://glovin.cse.psu.edu/enterix/ (Florea et al. 2000; McClelland et al.
2000) Intronerator (displays WABA alignments and ...)
◦ http://www.cse.ucsc.edu/~kent/intronerator/ (Kent & Zahler 2000b) VISTA (Visualization Tool for Alignment) (displays GLASS
alignments)◦ http://www-gsd.lbl.gov/vista/
SynPlot (displays DIALIGN and GLASS alignments)◦ http://www.sanger.ac.uk/Users/igrg/SynPlot/
Artemis Comparison Tool Artemis Comparison Tool (ACT)(ACT)- ACT is a DNA sequence comparison viewer
based on Artemis- Can read complete EMBL and GenBank
entries or sequence in FASTA or raw format- Additional sequence feature can be in EMBL,
GenBank, GFF format- ACT is free software and is distributed under
the GNU Public License- Java based software- Latest release 2.0 better support Eukaryotic
Genome Comparison
http://www.sanger.ac.uk/Software/ACT/
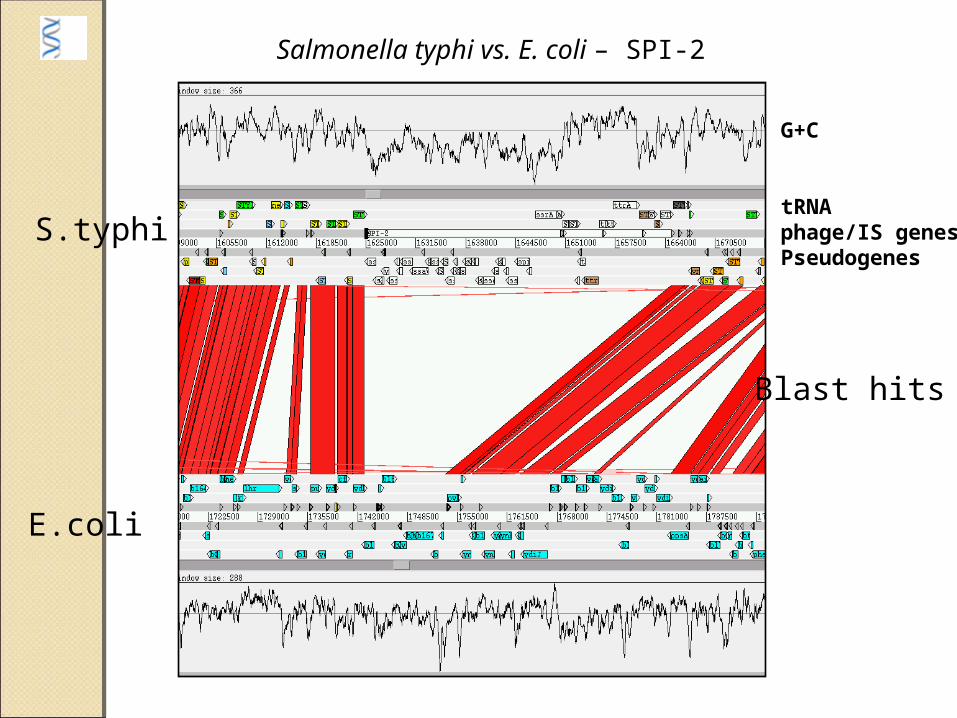
G+C
tRNAphage/IS genesPseudogenes
Salmonella typhi vs. E. coli – SPI-2
Blast hits
S.typhi
E.coli
Neisseria meningitidis - A vs. B comparison - ACT
A case A case Study:Comparison of Study:Comparison of mouse chromosome mouse chromosome 16 and the human 16 and the human genome:genome:
Mural et al., Science, 2002, 296:1661
Celera groupSynteny with human chr.’s
3,8,12,16,21,22 and rat chr.’s 10,11
Q: Why more breakpoints in mouse-human than in mouse-rat?
Q: Why more conserved genes in human than in rat?
•This also can occur between chromosomes•The longer the divergence time between 2 species, the more recombination has occurred•100 million years since human-mouse divergence•40 million years since rat-mouse divergence
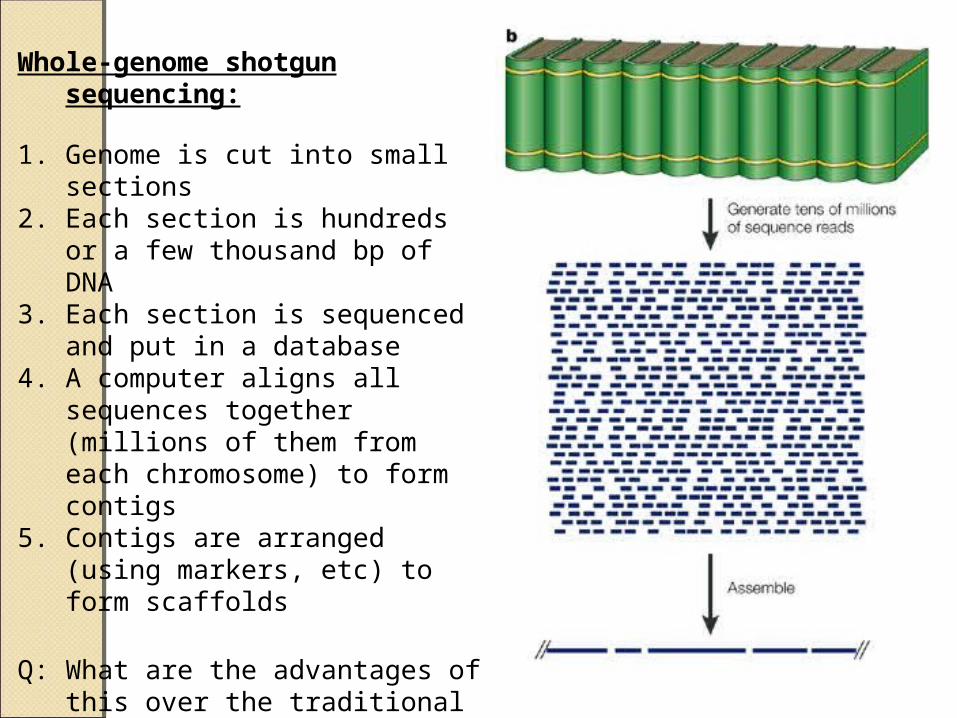
Whole-genome shotgun sequencing:
1. Genome is cut into small sections2. Each section is hundreds or a few
thousand bp of DNA3. Each section is sequenced and put
in a database4. A computer aligns all sequences
together (millions of them from each chromosome) to form contigs
5. Contigs are arranged (using markers, etc) to form scaffolds
Q: What are the advantages of this over the traditional method?
Q: What are the potential sources of error?
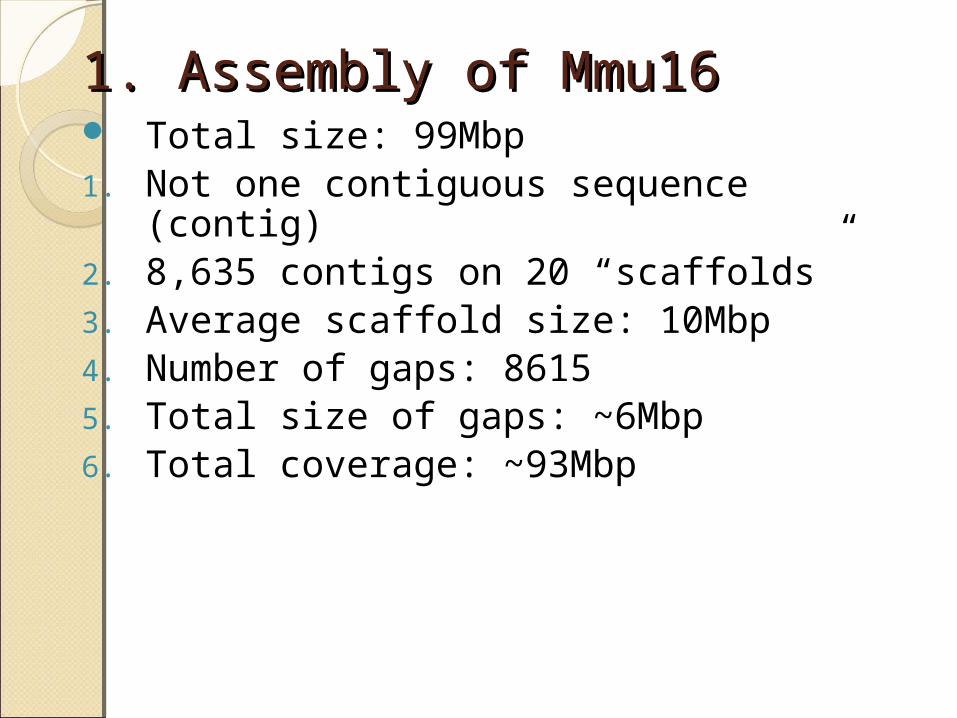
1. Assembly of Mmu161. Assembly of Mmu16 Total size: 99Mbp1. Not one contiguous sequence (contig)2. 8,635 contigs on 20 “scaffolds”3. Average scaffold size: 10Mbp4. Number of gaps: 86155. Total size of gaps: ~6Mbp6. Total coverage: ~93Mbp
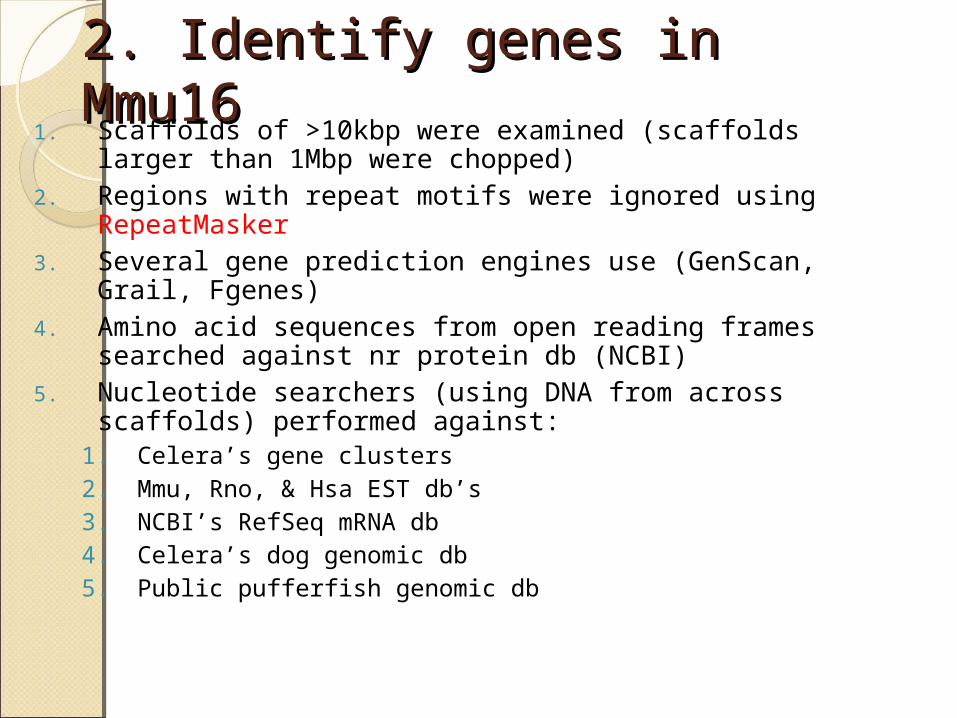
2. Identify genes in Mmu162. Identify genes in Mmu161. Scaffolds of >10kbp were examined (scaffolds larger than
1Mbp were chopped)2. Regions with repeat motifs were ignored using
RepeatMasker3. Several gene prediction engines use (GenScan, Grail,
Fgenes)4. Amino acid sequences from open reading frames searched
against nr protein db (NCBI)5. Nucleotide searchers (using DNA from across scaffolds)
performed against:1. Celera’s gene clusters2. Mmu, Rno, & Hsa EST db’s3. NCBI’s RefSeq mRNA db4. Celera’s dog genomic db5. Public pufferfish genomic db
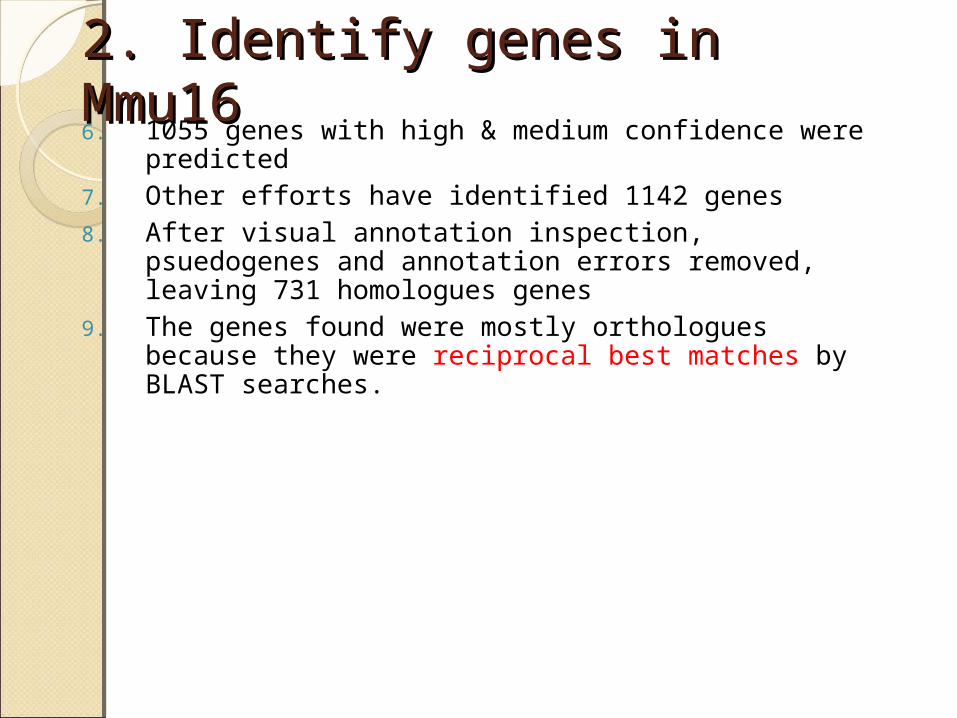
2. Identify genes in Mmu162. Identify genes in Mmu166. 1055 genes with high & medium confidence were
predicted7. Other efforts have identified 1142 genes8. After visual annotation inspection, psuedogenes and