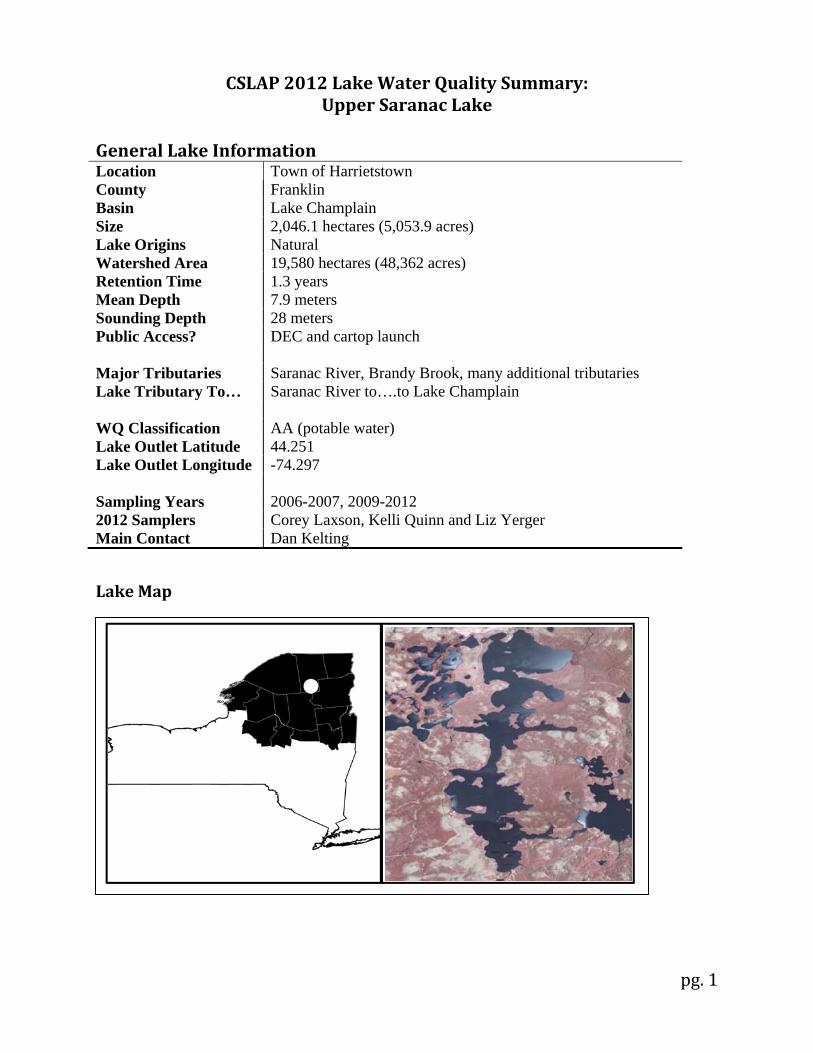
pg. 1 CSLAP 2012 Lake Water Quality Summary: Upper Saranac Lake General Lake Information Location Town of Harrietstown County Franklin Basin Lake Champlain Size 2,046.1 hectares (5,053.9 acres) Lake Origins Natural Watershed Area 19,580 hectares (48,362 acres) Retention Time 1.3 years Mean Depth 7.9 meters Sounding Depth 28 meters Public Access? DEC and cartop launch Major Tributaries Saranac River, Brandy Brook, many additional tributaries Lake Tributary To… Saranac River to….to Lake Champlain WQ Classification AA (potable water) Lake Outlet Latitude 44.251 Lake Outlet Longitude -74.297 Sampling Years 2006-2007, 2009-2012 2012 Samplers Corey Laxson, Kelli Quinn and Liz Yerger Main Contact Dan Kelting Lake Map
Transcript
pg. 1
CSLAP 2012 Lake Water Quality Summary: Upper Saranac Lake
General Lake Information Location Town of Harrietstown County Franklin Basin Lake Champlain Size 2,046.1 hectares (5,053.9 acres) Lake Origins Natural Watershed Area 19,580 hectares (48,362 acres) Retention Time 1.3 years Mean Depth 7.9 meters Sounding Depth 28 meters Public Access? DEC and cartop launch Major Tributaries Saranac River, Brandy Brook, many additional tributaries Lake Tributary To… Saranac River to….to Lake Champlain WQ Classification AA (potable water) Lake Outlet Latitude 44.251 Lake Outlet Longitude -74.297 Sampling Years 2006-2007, 2009-2012 2012 Samplers Corey Laxson, Kelli Quinn and Liz Yerger Main Contact Dan Kelting
Lake Map
pg. 2
Background Upper Saranac Lake is a 5050 acre, class AA lake found in the Town of Harrietstown in Franklin County, in the northern Adirondack region of New York State. It was first sampled as part of CSLAP in 2006. It is one of 16 CSLAP lakes among the more than 220 lakes found in Franklin County, and one of 15 CSLAP lakes among the more than 235 lakes and ponds in the Lake Champlain drainage basin.
Lake Uses Upper Saranac Lake is a Class AA lake; this means that the best intended use for the lake is for potable water use—drinking, contact recreation—swimming and bathing, non-contact recreation—boating and angling, aquatic life, and aesthetics. The lake is used by lake residents and visitors for swimming, boating and other recreation via shoreline properties and several public boat launches. Upper Saranac Lake has been regularly stocked through the state fisheries stocking programs. In a typical year, about 9,000 eight to nine inch brown trout, 12,000 eight to nine inch rainbow trout, and 13,000 seven inch lake trout are stocked by the state. It is not known by the report author if any private stocking has occurred. The DEC Bureau of Fisheries reports that the lake maintains a population of smallmouth bass, northern pike, brown bullhead, brown trout, yellow perch, rainbow trout, rainbow smelt, lake trout, and largemouth bass. General statewide fishing regulations are applicable in Upper Saranac Lake. However, lake trout and trout fishing season is April 1st to October 15th; there are no (minimum) size limits for trout, lake trout must be more than 23 inches in length, and daily takes for each are limited to five fish. Ice fishing is permitted; tip-ups are prohibited. Yellow perch and sunfish can be caught all year, with no size or take limits. Statewide fish consumption advisories apply to Upper Saranac Lake—no site-specific advisories have been issued for the lake.
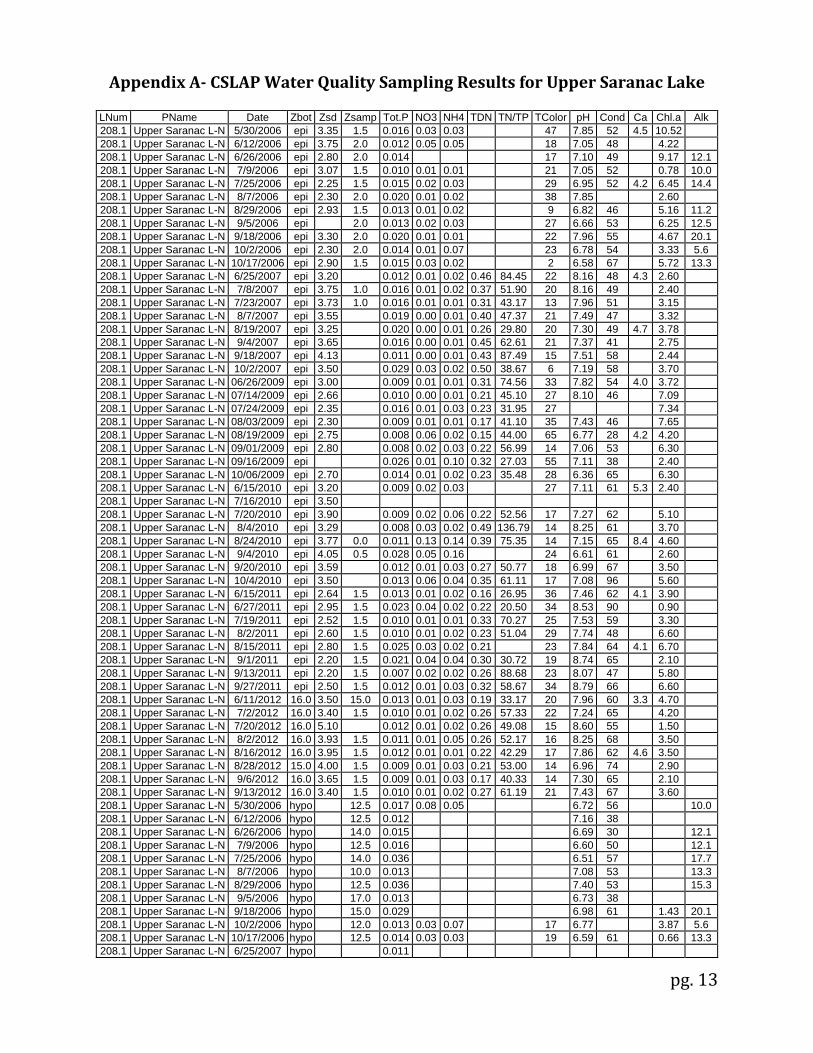
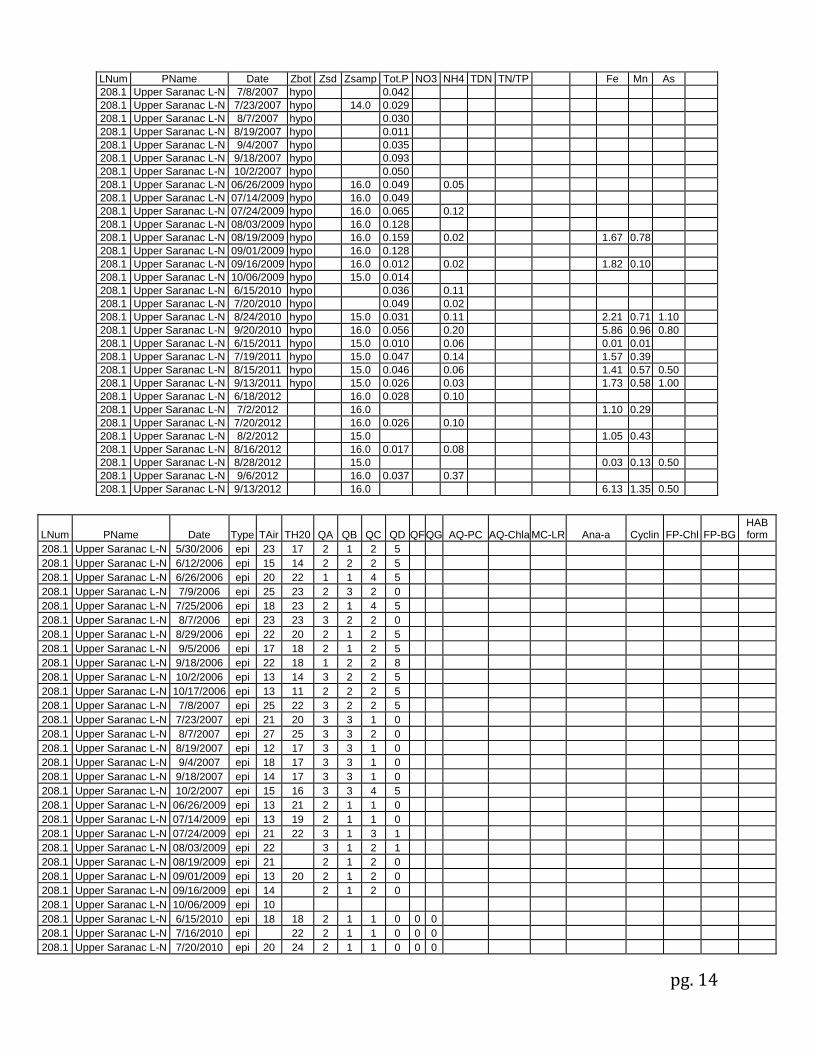
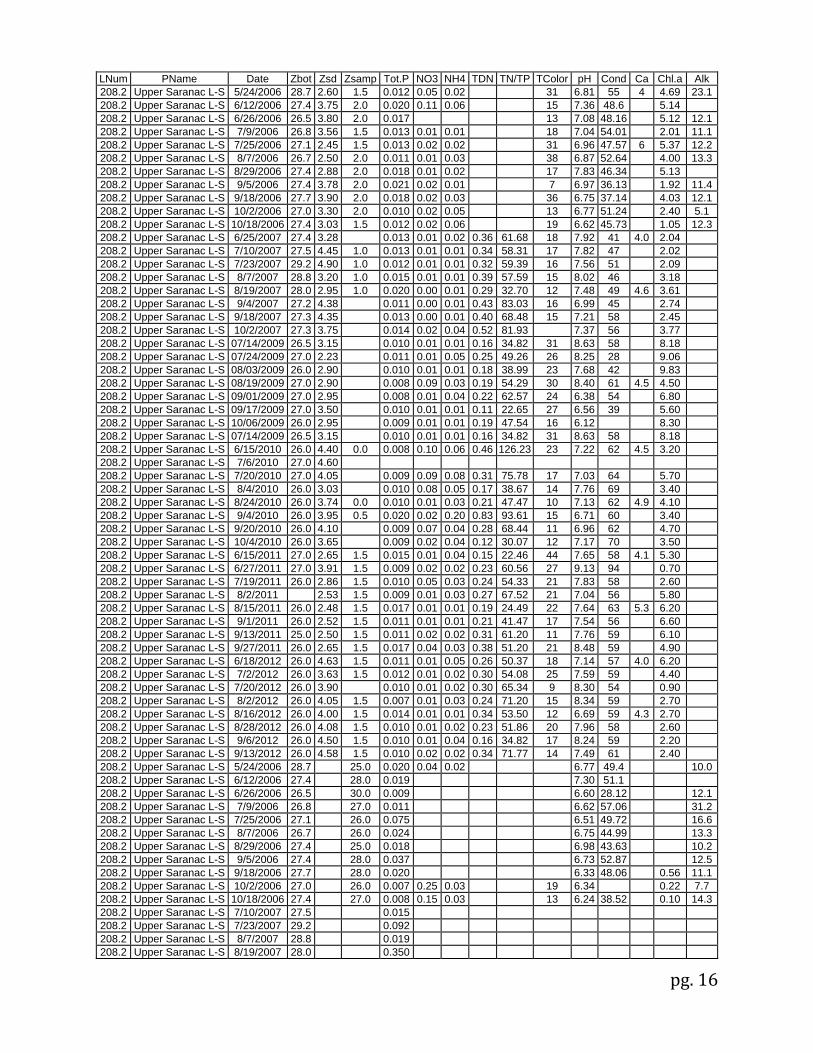
Historical Water Quality Data CSLAP sampling was conducted on Upper Saranac Lake in 2006, 2007, 2009 through 2012. The CSLAP reports for each of the past several years can be found on the NYSFOLA website at http://nysfola.mylaketown.com. The 2011 CSLAP report and scorecards for Upper Saranac Lake can also be found on the NYSDEC web page at http://www.dec.ny.gov/lands/77871.html. Upper Saranac Lake has been sampled as part of a number of previous monitoring programs. An incomplete list includes the 1929 Conservation Department survey of the lake as part of the Lake Champlain Basin Biological Survey, a NYSDOH study of the lake in 1971, DEC surveys of the lake in 1981, 1987, and 1991, studies conducted by Paul Smiths College during much of the 1990s, the Cedar Eden studies of the lake in recent years, including 2005, and the Clean Lakes study of the lake in 1995 and 1996.
Lake Association and Management History Upper Saranac Lake is served by the Upper Saranac Lake Association and the Upper Saranac Lake Foundation. The lake association and foundation have been involved in a variety of lake management actions, including:
• Lake water quality monitoring and evaluation • Septic education and management • Milfoil management in cooperation with the Adirondack Watershed Institute
Much of this work is managed by the Upper Saranac Lake Waterkeeper. The Upper Saranac Lake Association maintains a website at http://www.uppersaranac.com/; the Foundation maintains a website at http://www.usfl.org.
Summary of 2012 CSLAP Sampling Results
Evaluation of 2012 Annual and Monthly Results Relative to 20062011 The summer (mid-June through mid-September) average readings are compared to historical averages for all CSLAP sampling seasons in the “Lake Condition Summary” table, and are compared to individual historical CSLAP sampling seasons in the “Long Term Data Plots –Upper Saranac Lake” section in Appendix C.
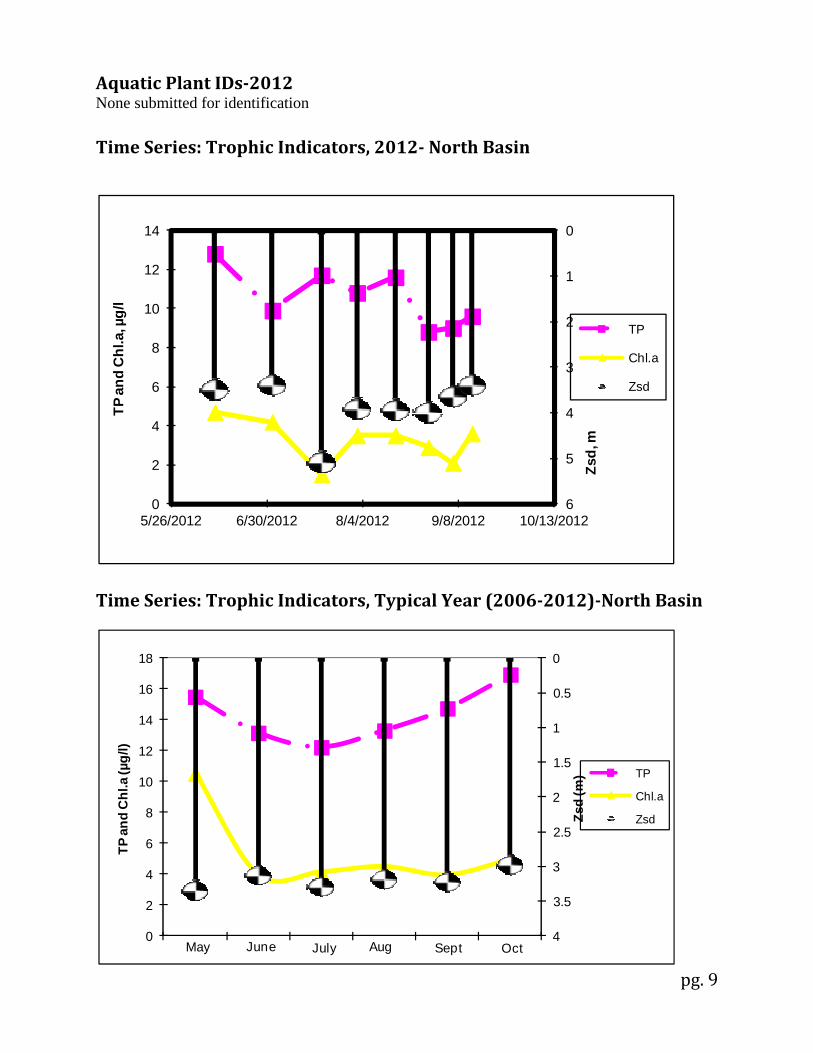
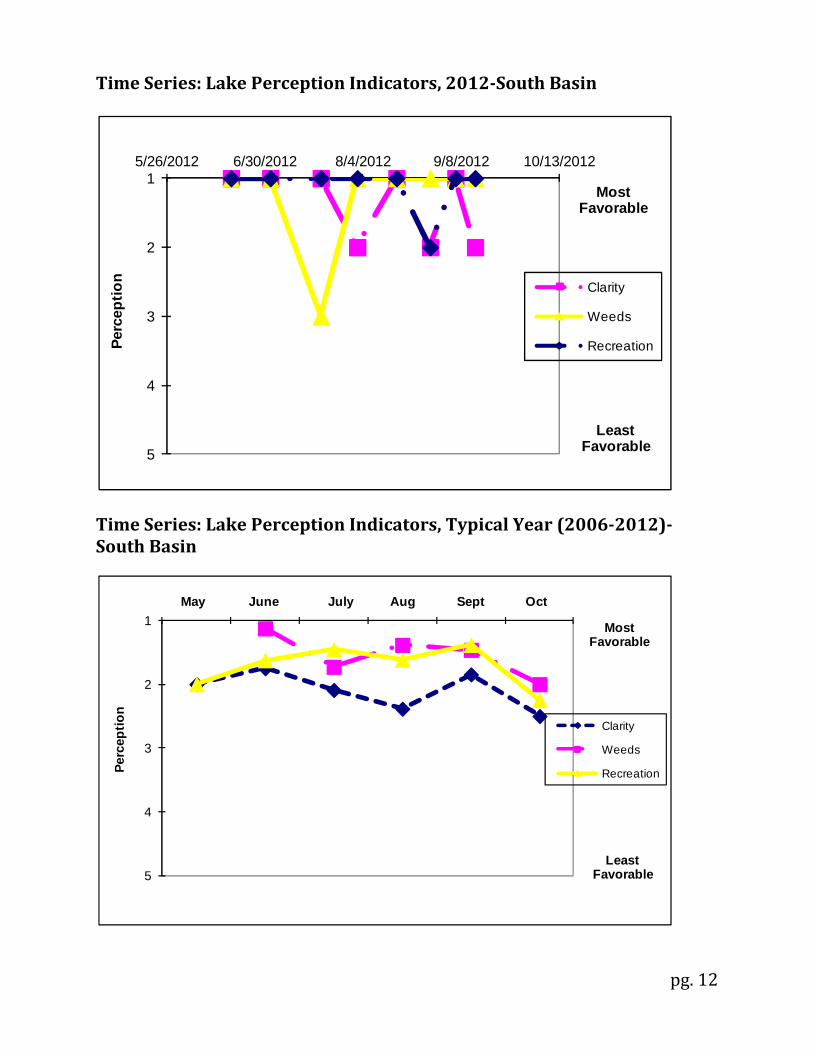
Evaluation of Eutrophication Indicators Water clarity readings were higher than normal in both the north and south basins, particularly in mid summer, consistent with algae (chlorophyll a) levels in both basins that were lower than normal. Phosphorus readings in the north basin were lower than normal; while TP levels in the south basin were close to normal in 2012, south basin TP readings have decreased slightly over the last six years. Lake productivity does not usually exhibit any clear long-term trends, and seasonal trends were not apparent in 2012. The lake continues to be characterized as mesotrophic, based on water clarity, chlorophyll a, and total phosphorus readings (all typical of mesotrophic lakes). The trophic state indices (TSI) evaluation suggests that each of these trophic indicators is “internally consistent”—each of these indicators is in the expected range given the readings of the other indicators in both basins. Overall trophic conditions are summarized on the Lake Scorecard and Lake Condition Summary Table. Lake productivity is slightly lower in the south basin than in the north basin, although trophic conditions in both basins are typical of mesotrophic lakes.
Evaluation of Potable Water Indicators Algae levels are at times be high enough to render the lake susceptible to taste and odor compounds or elevated DBP (disinfection by product) compounds that could affect the potability of the water, although it is not known if this use is impacted by algae. Hypolimnetic phosphorus and ammonia readings in both basins of Upper Saranac Lake are close to those measured at the lake surface. However, deepwater iron and manganese levels are elevated in both basins. This suggests that deepwater intakes may be somewhat compromised for any deep potable water use. Iron readings are higher in the north basin, while manganese levels are higher in the south basin. Potable water conditions, at least as measurable through CSLAP, are summarized in the Lake Scorecard and Lake Condition Summary Table.
Evaluation of Limnological Indicators In the north basin, total nitrogen readings were slightly lower than normal in 2012, and these readings have decreased over the last several years in both basins. Conductivity readings were close to normal in 2012, but have decreased slightly since the late 2000s. In the south basin, NOx readings were lower than normal and pH was higher than normal in 2012, but neither indicator has exhibited any long-term trends. Each of the other limnological indicators (ammonia, color, and calcium) was close to normal in 2012, and none of these other indicators has exhibited any clear long-term trends. Overall limnological conditions for both basins are summarized in the Lake Scorecard and Lake Condition Summary Table. Limnological conditions were mostly comparable in both basins of the lake.
Evaluation of Biological Condition Macrophyte communities in the lake were evaluated through the federal Clean Lakes study of the lake. These plant surveys found a very high plant diversity, with at least forty plant species, including two protected plant species (Myriophyllum farwellii, Farwell’s milfoil, and Potamogeton alpinus, northern pondweed) and one invasive exotic plant species (Myriophyllum spicatum, Eurasian watermilfoil). The modified floristic quality index (FQI) indicates that the quality of the aquatic plant community is “excellent.” The fish community in the lake is comprised of a mix of coldwater (at least three species), coolwater (at least two species) and warmwater (at least three species) fish. This indicates that the lake supports a two story fishery. Phytoplankton, zooplankton and macroinvertebrate surveys have not been conducted through CSLAP at Upper Saranac Lake. The fluoroprobe screening samples analyzed by SUNY ESF in 2012 showed relatively low overall algae levels and low levels of blue green algae, although algae levels have been elevated in some previous years. Biological conditions in the lake are summarized in the Lake Scorecard and Lake Condition Summary Table.
Evaluation of Lake Perception Water quality assessments in both basins were more favorable than normal in 2012, consistent with the higher water transparency readings. Recreational assessments in both basins were close to normal in 2012, consistent with the lack of significant change in aquatic plant coverage. However, recreational assessments in both basins have improved slightly over the last six years. Lake perception does not normally exhibit any clear seasonal trends, despite a slight seasonal increase in plant coverage, and no seasonal differences were apparent in 2012 at either site. Overall lake perception is summarized on the Lake Scorecard and Lake Condition Summary Table. Lake perception is comparable at both sampling sites, despite slightly lower lake productivity in the south basin.
Evaluation of Local Climate Change Water and air temperature readings in the summer index period were higher than normal in 2011 and 2012 at both sampling sites, although no long-term trends in these temperatures have been apparent. Additional data may help to determine if air and water temperature readings can be used to evaluate local climate change in the lake.
pg. 5
Evaluation of Algal Toxins Algal toxin levels can vary significantly within blooms and from shoreline to lake, and the absence of toxins in a sample does not indicate safe swimming conditions. Phycocyanin readings are usually below the levels indicating susceptibility for harmful algal blooms (HABs), consistent with the fluoroprobe screening samples analyzed in 2012 (indicating relatively low blue green algae levels in the open water and in the shoreline bloom sample from the south basin). The limited open water toxins data indicate microcystin readings well below the thresholds associated with safe swimming. Anatoxin-a was measurable (but very low) in a single sample in the north basin in 2012, but no other measurable levels were reported, suggesting this may not have been an accurate result.
pg. 6
Lake Condition SummaryNorth Basin Category Indicator Min 06‐12
Avg Max 2012
Avg Classification 2012 Change? Long‐term Change?
Eutrophication Indicators
Water Clarity 2.20 3.19 5.10 3.87 Mesotrophic Higher Than Normal No Change
Chlorophyll a 0.78 4.35 10.52 3.25 Mesotrophic Lower Than Normal No Change
Total Phosphorus 0.007 0.014 0.029 0.011 Mesotrophic Lower Than Normal No Change
Potable Water Indicators
Hypolimnetic Ammonia 0.02 0.09 0.37 0.16 Close to Surface NH4 Readings
Shoreline Anatoxin a No shoreline bloom anatoxin data
Not known Not known
pg. 8
Evaluation of Lake Condition Impacts to Lake Uses The 2009 NYSDEC Priority Waterbody Listings (PWL) for the Lake Champlain drainage basin indicated that aquatic life is stressed and recreation is threatened in Upper Saranac Lake due low deepwater oxygen readings and the presence of Eurasian watermilfoil. The PWL listing for Upper Saranac Lake is shown in Appendix C.
Potable Water (Drinking Water) The CSLAP dataset at Upper Saranac Lake, including water chemistry data, physical measurements, and volunteer samplers’ perception data, is inadequate to evaluate the use of the lake for potable water. The limited data indicate that this use may be impaired by excessive algae (due to DBP production from excessive organic matter), although additional data may help to determine if recent lower algae levels will reduce this impact. These uses may also be threatened for potable water due to elevated iron and manganese levels.
Contact Recreation (Swimming) The CSLAP dataset at Upper Saranac Lake, including water chemistry data, physical measurements, and volunteer samplers’ perception data, suggests that swimming and contact recreation may be stressed by excessive nutrients and reduced water clarity, particularly in the north basin, although additional information about bacterial levels is needed to evaluate the safety of the water for swimming.
NonContact Recreation (Boating and Fishing) The CSLAP dataset on Upper Saranac Lake, including water chemistry data, physical measurements, and volunteer samplers’ perception data, suggest that non-contact recreation should be fully supported, although these uses may be threatened by the presence of Eurasian watermilfoil (particularly if active management of the milfoil beds is curtailed).
Aquatic Life The CSLAP dataset on Upper Saranac Lake, including water chemistry data, physical measurements, and volunteer samplers’ perception data, suggest that aquatic life may be threatened by deepwater anoxia and the presence of exotic plants. Additional data are needed to evaluate the food and habitat conditions for aquatic organisms in the lake.
Aesthetics The CSLAP dataset on Upper Saranac Lake, including water chemistry data, physical measurements, and volunteer samplers’ perception data, suggest that aesthetics should be fully supported.
Fish Consumption There are no fish consumption advisories posted for Upper Saranac Lake.
Additional Comments and Recommendations It is not known if occasionally elevated algae levels affect potable water use of the lake—this may become apparent with additional data or local reports. Lake residents are advised to report any shoreline algae blooms, and lake residents and their pets should avoid direct exposure to shoreline blooms or discolored water.
pg. 9
Aquatic Plant IDs2012 None submitted for identification
Time Series: Trophic Indicators, 2012 North Basin
Time Series: Trophic Indicators, Typical Year (20062012)North Basin
0
1
2
3
4
5
60
2
4
6
8
10
12
14
5/26/2012 6/30/2012 8/4/2012 9/8/2012 10/13/2012
Zsd,
m
TP a
nd C
hl.a
, µg/
l
TP
Chl.a
Zsd
0
0.5
1
1.5
2
2.5
3
3.5
40
2
4
6
8
10
12
14
16
18
Zsd
(m)
TP a
nd C
hl.a
(µg/
l)
TP
Chl.a
Zsd
June July Aug Sept OctMay
pg. 10
Time Series: Trophic Indicators, 2012 South Basin
Time Series: Trophic Indicators, Typical Year (20062012) South Basin
0
1
2
3
4
50
2
4
6
8
10
12
14
16
5/26/2012 6/30/2012 8/4/2012 9/8/2012 10/13/2012
Zsd,
m
TP a
nd C
hl.a
, µg/
l
TP
Chl.a
Zsd
0
0.5
1
1.5
2
2.5
3
3.5
40
2
4
6
8
10
12
14Zs
d (m
)
TP a
nd C
hl.a
(µg/
l)
TP
Chl.a
Zsd
June July Aug Sept OctMay
pg. 11
Time Series: Lake Perception Indicators, 2012North Basin
Time Series: Lake Perception Indicators, Typical Year (20062012)North Basin
1
2
3
4
5
5/26/2012 6/30/2012 8/4/2012 9/8/2012 10/13/2012
Perc
eptio
n
Clarity
Weeds
Recreation
Most Favorable
Least Favorable
1
2
3
4
5
Clarity
Weeds
Recreation
May June July Aug Sept Oct
Most Favorable
Least Favorable
Perc
eptio
n
pg. 12
Time Series: Lake Perception Indicators, 2012South Basin
Time Series: Lake Perception Indicators, Typical Year (20062012)South Basin
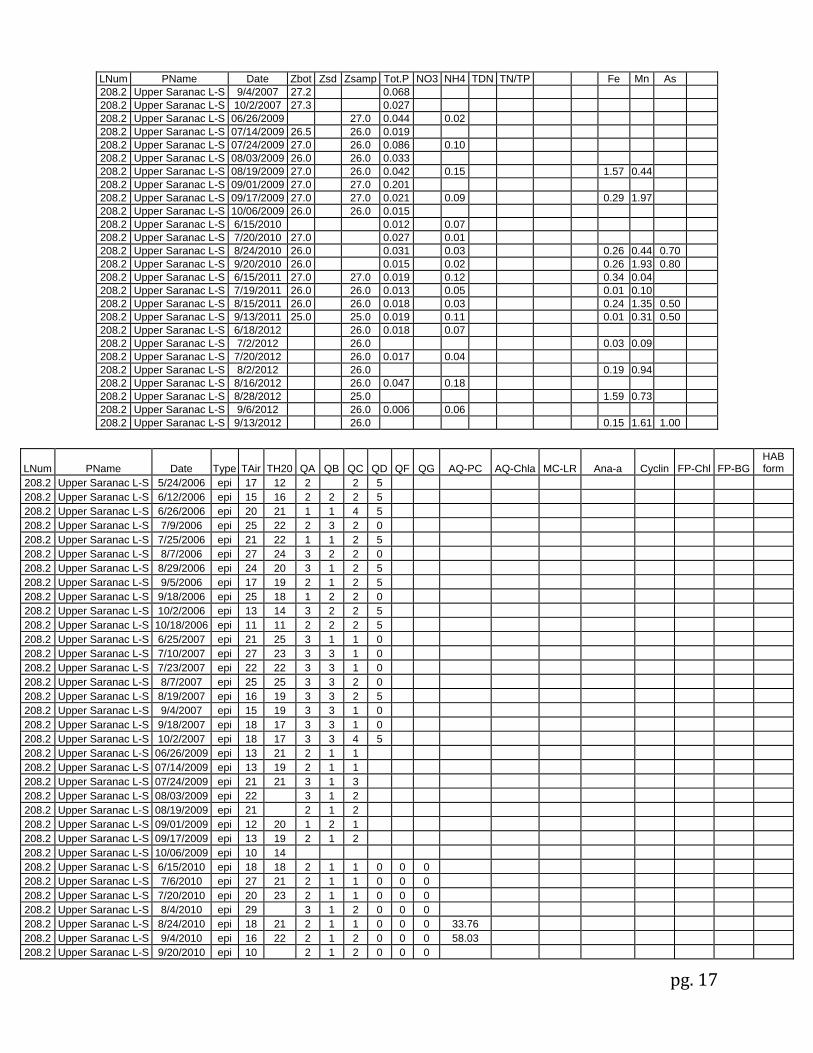
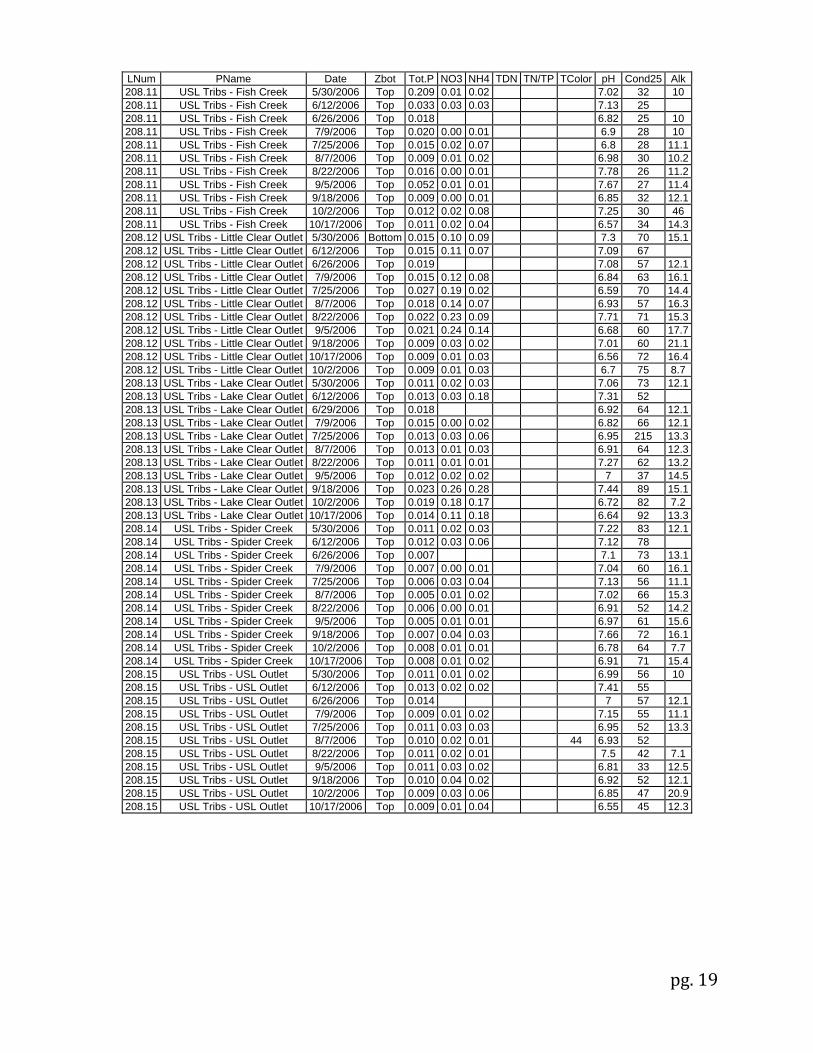
LNum PName Date Zbot Tot.P NO3 NH4 TDN TN/TP TColor pH Cond25 Alk208.11 USL Tribs - Fish Creek 5/30/2006 Top 0.209 0.01 0.02 7.02 32 10 208.11 USL Tribs - Fish Creek 6/12/2006 Top 0.033 0.03 0.03 7.13 25 208.11 USL Tribs - Fish Creek 6/26/2006 Top 0.018 6.82 25 10 208.11 USL Tribs - Fish Creek 7/9/2006 Top 0.020 0.00 0.01 6.9 28 10 208.11 USL Tribs - Fish Creek 7/25/2006 Top 0.015 0.02 0.07 6.8 28 11.1208.11 USL Tribs - Fish Creek 8/7/2006 Top 0.009 0.01 0.02 6.98 30 10.2208.11 USL Tribs - Fish Creek 8/22/2006 Top 0.016 0.00 0.01 7.78 26 11.2208.11 USL Tribs - Fish Creek 9/5/2006 Top 0.052 0.01 0.01 7.67 27 11.4208.11 USL Tribs - Fish Creek 9/18/2006 Top 0.009 0.00 0.01 6.85 32 12.1208.11 USL Tribs - Fish Creek 10/2/2006 Top 0.012 0.02 0.08 7.25 30 46 208.11 USL Tribs - Fish Creek 10/17/2006 Top 0.011 0.02 0.04 6.57 34 14.3208.12 USL Tribs - Little Clear Outlet 5/30/2006 Bottom 0.015 0.10 0.09 7.3 70 15.1208.12 USL Tribs - Little Clear Outlet 6/12/2006 Top 0.015 0.11 0.07 7.09 67 208.12 USL Tribs - Little Clear Outlet 6/26/2006 Top 0.019 7.08 57 12.1208.12 USL Tribs - Little Clear Outlet 7/9/2006 Top 0.015 0.12 0.08 6.84 63 16.1208.12 USL Tribs - Little Clear Outlet 7/25/2006 Top 0.027 0.19 0.02 6.59 70 14.4208.12 USL Tribs - Little Clear Outlet 8/7/2006 Top 0.018 0.14 0.07 6.93 57 16.3208.12 USL Tribs - Little Clear Outlet 8/22/2006 Top 0.022 0.23 0.09 7.71 71 15.3208.12 USL Tribs - Little Clear Outlet 9/5/2006 Top 0.021 0.24 0.14 6.68 60 17.7208.12 USL Tribs - Little Clear Outlet 9/18/2006 Top 0.009 0.03 0.02 7.01 60 21.1208.12 USL Tribs - Little Clear Outlet 10/17/2006 Top 0.009 0.01 0.03 6.56 72 16.4208.12 USL Tribs - Little Clear Outlet 10/2/2006 Top 0.009 0.01 0.03 6.7 75 8.7208.13 USL Tribs - Lake Clear Outlet 5/30/2006 Top 0.011 0.02 0.03 7.06 73 12.1208.13 USL Tribs - Lake Clear Outlet 6/12/2006 Top 0.013 0.03 0.18 7.31 52 208.13 USL Tribs - Lake Clear Outlet 6/29/2006 Top 0.018 6.92 64 12.1208.13 USL Tribs - Lake Clear Outlet 7/9/2006 Top 0.015 0.00 0.02 6.82 66 12.1208.13 USL Tribs - Lake Clear Outlet 7/25/2006 Top 0.013 0.03 0.06 6.95 215 13.3208.13 USL Tribs - Lake Clear Outlet 8/7/2006 Top 0.013 0.01 0.03 6.91 64 12.3208.13 USL Tribs - Lake Clear Outlet 8/22/2006 Top 0.011 0.01 0.01 7.27 62 13.2208.13 USL Tribs - Lake Clear Outlet 9/5/2006 Top 0.012 0.02 0.02 7 37 14.5208.13 USL Tribs - Lake Clear Outlet 9/18/2006 Top 0.023 0.26 0.28 7.44 89 15.1208.13 USL Tribs - Lake Clear Outlet 10/2/2006 Top 0.019 0.18 0.17 6.72 82 7.2208.13 USL Tribs - Lake Clear Outlet 10/17/2006 Top 0.014 0.11 0.18 6.64 92 13.3208.14 USL Tribs - Spider Creek 5/30/2006 Top 0.011 0.02 0.03 7.22 83 12.1208.14 USL Tribs - Spider Creek 6/12/2006 Top 0.012 0.03 0.06 7.12 78 208.14 USL Tribs - Spider Creek 6/26/2006 Top 0.007 7.1 73 13.1208.14 USL Tribs - Spider Creek 7/9/2006 Top 0.007 0.00 0.01 7.04 60 16.1208.14 USL Tribs - Spider Creek 7/25/2006 Top 0.006 0.03 0.04 7.13 56 11.1208.14 USL Tribs - Spider Creek 8/7/2006 Top 0.005 0.01 0.02 7.02 66 15.3208.14 USL Tribs - Spider Creek 8/22/2006 Top 0.006 0.00 0.01 6.91 52 14.2208.14 USL Tribs - Spider Creek 9/5/2006 Top 0.005 0.01 0.01 6.97 61 15.6208.14 USL Tribs - Spider Creek 9/18/2006 Top 0.007 0.04 0.03 7.66 72 16.1208.14 USL Tribs - Spider Creek 10/2/2006 Top 0.008 0.01 0.01 6.78 64 7.7208.14 USL Tribs - Spider Creek 10/17/2006 Top 0.008 0.01 0.02 6.91 71 15.4208.15 USL Tribs - USL Outlet 5/30/2006 Top 0.011 0.01 0.02 6.99 56 10 208.15 USL Tribs - USL Outlet 6/12/2006 Top 0.013 0.02 0.02 7.41 55 208.15 USL Tribs - USL Outlet 6/26/2006 Top 0.014 7 57 12.1208.15 USL Tribs - USL Outlet 7/9/2006 Top 0.009 0.01 0.02 7.15 55 11.1208.15 USL Tribs - USL Outlet 7/25/2006 Top 0.011 0.03 0.03 6.95 52 13.3208.15 USL Tribs - USL Outlet 8/7/2006 Top 0.010 0.02 0.01 44 6.93 52 208.15 USL Tribs - USL Outlet 8/22/2006 Top 0.011 0.02 0.01 7.5 42 7.1208.15 USL Tribs - USL Outlet 9/5/2006 Top 0.011 0.03 0.02 6.81 33 12.5208.15 USL Tribs - USL Outlet 9/18/2006 Top 0.010 0.04 0.02 6.92 52 12.1208.15 USL Tribs - USL Outlet 10/2/2006 Top 0.009 0.03 0.06 6.85 47 20.9208.15 USL Tribs - USL Outlet 10/17/2006 Top 0.009 0.01 0.04 6.55 45 12.3
pg. 20
Legend Information Indicator Description Detection
Limit Standard (S) / Criteria (C)
General Information Lnum lake number (unique to CSLAP) Lname name of lake (as it appears in the Gazetteer of NYS Lakes) Date sampling date
Field Parameters Zbot lake depth at sampling point, meters (m) Zsd Secchi disk transparency or clarity 0.1m 1.2m ( C) Zsamp water sample depth (m) (epi = epilimnion or surface; bot = bottom) 0.1m none Tair air temperature ( C) ‐10C none TH20 water temperature ( C) ‐10C none
Lake Assessment QA water quality assessment; 1 = crystal clear, 2 = not quite crystal clear, 3 =
definite algae greenness, 4 = high algae levels, 5 = severely high algae levels
QB aquatic plant assessment; 1 = no plants visible, 2 = plants below surface, 3 = plants at surface, 4 = plants dense at surface, 5 = surface plant coverage
QC recreational assessment; 1 = could not be nicer, 2 = excellent, 3 = slightly impaired, 4 = substantially impaired, 5 = lake not usable
QD reasons for recreational assessment; 1 = poor water clarity, 2 = excessive weeds, 3 = too much algae, 4 = lake looks bad, 5 = poor weather, 6 = litter/surface debris, 7 = too many lake users, 8 = other
QF, QG Health and safety issues today (QF) and past week (QG); 0 = none, 1 = taste/odor, 2 = GI illness humans/animals, 3 = swimmers itch, 4 = algae blooms, 5 = dead fish, 6 = unusual animals, 7 = other
HAB form HAB evaluation; A = spilled paint, B = pea soup, C = streaks, D = green dots, E = bubbling scum, F = green/brown tint, G = duckweed, H = other, I = no bloom
pg. 21
Appendix B Monthly Evaluation of Upper Saranac Lake (North) Data, 20062012
June Data 2006 2007 2008 2009 2010 2011 2012
Zsd NORMAL NORMAL NORMAL NORMAL NORMAL NORMAL TP NORMAL NORMAL NORMAL NORMAL NORMAL NORMAL Chl.a NORMAL NORMAL NORMAL NORMAL NORMAL NORMAL NOx HIGH NORMAL NORMAL NORMAL NORMAL NORMAL NH4 NORMAL NORMAL NORMAL NORMAL NORMAL NORMAL TN NORMAL NORMAL NORMAL LOW LOW pH NORMAL NORMAL NORMAL NORMAL NORMAL NORMAL SpCond NORMAL NORMAL NORMAL NORMAL HIGH NORMAL Color NORMAL NORMAL NORMAL NORMAL NORMAL NORMAL Ca NORMAL LOW NORMAL NORMAL LOW QA NORMAL NORMAL NORMAL NORMAL NORMAL QB NORMAL NORMAL NORMAL NORMAL NORMAL QC HIGH NORMAL NORMAL NORMAL NORMAL TH20 NORMAL NORMAL NORMAL NORMAL NORMAL High = average monthly reading > 90th percentile reading for lake, 2000-2010 Low = average monthly reading < 10th percentile reading for lake, 2000-2010 Normal = average monthly reading between 10th and 90th percentile reading for lake, 2000-2010
July Data 2006 2007 2008 2009 2010 2011 2012
Zsd NORMAL NORMAL NORMAL NORMAL NORMAL HIGH TP NORMAL NORMAL NORMAL NORMAL NORMAL NORMAL Chl.a NORMAL NORMAL HIGH NORMAL NORMAL NORMAL NOx NORMAL NORMAL NORMAL NORMAL NORMAL NORMAL NH4 NORMAL NORMAL NORMAL NORMAL NORMAL NORMAL TN NORMAL NORMAL NORMAL NORMAL NORMAL NORMAL pH NORMAL NORMAL NORMAL NORMAL NORMAL NORMAL SpCond NORMAL NORMAL NORMAL NORMAL NORMAL NORMAL Color NORMAL NORMAL NORMAL NORMAL NORMAL NORMAL Ca NORMAL QA NORMAL NORMAL NORMAL NORMAL NORMAL NORMAL QB NORMAL NORMAL NORMAL NORMAL NORMAL NORMAL QC HIGH NORMAL NORMAL NORMAL NORMAL NORMAL TH20 NORMAL NORMAL NORMAL NORMAL HIGH NORMAL High = average monthly reading > 90th percentile reading for lake, 2000-2010 Low = average monthly reading < 10th percentile reading for lake, 2000-2010 Normal = average monthly reading between 10th and 90th percentile reading for lake, 2000-2010
pg. 22
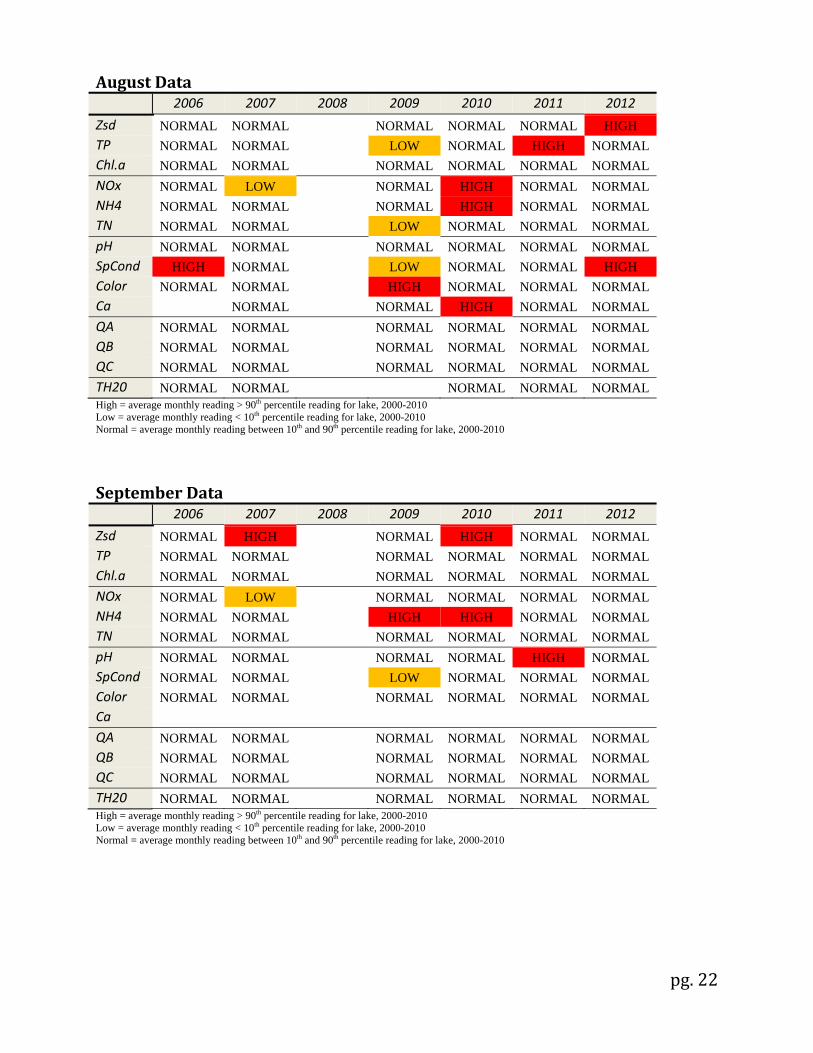
August Data 2006 2007 2008 2009 2010 2011 2012
Zsd NORMAL NORMAL NORMAL NORMAL NORMAL HIGH TP NORMAL NORMAL LOW NORMAL HIGH NORMAL Chl.a NORMAL NORMAL NORMAL NORMAL NORMAL NORMAL NOx NORMAL LOW NORMAL HIGH NORMAL NORMAL NH4 NORMAL NORMAL NORMAL HIGH NORMAL NORMAL TN NORMAL NORMAL LOW NORMAL NORMAL NORMAL pH NORMAL NORMAL NORMAL NORMAL NORMAL NORMAL SpCond HIGH NORMAL LOW NORMAL NORMAL HIGH Color NORMAL NORMAL HIGH NORMAL NORMAL NORMAL Ca NORMAL NORMAL HIGH NORMAL NORMAL QA NORMAL NORMAL NORMAL NORMAL NORMAL NORMAL QB NORMAL NORMAL NORMAL NORMAL NORMAL NORMAL QC NORMAL NORMAL NORMAL NORMAL NORMAL NORMAL TH20 NORMAL NORMAL NORMAL NORMAL NORMAL High = average monthly reading > 90th percentile reading for lake, 2000-2010 Low = average monthly reading < 10th percentile reading for lake, 2000-2010 Normal = average monthly reading between 10th and 90th percentile reading for lake, 2000-2010
September Data 2006 2007 2008 2009 2010 2011 2012
Zsd NORMAL HIGH NORMAL HIGH NORMAL NORMAL TP NORMAL NORMAL NORMAL NORMAL NORMAL NORMAL Chl.a NORMAL NORMAL NORMAL NORMAL NORMAL NORMAL NOx NORMAL LOW NORMAL NORMAL NORMAL NORMAL NH4 NORMAL NORMAL HIGH HIGH NORMAL NORMAL TN NORMAL NORMAL NORMAL NORMAL NORMAL NORMAL pH NORMAL NORMAL NORMAL NORMAL HIGH NORMAL SpCond NORMAL NORMAL LOW NORMAL NORMAL NORMAL Color NORMAL NORMAL NORMAL NORMAL NORMAL NORMAL Ca QA NORMAL NORMAL NORMAL NORMAL NORMAL NORMAL QB NORMAL NORMAL NORMAL NORMAL NORMAL NORMAL QC NORMAL NORMAL NORMAL NORMAL NORMAL NORMAL TH20 NORMAL NORMAL NORMAL NORMAL NORMAL NORMAL High = average monthly reading > 90th percentile reading for lake, 2000-2010 Low = average monthly reading < 10th percentile reading for lake, 2000-2010 Normal = average monthly reading between 10th and 90th percentile reading for lake, 2000-2010
pg. 23
Monthly Evaluation of Upper Saranac Lake (South) Data, 20062012
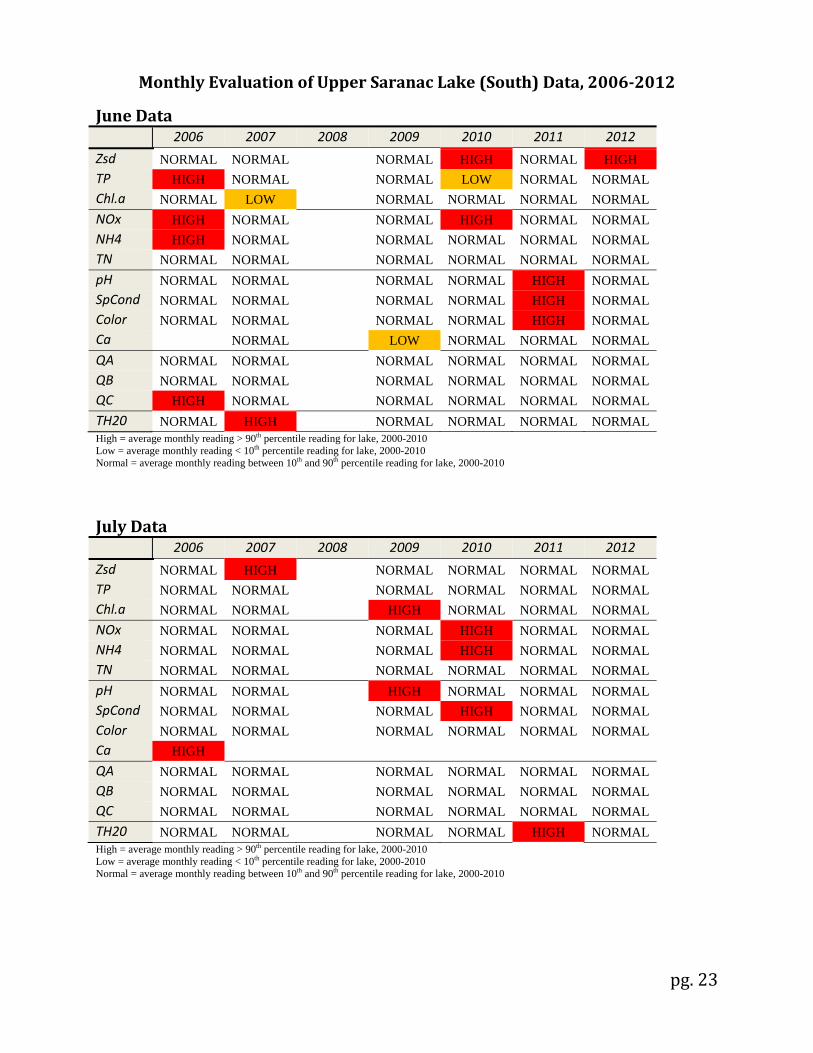
June Data 2006 2007 2008 2009 2010 2011 2012
Zsd NORMAL NORMAL NORMAL HIGH NORMAL HIGH TP HIGH NORMAL NORMAL LOW NORMAL NORMAL Chl.a NORMAL LOW NORMAL NORMAL NORMAL NORMAL NOx HIGH NORMAL NORMAL HIGH NORMAL NORMAL NH4 HIGH NORMAL NORMAL NORMAL NORMAL NORMAL TN NORMAL NORMAL NORMAL NORMAL NORMAL NORMAL pH NORMAL NORMAL NORMAL NORMAL HIGH NORMAL SpCond NORMAL NORMAL NORMAL NORMAL HIGH NORMAL Color NORMAL NORMAL NORMAL NORMAL HIGH NORMAL Ca NORMAL LOW NORMAL NORMAL NORMAL QA NORMAL NORMAL NORMAL NORMAL NORMAL NORMAL QB NORMAL NORMAL NORMAL NORMAL NORMAL NORMAL QC HIGH NORMAL NORMAL NORMAL NORMAL NORMAL TH20 NORMAL HIGH NORMAL NORMAL NORMAL NORMAL High = average monthly reading > 90th percentile reading for lake, 2000-2010 Low = average monthly reading < 10th percentile reading for lake, 2000-2010 Normal = average monthly reading between 10th and 90th percentile reading for lake, 2000-2010
July Data 2006 2007 2008 2009 2010 2011 2012
Zsd NORMAL HIGH NORMAL NORMAL NORMAL NORMAL TP NORMAL NORMAL NORMAL NORMAL NORMAL NORMAL Chl.a NORMAL NORMAL HIGH NORMAL NORMAL NORMAL NOx NORMAL NORMAL NORMAL HIGH NORMAL NORMAL NH4 NORMAL NORMAL NORMAL HIGH NORMAL NORMAL TN NORMAL NORMAL NORMAL NORMAL NORMAL NORMAL pH NORMAL NORMAL HIGH NORMAL NORMAL NORMAL SpCond NORMAL NORMAL NORMAL HIGH NORMAL NORMAL Color NORMAL NORMAL NORMAL NORMAL NORMAL NORMAL Ca HIGH QA NORMAL NORMAL NORMAL NORMAL NORMAL NORMAL QB NORMAL NORMAL NORMAL NORMAL NORMAL NORMAL QC NORMAL NORMAL NORMAL NORMAL NORMAL NORMAL TH20 NORMAL NORMAL NORMAL NORMAL HIGH NORMAL High = average monthly reading > 90th percentile reading for lake, 2000-2010 Low = average monthly reading < 10th percentile reading for lake, 2000-2010 Normal = average monthly reading between 10th and 90th percentile reading for lake, 2000-2010
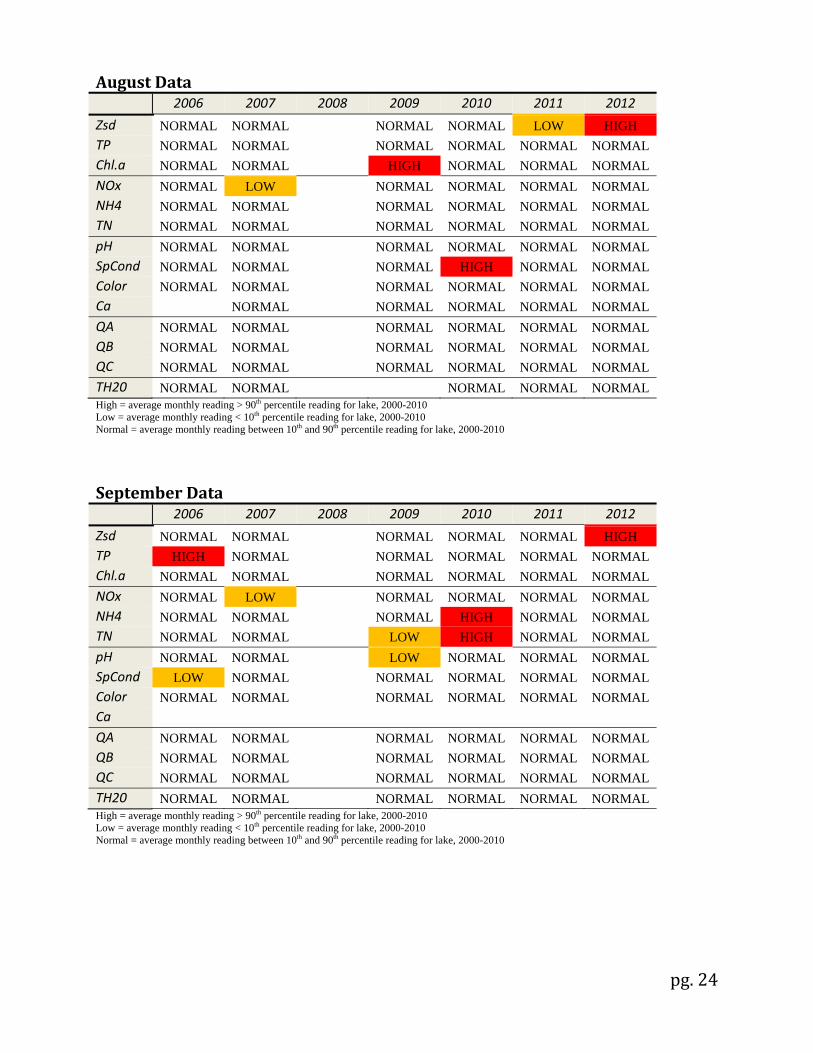
pg. 24
August Data 2006 2007 2008 2009 2010 2011 2012
Zsd NORMAL NORMAL NORMAL NORMAL LOW HIGH TP NORMAL NORMAL NORMAL NORMAL NORMAL NORMAL Chl.a NORMAL NORMAL HIGH NORMAL NORMAL NORMAL NOx NORMAL LOW NORMAL NORMAL NORMAL NORMAL NH4 NORMAL NORMAL NORMAL NORMAL NORMAL NORMAL TN NORMAL NORMAL NORMAL NORMAL NORMAL NORMAL pH NORMAL NORMAL NORMAL NORMAL NORMAL NORMAL SpCond NORMAL NORMAL NORMAL HIGH NORMAL NORMAL Color NORMAL NORMAL NORMAL NORMAL NORMAL NORMAL Ca NORMAL NORMAL NORMAL NORMAL NORMAL QA NORMAL NORMAL NORMAL NORMAL NORMAL NORMAL QB NORMAL NORMAL NORMAL NORMAL NORMAL NORMAL QC NORMAL NORMAL NORMAL NORMAL NORMAL NORMAL TH20 NORMAL NORMAL NORMAL NORMAL NORMAL High = average monthly reading > 90th percentile reading for lake, 2000-2010 Low = average monthly reading < 10th percentile reading for lake, 2000-2010 Normal = average monthly reading between 10th and 90th percentile reading for lake, 2000-2010
September Data 2006 2007 2008 2009 2010 2011 2012
Zsd NORMAL NORMAL NORMAL NORMAL NORMAL HIGH TP HIGH NORMAL NORMAL NORMAL NORMAL NORMAL Chl.a NORMAL NORMAL NORMAL NORMAL NORMAL NORMAL NOx NORMAL LOW NORMAL NORMAL NORMAL NORMAL NH4 NORMAL NORMAL NORMAL HIGH NORMAL NORMAL TN NORMAL NORMAL LOW HIGH NORMAL NORMAL pH NORMAL NORMAL LOW NORMAL NORMAL NORMAL SpCond LOW NORMAL NORMAL NORMAL NORMAL NORMAL Color NORMAL NORMAL NORMAL NORMAL NORMAL NORMAL Ca QA NORMAL NORMAL NORMAL NORMAL NORMAL NORMAL QB NORMAL NORMAL NORMAL NORMAL NORMAL NORMAL QC NORMAL NORMAL NORMAL NORMAL NORMAL NORMAL TH20 NORMAL NORMAL NORMAL NORMAL NORMAL NORMAL High = average monthly reading > 90th percentile reading for lake, 2000-2010 Low = average monthly reading < 10th percentile reading for lake, 2000-2010 Normal = average monthly reading between 10th and 90th percentile reading for lake, 2000-2010
pg. 25
Appendix C Priority Waterbody Listing for Upper Saranac Lake
pg. 26
pg. 27
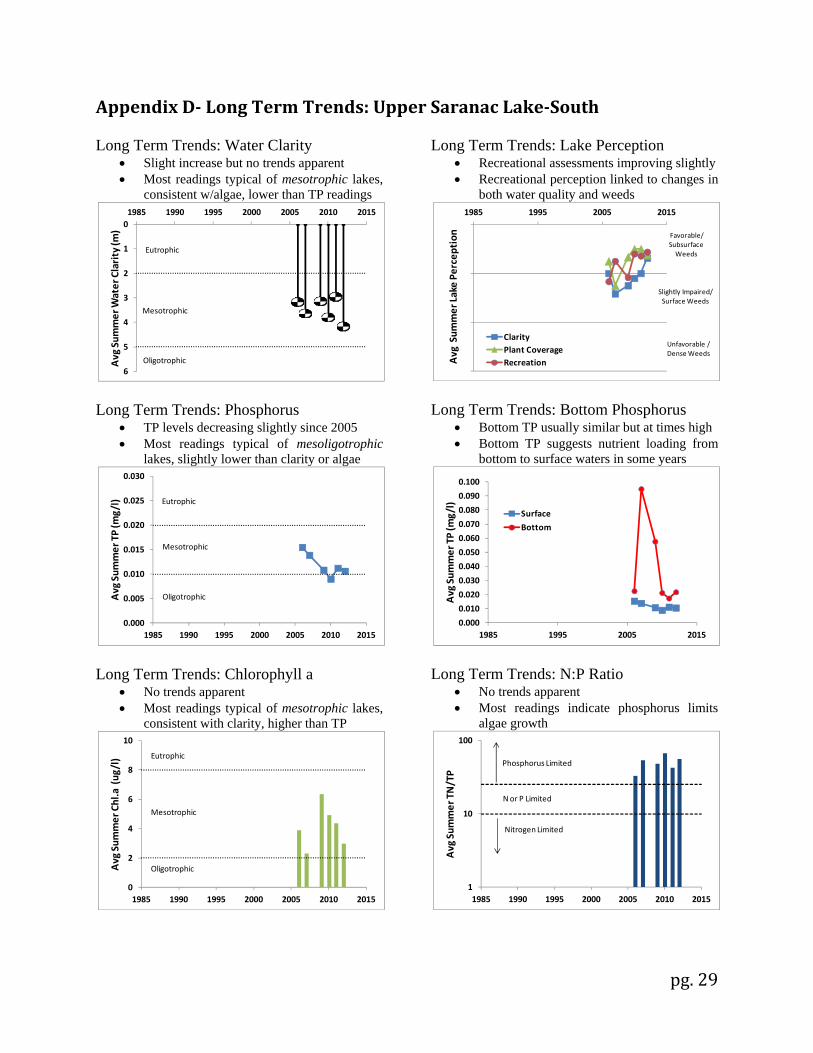
Appendix D Long Term Trends: Upper Saranac LakeNorth Long Term Trends: Water Clarity
• No trends apparent despite recent increase • Most readings typical of mesotrophic lakes,
consistent w/algae and TP readings
Long Term Trends: Phosphorus • No trends apparent • Most readings typical of mesotrophic lakes,
consistent with clarity and algae levels
Long Term Trends: Chlorophyll a
• No trends apparent • Most readings typical of mesotrophic lakes,
consistent with clarity and TP levels
Long Term Trends: Lake Perception
• Recreational assessments improving slightly • Recreational perception linked to changes in
water quality and weeds
Long Term Trends: Bottom Phosphorus • Bottom TP higher than surface TP • Bottom TP levels suggest some summer
nutrient loading, bottom to surface waters
Long Term Trends: N:P Ratio
• No trends apparent • Most readings indicate phosphorus limits
algae growth
0
1
2
3
4
5
6
1985 1990 1995 2000 2005 2010 2015
Avg Sum
mer Water Clarity (m
)
Eutrophic
Oligotrophic
Mesotrophic
0.000
0.005
0.010
0.015
0.020
0.025
0.030
1985 1990 1995 2000 2005 2010 2015
Avg Sum
mer TP (m
g/l) Eutrophic
Mesotrophic
Oligotrophic
0
2
4
6
8
10
1985 1990 1995 2000 2005 2010 2015
Avg Sum
mer Chl.a (ug
/l) Eutrophic
Mesotrophic
Oligotrophic
1985 1995 2005 2015
Avg Sum
mer Lake Pe
rcep
tion
ClarityPlant CoverageRecreation
Favorable/SubsurfaceWeeds
Unfavorable / DenseWeeds
Slightly Impaired/ Surface Weeds
0.000
0.010
0.020
0.030
0.040
0.050
0.060
0.070
0.080
1985 1995 2005 2015
Avg Sum
mer TP (m
g/l)
Surface
Bottom
1
10
100
1985 1990 1995 2000 2005 2010 2015
Avg Sum
mer TN/TP
Phosphorus Limited
Nitrogen Limited
N or P Limited
pg. 28
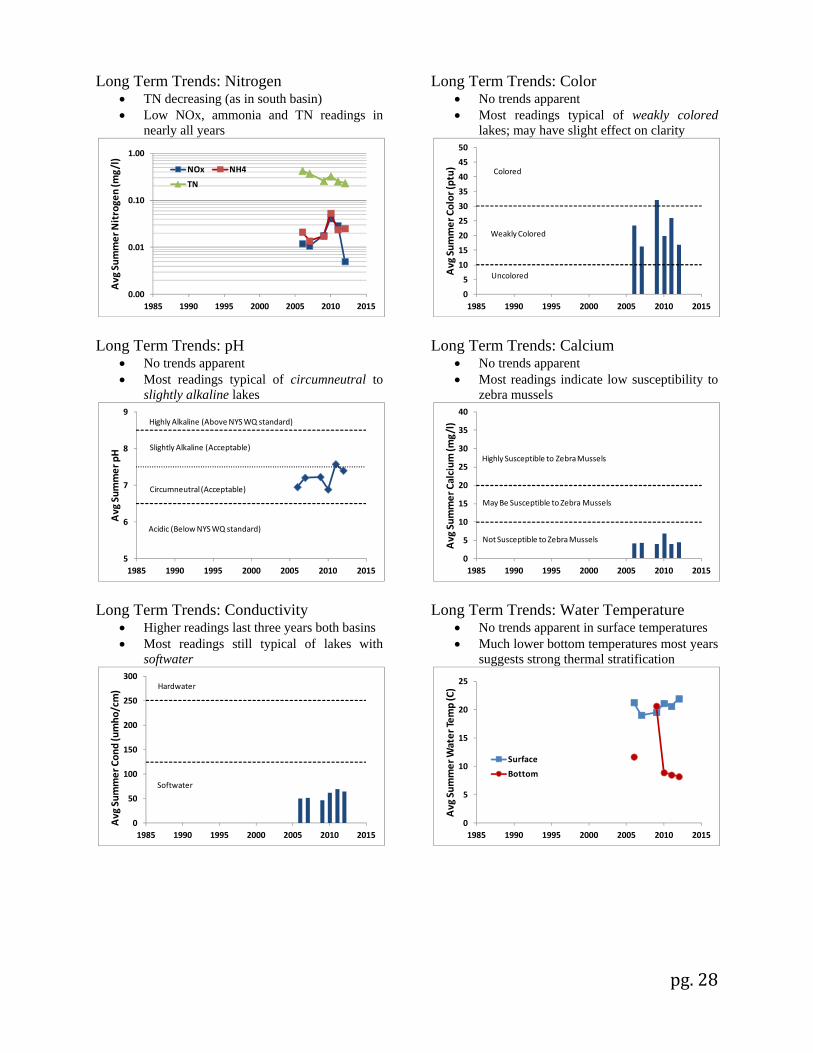
Long Term Trends: Nitrogen • TN decreasing (as in south basin) • Low NOx, ammonia and TN readings in
nearly all years
Long Term Trends: pH • No trends apparent • Most readings typical of circumneutral to
slightly alkaline lakes
Long Term Trends: Conductivity
• Higher readings last three years both basins • Most readings still typical of lakes with
softwater
Long Term Trends: Color • No trends apparent • Most readings typical of weakly colored
lakes; may have slight effect on clarity
Long Term Trends: Calcium
• No trends apparent • Most readings indicate low susceptibility to
zebra mussels
Long Term Trends: Water Temperature
• No trends apparent in surface temperatures • Much lower bottom temperatures most years
suggests strong thermal stratification
0.00
0.01
0.10
1.00
1985 1990 1995 2000 2005 2010 2015
Avg Sum
mer Nitrogen (m
g/l)
NOx NH4
TN
5
6
7
8
9
1985 1990 1995 2000 2005 2010 2015
Avg Sum
mer pH
Highly Alkaline (Above NYS WQ standard)
Circumneutral (Acceptable)
Acidic (Below NYS WQ standard)
Slightly Alkaline (Acceptable)
0
50
100
150
200
250
300
1985 1990 1995 2000 2005 2010 2015
Avg Sum
mer Con
d (umho
/cm) Hardwater
Softwater
0
5
10
15
20
25
30
35
40
45
50
1985 1990 1995 2000 2005 2010 2015
Avg Sum
mer Color (ptu) Colored
Weakly Colored
Uncolored
0
5
10
15
20
25
30
35
40
1985 1990 1995 2000 2005 2010 2015
Avg Sum
mer Calcium
(mg/l)
Highly Susceptible to Zebra Mussels
Not Susceptible to Zebra Mussels
May Be Susceptible to Zebra Mussels
0
5
10
15
20
25
1985 1990 1995 2000 2005 2010 2015
Avg Sum
mer Water Te
mp (C)
Surface
Bottom
pg. 29
Appendix D Long Term Trends: Upper Saranac LakeSouth Long Term Trends: Water Clarity
• Slight increase but no trends apparent • Most readings typical of mesotrophic lakes,
consistent w/algae, lower than TP readings
Long Term Trends: Phosphorus • TP levels decreasing slightly since 2005 • Most readings typical of mesoligotrophic
lakes, slightly lower than clarity or algae
Long Term Trends: Chlorophyll a
• No trends apparent • Most readings typical of mesotrophic lakes,
consistent with clarity, higher than TP
Long Term Trends: Lake Perception
• Recreational assessments improving slightly • Recreational perception linked to changes in
both water quality and weeds
Long Term Trends: Bottom Phosphorus • Bottom TP usually similar but at times high • Bottom TP suggests nutrient loading from
bottom to surface waters in some years
Long Term Trends: N:P Ratio
• No trends apparent • Most readings indicate phosphorus limits
algae growth
0
1
2
3
4
5
6
1985 1990 1995 2000 2005 2010 2015
Avg Sum
mer Water Clarity (m
)
Eutrophic
Oligotrophic
Mesotrophic
0.000
0.005
0.010
0.015
0.020
0.025
0.030
1985 1990 1995 2000 2005 2010 2015
Avg Sum
mer TP (m
g/l) Eutrophic
Mesotrophic
Oligotrophic
0
2
4
6
8
10
1985 1990 1995 2000 2005 2010 2015
Avg Sum
mer Chl.a (ug
/l) Eutrophic
Mesotrophic
Oligotrophic
1985 1995 2005 2015
Avg Sum
mer Lake Pe
rcep
tion
ClarityPlant CoverageRecreation
Favorable/SubsurfaceWeeds
Unfavorable / DenseWeeds
Slightly Impaired/ Surface Weeds
0.000
0.010
0.020
0.030
0.040
0.050
0.060
0.070
0.080
0.090
0.100
1985 1995 2005 2015
Avg Sum
mer TP (m
g/l)
Surface
Bottom
1
10
100
1985 1990 1995 2000 2005 2010 2015
Avg Sum
mer TN/TP
Phosphorus Limited
Nitrogen Limited
N or P Limited
pg. 30
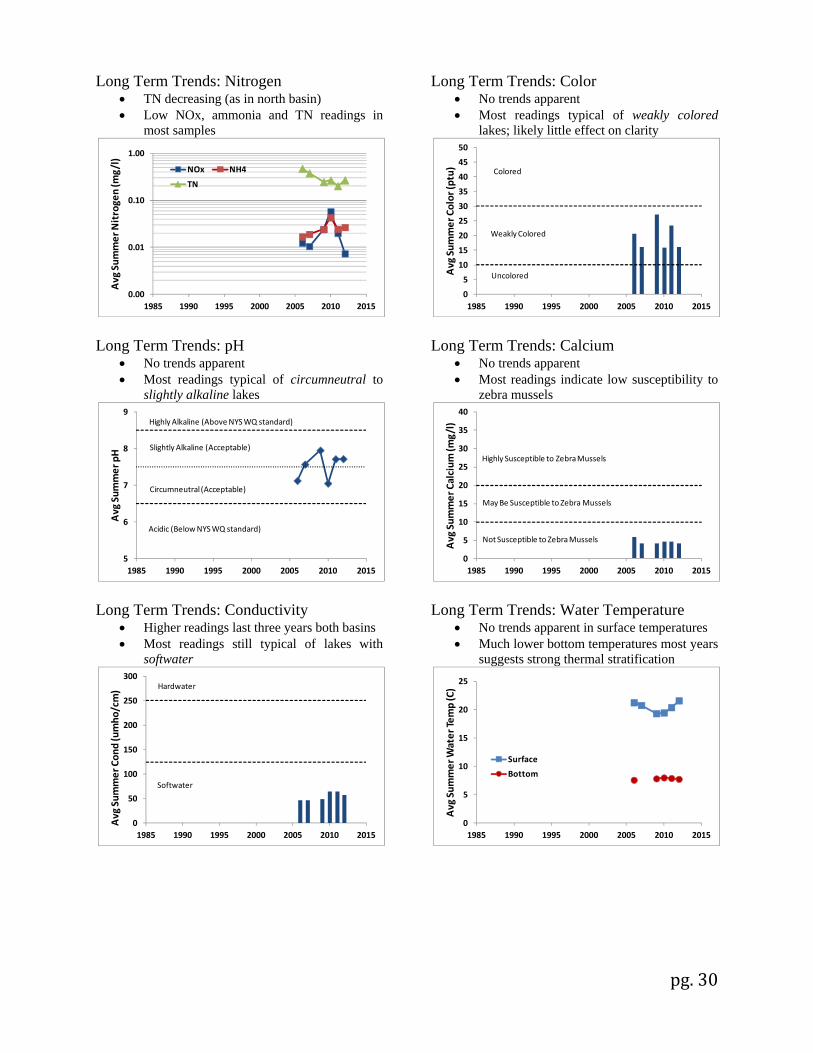
Long Term Trends: Nitrogen • TN decreasing (as in north basin) • Low NOx, ammonia and TN readings in
most samples
Long Term Trends: pH • No trends apparent • Most readings typical of circumneutral to
slightly alkaline lakes
Long Term Trends: Conductivity
• Higher readings last three years both basins • Most readings still typical of lakes with
softwater
Long Term Trends: Color • No trends apparent • Most readings typical of weakly colored
lakes; likely little effect on clarity
Long Term Trends: Calcium
• No trends apparent • Most readings indicate low susceptibility to
zebra mussels
Long Term Trends: Water Temperature
• No trends apparent in surface temperatures • Much lower bottom temperatures most years