Page 1
u n i ve r s i t y o f co pe n h ag e n
Københavns Universitet
microRNA-143 down-regulates Hexokinase 2 in colon cancer cells
Gregersen, Lea Haarup; Jacobsen, Anders; Frankel, Lisa; Wen, Jiayu; Krogh, Anders; Lund,Anders H.Published in:B M C Cancer
DOI:10.1186/1471-2407-12-232
Publication date:2012
Document VersionPublisher's PDF, also known as Version of record
Citation for published version (APA):Gregersen, L. H., Jacobsen, A., Frankel, L., Wen, J., Krogh, A., & Lund, A. H. (2012). microRNA-143 down-regulates Hexokinase 2 in colon cancer cells. DOI: 10.1186/1471-2407-12-232
Download date: 11. Jul. 2018
Page 2
This Provisional PDF corresponds to the article as it appeared upon acceptance. Fully formattedPDF and full text (HTML) versions will be made available soon.
microRNA-143 down-regulates Hexokinase 2 in colon cancer cells
BMC Cancer 2012, 12:232 doi:10.1186/1471-2407-12-232
Lea H Gregersen ([email protected] )Anders Jacobsen ([email protected] )
Lisa B Frankel ([email protected] )Jiayu Wen ([email protected] )Anders Krogh ([email protected] )
Anders H Lund ([email protected] )
ISSN 1471-2407
Article type Research article
Submission date 25 October 2011
Acceptance date 15 May 2012
Publication date 12 June 2012
Article URL http://www.biomedcentral.com/1471-2407/12/232
Like all articles in BMC journals, this peer-reviewed article was published immediately uponacceptance. It can be downloaded, printed and distributed freely for any purposes (see copyright
notice below).
Articles in BMC journals are listed in PubMed and archived at PubMed Central.
For information about publishing your research in BMC journals or any BioMed Central journal, go to
http://www.biomedcentral.com/info/authors/
BMC Cancer
© 2012 Gregersen et al. ; licensee BioMed Central Ltd.This is an open access article distributed under the terms of the Creative Commons Attribution License (http://creativecommons.org/licenses/by/2.0),
which permits unrestricted use, distribution, and reproduction in any medium, provided the original work is properly cited.
Page 3
microRNA-143 down-regulates Hexokinase 2 in
colon cancer cells
Lea H Gregersen1,2,3
Email: [email protected]
Anders Jacobsen2,4
Email: [email protected]
Lisa B Frankel1
Email: [email protected]
Jiayu Wen2
Email: [email protected]
Anders Krogh1,2
Email: [email protected]
Anders H Lund1*
* Corresponding author
Email: [email protected]
1 Biotech Research and Innovation Centre and Centre for Epigenetics, University
of Copenhagen, DK-2200 Copenhagen N, Denmark
2 The Bioinformatics Centre, Department of Biology, University of Copenhagen,
DK-2200 Copenhagen N, Denmark
3 Present address: Berlin Institute for Medical Systems Biology, Max-Delbrück-
Center for Molecular Medicine, D-13125 Berlin, Germany
4 Present address: Computational Biology Program, Memorial Sloan-Kettering
Cancer Center, New York, NY, USA
Abstract
Background
MicroRNAs (miRNAs) are well recognized as gene regulators and have been implicated in
the regulation of development as well as human diseases. miR-143 is located at a fragile site
on chromosome 5 frequently deleted in cancer, and has been reported to be down-regulated in
several cancers including colon cancer.
Methods
To gain insight into the role of miR-143 in colon cancer, we used a microarray-based
approach in combination with seed site enrichment analysis to identify miR-143 targets.
Page 4
Results
As expected, transcripts down-regulated upon miR-143 overexpression had a significant
enrichment of miR-143 seed sites in their 3′UTRs. Here we report the identification of
Hexokinase 2 (HK2) as a direct target of miR-143. We show that re-introduction of miR-143
in the colon cancer cell line DLD-1 results in a decreased lactate secretion.
Conclusion
We have identified and validated HK2 as a miR-143 target. Furthermore, our results indicate
that miR-143 mediated down-regulation of HK2 affects glucose metabolism in colon cancer
cells. We hypothesize that loss of miR-143-mediated repression of HK2 can promote glucose
metabolism in cancer cells, contributing to the shift towards aerobic glycolysis observed in
many tumors.
Keywords
miR-143, Colon cancer, Hexokinase 2, Glycolysis
Background
microRNAs (miRNAs) represent an abundant group of small non-coding RNAs that repress
translation and promote degradation of their mRNA targets through binding to partially
complementary regions in the 3′UTR [1-3]. The target recognition is mediated by the RNA-
induced silencing complex (RISC) with AGO2 as a key component. AGO2 presents the
miRNA to its targets in such a way that the nucleotides at position 2–8 of the mature miRNA,
also known as the seed region, are able to base pair with complementary regions in the
3′UTR [1].
Past years research on miRNAs has revealed a role of miRNAs in the regulation of numerous
cellular functions including development and differentiation, cell cycle regulation,
metabolism and apoptosis [4,5]. A large number of miRNAs are encoded by genes located in
regions frequently exposed to changes in cancer cells [6] and alterations of miRNA
expression levels have been associated with various types of cancer [7]. In addition, miRNA
signatures of cancer have also in some cases been shown to correlate with the prognosis and
progression of cancer [8]. By down-regulation of protein-encoding genes either promoting or
inhibiting cell proliferation, several miRNAs have been shown to function as
tumorsuppressors and oncogenes [5,8-11].
miR-143 is located at a fragile site often deleted in cancers [12] and has accordingly been
found down-regulated in a number of cancers [13-22]. Furthermore, miR-143 overexpression
has been demonstrated to have a growth inhibitory effect in several cell lines, indicating that
loss of miR-143 expression could contribute to the development of cancer [13-15,18,22,23].
During development miR-143 expression has been reported to be induced during
differentiation of adipocytes and vascular smooth muscle cells [24-26]. In vascular smooth
muscle cells miR-143 inhibition was found to increase the proliferative potential 2-fold, but
by itself miR-143 overexpression was not able to induce vascular smooth muscle
Page 5
differentiation [26]. This suggests that miR-143 may normally function to restrict the
proliferative potential of differentiated cells, explaining why down-regulation or loss of miR-
143 can contribute to the formation and/or growth of cancer.
To investigate the function of miR-143 as a putative tumorsuppressor, we sought to
understand the mechanistic basis for the involvement of miR-143 in cancer by the
identification of miR-143 targets. We chose to focus our study on colon cancer, since miR-
143 has been frequently reported as down-regulated in colon cancers [14,15,17,18,20]. In
order to identify miR-143 targets we used a microarray-based approach. Potential miR-143
targets were identified as genes containing miR-143 seed sites in the 3′UTRs that were down-
regulated upon miR-143 overexpression. Here, we report that miR-143 targets and down-
regulates the glycolytic enzyme hexokinase 2 (HK2) in colon cancer cell lines. Furthermore
we show, that re-introduction of miR-143 leads to a decrease in lactate secretion, indicating
that miR-143-mediated downregulation of HK2 impairs the rate of glycolysis.
Methods
Cell cultures and cell proliferation assays
Cell were cultured as previously described [27]. Overexpression of miR-143 was achieved by
transient transfection with a miR-143 duplex that mimics the mature miR-143 duplex
(PM10883; Ambion, Austin, TX, USA). Transfection with a scrambled negative control
siRNA (1027281, Qiagen, GermantownMD, USA) was used as control. All transfections
were carried out using Lipofectamine™ 2000 Transfection Reagent (11668-019, Invitrogen,
Burlington, ON, Canada) according to the manufactures protocol using a final concentration
of 50nM of oligonucleotides. Crystal violet assays were performed as previously described
[27].
Quantitative RT-PCR
Total RNA was isolated with TRIZOL (15596-026, Invitrogen) and treated with DNaseI
(DNase-free kit™, AM1906, Ambion). Primer sequences used for quantitative PCR (Q-PCR)
are listed in Additional file 1: Table S1. Hypoxanthine phosphoribosyltransfease (HPRT) or
beta-actin (ATCB) served as housekeeping normalization controls. Mature miR-143 levels
were quantified using TaqMan® MicroRNA Assay (4373134, Applied Biosystems, Austin,
TX, USA) and normalized to the U6 small nuclear B non-coding RNA (4373381, Applied
Biosystems).
Microarray profiles
DLD-1 cells were transfected with miR-143 duplex or mock transfected in four biological
replicates. Total RNA was isolated with TRIZOL 24 h after transfection. Affymetrix
microarray analysis (HG-U133 Plus 2.0 human) was performed at the Microarray Center,
Rigshospitalet, Copenhagen University Hospital as previously described [28]. Data
processing and word analysis are described in a separate section below.
Page 6
Vector construction and reporter assays
The miR-143 luciferase reporter vector was cloned by inserting a site with perfect
complementarity to miR-143 into HindIII/SpeI sites of pMIR-REPORT (AM5795, Applied
Biosystems). Antisense and sense oligonucleotide sequences (with restriction overhangs
indicated in lower case) are as follows:
miR-143 AS: 5′-ctagtGAGCTACAGTGCTTCATCTCAGCTCAGCA-3′,
miR-143 S: 5′-agcttGCTGAGCTGAGATGAAGCACTGTAGCTCA-3′,
3′ UTR fragment of HK2 was PCR amplified from DLD-1 genomic DNA and cloned into the
pGL3+ vector described previously [28]. The primer sequences used for PCR amplification
were as follows (restriction sites indicated in lower case):
HK2 3′UTR BglII FW: 5′-GGGagatctGGAGGGATGAGAGTGGCTTA-3′
HK2 3′UTR XhoI RV: 5′-GGGctcgagAATGACAACATCTTCACTAGACTGAG-3′
The miR-143 8mer seed site, TCATCTCA, in the 3′UTR of HK2 was converted into
TCATGACA using the QuikChange site-directed mutagenesis kit (Stratagene, La Jolla, CA,
USA). Mutagenesis primers used were as follows:
HK2 mut FW: 5′-
GTGTGATGAATAGCGAATCATGACAAATCCTTGAGCACTCAGTC-3′
HK2 mut RV: 3′-
GACTGAGTGCTCAAGGATTTGTCATGATTCGCTATTCATCACAC-5′
Luciferase assays were performed as previously described [27]. Briefly, cells were co-
transfected with indicated luciferase reporters and a Renilla normalization control, pRL-TK
(E2241, Promega, Madison, WI, USA) vector alone or with miR-143 duplex or a scrambled
negative control. Firefly and Renilla luminescence was measured 24 h after transfection using
the Dual-Glo luciferase kit (E2940, Promega).
HK2 siRNA knockdown experiments
Knockdown experiments were performed by transient transfection of HK2 siRNA using
lipofectamine as described above. Cells were double transfected with 50nM siRNA for 6 h
each and the cell lysates were harvested 48 h after the first transfection for protein and RNA
extraction. The sequence of the HK2 siRNA is as previously published [29]: HK2 sense 5′-
GGAUAAGCUACAAAUCAAA[dT][dT]-3′,
Antibodies and western blot analysis
For western blotting DLD-1 or HCT116 cells were double transfected for 6 h on two
subsequent days. Cells were harvested 48 h after the first transfection, washed twice in PBS,
and lysed in RIPA buffer (150 mM NaCl, 1% NP40, 0.5% sodium deoxycholate, 0.1% SDS,
50 mM Tris-HCl at pH 8, 2 mM EDTA) containing protease inhibitor cocktail
(04693124001, Roche, Basel, Switzerland)) and phosphatase inhibitors (1 mM NaVO3, 10
mM NaF and 1 mM β-glycerolphosphat). 30 μg protein/lane was separated on
Page 7
polyacrylamide gels, transferred to a nitrocellulose membrane and incubated with antibodies
against HK2 (1:1000, 2106, Cell Signaling Technology, Danvers, MA, USA) or antibodies
against Tubulin (ab11304, Abcam, Cambridge, MA, USA) serving as a loading control. Band
intensities were quantified using TotalLab image analysis software.
Lactate assay
DLD-1 cells were double transfected for 6 h on two subsequent days. To measure the
secretion of lactate, media samples were removed in 6 h intervals following the addition of
fresh media after the second transfection and stored at −80°C until measurement. Lactate was
measured using the Lactate Acid Assay Kit (K607-100, BioVison, Mountain View, CA,
USA).
Analysis of microarray profiles, seed site enrichment and word analysis
The microarray data was processed as previously described [27]. Non-specific filtering was
used to remove genes with low variance between arrays using a cutoff of 0.25. This left 1241
genes that were used for the following analysis. Differentially expressed genes were found
using limma [30]. Genes with a FC above 1.1 or below −1.1 were used to define the up and
down set, respectively. The no-change set was selected from genes with a logFC centered on
0. The microarray data has been deposited in the GEO database accession number
GSE33420.
Seed site enrichment was calculated by scanning the 3′UTR sequences in the up, down and
no-change sets for the presence of 6mer, 7mer, 7mer-A1 and 8mer seed sites.
We used Gene Set Enrichment Analysis (GSEA) to detect significantly enriched biological
functions/pathways from the KEGG pathway [31], Biocarta pathway (www.biocarta.com)
and MSigDB [32] databases for the down-regulated gene sets after over-expressing miR-143.
GSEA can detect an overall change in a gene set for up- and down-regulated genes even
though individual genes in the set may not be significantly differentially expressed. The
analysis was based on expression fold changes between miR-143 and mock transfection of all
genes on the array without any cutoffs, and p-value less than 0.01 was used for statistical
significance. The package “gage” [33] in Bioconductor was used for the analysis.
For the word analysis we used a non-parametric statistical framework for scoring and ranking
oligonucleotide words based on their overrepresentation in a ranked list of sequences as
previously described [34].
TCGA colorectal adenocarcinoma expression correlation
Data was obtained from the public open-access HTTP directory at the TCGA website
(http://tcga-data.nci.nih.gov/) for the colon adenocarcinoma (COAD) and rectum
adenocarcinoma (READ) projects. Level 3 normalized Agilent microarray mRNA expression
data and miRNA expression sequencing data summarized for each mature miRNA was
obtained for 184 colon and rectum adenocarcinoma samples.
Page 8
Results
To investigate the expression level of miR-143 in established cell lines, we profiled miR-143
expression level using Q-PCR in a number of selected cancer cell lines as well as non-
tumourigenic cell lines (Additional file 2: Figure S1). As expected, the expression levels of
miR-143 were extremely low or undetectable in all tested cancer cell lines. The highest
expression levels were observed in the non-tumorigenic fibroblast cell lines BJ and Tig3. We
chose to focus our further studies on the human colon cancer cell line DLD-1 since miR-143
expression was virtually absent from this cell line and thus mimics the situation reported in
colon cancer tumors. To confirm previous findings that miR-143 inhibits cell growth we
investigated the cell proliferation upon transient transfections with a miR-143 duplex. The
effect of miR-143 duplex transfection in DLD-1 cells was confirmed by co-transfection of a
luciferase reporter containing a perfect complementary site to the mature miR-143
(Additional file 2: Figure S2). As demonstrated by cell growth assays, overexpression of
miR-143 resulted in a decreased cell proliferation (Figure 1).
Figure 1 miR-143 overexpression reduces the proliferative potential of DLD-1 cells.
DLD-1 cells transfected with miR-143 duplex exhibit a reduced cell proliferation as
measured by crystal violet growth assay. Data are shown as the mean ± S.D. of four
replicates. *, p < 0.005 using a two-tailed t-test, ***, p < 0.001 using a two-tailed t-test
We next sought to identify functionally relevant targets that could explain the underlying role
of miR-143 in cancer. To achieve this, DLD-1 cells were transfected with miR-143 duplex or
mock transfected. Total RNA was harvested 24 h post-transfection and analyzed on
Affymetrix HG-U133 Plus 2.0 human arrays.
To determine whether genes down-regulated by miR-143 were related to specific cellular
functions, we performed a search for enriched functional annotations as derived from KEGG
and BioCarta pathway databases. In KEGG pathways, down-regulated gene sets were
enriched in cell cycle (p-value = 3·10−9
), glutamate metabolism (p-value = 3·10−4
), N-glycan
biosynthesis (p-value = 2·10−3
) and glycolysis/gluconeogenesis (p-value = 0.01) (Table 1). In
BioCarta pathways, down-regulated gene set were enriched in the mTOR signalling pathway
(p-value = 7·10−5
) and the G1/S check point pathway (p-value = 5·10−3
) (Table 2).
Table 1 Enriched KEGG pathways among miR-143 down-regulated gene sets
KEGG Pathway P-value
Cell cycle 3.12.10
-9
Ubiquitin mediated proteolysis 8.99.10
-7
Ribosome 1.89.10
-6
Aminoacyl-tRNA biosynthesis 3.10
-6
Parkinson's disease 4.10
-6
Pyrimidine metabolism 1.10
-5
Adherens junction 2.10
-5
DNA replication 2.10
-5
Proteasome 3.10
-5
Glutamate metabolism 3.10
-4
Thyroid cancer 8.10
-4
Page 9
Pathogenic Escherichia coli infection - EHEC 2.10
-9
N-Glycan biosynthesis 0002
Base excision repair 0.002
Vibrio cholerae infection 0.003
p53 signaling pathway 0.003
Huntington's disease 0.004
Lysine degradation 0.004
Regulation of actin cytoskeleton 0.007
Wnt signaling pathway 0.008
Biosynthesis of unsaturated fatty acids 0.008
Glycolysis / Gluconeogenesis 0.01
Table 2 Enriched BioCarta pathways among miR-143 down-regulated gene sets
BioCarta Pathway P-value
HIV-I Nef: negative effector of Fas and TNF 2.42.10
-6
mTOR Signaling Pathway 7.43.10
-5
Ras-Independent pathway in NK cell-mediated cytotoxicity 3.27.10
-4
The IGF-1 Receptor and Longevity 1.00.10
-3
Inhibition of Cellular Proliferation by Gleevec 2.70.10
-3
Role of ERBB2 in Signal Transduction and Oncology 2.85.10
-3
Cell Cycle: G1/S Check Point 5.09.10
-3
In addition we also performed a search for enriched transcription factor and miR-143 binding
motifs among miR-143 down-regulated genes. The second most significantly enriched motif
in the down-regulated gene set was the miR-143 seed site (p-value = 7·10−10
), while the most
significantly enriched motif was binding site of the transcription factor E2F (Additional file
3: Table S2).
Seed site enrichment analysis of seed sites present in the 3′UTRs of transcripts showed a very
significant enrichment of miR-143 seed sites among the down-regulated transcripts (Figure
2A). In this analysis we grouped the 3′UTRs into down-regulated (FC < −1.1), no-change
(genes with FC centred on 0) and up-regulated (FC > 1.1) (Figure 2A). The p-values for the
enrichment of miR-143 seed sites (including 7mer, 7mer-1A and 8mer sites) were 3.4·10−19
when considering the down-regulated transcripts vs. up-regulated transcripts and 5.8·10−28
when considering down-regulated transcript vs. no change transcripts. This was also the case
when the seed site enrichment was evaluated by two alternative methods of calculating the
seed site enrichment, either as seed site occurrences after correcting the up, down and no-
change sets to the same size or as seed site occurrences calculated per kb (Additional file 2:
Figure S3A and S3B).
Figure 2 Microarray based identification of miR-143 targets. A, The percentages of genes
in the up, down and no-change sets with seeds sites in their 3′UTRs. Seed sites were mutually
exclusive. Mean log fold-changes were 0.193, −0.004 and −0.249 for the up, down and no-
change sets, respectively. The p-values are calculated testing the null hypothesis that the
percentages of genes with seed sites are the same for the down-regulated and the up-regulated
Page 10
genes (down vs. up) or the down-regulated genes compared to the no-change genes (down vs.
no-change). P-values for 7mer seed site enrichment were 1.2·10 −4
(down vs. up) and 3.5·10 −6
(down vs. no-change). P-values for 7mer-1A seed site enrichment were 1.4·10 −3
(down vs.
up) and 1.8·10 −4
(down vs. no-change). P-values for 8mer seed site enrichment were 2.7·10 −11
(down vs. up) and 2.2·10 −16
(down vs. no-change). B, Enriched 7mer words in the
3′UTRs of down-regulated transcripts. Z-scores were calculated as previously described [34].
C, An example of the unbiased word analysis (based on the 1241 genes left after non-specific
filtering) showing the running sum of the overrepresentation score for the miR-143 7mer seed
site TCATCTC in the list of 3′UTR sequences ranked according to their fold-change (black
line) compared to permutations of the ranked gene list (grey lines). D, Quantitative RT-PCR
validation of the microarray data. DLD-1 cells were transfected with miR-143 duplex or
mock transfected and total RNA harvested 24 h post-transfection. The 3′UTRs of ABHD5 and
TAF10 do not contain any miR-143 seed matches, but both genes contain a 8mer seed match
in their coding region. All other miR-143 responsive genes contain at least one 7mer seed site
in their 3′UTR. The expression level of each transcript data was normalized to HPRT and is
shown relative to the level in mock transfected cells. Data are shown as the mean ± S.D. of
three replicates
In addition to seed site enrichment analysis, we also performed an unbiased word analysis of
words present in 3’UTRs of transcript ranked according to their FC. The 7mer and the 7mer-
1A seed sites of miR-143 were identified as the most significantly enriched 7mer words in
the 3′UTRs of transcripts down-regulated after miR-143 overexpression (Figure 2B).
Sequence variations of the miR-143 seed site were also among the highest scoring words.
Similarly, a 6mer word analysis indentified the miR-143 6mer seed site as the most enriched
6mer word in 3′UTRs of down-regulated transcripts (Additional file 2: Figure S4). The
overrepresentation of miR-143 seed sites in 3′UTRs of down-regulated transcripts can be
visualized by plotting the running sum of the overrepresentation scores of the seed sites in
transcripts ranked according to their logFC. As seen in Figure 2C the overrepresentation
scores of the miR-143 7mer seed site are highest among 3′UTRs of down-regulated
transcripts (black line). This was not the case, when the same analysis was performed for 100
permutations of the ranked transcript list (grey lines).
As miR-143 possesses a tumor-suppressor function, we would expect a down-regulation of
oncogenes and genes promoting cell proliferation upon miR-143 overexpression. Putative
miR-143 targets, defined as genes down-regulated upon miR-143 overexpression with a
FC < −1.1 and containing either a least one 7mer, 7mer-1A or 8mer seed site in their 3′UTR
are listed in Additional file 4: Table S3. Among the down-regulated genes containing miR-
143 seed sites in their 3′UTRs we found a number of genes that have previously been
implicated in tumorigenesis. This include the Steroid 5-alpha-reductase SRD5A1, the CCR4-
NOT component RQCD1 and the Rab11 effector protein RAB11FIP1 which have all been
reported as up-regulated in breast cancers [35-37]. Other miR-143 responsive genes with a
miR-143 seed site in their 3′UTR were SEMA5A, SLC35B2 and KLF5 which have all been
shown to be up-regulated in cancers and to promote cell proliferation [38-41]. Among the
putative miR-143 targets we also found the deubiquitinating enzyme USP22, which have
been reported to be associated with a poor prognosis of colorectal cancer [42] and invasive
breast cancer [43]. In addition we also observed a reduced expression of the glycolytic
enzyme hexokinase 2 (HK2) upon miR-143 overexpression. HK2 catalyzes the first step of
glycolysis by phosphorylation of glucose into glucose-6-phosphate. HK2 is often found
upregulated in cancer and facilitates a high rate of glucose metabolism necessary for tumor
growth [44].
Page 11
Among genes motioned above, three genes have also been predicted by a target prediction
model built on 12 transfection datasets with good prediction posterior probabilities and low
FDR (<25%) [45]. This includes HK2 (posterior probability = 0.93; adjusted p-value = 0.17),
RAB11FIP1 (posterior probability = 0.92; adjusted p-value = 0.17) and SEMA5A (posterior
probability = 0.9; adjusted p-value = 0.22). This adds supportive evidence that these genes are
direct targets of miR-143 beyond a simple seed match search.
As a validation of the microarray data we selected 7 transcripts identified as down-regulated
by miR-143 in the microarray analysis for Q-PCR validation. All 7 transcripts including HK2
were found to be down-regulated, confirming the microarray data (Figure 2D). In accordance
with previous reports we also find KRAS downregulated upon miR-143 overexpression
(Figure 2D) [15]. KRAS was also found down-regulated in the microarray analysis but
because it had a borderline logFC of −0.14, it is not included in our list of potential miR-143
targets as listed in Additional file 4: Table S3.
Due to HK2’s reported role in promoting tumor growth we wanted to investigate if the
tumorsuppressor function of miR-143 can in part be accounted for due to its down-regulation
of HK2. To investigate the role of miR-143 mediated regulation of HK2, we firstly wanted to
determine whether HK2 is a direct target of miR-143. The 3′UTR of HK2 contain a 8mer
seed site for miR-143 (Figure 3A). To determine if miR-143 directly regulates HK2 through
binding to its 3′UTR, 3′UTR luciferase reporter constructs were cloned containing 789 base-
pair UTR fragments. Overexpression of miR-143 resulted in a significant decrease of the
luciferase activity (p-value < 0.002) of a construct holding the wild-type 3′UTR of HK2
(Figure 3B). This regulation was alleviated when two nucleotides in the seed site had been
mutated (Figure 3B), indicating that the miR-143 directly regulates HK2. Western blot
analysis further confirmed that miR-143 overexpression lead to a down-regulation of HK2
protein levels in both DLD-1 and HCT116 colon cancer cells (Figure 3C). The effect of miR-
143 overexpression in HCT116 measured by a miR-143 luciferase reporter was similar to that
observed in DLD-1 cells (Additional file 2: Figure S2B). Notably the endogenous protein
level of HK2 in DLD-1 is considerably higher than in HCT116 cells, but nevertheless miR-
143 overexpression lead to a downregulation of HK2 protein levels in both cell lines.
Figure 3 miR-143 downregulates HK2. A, Sequence alignment of the miR-143 seed region
and HK2 3′UTR. (ENSG00000159399) B, Firefly luciferase assay with pGL3+ constructs
holding a 789 bp 3′UTR fragment of HK2 downstream to the firefly luciferase gene. DLD-1
cells were co-transfected with firefly luciferase reporters along with a Renilla luciferase
transfection control plasmid either alone (mock) or with miR-143 duplex and scrambled
duplex as a negative control. Data are shown as the mean ± S.D. of four replicates. *,
p < 0.005 using a two-tailed t-test. C, Western blot analysis of DLD-1 and HCT116 cells
transfected with miR-143 duplex or mock transfected cells blotted for HK2. Tubulin was
used as loading control. The bands were normalized relative to the tubulin loading control
and quantified relative to the HK2 protein level in mock transfected cells. D, miR-143 and
HK2 are negatively correlated in TCGA colorectal adenocarcinoma. Linear Pearson
correlation between miR-143 expression and HK2 expression in 184 colon and rectum
adenocarcinoma samples
To further strengthen the connection between miR-143 and HK2 we surveyed the expression
levels of both miR-143 and HK2 in data from The Cancer Genome Atlas (TCGA)
consortium. TCGA is currently profiling the genomes of a large cohort of colon and rectum
adenocarcinomas. We found a significant negative correlation between miR-143 and HK2
Page 12
(P = 0.002, r = −0.22, Pearson correlation) in 184 public TCGA colorectal adenocarcinoma
tumor samples with miRNA and mRNA expression data available (Figure 3D). This
observation supports that miR-143 could target and repress HK2 expression in-vivo and that
HK2 expression could be upregulated in a subset of tumors due to lower levels of miR-143.
To investigate the effect of HK2 on cellular growth, we performed cell proliferation assay
upon siRNA-mediated knockdown of HK2. HK2 knockdown was verified on both mRNA
and protein level in DLD-1 cells (Figure 4A and B). We found that, in a similar manner to
miR-143 overexpression, HK2 siRNA mediated knockdown also resulted in a reduced cell
proliferation (Figure 4C).
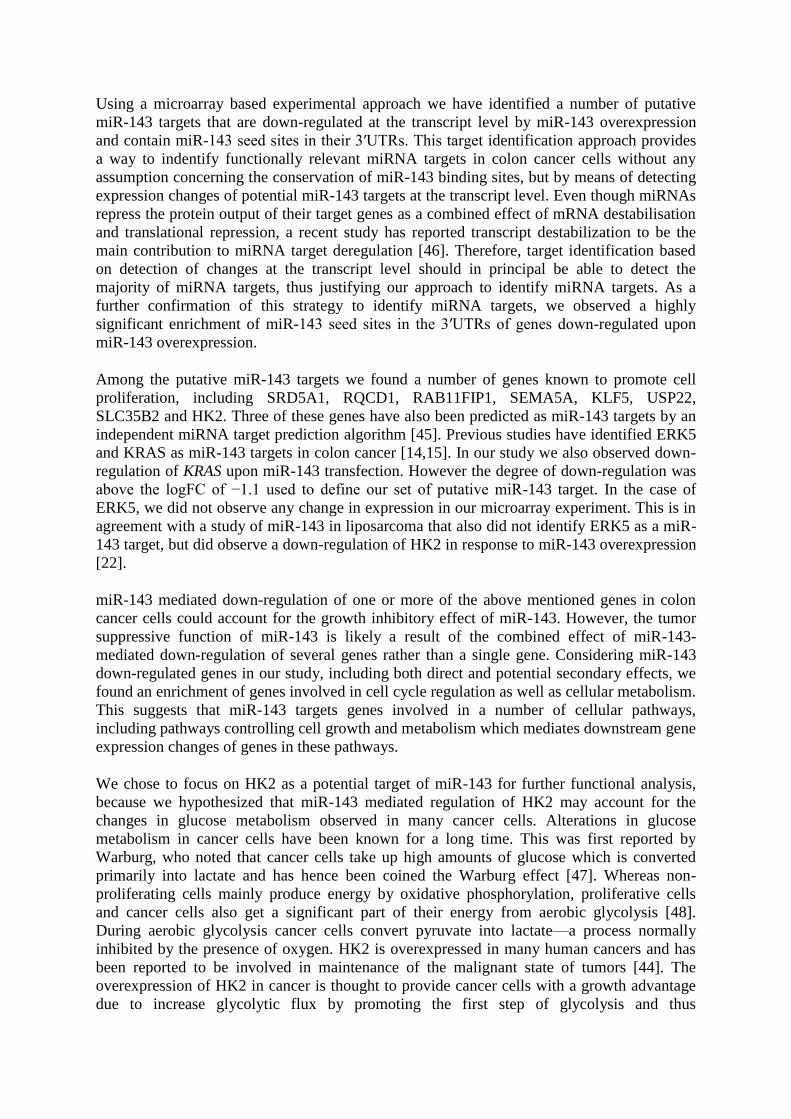
Figure 4 Knockdown of HK2 as well as miR-143 overexpression results in decreased
lactate secretion. A, Verification of HK2 knockdown on protein level. Cells were transfected
on two consecutive days with HK2 siRNA and protein was harvested 48 h after the first
transfection. Tubulin was used as loading control. B, Verification of HK2 knockdown on
transcript level. DLD-1 cells were transfected on two consecutive days with HK2 siRNA and
RNA was harvested 48 h after the first transfection. The expression level was normalized to
ATCB and shown as the mean ± S.D. of three replicates. C, HK2 knockdown results in a
reduced proliferative potential of DLD-1 cells. DLD-1 cells transfected with miR-143 duplex
or HK2 siRNA exhibit a reduced cell proliferation as measured by crystal violet growth
assay. Results are shown for day 4 after transfection as the mean ± S.D. of four replicates. *,
p < 0.005 using a two-tailed t-test. D, Lactate secretion of DLD-1 cells is decreased upon
miR-143 overexpression or HK2 knockdown compared to mock transfected cells. Cells were
transfected as described in A) and B) and media samples were removed in 6 h intervals for
measurement of lactate. The 0 h time points correspond to samples taken immediately after
addition of fresh media following the second transfection. Data shows a representative
experiment with results depicted as the mean ± S.D. of three replicates. *, p < 0.005 using a
two-tailed t-test
Next, to determine if downregulation of HK2 mediated by miR-143 resulted in an impairment
of glycolysis, lactate production was measured in mock transfected cells and cells transfected
with miR-143 duplex or HK2 siRNA. Cells transfected with a HK2 siRNA showed a marked
decrease in the rate of lactate secretion over a period of 48 h (Figure 4D). Importantly, a
decrease in the lactate secretion was also observed upon miR-143 overexpression (Figure
4D), confirming that miR-143 downregulation of HK2 has a functional effect on the glucose
metabolism. The observed decrease in lactate secretion caused by miR-143 overexpression is
less pronounced than for HK2 siRNA mediated inhibition. However, this might be explained
by the more efficient down-regulation of HK2 mediated by the HK2 siRNA than by
overexpression of miR-143.
Discussion
In accordance with numerous reports of miR-143 down-regulation in cancer, we observed
low or undetectable expression levels of miR-143 in human cancer cell lines. This was in
contrast to non-tumorigenic fibroblast cell lines, which had a relatively high expression level
of miR-143. In addition, we confirmed the growth inhibitory effect of miR-143 reported by
others in DLD-1 colon cancer cells [14,15,18].
Page 13
Using a microarray based experimental approach we have identified a number of putative
miR-143 targets that are down-regulated at the transcript level by miR-143 overexpression
and contain miR-143 seed sites in their 3′UTRs. This target identification approach provides
a way to indentify functionally relevant miRNA targets in colon cancer cells without any
assumption concerning the conservation of miR-143 binding sites, but by means of detecting
expression changes of potential miR-143 targets at the transcript level. Even though miRNAs
repress the protein output of their target genes as a combined effect of mRNA destabilisation
and translational repression, a recent study has reported transcript destabilization to be the
main contribution to miRNA target deregulation [46]. Therefore, target identification based
on detection of changes at the transcript level should in principal be able to detect the
majority of miRNA targets, thus justifying our approach to identify miRNA targets. As a
further confirmation of this strategy to identify miRNA targets, we observed a highly
significant enrichment of miR-143 seed sites in the 3′UTRs of genes down-regulated upon
miR-143 overexpression.
Among the putative miR-143 targets we found a number of genes known to promote cell
proliferation, including SRD5A1, RQCD1, RAB11FIP1, SEMA5A, KLF5, USP22,
SLC35B2 and HK2. Three of these genes have also been predicted as miR-143 targets by an
independent miRNA target prediction algorithm [45]. Previous studies have identified ERK5
and KRAS as miR-143 targets in colon cancer [14,15]. In our study we also observed down-
regulation of KRAS upon miR-143 transfection. However the degree of down-regulation was
above the logFC of −1.1 used to define our set of putative miR-143 target. In the case of
ERK5, we did not observe any change in expression in our microarray experiment. This is in
agreement with a study of miR-143 in liposarcoma that also did not identify ERK5 as a miR-
143 target, but did observe a down-regulation of HK2 in response to miR-143 overexpression
[22].
miR-143 mediated down-regulation of one or more of the above mentioned genes in colon
cancer cells could account for the growth inhibitory effect of miR-143. However, the tumor
suppressive function of miR-143 is likely a result of the combined effect of miR-143-
mediated down-regulation of several genes rather than a single gene. Considering miR-143
down-regulated genes in our study, including both direct and potential secondary effects, we
found an enrichment of genes involved in cell cycle regulation as well as cellular metabolism.
This suggests that miR-143 targets genes involved in a number of cellular pathways,
including pathways controlling cell growth and metabolism which mediates downstream gene
expression changes of genes in these pathways.
We chose to focus on HK2 as a potential target of miR-143 for further functional analysis,
because we hypothesized that miR-143 mediated regulation of HK2 may account for the
changes in glucose metabolism observed in many cancer cells. Alterations in glucose
metabolism in cancer cells have been known for a long time. This was first reported by
Warburg, who noted that cancer cells take up high amounts of glucose which is converted
primarily into lactate and has hence been coined the Warburg effect [47]. Whereas non-
proliferating cells mainly produce energy by oxidative phosphorylation, proliferative cells
and cancer cells also get a significant part of their energy from aerobic glycolysis [48].
During aerobic glycolysis cancer cells convert pyruvate into lactate—a process normally
inhibited by the presence of oxygen. HK2 is overexpressed in many human cancers and has
been reported to be involved in maintenance of the malignant state of tumors [44]. The
overexpression of HK2 in cancer is thought to provide cancer cells with a growth advantage
due to increase glycolytic flux by promoting the first step of glycolysis and thus
Page 14
promoting/inducing the shift towards aerobic glycolysis. This type of catabolism of glucose
with lactate as the end product produces significantly less ATP than oxidative
phosphorylation, but even though the ATP production is reduced, this shift is thought to
provide rapidly dividing cancer cells with certain advantages, such as the biosynthesis of
nucleic acids as well as providing the cofactor NADPH for synthesis of phospholipids and
fatty acids though the pentose phosphate pathway [48]. In addition to creating an acid
environment protecting against the immune system and favouring invasion of surrounding
tissue [48]. Finally, the Warburg effect also makes the cells less dependent on oxygen, which
ensures survival during hypoxic and anoxic conditions.
Here, we reported the identification of HK2 as a target of miR-143, confirming the down-
regulation of HK2 upon miR-143 overexpression of transcript cells as well as protein level in
both DLD-1 and HCT116 colon cancer cell lines. Interestingly the expression level of HK2 is
markedly different between DLD-1 and HCT116 cells. This might be due to different
mutations in the two cell lines that are giving rise to the tumorigenic phenotype or different
metabolic adaptations to the need for a fast proliferation. By mutation of the miR-143 binding
site in the 3′UTR of HK2 we showed that the target interaction between miR-143 and HK2 is
direct. We further showed that inhibition of HK2 results in a reduction in cellular
proliferation of DLD-1 colon cancer cells, an effect that resembles the effect of miR-143
overexpression. Interestingly, the decreased cell proliferation observed upon HK2 siRNA-
mediated knockdown was not as strong as for miR-143 overexpression. This suggests that
additional miR-143 targets besides HK2 may also be responsible for the growth inhibitory
effect of miR-143. In support of miR-143’s role in glucose metabolism we showed that
overexpression of miR-143 in DLD-1 cells leads to a reduced lactate secretion. However, the
decrease in lactate secretion as a result of miR-143 overexpression is not as marked as the
decrease observed upon HK2 siRNA mediated knockdown. This might be explained by the
fact that miR-143 only mediates a relatively moderate reduction of HK2 protein level
compared with the siRNA mediated knockdown of HK2.
Conclusion
Here, we have identified a number of putative miR-143 targets in colon cancer cells. We
verified HK2 as a direct target of miR-143 and show that miR-143 mediated down-regulation
of HK2 results in a decreased lactate secretion. We speculate that loss of miR-143 in cancer
cells might promote the metabolic shift towards aerobic glycolysis due to up-regulation of
HK2.
Competing interests
The authors declare that they have no competing interests.
Authors’ contributions
LHG carried out experiments and analysis of the microarray data. AJ developed the word
analysis tool and carried out analysis of TCGA data. LBF participated in planning and
supervision of experiments. JW carried out the GSEA analysis and helped with statistical
analysis. AK and AHL conceived the study and participated in its design. LHG and AHL
wrote the manuscript. All authors read and approved the final manuscript.
Page 15
Acknowledgements
Work in the authors’ laboratories are supported by EC FP7 funding (ONCOMIRS, grant
agreement number 201102; this publication reflects only authors’ views; the commission is
not liable for any use that may be made of the information herein), the Novo Nordisk
Foundation, The Lundbeck Foundation, The Danish National Research Foundation, The
Danish Medical Research Council, The Danish Cancer Society and the Danish National
Advanced Technology Foundation.
References
1. Bartel DP: MicroRNAs: target recognition and regulatory functions. Cell 2009,
136:215–233.
2. Krol J, Loedige I, Filipowicz W: The widespread regulation of microRNA biogenesis,
function and decay. Nat Rev Genet 2010, 11:597–610.
3. Fabian MR, Sonenberg N, Filipowicz W: Regulation of mRNA translation and stability
by microRNAs. Annu Rev Biochem 2010, 79:351–379.
4. Flynt AS, Lai EC: Biological principles of microRNA-mediated regulation: shared
themes amid diversity. Nat Rev Genet 2008, 9:831–842.
5. Ventura A, Jacks T: MicroRNAs and cancer: short RNAs go a long way. Cell 2009,
136:586–591.
6. Calin GA, Liu CG, Sevignani C, Ferracin M, Felli N, Dumitru CD, Shimizu M, Cimmino
A, Zupo S, Dono M, et al: MicroRNA profiling reveals distinct signatures in B cell
chronic lymphocytic leukemias. Proc Natl Acad Sci U S A 2004, 101:11755–11760.
7. Volinia S, Calin GA, Liu CG, Ambs S, Cimmino A, Petrocca F, Visone R, Iorio M, Roldo
C, Ferracin M, et al: A microRNA expression signature of human solid tumors defines
cancer gene targets. Proc Natl Acad Sci U S A 2006, 103:2257–2261.
8. Garzon R, Calin GA, Croce CM: MicroRNAs in cancer. Annu Rev Med 2009, 60:167–
179.
9. Esquela-Kerscher A, Slack FJ: Oncomirs—microRNAs with a role in cancer. Nat Rev
Cancer 2006, 6:259–269.
10. Si ML, Zhu S, Wu H, Lu Z, Wu F, Mo YY: miR-21-mediated tumor growth. Oncogene
2007, 26:2799–2803.
11. He L, Thomson JM, Hemann MT, Hernando-Monge E, Mu D, Goodson S, Powers S,
Cordon-Cardo C, Lowe SW, Hannon GJ, Hammond SM: A microRNA polycistron as a
potential human oncogene. Nature 2005, 435:828–833.
12. Calin GA, Sevignani C, Dumitru CD, Hyslop T, Noch E, Yendamuri S, Shimizu M,
Rattan S, Bullrich F, Negrini M, Croce CM: Human microRNA genes are frequently
Page 16
located at fragile sites and genomic regions involved in cancers. Proc Natl Acad Sci U S A
2004, 101:2999–3004.
13. Akao Y, Nakagawa Y, Kitade Y, Kinoshita T, Naoe T: Downregulation of microRNAs-
143 and -145 in B-cell malignancies. Cancer Sci 2007, 98:1914–1920.
14. Akao Y, Nakagawa Y, Naoe T: MicroRNA-143 and -145 in colon cancer. DNA Cell
Biol 2007, 26:311–320.
15. Chen X, Guo X, Zhang H, Xiang Y, Chen J, Yin Y, Cai X, Wang K, Wang G, Ba Y, et
al: Role of miR-143 targeting KRAS in colorectal tumorigenesis. Oncogene 2009,
28:1385–1392.
16. Lui WO, Pourmand N, Patterson BK, Fire A: Patterns of known and novel small RNAs
in human cervical cancer. Cancer Res 2007, 67:6031–6043.
17. Michael MZ, O’Connor SM, van Holst Pellekaan NG, Young GP, James RJ: Reduced
accumulation of specific microRNAs in colorectal neoplasia. Mol Cancer Res 2003,
1:882–891.
18. Ng EK, Tsang WP, Ng SS, Jin HC, Yu J, Li JJ, Rocken C, Ebert MP, Kwok TT, Sung JJ:
MicroRNA-143 targets DNA methyltransferases 3A in colorectal cancer. Br J Cancer
2009, 101:699–706.
19. Porkka KP, Pfeiffer MJ, Waltering KK, Vessella RL, Tammela TL, Visakorpi T:
MicroRNA expression profiling in prostate cancer. Cancer Res 2007, 67:6130–6135.
20. Slaby O, Svoboda M, Fabian P, Smerdova T, Knoflickova D, Bednarikova M, Nenutil R,
Vyzula R: Altered expression of miR-21, miR-31, miR-143 and miR-145 is related to
clinicopathologic features of colorectal cancer. Oncology 2007, 72:397–402.
21. Wang CJ, Zhou ZG, Wang L, Yang L, Zhou B, Gu J, Chen HY, Sun XF:
Clinicopathological significance of microRNA-31, -143 and -145 expression in colorectal
cancer. Dis Markers 2009, 26:27–34.
22. Ugras S, Brill ER, Jacobsen A, Hafner M, Socci N, Decarolis PL, Khanin R, O'Connor
RB, Mihailovic A, Taylor BS, et al: Small RNA sequencing and functional
characterization reveals microRNA-143 tumor suppressor activity in liposarcoma. Cancer Res 2011, 71:5659–5669.
23. Elia L, Quintavalle M, Zhang J, Contu R, Cossu L, Latronico MV, Peterson KL, Indolfi
C, Catalucci D, Chen J, et al: The knockout of miR-143 and -145 alters smooth muscle
cell maintenance and vascular homeostasis in mice: correlates with human disease. Cell
Death Differ 2009, 16:1590–1598.
24. Esau C, Kang X, Peralta E, Hanson E, Marcusson EG, Ravichandran LV, Sun Y, Koo S,
Perera RJ, Jain R, et al: MicroRNA-143 regulates adipocyte differentiation. J Biol Chem
2004, 279:52361–52365.
Page 17
25. Xie H, Lim B, Lodish HF: MicroRNAs induced during adipogenesis that accelerate
fat cell development are downregulated in obesity. Diabetes 2009, 58:1050–1057.
26. Cordes KR, Sheehy NT, White MP, Berry EC, Morton SU, Muth AN, Lee TH, Miano
JM, Ivey KN, Srivastava D: miR-145 and miR-143 regulate smooth muscle cell fate and
plasticity. Nature 2009, 460:705–710.
27. Gregersen LH, Jacobsen AB, Frankel LB, Wen J, Krogh A, Lund AH: MicroRNA-145
targets YES and STAT1 in colon cancer cells. PLoS One 2010, 5:e8836.
28. Frankel LB, Christoffersen NR, Jacobsen A, Lindow M, Krogh A, Lund AH:
Programmed cell death 4 (PDCD4) is an important functional target of the microRNA
miR-21 in breast cancer cells. J Biol Chem 2008, 283:1026–1033.
29. Yuan S, Fu Y, Wang X, Shi H, Huang Y, Song X, Li L, Song N, Luo Y: Voltage-
dependent anion channel 1 is involved in endostatin-induced endothelial cell apoptosis. FASEB J 2008, 22:2809–2820.
30. G Smyth: Limma: linear models for microarray data. In Bioinformatics and
Computational Biology, Solutions using R and Bioconductor. Edited by Gentleman R, Carey
V, Dudoit S, Irizarry R, Huber W. New York: Springer; 2005:397–420.
31. Kanehisa M, Goto S: KEGG: kyoto encyclopedia of genes and genomes. Nucleic Acids
Res 2000, 28:27–30.
32. Subramanian A, Tamayo P, Mootha VK, Mukherjee S, Ebert BL, Gillette MA, Paulovich
A, Pomeroy SL, Golub TR, Lander ES, Mesirov JP: Gene set enrichment analysis: a
knowledge-based approach for interpreting genome-wide expression profiles. Proc Natl
Acad Sci U S A 2005, 102:15545–15550.
33. Luo W, Friedman MS, Shedden K, Hankenson KD, Woolf PJ: GAGE: generally
applicable gene set enrichment for pathway analysis. BMC Bioinforma 2009, 10:161.
34. Jacobsen A, Wen J, Marks DS, Krogh A: Signatures of RNA binding proteins globally
coupled to effective microRNA target sites. Genome Res 2010, 20:1010–1019.
35. Lewis MJ, Wiebe JP, Heathcote JG: Expression of progesterone metabolizing enzyme
genes (AKR1C1, AKR1C2, AKR1C3, SRD5A1, SRD5A2) is altered in human breast
carcinoma. BMC Cancer 2004, 4:27.
36. Ajiro M, Katagiri T, Ueda K, Nakagawa H, Fukukawa C, Lin ML, Park JH, Nishidate T,
Daigo Y, Nakamura Y: Involvement of RQCD1 overexpression, a novel cancer-testis
antigen, in the Akt pathway in breast cancer cells. Int J Oncol 2009, 35:673–681.
37. Zhang J, Liu X, Datta A, Govindarajan K, Tam WL, Han J, George J, Wong C,
Ramnarayanan K, Phua TY, et al: RCP is a human breast cancer-promoting gene with
Ras-activating function. J Clin Invest 2009, 119:2171–2183.
Page 18
38. Sadanandam A, Varney ML, Singh S, Ashour AE, Moniaux N, Deb S, Lele SM, Batra
SK, Singh RK: High gene expression of semaphorin 5A in pancreatic cancer is associated
with tumor growth, invasion and metastasis. Int J Cancer 2010, 127:1373–1383.
39. Pan GQ, Ren HZ, Zhang SF, Wang XM, Wen JF: Expression of semaphorin 5A and its
receptor plexin B3 contributes to invasion and metastasis of gastric carcinoma. World J
Gastroenterol 2009, 15:2800–2804.
40. Kamiyama S, Ichimiya T, Ikehara Y, Takase T, Fujimoto I, Suda T, Nakamori S,
Nakamura M, Nakayama F, Irimura T, et al: Expression and the role of 3′-
phosphoadenosine 5′-phosphosulfate transporters in human colorectal carcinoma. Glycobiology 2011, 21:235–246.
41. Nandan MO, Yoon HS, Zhao W, Ouko LA, Chanchevalap S, Yang VW: Kruppel-like
factor 5 mediates the transforming activity of oncogenic H-Ras. Oncogene 2004,
23:3404–3413.
42. Liu YL, Yang YM, Xu H, Dong XS: Aberrant expression of USP22 is associated with
liver metastasis and poor prognosis of colorectal cancer. J Surg Oncol 2010, 103:283–
289.
43. Zhang Y, Yao L, Zhang X, Ji H, Wang L, Sun S, Pang D: Elevated expression of USP22
in correlation with poor prognosis in patients with invasive breast cancer. J Cancer Res
Clin Oncol 2011, 137:1245–1253.
44. Mathupala SP, Ko YH, Pedersen PL: Hexokinase II: cancer’s double-edged sword
acting as both facilitator and gatekeeper of malignancy when bound to mitochondria. Oncogene 2006, 25:4777–4786.
45. Wen J, Parker BJ, Jacobsen A, Krogh A: MicroRNA transfection and AGO-bound
CLIP-seq data sets reveal distinct determinants of miRNA action. RNA 2011, 17:820–
834.
46. Guo H, Ingolia NT, Weissman JS, Bartel DP: Mammalian microRNAs predominantly
act to decrease target mRNA levels. Nature 2010, 466:835–840.
47. Warburg O: On respiratory impairment in cancer cells. Science 1956, 124:269–270.
48. Vander Heiden MG, Cantley LC, Thompson CB: Understanding the Warburg effect:
the metabolic requirements of cell proliferation. Science 2009, 324:1029–1033.
Additional files
Additional_file_1 as DOCX Additional file 1: Table S1. Primer sequences used for quantitative RT-PCR
Additional_file_2 as PDF Additional file 2: Figures S1–S4. Format: PDF.
Page 19
Additional_file_3 as DOCX Additional file 3: Table S2. Enriched motifs among miR-143 down-regulated genes.
Additional_file_4 as DOCX Additional file 4: Table S3. List of putative miR-143 targets (defined as down-regulated
transcripts with at least one miR-143 7mer, 7mer-1A or 8mer seed site in their 3′UTRs)
Page 20
0
5
10
15
20
25
day 0 day 1 day 2 day 3 day 4
Ce
ll n
um
be
r re
lati
ve
to
da
y 0
mock
Scramble
miR-143
Figure 1
Page 23
HK2
Tubulin
mock
HK
2 s
iRN
A
0
0.2
0.4
0.6
0.8
1
1.2
1.4
HK2 mRNA
Rela
tive m
RN
A e
xpre
ssio
n
mock
0
0.2
0.4
0.6
0.8
1
1.2
moc
k
HK2
siRNA
miR
-143
Cell
num
ber
rela
tive to m
ock
0.6
0.8
1
1.2
1.4
1.6
0 10 20 30 40 50
Hours post-transfection
nm
ol la
cta
te/µ
l
mock
miR143
HK2 siRNA
Scramble
A B C
DScr
amble
HK2 siRNA
**
******
*
*
Figure 4
Page 24
Additional files provided with this submission:
Additional file 1: 1863259038624470_add1.docx, 12Khttp://www.biomedcentral.com/imedia/5205945167470971/supp1.docxAdditional file 2: 1863259038624470_add2.pdf, 16Khttp://www.biomedcentral.com/imedia/1613698257747097/supp2.pdfAdditional file 3: 1863259038624470_add3.docx, 11Khttp://www.biomedcentral.com/imedia/1799740355747097/supp3.docxAdditional file 4: 1863259038624470_add4.docx, 20Khttp://www.biomedcentral.com/imedia/1100584705747097/supp4.docx