Current Account Imbalances in the Euro Area Alan Ahearne Bruegel, Brussels and National University of Galway, Ireland Birgit Schmitz University of Bonn Jürgen von Hagen Bruegel, Brussels, University of Bonn, Indiana University, and CEPR Draft, August 2007 Abstract The dispersion in current account balances among countries in the euro area has widened markedly over the past decade-and-a-half, and especially since 1999. We decompose current account positions for euro area countries into intra-euro-area balances and extra-euro-area balances and examine the determinants of these balances. Regarding intra-euro-area balances, we present evidence that capital tends to flow from high-income euro area economies to low-income euro area economies. These flows have increased since the creation of the single currency in Europe. We construct a novel data set regarding extra-euro-area balances. The data set contains, for the euro area and the most important member economies, exports and imports to and from the 10 respective most important trade partners outside the euro area. This allows us to study the determinants of the extra-euro current account and its interaction with intra-euro area trade balances. We estimate a model of the trade balance of the euro area and individual euro-area countries with the rest of the world. We find that a real appreciation of the euro against the currencies of its main trading partners appears to have a substantial effect on the euro area’s net exports in the long run, though the immediate effect is small. Our estimates for individual countries suggest that the adjustment to a real appreciation of the euro would not be equally distributed across euro-area countries. In particular, Germany would bear the largest share of the adjustment, while the other large euro-area economies would be relatively unaffected. Finally, we find that the introduction of the euro seems to have changed the dynamics of trade balance adjustment in three of the larger euro-area economies. The authors thank Narcissa Balta, Kristin Langwasser, and Patrick Rossol for excellent research assistance. Emails: [email protected], [email protected], [email protected]
Transcript
Current Account Imbalances in the Euro Area
Alan Ahearne
Bruegel, Brussels and National University of Galway, Ireland
Birgit Schmitz University of Bonn
Jürgen von Hagen
Bruegel, Brussels, University of Bonn, Indiana University, and CEPR
Draft, August 2007
Abstract
The dispersion in current account balances among countries in the euro area has widened markedly over the past decade-and-a-half, and especially since 1999. We decompose current account positions for euro area countries into intra-euro-area balances and extra-euro-area balances and examine the determinants of these balances. Regarding intra-euro-area balances, we present evidence that capital tends to flow from high-income euro area economies to low-income euro area economies. These flows have increased since the creation of the single currency in Europe. We construct a novel data set regarding extra-euro-area balances. The data set contains, for the euro area and the most important member economies, exports and imports to and from the 10 respective most important trade partners outside the euro area. This allows us to study the determinants of the extra-euro current account and its interaction with intra-euro area trade balances. We estimate a model of the trade balance of the euro area and individual euro-area countries with the rest of the world. We find that a real appreciation of the euro against the currencies of its main trading partners appears to have a substantial effect on the euro area’s net exports in the long run, though the immediate effect is small. Our estimates for individual countries suggest that the adjustment to a real appreciation of the euro would not be equally distributed across euro-area countries. In particular, Germany would bear the largest share of the adjustment, while the other large euro-area economies would be relatively unaffected. Finally, we find that the introduction of the euro seems to have changed the dynamics of trade balance adjustment in three of the larger euro-area economies. The authors thank Narcissa Balta, Kristin Langwasser, and Patrick Rossol for excellent research assistance. Emails: [email protected], [email protected], [email protected]
2
1. Introduction The observation of rising and persistent global imbalances has been the focus
of lively debate among policymakers and academic economists in recent years. Most
of that debate has concentrated on the large U.S. current account deficit and its main
counterpart, the large current account surpluses of countries in Asia. Europe has not
attracted much attention in this debate, most likely because European countries and
the European Union as a whole have a long tradition of keeping their current accounts
relatively close to balance (see Ahearne and von Hagen, 2005). Nevertheless, current
account developments in Europe deserve attention for several reasons. For starters,
current account imbalances within the EU and, in particular, among the countries
participating in European Monetary Union (EMU) have grown considerably in recent
years. A natural question to ask is whether these imbalances can be explained by
fundamental economic factors or whether they might point to a potential non-
sustainability of the common currency.
In addition, as argued in Ahearne and von Hagen (2005), Europe, and the euro
area in particular, might be forced to run significant current account deficits in the
future, if the United States takes action to close its current account deficit or the U.S.
dollar depreciates sharply and the Asian countries insist on running surpluses and start
accumulating euro reserves instead of dollar reserves. The question here is: What are
the consequences of a significant appreciation of the euro for the euro area’s current
account position?
This paper explores the determinants of the current account balances of the
euro area and individual member countries of the euro area. We are interested in both
intra-euro-area and extra-euro-area current account balances. Below, we look at the
issue from two perspectives. The first interprets current account balances as the
counterpart of capital flows and asks to what extent they can be explained by
economic convergence among countries with different per-capita incomes. The
second perspective interprets current accounts in the traditional way of exports and
imports of goods and services and asks to what extent they can be explained by
movements in aggregate real incomes and real exchange rates.
We have divided the paper into 5 sections. After this brief introduction, we
present some stylised facts on current account balances in the euro area. In Section 3,
we present evidence that capital tends to flow from high-income euro area economies
to low-income euro area economies. These flows have increased since the creation of
3
the single currency in Europe. In Section 4, we turn our attention to extra-EMU trade
and estimate a model of the trade balance of the euro area and individual member
countries of the euro area with the rest of the world. We find that a real appreciation
of the euro against the currencies of its main trading partners appears to have a
substantial effect on the euro area’s net exports in the long run, though the immediate
effect is small. Our estimates for individual countries suggest that the adjustment to a
real appreciation of the euro would not be equally distributed across euro-area
countries. In particular, Germany would bear the largest share of the adjustment,
while the other large euro-area economies would be relatively unaffected. Finally, we
find that the introduction of the euro seems to have changed the dynamics of trade
balance adjustment in three of the larger euro-area economies. We close with a few
concluding remarks.
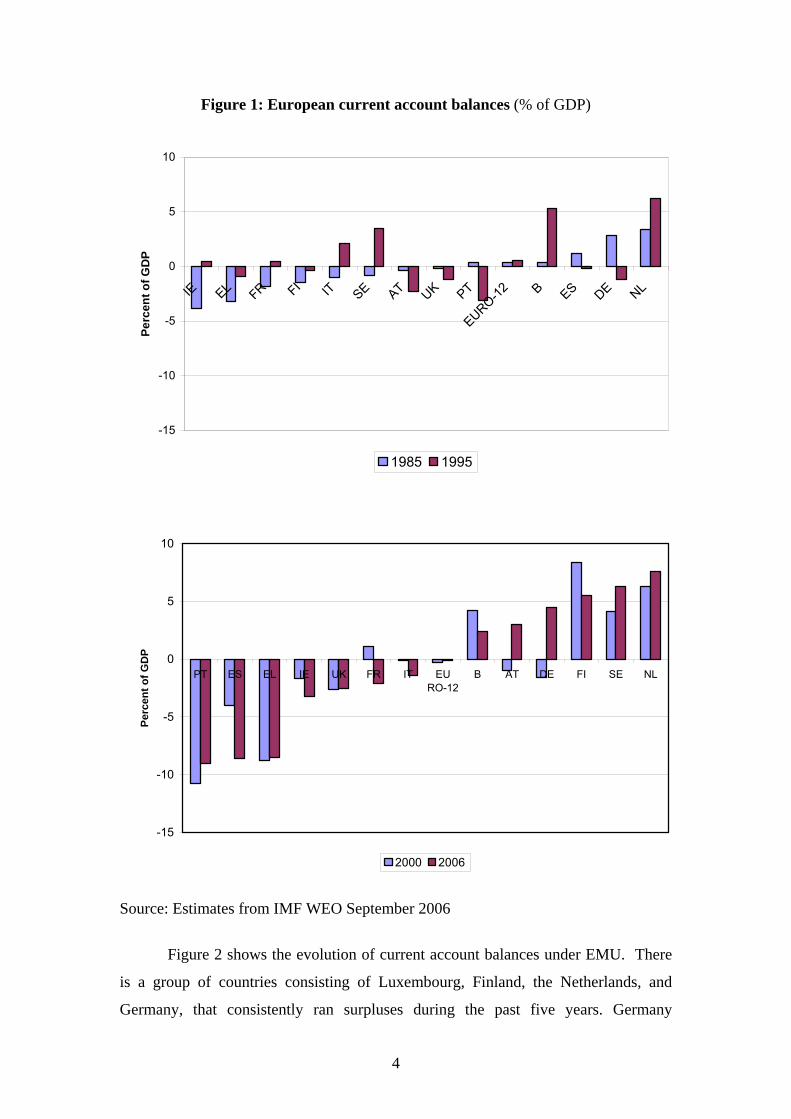
2. Stylized facts This section presents some of the main stylised facts about individual EMU
member countries’ current account balances. Figure 1 shows the current account
balances for the euro area as a whole and for individual EU countries in selected years
since 1985. As an aggregate, the euro area tends to be financially largely self-
contained and contribute little to absorb current account imbalances in other parts of
the world. Current account balances were typically small over this 20 year period,
with 1995 being a noticeable exception. This is not withstanding the fact that some
EU countries have sizable current account imbalances. Germany, for example, has
recorded annual surpluses of around $100 billion in recent years. Germany’s surplus
is estimated to have reached 4¼ percent of GDP in 2006. This has brought Germany
back to its traditional position of surplus, which we observe in 1985. Finland, Sweden,
and the Netherlands have run even larger surpluses relative to GDP in the past six
years. In contrast, Portugal’s current account deficit was nearly 10 percent of GDP in
2006, while deficits in Greece and Spain exceeded 8 percent of GDP. All three
countries have had sizeable deficits since the start of EMU.1
1 See Blanchard and Giavazzi (2002) for a discussion of Greece and Portugal in this regard..
4
Figure 1: European current account balances (% of GDP)
-15
-10
-5
0
5
10
IE EL FR FI IT SE AT UK PT
EURO-12 B ES DE NL
Perc
ent o
f GD
P
1985 1995
-15
-10
-5
0
5
10
PT ES EL IE UK FR IT EURO-12
B AT DE FI SE NL
Perc
ent o
f GD
P
2000 2006
Source: Estimates from IMF WEO September 2006
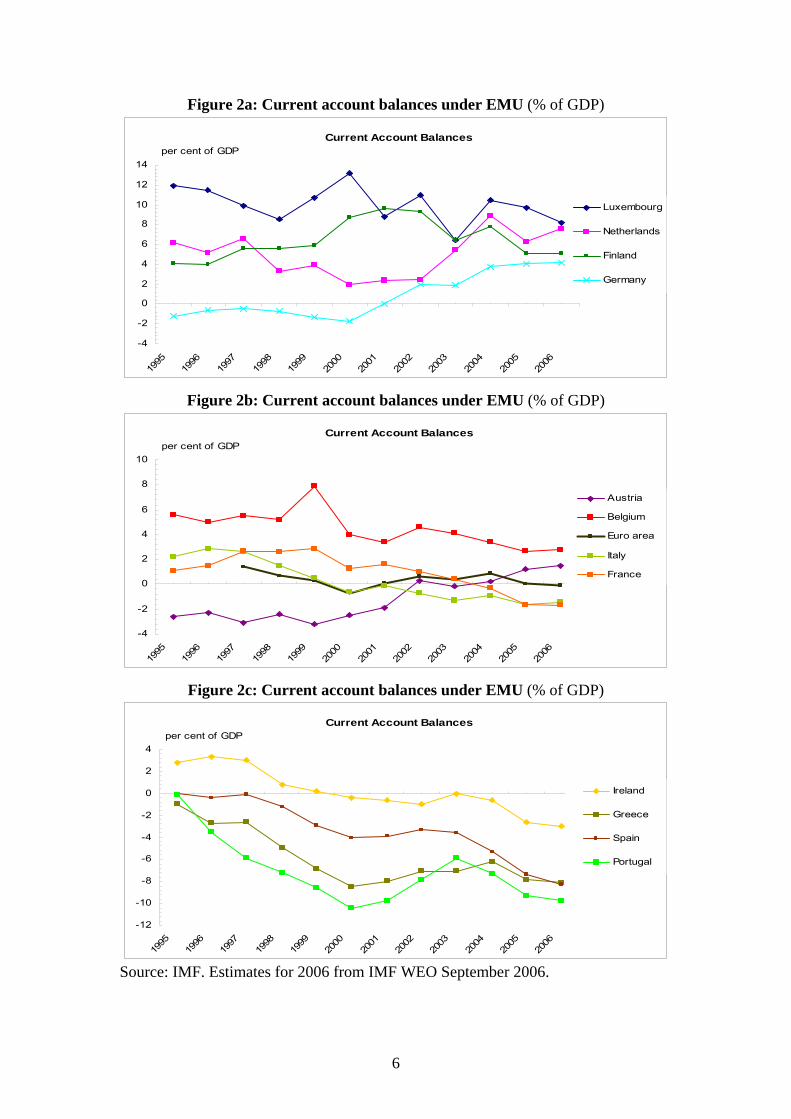
Figure 2 shows the evolution of current account balances under EMU. There
is a group of countries consisting of Luxembourg, Finland, the Netherlands, and
Germany, that consistently ran surpluses during the past five years. Germany
5
registered small current account deficits averaging about 1 percent of GDP during
most of the 1990s. The German balance swung into surplus in 2002 and the surplus
has widened steadily over recent years as German exports have outpaced imports.
Recent years have also seen a marked increase in the current account surplus in the
Netherlands, while Finland’s surplus has returned to roughly its level at the beginning
of EMU, after widening to nearly 10 percent in 2001.
At the other end of the spectrum, Greece, Portugal, and Spain have
consistently run current account deficits in the past five years, and their deficits have
widened significantly under EMU and during the period in the run-up to EMU. All
three countries had current account positions close to balance around the mid-1990s.
Recent years have seen an especially sharp decline in Spain’s current account balance
from roughly 3½ percent of GDP in 2003 to an estimated 8¼ percent of GDP in 2006.
Current account deficits of the magnitudes seen in Greece, Portugal, and Spain
at present are unprecedented among euro area countries, with the exception of Ireland
in the mid-1980s and Portugal in the 1970s (European Commission, 2006). Current
account deficits of more than 8 percent of GDP are also large compared with other
non-euro-area advanced economies. Continual current account deficits accumulate to
the net international investment position. Net external liabilities relative to GDP have
soared to nearly 80 percent in Greece, 60 percent in Portugal, and 40 percent in Spain.
One interpretation of the evolution of current account balances under EMU is
that the increased dispersion of current account positions has been driven by trade
flows that reflect shifts in relative competitiveness within the euro area. (See, for
example, Blanchard 2006, European Commission 2006, and Munchau 2006).
6
Figure 2a: Current account balances under EMU (% of GDP)
Current Account Balances
-4
-2
0
2
4
6
8
10
12
14
1995
1996
1997
1998
1999
2000
2001
2002
2003
2004
2005
2006
Luxembourg
Netherlands
Finland
Germany
per cent of GDP
Figure 2b: Current account balances under EMU (% of GDP)
Current Account Balances
-4
-2
0
2
4
6
8
10
1995
1996
1997
1998
1999
2000
2001
2002
2003
2004
2005
2006
Austria
Belgium
Euro area
Italy
France
per cent of GDP
Figure 2c: Current account balances under EMU (% of GDP)
Current Account Balances
-12
-10
-8
-6
-4
-2
0
2
4
1995
1996
1997
1998
1999
2000
2001
2002
2003
2004
2005
2006
Ireland
Greece
Spain
Portugal
per cent of GDP
Source: IMF. Estimates for 2006 from IMF WEO September 2006.
7
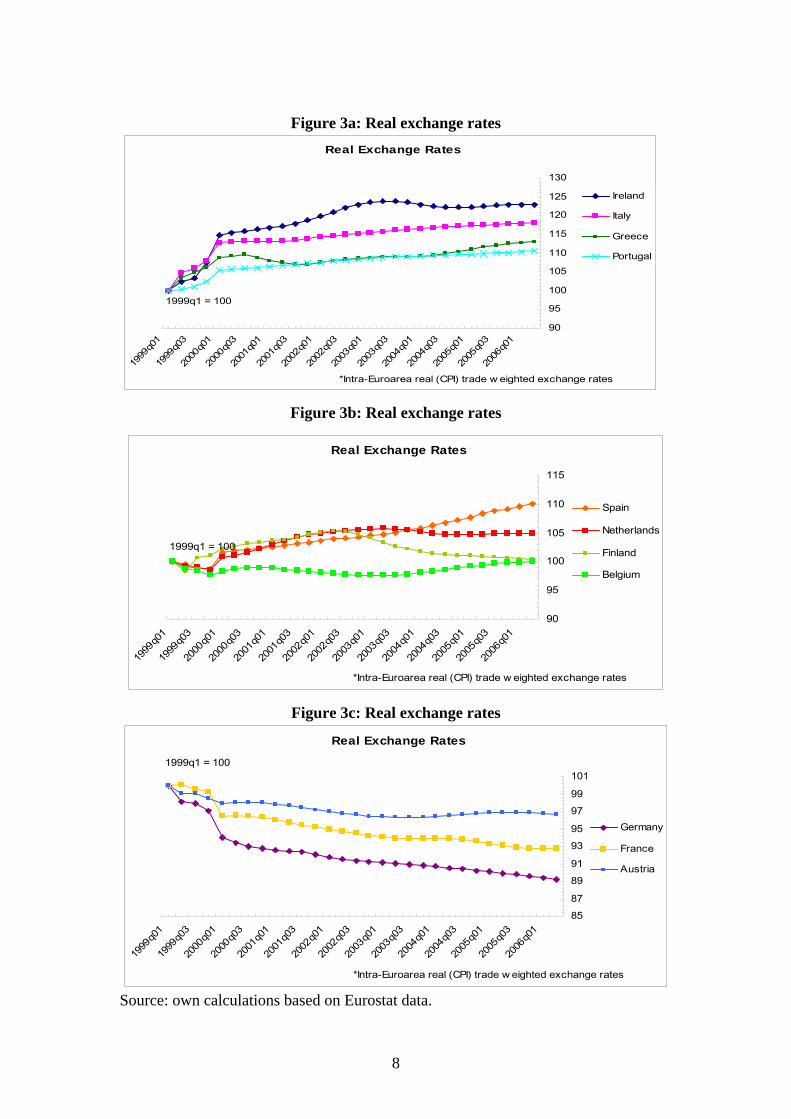
On this account, aggregate demand was too strong in some countries and too
weak in others, resulting in persistent differences in inflation rates across countries.
In fact, the size and persistence of inflation differentials at the national level is one of
the most widely recognized and documented facts relating to the start of EMU. As a
result of persistent differences in inflation across countries, euro area economies have
experienced very sizeable swings in the real exchange rates vis-à-vis their peers, as
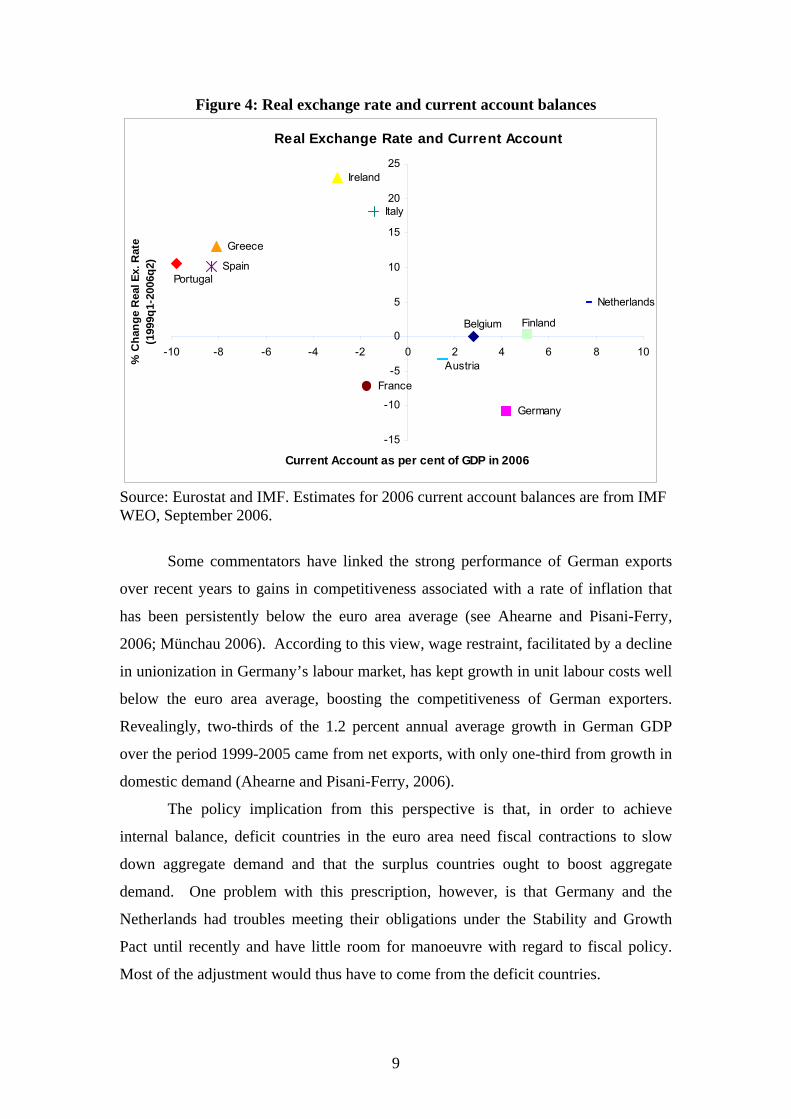
shown in Figure 3. In turn, the changes in competitiveness associated with these
movements in real exchange rates may have played a role in bringing about the large
swings in current account balances. The relationship between real exchange rate
developments and current account balances portrayed in Figure 4 appears to confirm
that countries that have gained (lost) competitiveness relative to other euro-area
countries during EMU are now running large current account surpluses (deficits).
In particular, Blanchard (2006) ascribes Portugal’s economic boom in the late
1990s to the sharp drop in interest rates and heightened expectations for faster
convergence that resulted from participation in EMU. Rapid economic growth and a
decline in unemployment lead to an increase in wage growth to a rate substantially
above the growth in labour productivity. As a result, competitiveness deteriorated
sharply, export growth weakened, and Portugal’s trade and current account deficits
widened markedly. Ahearne and Pisani-Ferry (2006) document that over the period
1999-2005, cumulative growth in Portugal’s gross exports was as much as 10
percentage points below the euro area average. Greece, Italy, and Spain also
experienced relatively sluggish growth in gross exports over this period.
8
Figure 3a: Real exchange rates
Real Exchange Rates
90
95
100
105
110
115
120
125
130
1999
q01
1999
q03
2000
q01
2000
q03
2001
q01
2001
q03
2002
q01
2002
q03
2003
q01
2003
q03
2004
q01
2004
q03
2005
q01
2005
q03
2006
q01
Ireland
Italy
Greece
Portugal
1999q1 = 100
*Intra-Euroarea real (CPI) trade w eighted exchange rates
Figure 3b: Real exchange rates
Real Exchange Rates
90
95
100
105
110
115
1999
q01
1999
q03
2000
q01
2000
q03
2001
q01
2001
q03
2002
q01
2002
q03
2003
q01
2003
q03
2004
q01
2004
q03
2005
q01
2005
q03
2006
q01
Spain
Netherlands
Finland
Belgium
1999q1 = 100
*Intra-Euroarea real (CPI) trade w eighted exchange rates
Figure 3c: Real exchange rates
Real Exchange Rates
85
87
89
91
93
95
97
99
101
1999
q01
1999
q03
2000
q01
2000
q03
2001
q01
2001
q03
2002
q01
2002
q03
2003
q01
2003
q03
2004
q01
2004
q03
2005
q01
2005
q03
2006
q01
Germany
France
Austria
1999q1 = 100
*Intra-Euroarea real (CPI) trade w eighted exchange rates
Source: own calculations based on Eurostat data.
9
Figure 4: Real exchange rate and current account balances
Real Exchange Rate and Current Account
Germany
Ireland
Greece
Spain
France
Italy
Netherlands
Belgium
Austria
Portugal
Finland
-15
-10
-5
0
5
10
15
20
25
-10 -8 -6 -4 -2 0 2 4 6 8 10
Current Account as per cent of GDP in 2006
% C
hang
e R
eal E
x. R
ate
(199
9q1-
2006
q2)
Source: Eurostat and IMF. Estimates for 2006 current account balances are from IMF WEO, September 2006.
Some commentators have linked the strong performance of German exports
over recent years to gains in competitiveness associated with a rate of inflation that
has been persistently below the euro area average (see Ahearne and Pisani-Ferry,
2006; Münchau 2006). According to this view, wage restraint, facilitated by a decline
in unionization in Germany’s labour market, has kept growth in unit labour costs well
below the euro area average, boosting the competitiveness of German exporters.
Revealingly, two-thirds of the 1.2 percent annual average growth in German GDP
over the period 1999-2005 came from net exports, with only one-third from growth in
domestic demand (Ahearne and Pisani-Ferry, 2006).
The policy implication from this perspective is that, in order to achieve
internal balance, deficit countries in the euro area need fiscal contractions to slow
down aggregate demand and that the surplus countries ought to boost aggregate
demand. One problem with this prescription, however, is that Germany and the
Netherlands had troubles meeting their obligations under the Stability and Growth
Pact until recently and have little room for manoeuvre with regard to fiscal policy.
Most of the adjustment would thus have to come from the deficit countries.
10
An important question is how the large current account deficits in Greece,
Portugal, and Spain are being financed. The European Commission (2006) documents
that a large part of the net financial inflows into these countries during EMU have
taken the form of bank loans. For Greece, net portfolio inflows have also been
important. Outflows of foreign direct investment have generally exceeded inflows in
each of the three countries. In Germany, lending abroad by German banks exceeded
foreign borrowing by German banks to the tune of about 2½ percent of GDP annually
on average over the period 1999-2005.
In contrast, in the period 1992-1998, German banks were significant net
borrowers from the rest of the world. One hypothesis is that by eliminating exchange
rate risk, the creation of the single currency in Europe has boosted financial flows
from high-income to low-income countries in the euro area. Financial flows from
high-income countries in the euro area to low-income countries outside of the euro
area have not increased. Of course, EMU has coincided with other efforts to promote
increased financial integration in Europe. In the next section, we examine in more
detail the pattern of net financial flows between European countries and between
European and non-European countries.
3. Net financial flows and EMU The alternative interpretation of current account imbalances is that they reflect
capital flows. Neoclassical growth theory predicts that capital should flow from rich
countries to poor countries. Poor countries have lower levels of capital per worker—
in part, that explains why they are poor. In poor countries, the scarcity of capital
relative to labour should mean that the returns to capital are high. In response, savers
in rich countries should look at poor countries as profitable places in which to invest.2
In this section, we present some simple econometric evidence on the
determinants of capital flows between countries in the EU-15 and between EU-15
countries and non-EU-15 countries. Ideally, we would use individual country data on
intra-EU-15 and extra-EU-15 current account positions to measure financial flows, 2 In reality, surprisingly little capital flows from rich countries to poor countries (see Lucas, 1990). Several candidate explanations have been put forward, including differences in human capital between rich and poor countries as well as failures in international capital markets that might account for the lack of flows. However, none of these candidates can come near to explaining quantitatively the observed shortage of capital flows relative to what economic theory would predict.
11
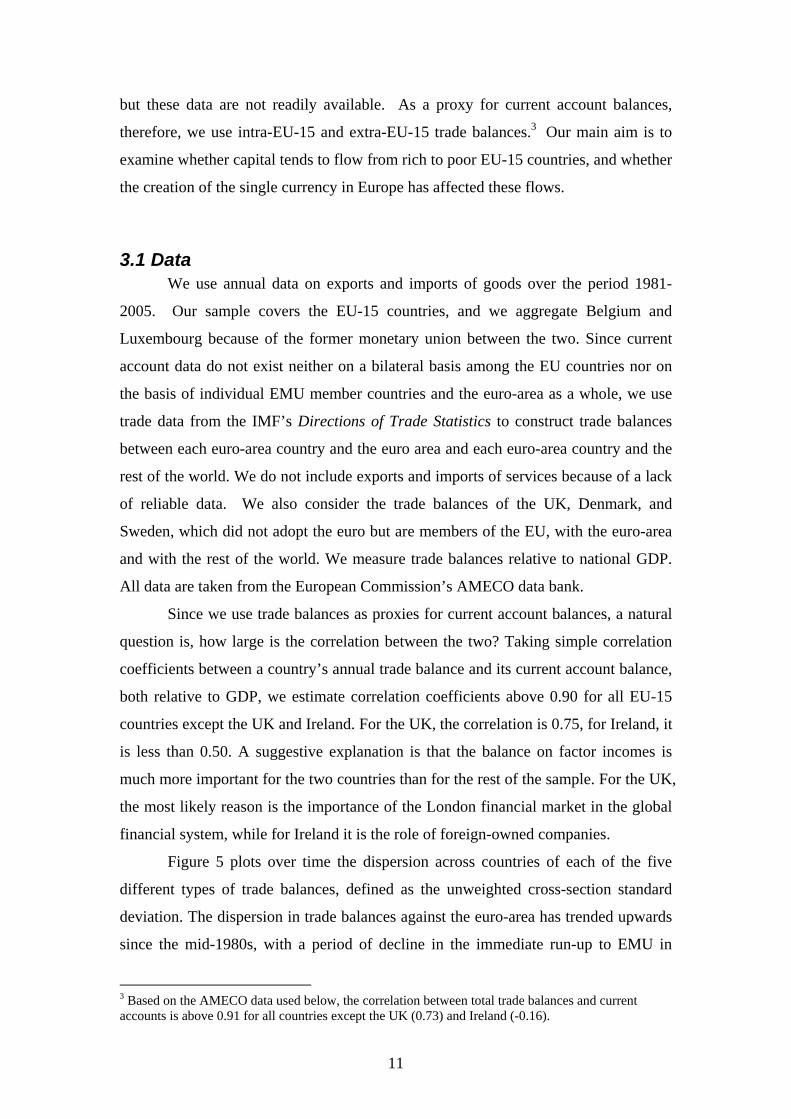
but these data are not readily available. As a proxy for current account balances,
therefore, we use intra-EU-15 and extra-EU-15 trade balances.3 Our main aim is to
examine whether capital tends to flow from rich to poor EU-15 countries, and whether
the creation of the single currency in Europe has affected these flows.
3.1 Data We use annual data on exports and imports of goods over the period 1981-
2005. Our sample covers the EU-15 countries, and we aggregate Belgium and
Luxembourg because of the former monetary union between the two. Since current
account data do not exist neither on a bilateral basis among the EU countries nor on
the basis of individual EMU member countries and the euro-area as a whole, we use
trade data from the IMF’s Directions of Trade Statistics to construct trade balances
between each euro-area country and the euro area and each euro-area country and the
rest of the world. We do not include exports and imports of services because of a lack
of reliable data. We also consider the trade balances of the UK, Denmark, and
Sweden, which did not adopt the euro but are members of the EU, with the euro-area
and with the rest of the world. We measure trade balances relative to national GDP.
All data are taken from the European Commission’s AMECO data bank.
Since we use trade balances as proxies for current account balances, a natural
question is, how large is the correlation between the two? Taking simple correlation
coefficients between a country’s annual trade balance and its current account balance,
both relative to GDP, we estimate correlation coefficients above 0.90 for all EU-15
countries except the UK and Ireland. For the UK, the correlation is 0.75, for Ireland, it
is less than 0.50. A suggestive explanation is that the balance on factor incomes is
much more important for the two countries than for the rest of the sample. For the UK,
the most likely reason is the importance of the London financial market in the global
financial system, while for Ireland it is the role of foreign-owned companies.
Figure 5 plots over time the dispersion across countries of each of the five
different types of trade balances, defined as the unweighted cross-section standard
deviation. The dispersion in trade balances against the euro-area has trended upwards
since the mid-1980s, with a period of decline in the immediate run-up to EMU in
3 Based on the AMECO data used below, the correlation between total trade balances and current accounts is above 0.91 for all countries except the UK (0.73) and Ireland (-0.16).
12
1995-1997. Relative to the rest of the world, the dispersion of trade balances began to
increase much later, i.e., after the breakdown of the European Monetary System in
1992. The observation of widening differences among the total trade balances of EU
member states from the mid-1980s to the early 2000s matches the evidence in
Blanchard (2006), who looks at the total current account of each country with the rest
of the world and shows that the dispersion also increases among OECD countries.
Figure 5 shows that the dispersion of trade balances with the euro-area is consistently
larger than the dispersion of trade balances with the rest of the world, and that the
former has risen faster than the latter since the mid-1980s. Separating euro and non-
euro countries from the EU-15 group makes no significant difference.
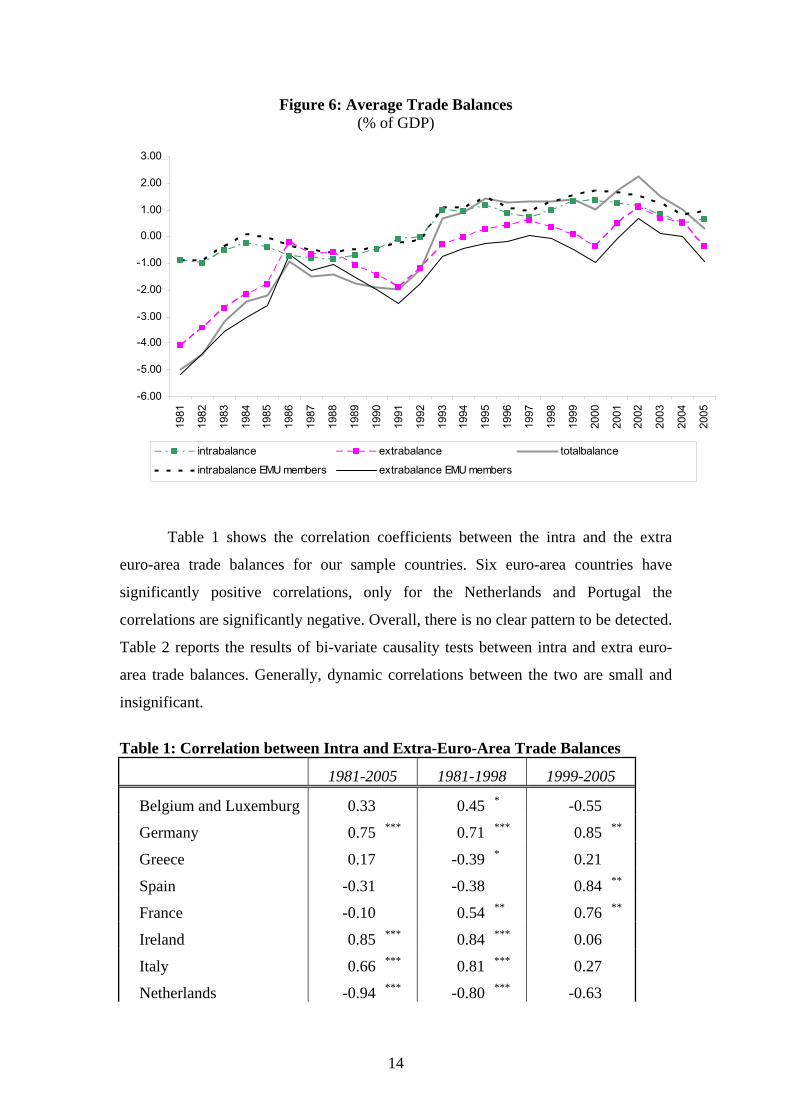
Figure 6 shows the behavior of the (unweighted) average of trade balances
over the past 25 years. It indicates that the average EU country moved from a small
deficit against the euro-area in the 1980s to a small surplus in the 1990s and 2000s
regardless of whether or not it is a member of the euro area. The average trade
balances with regard to the rest of the world was exposed to larger swings in the
1980s, but remained in a range of zero to minus one afterwards. We also counted the
number of years in which a country’s trade balance against its EU partners had the
same or the opposite sign from its trade balance against the rest of the world. Greece
had the same sign on both balances in all 25 years, Portugal in 23 years and Spain in
21 years. In contrast, Germany and the Netherlands had opposite signs on the two
balances in all 25 years. Thus, countries running deficits against their EU partners
consistently in past years tended to borrow from those and from the rest of the world.
In contrast, Germany and the Netherlands tended to borrow from the rest of the world
and lend to other EU countries, thus positioning themselves as financial
intermediaries in Europe.
13
Figure 5: Dispersion of Trade Balances (Standard deviation, % of GDP)
0.00
2.00
4.00
6.00
8.00
10.00
12.00
1981
1982
1983
1984
1985
1986
1987
1988
1989
1990
1991
1992
1993
1994
1995
1996
1997
1998
1999
2000
2001
2002
2003
2004
2005
intrabalance extrabalance totalbalance
intrabalance EMU members extrabalance EMU members
14
Figure 6: Average Trade Balances (% of GDP)
-6.00
-5.00
-4.00
-3.00
-2.00
-1.00
0.00
1.00
2.00
3.00
1981
1982
1983
1984
1985
1986
1987
1988
1989
1990
1991
1992
1993
1994
1995
1996
1997
1998
1999
2000
2001
2002
2003
2004
2005
intrabalance extrabalance totalbalance
intrabalance EMU members extrabalance EMU members
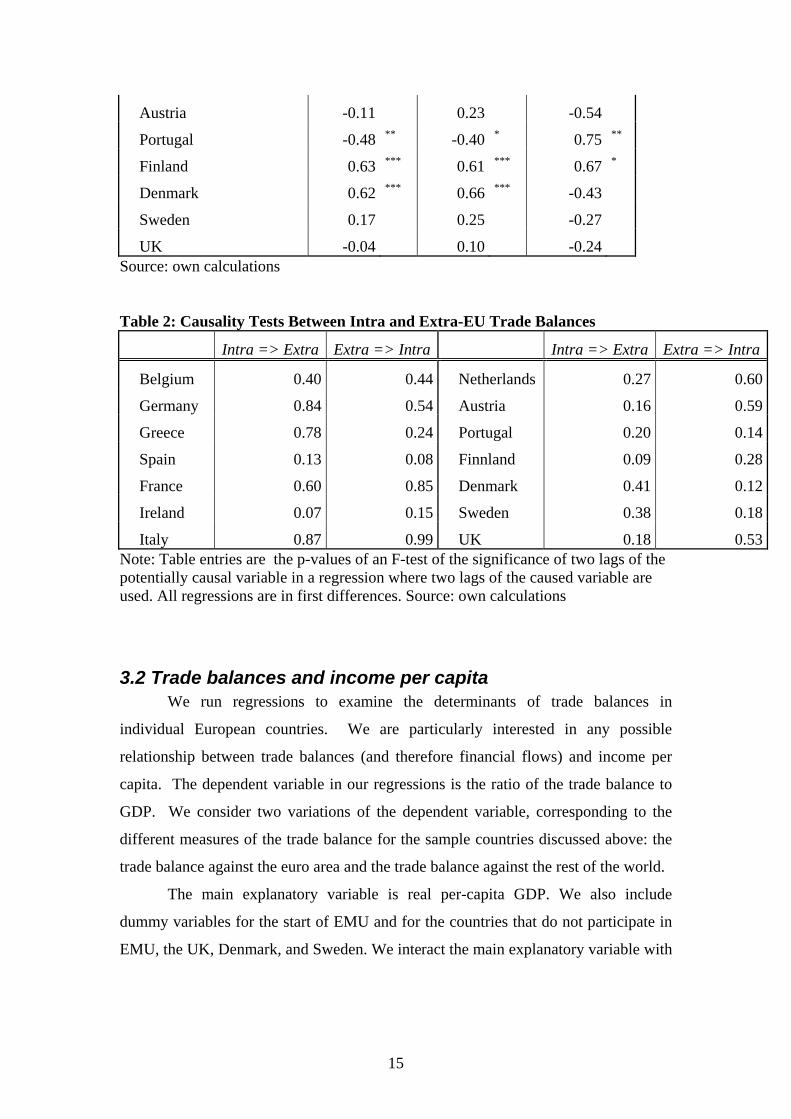
Table 1 shows the correlation coefficients between the intra and the extra
euro-area trade balances for our sample countries. Six euro-area countries have
significantly positive correlations, only for the Netherlands and Portugal the
correlations are significantly negative. Overall, there is no clear pattern to be detected.
Table 2 reports the results of bi-variate causality tests between intra and extra euro-
area trade balances. Generally, dynamic correlations between the two are small and
insignificant.
Table 1: Correlation between Intra and Extra-Euro-Area Trade Balances
1981-2005 1981-1998 1999-2005
Belgium and Luxemburg 0.33 0.45 * -0.55
Germany 0.75 *** 0.71 *** 0.85 **
Greece 0.17 -0.39 * 0.21
Spain -0.31 -0.38 0.84 **
France -0.10 0.54 ** 0.76 **
Ireland 0.85 *** 0.84 *** 0.06
Italy 0.66 *** 0.81 *** 0.27
Netherlands -0.94 *** -0.80 *** -0.63
15
Austria -0.11 0.23 -0.54
Portugal -0.48 ** -0.40 * 0.75 **
Finland 0.63 *** 0.61 *** 0.67 *
Denmark 0.62 *** 0.66 *** -0.43
Sweden 0.17 0.25 -0.27
UK -0.04 0.10 -0.24 Source: own calculations Table 2: Causality Tests Between Intra and Extra-EU Trade Balances
Intra => Extra Extra => Intra Intra => Extra Extra => Intra
Belgium 0.40 0.44 Netherlands 0.27 0.60
Germany 0.84 0.54 Austria 0.16 0.59
Greece 0.78 0.24 Portugal 0.20 0.14
Spain 0.13 0.08 Finnland 0.09 0.28
France 0.60 0.85 Denmark 0.41 0.12
Ireland 0.07 0.15 Sweden 0.38 0.18
Italy 0.87 0.99 UK 0.18 0.53Note: Table entries are the p-values of an F-test of the significance of two lags of the potentially causal variable in a regression where two lags of the caused variable are used. All regressions are in first differences. Source: own calculations
3.2 Trade balances and income per capita We run regressions to examine the determinants of trade balances in
individual European countries. We are particularly interested in any possible
relationship between trade balances (and therefore financial flows) and income per
capita. The dependent variable in our regressions is the ratio of the trade balance to
GDP. We consider two variations of the dependent variable, corresponding to the
different measures of the trade balance for the sample countries discussed above: the
trade balance against the euro area and the trade balance against the rest of the world.
The main explanatory variable is real per-capita GDP. We also include
dummy variables for the start of EMU and for the countries that do not participate in
EMU, the UK, Denmark, and Sweden. We interact the main explanatory variable with
16
these dummies to see whether the introduction of the euro changed the determinants
of net capital flows.4
Our results are presented in Table 3A-B. We report four specifications for
each dependent variable. The first uses only the dummies and GDP-per-capita as
explanatory variables. The second adds the general government balance as a ratio of
GDP and the real price of oil in US dollars. The former is motivated by the effect
public sector deficits have on the current account in conventional macro models. The
latter is motivated by the fact that EU countries except the UK are dependent on oil
imports. The third specification adds time dummies to the model and uses a GLS
estimator accounting for panel heteroskedasticity and first-order autocorrelation of the
residuals. The final specification adds a number of additional explanatory variables as
a robustness check, namely real GDP-per-capita in the EU and a measure of the real
effective exchange rate.
Consider Table 3A, column A. We find that trade surpluses within the euro
area are a positive function of per-capita income and that the relationship is strongly
statistically significant. 5 Generally, countries with larger per-capita GDPs have larger
intra EMU trade balances. Before the start of EMU, the effect of rising GDP per
capita on a country’s intra-EU trade balance is 0.44. The effect is significantly weaker
for the countries that did not join the euro area in 1999. In fact, the sum of the
coefficients on per-capita GDP and the same variable interacted with the dummy for
non-euro area countries is not significantly different from zero, indicating that capital
flows between euro-area and non-euro-area countries did not follow differences in
per-capita GDP before 1999. There is thus a marked difference between the EU
countries that formed the monetary union and those that did not. If we take the extent
to which net capital flows follow differences in per-capita GDP as an indicator of
capital market integration, this difference suggests that the degree of capital market
integration among the countries that formed the monetary union was larger than
between these and the countries that stayed outside.
4 We also included a dummy variable for German unification, but this turned out not to be statistically significant. 5 De Santis and Lührmann (2006) and Chinn and Prasad (2003) find that relative per-capita income has a positive effect on the current account balance in a large panel of countries running from 1970 to 2003. They also employ squared relative income as a regressor. Following their papers, we used squared per capita income as an additional regressor in the models for the intra, extra, and total balances but did not find a significant effect.
17
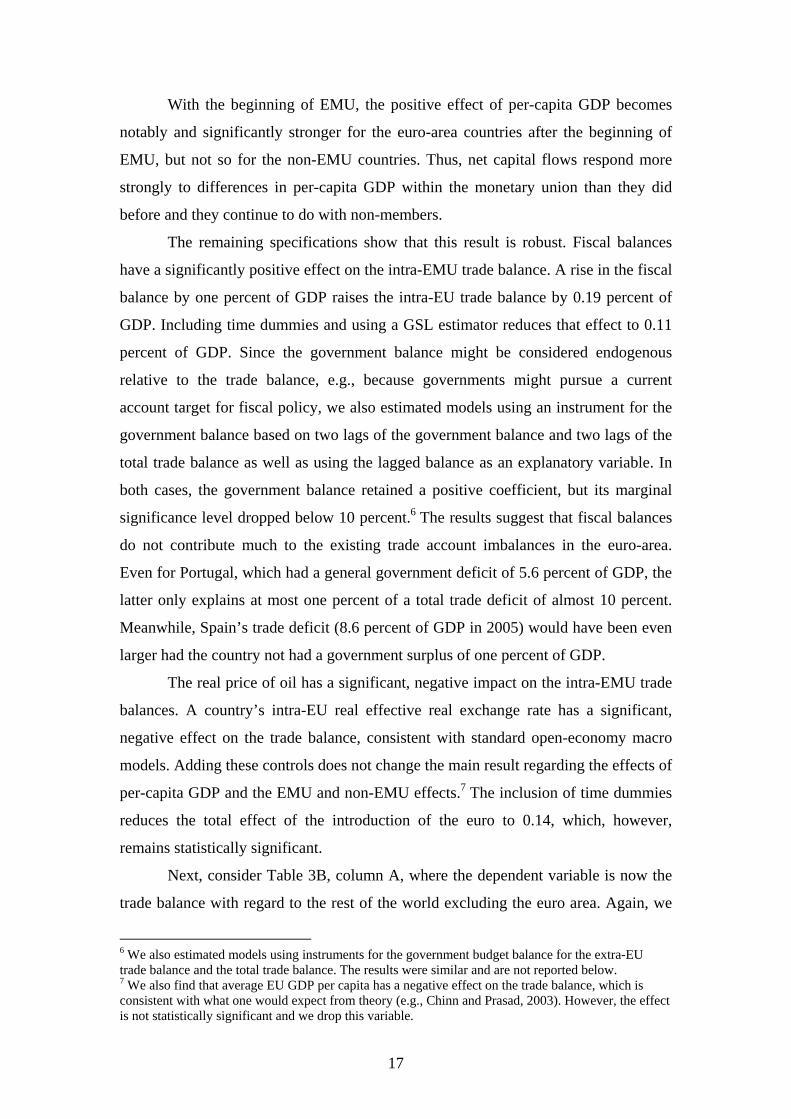
With the beginning of EMU, the positive effect of per-capita GDP becomes
notably and significantly stronger for the euro-area countries after the beginning of
EMU, but not so for the non-EMU countries. Thus, net capital flows respond more
strongly to differences in per-capita GDP within the monetary union than they did
before and they continue to do with non-members.
The remaining specifications show that this result is robust. Fiscal balances
have a significantly positive effect on the intra-EMU trade balance. A rise in the fiscal
balance by one percent of GDP raises the intra-EU trade balance by 0.19 percent of
GDP. Including time dummies and using a GSL estimator reduces that effect to 0.11
percent of GDP. Since the government balance might be considered endogenous
relative to the trade balance, e.g., because governments might pursue a current
account target for fiscal policy, we also estimated models using an instrument for the
government balance based on two lags of the government balance and two lags of the
total trade balance as well as using the lagged balance as an explanatory variable. In
both cases, the government balance retained a positive coefficient, but its marginal
significance level dropped below 10 percent.6 The results suggest that fiscal balances
do not contribute much to the existing trade account imbalances in the euro-area.
Even for Portugal, which had a general government deficit of 5.6 percent of GDP, the
latter only explains at most one percent of a total trade deficit of almost 10 percent.
Meanwhile, Spain’s trade deficit (8.6 percent of GDP in 2005) would have been even
larger had the country not had a government surplus of one percent of GDP.
The real price of oil has a significant, negative impact on the intra-EMU trade
balances. A country’s intra-EU real effective real exchange rate has a significant,
negative effect on the trade balance, consistent with standard open-economy macro
models. Adding these controls does not change the main result regarding the effects of
per-capita GDP and the EMU and non-EMU effects.7 The inclusion of time dummies
reduces the total effect of the introduction of the euro to 0.14, which, however,
remains statistically significant.
Next, consider Table 3B, column A, where the dependent variable is now the
trade balance with regard to the rest of the world excluding the euro area. Again, we
6 We also estimated models using instruments for the government budget balance for the extra-EU trade balance and the total trade balance. The results were similar and are not reported below. 7 We also find that average EU GDP per capita has a negative effect on the trade balance, which is consistent with what one would expect from theory (e.g., Chinn and Prasad, 2003). However, the effect is not statistically significant and we drop this variable.
18
find that trade surpluses are significantly and positively linked to real GDP per capita.
The effect is of the same order of magnitude as in the case of intra-euro-area trade
balances. For the three countries that did not join the euro area, the impact of per-
capita-GDP disappears once we take into account time dummies.
Regarding extra-euro-area trade balances, the impact of per-capita GDP does
not change for the euro-area countries with the introduction of the euro. The
coefficient on the interactive term with the EMU dummy is not statistically significant.
This reinforces the suggestion that the introduction of the euro has changed net trade
flows within the euro area alone. The results are different, however, for the non-EMU
countries. For these countries, the total effect of GDP per capita is significantly
positive after the introduction of the euro.
The fiscal balance has a positive and significant coefficient in these
regressions and the real oil price has a significantly negative effect on the trade
balance. The latter effect, however, is only significant if we do not account for time
dummies. We do not find significant effects of the real exchange rate.
These results suggest that EMU has increased capital market integration in
Europe with the result that capital flows are now more in line with what neoclassical
growth theory predicts. As capital flows from high-per capita GDP to low-per capita
GDP countries, they can be expected to promote economic convergence among the
euro-area countries. This means that the allocation of capital is becoming more
efficient in the euro area, and that the observed current account imbalances indicate
that the monetary union works well. By implication, a fiscal expansion in the surplus
countries would tend to absorb more of their domestic savings and slow down capital
flows to poorer countries, thus rendering EMU less efficient.
Our reading of the results is that monetary union has greatly increased capital
market integration among the participating countries. More efficient capital allocation
within the region is a major benefit from the monetary union. But note that monetary
integration, not unlike trade integration, also seems to have had an effect on capital
market integration between the non-euro area countries in the EU and the rest of the
world. More specifically, financial market integration seems to have increased
between the latter since 1999, but not so between the euro-area countries and the rest
of the world. This effect, which is in analogy to the well-known trade diversion effect
of trade integration, implies a possible worsening of the allocation of capital between
the euro area and the rest of the world.
19
Table 3A: Dependent Variable Intra EMU Trade Balance
A B C D Constant -7.36***
(1.16) -5.29***
(1.66) -6.73***
(1.26) -6.73***
(1.39) Dummy EMU -14.00***
(2.51) -14.64***
(2.54) -2.21** (1.09)
-6.29 (6.30)
Dummy Non-EMU1 4.07 (3.51)
3.53 (3.50)
5.15*** (1.30)
5.05*** (1.54)
GDP Per Capita 0.44*** (0.07)
0.37*** (0.07)
0.48*** (0.05)
0.52*** (0.05)
(GDP Per Capita)*EMU 0.57*** (0.12)
0.59*** (0.12)
0.14*** (0.05)
0.15*** (0.05)
(GDP Per Capita)*Non-EMU1 -0.33 (0.16)**
-0.31* (0.16)
-0.38*** (0.06)
-0.38*** (0.07)
(GDP Per Capita)*Non-EMU2 0.03 (0.37)
-0.01 (0.03)
0.07 (0.76)
0.07 (0.09)
Fiscal Balance 0.19** (0.081)
0.07** (0.03)
0.08*** (0.03)
Real Oil Price -0.008*** (0.002)
-0.02*** (0.005)
-0.02*** (0.005)
Intra EMU REER -0.01 (0.01)
(Intra EMU REER)*EMU -0.09 (0.06)
Time Dummies No No Yes Yes Method OLS OLS GLS GLS Adjusted R2 0.31 0.34 NOBS 350 350 350 350
Note: GLS estimator accounts for heteroskedasticity between countries and country-specific autocorrelation of residuals. Standard errors in parentheses. *, **, *** denote statistical significance of the 10, 5, and 1 percent level respectively.
20
Table 3B : Dependent Variable Extra-EMU Trade Balance A B C D Constant -10.06***
(0.75) -6.41***
(1.04) -8.86***
(0.89) -16.31**
(7.26) Dummy EMU -0.96
(1.62) -2.27 (1.60)
-2.50** (1.08)
-6.03 (7.62)
Dummy Non-EMU1 3.33 (2.26)
2.81 (2.19)
9.23*** (1.74)
8.65*** (1.78)
Dummy Non-EMU2 -9.34 (6.76)
-10.04** (6.57)
-6.22** (2.87)
-6.00** (2.86)
GDP Per Capita 0.50*** (0.043)
0.40*** (0.046)
0.47*** (0.04)
0.46*** (0.04)
(GDP Per Capita)*Non-EMU1 -0.15 (0.10)
-0.12 (0.10)
-0.42*** (0.07)
-0.39*** (0.07)
(GDP Per Capita)*EMU -0.01 (0.07)
0.04 (0.07)
0.06 (0.05)
0.06 (0.044)
(GDP Per Capita)*Non-EMU2 0.03 (0.026)
0.31 (0.23)
0.22** (0.03)
0.21** (0.10)
Fiscal Balance 0.16 (0.05)
0.05** (0.03)
0.06** (0.028)
Real Oil Price -0.008*** (0.002)
-0.005 (0.005)
-0.07 (0.05)
Extra EMU REER 0.07 (0.07)
(Extra EMU REER)*EMU 0.03 (0.08)
Time Dummies No No Yes Yes Method OLS OLS GLS GLS Adjusted R2 0.46 0.49 NOBS 350 350 350 350 Note: GLS estimator accounts for heteroskedasticity between countries and country-specific autocorrelation of residuals. Standard errors in parentheses. *, **, *** denote statistical significance of the 10, 5, and 1 percent level respectively.
21
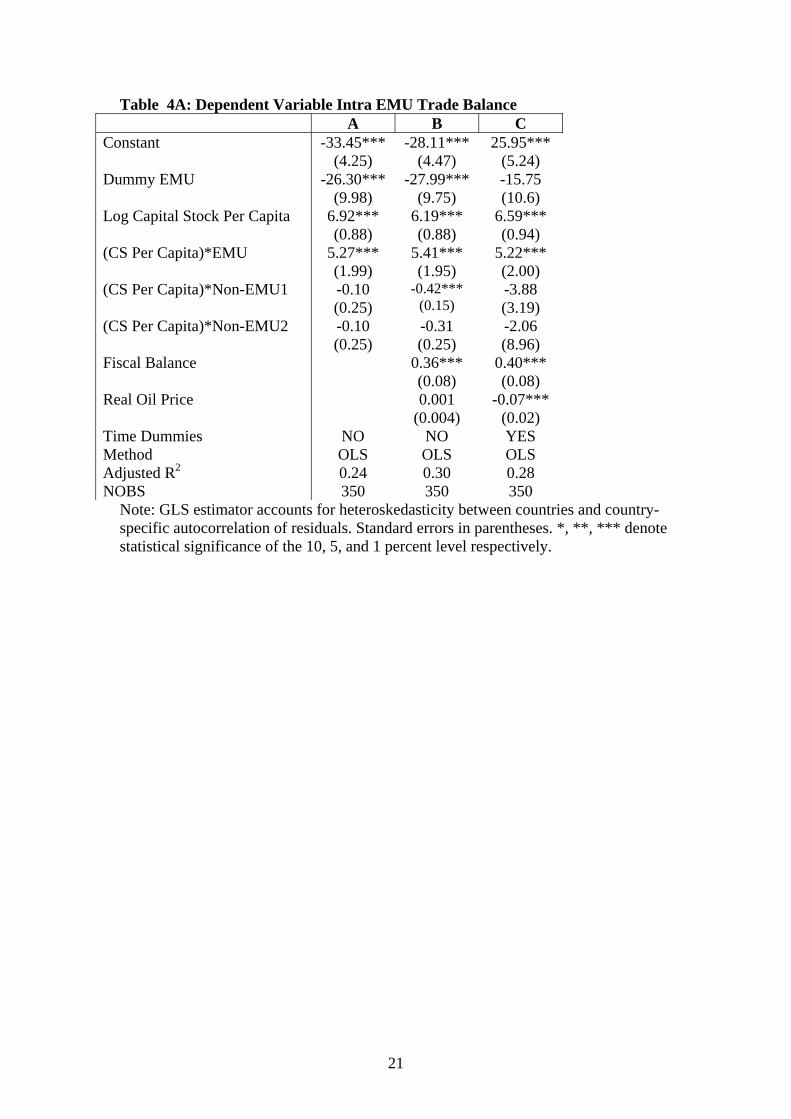
Table 4A: Dependent Variable Intra EMU Trade Balance A B C Constant -33.45***
(4.25) -28.11***
(4.47) 25.95***
(5.24) Dummy EMU -26.30***
(9.98) -27.99***
(9.75) -15.75 (10.6)
Log Capital Stock Per Capita 6.92*** (0.88)
6.19*** (0.88)
6.59*** (0.94)
(CS Per Capita)*EMU 5.27*** (1.99)
5.41*** (1.95)
5.22*** (2.00)
(CS Per Capita)*Non-EMU1 -0.10 (0.25)
-0.42*** (0.15)
-3.88 (3.19)
(CS Per Capita)*Non-EMU2 -0.10 (0.25)
-0.31 (0.25)
-2.06 (8.96)
Fiscal Balance 0.36*** (0.08)
0.40*** (0.08)
Real Oil Price 0.001 (0.004)
-0.07*** (0.02)
Time Dummies NO NO YES Method OLS OLS OLS Adjusted R2 0.24 0.30 0.28 NOBS 350 350 350
Note: GLS estimator accounts for heteroskedasticity between countries and country-specific autocorrelation of residuals. Standard errors in parentheses. *, **, *** denote statistical significance of the 10, 5, and 1 percent level respectively.
22
Table 4B: Dependent Variable Extra EMU Trade Balance A B C Constant -21.15***
(2.75) -11.70***
(2.79) -11.13***
(3.52) Dummy Non-EMU2 -98.45**
(29.80) -76.52***
(28.78) -21.31** (10.50)
Log Capital Stock Per Capita 4.01*** (0.57)
2.72*** (0.55)
2.72*** (0.63)
(LCS Per Capita)*EMU 0.17* (0.098)
-0.01 (0.09)
-0.07 (0.05)
(LCS Per Capita)*Non-EMU1 0.56*** (0.11)
4.41** (2.08)
4.75** (2.15)
(LCS Per Capita)*Non-EMU2 19.60*** (5.92)
14.94*** (5.73)
14.53** (5.84)
Fiscal Balance 0.35*** (0.05)
0.37*** (0.05)
Real Oil Price -0.01*** (0.002)
-0.03** (0.015)
Time Dummies NO NO YES Method OLS OLS OLS Adjusted R2 0.25 0.39 0.36 NOBS 350 350 350
Note: GLS estimator accounts for heteroskedasticity between countries and country-specific autocorrelation of residuals. Standard errors in parentheses. *, **, *** denote statistical significance of the 10, 5, and 1 percent level respectively.
23
4. Monetary Union and the Feldstein Horioka Puzzle In a seminal contribution to open-economy macro economics, Feldstein and Horioka
(1980) showed that, at the time, international capital market integration was much
weaker than generally perceived. They did this based on a simple reasoning. With
complete international capital market integration, a country’s rate of investment
should be uncorrelated with its rate of savings. Any excess of investment over savings
would simply be absorbed by the current account balance. This suggests that the
regression coefficient of the investment on the savings ratio, which is called the
savings retention coefficient, should not be statistically different from zero. However,
Feldstein and Horioka showed that, in an international panel, that coefficient was
much closer to one than to zero. Subsequent literature has shown that the savings
retention coefficient has declined in international panels since the 1980s.8 This is in
line with the general perception that the degree of international capital markets
integration has increased since then.
Blanchard and Giavazzi (2002) revisit this issue in the context of EMU. They
use annual data for investment and savings ratios of OECD, EU, and euro-area
countries from 1975 to 2000 and estimate savings retention coefficients. Blanchard
and Giavazzi show that savings retention coefficients generally from levels of 0.5 to
values close to zero for all three groups of countries.
Showing that savings retention coefficients declined would support our
interpretation of the current account imbalances in the euro area, since it is another
aspect of looking at capital market integration. With this in mind, we consider
Feldstein Horioka regressions for our 14 countries and the period from 1981 to 2005.
The dependent variable is the gross investment rate, which includes public sector
investment. The explanatory variable is the gross savings rate, which includes public
sector savings. All data are from the AMECO data base.
8 See e.g. Obstfeld and Taylor (2004) and Hericourt and Maurel (2005) for a recent, comprehensive survey.
24
Table 4: Feldstein Horioka Regressions for EU Countries, 1981-2005 Dependent Variable: Gross Investment Rate
Variable CoefficentConstant 12.25***
(1.09)Gross Savings Rate 0.43***
(0.05)Gross savings Rate*EMU -0.64***
(0.10)Gross Savings Rate* Non-
EMU -0.20
(0.17)EMU Dummy 14.15***
(6.67)Non-EMU Dummy 1.39
(3.59)R2=0.49 N=350
Source: Own estimations
Table 4 reports the results. The coefficient on the gross savings rate is 0.43
and statistically significant. This is lower than what Feldstein and Horioka found, but
well in line with Blanchard and Giavazzi (2002). Interacting the gross savings rate
with an EMU dummy for the euro-area countries yields a negative coefficient of -0.63.
The total effect post-1999 of -0.23 is not statistically different from zero. Thus,
domestic investment has been completely decoupled from domestic savings in the
euro-area countries. Interacting the gross savings rate with our non-EMU dummy
yields a negative coefficient which is much smaller and not statistically different from
zero. Thus, table 4 supports our results that EMU has increased capital market
integration within the region, but not for outsiders.
5. Estimating trade balance models The emphasis in the previous section was on capital flows within the euro area.
In this section, we present empirical estimates of a model explaining the trade balance
of the euro area and individual member countries of the euro area with the rest of the
world. We use quarterly data for the period from 1980:Q1 to 2005:Q2. Exports and
imports for the euro area are computed for the ten most important trade partners
outside the euro area. This covers approximately 60 percent of the total trade with the
rest of the world. For the member countries, we use total exports (imports) and
25
subtract exports (imports) to other euro-area countries. We use data from the IMF’s
Direction of Trade statistics, and focus on exports and imports of goods since, as
mentioned earlier, data for trade in services are not readily available, nor are current
account data with regard to non-euro area countries. Exports and imports are
measured in U.S. dollars for all countries. We normalize the trade balance by dividing
by domestic GDP in U.S. dollars.
Our baseline model seeks to explain the trade balance using domestic and
foreign real GDP and the effective real exchange rate. For each country and the euro
area, we calculate “foreign” GDP by taking the nominal GDP of the ten most
important trade partners outside the euro area converted into US dollars and deflating
it by the US CPI. Our regressions use the ratio of domestic real GDP to foreign real
GDP as an explanatory variable. Note that domestic real GDP is computed in terms
of the relevant country’s or the euro area’s own currency, while “foreign” real GDP is
calculated in terms of real US dollars. Converting the former into real dollars - or the
latter into real euros – would result in a series which is entirely dominated by real
exchange rate movements such that the information about real GDP is wiped out.
Both real GDP series are computed as indexes with the first quarter of 1999 as base
period and are converted into logs.
Figures 7-13 show the trade balances relative to GDP together with the real
exchange rates and the relative GDP variables. For the euro area, Figure 7 gives three
measures of the trade account. The line CA gives the trade balance of the aggregate
euro area according to the IMF’s Direction of Trade Statistics (December 2006).
“Extra CA” gives the sum of all of euro area-countries net exports to the rest of the
world less the same countries’ net exports to other euro-area countries. The figure
shows that there are some data discrepancies that are due to the statistical separation
of Belgium and Luxembourg in the late 1990s. The figure also shows the euro-area’s
net exports to its ten most important trade partners. This line tracks the total trade
balance very closely except for a period in the mid-1990s.
Figure 7 shows that for the euro area as a whole the trade balance has
remained within a band of plus/minus 2 percent of GDP in all but two years in the
past 25 years, and the two exceptions are in the early part of the sample. In the past 10
years, it has hovered between zero and 2 percent of GDP. There are larger
discrepancies across the four largest euro-area economies, Germany, France, Italy,
and Spain, as shown in Figure 9. Individual trade balances range between plus and
26
minus five percent of individual country GDP. While Spain consistently experienced
trade deficits throughout the period, the other three large economies consistently had
trade surpluses, and Germany had the largest of these.
Figure 7 -2
02
4C
urre
nt a
ccou
nt in
per
cent
age
poin
ts
1980q1 1985q1 1990q1 1995q1 2000q1 2005q1date
ca extracatop10ca
Current Account 1980 - 2005Euro Area
Figure 8
27
8090
100
110
120
reer
-.05
0.0
5.1
relg
dp1
1980q1 1985q1 1990q1 1995q1 2000q1 2005q1date
relgdp1 reer
REER and Relative GDP 1980 - 2005Euro Area
Figure 9
-50
510
Cur
rent
acc
ount
in p
erce
ntag
e po
ints
1980q1 1985q1 1990q1 1995q1 2000q1 2005q1date
Germany FranceItaly Spain
Current Account with Extra - Euro - Area 1980 - 2005Big - Four
Figure 8 shows the relative GDP of the euro area against its ten largest trade
partners (in logs, as explained above). The series oscillates between -0.05 and 0.1
28
with a slight upward trend since the mid-1980s. The figure also shows the real
exchange rate of the euro area against its ten largest trade partners. Following a large
real depreciation of the euro in the first half of the 1980s, we observe a real
appreciation in the subsequent decade, and especially in the years 1992-1995. This
was followed by a rapid depreciation which ended in an appreciation after 2001 that
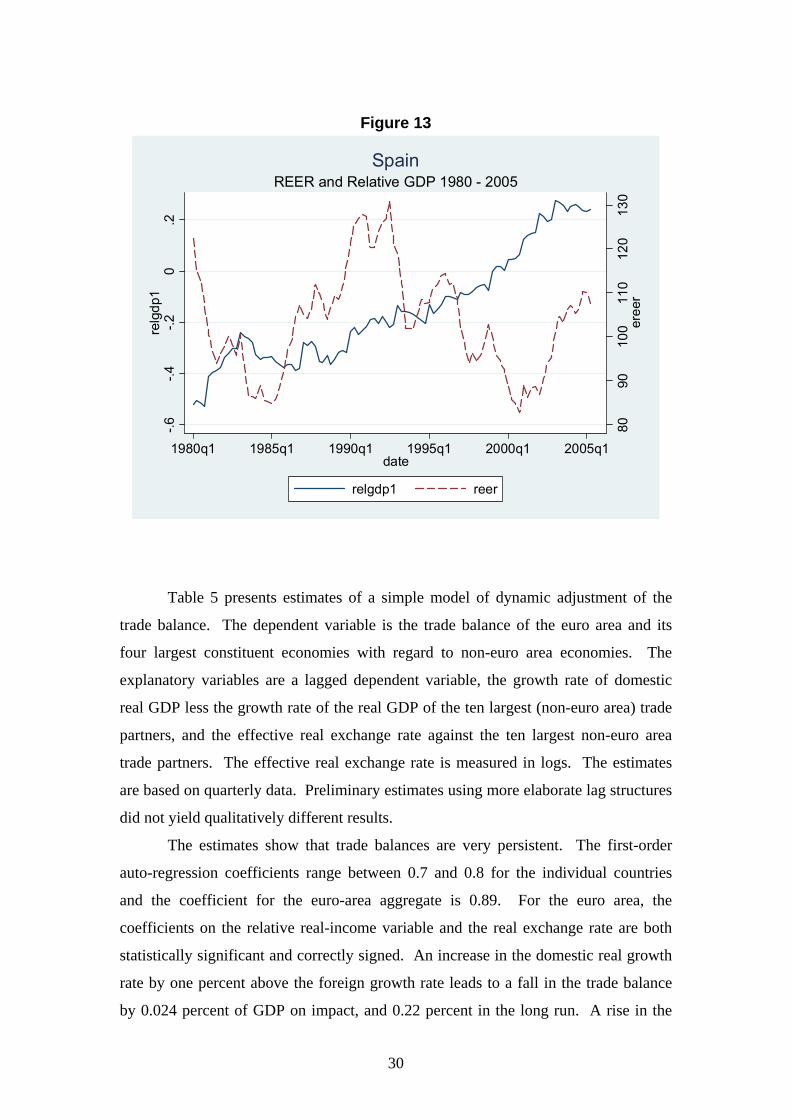
brought the real value of the euro back to its long-run average. Figures 10-13 show
that individual country experiences exhibit similar patterns, although with swings of
larger amplitudes. On aggregate, therefore, the euro area is less volatile against
outside countries than its individual member countries. A notable exception to the
general impression is the relative GDP series for Spain, which exhibits a continuous
upward trend throughout the period.
Figure 10
8090
100
110
120
dree
r
-.2-.1
0.1
relg
dp1
1980q1 1985q1 1990q1 1995q1 2000q1 2005q1date
relgdp1 reer
REER and Relative GDP 1980 - 2005Germany
29
Figure 11
8090
100
110
120
130
freer
-.05
0.0
5.1
.15
relg
dp1
1980q1 1985q1 1990q1 1995q1 2000q1 2005q1date
relgdp1 reer
REER and Relative GDP 1980 - 2005France
Figure 12 80
9010
011
012
0ire
er
-.2-.1
0.1
.2re
lgdp
1
1980q1 1985q1 1990q1 1995q1 2000q1 2005q1date
relgdp1 reer
REER and Relative GDP 1980 - 2005Italy
30
Figure 13
8090
100
110
120
130
eree
r
-.6-.4
-.20
.2re
lgdp
1
1980q1 1985q1 1990q1 1995q1 2000q1 2005q1date
relgdp1 reer
REER and Relative GDP 1980 - 2005Spain
Table 5 presents estimates of a simple model of dynamic adjustment of the
trade balance. The dependent variable is the trade balance of the euro area and its
four largest constituent economies with regard to non-euro area economies. The
explanatory variables are a lagged dependent variable, the growth rate of domestic
real GDP less the growth rate of the real GDP of the ten largest (non-euro area) trade
partners, and the effective real exchange rate against the ten largest non-euro area
trade partners. The effective real exchange rate is measured in logs. The estimates
are based on quarterly data. Preliminary estimates using more elaborate lag structures
did not yield qualitatively different results.
The estimates show that trade balances are very persistent. The first-order
auto-regression coefficients range between 0.7 and 0.8 for the individual countries
and the coefficient for the euro-area aggregate is 0.89. For the euro area, the
coefficients on the relative real-income variable and the real exchange rate are both
statistically significant and correctly signed. An increase in the domestic real growth
rate by one percent above the foreign growth rate leads to a fall in the trade balance
by 0.024 percent of GDP on impact, and 0.22 percent in the long run. A rise in the
31
real exchange rate by 10 percent lowers the trade balance by 0.084 percent on impact,
and by 0.76 percent in the long run. Thus, a real appreciation of the euro against its
main trade partners seems to have a substantial effect on net exports in the long run,
although the immediate effect is small.
Table 5: Estimated trade balance models Variable Coefficient Standard
dev. t-ratio Long-run
effect Euro Area
Constant 3.93 1.66 2.37
Lag 1 0.89 0.04 21.89 ΔRGDP -0.024 1.31 1.83 -0.22 Real ex. R. -0.84 0.36 2.34 -7.6 R-square 0.85
Germany Constant 9.97 3.94 2.53 Lag 1 .78 0.06 13.6 ΔRGDP -0.055 2.66 2.06 -0.25 Real ex. R. -2.00 0.84 2.37 -9.1 R-square 0.73
France Constant 2.71 3.57 0.76 Lag 1 0.79 0.06 13.01 ΔRGDP -0.052 2.96 1.74 -0.25 Real ex. R. 3.56 2.41 1.51 Real ex. R. Lag
1 -4.14 2.36 1.76 -2.8
R-square 0.65
Italy Constant 2.06 4.82 0.43 Lag 1 0.74 .069 10.67 ΔRGDP -0.047 3.89 1.22 -0.18 Real ex. R. -0.36 1.06 0.34 -1.4 R-square 0.54
Spain Constant -2.07 3.10 0.67 Lag 1 0.71 0.67 10.63 ΔRGDP -0.13 2.46 5.59 -0.46 Real ex. R. 0.33 0.66 0.50 1.1 R-square 0.59
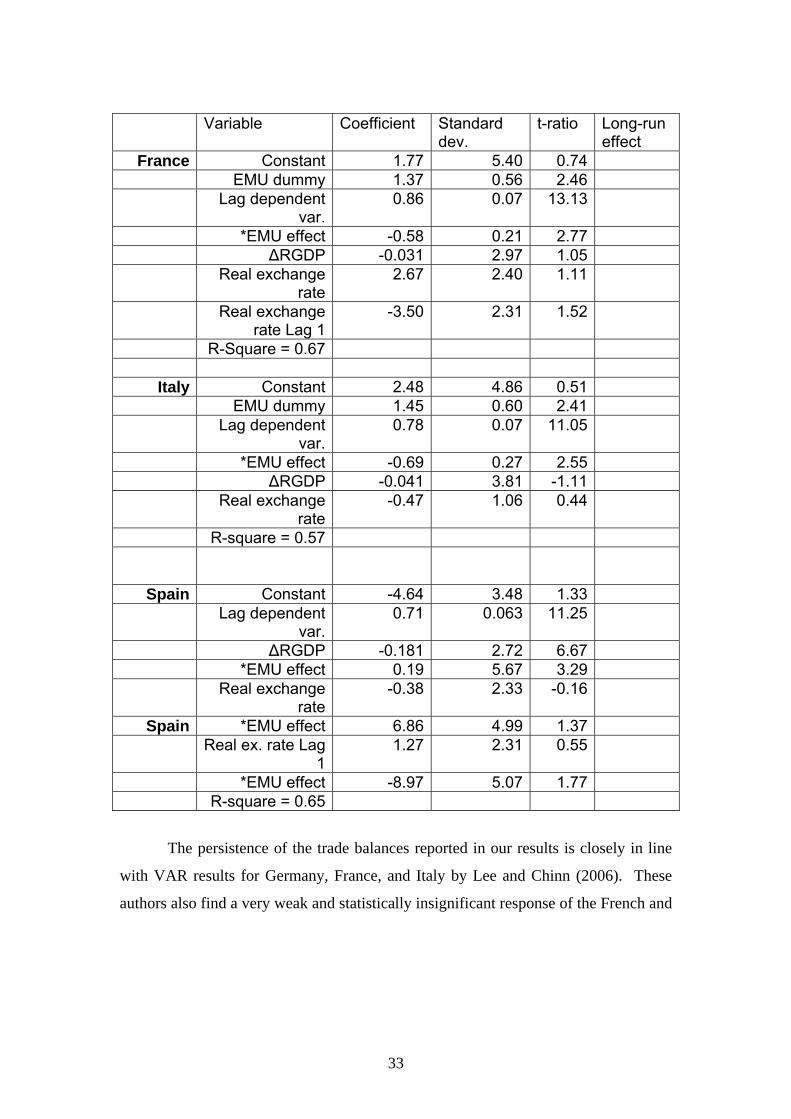
Turning to the individual countries, the performance of the model estimates is
considerably weaker. Germany is the only euro-area country whose trade balance
32
with respect to non-euro area countries responds significantly to changes in both the
relative real GDP growth rate and the real exchange rate. For Germany, a rise in the
relative growth rate by one percent leads to a fall in the trade balance by 0.055 percent
on impact and 0.25 percent in the long run. A real appreciation by 10 percent against
the ten most important non-euro-area countries leads to a fall in the trade balance by
0.2 percent of GDP on impact and 0.9 percent in the long run. While the other
countries show similar responses to changes in the relative GDP growth rate, the
responses of the Italian and Spanish trade balances to changes in the real exchange
rate are much weaker and not statistically significant. For France, we use the real
exchange rate and its first lag in the model. While the current real exchange rate has a
positive coefficient, the lagged real exchange rate has a negative coefficient and the
total effect has the expected negative sign. These estimates indicate that the
adjustment to a real appreciation of the euro against third countries would not be
equally distributed across euro-area countries. Germany would bear the largest part
of the adjustment, while the other large economies would seem relatively unaffected.
Next, we augment these models by a dummy variable which is zero until the
fourth quarter of 1998 and one from the first quarter of 1999 onwards. This dummy
allows us to test for and estimate the size of structural breaks in the model coefficients
at the start of EMU. We interact the dummy with all explanatory variables in the
model. For the euro-area aggregate and for Germany, all terms with this dummy are
statistically insignificant. We do not report them below. For France, Italy, and Spain,
in contrast, we find evidence for structural breaks around the start of EMU. Table 6
shows the results.
For France and Italy, we find that the persistence of the trade balance is
significantly weaker after the start of EMU. The combined first-order autoregressive
coefficient is 0.28 for France and 0.09 for Italy after the start of EMU. For Spain, the
persistence of the trade balance remains unchanged, but we find that the
responsiveness of the trade balance to changes in the relative real growth rate
vanishes after 1999. In contrast, the Spanish trade balance becomes responsive to
changes in the real exchange rate, although the effect remains small. In sum, the
introduction of the euro seems to have changed the dynamics of trade balance
adjustment in three of the larger euro-area economies.
Spain *EMU effect 6.86 4.99 1.37 Real ex. rate Lag
1 1.27 2.31 0.55
*EMU effect -8.97 5.07 1.77 R-square = 0.65
The persistence of the trade balances reported in our results is closely in line
with VAR results for Germany, France, and Italy by Lee and Chinn (2006). These
authors also find a very weak and statistically insignificant response of the French and
34
Italian current accounts to the real exchange rate, while the German current account
responds negatively and significantly to changes in the German real exchange rate.9
One weakness of the data used so far is that the trade weights employed to
calculate the real effective exchange rates and the real GDP of the ten largest trade
partners are based on trade data in 2005. The group of the 10 largest trade partners
therefore includes countries that did not exist as sovereign countries or did not
participate in world trade as market economies in the 1980s. Furthermore, the opening
of Central and Eastern Europe to international trade and the rise of China as a trading
nation have changed the trade weights significantly over the past 15 years.
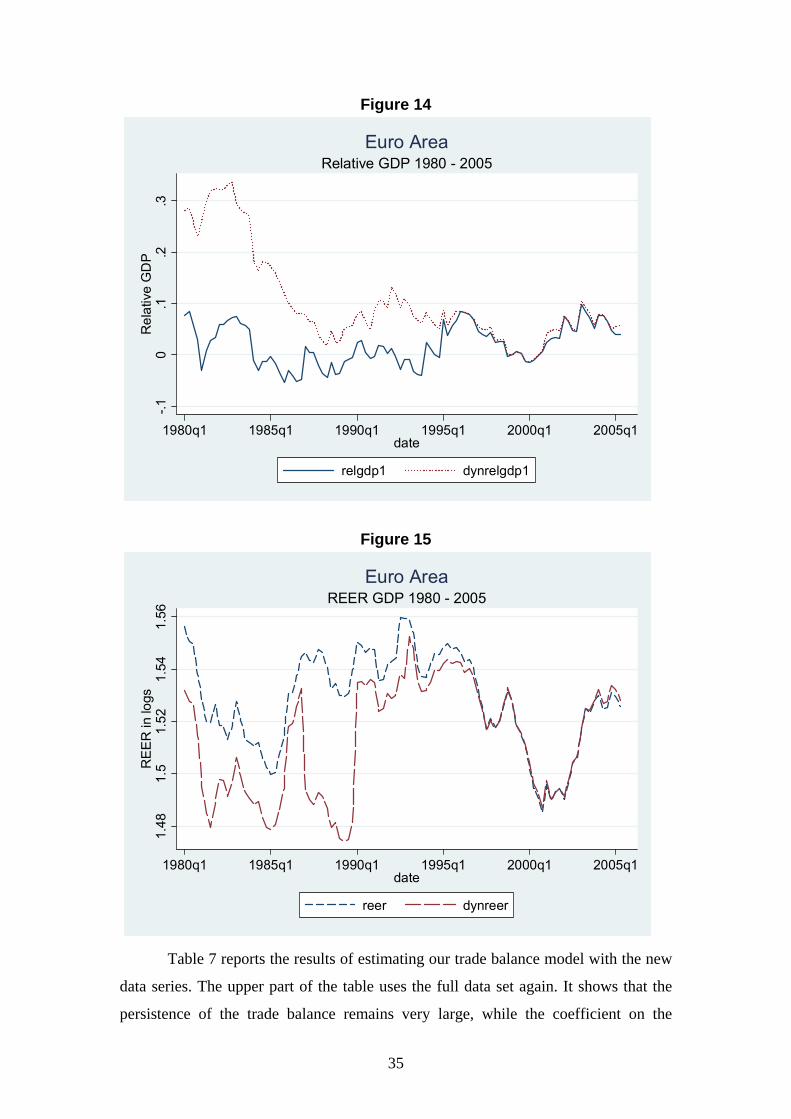
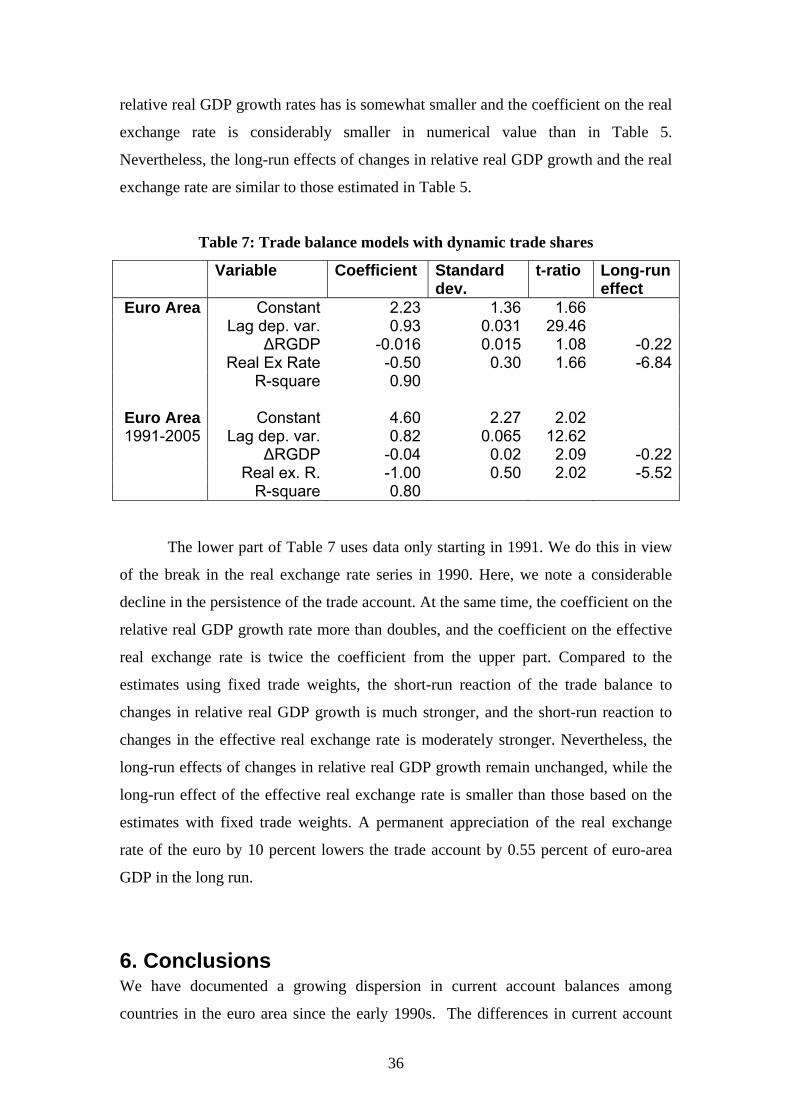
To avoid potential biases resulting from these changes, we calculate the shares
of the euro area with non-euro area countries for each year since 1981 and
recomputed the real GDP of the 10 largest trade partners and the effective real
exchange rate on that basis. Figures 14 and 15 show the difference these
recalculations make for the explanatory variables of our model. Figure 14 indicates
that the new relative real GDP series lies above the original one for all years during
the 1980s. This suggests that the trade weights from 2005 give too much weight to
countries with relatively low GDP in the 1980s. The two series converge in the mid-
1990s, suggesting that there are no large changes in the trade structure of the euro area
thereafter. Figure 15 shows that the new effective real exchange rate series lies below
the original one during the 1980s, suggesting that the 2005 trade weights give too
much weight to countries with relatively weak currencies in the 1980s. The series
exhibits a noticeable jump in 1990, the year when China first appears among the top
10 trade partners of the euro area, while other countries like the former Soviet Union
disappear from that group.
9 Arghyrou and Chortareas (2006) report lower persistence of the current accounts of EU countries and similar effects of the real exchange rate. However, these authors do not distinguish between intra and extra EMU trade and do not account for the effects of income growth.
35
Figure 14
-.10
.1.2
.3R
elat
ive
GD
P
1980q1 1985q1 1990q1 1995q1 2000q1 2005q1date
relgdp1 dynrelgdp1
Relative GDP 1980 - 2005Euro Area
Figure 15
1.48
1.5
1.52
1.54
1.56
RE
ER
in lo
gs
1980q1 1985q1 1990q1 1995q1 2000q1 2005q1date
reer dynreer
REER GDP 1980 - 2005Euro Area
Table 7 reports the results of estimating our trade balance model with the new
data series. The upper part of the table uses the full data set again. It shows that the
persistence of the trade balance remains very large, while the coefficient on the
36
relative real GDP growth rates has is somewhat smaller and the coefficient on the real
exchange rate is considerably smaller in numerical value than in Table 5.
Nevertheless, the long-run effects of changes in relative real GDP growth and the real
exchange rate are similar to those estimated in Table 5.
Table 7: Trade balance models with dynamic trade shares
Variable Coefficient Standard dev.
t-ratio Long-run effect
Euro Area Constant 2.23 1.36 1.66 Lag dep. var. 0.93 0.031 29.46 ΔRGDP -0.016 0.015 1.08 -0.22 Real Ex Rate -0.50 0.30 1.66 -6.84 R-square 0.90
Euro Area Constant 4.60 2.27 2.02 1991-2005 Lag dep. var. 0.82 0.065 12.62
ΔRGDP -0.04 0.02 2.09 -0.22 Real ex. R. -1.00 0.50 2.02 -5.52 R-square 0.80
The lower part of Table 7 uses data only starting in 1991. We do this in view
of the break in the real exchange rate series in 1990. Here, we note a considerable
decline in the persistence of the trade account. At the same time, the coefficient on the
relative real GDP growth rate more than doubles, and the coefficient on the effective
real exchange rate is twice the coefficient from the upper part. Compared to the
estimates using fixed trade weights, the short-run reaction of the trade balance to
changes in relative real GDP growth is much stronger, and the short-run reaction to
changes in the effective real exchange rate is moderately stronger. Nevertheless, the
long-run effects of changes in relative real GDP growth remain unchanged, while the
long-run effect of the effective real exchange rate is smaller than those based on the
estimates with fixed trade weights. A permanent appreciation of the real exchange
rate of the euro by 10 percent lowers the trade account by 0.55 percent of euro-area
GDP in the long run.
6. Conclusions We have documented a growing dispersion in current account balances among
countries in the euro area since the early 1990s. The differences in current account
37
positions widened significantly following the creation of EMU. We have shown, first,
that EMU has changed the pattern of capital flows within Europe. Specifically, it has
increased the tendency of capital flows to go from relatively rich to relatively poor
countries within the euro area. This suggests that the observed current account
imbalances are sign of the proper functioning of the euro area rather than a sign of
improper macro economic management.
Furthermore, we have presented some preliminary estimates of current
account adjustment of the euro area and its constituent economies. Our estimates
indicate that the long-run effect of a real appreciation of the euro against the
currencies of its main trade partners is sizeable. Thus, in a scenario in which the dollar
devalues against Asian currencies, the US current account closes, but Asian countries
stubbornly continue to run current account surpluses, the euro area would experience
a large deterioration of its trade balance. Furthermore, this deterioration would be
distributed unevenly across its member economies, at least in the short run. Such a
development could indeed pose a serious challenge to the sustainability of the
common currency. More empirical work, currently under way, is needed to obtain
more precise estimates of the outcomes of such a scenario.
References Ahearne, Alan, and Jürgen von Hagen (2005) “Global Current Account Imbalances: How to Manage the Risk for Europe,” Bruegel Policy Brief 2005/02, December. Ahearne, Alan, and Jean Pisani-Ferry (2006) “The Euro: Only for the Agile,” Bruegel Policy Brief 2006/01, February. Arghyrou, Michael G., and Georgios Chortareas (2006), “Real exchange rates and curren account imbalances in the Euro area.” Mimeo, Cardiff Business School Blanchard, Olivier (2006) “Adjustment with the Euro: The Difficult Case of Portugal,” MIT Department of Economics, Working Paper No. 06-04. Blanchard, Olivier (2006) “Current Account Deficits in Rich Countries,” Mundell Fleming Lecture presented to the 7th Jacques Polak Annual Research Conference, Washington DC, November 9-10. Blanchard, Olivier, and Francesco Giavazzi (2002), “Current Account Deficits in the Euro Area: The End of the Feldstein-Horioka Puzzle?” Brookings Papers on Economic Activity 2002:2, 147-186
38
Blanchard. O, F. Giavazzi and F. Sa, “The US Current Account and the Dollar”, MIT Working Paper 05-02, 2005. Chinn, Menzie D., and E. S. Prasad (2003), „Medium-term determinants of current accounts in industrial and developing countries: an empirical exploration.“ Journal of International Economics 59, 47-76 De Santis, Roberto, and Melanie Lührmann (2006), On the Determinants of External Imbalances and Net International Portfolio Flows – A Global Perspective. Working Paper 651, Frankfurt: European Central Bank European Commission (2006) “Quarterly Report on the Euro Area,” DGECFIN, IV/2006. Feldstein, Martin, and Charles Horioka (1980), “Domestic Saving and International Capital Flows.” Economic Journal 90, 314-329 Lane, Philip and Gian Maria Milesi-Ferretti (2005) " A Global Perspective on External Positions ," NBER Working Paper 11589 Lane, Philip and Gian Maria Milesi-Ferretti (2006) “Europe and Global Imbalances,” Paper presented at the 7th Jacques Polak Annual Research Conference, IMF, Washington DC, 9-10 November. Lee, Jaewoo and Menzie Chinn (2006) “Current Account and Real Exchange Rate Dynamics in the G7 Countries,” Journal of International Money and Finance 25, 257-274. Lucas, Robert E. Jr. (1990) “Why Doesn't Capital Flow from Rich to Poor Countries?” The American Economic Review, Vol. 80, No. 2, Papers and Proceedings of the Hundred and Second Annual Meeting of the American Economic Association, May, pp. 92-96 Munchau, Wolfgang (2006) “Why Internal Imbalances in the Euro Area Matter,” The Financial Times, 8 November 2006. Obstfeld, Maurice, and Alan M. Taylor (2004), Global Capital Markets: Integration, Crises, and Growth. Cambridge: Cambridge University Press