The Crisis, External Imbalances and Competitiveness in the Euro Area Giorgio Barba Navaretti, University of Milan and Centro Studi Luca d’Agliano LAC-EU Economic Forum 2013 Santiago, January 21 st 2013
Transcript
The Crisis, External Imbalances and
Competitiveness in the Euro Area
Giorgio Barba Navaretti,
University of Milan and
Centro Studi Luca d’Agliano
LAC-EU Economic Forum 2013Santiago, January 21st 2013
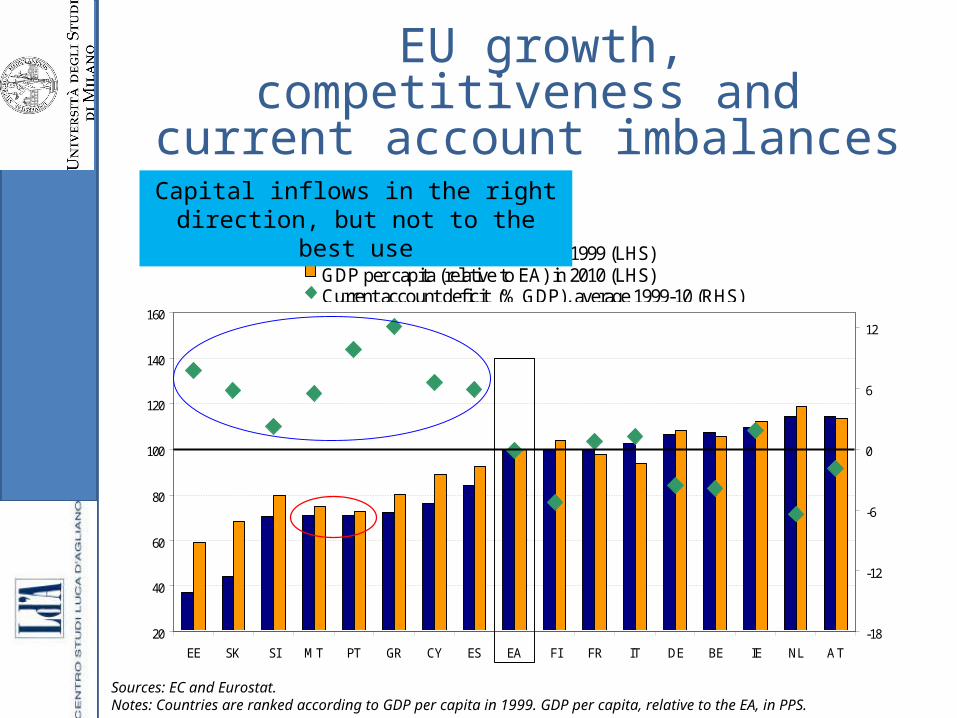
2 Sources: EC and Eurostat. Notes: Countries are ranked according to GDP per capita in 1999. GDP per capita, relative to the EA, in PPS.
20
40
60
80
100
120
140
160
EE SK SI MT PT GR CY ES EA FI FR IT DE BE IE NL AT
-18
-12
-6
0
6
12
GDP per capita (relative to EA) in 1999 (LHS)GDP per capita (relative to EA) in 2010 (LHS)Current account deficit (% GDP), average 1999-10 (RHS)
EU growth, competitiveness and current account imbalances
Capital inflows in the right direction, but not to the best use
External imbalances: Things change
Source: Barues, Lawson, Radziwill and Lane, OECD WP
External Imbalances: Forecast of Decline in the Periphery
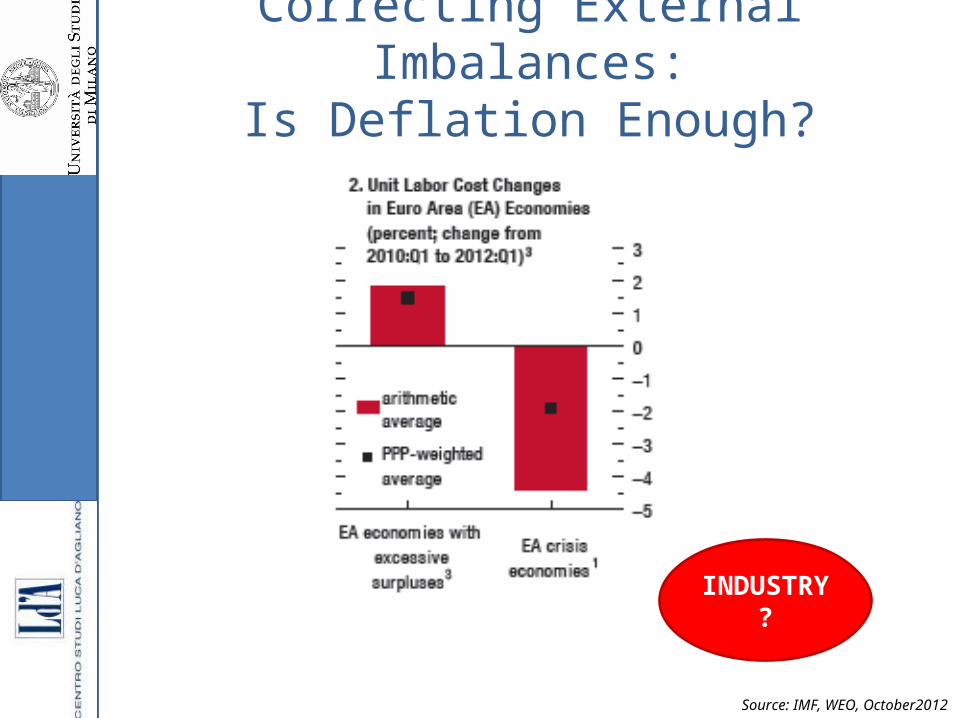
Source: IMF, WEO, October2012
Macro Macro and then??
Debate on “competitiveness”: macro indicators
•Real Effective Exchange Rates (REER)•Unit Labor Costs (ULC)•Export shares•Current Account (in % of GDP)
Nations and sectors do not produce, do not trade, do not compete; it is firms that produce trade and compete.
BUT
Firms?
Average firm size
What do we learn when we look at firms?
THE EFIGE SECOND POLICY POLICY REPORT
•Differences in country patterns:• German and French more sophisticated internationalisers
• Spain and Hungary lagging behind
• Italians, higher export propensity
•Firms characteristics affect internationalisation patterns in a remarkably similar way across countries
•Patterns explained mostly by firm characteristics
Country differ because they have a different industrial structure
Number of Destinations of ExportsMany Firms in Few Countries, Few Firms in Many Countries
Policy: How to shift these distributions to the right?
Source: Altomonte, Aquilante, and Ottaviano (2012)
Global Operations and TFPWatch Out for the Causality Link
Perspective: higher moments = reallocation of resources
Source: Altomonte, Aquilante, and Ottaviano (2012)
Global Operations and TFPThree steps
1. Identify thresholds
2. Identify firms moving above thresholds
3. Identify features of firms moving above thresholds
What it takes to move up
1. Higher ex ante productivity
2. More human capital
3. No family managers
4. Less leverage
5. Foreign groups
IMPACT ON TOTAL EFFICIENCY AND TRADE DEPENDS ON
REALLOCATIVE EFFECTSBUT
• Industrial structure (distribution of firm characteristics) important for trade imbalances
• Caveat: export not necessarily Nirvana
• => But clearly export competitiveness reflects efficiency and growth of industry and viceversa
• German miracle: did Germany have an industrial structure able to respond to changes in incentives?? • = > Mittelstandt ? Fraunhofer?• For other countries is firms growth important (Italy)?
• Nothing can be forced, but impediments to growth? And does reallocation of resources favour productivity growth?
Share of Total Exports for Top Exporters, by Country
The Happy FewExports Very Concentrated
What Explains Export Status?Firms’ Features
7%
29%
64%
0%
10%
20%
30%
40%
50%
60%
70%
80%
90%
100% Firm Characteristics
Sector Effects
Country Effects
A Simple Decomposition
• To quantify the importance of size and sector, apply to ITA, FRA and SPA the German structure (Germany only as benchmark; no suggestion to become German!)
• Keep fixed a country’s total employment in the manufacturing sector and shift workers across firms and sectors to replicate German structure
• How? Changing the weighting scheme as if sample firms in ITA, FRA and SPA were drawn from German population
• Importantly, keep a country’s export propensity and export share by size and sector classes
Export rise if we apply German industrial strucure, more in Italy and Spain than in France
(Number of workers constant)
Italy: Most of the
action is size
France and Spain,
industry matters
most
Switchers and the rest2001/2 vs 2008/9
Source: Altomonte, Aquilante, and Ottaviano (2012)