ASSOCIAZIONE ITALIANA ECONOMISTI DELL'ENERGIA the Italian Affiliate of the 2 nd AIEE Energy Symposium Conference Proceedings Current and Future Challenges to Energy Security Rome, 2-4 November, 2017 - LUMSA University www.aieeconference2017rome.eu
Transcript
ASSOCIAZIONE ITALIANA ECONOMISTI DELL'ENERGIA
the Italian Affiliate of the
2nd AIEE Energy Symposium Conference Proceedings
Current and Future Challenges to Energy Security
Rome, 2-4 November, 2017 - LUMSA University
www.aieeconference2017rome.eu
the Italian Affiliate of the
Published by: AIEE - The Italian Association of Energy Economists, Rome, Italy
2nd AIEE Energy Symposium
Current and Future Challenges to Energy Security 2-4 November 2017, LUMSA University, Italy
ACKNOWLEDGEMENTS The editors and the publisher acknowledge the support of the following sponsors of the 2nd
AIEE Energy Symposium on Current and Future Challenges to Energy Security Adriatic LNG Axpo Enel ERG Esso Italiana FEDERMANAGER Nature Energy Fondazione Megalia
ORGANIZATION (GENERAL CONFERENCE CHAIR) CARLO ANDREA BOLLINO, President, AIEE, Italy (ORGANIZATION COMMITTEE CHAIR) CARLO DI PRIMIO, Vice President, AIEE, Italy (CHAIR OF THE SCIENTIFIC COMMITTEE) NICOLETTA RANGONE, Professor, LUMSA University, Italy (CHAIR OF THE PROGRAM COMMITTEE) AGIME GERBETI, Adjunct Professor, LUMSA University, Italy (ORGANIZATION AND COORDINATION) ANKA SERBU, External Relations & Communication, AIEE, Italy THE SCIENTIFIC COMMITTEE Kostas Andriosopoulos, ESCP Europe Business School, Grece Francesco Asdrubali, Roma Tre University, Italy Lars Bergman, Stockholm School of Economics, Sweden Simona Bigerna, University of Perugia, Italy Federico Boffa, Free University of Bolzano, Italy Carlo Andrea Bollino, AIEE and University of Perugia, Italy Carlo Cambini, Polytechnic University of Turin, Italy Pantelis Capros, E3MLab - Energy Economy Environment Modelling Lab, Grece Fatma Çiğdem Çelik, Okan University, Turkey Vittorio D'Ermo, AIEE, Italy Vittorio De Martino, AIEE, Italy Erik Delarue, KU Leuven Department of Mechanical Engineering, Belgium Georg Erdmann, Technical University of Berlin, Germany Ugo Farinelli, AIEE, Italy Giovanni Ferri, LUMSA University, Italy Marzio Galeotti, State University of Milan, Italy Agime Gerbeti, LUMSA University, Italy Paolo Gentili, PricewaterhouseCoopers, Italy Antonio Geracitano, Eosconsulting, Italy Angelica Gianfreda, Free University of Bolzano, Italy Jean-Michel Glachant, Florence School of Regulation, Italy Richard Green, Imperial College Business School, U.K. Mario Iannotti, Advisor on Sustainable Development (IMELS), Italy Tomas Kåberger, Chalmers University of Technology, Sweden Jose Maria Labeaga Azcona, Open University Madrid, Spain Xavier Labandeira, University of Vigo, Spain Alessandro Lanza, LUISS University Rome, Italy Arturo Lorenzoni, University of Padua, Italy Carlo Mari, University of Chieti-Pescara, Italy Luis Mundaca, IIIEE at Lund University, Sweden David Newberry, University of Cambridge, UK Spiros Papaeftimiou, School of Production Engineering & Management-Technical University of Crete, Grece Silvia Pariente-David, Center for Mediterranean Integration, France Jacques Percebois, Montpellier University, France Alberto Pincherle, AIEE, Italy Paolo Polinori, University of Perugia, Italy Michele Polo, Bocconi University, Italy Ionut Purica, Advisory Center for Energy and Environment, Romania Pippo Ranci, Catholic University of Milan, Italy
Alessandro Sapio, Parthenope University of Naples, Italy Silvana Stefani, University Bicocca, Italy Lucia Visconti Parisio, University Bicocca, Italy Mine Yücel, Federal Reserve Bank of Dallas, USA Manfred Weissenbacher, University of Malta, Malta G.B. Zorzoli, FREE Committee, Italy
THE PROGRAMME COMMITTEE
Fabio Catino, Treccani, Italy Vittorio D'Ermo, AIEE, Italy Antonella Donia, AIEE-Milano, Italy Ugo Farinelli, AIEE, Italy Francesco Marghella, AIEE, Italy Alberto Pincherle, AIEE, Italy Manfred Weissenbacher, University of Malta, Malta
Giovanni Ferri, Deputy Rector at LUMSA University Full professor of economics at the Department of Economics, Political Sciences and Modern Languages at the LUMSA University. Deputy Rector for teaching and students' rights, chairs the Quality Assurance Committee and the Library Committee. At the University of Bari Aldo Moro, he chaired the Department of Economics Mathematics, was deputy Rector for international relations, introduced and chaired the first two editions of the Master in International Business and Economic Cooperation. Among the other professional experiences, he was at the World Bank. He was Economic Policy Consultant at Italy’s Treasury and Economic Consultant of the Italian Association among Popular Banks. He is a founding member of the Think Tank at the European Association of Cooperative Banks. He was member of the Banking Stakeholder Group at the European Banking Authority. He is a member of the Scientific Committee of the Report on the financial system by the Fondazione Rosselli. At LUMSA he has co-founded and chairs the CeRBE (Center for Relationship Banking and Economics)
Nicoletta Rangone, Chair of the Scientific Committee, LUMSA University Full professor of Economic Law at LUMSA University since 2014, Associate professor at the Politecnico of Milan, Ph.D. in Public Law with the University of Bologna, Academic director in teaching activities in the Short Course on Regulation, Visiting professor in the Joint Master in Parliamentary Procedures and Legislative Drafting, IALS-based EUPADRA Unit, London-Cognitive sciences and public Administrations research plan, visiting Fellowship with the Institute of Advanced Legal Studies, University of London. Member of the Unit for Simplification and Quality of Regulation-Presidency of the Italian Council of Ministers, Legal advisor on regulation at the National School of Administration on the quality of regulation and impact assessment, Legal advisor to the public administration department task-force (Presidency of the council of ministries) on administrative burdens measurement and reduction, national expert at the OECD - Public Management department in Paris.
Agime Gerbeti, Chair of the Programme Committee, LUMSA University Professor of Environmental and Social Sustainability at the University of Rome LUMSA, Prof. Agime Gerbeti holds a law degree from the University of Siena and specializes in environmental and energy law with a M. Sc. in Energy for Kyoto from the Politecnico di Milano. She has been a legal advisor for the Directorate of Sustainable Development at the Ministry of the Environment, Protection of the Territory and the Sea and was the Italian delegate for the European Commission and Council during the negotiations of 20-20-20 and 2030 package as well as for the following international organizations: International Energy Agency, International Partnership for Energy Efficiency Cooperation, Energy Community Treaty. Her latest book is “A symphony for Energy” in 2015, as well as four entries on Energy and Climate change in the Enciclopedia Italiana of the Treccani Institute.
Carlo Andrea Bollino, General Conference Chair, AIEE President Carlo Andrea Bollino - AIEE - Italian Association of Energy Economists - President, Graduate in Economics, Bocconi University, Ph. D. in Economics, University of Pennsylvania with Nobel Winner Prof. Lawrence Klein. Full Professor of Economics and Econometrics, University of Perugia and Professor of Energy Economics, University LUISS Guido Carli, Rome. Research interests: Econometric modeling, Consumer behaviour, Energy markets, Policy evaluation, Liberalization policy, Regulation Policy. Chairman, GSE Italy; Past-President for 2009-2010 of IAEE, International Association of Energy Economists; Advisor to the Minister of Treasury; Economic Consultant for UN, UNCTAD, the US Congress. Taught Economics also at Universities of Pennsylvania (USA), Campobasso, Sassari and Urbino (Italy). Author of over 200 scientific publications and articles.
Carlo Di Primio, Organization Committee Chair, AIEE Vice President President and Director of wind energy companies, Ceo and Vice President of the (AIEE), member of the AIEE Board. He was Ceo and Board Director of several energy companies (Oil refining and marketing, Lng terminals, Power generation, Renewable projects). Other Professional positions: Vice President and Board Director of Assoelettrica (Italian Federation of Electric Industry) and other industrial associations, Deputy General Manager of Unione Petrolifera (Italian Federation of oil industry), member of several Advisory Committee at national and international level. Speaker in energy congresses. Author of papers and articles on petroleum, electricity, renewable and other energy issues. Energy consultant in the field of energy price controlled system, liberalization of oil and electric prices, privatization of electric industry, LNG terminals and environmental assessment.
INTRODUCTION: CURRENT AND FUTURE CHELLENGES TO ENERGY SECURITY The AIEE - Italian Association of Energy Economists (Italian affiliate of the IAEE - The International Association for Energy Economics) organized this international conference in cooperation with the LUMSA University of Rome to bring together energy experts engaged in academic, business, government, international organizations for an exchange of ideas and experiences on the present and future landscape of energy security. The 1st AIEE Symposium on Energy Security - Milan 2016, was an opportunity to explore new and existing energy trends, challenges and creative solutions for the energy security, the availability of new technologies, the emergence of new market conditions and of new market operators. The energy situation is evolving in Europe as well as in the rest of the world, where new actors, the emerging economies, are taking the leading role. Political developments in several areas of the globe (North Africa and Middle East, the Caspian region, ASEAN countries) are reshaping the geopolitical situation, generating some worries about the security of supply in the EU countries. The concept of energy security is undergoing a rapid transformation. In the past, geopolitics and the supply of oil and gas were the dominant factors determining energy security. Today, a broader and more complex spectrum of elements are interacting to both stabilize and threaten energy security. Tackling climate change and contemporary improving energy security have been the most important issues faced by Countries in the last years. After the sign of the Paris agreement in 2015, the climate change problems become more appealing. European Union is moving fast towards its 2030 objectives and is fostering investments on low carbon technologies, energy efficiency and production from renewable sources. The availability of energy sources, when we consider both fossil fuels and renewables, is increasing. In particular, a major source of change is the strong growth in the production and integration of renewable and distributed energy, which offers opportunities to diversify the energy mix and thus improve energy security by reducing physical reliance and price exposure to only a few sources and countries. At the same time, this paradigm of a new energy system has strong implications both on petroleum-producing countries and companies, with knock-on effects on geo-economic balance of powers and energy markets and on the security and reliability of the transmission and distribution networks. The new challenges of the digital revolution that on one hand offers opportunities to improve efficiency, to have lower costs but on the other hand raises a whole new set of challenges and creates vulnerabilities we have never seen before so that energy is being viewed as a key part of national security. While in the past the supply side was the dominant factor in energy security, with the critical element being the possibility of sourcing the products to produce electricity and provide mobility, now the energy security balance is changing. This conference was an opportunity of promoting research and information exchanges on energy security, providing a general look at the forces driving its transformation and at some of their effects. Many of them are different from anything we have seen in the past.
CONTENT PLENARY Sessions programme and keynote speakers i
ABSTRACTS Index by Session iii
PAPERS Index by Session ix
ABSTRACTS 1
PAPERS 157
ANALYTICAL INDEX 279
i
PLENARY SESSIONS KEYNOTE SPEAKERS Opening Session
Giovanni Ferri, Deputy Rector at LUMSA University Nicoletta Rangone, Chair of the Scientific Committee, LUMSA University Agime Gerbeti, Chair of the Programme Committee, LUMSA University Carlo Andrea Bollino, AIEE President Carlo Di Primio, AIEE Vice President Gurkan Kumbaroglu, Past President IAEE, Bogazici University - Turkey Gabriele Checchia, President of AWOS, Italian Ambassador at OCSE, Representative of Italy to NATO Tommaso di Fazio, President C.I.U. Italy EU towards 2030
Agime Gerbeti, Adjunct Professor, LUMSA University, Italy Luca Bragoli, Head of International & Institutional Affairs, ERG, Italy Marco Falcone, Government Relations and Issues Manager, Esso Italiana, Italy Samuele Furfari, Adviser to the Director General of DG Energy at the European Commission Regulation of energy markets
Alessandro Ortis, President Stati Generali dell’Efficienza Energetica Jean-Michel Glachant, Director of the Florence School of Regulation, Italy Giuseppe Gatti, President Energia Concorrente, Italy Pippo Ranci, Università Cattolica, Italy Economic instruments and transition pathways to a low-carbon economy in the industrial sectors
Gurkan Kumbaroglu, Past President IAEE, Bogazici University - Turkey Sandro Neri, FEDERMANAGER Rome, Italy Simone Mori, President Elettricità Futura, Italy Corrado Papa, Commercial Manager, Adriatic LNG, Italy Salvatore Pinto, President of Axpo, Italy Claudio Spinaci, President Unione Petrolifera, Italy Europe Roadmap and the future strategies of the energy industry
Kostas Andriosopoulos, Executive Director, Research Centre for Energy Management (RCEM), Grece Leonardo D'Acquisto, Head Manager Institutional Relations, Italgas, Italy Dario Di Santo, Managing Director Italian Federation for Energy Efficiency – FIRE, Italy Luigi Michi, Strategy and Development Manager Terna, Italy Sustainable mobility challenges for the transition target
Emanuele Proia, Executive Manager ASSTRA (Italian Association of Public Transport Operators), Italy Franco Del Manso, Manager of the Technical and Environmental Office, Unione Petrolifera, Italy
iii
CONTENTS ABSTRACTS INDEX by session pag.
Session 01. The union of national energy markets Chair: Sergio Ascari, Florence School of Regulation, European University Institute, Italy
Danielle Devogelaer Increasing interconnections in a small, open ecoomy: a quantitative evaluation of its effects 1
Cristina González Ventosa, María Sonsoles Madejon Concejal; Luis Villafruela Arranz, Ana Isabel Abril Pérez Influence of interconnections on market prices - Spanish case of study 3
Paolo Mastropietro, Fulvio Fontini, Pablo Rodilla, Carlos BatlleCritical analysis of the “new” Italian capacity remuneration mechanism 4
Christian Spindler, Yuri Yegorov, Franz Wirl, Ondrisek ThomasInvestigation of Advantages from Future Integration of Wind Electricity in EU 7
Session 02. Promoting or imposing energy efficiency? Chair: Manfred Weissenbacher, University of Malta, Malta
Roland Menges Using sticks or carrots to promote energy efficiency – how do individuals react? Results of an experimental investigation 8Carlo Scarpa, Giovanna Landi Is energy efficiency efficient for the European market? . 11Sandra Klinke, Mehdi Farsi, Martin Jakob, Ulrich Reiter Contracting the Gap: Empirical evidence on the role of energy performance contracting to promote investment in energy efficiency (full paper on p. 159)
13
Session 03. Special session on Cognitive-based regulation for consumers empowerment Chair: Nicoletta Rangone, LUMSA University, Italy 15
Fabiana Di Porto Algorithmic regulation: the case of information disclosure
Luigi Mittone Feedback and efficient behavior
Clara Poletti How to improve the functioning of electricity retail markets: push or pull?
Francesco Vetrò Energy consumer empowerment in Italy
Valeria Scorsoni European Issues and trends of regulation 17
iv
Session 04. Global assessment of energy security, efficiency and sustainability Chair: Carlo Andrea Bollino, AIEE, Italy
Elena Stolyarova, Sandrine Mathy, Silavana Mima Evaluating the Implication of COP21 for Energy Security at Member State and EU Level
20
Georgia Makridou, Michael Doumpos, Kostas Andriosopoulos, Emilios Galariotis The financial performance of firms under the EU Emissions Trading Scheme (EU ETS)
22
Gianluca Carrino Carbon tax, EU ETS versus charge on emissions (full paper on, p.199)
24
Session 05. The gas market: new perspectives? Chair: Arnaldo Orlandini, ICEI, University Complutense of Madrid, Spain
Alec Waterworth, Michael J. Bradshaw The current and future role of natural gas in China
26
Chi-Kong Chyong The Economics of Gazprom’s gas export strategies to Europe
28
Sebastian Kreuz Pricing characteristics in the German diesel fuel market after the introduction of the market transparency scheme
32
Raffaele Troise, Claudio Pregagnoli, Claudio Dicembrino, Michele Frate Forecasting models for short and long term gas price
34
Session 06. Energy efficiency in buildings and industry Chair: Spiros Papaefthimiou, Technical University of Crete, Grece
Carlo Andrea Bollino, Simona Bigerna, Maria Chiara D'Errico e Paolo Polinori Environmental and energy efficiency analysis of EU electricity industry: An almost spatial two stages DEA approach
35
Giuseppe Dell’Olio Energy Efficiency in buildings: a simple but accurate way to perform calculations (full paper on p. 226 )
37
Daire McCoy, Antoine Dechezlepretre, Francois Cohen The longer term effects of home energy efficiency investments 38
Session 07. Special Session: Day-ahead, Intra-day and Balancing Markets Chair: Angelica Gianfreda, Free University of Bolzano, Italy
Stefano Clò, Angelica Gianfreda Imbalances and market rules in Italian wholesale electricity market
41
Elena Fumagalli, Bastian Westbrock Demand participation in electricity balancing markets
44
Lucia Visconti Parisio, Angelica Gianfreda, Matteo Pelagatti The RES-Induced switching effect across fossil fuels: an analysis of day-ahead and balancing prices
47
Alessandro Sapio Quantile merit order effects and network upgrades
49
Nicola Sorrentino, Daniele Menniti, Anna Pinnarelli Imbalances costs of small scale renewable not dispatchable power plants in the Italian electricity market
51
v
Session 08. Modeling the new environment Chair: Cecilia Camporeale, Italian Ministry of Environment – A.T. Sogesid, Italy
Cecilia Camporeale Roberto Del Ciello IT-DAMEE: a regional application to assess the macro-effect of RDP fund in Emilia Romagna
53
Nicola Colonna, Stefano Lo Presti Assessing the role of innovative farming techniques to reduce energy consumption and carbon emission
Syed Jawad Hussain Shahzad Asymmetric risk spillovers between oil and agricultural commodities
57
Bård Misund Evaluation of oil & gas firms’ financial performance: cash flows vs. accounting earnings (full paper on, p.212 )
58
Mona Shokripour Natural Gas Market Prediction via Statistical and Neural Network Methods
60
Silvana Stefani, Enrico Moretto, Matteo Parravicini, Simone Cambiaghi, Adeyemy Sonub, Gleda Kutrolli Financial instruments to mitigate the risk of climate change: rainfall and temperature
63
Session 10. Energy and Industrial Competitiveness Chair: Agime Gerbeti, LUMSA University , Italy
Mario Iannotti Carbon pricing instruments for implementing the objectives of the Paris agreement
65
Manfred Weissenbacher The environmental impact of photovoltaic panels imported from China compared to Germany in a central Mediterranean setting
67
Fabrizio Fabbri The revision of EU climate energy policies in the context of the Paris Agreement (full paper on, p.226)
69
Session 11. Strategic contribution of energy storage to energy security Chair: Alberto Pincherle, AIEE Italy
Giuseppe Dell’Olio Energy storage in wind turbines: a strategic contribution to energy security
70
Sergio Ascari Modelling the cost of gas supply outages and their substitution as a way of assessing Security of Supply Measures
71
Maria Kaninia Spot trading profits of energy storage systems in the region covered by EPEX SPOT
73
Session 12. Bioenergies Chair: Carlo Di Primio, AIEE, Italy
Himadri Roy Ghatak Lignocellulosic biorefineries as replacement of fossils (full paper on, p.234 )
74
vi
Carsten Herbes, Verena Halbherr, Lorenz Braun Factors influencing prices for heat from biogas plants
76
Gabin Mantulet, Adrien Bidaud, Silvana Mima Arbitrations for bioenergy use in the 21st century energy context: the significance of gasification and methanisation
78
Russell McKenna, Jann Weinand, Lorenz Braun, Carsten Herbes Securing local energy supply through municipal energy autonomy: assessing the feasability of increased district heating from German biogas plants
81
Session 14. Technology development - Grid management Chair: Giuseppe Dell’Olio, GSE, Italy
Alessandro Piacentini Big Data and Cloud Computing technologies applied to the energy sector: from buzzwords to market optimization through an SaaS solution
90
Mario Valentino Romeri Considering Hydrogen Fuel Cells Powertrain as Power Generation Plant - 2017 review
Session 15. Scenarios and forecasting methodologies Chair: Giancarlo Scorsoni, Energy Advisor, Italy
Simone D’Alessandro 2METE: An Ecological Macroeconomic Model for Energy Transition. Alternative Scenarios Towards Ecological Sustainability and Social Equity
98
Manfred Hafner Energy World in 2040: a scenario approach
100
Arne Vogler, Christian Pape, Oliver Woll, Christoph Weber Forecasting the distributions of hourly electricity spot prices:
102
Session 16. Climate policy and emission trading Chair: Ionut Purica, Advisory Center for Energy and Environment, Romania
Huibin Du, Zengkai Zhang Mapping carbon emissions embodied in inter-regional trade of China: final goods, intermediate goods and value chain
104
Session 13. The Electricity market: risks and opportunities Chair: Lucia Visconti Parisio, University Bicocca, Italy
Carlo Andrea. Bollino, Simona Bigerna, Maria Chiara D'Errico, Paolo Polinori The Ideal Competitive Electricity Market. a simulation for Italy
83
Gaia Moretti Electricity grid evolution in Europe pre-access Countries: the Turkish case
85
Alessio Pinzone, Fabrizio Armani The blockchain challenge for the electricity system
87
Carlo Stagnaro, Carlo Amenta, Giulia Di Croce, Luciano Lavecchia, Managing the liberalization of Italy’s retail electricity market: a policy proposal (full paper on, p.238)
88
vii
António Cardoso Marques, José Alberto Fuinhas, Patrícia Hipólito Leal Economic growth, CO2 emissions, fossil fuels consumption and renewable energy consumption in Australia
105
José Maria Martín-Moreno, Jorge Blázquez, Rafaela Pérez, Jesús Ruiz Curbin carbon emissions: is a carbon tax the most efficient levy?
108
Ionut Purica Energy volatilities and the cost of security
110
Session 17. The multiple paths of electricity demand Chair: G.B. Zorzoli, AIEE, Italy
Penelope Buckley Incentivizing households to reduce electricity consumption: a meta-analysis of the experimental evidence
114
Golnoush Soroush, Carlo Cambini Impacts of Prosumers on DSO Investments: Updating Tariff Structures
116
David López Soto, Rodrigo Nicolás Aragón Salinas The evolution of price and income elasticities of electricity demand in Latin American countries: a time varying parameter approach
119
Session 18. The energy-environment nexus Chair: Jose Maria Labeaga Azcona, Open University Madrid, Spain
António Cardoso Marques, Patrícia Hipólito Leal, José Alberto Fuinhas The impact of economic growth on the CO2 emissions in Australia: environmental Kuznets curve and decoupling index
121
George Nikoloudakis, Spiros Papaefthimiou Air pollution externalities in Greek ports and airports
124
Carla Teotónio, Miguel Rodriguez-Mendez, Peter Roebeling, Patrícia Fortes da Silva Assessing the economic impacts of climate change on competition for water resources in the framework of the water-energy nexus: a hybrid general equilibrium approach for Portugal
125
Session 19. Energy supply and security Chair: Fatma Çiğdem Çelik, İstanbul Okan University, Turkey
Kuei-Lan Chou Constructing a Taiwan’s energy security analysis of liquefied nature gas by system dynamic model
128
Petter Osmundsen, Magne Emhjellen Capital rationing. A threat to energy security
130
Diana Schumann, Sophia Dieken Similarities and Differences in Views on Energy Security. A Comparison of Public and Stakeholder Perceptions in Germany
133
Agime Gerbeti EU ETS 2021-2030 – A too much ambitious directive (full paper on, p.258)
137
Session 20. Integrating renewables in energy markets Chair: Francesco Asdrubali, Roma Tre University, Italy
Philip Dees Feed-in-tariff, quota obligation and tenders for renewable support: Comparison with regard to innovation, investment incentives and strategic behavior
140
viii
Maria Teresa Vespucci, Paolo Pisciella, Giacomo Viganò, Marco Rossi, Diana Moneta Estimation of Bidding Curves for Active Distribution Networks
143
Session 21. A new shape for electricity systems Chair: Carlo Mari, University of Chieti-Pescara, Italy
Stéphane Allard, Silvana Mima, Vincent Debusschere, Tuan Tran, Patrick Criqui, Nouredine Hadj-Saïd Long-term transmission capacity planning in a scenario with high share of variable renewable energies
145
Tim Jonathan Felling, Caroline Deilen, Robin Leisen, Christoph Weber Evaluation of risks for power plant operators through reconfiguration of price zones in extended Central Western Europe
148
Kun Li, Joseph D. Cursio The electricity market price: volatility, pattern and forecast analysis (full paper on, p.269 )
150
Alex Menu The electric system at the time of choices : an ecosystem that creates value for France
152
22. Special Student Session Chair: Vittorio D'Ermo, AIEE, Italy
Lorenzo De Santis The European Energy Policy on Renewable Sources and its Consequences on Member States
153
Elisabetta Glorioso The Italian Electric System in the light of European energy policies
155
ix
PAPERS INDEX by Session Sandra Klinke, Mehdi Farsi, Martin Jakob, Ulrich Reiter Contracting the Gap: Empirical evidence on the role of energy performance contracting to promote investment in energy efficiency. (session 1)
159
Gianluca Carrino Carbon tax, EU ETS versus charge on emissions (Session 4)
199
Bård Misund Evaluation of oil & gas firms’ financial performance: cash flows vs. accounting earnings (Session 9 )
212
Giuseppe Dell’Olio Energy Efficiency in buildings: a simple but accurate way to perform calculations (Session 6)
226
Fabrizio Fabbri EU 2030 climate energy policy (Session 10 )
228
Himadri Roy Ghatak Lignocellulosic biorefineries as replacement of fossils (Session 12)
236
Carlo Stagnaro, Carlo Amenta, Giulia Di Croce, Luciano Lavecchia, Managing the liberalization of Italy’s retail electricity market: a policy proposal (Session 13)
241
Mario Valentino Romeri Considering Hydrogen Fuel Cells Powertrain as Power Generation Plant - 2017 review (Session 14)
254
Agime Gerbeti, Francesco Scalia EU ETS 2021-2030 – A too much ambitious directive (Session 19)
261
Kun Li, Joseph D. Cursio The electricity market price: volatility, pattern and forecast analysis (Session 21)
272
Abstracts
1
Session 01 - The union of national energy markets
Daniele Devogelaer INCREASING INTERCONNECTIONS IN A SMALL, OPEN ECONOMY: A QUANTITATIVE EVALUATION OF ITS EFFECTS
Daniele Devogelaer, BAEE Board Member, Federal Planning Bureau, Avenue des Arts 47-49, 1000 Brussels, Belgium, [email protected]
Overview In the latest Network Development Plan of the Belgian Transmission System Operator Elia, two study projects aimed at reinforcing Belgium’s interconnections with Germany and the UK are cited. Since Belgium is a small open economy with, at times, more than 25% of its current demand covered by imports, it should be well aware of the added uncertainties linked with importing vast amounts of electricity. The decision to further invest in additional interconnections (or reinforcements) should be grounded on a thorough idea of its costs and benefits. This article discusses the impact of adding interconnections to an already well connected economy. The period under investigation is the year 2027, ten years from now. By then, Belgium should have phased out its entire nuclear fleet (6 GW) according to the law of 2003 and should operate a bipolar power system consisting of natural gas and renewable energy sources (Devogelaer and Gusbin, 2015). In this paper, the impact of an increase in the cross-border transfer capacity by 2 GW (+1 GW to and from Germany and +1 GW to and from the United Kingdom) on the functioning on the Belgian thermal (flexible) park is scrutinized. The possibility of premature closure of Belgian gas-fired power plants that have not come to the end of their operational lifetime yet will be documented. The effect this will engender on the system marginal cost and the required volumes of natural gas as well as the notion of missing money (Cramton and Stoft, 2006, Joskow, 2007) will be discussed.
Methods The main instrument that underlies most of the calculations is the optimal dispatch model Crystal Super Grid (Artelys, 2015). Crystal Super Grid is a unit commitment optimal dispatch model for the electricity sector that can be used for one up to thirty countries. It in fact minimizes total system production costs whilst aligning demand with supply. It contains an extensive library of both physical and financial assets (thermal power plants, renewable energy sources, power lines, etc.) which allows a fine-grained level of detail for analyses. The data infeed for the model mainly originates in publicly available databases like ENTSO-E and the International Energy Agency (IEA). More specifically, the demand, the installed capacities and the thermal availabilities are obtained from ENTSO-E, the fuel costs from IEA and the detailed capacity descriptions from the European TSO’s individual websites. Powerful optimization solvers are used to calculate the optimal dispatch of generating facilities in the interconnected zones. Results cover e.g. imports/exports between zones (countries or regions), marginal costs of electricity generation and CO2 emissions. In this study, scenarios are run with ten test cases each to take account of different meteorological years and hence the influence of the weather during a specific year on both demand and solar and wind production. In future power systems with a large penetration of variable energy sources, it is important to know the boundaries of the system in extreme years. In the construction of future demand and variable renewable production profiles, a coherence between the two is taken into consideration. This is ensured by including the correlation between demand and variable renewable production observed in different climatological years. The model used to generate the different production profiles was developed by IAEW (Institut für Elektrische Anlagen und Energiewirtschaft) at the university of Aachen RWTH. Commercial electricity exchanges between different countries are modelled through interconnections (NTC’s). The imported and exported volumes are calculated by the model, as well as production levels and (changes in) CO2 emissions.
2
Session 01 - The union of national energy markets
Intermediary results It seems that the future carbon price is a pivotal parameter. Depending on the height of the carbon price, quite different results are obtained. When the carbon prices are rather low (17 €/tCO2 in 2027), adding interconnections to an already well interconnected country further dampens the business case of the existing thermal fleet. Less running hours for the current thermal units are observed whilst imports into Belgium will increase. Exports from Belgium will also grow. This means that Belgium in this setting is finding its niche more and more as an energy hub or an energy roundabout, facilitated by its position at the crossroads of important renewable generation hubs (major wind hubs in the North and solar hubs in the South) and close to the main load centres. More ambitious CO2 prices (around 55 €/tCO2 in 2027) will completely overthrow this picture: Belgian gas-fired power plants will significantly increase their running hours and will export substiantially more to countries that possess a more polluting energy mix, thereby influencing the overall European CO2 picture. Maintaining current thermal capacities seems to outperform building new ones, but it remains blurry as to how to keep existing units to bridge the remaining ten-year period. Solutions as to capacity remuneration mechanisms are touched upon.
Preliminary conclusions Preliminary conclusions of this ongoing research reveal two big axes: Given the major influence carbon prices have on the merit order, hence, on the number of full load hours of existing thermal power plants, it is of utmost importance that a country like Belgium supports all initiatives that put a fair price on the emission of carbon dioxide and that strengthen this pricing mechanism; Increasing interconnections seem to have a beneficial influence on the overall Belgian welfare by lowering the price of the commodity, thereby giving access to the cheapest available energy in the Central West European zone. Nonetheless, keeping a well-functioning domestic fleet is crucial from the point of view of safeguarding reliability and generation adequacy in Belgium.
References
Artelys France (2015), Artelys Crystal Super Grid documentation. Cramton, P. and S. Stoft (2006), The Convergence of Market Designs for Adequate Generating Capacity,
Manuscript, April. Devogelaer, D. and D. Gusbin (2015), 2030 Climate and Energy Framework for Belgium, Impact assessment of a
selection of policy scenarios up to 2050, Federal Planning Bureau, Working Paper 3-15, April. Devogelaer, D. and D. Gusbin (2017), Cost-benefit analysis of a selection of policy scenarios on an adequate
future Belgian power system, Economic insights on different capacity portfolio and import scenarios, Federal Planning Bureau, Report, February.
IEA/NEA (2015), Projected costs of generating electricity, 2015 edition. Joskow, P. (2007), Capacity payments in imperfect electricity markets: need and design. Joskow, P. and J. Tirole (2007), Reliability and Competitive Electricity Markets, RAND Journal of Economics,
Vol 38, No 1, 60-84 5.
3
Session 01 - The union of national energy markets
Cristina González Ventosa, María Sonsoles Madejon Concejal, Luis, Villafruela Arranz, and Ana Isabel Abril Perez INFLUENCE OF INTERCONNECTIONS ON MARKET PRICES - SPANISH CASE OF STUDY
Overview The European Commission is encouraging Member States to increase electricity interconnection to promote a more efficient single electricity market and to integrate renewable energy sources. Unfortunately the Iberian Electricity Market (MIBEL), despite the capacity of interconnection between France and Spain has increased in the last years, it is still far from the goals established in Madrid agreements in 2015. In this study the impact on electricity market prices is analyzed from the perspective of this lack of interconnections. Method We analyze the evolution of the prices Iberian Market taking into account the real mix of generation at every hour, the market conditions and the real capacity of the interconnections. The period of the analysis has been selected from May-2014 to My2017. The main reason for this choice is because the Iberian Electricity Market was included in the PCR initiative (Price coupling of Regions) with the rest of European markets from that date. Congestion periods have been selected distinguishing between import and export hours. For export periods we studied the influence of real generation mix on electricity prices and for import periods a comparison between Europe and Iberian Prices has been done. Taking into account the previous analysis, we have simulated the impact on prices if there would be a 10% of capacity of interconnection. Results As a result of the analysis performed, during a period of around 65% of the hours, on average, there have been import congestions. If we compare the prices between the Iberian Electricity Market and the rest of European Markets, these are significantly higher compared to the rest of European countries, except Italia. The prices in France are around 10 €/MWh lower than the prices in Spain. According to the simulation results, an increase of the interconnection capacity up to 10% of the generating capacity, we have estimated that the range of the price in the Iberian Electricity Market could be reduced closed by 20%. Regarding exports, the hours with congestion are lower than the imports case, more or less 13% of the hours. These hours matched with the period of the higher availability of hydro and wind production. Therefore, only when come together both factors, the prices of the Iberian Market are lower than the prices in the rest of Europe. Anyway, it is not the purpose of this paper to estimate the impact over European markets due to an increase of renewable production in the Iberian Peninsula with an increase of the exchange capacity. Conclusions We consider that a significant increase of interconnection capacity would have a real impact on electricity prices. As a consequence, the congestion hours will be lower than in the present, and will be achieved an effective market coupling with the rest of Europe.
4
Session 01 - The union of national energy markets
Paolo Mastropietro, Fulvio Fontini, Pablo Rodilla and Carlos Batlle CRITICAL ANALYSIS OF THE “NEW” ITALIAN CAPACITY REMUNERATION MECHANISM
Paolo Mastropietro, Institute for Research in Technology, Comillas Pontifical University, Madrid, Spain [email protected]
Fulvio Fontini, Department of Economics and Management, University of Padua, Padua, Italy, [email protected]
Pablo Rodilla, Institute for Research in Technology, Comillas Pontifical University, Madrid, Spain , [email protected]
Carlos Batlle, MIT Energy Initiative, MIT, USA and Florence School of Regulation, EUI, Italy, [email protected]
Overview The development of the Italian power sector during the last decade has been characterized by a sustained growth of renewable energy sources, prompted by support mechanisms, and by a shrinking electricity demand due to the economic crisis. As in other contexts, this resulted in a reduction of the profitability of some thermal generation plants, particularly Combined Cycle Gas Turbines (CCGTs), whose operating hours (Figure 1) and market revenues collapsed, a situation that is already causing mothballing or decommission of some of these units (Terna, 2015). Even if the Italian power sector has been characterized in the last decade by a clear overcapacity, the potential reduction in the CCGT capacity is creating concerns regarding the flexibility of the power system. These more recent questions add on the security-of- supply concerns raised by the major blackout suffered by the country in 2003, which evidenced the Italian dependency on electricity imports.
Figure 1. CCGT capacity, production and load factors in recent year; authors’ elaboration based on Terna (2015) These and other concerns prompted the Regulator to introduce a Capacity Remuneration Mechanism (CRM), whose design started in 2003 and is still ongoing, through several successive consultations, modifications and approvals. In this intervention, Italy is following the prevailing trend in the European Union, which is currently experiencing the emergence of several CRMs that complement the energy markets created by the initial liberalizations back in the 1990s. The United Kingdom has already carried out the third auction of its capacity market (National Grid, 2016), France is implementing a CRM based on decentralized capacity obligations (RTE, 2014), while Ireland included a capacity mechanism in its wider electricity market reform (SEM, 2016). The European Commission is now trying to impose strict guidelines (EC, 2016a and 2016b) on the introduction of CRMs in Member States, which go beyond the persecution of state aid policies applied so far, but the outcome of these policies cannot be foreseen at this writing. The Italian CRM is a quantity-based market-wide scheme based on the procurement by the System Operator of reliability option contracts. This research paper aims at presenting the main features of the Italian capacity remuneration mechanism and at building a critical review of the design currently under approval
5
Session 01 - The union of national energy markets Methods The Italian capacity mechanism is analyzed through the design-element structure proposed by Batlle et al. (2015). Once the CRM is “broken up” into its design elements, the scheme is compared with other capacity mechanisms, implemented in Europe and elsewhere (United Kingdom, France, Ireland, ISO New England, PJM). This allows to highlight those critical features of the Italian CRM that are not aligned with international experiences. Results The main findings of the critical analysis can be summarized as follows: For the time being, renewable technologies will not be allowed to trade their capacity in the CRM auctions and will not have access to the resulting remuneration. This may fail reflecting the contribution of solar photovoltaic in a system with an increasing summer peak related to air conditioning. The average construction time for new plants in Italy is longer than the lag period considered for CRM contracts, which is equal to four years. This may discourage new power projects from bidding in the auction, due to the risk of sanctions in case of delays. The contract duration, which is three years for all resources, existing and new, does not allow a proper hedging of long-term risks and may discourage new entrants. This design element is not aligned with other auction-based CRMs, in Europe and elsewhere, which consider longer contract durations for new resources (from 7 to 15 years). The Italian reliability option contracts lack an explicit penalty aimed at improving the performance of committed capacity during scarcity conditions. This is not aligned with international experiences from both side of the Atlantic (ISO New England, PJM, and Ireland). The zonal clearing of CRM auctions may lead to high capacity prices in those zones where local market power exists. The Italian CRM presents a clear bias towards the existing thermal fleet, which, with the current design, may monopolize first auctions. This feature, together with the current overcapacity that characterizes the system, may clash with the European Commission’s guidelines on capacity mechanisms. Conclusions The market-based capacity mechanism proposed for Italy is deemed to enhance the electricity market efficiency by making explicit and transparent the social value of capacity. It is technology-neutral and it is expected to result in the entrance of the technology that, at a given moment, is the most efficient in providing security of supply. Furthermore, its design presents several innovations on the conventional reliability-option design. However, there are some critical features of the Italian CRM that require a careful assessment. Such features, analyzed and in this research paper, are likely to be at the centre of the negotiation with the European Commission that the Italian Regulator will have to face once the design is approved and made official. References AEEG, Autorità per l’energia elettrica e il gas (2011). Criteri e condizioni per la disciplina del sistema di
remunerazione della disponibilità di capacità produttiva di energia elettrica, ai sensi dell’articolo 2 del decreto legislativo 19 dicembre 2003, n. 379. Resolution ARG/elt 98/11, released on 21 July 2011.
Batlle, C., Mastropietro, P., Rodilla, P., Pérez-Arriaga, I. J. (2015). “The System Adequacy Problem: Lessons Learned from the American Continent”. Chapter of the book Capacity Mechanisms in the EU Energy Markets: Law, Policy, and Economics, 2015, Oxford University Press.
EC, European Commission (2016a). Final Report of the Sector Inquiry on Capacity Mechanisms. COM(2016) 752 final, released on 30 November 2016.
EC, European Commission (2016b). Staff Working Document Accompanying the Final Report of the Sector Inquiry on Capacity Mechanisms. SWD(2016) 385 final, released on 30 November 2016.
National Grid (2016). Final Auction Results: T-4 Capacity Market Auction for 2020/21.
6
Session 01 - The union of national energy markets
RTE, Réseau de Transport d'Électricité (2014). French capacity market. Report accompanying the draft rules.
Document released in April 2014. SEM, Single Electricity Market Committee (2016). Integrated Single Electricity Market (I-SEM) - Capacity
Remuneration Mechanism Detailed Design - Decision Paper 3. Decision Paper SEM-16-039, released on 8 July 2016.
Terna (2017c). Mercato della Capacità - Criteri per la definizione di curve di domanda per Area, lineari a tratti, funzione di specifici valori di LOLE. Consultation document, released in January 2017.
Terna (2015a). Dati Statistici sull’Energi Elettrica in Italia. Annual report for 2015.
7
Session 01 - The union of national energy markets Christian Spindler, Yuri Yegorov and Franz Wirl INVESTIGATION OF ADVANTAGES FROM FUTURE INTEGRATION OF WIND ELECTRICITY IN EU
Overview We want to consider an advantage from the development of high voltage (HV) lines in the European Union for more cross border trade in electricity. There is limited capacity of HV lines across countries and sometimes even inside a country. At present, low transmission capacity due to lack of HV connections across EU countries creates bottlenecks for long distance electricity transmission, resulting in congestion, quotas and high price from transmission and finally market regionalization. Transition towards more renewable energies (especially wind) creates a problem of balancing random supply. It becomes harder with higher penetration of wind. The goal of this paper is to see to what extent spatial aggregation of wind supply can partly self-balance it. Methods While production of an individual wind mill can be forecasted based on local statistics of wind, cross-correlation of wind speed across locations is not sufficiently studied, at least in energy economics literature. Wind pattern is not a purely stochastic but chaotic process. It can be characterized by local continuity in space and time but high instability resulting in stochastic patterns at large distances and times. We want to find the characteristic distance of spatial correlation for Europe based on empirical history of wind speed at certain locations. Our theoretical model derives the ratio of deterministic to stochastic component for some stylized wind patterns as the function of aggregation distance. Those results can be used further in a theoretical model that takes into account losses for heating as the functions of HV length and capacity as well as advantages from the possibility to balance heterogeneous spatial electricity demand and less correlated supply of renewable energies at large distances. Results The main idea comes from the analysis of weather maps with the focus on wind. The typical diameter of a cyclone over Europe is of order 1000 km. This means that at lower distances wind is highly correlated in most of the cases. Hence, we need to aggregate wind supply in the areas about 1000 km in length in order to have its constant component sufficiently high comparing to the variable component. In those areas wind energy can be highly balanced by itself, while in the case of lower aggregation a lot of other energy sources are needed for balance. This argument suggests the policy of inter-country aggregation of HV lines in order to lower balancing costs. This is especially important in the future when wind penetration will be higher. Conclusions The EU can invest in new capacity of HV lines to obtain more possibilities to balance an increasing share of renewable energies (especially wind). This will also increase its energy security. Another goal can be political: higher integration between regional electricity networks will strengthen the EU politically.
8
Session 02 - Promoting or imposing energy efficiency
Gregor Beyer and Roland Menges USING STICKS OR CARROTS TO PROMOTE ENERGY EFFICIENCY – HOW DO INDIVIDUALS REACT? RESULTS OF AN EXPERIMENTAL INVESTIGATION
Gregor Beyer, Clausthal University of Technology, Germany; Roland Menges, Clausthal University of Technology, Germany, [email protected]
Overview It is an unavoidable consequence of thermodynamics that large parts of total primary energy are lost when transformed into usable energy along the conversion chain. A bulk of studies suggest that improved energy efficiency in buildings, industrial processes and transportation could reduce the world’s energy needs substantially and thereby also helps to curb down the emissions of greenhouse gases. Although technologies to improve energy efficiency at the consumption side are available, the problem remains that individual households and companies are required to conduct large upfront investments to achieve savings that accrue later. This problem is labeled the energy- efficiency-gap and governments worldwide commit significant resources to overcome this problem (Prindle et al. 2010). Private households in particular are targeted with a broad variety of programs. Sticks such as energy taxes and carrots such as subsidies are used to incentivize investments. Economic literature reports that the results of energy efficiency programs range from positive (Alberini et al. 2013) to negative (Grösche and Vance 2009). However, most of these empirical studies neglect the strategic element of behavioral effects. In economic terms the energy efficiency gap gives rise to the incentive structure of an impure public good. Investing in energy efficiency implies to forgo current consumption possibilities in order to realize two things: First, households expect to reduce the total cost of energy consumption in the future as a private benefit. And second, they also contribute to a public good because of the reduction of energy consumption and greenhouse gas emission. The difference between the welfare maximizing level of individual energy efficiency investments (as perceived from the whole society) and the investments individuals actually undertake can be explained by positive externalities. Each individual compares private cost and private benefit of its decision and has only limited interest to also consider possible effect on social values. Investing in energy efficiency gives rise to a positive externality which simply represents the other side of the coin named negative externality of energy consumption. This paper presents an impure public good model where individuals interact when making investments decisions. The hypothesis drawn from this model states that sticks (such as taxes) and carrots (such as subsidies) can be used for an efficient internalization of external effects. This hypothesis is tested with the means of a laboratory experiment. Methods Results are drawn from an incentivized, non-linear public good experiment. The underlying model is a derivative of the impure public good model as suggested by Cornes and Sandler (1996) and used in previous studies (Menges & Beyer 2014). It features three core attributes of individual energy efficiency investments, which are expressed in a payoff function: opportunity costs of energy efficiency in terms of reduced private consumption, private benefits of efficiency investments that result from reduced energy expenditures public benefits reflecting the positive spillovers of efficiency investments such as climate protection. When modelling energy efficiency in this payoff function we follow Chan et al. (1999), who state that in the energy efficiency case all involved parties have different sizes, different interests, and different abatement cost structures. This leads to non-linear payoff structures of individual decisions.
9
Session 02 - Promoting or imposing energy efficiency
The investment problem is non-linear in the sense that the optimal individual investment almost certainly is greater than zero and lies in the interior of the choice set of each agent. Note, that the incentive structure of such kind of model is characterized by the motivation of free-riding. Even in the absence of regulation, it is in the private interest of all individuals to invest at least certain quantities of their endowments, given the expected investments of all other individual (Nash equilibrium > 0). However, all individuals would benefit if they would cooperate and invest in a way which maximizes the sum of all individual payoffs (welfare maximization). Hence, the gap between the optimal investment in the Nash-equilibrium and the welfare maximizing investment can be interpreted as energy efficiency gap. The model predicts that taxes on energy and subsidies for energy efficiency can be used to reduce this gap. Both, taxes and subsidies change the incentive structure of the payoff function in order to internalize the external effect: Energy taxes increase the private benefit of efficiency investments because the saving of expected energy expenditure increases. Subsidies paid for individual investments reduce the opportunity costs of investments but do not affect expected benefits. The experimental design is based on four treatments. In the control treatment (T1) we investigate individual decisions in the absence of any kind of regulation. Two treatments (T2 and T3) are used for testing and comparing directly the effects of taxes and subsidies. Although taxes and subsidies give rise to different income effects (the income effects becomes negative in the case of taxes and it becomes positive in the case of subsidies) , both, taxes and subsidies are designed in a way, which bears the same optimal investment decisions for each household type. A fourth treatment (T4) is developed to test for the effects of subsidies which only induce positive income effects but do not affect predicted optimal values of decisions (as compared to T1). Moreover, the experiment also includes a questionnaire concerning sociodemografic variables and certain attitudes towards environmental and energy policy. 180 Participants from a lecture in economics were recruited for a computer-based classroom experiment at the University of Clausthal in April 2017. Instructions were given via headphones. Each participant was assigned one of three heterogeneous household types with varying household sizes (assuming that energy needs depend on household size) and varying endowments (income). Three households of each type were merged to one artificial society, where participants had to make their one-shot investment decision. However, because interaction in each society was anonymous, they had no opportunity to communicate or to engage in explicit cooperation before making their investment decision. All participants were instructed to use their given endowment for an investment in energy efficiency in order to realize a private payoff, which will be paid out in cash at the end of the experiment. They were able to simulate and to learn how the expected payoff is affected by their own investment decision and how it is influenced by the investment decision of the other households in their society before making their investment decision. Results and conclusions 180 individual investment decisions are investigated on two levels: On the individual level observed investments of all types of households are compared to predicted values according to the model. On the collective level, we investigate the results in each artificial society with respect to a welfare indicator, i.e. the sum of payoffs. A first look at empirical results shows that the central hypothesis of the model can be confirmed. Taxes and subsidies do not differ very much in their ability to overcome the so-called energy efficiency gap. When applying a between-subjects analysis it can be shown that all types of household of T2 and T3 increase their energy efficiency investments when facing a tax on energy or a subsidy for energy efficiency measures. However, paying a subsidy for energy efficiency which only introduces positive income effects is not effective. In several cases it can be shown, that such kind of subsidies do not only give rise to windfall gains, but also reduce voluntary payments for energy efficiency without stimulating investment activities at all. Reducing the opportunity costs of efficiency investments with the means of a subsidy does not necessarily motivate individuals to increase their investments when investments give rise to positive, but decreasing benefits.
10
Session 02 - Promoting or imposing energy efficiency Because of their regressive effects on the distribution of income energy taxes are not very popular as mean of energy policy. On the other hand subsidy programs are often suggested as mean of choice because they address two goals simultaneously: subsidies attenuate negative social consequences of rising energy prices (especially for low income households) and they also stimulate investments in energy efficiency. However, when transferring the results of this experiment to real-life energy policy, the question has to be discussed, how windfall profits and other unintended behavioral responses to subsidies as observed in T4 can be prevented. In the model and in the experimental design the determination of efficient subsidies (T2) took place under perfect information about the non-linear payoff function. It is reasonable to assume that in reality the details “behind” this payoff function exist, but they are private information. Non-linearities include positive optimal investments for each household - even in the absence of sticks and carrots. However, if policy is not able to control the factors driving this optimal investment when fixing the subsidy, it is possible that subsidies fall flat. Facing the non-linearities of energy efficiency, energy taxes have the advantage, that they indubitably increase incentives to invest in efficiency, even if policy has no information about each households energy consumption characteristics. References Alberini, A.; Banfi, S.; Ramseier, C. (2013): Energy Efficiency Investments in the Home: Swiss Homeowners and
Expectation about Future Energy Prices, Energy Journal 34, 49-82. Chan, K. S., Mestelman, S., Moir, R. and Muller, R. A. (1999): Heterogeneity and the Voluntary Provision of
Public Goods, Experimental Economics 2, 5-30. Cornes, R.; Sandler, T. (1996): The Theory of Externalities, Public Goods and Club Goods, Cambridge. Grösche, P.; Vance, C. (2009): Willingness-to-Pay for energy conservation and free-ridership on subsidization -
Evidence from Germany, Energy Journal 30, 141–160. Menges, R.; Beyer, G. (2014): How to support energy efficiency – an experimental investigation of individual
preferences, in: Schenk-Mathes, H. Y., Köster, C. (ed.), Entscheidungstheorie und –praxis, DOI 19.1007/978-3-662- 46611-7.
Prindle, B.; Zarnikau, J.; Allis, E. (2010): Barriers and Policy Solutions to Energy Efficiency as a Carbon Emissions Reduction Strategy, in: Sioshansi, F. (ed): Generating Electricity in a Carbon-Constrained World, 207-239, London.
11
Session 02 - Promoting or imposing energy efficiency Carlo Scarpa and Giovanna Landi IS ENERGY EFFICIENCY EFFICIENT FOR THE EUROPEAN MARKET? Carlo Scarpa, Professor of Economics at Università di Brescia, Chairman of REF-Ricerche, Via Rugabella, 20122
Milan, Italy, [email protected] Giovanna Landi, Principal of Studio Legale Landi, Via Rugabella, 1 20122 Milan, Italy,
Overview The European Union includes energy efficiency among those priority measures that citizens and Member States are asked to adopt for the achievement of the reduction of CO2 emissions and the development of green markets based upon clean energies. This concept is strengthened also in the European package for consumers towards clean energy transition, named “Clean Energy for All Europeans” and it is a pivotal criterion for all the European legislative measures on energy and energy consumptions by certain sectors (real estate, transport etc.). Investments in energy efficiency must be improved by Member States by the implementation of long-term national strategies, with clear steps and measures to decarbonise the national buildings stock by 2050, with an intermediary step in 2030. By such plans, Member States are called to set forth orientations on mechanisms for investments following the main criteria indicated by the package, i.e.: aggregation of projects, to make it easier for investors to fund the renovations de-risking operations for investors use of public funding to leverage additional private-sector investment or address specific market
failures In Italy, the current version of the National Energy Strategy (currently under review) gives priority to energy efficiency, but does not contain any useful indication on investment strategies. The relevant market is not well developed yet and a number of obstacles, having both legal and technical nature, have hindered its success. This sector has been recently subject to dedicated public incentives, such as the Conto Termico, which replaced the contested Conto Energia, which together with the Green Certificates (i.e. other kind of public incentives based upon a market value) made the renewable market succeed strongly and rapidly. Before the implementation of an energy efficiency strategy at national level, therefore, it is important to analyze the relevant sector and to compare it with the similar market formed by renewable energies (i.e. solar and other renewable electric sources). Methods An economic comparison of efficiency and effectiveness of incentive schemes concerning energy supply (renewables, decreasing emissions for a given production level) and demand side (efficiency measures, decreasing energy demand for given generation technologies). This can be done both at theoretical level – using microeconomic theory to compare supply side policies and demand side incentives – and considering the estimated cost and the likely effectiveness of different, selected policy instruments. Results On the basis of the above, the present paper analyses from a legal and economic perspective, benefits and negative aspects of the energy efficiency actions and initiatives, also benefitting from some practical case studies, and aims at offering some guidelines to take into consideration within the implementing measures (and/or its review) of the NES.
12
Session 02 - Promoting or imposing energy efficiency The analysis provides the conditions under which different policies can be considered preferable. These conditions will partly be theoretical, partly related to the financial and legal aspects of the various investment projects. Conclusions These results – also on the basis of the experience with the Conto Energia – will allow us to draw the implications for policy design, questioning both the desirability of aggressive incentive policies towards energy efficiency and stressing the role of the public budget constraint References Geller, H., Harrington, P., Rosenfeld, A.H. and Tanishima, S. (2006) “Polices for increasing energy efficiency:
Thirty years of experience in OECD countries”, Energy policy. Gillingham, K., Newell, R.G. and Palmer, K. (2009) “Energy Efficiency Economics and Policy”, Resources for
the future D.P., 09-13. Jaffe, A.B. and Stavins, R. (1994) “The energy-efficiency gap. What does it mean?”, Energy policy. Loughran, D.S. and Kulick, J. (2004) Demand-side management and energy efficiency in the United States,
Energy Journal. Schleich, J. and Betz, R. (2005) “Incentives for energy efficiency and innovation in the European Emission
Trading System”, ECEEE 2005 Summer Study. Williams, A., Hesness, M., Moshier, P., McCleese, A. and Willis, T. (2015) “Final Report on Energy Efficiency
Incentives”, Prepared for The Ohio State University Environment, Economy, Deve
13
Session 02 - Promoting or imposing energy efficiency
Sandra Klinke, Mehdi Farsi, Martin Jakob and Ulrich Reiter CONTRACTING THE GAP: EMPIRICAL EVIDENCE ON THE ROLE OF ENERGY PERFORMANCE CONTRACTING TO PROMOTE INVESTMENT IN ENERGY EFFICIENCY
Sandra Klinke: Inst. of Economic Research, University of Neuchâtel, Abram-Louis Breguet 2, CH-2000 Switzerland, +41795862621, [email protected]
Mehdi Farsi: Inst. of Economic Research, University of Neuchâtel, Abram-Louis Breguet 2, CH-2000 Neuchâtel, Switzerland, +41 32 718 1450, [email protected]
Martin Jakob: TEP Energy GmbH, Rotbuchstrasse 68, CH-8037 Zürich, Switzerland, +41 43 500 7171, [email protected]
Ulrich Reiter: TEP Energy GmbH, Rotbuchstrasse 68, CH-8037 Zürich, Switzerland, +41 43 500 7173, [email protected]
Overview Energy performance contracting (EPC) consists of outsourcing the design, the structure, and sometimes the financing of an energy-efficiency project to a contractor called an Energy Service Company (ESCO). Generally, with a long-term contract, the ESCO provides its client with a reduction in energy costs in exchange for a fixed fee or part of the savings achieved. Through a performance guarantee or by sharing the savings achieved, the ESCO bears a significant part of the performance risk. As a result, EPC can be considered as a promising market-based instrument to induce energy efficiency investments in both private and public buildings. With this study, we aim to provide empirical evidence on the decision mechanisms through which EPC can induce investments in energy efficiency and to explore the underlying trade-offs while accounting for preference and decision patterns heterogeneity among building managers. Method The analysis is based on a discrete choice experiment among 297 potential EPC clients, i.e. managers and owners of large private and public buildings in Switzerland. In order to explore heterogeneity in preferences and decision- making processes, we compare conditional logit models with latent class models accounting for possible attribute non-attendance. Results The results show that the performance guarantee and the resulting risk sharing provided by EPC is consistently facilitating the willingness to invest in energy efficiency. The ESCO’s financing, on the other hand, is considered positively only by a minority of respondents. These are mostly public entities, presumably with debt ceilings. We found no divergence in the decision-making or in the valuation of contractual attributes between private and public entities. The results also show that when considering complex choices such as investments in energy efficiency, one has to account for preference heterogeneity as well as divergences in the decision process simplification. The results provide interesting insights about the behavioral complexity and heterogeneity underlying the decision process regarding energy efficiency investments. Conclusions While credit constraints seem to concern only a minority of potential EPC clients in Switzerland, asymmetric information, when the client cannot observe nor verify the performance or the adequacy of a technology, seems to be relevant for a majority of respondents. This is based on the findings that the ESCO’s guarantee has a persistent and significant positive impact on the willingness to invest.
14
Session 02 - Promoting or imposing energy efficiency This further suggests that the risk sharing advantage of EPC is an important driving factor for energy efficiency investments. Additionally, while EPC can mitigate important barriers to investments, it is also facing an intrinsic reluctance from potential clients which could not be explained by its contractual attributes, such as the contract’s duration or the payment to the ESCO. We argue that this reluctance mostly comes from misunderstandings of the concept and therefore could be mitigated by fostering awareness. References Banfi, S., Farsi, M., Filippini, M. and Jakob, M. 2008. Willingness to pay for energy-saving measures in
residential buildings. Energy Economics, 30, 503-516. Hensher, D.A., Rose, J.M. and Greene, W.H., 2015. Applied Choice Analysis, second edition, Cambridge
University Press. Klinke S., Farsi M., Jakob M., Reiter U. (2017). Contracting the Gap - Energy Efficiency Investments and
Transaction Costs. Final report, in press, Swiss Federal Office of Energy, Bern, Switzerland. Polzin, F., von Flotow, P., and Nolden, C., 2016. What encourages local authorities to engage with energy
performance contracting for retrofitting? Evidence from German municipalities. Energy Policy, 94, 317-330. Sorrell, S., 2005. The contribution of energy service contracting to a low carbon economy. Tech. rep., Tyndall
Centre.
15
Session 03 - Cognitive-based regulation for energy consumers empowerment
COGNITIVE-BASED REGULATION FOR ENERGY CONSUMERS EMPOWERMENT
Nicoletta Rangone, Professor of Economic Law, LUMSA University, [email protected]
Fabiana Di Porto, Professor of economic law, University of Salento, [email protected] Luigi Mittone, Professor of Economics at the University of Trento, [email protected]
Francesco Vetrò, Professor of Administrative Law, University of Salento, [email protected] Clara Poletti, Head of Energy Division at the Autorità per l'energia elettrica il gas e il sistema idrico,
[email protected] Overview The traditional regulatory toolkit (made of command and control, incentive, market based instruments and information disclosure) has been enriched by two new tools: nudging and cognitive empowerment. These last tools are cognitive- based because consideration is given to bias, heuristics, social norms and neuroscientific insights in the rule-making. While they can be both classified as non-economic incentives, their differ in that nudging designs the choice of environment in order to prompt some behavior, somehow exploiting an individual’s biases, while cognitive empowerment is aimed at overcoming them. Therefore, nudging is bias-preserving and interferes with individual’s autonomy (so-called “end paternalism”), while cognitive empowerment is a truly de-biasing technique and is aimed at correcting biases in the achievement of individual’s goals (“means paternalism”). Examples of nudging are default rules (which specify the desired outcome, for instance the green energy option, in a given situation if people make no choice) and comparative feedback (which uses imitation in order to nudge people to change their personal reference point). The latter have proven effective in promoting, among other things, household energy efficiency. Among empowerment tools, targeted education, standardization (which eases comparison of products or services) and simplification of information given to consumers (in order to avoid information overload, e.g. on energy consumption) can be mentioned. A way to support a given behavior is also to simplify information requested from consumers (e.g. prefilled forms) or activities to be performed by individuals (pro-choice web applications aimed at facilitating people’s choice by making comparisons between services easier). This so-called “make it easy” strategy is a cognitive empowerment tool because it helps individuals to overcome inertia. And then there is a grey area made of cognitive-based informational tools employing framing. The latter are mainly aimed at simplifying information and prompting "slow" thinking, thus they can be classified as cognitive empowerment; however, because they use framing techniques, they also contain some manipulative effect, although to a very limited extent, and in this limited sense they may also leverage on biases, and thus share features of nudging. In this framework, several energy regulators around the world have been implementing nudging and cognitive empowerment regulations in order to increase energy efficiency and saving, to make energy consumers proactive in the market and raise their awareness about energy consumption, such as the Italian, Dutch, South African and Swedish energy regulators (see OECD 2017, p. 107 ff.) Methods The discussion is aimed at analyzing the topic from an economic and legal perspective, including experimental methods. Results In line with the theoretical framework outlined above, the panel is aimed at verifying:
16
Session 03 - Cognitive-based regulation for energy consumers empowerment (i) how empirical data on the way people and firms make choices in the real world (hereafter cognitive insights) should be employed to support the drafting of nudging and cognitive empowerment regulation; (ii) to what extent the use of cognitive insights in rule- making is legitimate; (iii) the impact of the use of nudging and cognitive empowerment in increasing the effectiveness of regulation. Conclusions The speakers will discuss how effective nudging and cognitive empowerment tools are in achieving the above mentioned goals: to increase energy efficiency and saving; make consumers proactive in the market; and raise their awareness about energy consumption.
References
Casal S., Dellavalle N., L. Mittone, Soraperra I., Feedback and efficient behavior, in PLOS ONE, Vol. 12, n. 4,
2017, p.e0175738 Di Porto F. and Rangone N., Behavioural Sciences in Practice: Lessons for EU Policymakers, A. Alemanno and A.-
L. Sibony (eds), Nudge and the Law: A European Perspective?, Oxford, Hart Publishing, 2015, pp. 29-59 EU Commission Working Group, Report on Transparency in EU Retail Energy Markets, 2012 OECD, Behavioural insights public policies, 2017, Chapter 6: Behavioural insights case studies: energy Kahneman D. and Tversky A., Prospect Theory: An Analysis of Decision under Risk, in Econometrica, vol. 47, n.
2, 1979, p. 263 ff. Sunstein C., Why Nudge? The Politics of Libertarian Paternalism, Yale University Press, New Haven, 2014, p. 61
ff. Schultz P.W. et al., The Constructive, Destructive, and Reconstructive Power of Social Norms, in Psychological Science, Vol. 18, n. 5, p. 429-43
17
Session 03 - Cognitive-based regulation for energy consumers empowerment
Valeria Scorsoni ISSUES AND TRENDS OF EUROPEAN REGULATION
Valeria Scorsoni, Regulatory expert, Via A. De Gasparis 29, Rome, Italy, [email protected]
Overview This paper sets out to analyze the regulatory approach adopted by the European Union and chart the developing interrelations between EU bodies and national regulators. As regulation is central to the creation of a harmonized and efficient European Union (EU), functional for establishing a fair, efficient and sustainable market, i.e. the Single Market, and necessary for domestic markets that, in obedience to EU directives, have become more open and liberalized, so national regulators have come into the foreground. Over time experience has shown that an independent body with powers to coordinate and promote cooperation between different actors is required to establish a single market. However, the process of harmonizing regulations apart from being lengthy and tortuous, especially as concerns sectors deemed to have a national interest by the European Member States, is still far from being complete. Finally, the major issues and trends faced in the quest for greater regulatory efficiency have been outlined. The development of cooperation and integration in European regulation A broad survey of EU policy and rules and academic studies has been conducted to understand the principles of and identify the trends and issues in regulatory practice at the community and local level and interrelations between these different levels. Initially, the European Community promulgated binding guidelines for the purpose of harmonizing policy in the pursuit of internal cohesion and integration. The Commission issued directives that required Member States to implement specific provision into their national legislation. However, delays in adopting directives and regulatory gaps obliged the EU to adopt a “composite administration” model involving national and European administrations. Consequently, in the 1960s, the first cooperation mechanisms were introduced: Committees, administrative collegiate bodies comprising national administrative officials and a Commission’s representative. These were ancillary bodies with respect to the European Commission and the European Council and had an essentially advisory role. They are to be considered the first administrative example of cooperation. In the 1990s, the European Regulatory Agencies were introduced, which are also ancillary to the Commission. These are decentralized community bodies with a legal personality and specific powers (gathering and processing information, technical control and instruction, regulation and adjudication). They ensure integration between national administrations as well as bringing citizens closer to EU institutions by decentralizing their headquarters in the various Member States. At the same time, and in concomitance with market liberalization, the Member States established their own national regulatory authorities as a fundamental tool for supervising and governing markets that until then had been administered directly. The need for cooperation led the national regulatory authorities to gather spontaneously in networks of regulators. The first ones were the Florence Forum for the electricity market, the Madrid forum for gas and the Independent Regulator Group (IRG) for telecommunications. Initially, they were only informal forums open to all the stakeholders for exchanging information and making proposals, but later they became institutionalized bodies and as such able to ensure more efficient cooperation. Hence, the Concert of regulators emerged as a new administrative model, bodies without legal personality, composed of the directors of national regulatory authorities and a representative of the European Commission. This model was introduced first in the telecommunications market, the European Regulators Group (ERG), and later in the energy and gas market, the European Regulators Group for Electricity and Gas (ERGEG). Recently, a new and different kind of regulatory agency has developed in various market sectors.
18
Session 03 - Cognitive-based regulation for energy consumers empowerment Although similar to the preceding model, it differs by having more independence and power. Moreover, it aims at establishing stronger cooperation between national and EU administrations. In the financial market three examples of such “authorities” with supervisory functions have been set up, the European Banking Authority (EBA), the European Securities and Markets Authority (ESMA) and the European Insurance and Occupational Pensions Authority (EIOPA). In the energy and gas market, there is the Agency for the Cooperation of Energy Regulators (ACER) and in the telecommunications market, the Body of European Regulators for Electronic Communications (BEREC). Another example of new European regulator is the European Union Agency for Railways (EUAR). These new independent community bodies have different characteristics in terms of organization, powers and functions, as each is tailored to meet the needs of its specific sector. Furthermore, such differences also reflect the willingness of Member States to cede power to an independent body as also the balance of power between the EU Commission, the European Council and the European Parliament. For example, ACER is an independent agency with considerable power to pass resolutions binding upon third parties, while BEREC lacks a legal personality and can only provide advice and assistance. Issues and trends towards a more efficient regulation This survey shows that various market regulatory bodies with different levels of cooperation and integration still coexist alongside new independent regulatory authorities in the European Union. The creation of European regulatory bodies has had a strong impact on national systems by helping national regulatory authorities gain greater independence vis à vis stakeholders and political authorities so as to guarantee impartiality and neutrality in administrating sensitive sectors. The latter are autonomous administrative authorities with technical skills and actual powers on the role model of North American’s Independent Commissions. Some academics have expressed doubts as to their legitimacy as no mention of them is made in national constitutions and albeit non-elected they are endowed with executive, legislative and judiciary powers that conflict with principle of the separation of powers and the checks and balances that this principle entails. However, they are now recognized as legitimate within the framework of EU law, which is held to be sovereign with respect to national law. Similarly, the objection as to their unelected character has been overruled on the grounds of the provisions in place for their accountability, such as external judicial review, the duty to state reasons for their decisions, and procedural guarantees as stakeholders’ participation in the decision-making process via public consultation. National and European regulatory bodies are an expression of the need for market integration and regulation. In order to assure a free, competitive and open market, regulation is necessary. No market can exist without regulation, as supervision of this kind is necessary to remedy such market shortcoming as monopolies, information asymmetries, negative externalities and the inadequate provision of public goods. However, regulation itself poses many questions: proliferation and self-perpetuation of agencies, regulatory capture and regulatory burden on competition. The benefits of regulatory agencies (lightening the Commission’s burden of work, decentralization, enhancing cooperation between Member States and the EU) has led to their proliferation and an increase in their powers. But creating several agencies in many sectors to meet current needs without accurate planning has produced disorganization and fragmentation. The EU Commission has tried to accommodate agencies within a common legal framework, but only in 2012, and after repeated formal requests, did the European Commission obtain the consent of the EU Parliament and Council for the issue of a Joint Statement and Common approach on decentralized agencies. In the common approach, the EU institutions established that there should be impact assessment before setting up new agencies and objective criteria for choosing their seats. It was also laid down that the constitutive act establishing an agency must contain Sunset Clauses and a measure for closing them down. The sunset clauses were introduced to avoid self- perpetuation and set a timeline for accomplishing an agency’s mission.
19
Session 03 - Cognitive-based regulation for energy consumers empowerment Another important question is that of regulatory capture, which refers to specific interest groups being able to advance their interests under the aegis of the regulatory agency against the public interest. Some of the causes are: regulatory responsibility being limited to a single sector thereby increasing the possibility of its being influenced by the regulated subject, information asymmetry, and revolving doors. The latter refers to staff exchanges between regulators and regulated such as to influence regulative measures. The only measure able to contrast regulatory capture is independence. Regulators must be independent vis à vis stakeholders and political institutions if their neutrality and impartiality is to be guaranteed. On the other hand, the impact of regulation on competition has shown that excessive regulatory provisions, namely an extensive set of bureaucratic requirements and formalities, can stymie market competitiveness. The Organization for Economic Co-operation and Development (OECD) has introduced guidelines to analysis the impact of such regulation on competition (RIAC). RIAC complements the instrument adopted for this purpose by the OECD – the Regulation Impact Analysis (RIA), designed to analyze regulatory decisions in term of costs and benefits as a tool for improved regulation. The so-called Better Regulation concept refers to a strategy for administrative simplification, and is based on three pillars: administrative and legislative rationalization, the reduction of administrative burdens, and the regulatory impact analysis (RIA). In addition, recent developments have led to the Smart Regulation designed to further reduce the regulatory burden. Here regulation is a seen as a circular planning process (design, monitor, review) in which the initial provision undergoes revision in the light of feedback from monitoring. The participation of national authorities inside the European regulators has promoted the diffusion of the Better Regulation principle at the EU and national level. For example, the three financial supervisory authorities EBA, ESMA, EIOPA systematically perform RIA before adopting resolutions. Conclusions Although European regulators exhibit different features, they have all been created to enhance cooperation between national and European administrations in order to guarantee the uniform application of European law. EU regulation aims at integrating bodies in order to ensure horizontal and vertical cooperation and collaboration between national regulatory authorities and the European Commission. EU regulators are organizationally and financially autonomous with great powers but limited by their statutes. A composite administrative system is now in place to ensure the participation of national authorities in decision-making processes and guarantee the uniform application of law. Hence, integration and regulation will lead to a single, free and competitive market. Regulation and integration are assigned to ad hoc bodies. This is the result of organizational development and attempts to balance the different interests of EU institutions and Member States. At first such bodies were ancillary with a mere advisory function, but later they acquired greater independence and more powers. Nonetheless, this increase in power and independence level is balanced by controls and forms of accountability designed to avoid the unrestrained and autocratic use of their powers while, at the same time, ensuring that their individual remits can be performed with the required efficacy.
20
Session 04 - Global assessment of energy security, efficiency and sustainability
Elena Stolyarova, Sandrine Mathy and Silavana Mima EVALUATING THE IMPLICATION OF COP21 FOR ENERGY SECURITY AT MEMBER STATE AND EU LEVEL Elena Stolyarova, Grenoble Applied Economics Lab, CNRS 1221 rue des Résidences, 38400 Saint-Martin-d'Hères – France,
[email protected] Sandrine Mathy, Grenoble Applied Economics Lab, CNRS 1221 rue des Résidences, 38400 Saint-Martin-d'Hères – France
Silavana Mima, Grenoble Applied Economics Lab, CNRS 1221 rue des Résidences, 38400 Saint-Martin-d'Hères – France
Overview It is widely accepted that the implementation of climate policies through energy efficiency measures and increased use of renewable sources in energy mix would enhance energy security. However, some induced effects have to be considered when talking about impacts of climate policies on energy security. The objective of this study is to analyze the energy security in global and EU transition prospective scenarios using POLES model and integrating COP21 objectives. We also propose a further analysis of energy security issues with respect to two elements of crucial importance in the European context: role of gas in European energy mix and the impact on grid stability of the high share of intermittent renewable. Method At the first step, we develop a literature review of the most important energy security concepts and the most pertinent indicators to apply to the prospective scenarios. Secondly, national NDC and 2°C/1.5°C scenarios is used to calibrate the POLES global energy system model, which implements global energy system NDC and 2°C/1.5° scenarios. These scenarios will provide global and harmonized boundary conditions in terms of global energy markets, technology costs and investment costs, and fuel imports and exports, but still reflect the specificities of national transition pathways. As a final step the POLES scenarios will be analyzed in terms of the indicators developed, both at the EU level, and the national level for major EU and non-EU emitters. Intermediary results As there is no common definition of energy security (Ang et al., 2015; Cherp & Jewell, 2014; Gupta, 2008; Sovacool & Mukherjee, 2011), we suggest representing the energy security through multidimensional form. The energy should be Available for domestic uses, Affordable for households and companies, Sustainable to preserve our future, Resilient to better handle the risks, Reliable to better integration of I-RES and should support country's Economic Development. Several indicators, around 25 in total, describe each dimension. Due to the high number of indicators and studied countries, we create a composite energy security index following three steps: normalization of each indicators, calculation of weights and aggregation to composite index (JRC European Commission, 2008). The results show that climate policy has in general positive impact on availability of energy sources and affordability dimensions, as well as on sustainable dimension (by definition). A few indicators deteriorate, for example the per capita energy expenditure in dwellings. Our next step is to evaluate three other dimensions, especially grid reliability dimension.
21
Session 03 - Cognitive-based regulation for energy consumers empowerment
Table 1 : Energy independency ratio In European Union
2000 2020 2030 2040 2050 Coal, lignite
BL 44% 28% 24% 27% 23%
1.5°C 44% 28% 27% 10% 9% Oil
BL 28% 14% 13% 12% 14%
1.5°C 28% 14% 14% 10% 13% Natural Gas
BL 55% 30% 22% 17% 13%
1.5°C 55% 30% 22% 23% 23% Total
BL 52% 46% 47% 49% 47%
1.5°C 52% 46% 51% 64% 74%
Conclusions In this study we investigate the potential impact of COP21 commitments on European energy security. We propose multidimensional definition of energy security, that takes into account not only availability of energy supply and its affordability, but also environmental impacts, risks, electricity stability and economic development. The level of energy security in EU Countries is measured by around 25 indicators using prospective scenarios (2000-2050) from POLES model. The results show that an ambitious climate policy scenarios improve the availability of energy sources, affordability and sustainability. References Ang, B.W., Choong, W.L., Ng, T.S., 2015a. Energy security: Definitions, dimensions and indexes. Renewable and
Sustainable Energy Reviews 42, 1077–1093. doi:10.1016/j.rser.2014.10.064 Cherp, A., Jewell, J., 2014. The concept of energy security: Beyond the four As. Energy Policy 75, 415–421.
doi:10.1016/j.enpol.2014.09.005 Criqui, P., Mima, S., 2012. European climate—energy security nexus: A model based scenario analysis. Energy
Policy, Modeling Transport (Energy) Demand and Policies 41, 827–842. doi:10.1016/j.enpol.2011.11.061 Gupta, E., 2008. Oil vulnerability index of oil-importing countries. Energy Policy 36, 1195–1211.
doi:10.1016/j.enpol.2007.11.011 JRC European Commission, OECD (Eds.), 2008. Handbook on constructing composite indicators: methodology
and user guide. OECD, Paris. Sovacool, B.K., Mukherjee, I., 2011. Conceptualizing and measuring energy security: A synthesized approach.
Energy 36, 5343–5355. doi:10.1016/j.energy.2011.06.043
22
Session 04 - Global assessment of energy security, efficiency and sustainability
Georgia Makridou, Michael Doumpos, Kostas Andriosopoulos and Emilios Galariotis THE IMPACT OF THE EU EMISSION TRADING SCHEME (EU ETS) ON FIRMS’ PERFORMANCE AND ENERGY EFFICIENCY
Georgia Makridou, ESCP Europe Business School, e-mail: [email protected] Michael Doumpos, Technical University of Crete, e-mail: [email protected]
Kostas Andriosopoulos, ESCP Europe Business School, e-mail: [email protected] Emilios Galariotis, Audencia Business School, e-mail: [email protected]
Overview The European Union Emission Trading Scheme (EU ETS) is the cornerstone of the European Union's policy to combat climate change and its key tool for reducing industrial greenhouse gas emissions (GHG) cost-effectively. The EU ETS relies on the principle of “cap-and-trade”, whereby participants in the market are mandated to hold allowances corresponding to the amount of CO2 they release into the atmosphere. The overall amount of EU Allowances (EUA) is capped and progressively reduced. Participants can choose either to implement emission reduction measures or to buy EUAs from other players that have it in excess. In allowing companies to buy international credits, the EU ETS also acts as a major driver of investment in clean technologies and low-carbon solutions, particularly in developing countries. The introduction of mandatory controls and a trading scheme covering approximately half of all carbon dioxide emissions across Europe has triggered a debate about the impact of emissions trading on the performance of firm and specifically their competitiveness and energy efficiency performance. In fact, a body of studies has been conducted on the carbon trading market, covering issues related to the operation of the EU ETS, the design of the allowance allocation scheme, and its effectiveness at the country or sectoral level. This paper aims to contribute to the literature by measuring the impact of the EU ETS on the performance of firms in a wide EU context and by comparing the impacts from each of the three operational phases of the EU ETS. Furthermore, the interactions between improvements in energy efficiency and GHG emissions reductions achieved by the implementation of the EU ETS will be analyzed aiming to provide recommendations about how the functioning of the EU ETS could be improved. To this end, and for analyzing the effectiveness of the scheme, panel data on the emissions and performance of a large sample of EU firms covered by the scheme since 2005. The financial crisis that hit in 2008 is also taken into account in the proposed project. Methods Our dataset consists of a panel of European firms under EU ETS. The firms are classified in 25 EU countries and eight main industrial sectors based on the two digit NACE Rev.2 code. The analysis covers the period 2006–2014. Based on the literature, the economic variables used in the analysis include the current ratio (CR), the solvency ratio (SR), the EBIT divided by total assets (EBITTA), the logarithm of the total assets (SZ), the number of employees to total assets (NETTA) and the operating revenue to total assets (ORTTA). The environmental performance of the firms is examined using the allocation factor (AF) and the quotient of verified emissions to the sales (VETS). The economic data is obtained from the ORBIS whereas the environmental data comes from the European Union Transaction Log (EUTL). In the analysis, we considered four different settings for the variables used for the regression analysis, thus leading to four models. The first model uses only the economic variables that characterize the EU firms. In the other models, environmental variables are also added in the analysis. Results According to the regression analysis results, economic and environmental characteristics contribute to the profitability of firms under EU ETS. Specifically, it is mainly affected by the solvency ratio, employment, operating revenue to total assets as well as by the verified emissions to sales and the number of free allocation of emissions allocated to the verified emissions.
23
Session 04 - Global assessment of energy security, efficiency and sustainability
Conclusions The research output is expected to be helpful not only to other academics but also to government agencies and stakeholders that are involved in the negotiation of the EU ETS future phases design and in its implementation. By assessing the impact of the European carbon market on energy efficiency and competitiveness, this research has a strong influence on the political acceptability of future carbon markets. The results will encompass the extent of cost pass-through to customers, changes in output, changes in energy market share, and changes in firm profits. The firms that take part in the EU ETS as well as the public at large will also benefit from this research as the knowledge of the effects of the trading scheme on many aspects of society (economy, energy security, competitiveness, environment) is crucial for their performance and behavior.
24
Session 04 - Global assessment of energy security, efficiency and sustainability
Gianluca Carrino CARBON TAX, EU ETS VERSUS CHARGE ON EMISSIONS
Gianluca Carrino: Lumsa University, [email protected] Overview With the industrial revolutions the environment was considered as a container of useful resources ready to be used for economic purposes. As a consequence of the large-scale use of coal, oil and gas the level of CO2 started to increase steadily. If the emissions will keep on increasing at this rate, within the year 2100 the world will have to face a rise in the temperatures estimated between 2 and 4,8 degrees. The consequences of the global warming are interconnected and are such as the melting of the Permafrost, the loss of snow and ice, the increase of the sea level and Ocean acidification, the extreme climatic phenomena, deforestation, desertification and salinization. Each of these consequences has a strong impact on society, creating the conditions for forced migration, economic losses and biodiversity loss. For this reasons emissions are considered as negative externalities. Moreover, they influence directly the welfare of the community causing the biggest failure of the market. In order to fight Global warming Countries have to cooperate to limit and eliminate the emissions in a global way. Method In brief, to address climate change the Countries of the United Nation Framework Convention on Climate Change (UNFCCC) adopted on December 12th, 2015 the Paris Agreement. During the COP-21 held in Paris, Countries established to: reduce emissions, thus keeping the temperature below 2°, learn how to cohabit with the attended climate variations, and to support developing Countries’ efforts to reach sustainable growth. The international tools and strategies adopted to reduce emissions are: The European Emission Trading Scheme or Cap-and-Trade, The Carbon tax and Charge on emission. Results The Cap-and-Trade, though it establishes a maximum Cap tolerated by the society, it is inefficient for the excess of the allocation allowances, the price volatility and the energy price inflation. The Carbon Tax can be structured to avoid all those problems while providing a more reliable market incentive to produce clean-energy technology. Nevertheless, in the Carbon Tax there is no provision for input tax credit, which means that the final consumer may pay a fee on an input that has already been taxed previously (Cascading effect). The Charge on Emissions consists in imposing a value addition at every single phase, and can be the proper solution to resolve the cascading effect. In this way, the final consumers will face only the cost of the value added tax, which will vary depending on the emissions produced for manufacture the product. Even if the tools used to decrease emissions have been substantial in the last decade, until now, any of them has succeeded in modifying in depth the behaviours of the industries. Conclusions The current carbon prices are insufficient to induce a consistent decrease of the temperatures. The 85% of global emissions are not priced, and three quarters of the priced emissions are covered by a carbon price lower than US$10/tCO2.
25
Session 04 - Global assessment of energy security, efficiency and sustainability
To achieve the Paris Agreement’s goal the countries may pay at least US$40–80/t CO2 by 2020 and US$50–100/tCO2 by 2030, implementing and mixing different carbon policies simultaneously with the right price. The target should be common and global in order to prevent firms’ migration to countries that lack any environmental regulation.
References European Commission, EU ETS Handbook, 2015 Bates A., The Paris Agreement, Ecovillage, 2015 Fifth Assesment Report, IPCC, 27 September 2013 Financial Time, A carbon border tax is the best answer on climate change, 2017 Gerbeti A., A symphony for energy, Editoriale Delfino, Milano, 2015 Mastrojeni G., Pasini A., Effetto serra effetto Guerra, Chiarelettere editore, Milan, 2017 Mastrojeni G., L’arca di Noè, Chiarelettere editore, Milano, 2014 Report of the High-Level Commission on Carbon Prices, May 2017 United Nations, UNFCCC, Article 1, 1992
26
Session 05 - The gas market new perspectives
Alec Waterworth and Michael J. Bradshaw THE CURRENT AND FUTURE ROLE OF NATURAL GAS IN CHINA
Alec Waterworth: Research Fellow at Warwick Business School, Scarman Road, Coventry, CV4 7AL, United Kingdom [email protected]
Michael J. Bradshaw: Professor of Global Energy at Warwick Business School, Scarman Road, Coventry, CV4 7AL, United Kingdom [email protected]
Overview One of the biggest uncertainties in gas markets today is what will happen to natural gas consumption in China. The last decade has seen the steady substitution of coal with gas in the country’s energy mix. However, to date, China remains the world’s largest consumer and producer of coal. Nevertheless, the Chinese government has clearly stated its desire for this trend of gas-for- coal substitution to continue. Industry experts expect China’s natural gas consumption to double from 2015 levels by 2020 (IEA 2015, BP 2016). Method An in-depth case study analysis is undertaken, drawn from documentary research and semi- structured interviews conducted in June/July 2017. The case examines four factors that will shape the future of natural gas in China: the level of gas demand required by national energy policy; the level of domestic production (both conventional and unconventional); the level of pipeline imports secured; and the level of LNG imports required to balance supply and demand. The paper addresses each of these elements in turn and then considers the possible consequences for the global gas market, with a particular emphasis on LNG demand. Results Years of rapid growth in consumption occurred between 2003 and 2014 (termed by some the ‘golden age of gas’; Raval 2016), during which time consumption grew more than five-fold. However, this growth is now slowing, and the increase in demand in 2015 over 2014 levels of 4.7% (BP 2017) was the lowest since the late-1990s. Demand is likely to remain moderate in the next decade (Li 2015). Nevertheless, a gas-for-coal substitution is ongoing, driven by a significant governmental policy shift (including pricing reforms), and is complemented by an increasing environmental awareness amongst the country’s population in the face of hazardous air pollution. The 13th Five-Year Plan outlines the need to increase production of, and encourage private investment in, natural gas through liberalisation of extraction rights and reducing governmental intervention (including pricing mechanisms). However, governmental intervention remains a major constraint to domestic production in China, as demonstrated by the trend of international oil companies relinquishing previously-acquired Chinese exploration areas (Guo and Paton, 2016). Falling rates of subsidisation similarly dissuade private investment. Industry observers have called on policymakers to increase incentives for private investment if high-growth in the natural gas sector is still an aim of the government (Ratner et al., 2016). Beyond the investment environment in China, many private companies are reticent to commit to Chinese gas whilst concerns around geological complexity, access to water, pipeline and land access, limited infrastructure and a lack of technical expertise remain (Liu et al., 2015; Clemente, 2016). Under the currently low oil price - and the prospect of the price remaining ‘lower-for-longer’ - the inflated cost of drilling in China (which remains four-to-five times higher than in the United States; Ratner et al., 2016) is undoubtedly also challenging the economic viability of Chinese gas prospects and slowing development. After years of uncertainty over the security of pipeline volumes from Central Asia, two major gas deals were signed between Russia and China in 2014. In addition to the enhanced energy security the deal offers, Skalamera (2014) argues that the agreement also: (i) aids the country in addressing the projected gas shortage stemming from the ambitious gas-for-coal substitution plans; and (ii) offers assurances of supply in the case that the Chinese domestic gas revolution fails to materialise.
27
Session 05 - The gas market new perspectives With regards to LNG, China has invested heavily in LNG capacity over the last decade, and looks set to continue to do so. The growing size of China’s LNG import capacity places it in a strong position to benefit from a potential supply glut beyond 2020 stemming from major export projects in Australia, the United States and East Africa coming online. Conclusions Pricing has proven a valuable tool for stimulating demand, although this does have the disadvantage of discouraging domestic production. With regards to imports, major exporting projects are coming online towards the end of the decade, and Asia will be a key market for these cargoes. China will face growing competition for LNG volumes from newly-emerging Asia importers, as well as Japan post-Fukushima, where delays and uncertainty around nuclear power persist (Chen, 2014). This thus underlines the significance of the deal with Russia; not only to security of supply but also the leverage it offers China as it nears renewal of long-term LNG contracts. Finally, the recent improvement of trade relations with the United States under a Trump presidency - at a time when the latter is significantly increasing its export volumes - similarly enhances China’s negotiation leverage within the global market. Bibliography BP (2016). BP Statistical Review of World Energy 2015. London, BP. BP (2017). BP Statistical Review of World
Energy 2016. London, BP. IEA (2015). Medium-Term Gas Market Report 2015. Paris, IEA. Li, X. (2015). Natural gas in China: a regional analysis. Oxford, Oxford Institute for Energy Studies (OIES). National Bureau of Statistics. (2016). "China Statistical Yearbook." Retrieved 9th February, 2017, from
http://www.stats.gov.cn/tjsj/ndsj/2016/indexeh.htm. Raval, A. (2016). "Slowing China demand stalls ‘golden age of gas’." Retrieved 10th February, 2017, from
https://www.ft.com/content/fe83a638-2c8f-11e6-bf8d-26294ad519fc. Seligsohn, D. and A. Hsu. (2016). "How China’s 13th Five-Year Plan Addresses Energy and the Environment."
Retrieved 14th February, 2017, from http://www.chinafile.com/reporting-opinion/ environment/how-chinas-13th-five-year-plan-addresses-energy-and-environment.
State Council (2014). Energy Development Strategy Action Plan. Beijing, State Council.
28
Session 05 - The gas market new perspectives
Chi Kong Chyong THE ECONOMICS OF GAZPROM’S GAS EXPORT STRATEGIES TO EUROPE
Chi Kong Chyong, EPRG, University of Cambridge, e-mail: [email protected]
Overview In April 2015, the European Commission Directorate-General for Competition (DG COMP) began a formal investigation into Gazprom’s suspected violations of EU antitrust rules by issuing its statement of objections . In the statement, the Commission was concerned that Gazprom was impeding competition in the gas supply markets of Central and Eastern European Member States (MS) – Bulgaria, the Czech Republic, Estonia, Hungary, Latvia, Lithuania, Poland and Slovakia – by implementing abusive strategies, in particular: (a) by imposing territorial restrictions in its sales agreement with its clients in the above countries; (b) by pursuing unfair pricing policy in five MS - Bulgaria, Estonia, Latvia, Lithuania and Poland (from now on five MS); and (c) by obtaining unrelated commitments from its contractual counterparties concerning gas transport infrastructure (in Poland – Yamal-Europe gas pipeline and in Bulgaria – South Stream gas pipeline). On the 13th of March 2017, DG COMP published Gazprom’s proposed commitments to address the Commission’s competition concerns as regards gas markets in Central and Eastern Europe. In particular, Gazprom has proposed: in relation to Point (a), to remove all clauses that would hinder re-sale of its gas to other customers once and for all, and to facilitate cross-border gas trade in Central and Eastern European gas markets by allowing Gazprom’s customers in those countries to change delivery points; in relation to (b), (i) to introduce competitive gas price benchmarks into price review clauses contained in its long-term gas sales contracts with customers from Bulgaria, Estonia, Latvia, Lithuania and Poland, and (ii) to increase the frequency and speed of price revisions; and finally in relation to Point (c), Gazprom committed to not claim damages from Bulgaria regarding the cancellation of the South Stream pipeline. The research objective of this paper is to analyse the economic and political implications of these commitments on Europena gas markets. In particular, we are interested in: 1. If, and, under what circumstances the possibility of changing delivery points (from now on ‘swap deals’) of Russian gas within the markets of Central and Eastern Europe would improve the welfare and market efficiency of the five MS; 2. Defining the product and geographic market definition of the proposed swap deals. The former (product definition) deals with the question of an alternative means of constraining the potential market power of Gazprom in the five MS and hence a competitive assessment of the swap deals that Gazprom proposed vis-à-vis gas diversification infrastructure in the five MS. The latter (geographic definition) deals with the question of the possible impact of swap deals on the wholesale prices of other markets and how geographically ‘wide’ those impacts would be. This is important, as any changes to the service charges for swap deals could move market prices beyond those markets directly affected by swap deals.
Methodology and preliminary results To pursue these two objectives, and in order to quantify and measure the potential impact of these commitments, we use a global gas market simulation model – a large-scale computational model that simulates gas market operations based on economic fundamentals.
29
Session 05 - The gas market new perspectives The model allows us to run numerous ‘controlled’ experiments or ‘what-if’ type of analyses. These various ‘what-if’ analyses that we conducted using the global gas market model are quite similar to the withholding analysis1 or SSNIP test conducted as part of competition and merger investigations (Joskow and Kahn, 20022; Patton et al., 20023; CMA, 20154). One should note that the usage of market simulation models for energy market competition assessments have been used before – see e.g. Chauve and Godfried (20075), Wolak (20116).
The structure of this analysis is as follows. First, using the gas market model, we establish a competitive benchmark where all gas supplies into Europe and other market regions are priced according to their short-run marginal costs (Scenario A in Table 1). Then, we conduct a withholding analysis to test if Gazprom’s hypothetically monopolistic behavior in the five MS (Scenario B1) would increase its profit relative to its profit under the established competitive benchmark case (compare Scenario B1 with Scenario A). Next, we examine if the proposed remedies – Gazprom’s swap deals – would limit and constrain its market power in those five MS. We do so by comparing the expected prices of the five MS for Scenarios B2, B1 and A. Finally, we conduct various sensitivities analyses, particularly focusing on the impact of swap deals on gas diversification infrastructure in the five MS and the benefits of facilitating interconnection agreements between some of these MS as an alternative solution to the perceived problem of the market power of dominant suppliers in the Central and Eastern European markets.
The entire analysis is focused on the time period 2020 until mid-2021 using daily resolution, that is, reported results from the model that roughly correspond to day-ahead wholesale markets in years 2020-2021. The reason for focusing on the years 2020-2021 is that a number of important gas infrastructures in Europe will likely be available by that time period (such as Gas Interconnection Poland–Lithuania, possible expansion of capacities of Świnoujście and Klaipėda LNG terminals, TAP and IGB interconnectors etc.) which may be impacted by the proposed swap deals. Furthermore, it is expected that in that period international LNG export capacities (from the US and Australia, in particular) will ramp up dramatically and hence may constrain any hypothetical market power exerted by Gazprom resulting from its dominant position in the supply markets of those five MS.
1 The withholding analysis is a flipside of the SSNIP (Small but Significant and Non-transitory Increase in the Price) test which seeks to define the smallest relevant market for which a firm hypothetical monopolist could profitably impose a hypothetical small (typically in the range of 5-10%), permanent price increase (see European Commission’s notice on the definition of the relevant market for the purposes of Community competition law. Published in the Official Journal: OJ C 372 on 9/12/1997.) 2 Joskow, P. and E. Kahn, (2002), “A Quantitative Analysis of Pricing Behavior in California’s Wholesale Electricity Market During Summer 2000,” The Energy Journal, Vol. 23, No. 4 3 Patton, D., Sinclair, R., and Lee Van Schaick, P. (2002). “Competitive Assessment of the Energy Market in New England”, a report prepared by Potomac Economics, Independent Market Advisor to ISO New England. Available at: http://www.ferc.gov/CalendarFiles/20030912171352-A-3_2b_NE_CompetitiveAssessment.pdf 4 Competition & Markets Authority (CMA) (2015). “Energy market investigation. Updated issues statement”, consultative document issued during the course of the investigation. Available at: https://www.gov.uk/government/uploads/system/uploads/attachment_data/file/404867/Updated_Issues_Statement.pdf 5 Chauve, Philippe, and Godfried, Martin (2007). ‘Modelling competitive electricity markets: are consumers paying for lack of competition?’. Competition policy newsletter 2007-2, Opinions and Comments. Available at: http://ec.europa.eu/competition/publications/cpn/2007_2_18.pdf . In this publication the authors described a simulation model (quite similar to the one used in this research) that was used as part of DG COMP’s inquiry into competition in gas and electricity markets in 2005. 6 A Price Effects Analysis of the Proposed Exelon and Constellation Merger, by Frank A. Wolak, revised October 11 , 2011. Available at: http://webapp.psc.state.md.us/Intranet/maillog/content.cfm?filepath=C:%5CCasenum%5CAdmin%20Filings%5C110000-159999%5C134689%5CErrataWolakEx.FW-2.pdf
30
Session 05 - The gas market new perspectives In addition, if the commitments are adopted, it will likely take time for all existing and new contracts between Gazprom and buyers from these five MS to adopt changes including those related to pricing mechanisms. This may include further negotiations as well as time for market participants to ‘test’ the ideas of swap deals, therefore a complete and full implementation of the commitments will be close to the 2020 time period anyway. It would also be easy to carry out a similar study for other periods either before and/or after the 2020. Thus, we have provided an extensive analytical work to examine the impact of Gazprom’s proposed commitments to improve the gas market conditions in Central and Eastern European markets. The results of this research show that: 1. In principle, Gazprom’s proposed commitments and, in particular, possibilities for buyers of its gas from Central Europe (Slovakia, Poland, and Hungary) to change delivery points to new locations (Lithuania and Bulgaria) may substantially limit Gazprom’s potential market power in these markets. They allow price convergence of Russian gas in the region and offer a rather efficient way to connect these markets to more liquid markets in North Western Europe. 2. The option of having these swap deals and hence potential market entry by other suppliers into the Baltic markets and Bulgaria may (positively) affect price negotiations and arbitration (if needed) between existing buyers in the Baltics and in Bulgaria with Gazprom. The option presents an opportunity to trigger price review clauses because markets further downstream are now fundamentally changed, the legacy contracts may be ‘out of the money’, and arbitration may result in price reviews in favor of more competitive prices for Bulgaria and the Baltic states. However, arbitration is expensive and time consuming, and asymmetry exists in favor of Gazprom, which is large compared to small importers in the Baltics and Bulgaria. 3. For these positive effects stemming from these possible swap deals to take place, there may be a need to request gas release programs further downstream in the Baltic and Bulgarian markets because if gas users are tied to some long-term purchase agreements with existing importers, then new suppliers from Central Europe that would be willing to change delivery points and enter these captive markets would not be able to do so. 4. One should acknowledge that this ‘virtual’ link between these markets and other more competitive markets rely on Gazprom and its service charges. One must determine further sensitivities regarding different levels of service charges and how they may change the results presented here. It is also not clear from the proposed commitments what factors affect those service charges – are they dependent on how the upstream transmission system in Russia works? Are they dependent on transit fees to be paid by Gazprom to other parties along the way to Slovakia, Bulgaria, and Lithuania? Understanding the methodology of calculating these service charges would be helpful in this respect. 5. Regarding companies from Slovakia, Poland, and Hungary that could now enter the gas markets of the Baltic states and Bulgaria, legitimate questions arise. First, since Gazprom has long-term gas contracts with buyers from these five MS, would the company be willing to cancel or substantially reduce minimum take-or-pay volumes to allow swap volumes to take up market share in Poland, Lithuania, and Bulgaria? If not, then, what are the mechanisms that would allow the proposed swaps to take place and hence constrain Gazprom’s potential market power? 6. Although the ability to change delivery points may have a positive impact on market efficiency, it also poses a number of policy challenges, namely, gas diversification and energy security for the five MS. The swap operations seem to increase the market share of Russian gas in Lithuania and Poland, while the other markets see no improvement in diversification. However, swap deals may in fact decrease Gazprom’s market share at expenses of its other buyers entering the markets of the Baltic
31
Session 05 - The gas market new perspectives states and Bulgaria. This is ‘contractual’ diversification rather than physical because swap volumes are still Russian gas. 7. Further, the swap deals could (negatively) impact the utilization of strategic gas infrastructure assets such as the Poland-Lithuania gas interconnector (GILP), the Klaipeda and Świnoujście LNG terminal, the Greece- Bulgaria interconnector, and more generally, Bulgaria’s gas contract with Azerbaijan. 8. Finally, the swap deal may have ‘unintended’ consequences in terms of disintegrating the Baltic markets and Bulgaria from the rest of the markets in Europe. In particular, it was shown that Klaipeda LNG terminal usage is roughly nil when swap deals are allowed. This means an increasing cost of using the gas system in the Baltics and Bulgaria (IGB faces a fate similar to that of Klaipeda LNG) because of the adopted regulatory model in Europe whereby all gas assets are socialized. The cost of cross-border trading between these small markets and the rest of Europe would then be hampered by these additional costs. 9. Thus, the only positive factor among the proposed commitments is the certainty of the competitive prices of Russian gas, which will be priced against NWE competitive benchmarks, and the socialized cost of gas systems (which would then include all strategic assets deployed against Gazprom’s monopoly power). It is a vicious circle in the sense that these projects were publically financed for security reasons and would be used should Gazprom exercise its market power in these countries. Now that Gazprom has proposed changes to its contractual and sales practice to ensure competitive markets and prices in these five MS, these assets, if built, will not be utilized, and the costs should be allocated to all users of their gas systems. 10. In light of declining gas demand relative to the size of the gas systems and the different competitive landscape across European markets , the results reveal fundamental challenges for the current regulatory model in Europe to complete the project of a single market for gas. DG COMP should launch a comprehensive study on the impact and the suitability of the current regulatory regime in supporting and further facilitating competition in and across European gas markets.
32
Session 05 - The gas market new perspectives
Sebastian Kreuz PRICING CHARACTERISTICS IN THE GERMAN DIESEL RETAIL MARKET AFTER THE INTRODUCTION OF THE MARKET TRANSPARENCY SCHEME
Sebastian Kreuz, Brandenburg Technical University Cottbus-Senftenberg, email: [email protected]
Overview Cointegration relationship and asymmetric cost pass-through between crude oil and retail fuel prices (“Rockets and Feathers”) has been analyzed for a wide range of countries and periods. Nowadays, fuel pricing data is more widely available in many countries. One main reason for the increase in high-quality data is that private websites publish retail prices which customers can update with their smart phones when refueling. A second reason for improved data quality is that petrol stations are sometimes required to notify government agencies of price changes. In 2013, the German government established the market transparency unit for fuel within the Federal Cartel Office (FCO). The FCO collects real-time data related to gasoline price changes for all petrol stations, making the available pricing data more comprehensive. My work focuses on cointegration and price asymmetries, which means faster diesel price changes after oil price increases compared to decreases (“Rockets and Feathers”) for the German retail diesel market. I will test for long-term cointegration relationships, and pricing asymmetries by optimizing error correction models for brands, non-brands and regions with higher and lower population densities for recent German data. Methods Improved from earlier work (e.g. Kreuz, Müsgens, 2016), I use station-specific data instead of aggregated data for a specific market or characteristic. Therefore, my data contains diesel prices for about 7,000 retail stations in Germany (about 50 % of all stations in Germany) for the period from June 2014 to May 2016. Included in my data set is each price change of each of these retail stations. Out of these, I calculate daily station-specific averages for further analysis. I use optimized OLS regressions for the establishment and test of cointegration relationships (approach of Engle and Granger for the test of cointegration) for each station. Following, I establish with the help of the OLS an optimized asymmetric error correction model (ECM) for each retail station in my dataset. Lag selection will be decided by BIC. By the established ECM models, I can test for asymmetric pricing patterns in the German retail diesel market. Results First, each stations diesel price series, as well as the crude oil price series, are stationary in its first differences and non-stationary in levels. Second, my results show that a clear majority of stations (between 70 % and 90 % depending on significance levels) do have long-term cointegration relationships between fuel and crude oil prices. Cointegration levels seem not to be related to brands, with equal distribution for these characteristics. Third, results show that about one out of six stations demonstrate pricing asymmetries like the “Rockets and Feathers” phenomenon, with faster reactions of diesel prices to oil price increases than decreases. Results show higher than average shares of those pricing asymmetries for brand stations (e.g. Aral, Shell, Esso and Total). In addition, higher shares of the “Rockets and Feathers”-phenomenon can also be seen in regions with lower population densities and therefore potentially lower competition intensities. Conclusion Disaggregated data can give a far more detailed view for markets than aggregated data. Therefore, station- specific data can give an improved look into pricing strategies of certain retail fuel stations. Enhanced from earlier work with more aggregated data, the given analysis shows that a vast majority of stations in the dataset are cointegrated to the crude oil price development.
33
Session 05 - The gas market new perspectives Less than 20 % of all given stations show pricing asymmetries (“Rockets and Feathers”). Using that kind of disaggregated dataset, further research can focus on very specific questions regarding pricing strategies of certain regional markets, brands and station attributes. References Kreuz, S., Müsgens, F. (2016): “Asymmetries in the German Diesel Retail Market”, IEEE Conference
Proceedings, 13th International Conference on the European Energy Market (EEM), Porto, Portugal.
34
Session 05 - The gas market new perspectives Claudio Pregagnoli, Raffaele Troise, Claudio Dicembrino and Michele Frate FORECASTING MODELS FOR SHORT AND LONG TERM GAS PRICE
Claudio Pregagnoli, Macroeconomic Energy Analysis and Forecasting (MEAF), ENEL S.p.A., e-mail: [email protected]
Raffaele Troise, Macroeconomic Energy Analysis and Forecasting (MEAF), ENEL S.p.A. e-mail: [email protected]
Claudio Dicembrino, Macroeconomic Energy Analysis and Forecasting (MEAF), ENEL S.p.A. Michele Frate, Macroeconomic Energy Analysis and Forecasting (MEAF), ENEL S.p.A.
Overview The paper aims to provide both short and long-term innovative forecasting models for the North America (Henry Hub) and Europe (NBP) gas markets. To this purpose, for the long term forecasting model, we consider yearly data within the period comprised between 2000 and 2016 composing a dataset of almost 15 yearly observations for each variable (oil prices, exchange rates and carbon prices). About the short-term forecasting model, we take in consideration a historical dataset of the gas spot prices starting from 2001 to 2016 together with the related forward curves with a maturity up to 36 months. Methods The development of the above models has been based on two different methodology approaches: the multivariate statistics and the machine learning algorithms theory. The use of these methods is analyses with respect to the main features of the HH and NBP forecasts: i) the demand/supply market equilibrium in the definition of the gas prices; ii) the gas price dependence on exogenous variables (e.g. oil price, exchange rates…); iii) the autoregressive component in the case of the short-term prevision. Within this context, several models have been developed, such as VAR, multiple linear regressions for the statistical approach, the Generalized Additive Models (GAM), Gradient Boosting Models (GBM), and Neural Network for the machine learning approach. Results Among the aforementioned models, the lower forecasting error (measured through the MAPE index) has been obtained by the following models: 1. Henry Hub long-term: GBM model with 1.7% MAPE, 2. NBP long-term: Neural Network model with 2.8% MAPE, 3. Henry Hub short-term: VAR model with 2.4% MAPE, 4. NBP short-term: VAR model with 4.2% MAPE. This result demonstrates the necessity to consider a wider class of models in addition to those of the classical statistical econometrics, namely the machine learning algorithms as a result of the increasing complexity characterizing the variables relationship. Conclusions Considering the unstable and trend-changing path of gas prices on both sides of the ocean, we believe that developing an effective tool able to reduce the forecasting error is key to build up a resilient and reliable energy market. We are confident that the findings showed in this paper represent a valid attempt both to extend the knowledge about the short-term business implications of gas prices, and to produce useful insights for industrial strategic planning operations, energy government policies and further academia research.
35
Session 06 - Energy efficiency in buildings and industry
Carlo Andrea Bollino, Simona Bigerna, Maria Chiara D’Errico and Paolo Polinori ENVIRONMENTAL AND ENERGY EFFICIENCY ANALYSIS OF EU ELECTRICITY INDUSTRY: AN ALMOST SPATIAL TWO STAGES DEA APPROACH
Corresponding author: Paolo Polinori, Department of Economics, University of Perugia, via A. Pascoli, 20, 60123, Perugia, Italy, [email protected]
Simona Bigerna, Department of Economics, University of Perugia, via A. Pascoli, 20, 60123, Perugia, Italy, [email protected]
Carlo Andrea Bollino, Department of Economics, University of Perugia, via A. Pascoli, 20, 60123, Perugia, Italy, e-mail: [email protected]
Maria Chiara D’Errico, Department of Economics, University of Perugia, via A. Pascoli, 20, 60123, Perugia, Italy, [email protected]
Overview Environmental and energy efficiency (EEE) in production, transformation and consumption allows to reach European Union (EU) greenhouse gas reduction target faster (EEA, 2016). EEE is a crucial key in the transformation sector to make carbon free power generation. Internal and external factors are changing the traditionally largely asset-based industry moving to a new and more complex decentralized generation system. Internal factors refer to technological changes (Jamasb and Pollitt, 2008) and to the fuel energy mix that deeply changed in EU countries also due to the widened spread of renewable energy sources (RES) (Krozer, 2013). External factors involve policy and regulatory interventions (Knittel, 2002), changes in consumers’ preferences (Stigka et al., 2014) and environmental attitude (Bigerna et al, 2016). This paper intends to contribute to the literature developing a framework to measure the technical EEE of EU electricity industries taking into account: i) both non-separable “good” and “bad” outputs; ii) both “discretionary” and “non-discretionary” inputs; iii) spatial component in technical inefficiency explanation. Methods Using data from 2006 to 2013 for 19 major EU countries a two-steps procedure is used. According with recent literature (Apergis et al., 2015; Liu and Wu, 2015) in the first step we apply a non-parametric method such as Data Envelopment Analysis to estimate the total factor productivity of electricity sector. We derive the Malmquist Luenberger productivity index (ML) using three input (installed capacity, labor and fuels) and two output (electricity and Greenhouse Gas Emission); this directional efficiency measure allows for including into the model the undesirable output resulting into a decrease in efficiency as its level increases (takes into account the decrease in efficiency caused by the increase of the undesirable output such as GGE). This measure is then decomposed into the efficiency change (MLTEC, representing the catch up effect) and the technological change (MLTC, representing the frontier shift effect). In the second steps we adopt an econometric model to investigate the spatial effects and the dynamic effects of environmental regulation on the ML index thougth as dependent variable. Dynamic Panel data specification allows to control the serial correlation of the Malmquist index. We regress MLTEC and MLTC on their lagged value, the contiguity matrix and variables referring to both the overall OECD regulation and the EU environmental regulation using the Arellano Bond Estimation method. The starting point is as follows: yi,t = αyi,t-1 + δ∑jwi,jyj,t + + β1MktRi,t + β 2EnvRi,t + ∑mγmXm,i,t + ηi + θt + εi,t where: y MLTEC and MLTC index t 2006 – 2013; i = 1, …, 19 countries; j = refers to all other countries that could influence i; W contiguity matrix; MktR overall OECD regulatory indicator for the electricity sector [SM]
36
Session 06 - Energy efficiency in buildings and industry EnvR based on overall EU regulatory indicator for the electricity sector [SE] X set of control variables proxy the country’s technology (chp) the fuel mix (pcaFUEMIX) and the research and development expenditure intensity (rdd). η the country level unobserved effect θ are the dummies e idiosyncratic error 1) The correlation of time invariant fixed effects ηi is removed using the first difference GMM estimation. Δyi,t = αDyi,t-1 + δ∑jwi,jΔyj,t + β 1ΔMktRi,t + β 2ΔEnvRi,t + ∑mγmΔXm,i,t + θt + Δεi,t
2) The autocorrelation due to the presence of the lagged dependent variable is purged using as an instrument its past value (t-2).
3) The endogeneity problem due to the correlation of the time variant variable (Mkrt and EnvR) with the past error terms ε is overcame using them as predetermined, that is assuming that the level as an instrument its past value (t-2).
4) The correlation across panels in the idiosyncratic errors is controlled using time dummies variables.
37
Session 06 - Energy efficiency in buildings and industry
Giuseppe Dell’Olio ENERGY EFFICIENCY IN BUILDINGS: A SIMPLE BUT ACCURATE WAY TO PERFORM CALCULATIONS
Giuseppe Dell’Olio, Via Val di Sangro, 13 - 00141 Roma; e-mail: [email protected]
Overview Energy efficiency assessments of buildings are often criticized for being too expensive. This is due, i.a., to the complexity of the International Standards on which they are based. For the application of these Standards, technical expertise is often not enough: expensive software tools are also needed, which increases the fee for the hired professional. Not surprisingly, “simplified” methods are envisaged, albeit not detailed, by legislation. Is it possible to perform energy efficiency assessment in a simplified, yet accurate way? One of the most complicated calculations is that of solar heat contribution: for each month and for each exposure direction, the time percentage during which shutters are kept closed needs to be taken into account. A possible simplification (which does not involve any loss of accuracy) consists in conservatively assume for all month the “closed” time percentage of the worst month. This way, only four figures need be taken into account, instead of twenty eight. Methods We have selected a stand-alone, 2011 designed house in central Italy. The house is thermally isolated and equipped with heating (but no cooling) installation. We have first assessed the EPi (Energy Performance index for heating) rigorously; namely, we have distinguished the various months that make up the heating season. As per applicable legislation, we then performed the calculation, in the same condition, for the “reference building”. After that, we repeated the whole procedure with the conservative hypothesis described above (solar heat contribution underestimated). The calculation was much simpler and rapid. Both EPi’s (real building’s and reference building’s) turned out to be higher (worse) than respective “rigorous” values. In order to test the method once more, we performed a further calculation, based, this time, on an overestimate of solar heat contribution. Not surprisingly, EPi’s turned out to be better (lower) than corresponding rigorous values. Results In all cases (rigorous calculation; solar heat underestimated; solar heat overestimated) the energy efficiency class of the house turned out to be the same (namely, a B class). Conclusions The energy classification of buildings is basically independent of solar heat contribution. This is because solar heat acts “in the same direction” on both EPi’s: underestimating solar heat results in an overestimate of EPi, both for the real building and for the reference building. The latter is especially important, as it also affects the upper and lower limits of ranges associated with energy classes: these limits, which are proportional to EPi of the reference building, are in turn overestimated. As a result, conservatively underestimating solar heat is an efficient way to simplify calculation. This implies no loss of accuracy: the energy class of the building is unchanged. If such an approximation were to be adopted in software tools used to perform energy calculations on buildings, a significant cost reduction might be expected.
38
Session 06 - Energy efficiency in buildings and industry Daire McCoy, Francois Cohen and Antoine Dechezlepretre THE LONGER TERM EFFECTS OF HOME ENERGY EFFICIENCY INVESTMENTS
Daire McCoy, Grantham Research Institute, London School of Economics and Political Science, UK e-mail: [email protected]
Francois Cohen, Centre for International Environmental Studies, Graduate Institute of International and Development Studies, Geneva, Switzerland, e-mail: [email protected]
Antoine Dechezlepretre, GRI, LSE and OECD, Paris, e-mail: [email protected]
Overview Evaluations of the impact of policies to improve the energy efficiency of residential dwellings are beset by many problems. These include unreliable engineering estimates, rebound effect, and infra-marginal participation. Such evaluations typically only consider the short-term effects also, usually a window of 1-2 years on either side of the intervention (Fowlie et al., 2015; Hamilton et al. 2016). Specific factors related to usage patterns in any particular period may bias results both before and after, while poor installation quality or degradation in the installed equipment may affect the results post-installation. If there is significant variation in this over time, this could affect the accuracy of measurement, the attractiveness of the investment, or the cost-effectiveness of a government scheme. Further, variations in energy prices both before and after the installation may affect both expectations and realizations of the investment’s NPV. We contribute by examining the effectiveness of government and privately funded energy efficiency investments using a rolling time-horizon approach, in the spirit of Reggio and Mora (2012). As far as we are aware this type of analysis has not previously been undertaken before in this context. We exploit a large longitudinal database of household energy consumption and energy efficiency installations, allowing us to examine a much wider window of time around the intervention than is usually available. Preliminary analysis indicates that there is significant variation in the results depending on what time scale is used. Not accounting for this variation over time may bias results and compromise the accuracy of evaluation. Methods The National Energy Efficiency Database (NEED) contains dwelling-level data on four million households, over an eight-year period. This includes meter point electricity and gas consumption data, property attribute data, data on energy efficiency measures installed, and data modelled by Experian on household characteristics. For each year of installation we create an installation group and a control group using statistical matching techniques. Multiple regression models1 are then be estimated allowing us to examine the stability of the results, contingent on the length of the period used for comparison purposes before and after the intervention. _________________________________________
1 A range of estimation techniques such as panel fixed effects models and flexible differences-in differences models are used
39
Session 06 - Energy efficiency in buildings and industry Results
Figure 1: Reductions in gas consumption following upgrades in 2006. Models estimated
on a sample of 283,000 dwellings using panel fixed effects and The effect of the upgrade on gas consumption over time remains relatively stable for both insulation types, although the impact of cavity wall insulation reduces from 9.6% in 2007 to 8.7% in 2011. However, the boiler estimates reduce from 3.5% in 2007 to 1.1% in 2011. This is a 68% difference in the estimate, depending on when the measurement is taken. The overall pattern is a gradual reduction of the effect over time.
Figure 2: Reductions in electricity consumption following upgrades in 2006. Models estimated on a sample of
283,000 dwellings using panel fixed effects and matched upgrade and control group
40
Session 06 - Energy efficiency in buildings and industry
The electricity savings associated with cavity wall insulation are not significantly different from 0. Both loft insulation and installing a new boiler have an effect, but again this mitigates over time. The effect of loft insulation on energy reduction reduces from 3.6% in 2007 to 1.8% in 2011, while that of installing a new boiler reduces from 2.8% in 2007 to 0.1% in 2011, and is not significantly different from 0 at this point. Conclusions Recent research has confirmed the importance of time-scale when examining the effect of building energy codes on domestic energy consumption in the USA. Kotchen (2017) found noticeable differences depending on whether the effect was evaluated 3 or 11 years after implementation. Further, the effect was found to vary by energy source, with the savings increasing for gas, and reducing for electricity over time. We contribute to this work by examining the longer term effects of energy efficiency investments. Results show significant differences over time, particularly the effect of new boiler installations on gas consumption. Results also differ by fuel-type. Further work involves investigating the heterogeneity of this effect for different socioeconomic groups and dwelling types, and examining the NPV of energy efficiency investments. Ultimately these results demonstrate that ex-post evaluations of energy efficiency must take a longer time frame than is generally used in the literature. References Alberini, A. and Towe, C. "Information v. energy efficiency incentives: Evidence from residential electricity
consumption in Maryland," Energy Economics (52), 2015, pp. S30--S40. Fowlie, M., Greenstone, M. and Wolfram, C. "Do energy efficiency investments deliver? Evidence from the
weatherization assistance program", Technical report, National Bureau of Economic Research, 2015. Kotchen, M. J. "Longer-run evidence on whether building energy codes reduce residential energy consumption,"
Journal of the Association of Environmental and Resource Economists (4:1), 2017, pp. 135--153. Mora, R. and Reggio, I. "Treatment effect identification using alternative parallel assumptions," UC3M Working
papers. Economics 12-33 2012.
41
Session 07 - Day-ahead, Intra-day and balancing markets
Stefano Clo’ UNBALANCES AND MARKET RULES IN ITALIAN WHOLESALE ELECTRICITY MARKET
Overview Increasing RES penetration is attracting the attention of policy makers and market operators, given that the intermittent and unpredictable nature of renewable energy sources requires careful management of the continuous balance between demand and supply. The forecasting error in demand, obtained as the deviation between day-ahead and real time load, determines whether up-or down-regulation is required, after being adjusted for RES generation and net import/export flows. Therefore, balancing markets are attracting an increasing interest in the last years and several contributions consider different institutional designs and the ability to respond to high and increasing RES penetration. Hagemann and Weber (2013) found that RES forecast errors are one of the main sources of intraday liquidity in Germany and are thus also expected to influence prices. Von Roon and Wagner (2009) explore if the difference between German day-ahead and intraday prices is influenced by the wind forecast errors. Clo’ and D’Adamo (2015) already observed that “the merit-order effect” (daytime switch between solar and gas) has pushed Italian gas producers to concentrate their supply of electricity during off-peak hours in the day-ahead market session. The relationships among day-ahead, intra-day and balancing prices have been studied by Gianfreda et al. (2016). They show that the intra-daily sessions are appropriate tools for cost reductions but, at the same time, they argue that conventional production units may be incentivized to bid in real time sessions given the estimated high premia of readiness. On one side, electricity is not storable. On the other side, consumption and electricity generation are strictly related to weather conditions and, therefore, electricity prices have become more and more connected to weather than to fossil fuels, see Mulder and Scholtens (2013), Clo’ et al. (2015), Gianfreda et al. (2016); among others. This unpredictable combination is observed in frequent unbalances which heavily characterize electricity markets. In principle, it is possible to distinguish between random and intentional unbalances: the former ones are unexpected and can be produced by forecasting errors between the quantities scheduled in day-ahead sessions and the actual schedules observed in real time, even if adjusted through intra-daily sessions; whereas the latter ones are intentionally created for market speculations and are consequences of strategic bidding aimed at bidding higher (or lower) quantities than those actually planned to be injected (or withdrawn) into (from) the system. The Italian power generation mix has substantially changed in the last years with increasing shares of wind, solar PV and biomass. The increasing RES-E has added uncertainty to planned volumes on the day-ahead market (MGP), given that its session opens nine days before the day of delivery and closes at 12:00 p.m. of the day before delivery. Consequently, the quantities bid by RES units are based on forecasts while the effective load is known only in real time. This determines a higher level of volatility in production, which could correspond to uncertainties in consumption; both requiring hedging in real time. To adjust production schedules, an additional market session was introduced in 2015, hence having a total of 5 intra-day market sessions (MIs) taking place after the MGP. In addition, the Italian ancillary service market (mercato dei servizi di dispacciamento, MSD) opens at 12:55 p.m. of the day before delivery and it consists of a scheduling sub-stage (“ex-ante MSD”) and a balancing market (“MB”). MSD is the marketplace where the Italian TSO, Terna, negotiates all the necessary capacity to guarantee system security, to solve zonal congestions, and to establish an adequate real time balancing. Market participants are obliged to comply with their production/consumption programs established in the day-ahead (MGP) and intra-day (MIs) markets and they are financially responsible for any deviations from their schedules. The Italian authority, AEEGSI, settles the price for balancing quantities exchanged between market operators and the TSO. To this aim, it is necessary to distinguish between unbalances.
42
Session 07 - Day-ahead, Intra-day and balancing markets There is an “unbalance in phase” when the unbalance sign of a single operator is the same as the one observed in the macro zone (this last sign is known as the conventional sign and it is computed as the total amount of quantities called and procured from Terna in both MSD and MB market sessions for that area). Whereas, there is an “unbalance in antiphase” when the previous two signs are discordant. In the last 10 years, two different prices were applied according to the legislation (Delibera nr. 111/2006): penalties for “in phase” unbalances and economical compensations for “in antiphase” unbalances. This occurs because the “unbalances in phase” increase the total unbalances hence increase the costs for the system (and they must be discouraged using penalties); on the contrary, the “unbalances in antiphase” reduce the total zonal unbalance hence produce savings (or avoided costs) for the system and must be encouraged. However, in 2016 we assisted to increased costs incurred for planning and dispatching balancing power and consumers’ associations complained about speculations taking place in MSD sessions. As consequence, the Italian Authority proposed new settlement rules for unbalance prices (Delibera 444 in July 2016). The new computations vary according to unbalances greater or lower than a certain tolerance band (which is a percentage of the ratio between the forecasting error and the total injected and withdrawn quantity) and according to the assumed nature of unbalances (that is random or intentional). The unintended orrandom unbalances, which are those lying within this band, are evaluated according to the old single-price rule (hence basically nothing has changed); whereas, the intentional or wanted unbalances, which are those lying outside this tolerance band, are evaluated according to a new dual-price rule which always penalises them independently from their impact on the system. Therefore, the main aim of the paper is to understand if these speculations were actually put in place by strategic behaviours and/or because of not properly defined market rules for these price settlements. Methods and Results Market operators can be incentivized to intentionally “unbalance the system” if the pricing mechanisms are not properly and carefully designed. Therefore, we undertake an empirical analysis comparing the old price definition and the new rules formulated by the Italian authority trying to understand the effect of the new formulation. Using standard regression-type models, we perform an empirical analysis on forecasting errors in generation and consumptions looking at bid data in all interested market sessions from the beginning of 2016. We additionally quantify system costs according the two market rules. For each Italian market zone, we determine the hourly unbalance direction (positive or negative) for both relevant wind production and consumption. Zonal unbalances are estimated by matching data on actual consumption and generation and data on bids in the power exchange. On the consumption side, zonal unbalances are estimated as: a) difference between actual load (from Terna) and wholesale (day-ahead and intraday) bids (from GME). On the renewable side, they are estimated as difference between relevant wind actual generation and forecast offers in the wholesale market. Then, for each zone, we determine whether the hourly conventional zonal unbalance sign (as defined by the regulator) is consistent with the hourly actual unbalance sign. Next, we assess whether the size of the zonal unbalance and the related balancing costs depend on the consistency between conventional and actual zonal unbalance signs. When they match, the unbalance pricing rule is cost-reflective, penalizing in phase unbalances and rewarding anti-phase unbalances, thus giving incentives to lower overall unbalances. When conventional and actual zonal unbalance signs diverge, the unbalance pricing rule gives distortive incentives, and in phase unbalances are rewarded while anti-phase unbalances are penalized, causing an increase in overall unbalances. We assess to which extent: a) the probability to have aligned or divergent conventional and actual zonal unbalances signs and b) the size of the unbalancing pricing resulting from the settlement rule gives incentives to strategically bid to increase or lower the unbalance size. Conclusions Given that is not possible to avoid unbalances in schedules from both consumption and generation, it is important to understand the impact of settlement rules and the ways they can avoid market speculations and promote competitive behaviours.
43
Session 07 - Day-ahead, Intra-day and balancing markets Our analysis provides interesting insights and highlight limitations on the formulation of tolerance bands by comparing old and new price definitions. References Clo’ S. and D’Adamo G., (2015), The dark side of the sun: How solar power production affects the market value
of solar and gas sources, Energy Economics, 49, 523-530 Clo’ S., Cataldi A. and Zoppoli P., (2015), The merit-order effect in the Italian power market: The impact of solar
and wind generation on national wholesale electricity prices, Energy Policy, 77, 79–88 Gianfreda A., Parisio L. and Pelagatti M., (2016), The impact of RES in the Italian Day-Ahead and Balancing
Markets, The Energy Journal, 37, Bollino-Madlener Special issue Gianfreda A., Parisio L. and Pelagatti M., (2016), Revisiting Long-run Relations in Power Markets with High RES
Penetration, Energy Policy, 94, 432-445 Hagemann S. and Weber C. (2013), An Empirical Analysis of Liquidity and its Determinants in The German
Intraday Market for Electricity, available at https://ideas.repec.org/p/dui/wpaper/1317.html Mulder M. and Scholtens B., (2013), The impact of renewable energy on electricity prices in the Netherlands,
Renewable Energy, 57, 94-100 Von Roon S. and Wagner U., (2009), The interaction of Conventional Power Production and Renewable Power
under the aspect of balancing Forecast Errors, Proceedings 10th IAEE European Conference 2009, Vienna. Available at
Session 07 - Day-ahead, Intra-day and balancing markets
Elena Fumagalli and Bastian Westbrock DEMAND PARTICIPATION IN ELECTRICITY BALANCING MARKETS
Bastian Westbrock, Utrecht University School of Economics Kriekenpitplein 21-22, 3584 EC Utrecht, The Netherlands [email protected]
Elena Fumagalli, Dep. of Management, Economics and Industrial Engineering, Politecnico di Milano, via Lambruschini 4/b, 20156 Milano, Italy, e-mail: [email protected]
Overview In most European countries today demand resources are considered essential to build a secure, competitive, and sustainable internal energy market: demand participation is encouraged in wholesale electricity markets and there are several initiatives to make use of demand flexibility as a reliability resource. Among other examples in Europe, the Italian Regulatory Authority for electricity and gas has recently launched a consultation on the opening of the Italian Ancillary Service Market to demand resources, intermittent renewable energy sources and distributed generation (AEEGSI, 2016; AEEGSI, 2017). Our objective is to theoretically investigate how the admission of demand resources to a balancing market might affect the economic efficiency of this market and of a preceding energy market. While technical and regulatory issues associated with demand participation have been addressed in the literature (f.i., Koliou et al., 2014), the benefits in terms of economic efficiency have received considerably less attention. In particular, we focus on a potential adverse effect of demand participation: consumers might anticipate on the rewards for their balancing services and distort their consumption decisions on the preceding energy market, thereby distorting the outcome of that market. Hence, the dispatching schedule of the energy market might lose its predictive power. In fact, consumers and producers might defer all serious consumption and production decisions to the day of delivery, while the energy market is exploited to serve speculative profits. In turn, this would increase the volume traded in the balancing market and potentially drive up the cost of maintaining the system in balance. Our baseline result extends on previous work that has looked at demand participation in the absence of speculative motives (Crampes and Léautier, 2012). In addition, we consider the possibility that market participants might supply or demand a quantity that is incompatible with their true willingness to consume or their true production cost, respectively. We start from the observation that energy markets are already prone to speculative over- and under-supply positions by current balancing service providers (large, programmable power plants). Along this line, Just and Weber (2015) show clear indications for speculative behavior in aggregate market data for the German market. Thus, our main question regards how far things get worse when both sides of the energy market hold positions that not only reflect their ‘true’ preference for electricity and their ‘true’ production cost, respectively, but partly also speculative trades. Method We consider the simplest possible setting that includes: A Day-Ahead Market (DA): a competitive market for wholesale electricity that clears the day before delivery. A Balancing Market (BM): a competitive market for balancing services that clears on the day of delivery.
45
Session 07 - Day-ahead, Intra-day and balancing markets Participants in the DA are a large number of consumers and a large number of renewable and thermal energy producers; The balancing services are procured and activated by a Transmission System Operator (TSO) and supplied by a large number of balancing service providers. Depending on the admission of consumers to this market, these service providers are either only thermal energy producers1 or also consumers in addition. The only source of uncertainty in our model stems from the stochastic outputs of the wind producers. The TSO procures balancing energy in real time, when the actual state of the wind is known, in order to keep the system in balance. Depending on whether the actual total wind output is larger or smaller than the scheduled wind output, the TSO procures one of two types of balancing services: upward balancing energy when the system is short and downward balancing energy when the system is long. In the case of an upward market, the TSO pays the service providers. In a downward market, the TSO sells back the excess energy to the service providers.
Results The welfare effects of DP without speculation: under a competitive energy market, demand participation (a) increases the volatility of consumption and decreases the volatility of production in the BM, (b) implements the first-best outcome in the BM, and (c) reduces the cost of maintaining the system balanced under any state of the system. The main driver behind this result is that demand participation effectively introduces another potential margin of adjustment in the balancing phase, thereby reducing the wedge between the day-ahead price and the balance-inducing price. The welfare effects of DP with speculation on the part of both consumers and producers: results (a) and (b) above are confirmed. When we consider speculative purchases or sales in the day-ahead market, but still foreclose the BM to consumers, we find two potential equilibria: an interior and a ‘crash’ equilibrium. In the first case, thermal energy scheduled in the DA is sufficiently large to meet any potential up- or downward adjustment requirements in the BM. In the second case, thermal producers might not be able to sufficiently expand or cut back their output, when called upon by the TSO. Notably, our results show that demand participation strictly reduces the likelihood of such a ‘crash’ equilibrium. More importantly, when we open the BM to demand participation, we find that a purely speculative equilibrium where either very little or an excessive amount of electricity is scheduled in the day ahead can be ruled out. In the unique equilibrium under demand participation, the total demand scheduled in the day-ahead is actually rather close to the actual consumption on the day of delivery. Finally, our preliminary results show that when consumers carry some of the balancing burden, balancing costs might decrease, even though demand participation has a non-trivial impact on thermal energy traded on the energy market, a key quantity in determining the overall level of balancing costs.
Conclusions In this work, we theoretically investigate demand participation in a balancing market. Absent speculative behavior on the parts of consumers and electricity producers, we find that demand participation clearly enhances market efficiency and reduces the costs of keeping the system in balance. Differently, once we introduce speculative behavior, the analysis becomes more complex because of feedback effects on the output traded in the energy market. Nevertheless, our preliminary findings broadly support changes in current market designs to allow demand participation, as well as any policy initiative which might facilitate the integration of demand resources in power systems. _____________________________________________ 1 In reality, scheduled energy programs for market participants emerge from bilateral contracts, Day-Ahead and Intraday markets. Without loss of generality and for the sake of simplicity, we consider here that they emerge from DA only.
46
Session 07 - Day-ahead, Intra-day and balancing markets
References AEEGSI, 2016. Prima fase della riforma del mercato per il servizio di dispacciamento: apertura alla domanda, alle
fonti rinnovabili non programmabili e alla generazione distribuita. DCO 298/2016/R/EEL. Available from: http://www.autorita.energia.it.
AEEGSI, 2017. Prima apertura del mercato per il servizio di dispacciamento (MSD) alla domanda elettrica e alle unità di produzione anche da fonti rinnovabili non già abilitate nonché ai sistemi di accumulo. Available from: http://www.autorita.energia.it.
Crampes, C., and Léautier, T. O., 2015. Demand response in adjustment markets for electricity. Journal of Regulatory Economics, 48(2), 169-193.
Just, S. and Weber, C., 2015. Strategic behavior in the German balancing energy mechanism: incentives, evidence, costs and solutions. Journal of Regulatory Economics, 48(2), pp.218-243.
Koliou, E., Eid, C., Chaves-Ávila, J.P. and Hakvoort, R.A., 2014. Demand response in liberalized electricity markets: Analysis of aggregated load participation in the German balancing mechanism. Energy, 71, pp.245- 254.
47
Session 07 - Day-ahead, Intra-day and balancing markets Lucia Parisio, Angelica Gianfreda and Matteo Pelagatti THE RES-INDUCED SWITCHING EFFECT ACROSS FOSSIL FUELS: AN ANALYSIS OF DAY-AHEAD AND BALANCING PRICES
Lucia Parisio, DEMS-University of Milan-Bicocca, [email protected] Angelica Gianfreda, Faculty of Economics and Management, Free University of Bozen-Bolzano,
Overview The empirical literature on electricity markets have highlighted a strong cointegrating relationship governing the dynamics of electricity and fuel prices. More recently the massive introduction of RES in electricity generation, fostered by generous supporting schemes, has influenced the shape and position of the supply function and consequently the equilibrium prices. We believe that the new competitive scenario may have influenced the fuel-electricity nexus with a different impact in day-ahead and balancing markets. Taking into account the Northern Italian zone characterized by a high solar PV and hydro penetration, we provide empirical evidence of the evolving fuels-electricity nexus across two samples characterized by low (2006-08) and high (2013-15) RES levels. We conduct the analysis taking into account both day-ahead and, for the first time, balancing market sessions. Results indicate that fuel prices are much less relevant in determining the dynamics of electricity prices in recent years characterized by high RES penetration. On the contrary, taking into account flexible thermal sources, we show that in the second sample balancing and fuel prices (especially gas) are in a long run equilibrium. Methods We study the most relevant portion of the Italian market as a reference case, but our findings can be easily generalized to other countries with similar market structures, pricing mechanisms and portfolio mix of balancing technologies. The Northern zone of Italy is historically characterized by high hydro shares and, in the last few years, by high solar Photovoltaic (PV) penetration. Hence, this zone is a good candidate to analyze the influence of RES on relations between electricity and fossil fuels. We focus on a time span from 2006 to the end of 2015 during which we observed a progressive increment of RES generation from low, or even absent, to high penetration. To this aim, we have divided the time series into two samples: the first one (2006-2008) represents the scenario of low RES penetration, whereas the second one (2013-2015) represents the scenario of high RES penetration. Between the two considered sample periods 2009-2012 relevant regulatory changes have been introduced regarding Intra-day (MI) and Balancing market (MSD-MB) sessions. We decided not to analyze this period because it is characterized by a transition towards new market design and a new technology portfolio and hence we expected that the relationship among variables of interest to be unstable. For both samples, using dynamic econometric models, we study the relationship between fuels and electricity prices for both day-ahead and balancing market sessions. We considered the vector of time series containing fuel prices and day-ahead prices and then the vector containing fuel prices and balancing prices. Each electricity price time series was added individually to the fuel price vector, so that the VAR/VECMs we estimated were always four-dimensional. For each subsample, we determined the order of the VAR using the Akaike (AIC) and the Hannan-Quinn (HQC) information criteria and tested for the order of cointegration using Johansen's sequential test. A detailed analysis of the long run effects of unexpected shocks in fuel prices on electricity prices can be carried out by forecast error variance decomposition (FEVD). In order to better inquire the direct relationship between the balancing prices of thermal plants and single fuel prices, we estimated also bivariate VAR/VECM models for all the pairs you can form with the six price series and the three fuel series (18 models) and, then, produced the relative impulse response functions (IRFs).
48
Session 07 - Day-ahead, Intra-day and balancing markets
Results The empirical analysis suggests that a switch effect has occurred in the day-ahead market, where RES penetration has decreased the role of fuels in explaining the dynamics of prices; moreover, gas prices are much less relevant while coal prices become the main driving force of electricity price variability. The phenomenon is particularly evident in specific hours, like for example at sunset. Results related to the analysis of balancing prices are quite different. First, they are only mildly related to fuel prices in the long run. In the same manner, the switch effect exists but is very limited and restricted to some hours only. Taking into account accepted bids from flexible thermal sources, we find that fuels and electricity prices share common dynamics in real time market sessions in the second sample. We believe this is the evidence of a new role played by thermal units as supplier of flexibility and we interpret our results as evidence of evolving market opportunities: thermal units are often excluded from the day-ahead market, being price-setter less frequently than in the past and, as a consequence, they recover profits in balancing sessions. However, balancing prices are not entirely cost-reflective and appear to be driven also by strategic considerations related to the high degree of market power enjoyed by flexible thermal units in real time. Conclusions Despite the regulatory concerns and the attention paid in the recent “Winter package'', balancing markets have not been analyzed in deep by the literature. In particular, there is lack of evidence on driving forces governing the behavior of balancing prices. At the same time, the sudden and increasing renewable power generation makes the relations among day-ahead and fuel prices highly questionable, at least in recent years. Considering day-ahead and balancing electricity markets for the Northern Italy, we undertake our empirical analyses selecting specific hours on the basis of different load and RES production. This allows us to disentangle our results according to certain load levels and to highlight the influence of RES according to their intra-daily profiles. We consider two sample periods characterized by low (2006-08) and high (2013-15) RES penetration and we propose few hypotheses about the resulting dynamic relationship among fuels and electricity prices in both day-ahead and, for the first time, balancing markets. Our findings firstly confirm that the increasing RES penetration has substantially changed the traditional relationship between electricity and fuels prices in day-ahead markets. In particular, we show that RES are able to reduce the role and the influence of fuels in the day-ahead sessions. We find that coal-fired power generation has increased its influence on electricity prices, fostered by coal becoming relatively cheaper than gas. However, the switching from natural gas (the less emission-intensive generation source) to coal raises new challenging questions for policies aiming at reducing greenhouse gas emissions. Secondly and more importantly, we provide empirical evidence that fossil fuels are not relevant drivers of electricity prices in balancing sessions since they explain around 20% of the variance of electricity prices in a one-year time horizon. However, we show that in the second sample there is a common trend between balancing prices paid to thermal units and gas prices. This novel finding is interpreted as a signal of how firms respond to changing market opportunities. The high and sudden RES penetration has reshaped the competitive conditions in electricity market sessions, with gas units forced by RES to work less hours with respect to their break-even point in the day-ahead market (this is frequently known as the ”curse of CCGT units”) and therefore they revert to real time sessions where they still enjoy a leading role. As a result, flexible thermal units are restricted to bid in real time markets where they must recover both fixed and variable costs. This could explain why prices in balancing sessions are generally mildly cost-reflective and share the same dynamic behavior with the main fuel price, namely gas.
49
Session 07 - Day-ahead, Intra-day and balancing markets
Alessandro Sapio QUANTILE MERIT ORDER EFFECTS AND NETWORK UPGRADES
Alessandro Sapio, Parthenope University of Naples, e-mail: [email protected]
Overview Italian islands are rich reservoirs of renewable energy sources, such as wind power and photovoltaics. Yet, their interconnection with the Italian mainland has historically been poor. The Sicilian and Sardinian wholesale prices have been above the average national price, signaling a chronic supply shortage in a region characterized by scarcity of hydropower sources. In a highly symbolic move, the Sardinian electricity system was fully integrated with the Italian grid on March 17, 2011, as part of the celebrations for the 150th anniversary of the Italian unification. A new HVDC interconnection, named SAPEI (SArdinia-Italian Peninsula), was added to the previously existing, and smaller, Sardinia-Corse-Italy (SACOI) cable. On May 28, 2016, the long awaited doubling of the Sorgente-Rizziconi cable, connecting Sicily with the Italian peninsula, has been activated, aiming to curb a congestion problem that in some years caused zonal separation in about 80% of the hours. The new cables in the Italian grid offer a highly interesting case study to assess how the additional energy production from renewables, heavily subsidized until few years ago, affected the Italian wholesale electricity prices across the new interconnections. In policy terms, this is an essential analytical step, since the expected fall in Sicilian wholesale prices do not seem to materialise yet, and concerns of increasing volatility are associated to blossoming renewables. The chosen methodology overcomes the limitations of most previous works, wherein merit order effects were estimated on the average price without taking care of zonal spillovers. In this paper, quantile regression models of the day-ahead electricity price are estimated in order to grasp how the shape of the price distribution changed, as the production of renewables increased while the new cables became operational. An additional aim is to understand volatility transmission patterns across market zones. The paper thus contributes to two strands of literature. One is about the merit order effect (from Sensfuss et al. 2008 to Paraschiv et al. 2014) and volatility effects of renewables. The other is on market integration, related to valuation anomalies (Bunn and Zachmann 2010, McInerney and Bunn 2013) and market power export effects (see Boffa and Scarpa 2009, de Villemeur and Pineau 2012). Electricity prices in Sicily and Sardinia were already explored in Sapio and Spagnolo (2015) and Sapio and Spanolo (2016), respectively. The analysis is based on day-ahead electricity prices in the Italian market zones in the 2011-2017 time window, regressed on intermittent renewable generation, on volatility estimates (in the zone and from neighboring zones) and on fundamentals. Methods Quantile regression was introduced by Koenker and Bassett (1978) and is fully described in Koenker (2005). It has been already applied to wholesale electricity prices by Bunn et al. (2013), Hagfors et al. (2016) and Maciejowska et al. (2016) on UK data, among others. Quantile regression models are robust to distributional mis-specifications, as no explicit distributional assumptions need to be made. This makes them particularly suitable to deal with heavy-tailed and skewed data, such as wholesale electricity prices, improving upon merit order effect estimates focusing on the price average. Moreover, comparing the estimated coefficients across quantiles allows to grasp, at the same time, the impact of renewables on both the location and scale of the log-price distribution, and to appreciate time-varying effects as in Ketterer (2014), Paraschiv et al. (2014), and Sapio (2015). Through quantile regression, hereby one models the quantiles of the log-price distribution, conditional on the main variable of interest - renewable energy in- feed - as well as control variables accounting for market fundamentals at each quantile, namely seasonal dummies, fuel prices, and cable capacities.
50
Session 07 - Day-ahead, Intra-day and balancing markets In this paper, a linear quantile regression model is estimated, augmented with an estimate of volatility based on a preliminary GARCH estimation, as in Bunn et al. (2013). This term finds a number of economic motivations, such as convexity in the supply stack, and risk-aversion by market participants, whose decisions take account of volatility. Also, including volatility terms regarding neighboring zones helps measuring volatility spillover effects. Econometrically speaking, previous works (e.g. Liu and Shi 2013, Efimova and Serletis 2014) have similarly included GARCH-in-mean terms for forecasting purposes. Data on the wholesale day-ahead zonal electricity prices (in Eur/MWh) have been collected from the IPEx website (www.mercatoelettrico.org) for the period Jan 1, 2011–May 31, 2017, for the 6 Italian zonal markets. The sample covers the period right after the SAPEI cable inauguration and the first year after doubling the Sorgente-Rizziconi cable connecting Sicily to the Italian peninsula. Hourly data on intermittent renewable energy generation (photovoltaics and wind) and on the available capacity of transmission lines are provided by Terna, the transmission system operator. Daily oil and gas prices have been sourced from Eikon, a Thomson-Reuters database. The quantile regression model is run for each of the 24 hourly auctions held in the Italian power exchange. Results Preliminary results suggest that renewables have exercised a merit order effect in all zones, as testified by the negative coefficients associated to renewables across quantiles. Adding to this, a volatility effect is also detected, since coefficients increase across quantiles - hence, both the upper and lower tails of the price distribution are magnified when renewable generation grows. Further, volatility transmission from net electricity importing zones, is stronger than volatility transmission from net exporters. As shown by the volatility term in the linear quantile model, volatility from the islands affect the mean prices in the neighbouring zones, as if exporting the merit order effect associated with renewables. References Boffa, F.; Scarpa, C. An anticompetitive effect of eliminating transport barriers in network markets. Review of
Industrial Organization, 2009, 34.2, 115-133. Bunn, D., Andresen, A., Chen, D. and Westgaard, S., 2013, September. Analysis and forecasting of electricity
price risks with quantile factor models. In Finance Research Seminar Series, University of St. Gallen. Bunn, D.W.; Zachmann, G. Inefficient arbitrage in inter-regional electricity transmission. Journal of Regulatory
Economics, 2010, 37, 243-265. de Villemeur, E.B.; Pineau, P.O. Regulation and electricity market integration: When trade introduces
inefficiencies. Energy Economics, 2012, 34.2, 529-535. Efimova, O.; Serletis, A. Energy markets volatility modelling using GARCH. Energy Economics, 2014, 43, 264-
273. Hagfors, L.I., Bunn, D., Kristoffersen, E., Staver, T.T. and Westgaard, S., 2016. Modeling the UK electricity price
distributions using quantile regression. Energy, 102, pp.231-243.
51
Session 07 - Day-ahead, Intra-day and balancing markets
Nicola Sorrentino, Daniele Menniti and Anna Pinnarelli IMBALANCES COSTS OF SMALL SCALE RENEWABLE NOT DISPATCHABLE POWER PLANTS IN THE ITALIAN ELECTRICITY MARKET
Nicola Sorrentino, Energetic, Mechanical and Management Engineering Dept. - University of Calabria e-mail: [email protected]
Daniele Menniti, Energetic, Mechanical and Management Engineering Dept. - University of Calabria e-mail: [email protected]
Anna Pinnarelli, Energetic, Mechanical and Management Engineering Dept. - University of Calabria e-mail: [email protected]
Overview The dispatching in electrical systems always has to face the problem of instantaneous balance between produced power and consumed power. In recent decades, with the advent of distributed generation, especially from non- programmable renewable sources, dispatching has become increasingly more difficult, and more and more attention was paid to the opportunity to limit the imbalances between foreseen production profiles and those actually measured, by the payment of a fee. In the Italian electricity market, the legislation on this subject is evolving rapidly, especially in terms of different ways to calculate the imbalance fee. The paper presents an analysis of imbalances in the Italian case and exams the legislation in force and the proposed changes by the Italian Authority (AEEGSI). Results show that there are heavy penalizations with these changes, especially for the balancing operators (BO) who manage production units from non-programmable renewable sources (NPRS). Methods The economic evaluation of imbalances depends if the BO is eligible or not to participate in the balancing markets and if energy is produced by NPRS. The latter case, it makes a difference if the unit size is greater than 10MW or not. The imbalance payments according to previous and actual rules by AEEGSI are evaluated for a plant, not relevant, non-eligible, from NPRS, is observed. This unit is a 975.5 kW photovoltaic plant, located in Cirò Marina - Crotone, Italy. Referring to this plant, a forecast model will be used by which the binding ,modified and correct program is obtained and assumed as communicated to the Transmission System Operator (Terna) as reference profile. Using plant actual measurement and market results along 2016 by GME and Terna, the imbalances cost for this unit has been calculated with previous and new rules claimed by AEEGSI. It is worth to underline that any intentional arbitrage between markets is assumed. Results From the results, it can immediately deduce that changing regulation the production unit has a disadvantage because it receives less and pays more for its imbalance. In detail, the situation is critical: in some day it is noted that the negative fee, to pay to Terna, increases more than 50%, and in some cases it increases by almost 850%. Conclusions In the paper, an analysis of imbalances costs in the Italian electricity market was presented, considering the new rules to evaluate the charges in case of imbalance. Numerical results on the calculation of charges for a small scale renewable not dispatchable power plant, show that these new rules penalize very heavily this type of plant; indeed, the calculation on just about a year presents a strong penalty with an increase of nearly 6 times of the paying fee respect the regulation in force. It may be underlined that although the PV operator make no arbitrage in imbalance, related costs increase at an acceptable level to assure the overall economicity of the investment To reduce this cost, it is necessary a fully integration in intra-day and balancing market of distributed generation.
52
Session 07 - Day-ahead, Intra-day and balancing markets References L. Hirth and I. Ziegenhagen, "Balancing power and variable renewables: Three links", Renewable and Sustainable
Energy Reviews 50 (2015) A. Gianfreda, L Parisio and M. Pelagatti, "The Impact of RES in the Italian Day–Ahead and Balancing Markets",
The Energy Journal, 37, Volume 37, Bollino-Madlener Special issue I. J. Perez-Arriaga, and C. Batlle, "Impacts of intermittent renewables on electricity generation system operation",
Economics of Energy & Environmental Policy 1.2 (2012). Italian Council of State ruling no. 2936/14 AEEGSI, “Delibera n. 111/06, Condizioni per l'erogazione del pubblico servizio di dispacciamento dell'energia
elettrica sul territorio nazionale e per l'approvvigionamento delle relative risorse su base di merito economico, ai sensi degli articoli 3 e 5 del decreto legislativo 16 marzo 1999, n. 79”, July 2006, www.autorita.energia.it
AEEGSI, “Delibera 444/2016, Interventi prioritari in materia di valorizzazione degli sbilanciamenti effettivi nell’ambito del dispacciamento elettrico”, July 2016, www.autorita.energia.it
AEEGSI, Delibera 522/2014/R/eel “Disposizioni in materia di dispacciamento delle fonti rinnovabili non programmabili a seguito della sentenza del Consiglio di Stato – Sezione Sesta – 9 giugno 2014, n. 2936″, www.autorita.energia.it
53
Session 08 - Modeling the new environment
Cecilia Camporeale and Roberto Del Ciello IT-DAMEE: A REGIONAL APPLICATION TO ASSESS THE MACRO-EFFECT OF RDP FUND IN EMILIA ROMAGNA
Cecilia Camporeale, Italian Ministry of Environment – AT Sogesid, e-mail: [email protected] Roberto Del Ciello, SSPT-STS, ENEA, e-mail: [email protected]
Overview Rural Development Program (RDP) is the main policy to stimulate and encourage actions to support agriculture sector in the long run period aiming to preserve and value the environment and the sustainable growth of regional rural area but also helping the rural areas to meet the wide range of economic, environmental and social challenges of the 21st century. The new 2014-2020 European financial programming period sets 1.18 billion of euro for the RDP in Region Emilia Romagna. This is a very consistent amount of funds to boost a sector such as agriculture and agri-food industry strategic for Italian economy. This is why the RDP considers actions and measures to support younger employment and aim to repopulation of farming and rural areas, but also to limit the environmental pressure. How to estimate the macro economic impact of the RDP fund is an interesting aspect to investigate. This is the main object of the application of IT-DAMEE, an evolution of IO-NAMEA matrix model, an integrated tool for assessing the potential impacts of plans, programs, policies and measures on GHG emissions, considering the interrelation between the economic and the environmental system. In this paper, we show the results obtained through a projection of 2020 and 2030 of the regional application of IT- DAMEE to Emilia Romagna according to the approved distribution of RDP funding by European Commission. Methods IT-DAMEE is the acronym of Integrated Tool of Dynamic Accounting Matrices of Economy and Environment. It uses two accounting systems: Input/Output Matrix for the economic aspects and NAMEA (National Accounting Matrix with Environmental Accounts) matrix for the environmental and emission data related to each economic sector. In this article, we investigate - using the integration of these tools - the potential assessment of the effects of RDP for the period 2014-2020 in Emilia Romagna. The model developed is qualified for the interrelation among several approaches, and it is composed of three modules: 1. Module 1: allows to estimate the Value Added and the employment sectorial growth coherent with the Input/Output Matrix to supply a forecasting I/O matrix; 2. Module 2: allows to rebuild the NAMEA matrix for the emissions up to 2020, through the estimate of the sectorial emission intensities; 3. Module 3: allows to create the quantification effects of the public intervention on production, Value Added, employment, and GHG emissions. The basis of the model is a reference scenario or business as usual (BAU) scenario, in which the evolution of all its components, both economic and environmental elements are coherent among them. The essential elements to start the simulation are: Input/Output Matrix to a base year; NAMEA Matrix to a base year; the forecast of GHG emissions linked to the economic scenario considered so to describe a coherent framework of the economic system and the related environmental pressures.
54
Session 08 - Modeling the new environment These three elements determine the possibility to obtain a full reference scenario that we stress with the impact of an economic shock due to the introduction of the expenditure linked to the program examined. In this way we obtain the effect framework of the policy to a determined future year. Results The model allows to estimate impact scenario of public policies through the integration of different approaches and instruments (econometric models, matrix Input-Output, matrix NAMEA). The integration allows to consider all mechanisms of the interrelation existing between the economic and the environmental systems. We have applied the model to the RDP investment to study the economic and carbonic effects on Emilia Romagna economic structure through a projection of 2020 and 2030 of the regional IO and NAMEA matrix, in order to assess the systemic effects on the economy and GHG emissions linked to the rural program. The model can estimate the direct, indirect and induced effects (impacts) of a given investment on emissions and/or economic growth and employment. From our study, we can examine the effects also in two phases: the construction phase and the operation phase, which represent the permanent effect on the system.
55
Session 08 - Modeling the new environment
Nicola Colonna and Stefano Lo Presti ASSESSING THE ROLE OF INNOVATIVE FARMING TECHNIQUES TO REDUCE ENERGY CONSUMPTION AND CARBON EMISSION
Nicola Colonna, ENEA , National Agency for New Technologies, Energy and Sustainable Economic
Development, Research Center Casaccia, Rome, Italy, e-mail: [email protected] Stefano Lo Presti, Centrale valutativa srl, Via Giacomo Peroni 442 - 00131 - Rome,
Overview The Kyoto protocol fully commit the agricultural and forestry sectors on the valorization of their potential contribution to the objective of reducing greenhouse gases emission. Agriculture sector play a double role, it is a net emitter of GHG due to fossil fuel consumption, nitrogen fertilization and enteric fermentation and on the other side could play the role of carbon sink by enhancing its soil carbon sequestration potential. The EU has taken up the challenge to limit climate change to 2°C and has based its policy on considerations related to cost effectiveness and involvement of all productive sectors. In 2011, EU defined a roadmap for the transition to a low carbon emission economy setting the objective of reducing the GHG emission in agricultural sector by 2050, with an ambitious target (42-49%). There are promising technologies and approaches to deal with CO2 reduction as precision farming and conservation agriculture. Both could help farmers to increase competitiveness and mitigate CO2 emission. A project called AGRICARE has been carried out in Italy, under the LIFE program, to demonstrate Precision and conservation agriculture suitability for arable land. The project was designed to demonstrate how the application of advanced precision agriculture techniques, paired with different conservation agriculture practices, can reduce greenhouse gases and protect the soil. Methods Demonstration test have been conducted in the Veneto Region to evaluate the role of using innovative machineries with satellite assisted driving paired with conventional or innovative cropping systems as no tillage and minimum tillage. Trials have been conducted to compare conventional and innovative systems and energy and environmental evaluation have been carried out to assess gross energy requirements as well energy efficiency and CO2 emissions by using a simplified LCA approach. To perform precise evaluations, each cultivation step was thoroughly monitored. All consumptions and each factor distributed on the soil were recorded, drawing up a detailed accounting of the energy use. An energy balance was therefore carried out Results The results vary according to the crop as well to the different combination of innovative cultivation methods. Significant fuel savings are recorded in cropping techniques that apply the principles of conservation agriculture. This means that the quantity of direct energy needed to produce an hectare of crop decreases by as much as 50-60% with the no tillage technique. By the way the indirect energy use grows and counteract partially the calculated savings. Moreover the conservation techniques, when combined with precision farming (that include assisted driving and variable distribution of fertilizers or seeds) enable a significant quantity of diesel to be saved and a reduction in CO2 equivalent emissions for minimum tillage and no till, compared to traditional methods.
56
Session 08 - Modeling the new environment Conclusions By introducing innovative cultivation systems an average reduction on the fuel and chemicals use can be achieved (up to 10%), compared to the traditional farming techniques. Such optimization in the input side, is directly reflected in the results with a lower energy and environmental burden, which may become more relevant if precision farming and conservation agriculture would be applied at a larger scale and tested in different pedoclimatic conditions. Both techniques could support agriculture mitigation efforts and significantly contribute to EU ambitious goals.
57
Session 09 - Commodity pricing
Syed Jawad Hussain Shahzad ASYMMETRIC RISK SPILLOVERS BETWEEN OIL AND AGRICULTURAL COMMODITIES
We examine the tail dependence between oil and agricultural commodities (wheat, corn, soya beans, rice, barley and the overall agricultural commodities index) using static and time-varying copula functions. The upside and downside risk spillovers are quantified by three market risk measures, namely, the value at risk (VaR), the conditional VaR (CoVaR) and the delta CoVaR (ΔCoVaR). The results show high symmetric and asymmetric tail dependence between oil and agricultural commodities that increased during the global financial crisis of 2007-09. Moreover, there is strong evidence of upside and downside risk spillovers from oil to commodity markets (and vice versa) and risk spillovers are asymmetric. Investment implications are discussed. JEL classification: C5, G1, G14 Keywords: Oil prices; commodities; static and time-varying copula; risk spillovers
58
Session 09 - Commodity pricing Bård Misund EVALUATION of OIL & GAS FIRMS’ FINANCIAL PERFORMANCE: CASH FLOWS VS. ACCOUNTING EARNINGS
Bård Misund, University of Stavanger Business School, N-4036 Stavanger, Norway, e-mail: [email protected]
Overview For over forty years, accounting standard setters, regulators, oil and gas companies and academics have discussed intensively the topic of how to capitalize exploration (pre-discovery ) expenses for oil and gas producers. Since the 1960s oil and gas companies have been using two competing methods, the full cost (FC) and successful efforts (SE) methods (Zeff, 1978). Under the FC method, oil and gas explorers are allowed to capitalize all expenses, while under the alternative method, SE, only expenses from successful discoveries are allowed to become assets on their balance sheets.
The literature suggests that investors, faced with the difficulties of assessing the relevance of accounting numbers for predicting future cash flows due to accounting method heterogeneity may instead turn to cash flows. In fact, a survey reports that earnings are considered unreliable by oil and gas analysts comparing firm performance (Oil and gas investor, 1993) Moreover, DeFond and Hung (2003) find that analysts tend to forecast cash flows for firms with more heterogenous accounting method choices.
Our conjecture is that investors will turn to two relevant measures for oil and gas companies, namely cash flow from operations, which can convey information on current profitability, and oil and gas reserves fair values, which can provide information on future profitability. Our empirical methodology explicitly examines the relative importance for investors of accrual measures of probability versus that of cash flow measures. Methods In order to examine the impact of accounting method heterogeneity on investors’ flight to cash flows, we test four hypotheses. The first two compares the significance of the parameters on earnings variables relative to those on cash flow, and the latter two address the relative value relevance of the overall empirical model. First, we test if accounting method choice impacts the value relevance of accruals. This provides evidence on the relevance of signals information about future profitability. Second, we test if accounting method heterogeneity confuses investors about the usefulness of accruals and will instead turn to cash flow from operations as measures of future profitability. Using the Vuong test (Vuong, 1989), the third test assesses whether a cash flow-based empirical model is better than an accruals-based model for FC firms, while the last hypothesis tests this also applies for SE firms. Results & Conclusion The results support the view that accounting method discretion reduces value-relevance of accruals. We find evidence that short-term cash flow from operations) or long-term (change in net present value of reserves), or both, are more value-relevant than accounting earnings for both SE and FC firms. In fact, we fail to find evidence that neither earnings nor the change in earnings are significantly associated with oil company returns. A possible explanation is the adverse effect on investor confidence in earnings figures disclosed by oil and gas producers that multiple accounting methods have. Ironically, it seems that the fears of both the proponents and opponents of the successful efforts method have materialized. In fact, it seems that more objective economic variables such cash flows and net present value of reserves are more important than historical costs, indeed a triumph of economics over politics. The results are line with the concept that accounting method heterogeneity has a detrimental effect on the accrual value relevance.
59
Session 09 - Commodity pricing Conclusions We find that the accounting method heterogeneity combined with management discretion does not provide a valuable signal to investors. Instead, it seems that the returns on both FC and SE firms are determined by fundamental factors consistent with financial economic theory, rather than accounting based profitability measures. This is in line with theory suggesting that when an investor is faced with accruals that do not provide valuable signals, she will turn to cash flows measures. In fact, we find a positive association of both short-term and long term cash flow measures with returns for oil and gas firms that use the SE approach. The results also suggest that although FC and SE firm characteristics are different, this seems to be recognized and priced by investors. References DeFond, M.L. and M. Hung (2003). An empirical analysis of analysts’ cash flow forecasts. Journal of Accounting
and Economics 35, 73-100. Vuong, Q.H. (1989). Likelihood ratio test for model selection and non-nested hypotheses. Econometrica 57, 307-
333. Zeff, S.A. (1978). The risk of ‘economic’ consequences. Journal of Accountancy 146 (6), 56-63.
60
Session 09 - Commodity pricing
Mona Shokripour NATURAL GAS MARKET PREDICTION VIA STATISTICAL AND NEURAL NETWORK METHODS
Mona Shokripour, Energy Statistician, Gas Exporting Contries Forum (GECF), e-mail: [email protected]
Overview Natural gas is considered promisingly energy source among other primary energy sources since it has significant environmental benefits including low-level emissions of greenhouse gases when compared with other fossil fuels. The total world demand for gas is projected to increase through 2040 about 69% for the non-OECD region and 35% for OECD nations. Also, world gas demand is expected to grow by 1.83 billion cubic meter. The market price of the energy plays a significant role in determining energy and environmental security. We have two kinds of contract pricing methods in the gas market, one of them is spot price which is based on demand and supply and the other which is a term contract and related to oil index. Statistical models are capable of providing a prediction of future supply, demand and eventually price of natural gas which are essential for the planning of the energy market. The aim of this study is to compare statistical models with neural network models for describing the evolution of supply, demand and price of natural gas. Meanwhile, considering that there is a strong interaction between supply, demand and the resulting price, we may be able to take and project the demand as a variable that can be modeled and through which we can to model the other variables. Eventually, in order to show the accuracy of the algorithm, a fair comparison is made with Neural network and time series modeling. Method Global demand for petroleum products is highly seasonal and is greatest during the winter months, supply of gas, including both production and net imports, also shows a similar seasonal variation. Therefore, the statistical model with seasonal aspect enables to estimate gas prices and sectoral economic indicators. There exist a limited number of works on forecasting natural gas demand. According to Aydinalp-Koksal and Ugursal (2008) and Kavaklioglu et al. (2012), three groups of models have practical relevance: TS (time series), RM (regression model) or ANN (artificial neural network). Demirel et al. (2012) used AR (auto-regressive) and MA (moving average) model with an additional variable (ARMAX) for short-term forecasting of gas demand for Istanbul in Turkey. Akkurt et al. (2010) suggested the application of ARIMA model for the annual forecasting and SARIMA model for monthly forecasting of gas demand. SARIMA or SARIMAX methods consider the presence of seasonal factor in time series. Seasonal autoregressive integrated moving average (SARIMA) can be structured as univariate or multivariate models and takes the following general form SARIMA(p,d,q)(P,D,Q) where the potentially p autoregressive (AR) and q moving average (MA) terms p and q are integers and are called orders of the model. The same for P and Q according to seasonality and the d and D parameters related to difference in model for both non-seasonal and seasonal part, respectively. In this paper, we select this parameter via optimization which leads to minimum AIC and Lags were chosen iteratively based on Box-Jenkins methodology. In estimation process, we use some covariate to identify the best model. All variables were significant at the 5% level. ANNs are analytic techniques modeled on the learning processes of the human cognitive system and the neurological functions of the brain. Multilayered feedforward networks use a supervised learning method and feedforward architecture. A backpropagation neural network is one of the most frequently utilized neural network techniques for classification and prediction. A multilayer perceptron (MLP) is a feedforward artificial neural network model that maps sets of input data onto a set of appropriate outputs. The Levenberg-Marquardt backpropagation algorithm was used to train the ANN model as the learning algorithm. The optimization algorithm was selected as a conjugate gradient algorithm.
61
Session 09 - Commodity pricing
Results In this study, the multilayer perception type of neural network model with different learning algorithms and SARIMAX model were examined. The accuracy of the forecasting methods is compared by using 3 different performance measures. These are root mean squared error (RMSE), mean absolute deviation (MAE), and mean absolute percentage error (MAPE).
Where Yt and Ẏt represent the real and forecast value of natural gas demand (price), respectively. Table 1 provides the average MSE, MAPE, MAE, and RMSE for the data set of the methods.
The results show that our forecast are quite close to real values and the time series models can be perform as well as neural network models. We find that the method of SARMAX can provide approximately well-calibrated prediction in energy demand forecasting. Choosing a density forecasting method however demands careful examination of calibration. Conclusions This study has dealt with one of the most important issues in natural gas demand management, providing better decisions for natural gas prediction in gas market using appropriate quantitative approaches such as SARMAX and neural networks. It has been observed that the time series models help in understanding the way in which energy interactions work. In addition, they enable the planners to predict and plan the future. It has been concluded that the models serve to promote discussion and formulation of policies, which are appropriate to the situation. This research concluded that the neural network model with backpropagation outperforms multiple regression, neural network NeuroShell, the neural network model with the GA, and the SARMAX model for natural gas forecasting. ASRMAX and ANNs with backpropagation models indicated that temperature and the first lag of demand were the most important factors for natural gas prediction. On the other hand, the suggestion made by an ANN with backpropagation model, which had the lowest performance scores in terms of MSE, MAPE, and RMSE, contradicted the SARMAX and ANN with backpropagation models are the best models. As mentioned above, there are various factors that determine annual gas demand, including seasonal variation, temperature and population. The results show that the use of forecasting data improves the performance of prediction techniques.
62
Session 09 - Commodity pricing References Akkurt, M., Demirel, O. F., Zaim, S. (2010) “Forecasting Turkey's natural gas consumption by using time series
methods”, European Journal of Economic and Political Studies, 2: 1-21. Aydinalp-Koksal, M., Ugursal, V. I. (2008) “Comparison of neural network, conditional demand analysis, and
engineering approaches for modeling endues energy consumption in the residential sector”, Applied Energy, 85:271-296.
Demiral, OP., Zaim, S., Çalis Kan, A., Ozuyar, P. (2012) “Forecasting natural gas consumption in Istanbul using neural networks and multivariate time series methods”, Turkish Journal of electrical engineering and computer sciences, 20(5): 695-711.
IEA, 2017. Natural Gas Information, IEA Statistics. International Energy Agency, Paris, France. IGU, 2015. World LNG Report - 2015 Edition, World Gas Conference Edition. International Gas Union, Fornebu,
Norway. Kavaklioglu, K., Ceylan, H., Oztrik, H. K., Canyurt, O. E. (2012) “Modeling and prediction of Turkey's electricity
consumption using artificial neural network”, Energy Conversion and Management, 50, 2719-2727.
63
Session 09 - Commodity pricing
Silvana Stefani, Enrico Moretto, Matteo Parravicini, Simone Cambiaghi, Adeyemy Sonub and Gleda Kutrolli FINANCIAL INSTRUMENTS TO MITIGATE THE RISK OF CLIMATE CHANGE: RAINFALL AND TEMPERATURE
Silvana Stefani , Department of Statistics and Quantitative Methods, Milano-Bicocca University, Milan, Italy, corresponding author, e-mail: [email protected]
Simone Cambiaghi, Adeyemi. Sonubi, Gleda Kutrolli, Matteo Parravicini, Department of Statistics and Quantitative Methods, Milano-Bicocca University, Milan, Italy
Enrico Moretto, Department of Economics, University of Insubria, Varese, Italy
National and international policy initiatives have focused on reducing carbon emissions as a means by which to limit future climate warming. Much less attention has been paid by policymakers to monitoring, modelling and managing the impacts of climate change on the dynamics of Earth surface systems, including glaciers, rivers, mountains and coasts. However, it is almost universally recognized that the risks connected to climatic changes are high and somehow unpredictable in their consequences. Moreover, the attempts of managing the climatic changes at a global level, i.e. the decisions taken in the 2016 Paris conference, have been recently counterbalanced by a not clearcut US policy. Surprisingly, the financial world does not seem to care much about the problem. Yet, it is estimated that 80% of world industry is affected (totally or in part) by climate. In particular, agriculture, building industry and hospitality activities are heavily dependent on climate. Rain or low temperatures may cause cancellations or change of destination for tourists; heavy rain or high temperature damage crops and cause exit of farmers from the market. The present work contributes to the financial and climate literature by proposing a scientific framework for rainfall and temperature risk management using specific financial instruments, the weather contracts. The aim is to mitigate the negative impacts of rain or temperature on the business performance of a company. It has to be noted that those contracts may help in reducing business risk due to not extreme weather changes. For extremely severe or even catastrophical events, insurance contracts are preferable. In this paper we modelled and priced a temperature contract and a rainfall contract. For temperature, as a first step, based on a well-established literature, we proposed a technique for modelling temperature time series. Our data refer to the area of Arezzo, Tuscany, for temperature daily data (1951-2016) and rainfall daily data (1992-2016). Then, we priced two financial instruments (one-month forward) for hedging against high levels of temperature. We priced the contract based on the HDD Index, defined as max ; 0 . HDD reflects the amount of energy to heat a bulding. Then, through the Burn analysis, we proceeded by calculating the payoffs. We included in the pricing the risk loading, which is the protection against risk added to the price, set up by the bank or financial institution issuing the contract (risk loading is obtained here by taking the 5% of the 95° percentile of the payoff distribution). We show how a “negative” weather performance can be counterbalanced by the “positive” performance of the correspondent financial instrument and viceversa.
64
Session 09 - Commodity pricing This can be seen in the annexed tables for two one-month contracts (January and February 2017), with two different thresholds. For January 2017, a gain of 277.28€ results, thereby covering the client from a particularly cold month. On the contrary, February gave a loss, but of course balanced by a positive impact on the crops due to good temperature. A similar analysis has been performed on rainfall and a one month forward was also priced (Tables not shown in this abstract). Those financial instruments, typically Over the Counter, can be personalized and tailored according to the specific needs. This can be done through the pricing of the tick size (one Celsius degree or one rain mm) and the specific weather station close to the client. In our analysis, we have chosen 20€ as a tick size both for temperature and rainfall, but of course building contractors and farmers give a different value to one Celsius degree.
References Barnosky A.D. et al (2012) Approaching a state shift in Earth’s biosphere, doi:10.1038/nature11018 Benth F.E., Jurate Saltyte Bent, (2013) Modeling and pricing in financial markets for weather derivatives,
Advanced Series on Statistical Science & Applied Probability, World Scientific Bhattacharya S., A.Gupta, Koushik Kar and Abena Owusu “Hedging strategies for risk reduction through weather
derivatives in renewable energy markets” doi: 10.1109/ICRERA.2015.7418597 IPCC AR5 (2013), Climate Change 2013: The Physical Science Basis. Contribution of Working Group I to the
Fifth Assessment Report of the Intergovernmental Panel on Climate Change Papazian and Skiadopoulos (2010), Modeling the Dynamics of Temperature with a View to Weather Derivatives,
SSRN-id1517293.pdf
65
Session 10 - Energy and industrial competitiveness
Mario Iannotti THE FOSSIL FUEL SUBSDIES ON ENERGY SECTOR IN ITALY
Mario Iannotti, Energy Advisor at the Italian Ministry of Environment, Land & Sea – Directorate-General
Sustainable Development and Relations with the EU and International Organizations – Environmental Economics Team Member A.T. Sogesid, Via Cristoforo Colombo 44,– CAP. 00154, ROME – ITALY - EU.
e-mail: [email protected] Disclaimer: The views and opinions expressed in this article are those of the author and do not necessarily reflect the official policy or position of any agency of the Italian Government. Overview The attention to environmentally relevant subsidies by the International Institutions, particularly Environmentally Harmful Subsidies (EHS), has grown in time. In the last thirty years, the environmental impacts of subsidies have been the subject of study and research by IGOs (International Governmental Organizations) such as OECD, International Monetary Fund (IMF), World Bank, G20, UNEP, FAO, European Environment Agency. In particular, for the energy harmful subsidies the International Energy Agency (IEA) has created an on line database in order to estimate how many fossil fuel subsidies there are in the energy sector in a significant number of countries. In order to reach the objectives of the Paris Agreement on Climate Change, subscribed by more than 180 countries in the world, the international community recommends “pursuing efforts to limit the temperature increase to 1.5 °C above preindustrial levels” by the end of the century. In relation to the European agreed climate objectives (-20% GHGs by 2020, -40% GHGs by 2030 and -80/95% GHGs to 2050 compared to 1990 levels), would certainly benefit from deleting progressively the Fossil Fuel Subsidies (FFSs) whether direct or indirect. In particular, Italy is analyzing and measuring its FFSs in form of tax expenditures for the energy sector, in order to conserve its economic resources and increase the competitiveness of Italian industry. Method An estimate of the financial impact of a specific subsidy is revealed by the loss of revenue to the respective tax authority. The basic assumption is that, when a subsidy is deleted, the contributory behaviour of individuals will remain unchanged. Essentially, the adopted methodology follows the cost-recovery principle in order to estimate the tax expenditures in the energy sector. Costs for the generation of electricity by a particular type of fuel such as gas, coal, oil, hydro or renewable are calculated by dividing the total cost of the fuel type by the total amount of electricity generated using that source. The economic estimates and financial impact of the tax expenditures have been sourced from Notes to the Accounts of Central-Government Budget, 2016-18 and the Italian Catalogue on Environmentally Harmful and Friendly subsidies. Results The estimated financial impact of FFS on the energy sector, in the form of tax expenditures, for the 2016-18 period accounts for approximately 6.4 € billion per fiscal year. The highest items of expenditure as a percentage of FFSs are: a) 25% - the exemption from excise duty on the use of energy products as fuel for the purpose of air navigation other than private pleasure craft and for instructional flights; b) 21% - the reduction of excise duty on diesel used as fuel for road transport goods and other passenger categories; c) 13% - the tax relief on the use of energy products in agriculture and similar works (livestock, forestry, fish farming and floriculture); d) 10% - free allocation of CO2 emissions trading allowances;
66
Session 10 - Energy and industrial competitiveness e) 7% - the exemption from excise duty on fuel for navigation in Community Marine Waters (including fishing), with the exception of private pleasure craft and the exemption from excise duty for the fuel for navigation in inland waters, limited to the transport of goods and for the dredging of waterways and ports; f) other items - like the tax relief for the service stations or the exemption from excise duty on electricity used in residential homes with power up to 3kWp and monthly consumption up to 150 kWh – account for about 24%. Conclusions Authoritative international organizations, such as the International Monetary Fund, include in the definition of subsidies the external costs of economic activities (cfr. IMF 2014). However, the analysis and the quantification of the implicit subsidies would require a special national monitoring mechanism of the external costs of economic activities, which is currently not available and could be prepared in the near future. Hence, it is recommended to: a) improve the knowledge base in support of spatial impact assessment of each type of aid including, direct subsidies, tax breaks and implicit subsidies associated with the incomplete application of the Polluter Pays Principle; b) FFSs expenditures amount to about 6.4 €billion for 2016, 2017 and 2018. These amounts should be cut progressively and could be used for one of the following targets (or a mix of them): the reduction of income taxation, in particular onjobs generated by green economy; innovation and diffusion of low-carbon technologies and products; financing of sustainable patterns of production and consumption; the revision of the financing of energy production subsidies from renewable sources; increased financing of energy efficiency measures; the reduction of accumulated public debt. References Coady D. P., Parry I., Sears L., Shang B. (2015a), “How Large Are Global Energy Subsidies?”, IMF WP 15/105. D’Alberti M., Giavazzi F., Moliterni A., Polo A., Schivardi F., (2012) “Analisi e raccomandazioni sul tema di
Contributi Pubblici alle Imprese” o Rapporto Giavazzi, Camera dei Deputati. G20 (2015), G20 Country Progress Reports on the G20 Commitment to Rationalize and Phase Out Inefficient
Fossil Fuel Subsidies September 2015. IEA, OCSE (2015), “Update on recent progress in reform of inefficient fossil fuel subsidies that encourage
wasteful consumption” – Contribution by IEA and OECD to the G20 Energy Sustainability Working Group. IEA (2008), “Global fossil fuels subsidies and the impacts of their removal”, Office of Chief Economist,
OECD/IEA. Legge 221/2015, “Disposizioni in materia ambientale per promuovere misure di green economy e per il contenimento dell’uso eccessivo di risorse naturali” o ex “Collegato Ambientale” alla Legge di Stabilità 20141.
Legge 28 dicembre 2015, n.208 o Legge di Stabilità 2016 (commi 645 e 646). Nguyen T.C., Bridle R., Wooders P. (2014) “A Financially Sustainable Power Sector: Developing
Assessment methodologies” International Institute for Sustainable Development Report (IISD). OCSE (2015a), “OECD Companion to the inventory of support measures for fossil fuels 2015”, OECD Publishing
OCSE (2011), “Fossil-fuel Support” OECD Secretariat background report to support the report on “Mobilizing Climate Finance”, OECD Publishing 2.
OCSE (1998), “Improving the environment through reducing subsidies”, OECD, Paris. Senato, A.S. 2112 (2015), “Bilancio di Previsione dello Stato per l’anno finanziario 2016 e bilancio pluriennale
2016- 2018” – Government Regulation. UNFCCC (2015) “Adoption of the Paris Agreement.” Report” No. FCCC/CP/2015/L.9/Rev.1, G20 (2015), G20 Country Progress Report: http://www.g20.utoronto.ca/2015/Summary-of-Progress-Reports-on-
the-Commitment-to-Rationalize-and-Phase-Out-IFFS.pdf OCSE (2015b), “Support to fossil fuels remains high and the time is ripe for change”
http://www.oecd.org/environment/support-to-fossil-fuels-remains-high-and-the-time-is-ripe-for-change.htm UNFCCC (2015) Paris Agreement on Climate Change http://unfccc.int/resource/docs/2015/cop21/eng/l09r01.pdf 2020 The EU climate and Energy package: http://ec.europa.eu/clima/policies/package/index_en.htm (EU Package) 2030 Energy Strategy: http://ec.europa.eu/energy/en/topics/energy-strategy/2030-energy-strategy (EU Framework)
2050 Energy Strategy: https://ec.europa.eu/energy/en/topics/energy-strategy/2050-energy-strategy (EU Roadmap).
67
Session 10 - Energy and industrial competitiveness Manfred Weissenbache and Stefan Montebello THE ENVIRONMENTAL IMPACT OF PHOTOVOLTAIC PANELS IMPORTED FROM CHINA COMPARED TO GERMANY IN A CENTRAL MEDITERRANEAN SETTING
Manfred Weissenbacher, Institute for Sustainable Energy, University of Malta, e-mail: [email protected]
Stefan Montebello, Institute of Earth Systems, University of Malta, e-mail: [email protected]
Overview The objective of this study was to answer the following question: does it make a significant difference from the environmental standpoint if photovoltaic panels produced in China compared to panels produced in Germany are being used in Malta? Such differences may arise from differences in the production efficiency and quality of the input energy mix as well as the required transport energy. The latter may suggest that Asian panels are at a disadvantage when used in Europe due to the long distance between factory and site of panel use. However, seaborne transport is efficient, and studies have suggested, for instance, that New Yorkers would reduce their carbon footprint by drinking wine from Bordeaux rather than wine being trucked from California’s Napa Valley. To be sure, environmental impacts include both, carbon and other greenhouse gas emissions with a global effect as well as release of pollutants with a local or regional effect. In absolute rather than comparative terms, the benefit of any panel traded across borders will be affected by both, the conditions under which the panel is produced and transported as well as the quality of the electricity mix in the country where the panel operates to replace general grid electricity. Methods To investigate the differences of using Asian versus European panels in Malta, we decided to do a case study that compares fairly typical German and Chinese panel makes as found on the local market. We looked up the respective factory locations in Germany and China and attempted to take production plant efficiencies, types of energy inputs, the electricity mixes with their emissions, and representative modes of transport into account. We then calculated the emissions avoided by employing the panels in Malta, based on the local PV output and grid electricity generation mix. Results Results showed that energy payback periods are around two years, roughly equivalent to values found in literature for similar settings, at least if energy used for the production and transport of mounting structures is included- as we did in this study. The results also showed that there is hardly any difference between panels from Europe and from Asia in this respect, because the transport energy is small compared to energy inputs for manufacturing. The carbon dioxide emissions during panel manufacturing are significantly higher in China than in Germany, as the Chinese electricity mix is being dominated by coal, while the German one has much larger shares of non-hydro renewables and natural gas. However, the use of electricity-from-waste leads to higher methane emissions associated with panel manufacturing in Germany compared to China. Pollutant levels associated with transport were small compared to manufacturing for both scenarios, reflecting the required energy inputs. We coined the term emissions recovery period and used this metric to calculate how long panels need to operate in order to replace the emissions generated during their production and transport. Given that the electricity mix in Malta - following a shift from oil to gas in local power generation and the commissioning of an interconnector to Italy- is relatively clean, the emissions recovery period for carbon dioxide is nearly three years for Chinese panels.
Session 10 - Energy and industrial competitiveness
68
The longest emissions recovery period for the investigated pollutants was, however, found for nitrous oxide emissions for Chinese panels, which have to operate in Malta for more than six years to make up for the pollution caused in China. Conclusions The study confirmed that energy used and emissions released during transport are relatively insignificant compared to energy inputs and emissions during the manufacturing phase of photovoltaic panels. The distance between factory and site of panel operation is thus quite irrelevant. However, since most of the energy input in PV panel manufacturing is in form of electricity, the electricity generation mix in the producing country is crucial. In economic terms it may well make sense to produce renewable energy equipment from a fossil energy mix as long as renewable energy remains more expensive, especially if grid integration costs are taken into account while fossil externalities are not adequately internalized. However, if a country with a fossil-dominated energy mix that causes high levels of local air pollution decides to produce renewable energy hardware for export markets, it might well be argued that this is in effect an export of health enjoyed in the importing country at the expense of the exporting country.
69
Session 10 - Energy and industrial competitiveness
Fabrizio Fabbri EU 2030 CLIMATE ENERGY POLICY
Fabrizio Fabbri, Policy Advisor at the European Parliament, Rue Weirtz, 1000, Bruxelles, Belgium e-mail: [email protected]
Abstract Impacts of climate change are not any longer a prospect for the future but a daily realty. The possibility of keeping the temperature raising below 1.5 o C by the end of century is still highly debated while keeping the warming below 2o C could have an higher chance provided concrete mitigation policies are adopted and implemented soon. Though the Paris Agreement has raised hopes, its not binding nature, and the consequent lack of a sanctioning system in place for not compliance, is less then optimal considering the magnitude of the damages impacts of climate change may have. In November 2016 the EU has submitted its national determined contribution as whole (EU NDC) to the UNFCCC committing to cut its emission by at least 40% by 2030 compared to 1990. The European Commission (EC) submitted a package of legislative proposals aimed at setting up emission reduction targets, targets for the promotion of the renewable energy and energy efficiency and to set up regulatory framework (ie Energy Market Directive, Energy Market Regulation, Governance of the Energy Union). The following review will try to picture possible scenario on the final outcome for some of most important legislation proposals that are in their final negotiation stage among co-legislators (ie so called “trilogue”). Some consideration about the consistency among policies and what is needed will be proposed for further discussions.
70
Session 11 - Strategic contribution of energy storage to energy security
Giuseppe Dell’Olio ENERGY STORAGE IN WIND TURBINES: A STRATEGIC CONTRIBUTION TO ENERGY SECURITY
Giuseppe Dell’Olio, Via Val di Sangro, 13 - 00141 Roma; e-mail: [email protected]
Overview One of the main constraints on the wide spreading of renewables is the lack of methods to store energy produced at times when there is little or no demand thereof. Another limitation, less notorious but not less important, is connected to the spreading of PV: namely, the ever increasing lack of mechanical inertia in the electric grids. Wind Turbines (WT) may be able to alleviate both issues at a time: they can store a large amount of energy as kinetic rotational energy, and they can provide a considerable inertia. This is due to the long blades, which have a large momentum of inertia and can therefore store much energy at times of strong wind; and to the ability to withstand large variations in rotational speed. Thanks to these characteristics, WTs are able, if properly operated, to strategically contribute to energy security, by enabling storage of significant amounts of energy. Methods We have chosen a few market WTs, for which data sheets are available. For each WT, we have considered the maximum and the minimum allowable rotational speed, and calculated the corresponding rotational energies. The difference between those energies is the energy that can be stored and, when needed, fed to the grid. Based on the control system governing the blade angle, we have determined, by software simulations, the time needed to transfer the stored energy to the grid, namely the time needed to decrease rotational speed from highest to lowest value. Results We have compared the values yielded by above calculation to prescriptions of ENSO-E and UCTE in the matter of grid support. We have thus found that many WT available on the market qualify to provide such support. Conclusions WTs can be employed to meet the two most important needs of electric grids: storage capacity and rotational inertia. This can be achieved merely by properly operating the WT and specifically by controlling its blade angle. Only minor software modification (control system) are needed, but not hardware.
Energy storage is therefore is a possible, strategic contribution to energy security that can be expected of WTs. It is recommendable that energy storage by means of WTs be considered by international organizations and be addressed in future releases of European Directives, International Standards and Grid Codes.
71
Session 11 - Strategic contribution of energy storage to energy security
MODELLING THE COST OF GAS SUPPLY OUTAGES AND THEIR SUBSTITUTION AS A WAY OF ASSESSING SECURITY OF SUPPLY MEASURES1
Sergio Ascari, Gas Advisor, Florence School of Regulation, European University Institute, Florence Senior Consultant, REF-E, Milan
Overview There is general agreement about the relevance of Security of Supply, notably for natural gas. It is one of the pillars of European energy policy and the subject of a specific EU Directive. Yet, the actual evaluation of whether the benefits of measures aimed at SoS enhancement outweigh their costs, faces significant difficulties. This applies to measures like the expansion of storage sites and inventories, the activation of reverse flows, the construction of redundant supply facilities like pipelines of LNG terminals, and (in part) also to energy efficiency, or the resort to alternative fuels. Methods In principle, the evaluation of costs of infrastructure-related measures is straightforward and can be performed by methodologies that are well known to regulators and companies. On the other hand, the evaluation of the benefits of such measures is far less obvious. In principle, benefits of SoS measures mostly amount to: avoided cost of outages, which in the case of natural gas typically include the purchase of spot
supplies (mostly LNG); the resort to alternative, usually more costly and/or polluting energy sources (electricity, LPG,
fuel oil, coal, fuelwood); only in extreme cases, the outage of energy supply, with companies and people left “in the cold”.
Since outages are largely unpredictable in both size and frequency, the evaluation of benefits is strictly related to that of the probability and duration of the supply crises, as well as of the way such probability is included in the assessment. Results This paper highlights some methodological issues and results that are taken from a wider research project, funded and already published by European Commission (DG Energy). It lists and briefly discusses issues that must be addressed when assessing the benefits of SoS measures, and it suggests simple rule of thumbs for a practical valuation. However, the focus is on the impact of the crises on the costs of alternative energy sources, notably LNG. This focus is justified by the fact that in practice, LNG is the major alternative that is tapped in case of supply crises. Whereas in principle a general energy market model should be employed to assess the role of each alternative, lack of availability at the time of the research and lack of model precision suggest that reliable results can be obtained by more limited tools. Cost-based ranking of substitutes to missing supplies shows that it is unlikely that the role of each alternative can be subject to major changes in the short term. This is even truer after last decade Europe’s gas demand reduction, triggered by energy efficiency improvement, increased availability of renewable energy, industrial reorganization as well as by the development of new infrastructure, fostered by the EU SoS Directive and by the push towards closer interconnection of Europe’s national markets. ____________________________________________ 1 This paper is largely based on a research project entirely supported by a gratefully acknowledged financial contribution from the European Commission, DG Energy. Views expressed in this abstract and paper are those of the author only and do not involve the institutions to which he is affiliated, nor the European Commission.
72
Session 11 - Strategic contribution of energy storage to energy security The main economic feature of the impact of supply crises on the LNG market is the widespread perception that leads to market price hikes well above those that would be justified by the market fundamentals. Experience of crises like the Katrina hurricane, the Ukrainian 2009 transit dispute and the demand surge triggered by the closure of Japan’s nuclear power generation after the Fukushima accident, points to price hikes that are both stronger and longer lasting than justified by the actual market imbalance. This impact is modelled by a simple gas price econometric equation and results are used to assess the costs of a supply crisis as those envisaged in official disruption scenarios that have been considered in the EU. The paper also discusses the other main issues that are involved in the assessment of SoS Measures, with a view to choices faced by researchers undertaking practical studies under limited financial and time resources. The cost of alternative fuels (besides LNG) critically depends on whether current prices are assumed to properly internalize the differential environmental externalities. Sensitivity analysis may offer a reasonable solution to this uncertainty. The same can be said of the cost of actual outages, which are expected to represent a minor impact of the crises, notwithstanding the dramatic experience of some Balkan countries in January 2009. The evaluation could be done by contingent valuation or defensive expenditure techniques. Lacking specific evidence, electricity related studies can be adapted and sensitivity analysis can show how results are affected. The overall damage value is limited as the very small expected quantitative impact outweighs the high unit cost. A far more critical issue is the treatment of probability. Frequency of adverse events is far lower than the overall public perception and may justify a lower focus on SoS issues, yet high public and political interest point to a different status. Researchers may only reconcile crisis evidence and perception by resorting to advanced theories of probability. Overall, the practical assessment of SoS measures is much more an issue of avoiding the purchase of emergency supplies (notably LNG) at panic-inflated market prices than an issue of coping with actual energy supply disruption, even though a few limited cases are frequently mentioned. Yet the more fundamental problem of reconciling science-based evidence and political narratives remains.
73
Session 11 - Strategic contribution of energy storage to energy security
SPOT TRADING PROFITS OF ENERGY STORAGE SYSTEMS IN THE REGION COVERED BY EPEX SPOT
Maria Kaninia, MSc ETH Zürich, IAEE Member Address: Heejiweg 34, Innertkirchen 3862, Switzerland e-mail: [email protected]
Overview Electricity prices in the European market exhibit volatility patterns which are subject to load variation, power injection from renewables and various events such as outages of grid components. Large-scale, grid-connected energy storage systems (ESS) can exploit price differentials to generate revenue, while increasing system stability by buffering fluctuations. In this paper, a mathematical programming model (implemented in Pyomo, an open-source modeling environment) of a generic storage device is used to calculate the potential profit of a merchant storage plant. Day-Ahead Market prices from 2013 to 2016 for France, Germany and Switzerland are taken as input (EPEX SPOT). The model generates the optimal bidding schedule, assuming perfect foresight. Parametric analysis is performed for several technical characteristics of the storage system, such as round-trip efficiency and C-rates. Based on these results, the economic feasibility of large-scale electrochemical storage systems is discussed: The main conclusion is that, even assuming optimistic capital costs, electrochemical electricity storage is not yet viable unless supplemented by alternative revenue streams such as ancillary services or subsidies. Methods A linear mathematical program has been constructed that maximises the profit generated by an idealised ESS participating in the spot market. The model generates the optimal charge/discharge schedule of the ESS, assuming perfect foresight, or alternatively, using the technique of rolling horizon. Pyomo, an open- source modeling environment, was used for building the model (coupled with the GLPK solver). EPEX SPOT electricity prices from the Day-Ahead Market for France, Germany and Switzerland have been downloaded for the time period 2013-2016 and pre-processed to identify basic statistical properties and interface to the model solver. The output data is then post-processed via Python/Numpy for studying the effect of technological parameters on the potential arbitrage revenue. Results Our analysis shows that the potential yearly profit from idealised ESS participating in the spot market is in the range of 10-20 €/kWh (depending on input data assumptions). Sensitivity analysis for certain parameters (charge/discharge rates and round-trip efficiency) indicates the critical value range for these parameters. Conclusions We conclude that, even though large-scale ESS are critical for enabling integration of renewables and increasing the overall robustness of the grid, there is currently no electrochemical storage technology that can be considered economically viable solely by participating in the EPEX SPOT market. Supplementary revenue sources (ancillary services) or subsidies are required to bridge the gap between investment cost and revenue. References [Barbour et al., 2012] Barbour, E., Wilson, I. A. G., Bryden, I. G., McGregor, P. G., Mulheran, P. A., and Hall, P.
J. (2012). Towards an objective method to compare energy storage technologies: development and validation of a model to determine the upper boundary of revenue available from electrical price arbitrage. Energy Environ. Sci., 5:5425–5436.
74
Session 12 - Bioenergies
Himadri Roy Ghatak LIGNOCELLULOSIC BIOREFINERIES AS REPLACEMENT OF FOSSILS
Himadri Roy Ghatak: Department of Chemical Engineering, Sant Longowal Institute of Engineering & Technology, Longowal 148106, Punjab, India,
Overview Since the advent of industrial revolution, the world energy landscape has been overshadowed by the exploitation and utilization of fossils – initially coal and then petroleum. Concern for sustainable development, however, made the humankind rethink and obliged it to course correction. The Plan of Implementation under the 2002 World Summit on Sustainable Development looks to “Promote a sustainable use of biomass”. One of the critical aspects of fossils based energy system that is often overlooked, is that it also provides the organic feedstock that sustains the modern way of living. If we were to replace fossils then the replacement should also be capable of providing organic chemicals that are currently sourced from petroleum. Among all the renewable sources of energy biomass is the only one that can fit into this role. Here lies the role of biorefineries which according to the International Energy Agency “is the sustainable processing of biomass into a spectrum of marketable products and energy”.
Lignocelluloses Early biorefineries were based on starch or sugar containing biomass or oilseeds to primarily produce first generation biofuels – bioethanol and biodiesel. Major exponents in this category are corn in North America and China, sugarcane in Brazil and India, palm oil in Malaysia, and oilseed rape in Germany. However, these establishments run into direct conflict with food production for natural resources and compromises social sustainability.
Lignocelluloses are biomass of vegetative origin having cellulose, and lignin as their main chemical constituents. Carbohydrates other than cellulose are also present. Cellulose is the most abundant organic substance on earth followed by lignin. Both cellulose and lignin are not fit for human consumption as food. Therefore, their utilization as biorefinery feedstock for harnessing energy value and industrial chemicals would not compromise food security. Typical composition of lignocelluloses is; cellulose: 40-55%, lignin: 15-25%, other carbohydrates: 20- 30%. Besides dedicated plantations that could provide lignocelluloses as wood, herbaceous plants, and grasses, lignocellulosic biomass is also available as agricultural residues like different straws, and industrial wastes like bagasse, and saw mill waste. Black liquor from paper mills contain lignin as the main organic constituent.
Thermochemical processing of lignocelluloses Like any other biomass, lignocelluloses can be gasified under combined heat and power mode to generate heat, electricity, and liquid biofuels. Gasification temperature and the amount of oxygen are important parameters. Fast pyrolysis is the preferred mode. A liquid biocrude can be obtained that can subsequently yield liquid biofuels. Hydrothermal liquefaction of lignocelluloses can also produce biocrudes. Black liquor gasification is a commercially established process that expand the scope of paper mill operation.
The primary product of gasification process is the syngas containing carbon monoxide and hydrogen. Liquid hydrocarbons can be synthesized from syngas using Fischer–Tropsch Synthesis. It can also be catalytically transformed into methanol.
Second generation biofuels from lignocelluloses Acid hydrolysis of lignocelluloses depolymerises the carbohydrates into respective monomers. Under mild conditions cellulose remains largely unaltered while the degradation of other carbohydrates yield pentoses and hexoses as resulting monomers. One of them is xylose, a pentose, that can undergo acid catalysed dehydration to produce furfural, an important industrial chemical. Under strong acidic condition cellulose degrades into the constituent monomer glucose.
75
Session 12 - Bioenergies
It can then be transformed into bioethanol, the so called second generation biofuel. The initial acid hydrolysis leaves behind lignin as a solid residue that can either be utilized as a biofuel or converted into value added chemicals. Lignin can be derivatized into several value added chemicals like aromatic aldehydes and ketones, aromatic hydrocarbons, biopolymers, and adhesives.
As an alternative, enzymes can be used to depolymerise cellulose and other carbohydrates into their constituent monomers. However, lignocelluloses are generally difficult to biodegrade compared to starchy biomass. Biotechnological interventions through genetic and metabolic modifications can improve the process efficiencies.
Conclusion Inclusive utilization of biomass to harness both energy and functional organic materials is indispensable for shifting to a sustainable fossils free energy system. In this context lignocellosic biorefineries provide an attractive option as lignocelluloses are abundant and non-food biomass resource. In energy realm, they can provide second generation bioethanol, biocrudes, liquid hydrocarbons, and methanol. In addition important industrial chemicals like furfural, aromatic aldehydes and ketones, aromatic hydrocarbons, biopolymers, and adhesives can be synthesized in these biorefineries.
References de Jong, E. and Jungmeier, G. “Biorefinery Concepts in Comparison to Petrochemical Refineries”, in: Industrial
Biorefineries and White Biotechnology, Elsevier, Netherlands, pp. 5. Dutta, A., Talmadge, M., Hensley, J., Worley, M., Dudgeon, D., Barton, D., Groenendijk, P., Ferrari, D., Stears, B.,
Searcy, E., Wright, C., and Hess, J.R. (2012) “Techno-economics for conversion of lignocellulosic biomass to ethanol by indirect gasification and mixed alcohol synthesis”, Environ. Prog. Sus. En. 31(2): 182-190. Ghatak, H.R. (2011) “Biorefineries from the perspective of sustainability: Feedstocks, products, and processes “, Ren. Sus. En. Rev. 15(1): 4042-4052.
Safari, F., Tavasoli, A., Ataei, A. and Choi, J. (2015) “Hydrogen and syngas production from gasification of lignocellulosic biomass in supercritical water media”, Int. J. Rec. Org. Waste Agri. 4(2): 121-125.
Van Dyk, J.S. and Pletschke, B.I. (2012) “A review of lignocellulose bioconversion using enzymatic hydrolysis
and synergistic cooperation between enzymes—Factors affecting enzymes, conversion and synergy”, Biotechnol.
Adv. 30(6): 1458-1480. Zhao, X., Zi, L., Bai, F., Lin, H., Hao, X., Yue, G. and Ho, N.W.Y. (2012) “Bioethanol from Lignocellulosic
Lorenz Braun, Nuertingen-Geislingen University, Faculty of Agriculture, Economics and Management (FAVM), Neckarsteige 6-10, 72622 Nuertingen, Germany, e-mail: [email protected]
Overview In Europe alone, 17.240 biogas plants were operating as of 2015 [1]. Biogas offers the opportunity for a base load power production independent from weather conditions [2] and, since it can be stored, it can even be used for a production that responds to electricity demand and thus can contribute to energy security [3]. However, the use of the off-heat is pivotal for the economic viability of biogas plants [4]. Specifically, heat prices obtained by biogas plants are important, however, reliable price data have been missing so far. Hence our research question was: “Which prices do biogas plant operators obtain for heat sold to third parties and which variables influence the prices?” Methods In cooperation with the German Biogas Association, we conducted a survey of biogas plant operators in Germany yielding 1,035 price points from 602 respondents (response rate of 22.1%). The data were collected using an online questionnaire which was sent via email with a link, followed by two reminders. In underrepresented federal states a randomized sample of the non-respondents was drawn and contacted via telephone which decreased non response bias regarding the federal states. The high efforts in fieldwork such as the long fielding period of the questionnaire (June 1, 2016 to September 8, 2016), the two reminders and the contacting of potential respondents via telephone increased the overall response rate and decrease non response bias. Results The mean price for the heat sold by biogas plants in our sample to third parties lies at 1.91 EuroCt/kWhtherm on contract level and prices vary widely. If the biogas plant operator owns or operates the heat grid, (>75% of the cases), prices are around 1 EuroCt/kWhtherm higher (highly significant). When selling heat to customers that use it for drying processes, e.g. wood drying (mean: 0.75 EuroCt/kWhtherm), prices are significantly lower than in other applications such as heating residential buildings (mean: 2.79 EuroCt/kWhtherm) or schools (mean: 2.96 EuroCt/kWhtherm). Contracts with a full supply guarantee lead to a highly significant price increase of 1.6 EuroCt/kWhtherm. Macro location economic characteristics such as GDP per capita in the home region of the biogas plant do not affect prices. 43% of all prices were tied to a price index, mostly the oil price index. 49% of the prices were fixed and unexpectedly, these were on average 1.4 EuroCt/kWhtherm lower than variable prices. Conclusions Given the wide variations between prices and the limited influence of single influencing factors, companies and their financiers are advised to enter into pre-negotiations with prospective heat customers in order to determine price levels. Estimations based on mean prices per utilization path or plant size can bear a substantial risk for business plans. Policy makers, when setting subsidies for biogas plant can hardly avoid over-subsidizing those enjoying high heat prices but can get a good overall picture of heat prices from this study.
77
Session 12 - Bioenergies References European Biogas Association. 17240 biogas plants in Europe; 2016. Schuster A, Karellas S, Kakaras E, Spliethoff H. Energetic and economic investigation of Organic Rankine Cycle
applications. Applied Thermal Engineering 2009;29(8/9):1809–17. Herbes C. Marketing of Biomethane. In: Herbes C, Friege C, editors. Marketing Renewable Energy: Concepts,
Business Models and Cases. Cham, Switzerland: Springer; 2017, p. 151–171. Lantz M. The economic performance of combined heat and power from biogas produced from manure in Sweden
– A comparison of different CHP technologies. Applied Energy 2012;98:502–11.
78
Session 12 - Bioenergies Gabin Mantulet, Adrien Bidaud and Silvana Mima ARBITRATIONS FOR BIOENERGY USE IN THE 21st CENTURY ENERGY CONTEXT: THE SIGNIFICANCE OF GASIFICATION AND METHANISATION
Silvana Mima, CNRS researcher, GAEL – CNRS, UPMF - BP 47 - 38040 Grenoble cedex 9, e-mail : [email protected]
Overview In the new energy paradigm promoting greenhouse gases emissions reduction, energy sector has to be decarbonizes. Biomass can play an important role because it is one of low carbon resource that can be stored and is available all year round. Besides, thanks to many sources and process, biomass valorization is varied: electricity, heat, biogas and biofuel. Thus, it can be adapted to different land and time scale, in which networks can be interconnected. Finally yet importantly, considering the entire life cycle, bioenergy coupled with some carbon capture and storage devices can reach negative carbon emission that is key for reaching Paris climate accord’ objectives [5]. We will wonder what will be the trade-offs and arbitrations in the use of bioenergy in the XXIth century energy context. Method Only few research papers address the role of pyrolysis, gasification and methanisation supply chains as independent decarburization options. Our work contribute to analysis these technologies. Indeed, figure 1 represents French industrials assessments for the high potential of these two biogas technologies compared with power to gas. Furthermore, French gas consumption reaches approximately 450TWh in 2015. Therefore, France could become gas self-sufficient in the long term thanks to methanisation (anaerobic digestion and bacterial degradation of organic matter that produce gas) and gasification (thermochemical process producing gas) process [3].
We will use bottom up long-term modeling tool for the energy system POLES (Prospective Outlook on Long-term Energy Systems) to carry out energy scenarios that span across the whole 21st century until 2100.
79
Session 12 - Bioenergies Figure 2 represents the current modeling for bioenergy and the idea is to develop technologies features that is currently lacking because it represents only the final energy use, so that we can determine the contribution of each technology for the decarbonisation of the energy mix. In order to model as best as we could bioenergy, we will focus in a first time on these two technologies in this paper. Their influence will be presented in two scenarios: a baseline that represents current assessments for the future and the other with some carbon constraints named <2°C [1]. In addition and for the first time, we will model in POLES these technologies with the representative links between energy technologies and how the energy produced can be highly valorized, so that we can propose a review for actual and prospective evolution for gasification and methanisation processes.
Figure 2: POLES bioenergy model - Source [1] Results This study will allow us to implement simulations through several scenarios and sensitivity analysis and see how the technologies considered in this study would develop in the future energy mix. We will see the evolution of electricity production, biogas production, CO2 releases, etc. detailed by technology, and if they go along or compete with other energy technologies. So that we should be able to assess the role of each technology for the decarbonisation and draw some conclusions on the futures for biomass valorization into biogas. Conclusions There is no doubt that different technologies of biomass valorization (direct use for heat and electricity, transformation in biogas or biofuel) are becoming more and more important in energy systems, and should therefore appear in long term energy modeling tools. This environment is complex but the capture of interactions and competitions between biomass process and other energy technologies is a clue to better describe the decarbonized energy mix for the future [4]. This study focusing on gasification and methanisation is the beginning for a larger work dealing with all biomass valorization technologies to estimate their role in the decarbonisation and precise even more the complex biomass modelling. Biomass is an important way for local energy independence and can be exchanged on the markets, so that it can be a key resource for world energy security.
80
Session 12 - Bioenergies References [1] Bellevrat E, Menanteau P, “Energy technologies and depletable resource database - Biomass supply curves”,
Mengtech, CNRS GAEL, 2012 [2] GRTgaz – GRDF – TIGF – SPEGNN, « Perspectives gaz naturel et renouvelable », 2016, available online: http://www.grdf.fr/documents/10184/1291504/Perspectives-gaz-naturel-et-renouvelable.pdf/9ef0b81d-5873-469d-
b2ac- 2ba8d42370db [3] IEA, “How to guide for bioenergy, roadmap development and implementation”, 2017, available online: https://www.iea.org/publications/freepublications/publication/technology-roadmap-how2guide-for-bioenergy.html [4] Long H an al., ”Biomass resources and their bioenergy potential estimation: A review”, College of Resources
Science and Technology, Beijing Normal University, available online 25 June 2013 and consulted 15 June 2017.
[5] Ozturka M and al., “Biomass and bioenergy: An overview of the development potential in Turkey and Malaysia”, Center for environmental studies, EGE University, Izmir, Turkey, available online 27 May 2017 and consulted 8 June 2017.
81
Session 12 - Bioenergies
Russell McKenna, Jann Weinand, Katharina Karner, Lorenz Braun and Carsten Herbes SECURING LOCAL ENERGY SUPPLY THROUGH MUNICIPAL ENERGY AUTONOMY: ASSESSING THE FEASABILITY OF INCREASED DISTRICT HEATING FROM GERMAN BIOGAS PLANTS
Russell McKenna, Chair of Energy Economics, Karlsruhe Institute for Technology (KIT),
e-mail: [email protected] Jann Weinand, Chair of Energy Economics, Karlsruhe Institute for Technology (KIT),
e-mail: [email protected] Katharina Karner, Chair of Energy Economics, Karlsruhe Institute for Technology (KIT),
e-mail: [email protected] Lorenz Braun, Nuertingen-Geislingen University, Faculty of Agriculture, Economics and Management (FAVM),
Overview Grid parity of several renewable energy technologies, the recent rapid reduction in the specific investments for battery storage (Nykvist & Nilsson 2015) and the strong trend in community energy make approaches towards energy autonomy increasingly attractive for municipalities. Indeed, many municipalities already cite this as one of their aims when engaging in local and community energy projects (McKenna et al. 2015). However, they define energy autonomy on an annual basis, over the year. This means that they reduce their imports from medium and high voltage electricity networks and contribute less to the overall network costs, and they may benefit from subsidies for their renewable electricity. But the total costs of network fees and renewables’ subsides are shared by all consumers, with exceptions. The marginal effect of one project is clearly small, but thousands of autonomous municipalities could incur substantial additional costs for consumers (Jägemann et al. 2013). Whilst there are clear microeconomic benefits to consumers from increased levels of electrical autonomy (McKenna et al. 2017), the net macroeconomic effect could be detrimental. This contribution analyses the technical and economic feasibility of increasing the fraction of heat employed in district heating systems from biogas plants. Methods We employ a variety of methods in a multi-stage approach. Firstly, the around 11000 biogas plants in Germany are clustered according to their technical and geographical cheracteristics. This analysis is extended to consider the results of an extensive survey of biogas plant operators in Germany, with regard to their heat utilization rates (Herbes & Halbherr 2017). Secondly, the existing energy supply system within these municipalities is analysed and especially the local demand for heat in buildings is calculated. In order to provide a least cost solution, options to integrate the waste heat from the biogas plants into (existing or new) district heating networks are explored. Based on published methods for district heating systems assessment and dimensioning the possible CO2 savings and associated costs are determine for combinations of biogas plants and their nearest residential areas. By focussing on the connections with the lowest CO2-abatement costs, the most environmentally and economically attractive locations for a district heat network development are identified. Finally, we carry out a sensitivity analysis of these results to the key assumptions, and in the context of an outlook we present a method to scale up these results to the national level. In this context, we differentiate between electrical and full energy autonomy, and optimize the energy system based. Results & Conclusions Many biogas plants have additional waste heat that could be integrated into the local energy system at relatively low cost. It is currently not used for several reasons, above all because of little demand in summer and because of insecurity on the future of the plant when the support under the Renewable Energy Act ends after twenty years. Many plant operators are contemplating or have even already decided on a stronger utilization of their waste heat.
82
Session 12 - Bioenergies Hence we conclude that a local security of supply can be achieved for some municipalities through energy autonomy, but at currently relatively high cost and only with substantial backup generation capacities. The in depth analysis of waste heat from biogas plants has identified many locations where a utilization of this waster heat in local residential areas could be achieved with only modest CO2 costs. References Herbes, C., Halbherr, V. (2017): Stärkere Wärmenutzung in Biogasanlagen kann sich lohnen, Biogas Journal, 1,
2017, 68-71. Jägemann, C., Hagspiel, S., Lindenberger, D., 2013. The economic inefficiency of grid parity: The case of German
photovoltaics, EWI Working Paper No 13/19, December 2013 Luthander, R., Widen, J., Nilsson, D., Palm, J. (2015): Photovoltaic self-consumption in buildings: A review,
Applied Energy, 142, 80-94. Mainzer, K., Killinger, S., McKenna, R., Fichtner, W. (2017): Assessment of rooftop photovoltaic potentials at the
urban level using publicly available geodata and image recognition techniques, Solar Energy, 155, 561-573, https://doi.org/10.1016/j.solener.2017.06.065
McKenna, R., Herbes, C., Fichtner, W. (2015): Energieautarkie: Vorschlag einer Arbeitsdefinition als Grundlage für die Bewertung konkreter Projekte und Szenarien, Z Energiewirtsch, 39, 4, DOI 10.1007/s12398-015-0164-1.
McKenna, R., Bertsch, V., Mainzer, K., Fichtner, W. (2016): Combining local preferences with multi-criteria decision analysis and linear optimisation to develop feasible energy concepts in small communities, IIP Working Paper Series in Production and Energy, 16, November 2016,
http://www.iip.kit.edu/downloads/WP16_Nov16.pdf, checked 30.11.2016 McKenna, R., Merkel, E., Fichtner, W. (2017): Energy autonomy in residential buildings: a techno-economic
model-based analysis of the scale effects, Applied Energy, 189, 800-815, http://dx.doi.org/10.1016/j.apenergy.2016.03.062. Nykvist, B., Nilsson, M. (2015): Rapidly falling costs of battery packs for electric vehicles, Nature Climate
Change Letters, 5, 329-332, DOI: 10.1038/NCLIMATE2564 Schmidt et al. (2017): The future cost of electrical energy storage based on experience rates, Nature Energy, 2,
doi:10.1038/nenergy.2017.110
83
Session 13 - The Electricity market: risks and opportunities
Simona Bigerna, Carlo Andrea Bollino, Maria Chiara D’Errico and Paolo Polinori THE IDEAL COMPETITIVE ELECTRICITY MARKET. A SIMULATION MODEL FOR ITALY
Simona Bigerna, Department of Economics, University of Perugia, via A. Pascoli, 20, 60123, Perugia, Italy, [email protected]
Carlo Andrea Bollino, Department of Economics, University of Perugia, via A. Pascoli, 20, 60123, Perugia, Italy, e-mail: [email protected]
Maria Chiara D’Errico, Department of Economics, University of Perugia, via A. Pascoli, 20, 60123, Perugia, Italy, [email protected]
Paolo Polinori, Department of Economics, University of Perugia, via A. Pascoli, 20, 60123, Perugia, Italy, [email protected]
Overview The electricity market reforms of the 80’s and 90’s aimed at establishing a competitive behavior among purchaser and wholesalers, promoting a new general pro-market environment, unleashing new and more efficient technology development in the generation sector, building new awareness and consciousness of consumers. These reforms gradually abandoned the previous organization of vertically integrated monopolists and Government owned companies. The market design assumes that electricity generation can be ranked according to an efficient merit order in implicit auctions. The double auction mechanism was inspired by the idea that set competition in the market would increase the social welfare reducing the final price for consumers. Unfortunately, the first experience of deregulation showed how many organized electricity markets in Europe and USA are affected by anticompetitive behavior, especially on the supply side (Bosco et al., 2012). These markets are characterized by the existence of large generation companies, which established oligopoly conditions, with the exercise of market power as largely studied in the empirical literature (Green and Newebery, 1992; Wolak, 2003; Borenstein et al., 2002; Boffa et al., 2010; Bigerna et al., 2016). Recently, empirical evidence of the existence of oligopsony market power has emerged (Bigerna and Bollino, 2016). Moreover, transmission line congestions prevent the realization of the unique competitive equilibrium during a significant part of the day, as explained in detail in Section 3. The aim of the paper is to provide an empirical comprehensive measurement of the deadweight loss of welfare and the market inefficiency due to the strategic behavior of economic agents in both the market demand and the supply side. To this aim, we develop a comprehensive model of measurement of the discrepancy between the competitive and non-competitive equilibrium caused by firms exercising market power. Methods The strategy we pursue to measure the deviation from the competitive equilibrium and the corresponding welfare loss is the following: first, we develop an empirical measure of the market power of strategic agents, second, we construct a counterfactual market auction, with the aggregate demand and supply curves purged by market power and third we derive the implied theoretical competitive equilibrium. The total welfare loss is computed as the difference between the simulated competitive welfare and the welfare derived from the current market equilibrium. Measuring welfare loss through a market power analysis jointly performed for both supply and demand side is particularly challenging. In a sealed bid price auction the identification of the best strategic response of each agent (the Best Equilibrium Function - BEF) may be unpractical if we do not observe the distribution of all the scheduled bids (Atey and Haie, 2006). Using unit plant bid data allows to overcome this issue and to compare the actual bidding behavior to the theoretical competitive benchmark (Hortacsu and Puller, 2008). Indeed, the first order condition maximizing the expected profit depends on a random component capturing the extent of market power, that is the shift in the probability of the clearing price due to change in the best response conditional on the competitors’ best bids.
84
Session 13 - The Electricity market: risks and opportunities Observing the empirical distribution of all the bids allows to recover this probability distribution, identify the best response for each agent and derive a measure of unilateral market power (Wolak, 2003), which is the Lerner index. In the electricity markets, the Lerner index can be correctly computed when there are transmission congestions, as shown by Bigerna et al. (2016 EJ vol 37 2). Results In this respect, this paper offers three new contribution the literature, First, different from the literature that traditionally uses market aggregated data, we use simultaneously the disaggregated bid hourly data at the individual level for both generators and traders forming the supply and demand curves, respectively. Second, we overcome the usual assumption of the empirical literature on the oligopolistic conditions of electricity markets that relies on maintaining price-taking behavior hypothesis in one side of the market. This paper instead provides a new contribution relaxing this hypothesis and assumes that agents can affect market outcomes on both supply and demand side. Third, this paper estimates and computes the deviation of the equilibrium prices and traded quantities from their competitive values, disentangling the two main components of this gap: the oligopolistic behavior effect on the supply side and the oligopsonistic effect on the demand side. In this way, this paper can show how much of the current welfare would increase if a competitive market structure would be applied in both the supply and the demand side. Conclusions We show that deviations from the competitive welfare are significant and the removing of the oligopsonistic market power performs a major increase in welfare, enlightening how the purchasers’ price-taking hypothesis is not reliable. In addition, we decompose the current welfare in its producers and consumers’ components and simulate how the shares would change if a competitive structure were applied. Both components are significant, confirming the need to undertake the analysis of both market sides.
85
Session 13 - The Electricity market: risks and opportunities
ELECTRICITY GRID EVOLUTION IN EUROPE PRE-ACCESS COUNTRIES: THE TURKISH CASE
Gaia Moretti, LUMSA University – IANUS Consulting and Development Srl,
Overview Energy system has already changed, and Renewable Energy Sources – RES- are playing a central role in the European energy system. COP 21 objectives are focusing on increasing the RES development. A larger scale RES integration in the existing grid together with 3D trend (decentralization-decarbonization and digitalization) are shaping the new face/panorama of the electricity sector. Utilities will play new roles and supply security will depend more and more from an improved flexibility and reliability of the electricity system. The Countries aiming to enter EU system/market are subject to a process of harmonization of targets and rules to be compliant with EU guidelines and strategy that obliges these countries to accelerate their own way of grid modernization in order to keep the EU pace. As a pre-access Country with a large and complex electricity system, Turkey is building its new energy strategy in these months and is an interesting case study of this process and related implications/results. Methods The general targets of the strategy are set via political decision and include the need to assure the necessary supply to fuel the expected growth, the harmonization with EU targets and rules, the compliance with the pledges assumed under COP21. The current state of the system is analyzed under different points of view (institutional, planning and operational processes, regulation, physical infrastructures, potential achievements of current targets…), compared with the compliance to the European system and COP 21 objectives and barrier and challenges to reach the general targets are identified together with proposal of changes necessary to evolve in the right way. The simulation of the future scenarios of Turkish electric system is carried out by measuring the impact of the current and expected RES development, the future objectives and evaluating/assessing the current and future energy trends in generation (especially from RES), transmission and distribution. The changes in structure and duties of TSO, DSOs and public bodies as well as in sector and market regulation is addressed as a central part of the process, as well as the technical rules (grid code) required in order to have a reliable, flexible and secure grid. Results Simulations showed that if Turkey wants to comply with EU’s 2030 targets (27% of final gross energy consumption being supplied from renewable) at least 50% of the electricity dispatch has to be supplied from renewable. This will have consequences at a dispatch and capacity level in 2030, such as approximately 21000 MW of wind resources (14% of the dispatch) and 19000 MW of solar resources (6% of the dispatch). From there onwards, Turkey would be needing an additional contribution of 95 TWh from renewable sources to be added in the following years, period 2030 to 2050. Regulator and government are adopting a consequent strategy that includes actions to balance security of supply with reliability, affordability and cleanliness. The set of changes proposed includes practically all the measures that shape a real modernization of the whole grid including the adoption of storage, microgrids, new planning methods, new roles for DSO, new support policies etc. The Country Strategy has been established specifying horizons and targets harmonized with those of EU The Strategy is based on 4 building blocks: 1. An Energy Plan for the Country based on guideline of EU and supported by an IRS (Integrated
Resources Planning) methodology using a Country Energy Model to be continuously maintained and managed to scrutiny the future scenarios.
86
Session 13 - The Electricity market: risks and opportunities 2. An increased participation of Distributed Generation to the accomplishments of the target and
consequent transformations to the Sector organization: role of DSOs, role of TEDAS, regulatory changes to support this specific kind of penetration, TSO/DSOs relative roles and relations etc.
3. New approach in transmission and Distribution planning based on the principles of Grid Follows: the power system shall be developed in a way that allow to integrate the maximum of renewable resources as per the Energy Plan without limitations due to the physical status of the grid.
4. Regulatory reform based on extensive use of "auctions" and supporting the "smart grid" evolution Conclusions With its hydro and geothermal resources fully developed and with a long-term need of increasing renewable contribution and decreasing CO2 emissions, Turkey faces a huge challenge in terms of security of supply due to its aging thermal fleet which could only be substituted by non-emitting technologies, the only getaways passes through some central points. The first, the implementation of energy efficiency programs in-line with all other European countries so that the long-term demand forecasts are lower in the future, even capable of decreasing demand rather than slowing its growth. The second, not for importance, the adaptation of the legislation and promotion mechanisms to facilitate renewable integration at large and small scale is now critical. The Third, maybe the most important, is the adoption of a modernization plan of the whole system encompassing the large scale integration of renewable and the adoption of storage, micro-grids, new planning methods, new roles for DSO, new support policies: all those measures that shape the landscape of the Electricity Grid of the Future. Finally, the need to address the security of supply challenges jointly with the Climate Change commitments and EU rules/experience are guiding Turkey towards the realization of a New Electricity System where the D3 strategy is completed by a deeper electrification of the energy consumption. References AA.VV., 2017, IPA12CS02 – Development of the Renewable Energy Sector. Task 1A Assessment of the
current situation, barriers and road map, Ankara, MENR - DGRE AA.VV., 2017, IPA12CS02 – Development of the Renewable Energy Sector. Task 1C: Road Map and
Strategy Action Plan, Ankara, MENR – DGRE Melikoglu, M., 2017, Pumped hydroelectric energy storage: Analysing global development and assessing
potential applications in Turkey based on Vision 2023 hydroelectricity wind and solar energy targets, in Renewable and Sustainable Energy Reviews, Volume 72, May, Pages 146-153, Elsevier
Ozturk, I., Acaravci, A., 2010, CO2 emissions, energy consumption and economic growth in Turkey, in Renewable and Sustainable Energy Reviews, Volume 14, Issue 9, December, pages 3220-3225, Elsevier
World Bank Group, 2017, Turkey SME Energy Efficiency Project (P122178), IBRD/IDA http://www.mfa.gov.tr/turkeys-energy-strategy.en.mfa; http://thenewturkey.org/renewable-energy-is-
key-for-turkeys-2023-agenda/
National renewable energy action plan for Turkey – December 2014 DELOITTE EBRD
Session 13 - The Electricity market: risks and opportunities
Alessio Pinzone and Fabrizio Armani THE BLOCKCHAIN CHALLENGE FOR THE ELECTRICITY SYSTEM
Alessio Pinzone, AREA Ridef - Polytechnic University of Milan, Italy, e-mail: [email protected]
Fabrizio Armani, AREA Ridef - Polytechnic University of Milan, Italy
Abstract
A Blockchain is an open digital ledger in which cryptographically signed transaction are stored in blocks further accepted and bonded by the network according to a consensus mechanism. This features allows blockchain to sustain a distributed network in which digital value - in form of cryptocurrency - can be exchanged within participants without a central trusted third part authority checking for double-spending or ledger tampering. Since the very first working implementation represented by the Bitcoin protocol, blockchains have been used as the backbone of the increasing number of new cryptocurrencies but, on the other hand, significant interest and effort have been devoted by enterprise, business and institution has been devoted to exploit blockchain implementation in standard business including finance, insurance, notarization, instruction, medicine and finally electricity system applications. The aim of the speech in the AIEE Energy Symposium, is to present the actual blockchains implemented for the electricity value chain showing the differences between them. Moreover we will describe the distributed nature of blockchain and the development of Distributed Energy Resources. The speech will end showing all issues to the widespread of the blockchain in particular due to the difference between the blockchain pure virtual nature and the physical essence of the electricity system relying on natural monopoly infrastructure and state and country regulation.
88
Session 13 - The Electricity market: risks and opportunities
Carlo Stagnaro, Carlo Amenta and Luciano Lavecchia
MANAGING THE LIBERALIZATION OF ITALY’S RETAIL ELECTRICITY MARKET: A POLICY PROPOSAL Carlo Stagnaro: Ministero dello Sviluppo economico and Istituto Bruno Leoni, e-mail: [email protected]
Carlo Amenta: University of Palermo and Istituto Bruno Leoni, e-mail: [email protected] Luciano Lavecchia: Ministero dello Sviluppo Economico and Istituto Bruno Leoni,
Italy will phase out electricity retail price regulation by July 1st, 2019.
In 2016, about 66% of residential customers were supplied under the so-called “maggior tutela” (or “greater protection”) service. Under the maggior tutela, the customer is supplied by the local DSO, at a regulated price which reflects the costs incurred by Acquirente Unico Spa (single Bbuyer), plus a tariff component set by the energy regulator in order to match the entry cost of an “efficient” new entrant. Acquirente Unico is a state-owned company in charge of buying energy in the wholesale market on behalf of the maggior tutela client base. Of the clients supplied under the maggior tutela, some 80% are supplied by Enel, Italy’s largest utility, which is also state-controlled (Aeegsi 2017a). Despite switching rates in Italy are relatively high, as compared to other EU member states, the market is still highly concentrated (Aeegsi 2017b), reflecting also a sticky consumer behavior which is likely due to maggior tutela, at least to some extent.
The remaining one third of residential customers are supplied by utilities in the “free market”.
The Annual Competition Law, a legislative package which was passed in August 2017, mandates the phase-out of the maggior tutela by July 1st, 2019. It also requires the regulator as well as the Ministry of Economic Development to take steps in order to i) make an assessment of the electricity retail market; ii) guarantee that the transition towards the free market occurs in a way that promotes the engagement of residential customers as well as “a plurality of suppliers and offers in the free market”. Other implementation steps require a price-comparison website to be set up, adequate information to be provided to residential customers, protection of vulnerable households and a “safeguard mechanism” to be set up in order to grant the universal service obligations. This paper aims to: i) perform an analysis of the market conditions; ii) identify potential problems that might emerge during the transition; iii) propose policy measures in order to ensure that the retail market liberalization is consistent with Italy’s policy goals, i.e. promoting innovation and ensuring suppliers do not exercise market power.
Method In order to perform a market analysis, we will follow the structure-conduct-performance paradigm. In doing so we follow the methodology, and replicate the results, pursued by Acer (2016) and Ipa (2015). We focus on such indicators as market concentration indexes, switching rates, customer satisfaction indexes, price dispersion, and others. We take into consideration both the absolute value of such indicators, and their changes over time, in order to identify the potential frictions that might hinder the benefits of full liberalization. The evidence we collect is consistent with the indications from the existing literature (CMA 2015, 2016; Littlechild 2002; Joskow 2008; Crampes and Waddams 2017). We identify three major challenges: i) market concentration; ii) customer engagement; iii) energy poverty. We suggest a consequent policy strategy.
89
Session 13 - The Electricity market: risks and opportunities Results We find that concentration indexes are very high, by and large as a consequence of the “maggior tutela” design. We also find that switching rates are relatively high, although a large share of residential customers has never switched offer or supplier, despite a reasonable degree of commercial innovation and price dispersion (Stagnaro 2017). We find that energy poverty is a relevant issue and the existing policy tools are not an effective means to deal with it (Amenta and Lavecchia 2017). The policy strategy we propose relies on three main axes: i) in order to tackle market concentration, we propose that a transitional cap is placed on the market share of the largest operator, whose market share should fall below 40% in a three- years period; by the end of the period, the former maggior tutela customers who have not yet switched supplier or offer (and who should be supplied under standardized conditions) should be enrolled in a mandatory collective switching program; ii) in order to promote customer engagement, we propose several behavioral measures, including (but not limited to) a large information campaign and the creation of a database with detailed information on “disengaged customers” (i.e. those who have not switched in the previous three years) to be made accessible to electricity retailers; iii) in order to address energy poverty we suggest to adopt a formal definition and measure thereof, as well as a thorough review of existing policy tools, in order to improve them through a comprehensive reform of the current “discount bonuses”. Conclusion The liberalization of Italy’s retail electricity market entails both a challenge and an opportunity. Residential customers may make significant gains, both price-wise and with regard to the nature and quality of the service, but policy-makers should properly address some issues, such as market concentration, customer engagement, and energy poverty. Building upon our market analysis, we propose a policy strategy which aims to kick-off a rapid and most-needed change in the market structure. References ACER (2016), “Annual Report on the Results of Monitoring the Internal Electricity and Gas Markets in 2015. Retail
Markets”. AEEGSI (2017a), “Relazione annuale sullo stato dei servizi e l’attività svolta”. AEEGSI (2017b), “Monitoraggio retail. Aggiornamento del rapporto per gli anni 2014 e 2015”, Rapporto
168/2017/I/com. Amenta, C. and L. Lavecchia (2017), “La povertà energetica delle famiglie”, Energia, 2/2017. CMA (2015), “Energy market investigation. Provisional findings report,” 7 July 2015. CMA (2016), “Energy
market investigation. Final report”, 24 June 2016. Crampes, C. and C. Waddams (2017), “Empowering electricity consumers in retail and wholesale markets.
Project report”, Centre on Regulation in Europe, 9 marzo 2017. IPA (2015), “Ranking the Competitiveness of Retail Electricity and Gas Markets: A proposed methodology”, a
report for Acer, 4 September 2015. Littlechild, S.C. (2002), “Competition in Retail Electricity Supply”, Journal des Économistes et des Études
Humaines, vol.12, no.2, pp.1-26. Stagnaro, C. (2017), “Competition and Innovation in Electricity Retail Markets: Evidence from Italy”, Economic
Affairs, vol.37, no.1, pp.85-101.
90
Session 14 - Technology development - Grid management Alessandro Piacentini BIG DATA AND CLOUD COMPUTING TECHNOLOGIES APPLIED TO THE ENERGY SECTOR: FROM BUZZWORDS TO MARKET OPTIMIZATION THROUGH AN SAAS SOLUTION
Alessandro Piacentini, Dogma Enterprise CEO, e-mail: [email protected] Overview The European and Italian electricity market has undergone a decade of reforms exerting increasing pressure on the energy trade risk management and forcing inevitable change. Recent national and European regulators force management and disclosure of physical and financial data with more frequency, transparency and efficiency. This trend will persist for next years to come, aiming to secure, optimize, and stabilize the financial market and the overall grid management framework. Catching up with the new paradigm shift represents a new challenge for small and medium O&M, wholesale and retail businesses; meanwhile recent advancements in IT (cloud computing, big data) provide real opportunities for trade and risk management platform providers to offer advanced Cloud solution to manage this new data-driven businesses, potentially lowering their enhancement and maintenance IT costs, speeding up and optimizing business and internal processes performances, while enabling small and medium enterprises to perform advanced forecasting and Market, Credit and Operational risk analysis. Academic and private realms, both, invest in research and development to resolve well-known problems. Such is the case of defining forecasting algorithms for renewable production and retail consumption. Sometime the solutions, however, are not easily adaptable to small and medium enterprise processes and IT ecosystems. This is because of the big amount of input data required, expensive computational power needed or missing interconnection with economical, financial or regulatory processes and systems. Engineering and data scientist driven companies offer OTC financial instrument pricing algorithms or market data forecasts to fill the gap of small and medium business need for advanced analytics. Oftentimes, these solutions are lacking easy and cost effective access for the end-client IT platforms. While risk management is often delegated to the secondary back office activity, risk based analysis proves invaluable for systemic stability. For example, market risk and credit risk management help protect the business from market disruptions, operational risk shields from costly frauds, process breaches and miscommunication. Combining new technologies and computational methodologies, together with the massive amounts of data available on the market (live metering or price exchange data) is the optimal way forward to fulfill current and future requirements, by providing automated solutions that significantly reduce operative costs, optimize forecasting processes and guarantee regulatory compliance. Methods Value of data is rapidly growing, and the demand is raising for detailed and timely information spanning large number of sources and formats – structured and unstructured. Traditional data (plant, market or systems) and non-traditional data (weather forecast or maintenance) are both required for end-to-end, producer-to-user, data coverage. As part of a study, modern technology landscape was explored to analyze its full range of capabilities, specifically focusing on evaluation if – and how – there is a way to influence power trade management to raise the bar by supplying normalized data to the end-user in one single place, faster than before, and enabling real-time visualization and advanced analysis. Main dimensions to evaluate the solution were: operational cost reduction, processes optimization, capability extension for market-, credit- and operational-risk management, and regulatory reporting. Key technical concepts taken into consideration are described in the following paragraphs.
91
Session 14 - Technology development - Grid management Hybrid cloud infrastructure enables lower cost solution while offering outstanding system performance and security of client specific transactional data. In such a setup, information can be clustered by type: public or private. Public cloud component can be used to store persistent end-of-day or real-time public data – price exchange, weather and forecast data – standardized and normalized. Private cloud can be used to manage client specific transactional data while maintaining long- term history. Big data framework allows fast processing speed on large volume of data. This capability is important for ensuring timely availability of data – fully integrated and standardized production-to-delivery market, physical and transactional data – for advanced analytics (forecasting algorithms, predictive analytics, proprietary and third-party algorithms, advanced visualization and business intelligence via data mining and machine learning algorithms). Cloud computing further aids data handling speed by allowing parallel calculations. By increasing performance up to 99% (as compared with other technologies) cloud computing also allows real-time analytics, scenario analysis and Monte Carlo based simulations, e.g. Value-at-Risk evaluations. Software as a Service (SaaS) can provide notable advantages for several different reasons. SaaS reduces costs related to installation, maintenance and upgrades. Furthermore, pay-as-you-go models allow businesses to pay for only what they are using and not pay heavily on unused licensing. SaaS saves time via simplified installation and by shifting maintenance responsibilities to the vendor and consequently all systemic impacts – e.g. new regulations. SaaS pay-as-you go model provides fantastic scalability, while web-based use provides an ease of accessibility. If it is used properly, SaaS can help save money, time and human resources. By eliminating issues like software maintenance and incompatibility, SaaS can provide streamlined focus and greater productivity. Open architecture platforms offer third-party providers – e.g. price forecasting specialists – the possibility to automatically include and distribute data to broader audience. It also allows platform users to include third-party tools, such as forecasting algorithms, by leveraging big data and cloud computing, typical to supply users with advanced capabilities. Results Traditionally, enterprise trading and risk management (ETRM) software aims to increase transparency of complex portfolios consisting of physical and financial positions, to increase trader’s productivity, to improve risk management, accounting and settlement activities, and to simplify compliance with regulators. DOGMA, an innovative ETRM platform, is a SaaS (Software-as-a-Service) solution that unites these traditional specifications together with the latest available technology to not only satisfy the basic ETRM requirements but also to provide an additional range of benefits that are especially attractive to small and medium market players to compete with bigger ones, which are already involved in implementing costly in-house solutions requiring then costly IT teams to perform maintenance and upgrade activities over the time. By embracing big data and business intelligence concepts of data collection and standardization within a hybrid cloud-based environment, the platform allows real-time data injection, provides private and public modes of data storage, and equips trading and O&M companies with a single access point to a high quality – proprietary and third-party – real-time commodity asset data (e.g. prices, weather), metering data and computational frameworks. The SaaS solution managed and constantly upgraded by the DOGMA team guarantees compliance with regulatory reporting standards and in addition its extendible open architecture, assures native integration to third-party algorithms. DOGMA ETRM platform benefits to the market are two-fold: firm wide and systemic. Firm-wide benefits of the platform include: operational cost reduction and trading optimization, extended process automation and operational risk management, automated latest regulatory reporting, native integration with statistical tools to analyze and visualize consistent and enormous data,
92
Session 14 - Technology development - Grid management
advanced market analysis capabilities to identify, monitor and simplify market/credit risk mitigation (e.g. P&L, Position Management, VaR), and embedded forecasting tools. Systemic benefits of the DOGMA platform include: power network usage optimization due to the advanced forecasting capabilities, reduced barrier to enter the energy market due to minimal IT investment and maintenance costs, increased market competition and financial liquidity due to the increase in financial transactions, stimulation of new small and medium high-tech businesses providing forecasting algorithms, market price forecasts or financial exotic instruments pricing, reduction of direct and system costs for final users. The future for DOGMA is bright – architecturally designed to cover multiple asset classes (e.g. power, gas, oil, commodities) and geographical locations (e.g. market risk management coverage extensions), the platform offers the possibility to scale horizontally and vertically according to client needs and balancing license costs with business growth. Conclusions Integration of the latest technology into energy sector sounds a promising direction for the future energy savings and market balancing as a whole, statement confirmed by national and international sector studies. DOGMA SaaS platform is capable to solve, or reduce, some of the energy industry problems while reducing operational costs and enabling new market opportunities resulting in company and systemic enhancements within a regulatory compliant framework. Integration of the latest technology into energy sector is a promising direction for the future energy savings and market balancing as a whole.
93
Session 14 - Technology development - Grid management Mario Valentino Romeri CONSIDERING HYDROGEN FUEL CELLS POWERTRAIN AS POWER GENERATION PLANT - 2017 REVIEW.
Overview Worldwide Hydrogen energy vector and Fuel Cells technologies seem to be a Cinderella low-carbon solution in the current energy and transport debate. But in the coming years, hydrogen and fuel cells have the potential to be a disruptive low-carbon solution. The electricity produced by a Hydrogen Fuel Cell can be used both for stationary and transport application and the traditional model to link transport to energy sector is the Vehicle-to-Grid (V2G) approach. I think that it is time to consider the link between the transport sector and the energy sector not only in a V2G approach but in another perspective, more direct, relevant and disruptive. In fact the Hydrogen Fuel Cell Powertrain (H2FCPowertrain) or, in other words, the propulsion system of a FC Vehicle (FCV), is a small power generation plant (typically the H2FCPowertrain size is around 100 kW). In the coming years the high volume associated with the possible FCVs mass production will permit to reduce dramatically the FC system manufacturing costs, in order to be competitive with gasoline in hybrid-electric vehicles. In a mass production perspective, H2FCPowertrain will be so cost competitive to be useful adopted also for stationary power generation application, also in LCOE perspective. Methods The Levelized Costs of Generating Electricity (LCOE) is often cited as a handy tool for the analysis of generation costs and to compare the unit costs and the overall competiveness of different generating technologies. Focus of estimated average LCOE is the entire operating life of the power plants for a given technology. In LCOE model, different cost components are taken into account: capital costs, fuel costs, operations and maintenance costs (O&M), decommissioning costs. The resultant LCOE values, one for each generation option, are the main driver for choice technology. From 2010 I wrote, presented and published different studies where I compared the H2FCPowertrain LCOE, based on the U.S. Department of Energy (DOE) public data, with the traditional power generation technologies LCOE with very promising results, in the U.S. context and in many other contexts around the world. In this review, for the H2 production costs, I used also the International Energy Agency (IEA) data. Results In order to calculate the H2FCPowertrain LCOE it is necessary to know some specific data: system cost and efficiency, expected system lifetime, fuel cost (i.e. H2 production cost). According to my “Hydrogen and Fuel Cell: A Cinderella or a Disruptive Low-Carbon Solution?", based on 2015 DOE public data, I found: Current Status (2014): Overnight cost, 55 USD/kW (at 500k units/year, 66 USD/kW at 100k units/year, 280 USD/kW low volume); 54% System Efficiency; Lifetime, 2500 hours; H2 cost, 3 UDS/Kg-GGE (based on natural gas steam reforming). 2020 Targets: Overnight cost, 40 USD/kW (at 500k units/year); 60% System Efficiency; Lifetime, 5000 hours; H2 cost, 2–4 UDS/kg-GGE. The H2FCPowertrain LCOE, using these data referred to high projected production volume, would be USD 191 for MWh. Using the 2020 targets the LCOE range moved to USD 109-209 for MWh and, for the lower value of this range, it appeared competitive with many of the U.S. power generation technologies analyzed by EIA (the U.S. Energy Information Administration). In 2015, I considered these U.S. H2FCPowertrain LCOE data also in the EU context, having in mind the difference in natural gas prices present in these two areas and considering that, in EU, there are other cheap ways to produce H2 like from: brown coal (with CO2 capture, use and sequestration CCUS), nuclear power and all the situations of electricity overproduction.
94
Session 14 - Technology development - Grid management In 2020 perspective, based on our elaboration of the OECD-IEA-NEA Projected Costs of Generating Electricity 2015 Edition LCOE data, for the lower value of target range (109 USD/MWh) the H2FCPowertrain technology appeared competitive with many of the power generation technologies also considering the three different discount rate (3%, 7% and 10%) used in this OECD-IEA-NEA edition. In this “Considering Hydrogen Fuel Cells Powertrain as Power Generation Plant - 2017 review”, based on 2016 DOE public data, I found: Current Status (2016): Overnight cost, 53 USD/kW (at 500k units/year; 59 USD/kW at 100k units/year; 215 USD/kW low volume); 52% System Efficiency; Lifetime, 4100 hours; H2 cost, 5 UDS/kg-GGE (based on natural gas steam reforming, high volume projection; including: production, delivery & dispensing; in 2014 including only production & delivery). 2020 targets: Overnight cost, 40 USD/kW (at 500k units/year); 60% System Efficiency; Lifetime, 8000 hours (in 2014, 5000 hours); H2 cost, 4 UDS/kg-GGE (with the same assumptions of current status). The H2FCPowertrain LCOE, using these data referred to high projected production volume, would be USD 303 for MWh, using the 2016 data and 206 USD for MWh using the 2020 targets. Considering the fact that current DOE data regarding H2 projected costs including “production, delivery & dispensing” costs and not only the “production & delivery” costs as in the past, I decided to use the IEA H2 production costs presented in two recent publications (2017): “Producing industrial hydrogen from renewable energy” and “Producing ammonia and fertilizers: new opportunities from renewable”. The IEA H2 production costs data-range is 1-4 UDS/kg-GGE and includes both H2 from natural gas steam reforming and H2 from electrolizers (for different electricity costs and load factors). Combining the 2016 DOE fuel cell data and the 2017 IEA H2 production costs data-range (1-4 USD/kg-GGE) the current H2FCPowertrain LCOE value-range would be 72-245 USD/MWh and, for 2020, USD 56-206 USD/MWh. It is interesting to note that these values are mainly due to the H2 production costs data-range that impact for 58-231 USD/MWh in the current data and USD 50-200 USD/MWh in 2020 data. Conclusions In this perspective, the H2FCPowertrain technology appears competitive with many of the power generation technologies and, especially in favorable conditions of H2 production costs, H2FCPowertrain seems to be useful to be adopted also for stationary power generation application. Observing these H2FCPowertrain data it will be necessary to think the FCVs link to energy sector considering also the possibility to utilize H2FCPowertrain as a power generation plant, smart grid connected, with relevant and positive consequences for a rapid development of this disruptive low-carbon solution. In line with the spirit of the Holy Father Francis Encyclical Letter “LAUDATO SI’” and with the new goals of United Nations “Transforming our world: the 2030 Agenda for Sustainable Development”, in 2015 the UNFCCC COP 21 Conference adopted the historic “Paris Agreement” that introduced a new paradigm to a durable global framework to reduce global greenhouse gas emissions. After the 2017 decision of the United States of America to withdraw from the Paris Agreement, in July in Hamburg, the Leaders of the other G20 members stated that the Paris Agreement is irreversible. In this new and irreversible global framework it will be useful well explain the advantage to utilize H2FCPowertrain as power generation plant to all the actors involved in order to offer a new and feasible path to implement the Paris Agreement and to accelerate even more the introduction of this break-through low-carbon solution.
95
Session 14 - Technology development - Grid management References DOE, 2015: “Progress and Accomplishments in Hydrogen and Fuel Cells”,
https://energy.gov/sites/prod/files/2015/08/f26/fcto_progress_and_accomplishments_august_2015.pdf ; DOE, 2016: “Progress and Accomplishments in Hydrogen and Fuel Cells”,
https://energy.gov/sites/prod/files/2017/01/f34/fcto-progress-accomplishments-april-2016.pdf; DOE Hydrogen and Fuel Cells Program Record, 2014: “Fuel Cell System Cost -2014”,
http://www.hydrogen.energy.gov/pdfs/14014_fuel_cell_system_cost_2014.pdf ; DOE Hydrogen and Fuel Cells Program Record, 2016: “Fuel Cell System Cost – 2016”, https://www.hydrogen.energy.gov/pdfs/16020_fuel_cell_system_cost_2016.pdf : DOE Hydrogen and Fuel Cell Technologies Program Record, 2016: “On-Road Fuel Cell Stack Durability –
2016”, https://www.hydrogen.energy.gov/pdfs/16019_fuel_cell_stack_durability_2016.pdf: EIA, 2015: “Levelized Cost and Levelized Avoided Cost of New Generation Resources in the Annual Energy
Outlook 2015”, https://www.eia.gov/outlooks/archive/aeo15/pdf/electricity_generation_2015.pdf : EIA, 2017: “Levelized Cost and Levelized Avoided Cost of New Generation Resources in the Annual Energy
Outlook 2017”, https://www.eia.gov/outlooks/aeo/pdf/electricity_generation.pdf; EIA, 2015: “Assumptions to the Annual Energy Outlook 2015”, https://www.eia.gov/outlooks/archive/aeo15/assumptions/pdf/0554(2015).pdf; EIA, 2017: “Assumptions to the
Annual Energy Outlook 2017” https://www.eia.gov/outlooks/aeo/assumptions/pdf/0554(2017).pdf ; G20 GERMANY 2017: “G20 Leaders´ Declaration Shaping an interconnected world Hamburg, 7/8 July 2017”
https://www.g20.org/gipfeldokumente/G20-leaders-declaration.pdf; Holy Father Francis, 2015: Encyclical Letter “LAUDATO SI’ on Care for Our Common Home”,
http://www.iea.org/newsroom/news/2017/april/producing-industrial-hydrogen-from-renewable-energy.html; IEA, Cédric Philibert, 2017: “Producing ammonia and fertilizers: new opportunities from renewable”, http://www.iea.org/media/news/2017/FertilizermanufacturingRenewables_1605.pdf; M.V. Romeri, 2010: “Considering Hydrogen Fuel Cells Powertrain as Power Generation Plant”, World Electric
Vehicles Symposium EVS 25, Shenzhen, Guangdong, China, World Electric Vehicle Journal Volume 4 (2011), http://www.evs24.org/wevajournal/php/download.php?f= vol4/WEVA4-4131.pdf;
M.V. Romeri, 2011: “Hydrogen Fuel Cell Powertrain Levelized Cost of Electricity”, 30th USAEE/IAEE North American Conference, Washington DC USA, USAEE & IAEE Research Paper Series, http://ssrn.com/abstract=2006758;
M.V. Romeri, 2011: “The Hydrogen Fuel Cell Vehicles Powertrain Roles in the Copenhagen Accord and Cancun Agreement Perspective”, 2011 Fuel Cell Seminar & Exposition, Orlando FL USA, ECS The Electrochemical Society, ECS Transaction, Volume 42 http://ecst.ecsdl.org/content/42/1/59.abstract;
M.V. Romeri, 2012: “Consideration about the Hydrogen Fuel Cell Powertrain LCOE”, 3rd IAEE Asian Conference, Kyoto Japan, http://eneken.ieej.or.jp/3rd_IAEE_Asia/pdf/paper/025p.pdf;
M.V. Romeri, 2012: “Considering Hydrogen Fuel Cells Powertrain as Power Generation Plant in the Copenhagen Accord and Cancun Agreements Perspective”, International Battery, Hybrid and Fuel Cell Electric Vehicle Symposium EVS 26, Los Angeles CA USA, http://toc.proceedings.com/16245webtoc.pdf ;
M.V. Romeri, 2012: “The Hydrogen Fuel Cell Vehicles Powertrain Possible Roles in the Kyoto Protocol Second Commitment Period Perspective in the Pacific Rim Area”, ECS 222nd Meeting “PRIME 2012 Pacific Rim Meeting on Electrochemical and Solid-State Science”, Honolulu HI USA, ECS Transaction 2013, Volume 50, http://ecst.ecsdl.org/content/50/45/75.abstract;
M.V. Romeri, 2013: “Hydrogen Fuel Cell Vehicles Powertrain Possible Future Roles in a Global Perspective”, 36th Annual IAEE International Conference, Daegu Korea,
http://www.iaee2013daegu.org/eng/sub14/sub14_01.asp; M.V. Romeri, 2014 “Fuel Cell Vehicles are Close to Commercialization and it’s Time to Think Hydrogen Fuel
Cell Powertrain as Power Plant. Consideration about Germany, UK and Italy in EU Context” 14th IAEE European Energy Conference, Rome Italy, http://www.iaee2014europe.it/pages/october30.html and
Session 14 - Technology development - Grid management M.V. Romeri, 2014: “Considering Hydrogen Fuel Cell Powertrain as Power Plant in the Three Main Automaker
Asian Countries: South Korea, Japan and China”, 4th IAEE Asian Conference, Beijing China, http://iaeeasia.csp.escience.cn/dct/page/70056 and
http://www.iaee.org/en/publications/proceedingssearch.aspx (Author: Romeri); M.V. Romeri, 2015: “Hydrogen and Fuel Cell: A Cinderella or a Disruptive Low-Carbon Solution?”, 2015 Fuel
Cell Seminar & Energy Exposition, Los Angeles CA, USA, ECS Transaction 2016, Vo. 71 http://ecst.ecsdl.org/content/71/1/227.abstract;
United Nations Framework Convention on Climate Change UNFCCC COP 21, 2015: “Adoption of the Paris Agreement. Proposal by the President”, http://unfccc.int/documentation/documents/advanced_search/items/6911.php?priref=600008831;
United Nations, Resolution adopted by the General Assembly on 25 September 2015: “Transforming our world: the 2030 Agenda for Sustainable Development”,
Session 14 - Technology development - Grid management
Manolis Souliotis and Spiros Papaefthimiou SUSTAINABILITY ASSESSMENT OF HYBRID PHOTOVOLTAIC/THERMAL (PV/T) TECHNOLOGIES
Manolis Souliotis, School of Production Engineering and Management, Technical University of Crete, Chania, Greece, Department of Mechanical Engineering, University of Western Macedonia, Kozani, Greece
[email protected] Spiros Papaefthimiou, Department of Environmental Engineering, University of Western Macedonia, Kozani,
Greece, e-mail: [email protected] Abstract The present work presents the application of Life Cycle Assessment (LCA) based methodology for the holistic evaluation of Photovoltaic-Thermal (PV/T) technologies. The paper examines the environmental impacts throughout the life cycle of typical systems based to these technologies and analyzes the energy output and the anticipated costs during the expected life time operation period. For that purpose selected cases have been studied through a sustainability concept, i.e. focusing on their environment–energy–society oriented outcomes. Thus combined LCA and energy – cost analyses of PV/T systems are presented, investigating in detail the production, transportation, installation and use phases of the specified systems. The aim of this study is to provide to the researchers a useful guide for the combined applicability of the LCA and energy–cost analysis methods to such technologies and to present an extended analysis of the advantages and disadvantages of these technologies for simultaneous production of electricity and heat.
98
Session 15 - Scenarios and forecasting methodologies
Simone D’Alessandro 2METE: AN ECOLOGICAL MACROECONOMIC MODEL FOR ENERGY TRANSITION. ALTERNATIVE SCENARIOS TOWARDS ECOLOGICAL SUSTAINABILITY AND SOCIAL EQUITY
Simone D’Alessandro, Department of Economics and Management, University of Pisa, e-mail: [email protected]
Overview In recent years, international research has produced several studies that show how excessive emissions and constant environmental degradation require a significant revision of energy strategies and a consequent transformation of the societal system (Victor, 2008; Jackson, 2009; Martínez-Alier et al., 2010; Kallis et al., 2012). This paper presents an application of the 2METE model to Italy which has been developed to provide a concrete understanding of some important policy challenges associated with the transition to a ecologically sustainable and socially equitable society. The model aims to test, in a formal setting, the effectiveness and coherence of energy transition policies to achieve a reduction of 80% in carbon emissions by mid-century with respect to the 1990 level. The analysis addresses a series of challenges for attaining the overall goal of sustainable prosperity, namely full employment, low inequality, fiscal sustainability, and a sustainable energy system. In particular, we analyze how the implementation of low-carbon policies is likely to impact upon current trends toward industrial automation and technological unemployment. Thus, the model is an attempt to evaluate the systemic interactions between energy policies and socio-economic system, by taking into account the co-evolution between environmental, economic and social variables. The main objective of this study is twofold: i) to propose a model that can assess the impact of current proposals (e.g. SEN, 2017) on key macroeconomic and social variables (and vice versa), and ii) to analyze whether policies that tend to increase equity may be complementary to environmental and energy policies. Methods This paper contributes to the literature of Ecological Macroeconomics (Jackson, 2009; Rezai et al., 2013) which is characterized by three themes: i) the need to manage a non-growing economy, ii) the understanding of the dependence of macroeconomic processes on the environment, iii) the contamination between post-Keynesian macroeconomics and ecological economics (for a recent survey, see Hardt and O’Neill, 2017). The model we propose takes account of these three aspects and integrates the analysis of ecological macroeconomics through the formalization of some relationships that do not find a coherent treatment in it (i.e. local and social economy sector, population ageing, labor market institutions, multiplicity of energy sources). The model shares the system dynamics approach of ecological macroeconomic models, such as Jackson and Victor (2015), and Bernardo and D’Alessandro (2016). System dynamics is a suitable tool for the analysis of complex systems. It has a high degree of flexibility and provides a graphical structure which facilitates the identification of feedback mechanisms (Costanza et al. 1993; Costanza and Ruth 1998). This method is particularly suitable for the analysis of alternative scenarios, through simulations of the effects of policy implementation. Hence, the paper compares three scenarios for the period 2010-2050. 1. The “Business as Usual” scenario represents the impact of actual policies on a range of
environmental, social and economic variables. This is useful as reference scenario and for the calibration of the model using PRIMES/EUCO predictions.
2. The “Green Growth” scenario represents the impact of policies that promote economic growth and green investments, through an increase of energy efficiency and labor productivity, and the development of renewable energy sources.
3. The “Degrowth” scenario represents the impact of policies that primarily tend to reduce energy consumption and inequalities.
99
Session 15 - Scenarios and forecasting methodologies
Results We found that energy policies inspired by green growth in the current phase of innovation and automation (Industry 4.0) are likely to generate an increase in unemployment, job polarization and income inequality. Moreover, economic growth and inequality increase can constitute a roadblock to the achievement of environmental targets. On the contrary, the introduction of social policies that tend to increase equity and support employment can help to achieve the environmental target. However, many tradeoffs between economic, social and environmental indicators emerge. References Bernardo, G., D’Alessandro, S., 2016. Systems-dynamic analysis of employment and inequality impacts of low-
carbon investments. Environmental Innovation and Societal Transitions, 21: 123-144. Costanza, R., I. Kubiszewski, E. Giovannini, H. Lovins, J. McGlade, K. Pickett, K. Ragnarsdottir, D. Roberts, R.
D. Vogli, and R. Wilkinson (2014). Time to leave gdp behind. Nature, 505: 283-285. Costanza, R. and M. Ruth (1998). Using dynamic model to scope environmental problems and build consensus.
Environmental Management, 22(2): 183-195. Hardt, L. and D. W. O’Neill (2017). Ecological macroeconomic models: Assessing current developments.
Ecological Economics, 134: 198–211. Jackson, T., 2009. Prosperity Without Growth: Economics for a Finite Planet. Earthscan, London. Jackson, T., Victor, P., 2015. Towards a Stock-Flow Consistent Ecological Macroeconomics: An Overview of the
FALSTAFF Framework with Some Illustrative Results. UNEP Inquiry into the Design of a Sustainable Financial System. Working Paper No. 15/04.
Kallis, G., C. Kerschner, and J. Martinez-Alier (2012). The economics of degrowth. Ecological Economics 84: 172-180.
Martínez-Alier, J., U. Pascual, F.-D. Vivien, and E. Zaccai (2010). Sustainable de-growth: Mapping the context, criticisms and future prospects of an emergent paradigm. Ecological Economics, 69(9): 1741-1747.
Ministero dello Sviluppo Economico (2017). Strategia Energetica Nazionale 2017. Audizione Parlamentare. Røpke, I., 2016. Complementary system perspectives in ecological macroeconomics – the example of transition
investments during the crisis. Ecological Economics, 121:237-245. Victor, P.A., 2008. Managing Without Growth: Slower by Design, Not Disaster. Edward Elgar, Cheltenham.
100
Session 15 - Scenarios and forecasting methodologies Manfred Hafner ENERGY WORLD IN 2040: A SCENARIO APPROACH
Manfred Hafner, Vice-President, Enerdata, e-mail: [email protected] Overview The energy world is in rapid evolution driven in particular by policy developments but also economic, geopolitical, technological as well as social considerations. Enerdata regularly produces scenario based energy outlooks to analyze and forecast the supply & demand of energy commodities, energy prices, as well as the impact of climate change and energy policies on energy markets and their consequences for the energy industry. After the Paris and Marrakesh COPs, Enerdata has again done such an exercise. The Ener-Blue scenario provides an outlook of energy systems up to 2040 based on the achievement of the 2030 targets defined in the INDCs as announced at the COP-21. Ener-Green explores the implications of more stringent energy and climate policies to limit the global temperature increase at around 1.5-2°C by the end of the century. Finally, Ener-Brown describes a world with durably low fossil fuel energy prices, affecting the entire energy system over a long period. These different scenarios explore the consequences on energy supply and demand, energy mix, energy prices by fuel and region, as well as the implications on climate issues. Methods Scenarios have been modeled with the use of the POLES (Prospective Outlook on Long-term Energy Systems) model, which is a recognized world energy-economy partial equilibrium simulation model of the energy sector providing for a complete modeling from upstream production down to final user demand and GHG emissions, disaggregation into 15 energy demand sectors and over 40 technologies, and producing forecasts of full energy balances, emissions and prices for 66 countries/regions as well as Marginal Abatement Cost Curves (MACCs). The Poles model is also used by the JRC of the European Commission and Poles scenarios are used by several governments and energy companies for their energy planning. Results In the Ener-Blue scenario, the future energy mix remains dominated by fossil fuels, but INDCs planned policies regarding climate mitigation, energy efficiency and renewable energy sources lead to a diversification towards other sources of energy. Among others, the EU successfully achieves its triple objective of its climate and energy package, while China and India expand their renewable capacities to achieve their renewable targets. Within this international context of climate coordinated policies, CO2 emission growth slows down. However, the efforts defined in INDCs are not ambitious enough to limit the increase of the average global temperature to 2°C in 2050, but these efforts are compatible with 3-4°C objective. In the Ener-Green scenario, there is a clear transition from the current energy system towards a long-term decarbonisation, with substantial efforts on energy efficiency, initiatives to phase out fossil fuel subsidies and a real emergence of renewable energy technologies. This is achieved through ambitious policies both at the national and international level and through strict carbon constraints. Deployment of low-carbon technologies plays a key role, supported by significant R&D efforts to reduce their cost and improve their performance. In the power sector, RES become the main source of electricity generation around 2040; there is a growing adaptation of cleaner coal technologies and a wide-scale of deployment of CCS. Nuclear turns to be an attractive option. The agreements at the COP21 are implemented, governments commit to returning to the negotiating table and revise their emissions goal every five years. This new “green deal” leads to a reduction factor of 2 of world emissions by 2050. In the Ener-Brown scenario, OPEC output continues to rise to maintain its market share while the unconventional oil and gas boom in North America carries on and gets exported to other world regions (China, Argentina…). With less tensions, oil and gas prices are expected to remain week: prices slowly recover from present collapse, but remain well below the last decades highs.
101
Session 15 - Scenarios and forecasting methodologies Confirmed energy commitments in some regions as well as technological innovation foster a significant development of low energy intensive processes and technologies. Renewables achieve a substantial deployment but affordable fossil fuels still remain a competitive and attractive source of energy. Without a global agreement, non coordinated policies result in soaring CO2 emissions across the world, towards +5-6°C temperature increase by the end of the century. Conclusions The presentation will present in detail some results related to the Ener-Blue scenario (INDCs), its impacts on different energy sources and geographical regions, as well as its challenges in implementation. It will also show what additional commitments are needed to move from the Ener-Blue to the Ener-Green (2°C) scenario, and it will present the consequences of a scenario (Ener-Brown) where - due to an abundance of cheap hydrocarbon resources and lesser climate commitments by some key-countries – fossil fuels continue to be used large scale, even though in parallel important efforts are done as far as sustainable development is concerned.
102
Session 15 - Scenarios and forecasting methodologies
Arne Vogler, Christian Pape, Oliver Woll and Christoph Weber
FORECASTING THE DISTRIBUTIONS OF HOURLY ELECTRICITY SPOT PRICES
Arne Vogler, House of Energy Markets and Finance, University of Duisburg-Essen, Universitätsstr. 12, 45141 Essen, Germany, e-mail: [email protected]
Christian Pape, Commercial Analyst, innogy SE and Ph. D. Student, House of Energy Markets and Finance, Gildehofstraße 1, 45127 Essen, Germany, e-mail: [email protected]
Oliver Woll, Centre of European Economic Research (ZEW), Competition and Regulation, 68161 Mannheim, Germany, e-mail: [email protected]
Christoph Weber, House of Energy Markets and Finance, University of Duisburg-Essen, Universitätsstr. 12, 45141 Essen, Germany, e-mail:[email protected]
Overview We present a stochastic modelling approach to describe the dynamics of hourly electricity prices. The suggested methodology is a stepwise combination of several mathematical operations to adequately characterize the distribution of electricity spot prices. The basic idea is to analyze day-ahead prices as panel of 24 cross-sectional hours and to identify principal components of hourly prices to account for the cross correlation between hours. Moreover, non-normality of residuals is addressed by performing a normal quantile transformation and specifying appropriate stochastic processes for time series before fit. We highlight the importance of adequate distributional forecasts and present a framework to evaluate the distribution forecast accuracy. The application to German electricity prices 2015 reveal that: (i) An autoregressive specification of the stochastic component delivers the best distribution but not always the best point forecasting results. (ii) Only a complete evaluation of point, interval and density forecasts, including formal statistical tests, can ensure a correct model choice. Method We present an econometric-stochastic approach focusing on explaining factors influencing hourly electricity prices and joint disturbances. Here, electricity prices are analyzed separately for single hours treated as a panel of 24 daily time-series. In order to characterize distributions adequately, we suggest a combination of several mathematical approaches. The estimation and simulation procedure includes the following steps, whereby step (i), (ii), (v) and (vi) are adjustable depending on the application: i) Treat the time series of spot prices as panel of different individual hours; ii) Determine the main deterministic influences and the residuals; iii) Map the residuals’ empirical distribution to a normal distribution; iv) Identify the common factors of hourly prices; v) Model lagged effects of price level and price volatility; vi) Use a rolling window technique to estimate and simulate; vii) We thus characterize the distributions of hourly electricity prices for day t as the empirical
distribution functions of a Monte Carlo prediction samples.
We assess the point forecast quality using the Mean Average Error and the Root Mean Square Error, as both measures are robust to adverse effects of prices close to zero. If every hour of a day is modeled separately, it is important to avoid unrealistic jagged forms of individual price paths over the 24 hours of a day. To measure the smoothness of the simulated price paths, we suggest to investigate the spot price variation of every day until the end of the simulation period and over each simulation path of the total number of simulations. This leads to our so-called smoothness indicator. Generally, point forecast error measures do not contain information about the distance between the observations and individual simulation paths and fail to provide information on the quality of probabilistic forecasts. To evaluate the distribution forecast quality, we investigate the complete distribution forecast rather than a restricted number of quintiles of said forecast.
103
Session 15 - Scenarios and forecasting methodologies To evaluate the distribution forecasts of the presented methodology, we use histograms and the formal test by Knüppel (2015) to assess calibration and the Continuous Ranked Probability Score (CRPS) with the associated Diebold-Mariano-type test to select the superior distribution forecast among the forecasts that fulfil the necessary condition of calibrated forecasts (Gneiting and Katzfuss 2014). Results In the application, we consider the results for hourly electricity spot prices in Germany for the year 2015. The various specifications of the proposed methodology work accurately and exhibit statistical behavior that is close to the actual data. Yet, one has to note that extreme prices are not well replicated and that all specifications underestimate the kurtosis of actual prices. It is important to adequately account for cross-correlation between the hours under the considered panel approach in order to generate smooth price paths. We find that accounting for cross-correlation patterns through a Principal Component Analysis (PCA) substantially improves the smoothness of the simulated price paths. Additionally, allowing for conditional heteroscedasticity through GARCH-effects leads to a smoothness indicator that is nearly identical to that of the actual prices series. The evaluation of probabilistic forecast ability uncovers that accounting for conditional heteroscedasticity does not provide reliable distribution forecasts. Yet, an AR(2) specification without PCA or with PCA produces reliable forecasts. Thus, we conclude that our presented econometric-stochastic approach delivers distribution forecasts that coincide with the actual price distribution in the vast majority of hours. Conclusions Forecasting electricity spot prices has to address different issues: (1) Handle the idiosyncratic influences on electricity prices, (2) capture the main characteristics of prices dynamics, (3) deliver not only point forecasts but also distribution forecasts and (4) establish an estimation and simulation procedure that keeps time and effort small. Therefore, our paper presents an approach that improves day-ahead electricity price distribution forecasting by accounting for cross correlation patterns between individual hours. In a stepwise procedure of testing point, interval and distribution forecast accuracy, it is shown that our approach is able to capture the main characteristics of hourly electricity prices and produces reliable point, interval and distribution forecasts for decision support. Among the considered specifications, we find little variation in point forecasting ability. Yet, we argue that an investigation of point forecasts only is not sufficient to consider a particular model to be superior. The same is true for interval forecasts. Rather, an evaluation of distribution forecast ability is required to assess a forecasting model fully. Consequently, only additional tests for calibration and the consideration of the CRPS and associated tests facilitate said evaluation. The specifications accounting for conditional heteroscedasticity do not provide reliable distribution forecasts, despite possessing good point forecasts. It is shown that an AR(2) specification without PCA or with PCA produces reliable distribution forecasts while the specification with PCA yields smoother simulation paths. Our method is flexible in the sense that it can be combined with different point-forecasting approaches for electricity prices and that it can be easily applied to different data exhibiting within-day correlation structures like electricity, e. g. electricity load or heating demand. References
HuiBin Du, TianJin University, e-mail: [email protected] Overview With the development of production fragmentation within China, different regions are specializing in certain production stages in the production network and linked with each other through different types of trade patterns which also contribute the carbon emissions of China. This paper employs multi-regional input-output method to calculate carbon transfer within China through three types interregional trade including final goods, intermediate goods and value chain, and then estimates the impacts of international trade on regional and national emissions. The reminder of this paper is as follows: Section 2 introduces the methodology and data materials, and the main results of embodied emissions in inter-regional trade and the global and national environmental effects of different trade patterns are presented in Section 3. Section 4 purposes the major conclusion and policy implications. Methods Multi-regional input-output method. Results First, there is a great difference in the decompositions of each region’s carbon emission, which is highly related to their positions in value chain and the structure of industry. Second, in general, developed and coastal regions are net carbon importers, while developing and inland regions are net exporters, while the contributes of each trade patterns of regions on carbon transfer are different. Third, the inter-regional trade contributes to a decrease in carbon emissions of China by 15.6 million tons, while domestic value chain related trade increases the carbon emissions by 202.5 million tons. Conclusions To moderate the growth of carbon emissions of China and to achieve the carbon reduction targets in 2020, we should focus on adjusting the patterns of trade in some key regions like adding the ratio of final goods trade and decreasing that of intermediate goods trade and value goods trade. Meanwhile, adjusting the structure of trade also helps the carbon reduction, such as reducing the ratio of no metal and metal products and energy products of the trade in Hebei which contributes great to the BAE. In a word, if the carbon intensity of industrial sectors in less developed regions could be reduced and trade patterns and trade structures could be adjusted, the carbon emissions induced by inter-regional trade of China will be fell. References Dietzenbacher, E., Pei, J., Yang, C., 2012. Trade, production fragmentation, and China's carbon dioxide emissions. Journal of
Environmental Economics & Management 64, 88-101. Feng, K., Davis, S.J., Sun, L., Li, X., Guan, D., Liu, W., Liu, Z., Hubacek, K., 2013. Outsourcing CO2 within China.
Proceedings of the National Academy of Sciences of the United States of America 110, 11654-11659. Liu Z, Davis S J, Feng K, et al. Targeted opportunities to address the climate-trade dilemma in China. Nature Climate
Change, 2015. Arnold, T., Arjan, D.K., Richard, W., Stephan, M., Bouwmeester, M.C., 2012. Price corrected domestic technology
assumption--a method to assess pollution embodied in trade using primary official statistics only. With a case on CO2 emissions embodied in imports to Europe. Environmental Science & Technology 47, 1775- 1783.
Qi, Y., Li, H., Wu, T., 2013. Interpreting China's carbon flows. Proceedings of the National Academy of Sciences 110, 11221-11222.
105
Session 16 - Climate policy and emission trading
António Cardoso Marques, José Alberto Fuinhas and Patrícia Hipólito Leal ECONOMIC GROWTH, CO2 EMISSIONS, FOSSIL FUELS CONSUMPTION AND RENEWABLE ENERGY CONSUMPTION IN AUSTRALIA
António Cardoso Marques, NECE-UBI, University of Beira Interior, e-mail [email protected] José Alberto Fuinhas, NECE-UBI, University of Beira Interior, e-mail [email protected]
Patrícia Hipólito Leal, University of Beira Interior, e-mail [email protected] Overview Australia is the sixth largest country in the world. This year celebrate your twenty-sixth consecutive year without resection. It is one of the ten largest emitters of greenhouse gases, mainly caused by the energy use. Moreover, they have a endogenous potential on energy sources, which includes coal and oil. Regarding the gross final energy consumption, it is mainly satisfied by the use of the oil products. Concerning the renewable energy, the country has extensive resources of solar and wind (IEA, 2012). The trade-off between economic growth and energy consumption raises several questions: (i) what is the impact of fossil fuels on the economic growth?; (ii) what is the impact of renewable energy on the economic growth?, and (iii) what is the impact of the economic growth and energy consumptions on the environment? The literature has been studied these questions with different emphases, depending on the country in which is applied (Ito, 2017; Narayan & Narayan, 2010). However, the empirical evidence for the Australia remains scarce, which leads to the main aim of this research. This research intends to study the energy-growth nexus and the effects of energy consumption on environmental, in Australia. In fact, it is important to examine this questions in a country that not have resection during several consecutive years, and economic growth with an increasing tendency. Methods This paper uses annual data comprising a time span from 1965 to 2015 for Australia. The variables used are: Gross Domestic Product, in constant local current unit (LCU) (GDP_LCU); Renewable Energy Sources consumption, in millions of tonnes of oil equivalent (RES); intensity of CO2 emissions on economy, in millions of tonnes (CO2), ratio between the CO2 emissions and the primary energy consumption; Percentage of Oil in Primary Energy Consumption, in tonnes (OIL) and share of Coal in the Primary Energy Consumption, in millions of tonnes of oil equivalent (COAL). The data has been retrieved from the World Development Indicators and BP Statistical Review of World Energy 2016 The suspicion that the variables could be endogenous makes suitable the use the Autoregressive distributed lag (ARDL) model, proposed by Pesaran, Shin, & Smith, (2001). The ARDL model characteristics allow its application with a small number of observations, and the correction of outliers through dummies without affecting the efficiency of the results. Being that all variables are integrated of order one, but exists variables that are fractionally integrated, it was not compromised the use of the ARDL. The ARDL bounds proposed by Pesaran et al. (2001) was also performed. Their null hypothesis is that variables are not cointegrated. Five models were estimated, namely (i) Model – I, economic growth; (ii) Model – II, oil consumption; (iii) Model – III, coal consumption; (iv) Model – IV, intensity of CO2 emissions; (v) Model – IV, renewable energy consumption. The quality of the estimation was checked to reduce the likelihood of the skewed results. The residual diagnostic tests were performed, namely LM Breusch-Godfrey test, ARCH test, Jarque-Bera test to certify that the residuals not have a serial correlation, heteroskedastic errors, and they have a normal distribution. Moreover, the stability tests were performed, namely, Ramsey RESET test and CUSUM and CUSUM of squares, and they prove that the model is well specified and stable.
106
Session 16 - Climate policy and emission trading
Results The results of the model I – economic growth show that both the intensity of CO2 emissions and the renewable energy has a negative impact on the economic growth. On the one hand, the result of the intensity of CO2 emissions could be explained by the reduction of energy consumption through the restrictive consumption policies. On the other hand, the impact of renewable energy consumption could reveal the high investment costs required by the renewable energy deployment. The models of fossil fuels consumption reveal great consistency, and they highlight the substitution effect between all the fossil fuels sources. The economic growth does not increase the fossil fuels consumption. In fact, this result is in accordance with the goals of a sustainable development, and with the restrictive fossil fuels consumption policies. However, the CO2 intensity and the renewable energy have a positive effect on the fossil fuels consumption. In accordance with the former results, the fossil fuels, which are controllable sources, are playing a backup role. That backup capacity allows accommodate additional intermittent renewable. Please note that, given that the paper considered primary energy consumption and not only electricity, then the observed effect could also be explained by the transport sector, which remain high intensive on fossil fuels consumption. Regarding the model IV - CO2
intensity, only the renewable energy has a negative impact. Indeed, the literature supports that RES is the solution to mitigate the climate effects of energy consumption. The results of the model of the renewable energy consumption are supporting the negative impact of the CO2 intensity, which is in line with the others obtained results.
Figure 1: Main results from ARDL models ________________________________________________________________________________
Conclusions This study analyzes the relationship between fossil fuels consumption, renewable energy consumption, gross domestic product and CO2 intensity. In Australia are confirmed the feedback hypothesis between economic growth and both oil consumption and renewable energy consumption. Furthermore, the conservation hypothesis is supported by economic growth and coal consumption. Concerning the relationship between economic growth and CO2 intensity, the results are an entirely different.
107
Session 16 - Climate policy and emission trading Session 16 - Climate policy and emission trading
The economic growth is increasing the CO2 intensity, while the CO2 intensity has a negative impact on the GDP. In other words, in Australia exist a trade-off between economic growth and environmental quality. This paper also confirms that renewable energy could be a solution to decreased the CO2 emissions. Therefore, Australia have made several efforts to mitigate the climate changes, applying restrictive policies on the fossil fuels consumption. Furthermore, their climate preoccupation has lead Australia to exploit renewable energy sources. References IEA. (2012). Energy Policies of IEA Countries - Australia 2012 Review. Ito, K. (2017). CO2 emissions, renewable and non-renewable energy consumption, and economic growth:
evidence from panel data for developing countries. International Economics, (xxxx), 1–6. Narayan, P. K., & Narayan, S. (2010). Carbon dioxide emissions and economic growth: Panel data evidence from
developing countries. Energy Policy, 38(1), 661–666. Pesaran, M. H., Shin, Y., & Smith, R. J. (2001). Bounds testing approaches to the analysis of long run
relationships. Journal of Applied Econometric, 16, 289–326.
108
Session 16 - Climate policy and emission trading
J.M. Martin-Moreno, Jorge Blazquez, Rafaela Perez and Jesus Ruiz CURBIN CARBON EMISSIONS: IS A CARBON TAX THE MOST EFFICIENT LEVY?
Jorge Blázquez. Research Fellow. KAPSARC. King Abdullah Petroleum Studies and Research Center. Riyadh 11672, Saudi Arabia. e-mail: [email protected]
J.M. Martín-Moreno Dpto. Fundamentos del Análisis Económico. Facultad de CC.EE.EE. Universidad de Vigo. Campus Lagoas-Marcosende s/n. e-mail: [email protected]
Rafaela Pérez. Departamento de Fundamentos del Análisis Económico I and ICAE. Universidad Complutense de Madrid, e-mail: [email protected]
Jesús Ruiz. Departamento de Economía Cuantitativa and ICAE. Universidad Complutense de Madrid, e-mail: [email protected]
Overview The ambitious environmental objectives of the Paris Agreement imply that all policy levers will be eventually used to curb carbon emissions. These include carbon taxes and taxes on fossil fuels. This study evaluates the optimal taxes on oil, natural gas and coal to curb carbon emissions and compares them to a carbon tax in a general equilibrium context. The results of the model suggest the following: first, carbon taxes are suboptimal in most of the cases. In particular, carbon taxes are not a satisfactory policy tool for mild environmental targets. Second, governments must always tax coal heavily to reduce CO2 emissions. This is not the case of natural gas and oil that should be taxed with lower tax rates. In some cases, subsidizing oil and natural gas could be part of an optimal strategy. This is a counterintuitive and innovative result. Third, we also find that the tax on oil should be always lower than the tax on natural gas and lower than the tax on coal. Finally, marginal abatement costs of CO2 in terms of social welfare and GDP increase as the environmental policy is more ambitious. Method In our analysis, the economy is represented though a dynamic general equilibrium model with the characteristics of a small open economy. There are a representative household, three representative and competitive firms and the government. The external sector actively interacts by trading a final representative good, foreign bonds and three primary energy inputs (oil, natural gas and coal). The government taxes fossil fuels and transfers the revenues from these taxes to the representative household by means of a lump sum transfer. The idea behind this mechanism is to minimize the impact of taxes on households’ disposable income. In addition, the government runs a balanced fiscal budget. This model is an adaptation of the neoclassical growth model for the Spanish economy proposed by Blazquez et al. (The Energy Journal, 2017). In order to simplify the model and to focus on the best tax mix, it is important to stress that CO2 emissions do not impact on households’ welfare or on economic activity. In this model, the level of carbon emissions is not relevant for the household or the firm. They only take account of economic variables such as private consumption, investment or profits. Obviously, governments set environmental targets due to social preferences, but in our model we assume that this government sets a target of carbon emissions according to exogenous criteria. Empirical Results The main results of the analysis are as follows: Among their options for reducing CO2 emissions, policymakers may consider taxing coal heavily. Less punitive taxation of oil and natural gas could also form part of an optimal strategy. For maximum effectiveness, we found that any planned tax on oil should always be lower than
the tax on natural gas, and still lower than that on coal. This counterintuitive result comes about because oil has the highest marginal economic productivity of the three fuels, though natural gas is the cleanest fossil fuel in terms of CO2 emissions. According to standard economic theory, the marginal economic productivity of any fossil fuel should be similar to international prices for it in competitive markets.
109
Carbon taxes may be seen to have both advantages and disadvantages for policymakers. In the short run, the revenues collected would be higher from an optimal mixture of taxes on the various fossil fuels -- but, in the longer term, higher taxes might be seen by taxpayers as unreasonable and could result in a loss of support for the environmental policies they are intended to underpin.
Conclusions Carbon taxes are becoming a popular policy tool to curb greenhouse emissions. Intuitively, it would appear that the best way to reduce carbon emissions would be by making them more expensive through taxes. However, this intuitive supposition is not entirely correct. The objective of our study was to analyze what would be the optimal taxes on fossil fuels from the point of view of curbing carbon emissions, and to evaluate any welfare losses that might be associated with these optimal taxes. Our modeling produced findings that may be of interest to policymakers. First, to be most effective in reducing CO2 emissions, any tax on coal should be substantial, since it is the fossil fuel with the highest carbon emissions and lowest level of energy productivity. In addition, we find that a lower level taxation of oil and natural gas could also form part of an optimal strategy. The results from our model show that, for modest environmental targets for reducing CO2 emissions, subsidizing oil and natural gas would form part of an optimal strategy. This is a counterintuitive result and, obviously, it has to be seen in the context of a theoretical economic model. Logically, as the planned carbon target becomes more ambitious, the scope for subsidizing oil and natural gas disappears. Second, our results suggest that for optimum effectiveness the tax on oil should be lower than the tax on natural gas and still less than that on coal. This unexpected finding comes about because oil’s marginal productivity is the highest of the three fossil fuels. Third, we find that a carbon tax tends to converge with the optimal tax mix when the environmental target is very ambitious. Regardless of the tax strategy implemented, the model’s results suggest that the marginal abatement costs of CO2, in terms of social welfare and GDP, increase as the environmental policy becomes more ambitious. In other words, abatement costs in terms of welfare tend to be exponential, not linear, suggesting that adaption to climate change may also form part of a strategy for curbing carbon emissions. References Aldy, Joseph E., and Robert N. Stavins. "The promise and problems of pricing carbon: theory and experience." The
Journal of Environment & Development 21, no. 2 (2012): 152-180. Blazquez, Jorge, Martin-Moreno, Jose Maria, Perez, Rafaela and Ruiz, Jesus. “Fossil fuel price shocks and CO2 emissions
in small open economies: the case of Spain” The Energy Journal Vol. 38, no.6 (2017): 161-175. Barker, Terry, Sudhir Junankar, Hector Pollitt, and Philip Summerton. "Carbon leakage from unilateral environmental tax
reforms in Europe, 1995–2005." Energy Policy 35, no. 12 (2007): 6281-6292. BP. Statistical Review of the World Energy 2016 (2016) Ferran. S. "Double dividend effectiveness of energy tax policies and the elasticity of substitution: A CGE appraisal."
Energy Policy 38, no. 6 (2010): 2927-2933. Fraser, Iain, and Robert Waschik. "The double dividend hypothesis in a CGE model: Specific factors and the carbon base." Energy Economics 39 (2013): 283-295. Golosov, Mikhail, John Hassler, Per Krusell, and Aleh Tsyvinski. "Optimal taxes on fossil fuel in general equilibrium."
Econometrica 82, no. 1 (2014): 41-88. Hoel, Michael, and Snorre Kverndokk. "Depletion of fossil fuels and the impacts of global warming." Resource and
Energy Economics 18, no. 2 (1996): 115-136. International Energy Agency. Energy Technology Perspectives 2016 - Towards Sustainable Urban Energy Systems.
OECD/IEA, Paris, 2016. Kumbaroğlu, Gürkan Selçuk. "Environmental taxation and economic effects: a computable general equilibrium analysis
for Turkey." Journal of Policy Modeling 25, no. 8 (2003): 795-810. Nordhaus, William D., and Joseph Boyer. Warming the world: economic models of global warming. MIT press, 2000. Pereira, Alfredo M., and Rui M. Pereira. "On the environmental, economic and budgetary impacts of fossil fuel prices: A
dynamic general equilibrium analysis of the Portuguese case." Energy Economics 42 (2014): 248-261. Solaymani, Saeed. “Carbon and Energy Taxes in a Small and Open Country”. Global Journal of. Environmental and.
Science. Management, 3(1) (2017): 51-62.Strand, Jon. "Optimal fossil-fuel taxation with backstop technologies and tenure risk." Energy Economics 32, no. 2 (2010): 418-422.
Tumen, Semih, Deren Unalmis, Ibrahim Unalmis, and D. Filiz Unsal. "Taxing fossil fuels under speculative storage." Energy Economics 53 (2016): 64-75.
Van der Ploeg, Frederick, and Cees Withagen. "Too much coal, too little oil." Journal of Public Economics 96, no. 1 (2012): 62-77.
110
Session 16 - Climate policy and emission trading Ionut Purica ENERGY VOLATILITIES AND THE COST OF SECURITY
Ionut Purica, AOSR m.c, Advisory Center for Energy and Environment, Romania,
Abstract The EU is striving for an Energy Union where security is paramount. To determine the needed capacity and, consequently, the costs of security a method is proposed based on the volatilities of various energy system parameters such as hydraulicity, wind speed, rain regime, etc. These are determined based on real data for the case of Romania and the calculations are done to determine the needed capacity to face in a resilient way a potential critical situation in order to absorb e.g. market price spikes. Conclusions are drawn for the EU security strategy. Overview In the present status of the energy systems in the EU and given the large import of energy materials, mostly natural gas, security of supply is paramount for the highly industrialized economies of the member countries. The specific cost of security needs to be internalized in the public expenses and be separated from the state aid to various energy sectors. In the case of Romania there is a diversified portfolio of generation that makes the power system a good example for an evaluation of the cost of security based on the intrinsic volatilities of various energy technologies e.g. water, wind, solar. Once the size of the excess power is determined to ensure security of operation a financial scheme simulation is used to determine the price of energy for standard financial and physical parameters. The result shows that there is a cost of security that has to be taken by the state and the swap type of energy acquisition scheme may be a long term solution. Elements of security According to the Security strategy of the energy systems launched by the EU Commission in 2014 it is necessary to have a diversified portfolio of electrical energy generation technologies that ensures the coverage of situations when various types of risks manifest themselves. As an example only the risks associated with hydraulicity, wind and photovoltaic will be considered. Risk of hydraulicity: the risk exposure is proportional with the standard deviation of the distribution of the Danube flow for the energy generated by the on-flow hydropower units; and to the standard deviation of the rain distrbution for the energy generated from the hydropower plants having a lake and a successive cascade. In Romania from a total of approx. 16 TWh of energy produced annually by Hidroelectrica, 70% is generated on the Danube and 30% comes from the other cascades. In figure 1 and 2 below are given the distributions of the Danube flow and of the raining probability for a representative region of Romania as an example.
Figure 1. Representative raining distribution (county average data 1961-2011)
111
Session 16 - Climate policy and emission trading
Figure 2. Distribution of the Danube flow (monthly data 1840-2006)
Considering the ratio SD per Mean in the conditions specified above rezults the necessary installed power of 462 MW to cover the draught situation on the Danube and of 359 MW for the one in the lakes. Estimations for the same situation of wind and photovoltaic lead to powers of 171 MW and respectively 68 MW. In the table below are given the estimations for each tipe of generation.
SD/Mean Danube 0.361534215 Needed security hydro run river TWh 16 TWh run river 11.2 h/year 8760 exposure TWh 4.049183203 power MW 462.2355254 SD/Mean rain 0.65527311 hidro lake TWh 16 TWh lake 4.8 h/year 8760 exposure TWh 3.145310928 power MW 359.0537589 SD/Mean wind 0.5 wind TWh 3 TWh wind 3 h/year 8760 exposure TWh 1.5 power MW 171.2328767 SD/Mean PV 0.6 PV TWh 1 TWh PV 1 h/year 8760 exposure TWh 0.6 power MW 68.49315068 Total security power MW 1061.015312
It should be underlined that these values of power do not refer to the generation component in normal operation. For the coal it is necessary to have a power of approx. 1800-2200 MW in the normal system operation.
112
Session 16 - Climate policy and emission trading
So, even if the two new nuclear units may cover 1400 MW there remain 600 MW needed on coal together with at least 400 MW to cover the risks one gets 1000 MW needed on coal. The age of the existing equipments Presently all TPPs on coal have long passed their design lifetime as well as the extensions given by the rehabilitation programs. In order to avoid a major accident situation in coal generation having an impact on the power system it is necessary to invest in new units on coal. Considering the development of generation technologies with high efficiency (e.g. hypercritical steam cycles) as well as the emissions reduction ones (e.g. Carbon capture and storage) the new units on coal can meet the requirements of the Euespecially if the external energy system security costs are internalized as well as the social security ones. Evaluation of the investment At an average cost of investment for coal power plants of about 3500-4000 Euro/kWh, a unit of 600 MW needs an investment of 2.1-2.4 billion Euro. The value of such investment must be considered in the framework of the financing scheme that allows such investment; it can not be said that the investment is small or large in absolute value. Financing scheme In the table below a simulation of a typical financing scheme is presented for a coal power plant of 669 MW having a total of 3000 US$/kW and a lifetime of 50 years (the monetary units in the table are given in US$ but they can be replaced with Euro without changing the values).
Table 1. Example of financing structure for a 669MW power plant
113
Session 16 - Climate policy and emission trading
One must know that in the case of the financing scheme under consideration the cost over the lifetime of the plant is 52 US$/MWh and the starting cost is of 87 US$/MWh, the later one diminishing as the debt service is paid. The lifetime of the plant is of 50 years; any extension leads to a reduction in the cost of energy. Obviously the decrease of interest will have se same effect. It is important to notice the possibility to simulate various financing structures that allow to define a negotiation base with potential investors in order to obtain optimal production costs. Conclusions In the perspective of the energy development of the EU under the provisions of the Energy Union and of the Road Map and in the context of the energy security strategy of the EU, it is necessary to make an investment for the replacement of the coal capacities. These are old and risk continuity of operation problems with high associated risk costs. Moreover, the results of evaluating the mitigation and adaptation measures to the risks in the energy system (considering only hydraulicity, wind and photovoltaic) lead to the need of coal capacities of at least 1000 MW. Even if the investment costs are rather high the investment must be done as soon as possible also considering the internalization of the security costs both operational and social. The production costs that include the debt service for the investment credits are at a level which can be considered in the negotiations with the potential investors. Obviously the capacity to model various financial schemes is essential for an optimal negotiation. Finally, given the need for significant investments in the power sector it is necessary to develop a center for the investitional analysis that should include energy models along with inovative financial ones such that to prepare the elements for negotiation with the potential investors in various objectives of the sector. Also, an extended risk analysis is necessary to determine the types of externalities that may contribute to a just assessment of investment costs with a view to take coherent decisions. The energy sector may not be regarded from only a commercial view point, its strategic importance as well as the social one make necessary taking into consideration noncommercial costs that must be internalized in the financing scheme to reach optimal decisions. References EU NEEDS Programme. Purica, I., Managing the costs of climate change risks, Romanian Academy report IPE, 2015. Purica, I., Financial scheme model for energy power plants, internal report FCCEA Hydroelectrica data series of the Danube flow 1845-2006. ANM data series on raining 1961-2011.
114
Session 17 – The multiple path of electricity demand
Penelope Buckley INCENTIVISING HOUSEHOLDS TO REDUCE ELECTRICITY CONSUMPTION: A META-ANALYSIS OF THE EXPERIMENTAL EVIDENCE
Overview With the increasing demand for electricity, the phasing out of what were once guaranteed sources of energy supply, and energy production were being switched to renewable sources, there is a need to have a more flexible demand for electricity. There are two principal approaches to lowering electricity demand: (1) more efficient technologies and buildings, (2) incentives for consumers to modify their electricity consuming behavior. The present paper focuses on the latter. In the experimental literature, households are incentivized to lower their consumption through financial (monetary incentives, monetary information), and non-financial (personalized advice, individual and real-time feedback, social and injunctive norms) incentives. The incentives are designed to either make it more costly for consumers to consume as they typically do, to provide them with greater information about their consumption so that they can target types of consumption which can be reduced, or to exploit behavioral biases to “nudge” consumers towards lowering their consumption of electricity. Methods A meta-analysis approach is used to analyze the results of recent field experiments and pilot studies which explore the effects of different methods of incentivizing energy consumption reduction on residential consumers’ energy demand. Meta-regression analysis is a quantitative method of systematically analyzing the results of empirical studies with a common objective. It allows the researcher to calculate a mean effect across studies by discovering which variables lead to heterogeneity in experiments (Stanley and Jarrell, 1989; Nelson and Kennedy, 2009). Contrary to previous meta-analyses (Darby, 2006; Ehrhardt-Martinez et al., 2010; Faruqui et al., 2010; Delmas et al. 2013; Faruqui and Sergici, 2013, McKerracher and Torriti, 2013), which have reviewed studies from the 1970s and the 1980s, the present analysis considers studies from 2005 onwards so as to focus on a period of time labelled as the “Smart Grid Era” (McKerracher and Torriti, 2013) when more advanced technology has been available and to limit heterogeneity between studies. A rigorous procedure is followed to collect appropriate studies which examine the effect of different incentives on household electricity consumption. Data on incentives used and study design are collected for each study. After a descriptive and graphical analysis of the data, the effects of individual incentives are estimated using OLS and WLS with various weights to check for the robustness of the results. Studies are also characterized by quality, with higher quality studies including a greater number of controls. Results On average, an experimental study of the effect of an incentive on residential electricity consumption can be expected to see a 2% reduction in energy consumption. Real-time feedback and monetary information incentives have the greatest effect on energy consumption with an average reduction in consumption of almost 4% (weighted by sample size of study). When weighted by sample size, monetary incentives result, on average, in a slight increase in electricity consumption. Higher quality studies have a lower average treatment effect than lower quality studies. Regression estimations find injunctive norms, opt-in recruitment and the inclusion of sociodemographic characteristics to have the most significant, negative effect on residential electricity consumption.
115
Session 17 – The multiple path of electricity demand Conclusion All incentives, bar monetary incentives, show a negative effect on energy consumption. The positive, albeit small, average effect of monetary incentives may due to the opportunity to consume at a lower price during off-peak hours which leads to a rebound effect where consumers increase their off-peak consumption by a greater amount then they decrease their peak consumption. The regression analysis shows that the use of injunctive norms as an incentive has a significant and negative effect on electricity consumption, whereas social feedback has no significant effect. These results support the idea that descriptive feedback alone (a household’s own consumption compared to the average of their neighborhood) is insufficient to incentivize a change in electricity consumption. Previous studies have found that such incentives result in a convergence towards the average with low consuming households increasing their consumption (Schultz et al., 2007). The addition of injunctive norms provides social approval or disapproval of the action. References Darby, S. (2006). The effectiveness of feedback on energy consumption. A Review for DEFRA of the Literature on
Metering, Billing and direct Displays. Delmas, M. A., Fischlein, M. and Asensio, O. I. (2013). “Information strategies and energy conservation behavior:
A meta-analysis of experimental studies from 1975 to 2012”. Energy Policy, 61: 729-739. Ehrhardt-Martinez, K., Donnelly, K. A. and Laitner, S. (2010). Advanced metering initiatives and residential
feedback programs: a meta-review for household electricity-saving opportunities. Washington, DC: American Council for an Energy-Efficient Economy.
Faruqui, A., Sergici, S. and Sharif, A. (2010). “The impact of informational feedback on energy consumption—A survey of the experimental evidence”. Energy, 35(4): 1598-1608.
Faruqui, A. and Sergici, S. (2013). “Arcturus: international evidence on dynamic pricing”. The Electricity Journal, 26(7): 55-65. McKerracher, C. and Torriti, J. (2013). “Energy consumption feedback in perspective: integrating Australian data
to meta-analyses on in-home displays”, Energy Efficiency, 6(2): 387-405. Nelson, J. P. and Kennedy, P. E. (2009). “The use (and abuse) of meta-analysis in environmental and natural
resource economics: an assessment”. Environmental and Resource Economics, 42(3): 345-377. Schultz, P. W., Nolan, J. M., Cialdini, R. B., Goldstein, N. J. and Griskevicius, V. (2007). “The constructive,
destructive, and reconstructive power of social norms”. Psychological science, 18(5): 429-434. Stanley, T. D. and Jarrell, S. B. (1989). “Meta�Regression analysis: A quantitative method of literature surveys”,
Journal of Economic Surveys, 3(2): 161-170.
116
Session 17 – The multiple path of electricity demand Golnoush Soroush and Carlo Cambini IMPACTS OF PROSUMERS ON DSO INVESTMENTS: UPDATING TARIFF STRUCTURES
Golnoush Soroush, Politecnico di Torino, e-mail: [email protected] Carlo Cambini, Politecnico di Torino & FSR - EUI, e-mail: [email protected]
Overview In recent years, as a result of ongoing discussions regarding overcoming climate change, special attention has been directed towards development of green energy resources as well as energy efficient actions. On one hand, several jurisdictions attempt to promote the settlement of distributed generation. In the European Union for instance, article 14/7 2003/54/EC of the EU electricity directive requires DSOs to consider distributed generation (DGs) as an alternative when planning the distribution network expansion. However, it is important to notice that implementing such directives and eventually entry of DGs to the distribution networks will generate negative externalities for DSOs. In addition, as it is discussed in Jenkins and Pérez-Arriaga (2016), the growing number of distributed generation specially in form of prosumers, make the regulators face various challenges. On the other hand, policies imposing restrictions on carbon emissions, reinforce the exploitation of renewable energy resources such as wind and solar. Technological developments have reduced the installation cost of such resources and made it possible to extend their exploitation as DGs. As a result, traditional electricity consumers can now also become electricity producers, representing the so-called “prosumers”. Prosumers and their effects on electricity production and distribution networks is an emerging subject and it is only in recent years that studies are focusing on this matter. Prosumers’ penetration (distributed generation in a broader point of view) can have both negative and positive impacts on the distribution network costs. Low penetration level of DGs can decrease the distribution network costs and the need for excess capacity construction since the overall electricity demand will decrease as a fraction of consumers produce their own electricity. However, as the penetration level of DGs increases, energy losses increase and consequently they impose higher operating costs on DSOs. In order to cover these excess costs, DSOs need to set higher retail prices which will affect not only the electricity prosumers (who are the sources of these extra costs), but also the traditional consumers. In other words, the end-users cross-subsidise the prosumers. To solve this problem the regulator should introduce regulations which would encourage the utilities to invest in their networks and to reduce the distribution energy losses in presence of distributed generation. For instance, the regulator can set specific energy loss targets for the utilities. Furthermore, the corresponding investments by DSOs should be recovered through introducing relevant tariff mechanisms aimed at both prosumers and traditional consumers. Currently, several methods are used to compensate the utilities as well as the prosumers. Net metering is the most compatible method with the current technological infrastructures including the smart meters. However, there is a debate going on in the literature stating that net metering is not an optimal strategy (see Brown and Sappington 2015 and 2016; Gautier et. al 2016). In particular, applying this model can lead to two major issues: consumers’ cross subsidies and utilities’ death spiral. Furthermore, to the best of our knowledge, the cost of negative externalities imposed by prosumers on DSOs and related investments required to reduce these effects, are not considered comprehensively in the existing literature on net metering tariff calculations up to now. Therefore, it is relevant to introduce novel tariff structures which not only are compatible with the existing net metering system, but also take into consideration the extra costs which are burdened by DSOs in presence of higher number of DGs.
117
Session 17 – The multiple path of electricity demand
Methods We applied a game theoretic model to understand the optimal strategies of the players (DSO, prosumers, consumers). In the model, each type of consumers (prosumers or traditional consumers) try to maximize their utility by decreasing their costs. The utility (DSO) tries to maximize its profit as well, by reducing its operational and capital costs. Finally, the regulator aims to achieve maximum social welfare by setting relevant grid tariffs. Then we used the results of this model and compared the welfare maximization functions to find the optimal tariff scheme set by the regulator. In the whole process, it is important to allocate the costs to all the network users in a way that each consumer type is charged according to its own activities. This mechanism helps to ensure a just allocation of costs between prosumers and other consumers without distributed generation. The primary hypothesis is that it is costly for DSOs to eliminate the externalities caused by integration of DGs. On one hand, a better network infrastructure which facilitates DG connection, will encourage more consumers to become prosumers. This in turn will lead to lower total consumption and therefore lower revenues for DSOs. On the other hand, if the DSO decides to invest in the network to eliminate the externalities caused by the prosumers, its efforts will not be compensated with the current tariff mechanism. Therefore, the regulator should try to compensate the DSO for these costs through setting proper tariffs. In this context, we applied a repeated game to clarify the optimal strategy of each player. The game has a stage game including three players. The regulator who decides whether to consider investments into tariff structure or not. The utility (DSO) which should decide the level of investments. Consumers who would decide whether to become prosumers or not. The game starts with the regulator deciding about including investments in grid tariff calculations. In the next step, consumers, affected by several factors such as the wholesale price of electricity, cost of DG installation and the grid tariff, can choose whether to become prosumers or not. The consumers’ decision of becoming prosumers and installing DGs will create some externalities in the network. The effects of these externalities depend on the number of installed DGs and their capacity. Consequently, after observing the decisions taken by the consumers (number of DGs and amount of installed DG capacity), the DSO will decide about the level of network investments. In this stage, the regulator would evaluate the corresponding social welfare outputs and decides about how to compensate the DSO for its investments. To solve this game, we apply a backward induction method. Starting from the last set of subgames, we analyse the optimal decisions of each of the players according to their corresponding payoffs (SW for the regulator, utility for the consumers and profits for the DSO). For setting up the utility and profit functions of each grid user, we followed a methodology which is closely aligned with a study previously done by Gautier et al. (2016). However, in order to have a better estimation of the payoffs, cost causality method is used to allocate costs to each player responsible for those costs. Results When DSOs invest in the network, they will incur extra costs and will need to cover these costs through an increased grid tariff. Evidence from our calculations suggests that if the grid tariff increases, the DSO will fall further into the death spiral effect. Meaning that increasing the grid tariff will encourage more consumers to become prosumers and consequently DSO will lose further revenues and incur further costs. This means that not all investment levels by DSOs are socially optimal. On one hand, these types of investments are necessary for the network to be efficient in long run. On the other hand, it is not socially optimal to include them in DSOs’ distribution costs while we have a net metering system. Therefore, regulators should come up with another solution. One solution can be government intervention through subsidising DSOs’ investments. In a way that DSOs receive public transfer payments for their investments. If this is the case, the regulator will not include these investments in DSOs’ cost function and consequently the grid tariff would not increase. However, the regulator could also decide to subsidies the prosumers. Meaning that the regulator may decide to pay the DSOs, part of the grid tariff which is related to costs caused by prosumers, instead of prosumers themselves paying them.
118
Session 17 – The multiple path of electricity demand Conclusions Currently, as long as more technologically developed meters are not accessible, developing a novel tariff mechanism which considers activities of all players in the grid and their relative effects respectively, in a net metering context, can encourage further network investments by the utilities. By applying such tariffs, the regulator provides the utilities the possibility of recovering the corresponding costs. This would ultimately encourage further investments in renewable sources and contribute to the path of achieving desired climate change targets. References Brown, D.P. and Sappington, D. (2015). ‘On the Design of Distributed Generation Policies: Are Common Net
Metering Policies Optimal?’, University of Alberta working paper, October 2015a. Brown, D.P. and Sappington, D. (2016). ‘Optimal policies to promote efficient distributed generation of
electricity’, University of Alberta working paper no. 2016-01. EPRS, 2016. European Parliamentary Research Service Briefing on Electricity 'Prosumers', November 2016.
Available at: http://www.europarl.europa.eu/RegData/etudes/BRIE/2016/593518/EPRS_BRI(2016)593518_EN.pdf
Gautier, A., Jacqmin, J. and Poudou, J.C. (2016). ‘The Prosumers and the Grid’, Submission for the 65th annual meeting of AFSE, March 10, 2016. https://afse2016.sciencesconf.org/99255/document
Jenkins, J.D. and Pérez-Arriaga, I.J. (2016). ‘Improved regulatory approaches for the remuneration of electricity distribution utilities with high penetrations of distributed energy resources’, The Energy Journal, vol. 37, no. 3, pp.89-118.
119
Session 17 – The multiple path of electricity demand
THE EVOLUTION OF PRICE AND INCOME ELASTICITIES OF ELECTRICITY DEMAND IN LATIN AMERICAN COUNTRIES: A TIME VARYING PARAMETER APPROACH1
Rodrigo Aragòn Salinas, Energy Division, Infrastructure and Energy Sector, Inter-American Development Bank. 1300 New York Ave. NW Wasghinton, D.C., USA, e-mail: [email protected]
David Lòpez Soto, Energy Division, Infrastructure and Energy Sector, Inter-American Development Bank. 1300 New York Ave. NW Wasghinton, D.C., USA, e-mail: [email protected]
Overview Empirical studies on estimating electricity consumption have received considerable attention in both developed and developing countries. This paper seeks to contribute to the debate by proposing a time-varying price and income elasticities of electricity demand for 21 countries in Latin America during the period of 1980-20152. Based on a Kalman filter in most of the countries, we observe a decreasing effect of electricity price to consumption. Our results conclude to an important find- ing, the price elasticity becomes less significant while income shows a higher impact in electricity consumption in the last 35 years. The main purpose of this work is to fill a gap in the literature with two main contributions: i) the size of the sample (the number of countries included and period contemplated) and ii) the methodology employed. These two attributes make the study one of its kind in the region. Method The most important determinants on electricity consumption have proven to be both electricity price and income; hence, the complete understanding of electricity consumption’s sensitivity to prices and income is essential for addressing current and future challenges to energy security. Nevertheless, consensus has not been reached on the most appropriate methodology to model electricity demand (Dergiades and Tsoulfidis, 2011; Lee and Chiu, 2011; Nakajima and Hamori, 2010; Narayan and Smith, 2005; Al Faris, 2002; Ang et al. 1992; Amarawickrama and Hunt, 2008). Further, most of the studies in the literature have the assumption that both price and income elasticities remained constant throughout the periods examined. This also has led to a wide range of estimates among countries and regions. This paper will go a step further, by assuming that elasticity varies during the period studied. To complete this research, we propose to employ a state-space model in each of the 21 Latin American countries based on a Kalman filter. We opted to use this method following the approach of Arisoy et al. (2014) and the procedure of Inglesi-Lotz (2011) for Turkey and South Africa, respectively. First, we need to check the possibility of existing parameter instability. For doing this there are a number of tests in the literature (Andrews, 1993; Chu, 1989; Hansen, 1992). During the research process, we applied the three of them, though we selected Hansen test for the null hypothesis will confirm or reject the assumption of the time-varying price and income elasticities before estimating them. Therefore, if the coefficients are proven to vary over time, the Kalman filter is the most appropriate method. Second, the Kalman filter can be considered a recursive filter which allows for the coefficients to vary stochastically over time based on the estimation of state-space model that can be proven superior to the least squares approach (Morisson and Pike, 1977). ______________________________________ 1The findings, interpretations, and conclusions herein are strictly those of the authors and should not be attributed in any manner to their affiliated institutions. All remaining errors are our own responsibility. 2Our sample is composed by the following countries divided according income group: 1) High income (HI): Bar- bados, Chile, Trinidad Tobago, Uruguay; 2) Upper middle income (UMI): Argentina, Brazil, Colombia, Costa Rica, Dominican Republic, Ecuador, Jamaica, Mexico, Panama, Paraguay, Peru, Venezuela; 3) Lower middle income (LMI): Bolivia, El Salvador, Guatemala, Honduras, Nicaraguathe coefficients to vary stochastically over time based on the estimation of state-space model that can be proven superior to the least squares approach (Morisson and Pike, 1977).
120
Session 17 – The multiple path of electricity demand
Data To apply the Kalman filter in our sample of 21 countries, regional and international sources of data were used. The series on average electricity prices (USc/KWh) is obtained from OLADE-SIEE; while the data series on Gross Domestic Product was obtained from the World Development Indicators of the World Bank. Finally, the aggregate electricity consumption (GWh) is derived from the World Energy Balances published by the International Energy Agency. Results As a matter of space and waiting to be selected to the AIEE, we only present the results for Brazil (UMI). The Kalman filter calculates the evolution of the price and income elasticities over more than three decades. The range of the estimates are according to what we expected and the literature argue. The figure confirms that demand elasticities are likely to vary and results show that the price elasticity was significantly negative during the 1980s. Since then, it has become less significant with values close to -0.1. In terms of income, we can separate the effect in three periods: 1) during the 1980s commonly known as ”the lost decade”; 2) the period of structural reforms in the 1990s with a successful debt restructuring program and a wave of privatization up to 2004; 3) and the strong recovery after the 2008-09 crises. We observe the economic growth of the country has proven to be one of the main drivers of electricity consumption.
Figure 1: Price and income elasticities 1980-2015
Conclusions The key research findings and relevant policy implications are the following. First, in most of the countries we observe a decreasing effect of electricity price to consumption, the consumers show little response to electricity’s price variations because electricity is a necessary good. Second, as a region Latin America is composed by a variety of countries with different income levels, therefore, the advantage of having a large sample of countries is that helps to decompose the trends of elasticities by income group (high income, upper middle income, and lower middle-income countries). The results for the three income categories show that Latin America is becoming more income sensitive to change. This can be explained by many factors, for example, the rise of living standards and the improvements in energy access.
121
Session 18– The energy-environment nexus
António Cardoso Marques, José Alberto Fuinhas and Hipólito Leal THE IMPACT OF ECONOMIC GROWTH ON THE CO2 EMISSIONS IN AUSTRALIA: ENVIRONMENTAL KUZNETS CURVE AND DECOUPLING INDEX
António Cardoso Marques, NECE-UBI, University of Beira Interior, e-mail: [email protected] José Alberto Fuinhas, NECE-UBI, University of Beira Interior, e-mail: [email protected]
Patrícia Hipólito Leal, University of Beira Interior, e-mail: [email protected] Overview The relationship between economic growth and environmental protection should be considered by all economies. The equilibrium between economic growth and environmental protection deserve the concern of the policymakers. On this sense, the reduction of the fossil fuels consumption plays a fundamental role in the environment conservation. The Environmental Kuznets Curve (hereafter EKC) has merited attention of the literature, namely analyzing the EKC with different variables and several methodologies (Jiang and Guan 2016; Robalino-López et al. 2015). Empirically, the EKC analyze the relationship between the economic growth and the CO2 emissions. The literature is mainly focused on the validity of the environmental Kuznets hypothesis worldwide, but the empirical evidence for the Australia remains scarce. Australia is the sixth largest country in the world. This year celebrate its twenty-sixth consecutive year without resection. However, it is one of the ten largest emitters of greenhouse gases, mainly caused by the energy use. Besides, this country has a strong endogenous potential on energy sources, which includes coal and oil. Regarding the gross final energy consumption, it is mainly satisfied using the oil products. Concerning the renewable energy, the country has extensive resources of solar and wind, (IEA 2012). Therefore, this paper intends to answer the following questions: is the environmental Kuznets curve hypothesis verified in Australia?; and(ii) how the decoupling index in Australia behave? Methods This paper uses annual data comprising the time span from 1965 to 2015 for Australia. The variables used includes: Gross Domestic Product (GDP_LCU), Import of Goods and Services (IMP_LCU), Export of Goods and Services (EXP_LCU), Renewable Energy (RES), CO2 emissions (CO2), Percentage of Oil in Primary Energy Consumption (OIL) and share of Coal in Primary Energy Consumption (COAL). The database sources are World Development Indicators and BP Statistics. All the variables were converted into their natural logarithm, the meaning of prefixes “L”. The approach applied is the Autoregressive distributed lag (hereafter ARDL) model, proposed by Pesaran, Shin, and Smith (2001). The ARDL model has some characteristics such as: (i) the results are not skewed in small samples; (ii) it is robust to the correction of outliers through dummies, without affecting the efficiency of the results (iii)application of variables with a different integration order or borderline, certifying that they are not I(2); (iv) it can deals with endogenous variables. Being that all variables are integrated of order one, but some variables are fractionally integrated, it was not compromised the use of the ARDL. Moreover, this approach allows obtain the short- and long-run coefficients for the relationships between GDP and CO2 emissions. Therefore, this information is used to test the validity of EKC proposed by Grossman and Krueger (1991), such as noted by the literature (Bouznit and Pablo-Romero 2016; Mrabet and Alsamara 2017). The quality of the estimation was checked to reduce the likelihood of the skewed results. The residual diagnostic tests were performed, namely LM Breusch-Godfrey test, ARCH test, Jarque-Bera test to certify that the residuals not have a serial correlation, heteroskedastic errors, and if they have a normal distribution. Moreover, the stability tests were performed, namely, Ramsey RESET test and CUSUM and CUSUM of squares, and they prove that the model is well specified and it is stable.
122
Session 18– The energy-environment nexus The cointegration were evaluated by using the ARDL bounds test proposed by Pesaran, Shin, and Smith (2001).The null hypothesis provides that variables are not cointegrated. For robustness check, it was performed the Decoupling Index (hereafter DI) proposed by OCDE (2002). This index results on three possible effects: absolute decoupling, relative decoupling and coupling. The absolute decoupling means that the CO2 emissions decrease while the economy grows (DI≥1). The relative decoupling means the effect of the CO2 emissions and the economic growth increases simultaneously, but the economic growth increases with a higher rate than the rate of CO2 emission (0 < DI< 1). The coupling means that CO2 emissions increase faster than the GDP (DI ≤ 0). Results This paper supports that in Australia is verified the hypothesis of EKC, that is, it is verified the inverted U-shaped. This means that the economic growth boosts the CO2 emissions. This increase occurs to the maximum point of the income, which is also calculated. At this point the emissions starts to decrease. In the initial phase the economic growth increased and the CO2 emissions increases too. As such appropriate the policy intervention is required in that initial phase, in order to mitigate the environmental damages. Although this outcome are not the expected, the literature supported a positive impact, (Lantz and Feng 2006), and a negative impact, (Robalino-López et al. 2015). Regarding the DI, it was calculated both for the total period, and for the decades. The results are showing that Australia had a relative decoupling. This means that CO2 emissions grow at the same time than the economic growth, but with lower growth rate. Conclusions This paper applies an ARDL approach to analyze the relationship between economic growth and CO2 emissions through the EKC and the DI, for Australia from 1965 to 2015. The method used proves be appropriated to deal with the data features and allows to capture the short- and long-run effects. The results of this paper reveal great consistency. The relative decoupling reveals, that in the 60’s of the 19th century, the CO2 emissions and the economy were follow an upward trajectory. Over the years the CO2 emissions has grown at a lower speed and the DI increases in direction to the absolute decoupling. These findings were supported by the EKC. In fact, it demonstrates an ascending trajectory of the CO2 emissions and the GDP. Before the inflection point, the DI will continue to increase to achieve the 1 i.e. absolute decoupling. In this moment, the CO2 emissions will decrease, according to the EKC. Therefore, this paper indicates that in the long-run, Australia could have a strong decoupling effect. Accordingly, the policymakers should ensure the continued economic progress of the Australia, to achieve the absolute decoupling. Although the RES are not reducing the CO2 emissions, the economic growth without recession proves that this country could achieve their goals of the COP21. Therefore, the investment in the energy efficiency could play a fundamental role in the CO2 emissions reduction. The policymakers should incentivize the investment in the energy efficiency to reduce the CO2 emissions. this mechanism could be a precious way to guarantee the economic sustainability. on this sense, the use of the more environmental friendly technologies as well as more efficient must deserve further research.
References
Ali, Wajahat, Azrai Abdullah, and Muhammad Azam. 2015. “Re-Visiting the Environmental Kuznets Curve
Hypothesis for Malaysia: Fresh Evidence from ARDL Bounds Testing Approach.” Renewable and Sustainable Energy Reviews (September 2015): 0–1.
Bölük, Gülden, and Mehmet Mert. 2015. “The Renewable Energy, Growth and Environmental Kuznets Curve in Turkey: An ARDL Approach.” Renewable and Sustainable Energy Reviews 52: 587–95.
Bouznit, Mohammed, and María del P Pablo-Romero. 2016. “CO2 Emission and Economic Growth in Algeria.” Energy Policy 96: 93–104. http://dx.doi.org/10.1016/j.enpol.2016.05.036.
Grossman, Gene M, and Alan B Krueger. 1991. “Environmental Impacts of a North American Free Trade Agreement.” National Bureau of Economic Research Working Paper Series No. 3914(3914): 1–57. IEA. 2012. Energy Policies of IEA Countries - Australia 2012 Review.
123
Session 18– The energy-environment nexus Jiang, Xuemei, and Dabo Guan. 2016. “Determinants of Global CO2 Emissions Growth.” Applied Energy 184:
1132–41. Lantz, V., and Q. Feng. 2006. “Assessing Income, Population, and Technology Impacts on CO2 Emissions in
Canada: Where’s the EKC?” Ecological Economics 57(2): 229–38. Mrabet, Zouhair, and Mouyad Alsamara. 2017. “Testing the Kuznets Curve Hypothesis for Qatar: A Comparison
between Carbon Dioxide and Ecological Footprint.” Renewable and Sustainable Energy Reviews 70(December 2015): 1366–75.
Pesaran, M.Hashem, Yongcheol Shin, and Richard J Smith. 2001. “Bounds Testing Approaches to the Analysis of Long Run Relationships.” Journal of Applied Econometric 16: 289–326.
Robalino-López, Andrés, Ángel Mena-Nieto, José Enrique García-Ramos, and Antonio A. Golpe. 2015. “Studying the Relationship between Economic Growth, CO2 Emissions, and the Environmental Kuznets Curve in Venezuela (1980-2025).” Renewable and Sustainable Energy Reviews 41: 602–14.
124
Session 18– The energy-environment nexus
AIR POLLUTION EXTERNALITIES IN GREEK PORTS AND AIRPORTS
George Nikoloudakis, School of Production Engineering, Technical University of Crete, Greece, e-mail: [email protected]
Spiros Papaefthimiou, School of Production Engineering, Technical University of Crete, Greece, e-mail: [email protected]
Overview Ports and airports are the vital links of land, air and sea, acting as gateways and linking transport corridors, thus enhancing trade and communication. The environmental effects of both ports and airports to the atmosphere and human health (due to their proximity in densely populated areas) are extremely important and these effects are typically assessed through measured emissions of pollutants to air. This paper will present a detailed air emissions inventories (mainly focusing on GHGs and NOx, SO2 and PM2.5) and the relevant energy demand, for Greek ports and airports for years 2012-2016, as Greece was the third most popular cruise destination in Europe, while four of the studied ports are constantly in the top-10 list of European principal ports-of-call for cruise ships. Method A bottom-up methodology based on ships’ and planes’ activity will be applied to calculate exhaust pollutants values (GHGs and NOx, SO2 and PM2.5) and the energy spent during moving and while hoteling. The estimated emissions will be analyzed in terms of gas species, seasonality and activity. This "activity-based" method will be used to estimate emissions and energy based on detailed individual activities of ships and planes. For each studied port and airport and for all approaching vessels, activity profiles will be created; i.e. a breakdown of movements during modes of operation, with engines’ types and sizes, engines’ load factors, type of fuel consumed and time spent in each mode. The total external cost due to emissions to air in studied ports, will be estimated based on two methodologies: Clean Air for Europe (CAFE) and New Energy Externalities Development for Sustainability (NEEDS). Results In terms of the total air pollutants inventory, NOx has being proved to be dominant, followed by SO2 and PM2.5. Emissions during ships hoteling corresponded to almost 90% of total and significantly outweighed those produced during the vessels maneuvering activities (less than 11% of total). On the other hand in the case of planes emissions during take-off and landing were the vast majority in most cases. Seasonality was found to play a major role, as summer emissions and energy needs were more profound. In almost all cases, an extension of the touristic season towards October and November has been observed leading to increased autumn emissions. The estimated emissions inventory and the anticipated external costs indicate the necessity of measures towards careful control over the emissions produced by ships and planes (especially in in cities combining ports and airports in close distances) through effective environmental policy-making. Conclusions A bottom-up methodology based on vessels’ activity will be applied to create unique and complete emissions and energy inventories aiming at addressing the issue of air pollution generated in ports and airports. In addition to these data the estimated external costs are very important as they refer to a major sector (i.e. transportation), which is one of the most interesting cases due to its global growth in terms of touristic and economic terms, but also due to its anticipated environmental impacts. References A. Maragkogianni, S. Papaefthimiou, "Evaluating the social cost of cruise ships air emissions in major ports of
Greece", Transportation Research Part D: Transport and Environment 36 (2015) 10. R. Winkel, U. Weddige, D. Johnsen, V. Hoen, S. Papaefthimiou, "Shore Side Electricity in Europe: Potential and
environmental benefits", Energy Policy 88 (2016) 584.
125
Session 18– The energy-environment nexus ASSESSING THE ECONOMIC IMPACTS OF CLIMATE CHANGE ON COMPETITION FOR WATER RESOURCES IN THE FRAMEWORK OF THE WATER-ENERGY NEXUS: A HYBRID GENERAL EQUILIBRIUM APPROACH FOR PORTUGAL
Carla Teotónio, CESAM – Department of Environment and Planning, University of Aveiro, Aveiro, Portugal, e-mail: [email protected]
Miguel Rodríguez, Department of Applied Economics, University of Vigo, Facultade Empresariais e Turismo, Ourense, Spain, e-mail: [email protected]
Peter Roebeling, CESAM – Department of Environment and Planning, University of Aveiro, Aveiro, Portugal, e-mail: [email protected]
Patrícia Fortes, CENSE, Faculdade de Ciências e Tecnologia, Universidade Nova de Lisboa, 2829-516 , Caparica, Portugal, e-mail: [email protected]
Overview Climate change affects several domains of life, with the impact on water resources amongst one of the most important. Climate change affects the hydrological cycle and, thus, interferes with the availability of water resources and the timing and variability of demand and supply of water resources and services. Intergovernmental Panel on Climate Change (IPCC) projections show that climate change is increasing the vulnerability associated with present use of water resources and augmenting the uncertainties concerning water quantity and quality in the coming decades. In Portugal, projections encompass higher mean air temperature, lower precipitation, higher potential evapotranspiration, increased flood and drought risk, and reduced runoff. Altogether, these factors will negatively affect water quantity and quality in the country. The reduced availability of water resources is expected to exacerbate the existing competition for water resources among different users, notably agriculture, energy and urban uses. Within this topic of competition and trade-offs among water uses, the energy sector assumes particular relevance: around 90% of power generation sector consumes large amounts of water, and, therefore, the energy sector represents a considerable share of the water use. Water needs for energy production naturally depend on the energy mix, but the allocation of (scarce) water resources among multiple uses also determines how much water will be available for the energy sector. Water resources and the energy sector are thus closely interlinked and, hence, all policies concerning the allocation of water will have broader impacts on the overall economy. Such interlinkages and resulting externalities are the cornerstone of the so-called ‘water–energy nexus’. This interdependency is particularly acute for hydropower generation, for which conflicts about distinct and concurrent uses for scarce water resources are quite evident. In this context, this paper assesses the economic impacts of the competition for water resources between the energy sector and the other economic activities by 2050, using Portugal as a case study. Methods In this paper an innovative methodology is adopted that explicitly considers: i) climate change impacts on the hydrological cycle (via changes in runoff); and ii) the competition for water between power generation and the remaining water users (production sectors and households). Competition for water resources between hydropower and the remaining water users is equated under two competition scenarios: i) absence of competition, so that all sectors bear the impacts of climate change on water resources availability in a similar way; ii) total competition, so that economic activities located upstream of hydropower plants will compete for water with hydropower generation, reducing the availability of the resource for energy. These competition scenarios are analysed under two climate scenarios (RCP4.5 and RCP8.5).
126
Session 18– The energy-environment nexus The effects of reduced water availability on the Portuguese energy system are simulated by the bottom-up, optimization model TIMES_PT, which computes the most cost-effective power mix and the corresponding electricity generation costs that, in the subsequent stage, enter as inputs in a computable general equilibrium (CGE) model to simulate the economy-wide impacts of changes in water resources availability. A static CGE model for a small open economy is developed, which comprises 31 production sectors (4 energy sectors and 27 non-energy sectors) and three institutional sectors (the public sector, the private sector and the foreign sector). The initial version of the model, including two primary production factors (capital and labour), intermediate goods and three primary fossil fuels (coal, natural gas and petrol), is extended to include sectoral water extracted from nature as a third production factor. While the initial price of raw water is zero, climate change impacts will reduce availability of water rising the costs of both commercial distributed water and sectoral water extracted from nature (the opportunity cost associated with its scarcity). The model also includes the technological disaggregation of the power generation sector into 8 technologies, such as hydropower, and captures labour market imperfections so as to simulate involuntary unemployment. The model is calibrated to the base year 2008, which reflects the initial/benchmark equilibrium. Given the objective of assessing the economic impacts of climate change by 2050, a business-as-usual scenario for 2050 is designed and is used as the reference scenario for model simulations. Results Results show that water scarcity will impose extra costs to the Portuguese economy. Nonetheless, the magnitude of negative impacts is mitigated by the relatively low weight of raw water resources in the national economy. The most affected sectors are the most water-intensive, particularly agriculture and water distribution services. The effects on the power sector will be relatively small because fossil technologies, the largest water consumers (apart from hydropower), will have a minor share in the power mix by 2050, according to the cost-effective criteria of TIMES-PT. Water scarcity results in a price increase for raw water resources. As a direct consequence, production costs for water intensive sectors (notably agriculture, some manufacturing and water distribution services) increase. As to the other production sectors (namely services), production costs slightly decrease, because water resources play a minor role in the production structure, and wages and capital rents slightly decrease. Changes in production costs are transferred to final consumer’s prices, resulting in an insignificant reduction in the consumer price index. The contraction in production levels leads to reduced labour demand and, therefore, lower wages. As a consequence, labour supply decreases and leisure, whose opportunity cost is now lower, increases. Lower labour demand triggers involuntary unemployment and, therefore, real wages decrease. These economic impacts of reduced water availability lead to a reduction in gross domestic product (GDP), both in nominal and real terms. Conclusions The increasing concern about the impacts of climate change on water resources availability and the resulting consequences for human and economic activities is at the edge of a wealth of research – notably through integrated hydro-economic models that include computable general equilibrium approaches. However, the interlinkages between water use and the energy sector are usually out of scope. This paper aim is to fill this gap in literature, with the ultimate objective of a comprehensive assessment of the economy-wide impacts deriving from the concurrent effects of climate change-driven changes in water availability and the competition for scarcer water resources in Portugal by 2050, with particular emphasis on the ‘water–energy nexus’.
127
Session 18– The energy-environment nexus The analysis confirms that water scarcity will pose additional challenges to economic growth. Water intensive sectors will face higher costs, economic activity will slow down and unemployment will increase. As a result, GDP is negatively affected and welfare decreases. Simulated impacts quantify the cumulative effects of i) climate change on water resources and ii) increased competition between users in the context of reduced water availability, thus illustrating the interplay between climatic and economic variables. References WWAP (United Nations World Water Assessment Programme). 2014. The United Nations World Water
Development Report 2014: Water and Energy. Paris, UNESCO. Berrittella, M., Hoekstra, A.Y., Rehdanz, K., Roson, R., Tol, R.S.J., 2007. The economic impact of restricted
water supply: a computable general equilibrium analysis. Water Res. 41, 1799–813. doi:10.1016/j.watres.2007.01.010
Brouwer, R., Hofkes, M., 2008. Integrated hydro-economic modelling: Approaches, key issues and future research directions. Ecol. Econ. 66, 16–22. doi:10.1016/j.ecolecon.2008.02.009
Santos, F.D., Miranda, P., 2006. Alterações Climáticas em Portugal - Cenários, Impactos e Medidas - Projecto SIAMII. Gradiva, Lisboa, Portugal.
128
Session 19– Energy supply and security
Kuei-Lan Chou CONSTRUCTING A TAIWAN’S ENERGY SECURITY ANALYSIS OF LIQUEFIED NATURE GAS BY SYSTEM DYNAMIC MODEL
Kuei-Lan Chou: Green Energy and Environment Research Laboratories, Industrial Technology Research Institute, 195, Sec. 4, Chung Hsing Rd., Chutung, Hsinchu, Taiwan, R.O.C. e-mail: [email protected] or [email protected]
Overview In 2016, the Taiwan government established a new target of national electricity structure for non-nuclear homeland and low-carbon economic development. The proportion of power generation from renewable energy, coal and natural gas are 20%, 30% and 50% respectively by 2025. Renewable energy power generation is intermittent and needs sufficient reserve margin to maintain a stable power supply. As Taiwan is an island-based electric grid and 98% of the energy are imported, liquefied natural gas will play an important role to stabilize power supply while Taiwan moves towards low-carbon energy system. About 80% of Taiwan's natural gas is used for power generation. The proportion of natural gas power was 32% of the total power in 2016. To reach the target of natural gas accounted for 50% of total power generation by 2025, the availability of natural gas purchase and expansion of storage equipment are the key factors of electric power stability in future. Methods The system dynamics model is a computer simulation methodology developed by Professor Forrester of the Massachusetts Institute of Technology in 1956, which is based on a multi-dimensional and interactive analysis viewpoint. This study aimed to construct the energy security model of liquefied natural gas by the system dynamic model with a complete supply chain including demand and storage. There are two main features of this analytical model. Firstly, this study integrated the inventory management theory into the system dynamics model and constructed the nonlinear feedback logic between the influential factors for exploring the systematic causal relationship and evaluating the impact on the national energy security. Secondly, a state of the art analysis method of risk indicators of Energy Security, based on 4A dimensions including Availability, Accessibility, Affordability, Acceptability. This study focuses on an ex-ante dynamic and integrated non-linear strategy analysis, which is different from the energy security review of ex-post key performance indicators (KPIs) by static linearity aggregative method. Results The main applications of the system dynamic model established in this study are two: (1) to plan national long-term energy security strategy and assess the potential vulnerability and impact of energy systems, (2) to simulate the impact scenarios of policy or emergent energy events on the energy security. So far a preliminary construction of system dynamics model has been completed, including the associated causal loop diagram and Stock-and-Flow Diagram. After collecting data of variables and constructing mathematical equations, the verification and test of the system dynamic model are addressed to the results are coherent with energy security concept. Conclusions The complex causal feedback correlation between the variables is the core feature of system dynamic model, which significantly being different from other analysis tools. The impact of dynamic complexity is beyond the human mind to foresee and imagine. Therefore, the system dynamic model can effectively help decision makers to consider the dynamic complexity of the problem. This study has completed the construction and test of the dynamic model of Taiwan’s energy security system of liquefied natural gas. Next step, this study will be applied to the comprehensive impact analysis of liquefied natural gas policy on energy security of Taiwan. In addition, this modeling experience could be extended to construct other types of energy system dynamic model, including oil, coal, electricity and renewable energy.
129
Session 19– Energy supply and security References Aslani, A., Helo, P., Naaranoja, M. (2014) “Role of renewable energy policies in energy dependency in Finland:
System dynamics approach”, Applied Energy, 113: 758-765. Chi, K. C., Reiner, D.M., Nuttall, W.J. (2009) “Dynamics of the UK natural gas industry: System dynamics
modelling and long-term energy policy”, University of Cambridge, EPRG Working paper. Prambudia, Y., and Nakano, M. (2010)“Scenario analysis of Indonesia’s energy security by using a system-
dynamics approach”, International Journal of Social, Behavioral, Educational, Economic, Business and Industrial Engineering, 4: 2283-2288.
Prambudia, Y., and Nakano, M. (2012) “Integrated simulation model for energy security evaluation”, Energy, 5: 5086- 5110.
Shin, J., Shin, W.S., Lee, C. (2013) “An energy security management model using quality function deployment and system dynamics”, Energy Policy, 54: 72-86.
Tziogas, C. and Georgiadis, P. (2015) “Sustainable Energy Security: Critical taxonomy and system dynamics decision- making methodology”, Chemical Engineering Transactions, 43: 1951-1956.
130
Session 19– Energy supply and security
Magne Emhjellen and Petter Osmundsen CAPITAL RATIONING. A THREAT TO ENERGY SECURITY
Overview The recent dramatic fall in oil prices has led to extensive capital rationing in international oil companies. According to Wood Mackenzie Ltd1, because of the slump in prices, the oil and gas industry will cut USD 1 tril.lion from planned spending on exploration and development. Worldwide investment in the development of oil and gas resources will be cut by 22 per cent, or USD 740 billion, from 2015 to 2020. This is lower than was anticipated before prices plunged in 2014, with the deepest cuts in the USA. A further USD 300 billion will be eliminated from exploration spending. In spite of the dramatic investment cuts, oil companies sustain their production levels. According to Schlumberger CEO Paal Kibsgaard this is not sustainable2. According to him the production levels are masking an underlying problem that may soon hit the oil industry, “underinvestment over the last three years means production is not being replaced by further exploration, leading to faster depletion of known resources, and potentially, a resource crunch in the future.” Methods We describe the actual investment policy of multinational oil companies in periods of capital rationing and the effect of tax design on investment location decisions. We analyze capital allocation and government take for four equal oil projects in three different fiscal regimes: the US GoM, UK upstream and Norway offshore. Oil companies apply capital rationing – ie, a positive NPV is not sufficient to get a project sanctioned. We describe the profitability hurdles (metrics) which projects must surpass and, by applying them to model petroleum fields, analyze how tax design affects capital allocation between countries in a context where capital is being rationed. The first metric we present is the IRR, which is described in many finance textbooks (see Brealey and Myers, 2011, and Copeland and Weston, 2005). It is defined as the rate of return which gives an NPV of zero. The second metric is the net present value index (NPVI), defined as the after-tax NPV of the project, divided by the before-tax NPV of investment (Kind, Tveteras and Osmundsen, 2005). It is our understanding that this metric is used by the dominant international oil companies in periods when oil prices are fairly stable. The third metric is the break-even price (BEP) of the project (Jovanovic, 1999). It is often used by the oil industry in times like the present, when oil prices are volatile. BEP is the constant price which gives an NPV equal to zero after tax. We analyze capital allocation and government take for four equal oil projects in three different fiscal regimes: the US GoM, UK upstream and Norway offshore. Implications for optimal tax design are discussed. Results We analyze capital allocation to model fields in three different countries. All the projects have a positive NPV after tax, but we demonstrate that many of them are not developed due to capital rationing. No Norwegian projects are developed with the tightest capital constraint (USD 40 billion), while three in the UK and two in the USA will be. With a less stringent capital constraint of USD 70 billion, the same two projects in the USA are developed, all four in the UK, and only the large project in Norway. _________________________________ 1 http://www.bloomberg.com/news/articles/2016-06-15/oil-industry-to-cut-1-trillion-in-spending-after-price-slump 2 https://www.oilandgas360.com/low-investment-led-unsustainable-production-management-schlumberger/
131
Session 19– Energy supply and security One might therefore question the competitiveness of the Norwegian fiscal regime in current market conditions. The US authorities should worry about cream-skimming, since projects perceived to be marginal by capital-rationing oil companies – and which therefore fail to be sanctioned – may be profitable for society. Capital rationing is often implemented by simple decentralized profitability metrics. We have analyzed capital allocation under different metrics and tax systems. Juxtaposing the metric results against the results from portfolio NPV maximization with capital constraints, we find that the NPVI metric provides the same choice as portfolio optimization with a before-tax constraint. The IRR metric has its own solution with the lowest portfolio NPV. The BEP metric gives an intermediate solution and the same solution as that obtained with a minimizing present value of after-tax cost constraint. The solutions obtained by the NPVI (before tax) and the BEP (after-tax) metrics indicate large differences in the company’s financing needs with a much lower need given the BEP metric portfolio o solution (after tax). Conclusions Over a period of three years the international oil companies have had tight capital constraints due to a dramatic reduction in cash flow after the reduction in the oil price. They would like to protect their dividend programs and are hesitant to take up too much loan, so investments are cut. Oil companies ration capital even when the oil price is rising, since they know from experience that overly rapid growth leads to lower quality, inadequate project management and cost overruns (Osmundsen et al (2006)). In the paper we demonstrate capital rationing and how it is implemented in the oil companies. Further, we demonstrate how it depends on taxation and how it affects the competition between resource countries to attract oil investments. We find that the UK has a tax system that is attractive for investments when capital is scarce, more attractive than in the US and Norway. In the analysis we have presumed that the same projects are available in the three countries and that the tax systems have the same credibility. To the extent that the UK has less prospective fields and a less credible tax system (higher political risk), the favorable tax system can be seen as a way of compensating for these disadvantages. References Bjerksund, P. and S. Ekern 1990, “Managing Investment Opportunities under Price Uncertainty: From
"Last Chance" to "Wait and See" Strategies”, Financial Management, vol. 19, no 3, pp 65-83. Blake, A. J. and M.C. Roberts (2006), “Comparing petroleum fiscal regimes under oil price uncertainty”,
Resources Policy 31, 2, 5-105. Copeland, T. E. and Weston, J. F. 2005. Financial Theory and Corporate Policy, third edition, Addison-Wesley.
Emhjellen, M., Hausken, K., and P. Osmundsen (2006), “The Choice of Strategic Core - Impact of Financial Volume”, International Journal of Global Energy Issues, vol. 26, no 1/2, pp 136-157.
Haufler, A. and I. Wooton, «Country size and tax competition for foreign direct investment», Journal of Public Economics 71(1), 121-139.
Ingersoll, J. E. Jr. and Ross, S. A. 1992. “Waiting to Invest: Investment and Uncertainty”. The Journal of Business, vol. 65, no 1, pp 1-29.
Johnston, D. (2007), “How to evaluate the fiscal terms of oil contracts”, in Humphreys, M., Sachs, J.D., and J. E. Stiglitz, eds. (2007), Escaping the resource curse, Columbia University Press, New York.
Jovanovic, P. (1999), “Application of sensitivity analysis in investment project evaluation under uncertainty and risk”. International Journal of Project Management, vol. 17, issue 4, pp 217–222.
Kind, H.J., K. H. Midelfart and G. Schjelderup (2005), “Corporate tax systems, multinational enterprises, and economic integration”, Journal of International Economics 65(2), 507-521.
Kind, H.J., Tetras, R., and P. Osmundsen (2005), "Critical Factors in Transnational Oil Companies Localization Decisions – Clusters and Portfolio Optimization", in Glomsrød, S. and P. Osmundsen, eds., Petroleum Industry Regulation within Stable States. Recent Economic Analysis of Incentives in Petroleum Production and Wealth Management, Ashgate Studies in Environmental and Natural Resource Economics, Ashgate Publishers.
132
Session 19– Energy supply and security Olsen, T. and P. Osmundsen (2011), "Multinationals, tax competition and outside options", Journal of
Public Economics 95, 1579-1588. Osmundsen, P., Emhjellen. M., and M. Halleraker 2006, “Transnational Oil Companies’ Investment
Allocation Decisions”, in Jerome Davis, ed. 2006, The Changing World of Oil. An Analysis of Corporate Change and Adaptation, Ashgate Publishers, ISBN 0-7546-4178-3.
Osmundsen, P., Emhjellen, M., Johnsen, T., Kemp, A. and C. Riis (2015), “Petroleum taxation contingent on counter-factual investment behavior”, Energy Journal 36, 1-20.
Sharpe, W. 1964. “Capital Asset Prices: A Theory of Capital Market Equilibrium under Conditions of Risk”, Journal of Finance, vol 19, pp 425-442.
133
Session 19– Energy supply and security
Diana Schumann and Sophia Dieken SIMILARITIES AND DIFFERENCES IN VIEWS ON ENERGY SECURITY A COMPARISON OF PUBLIC AND STAKEHOLDER PERCEPTIONS IN GERMANY
Diana Schumann: Forschungszentrum Juelich GmbH, Institute of Energy and Climate Research, IEK-STE: Systems Analysis and Technology Evaluation, 52425 Juelich, Germany e-mail: [email protected]
Sophia Dieken: Forschungszentrum Juelich GmbH, Institute of Energy and Climate Research, IEK-STE: Systems Analysis and Technology Evaluation, 52425 Juelich, Germany, e-mail: [email protected]
Overview Energy security is often a focal point of policy-making [Yergin, 2006, 69]. As a consequence of substantial changes to energy systems and of global socioeconomic and strategic shifts the concept has broadened in its meaning and complexity [Chester, 2010]. However, whereas numerous studies on definitions of energy security have been published [cf. Sovacool & Brown, 2010], the investigation of its social context has started only recently. Current publications, for example, explore links between socio-cultural factors, socio-demographic characteristics, and public perceptions of energy security [Leonavičius et al., 2015, Roh & Kim, 2017, Sovacool et al., 2012, Jones et al., 2017]. In this context, [Sovacool, 2016] examined by carrying out a survey among stakeholders in 11 different countries whether perceptions of energy security vary by culture. He came to the conclusion that stakeholder perceptions across countries are more convergent than divergent. However, since energy security is central issue among others in Germany’s energy transition (Energiewende) [Fischer et al., 2016], the question whether perceptions are shared is pivotal not only across countries but also within countries. For instance, Blumer et al. found out that perceptions of energy security in Switzerland differ among energy users and experts, so that “shared understandings of energy security cannot be taken for granted” [Blumer et al., 2015, 935].
Against this background, this paper investigates the similarities and differences in perceptions of energy security among the general public and stakeholders in Germany. For this purpose, data of a representative survey of the German public was analyzed and compared to the results of the survey among German stakeholders published by [Sovacool, 2016]. The results of this comparison illustrate that views of the public and the stakeholders on energy security are similar to a large extent, but differ with regard to aspects which are particularly important for the public acceptance of the Ener- giewende.
Methods In order to examine similarities and differences in views on energy security, we used data of our IEK-STE Panel Survey which is a representative survey of the German public on their acceptance of the Energiewende [Schumann, 2017]. The IEK-STE Panel Survey is annually carried out since 2011/12 and comprises questions which are asked every year (=core questions) as well as questions on specific topics of current interest which vary every year or which are repeated at greater time intervals (e.g. every two years). In 2014, the specific topics of our panel survey comprised the perceptions of energy security, rising electricity prices and energy efficiency. The questions on energy security measured the awareness and knowledge about energy security as well as perceptions of 16 different dimensions of energy security which were taken from [Sovacool et al., 2012] and adapted to the German context (cf. Table 1). In the IEK-STE Panel Survey the dimensions were evaluated by the respondents on a seven-point Likert scale ranging from 1 (=extremely unimportant) to 7 (=extremely important). Furthermore, four of the 16 dimensions were selected and presented to the respondents together with an additional dimension in order to ask the respondents to rank five aspects according to their importance for energy security in Germany.
134
Session 19– Energy supply and security For this paper, the data of our survey was analyzed with descriptive statistics (frequencies, mean values, and standard deviations). The results for the 16 dimensions of energy security which were originally gathered in the IEK-STE Panel Survey 2014 on a seven-point Likert scale were recoded to the five-point scale from [Sovacool et al., 2012]. Afterwards the mean values of the evaluation of the energy security’s dimensions in our survey were compared to the mean values of the dimensions’ evaluation by German stakeholders in [Sovacool, 2016, 815] (cf. Table 1). Results The results of the descriptive statistical analyses of our survey data revealed that the German public is aware of energy security: in total 75 % of the respondents had heard about it. However, 59 % answered that they knew nothing or just a little bit about energy security and only 16 % stated that they knew quite a bit or a lot about it. 25 % had never heard about energy security, despite its significance in energy policy. Regarding the dimensions of energy security the mean values in Table 1 show that the German public, similar to German stakeholders, assessed all dimensions as important. Furthermore, with regard to nine of the 16 dimensions the ratings done by the public and the stakeholders are very similar, illustrated by only very small differences in the mean values (<= 0.29). However, with regard to seven of the 16 dimensions visible differences in the mean values (>= 0.46) were found. Thus, the public assessed the affordability of electricity and heat on average with the highest importance, whereas the stakeholders evaluated the conduction of research and development on new and innovative energy technologies on average with the highest value. Furthermore, the importance of a secure supply of energy sources was rated higher on average by the public than by the stakeholders. In contrast, the public rated the dimensions small-scale, de- centralized energy systems, promotion of international trade in energy products and technologies, energy security as the subject of education in schools and information about it for all citizens as well as reduction of greenhouse gas emissions visibly lower than the German stakeholders. In the ranking of the five selected dimensions, ordered according to their importance for energy security in Germany by the respondents of our survey, the affordability of electricity and heat was ranked as most important, followed by a secure supply of energy sources. Ranked third was the reduction of greenhouse gas emissions and ranked as least important was the promotion of international trade in energy products and technologies. Ranked forth was the “security policy cooperation with other countries to ensure safe ways of supplying energy” which was added by us as an additional dimension of energy security. Conclusions Our study suggests that perceptions of energy security among the general public and stakeholders in Germany are similar to a large extent. Nevertheless, significant differences in the ratings of the importance of the energy security’s dimensions have been found. These differences are especially relevant with regard to the management of the Energiewende, because public acceptance of the Energiewende can diminish if stakeholders are not aware that possible con- sequences of the energy transition for the affordability of electricity and heat and security of supply should be comprehensible and transparently communicated to the general public. However, since we are aware, that we cannot assess to which extent the differences in the mean values displayed in Table 1 have been influenced by the differences in phrasing, survey formats or survey periods, additional comparisons of public and stakeholder perceptions gathered with identical survey instruments should be carried out, also in other countries, in order to find out whether our results can be confirmed.
135
Session 19– Energy supply and security
Table 1: Comparison of public and stakeholder perceptions of energy security in Germany
German public 2014 (n=1006) German stakeholder 2010 (n=114) Δ Mean of public
perception to mean of stake-holder perception
Statements Mean1,3,4 Statements Mean2,3
Affordability of electricity and heat 4.64 To have affordably priced energy services 4.15 0.49
Protection of drinking water against negative impacts of energy pro-duction and use
4.54 To provide available and clean water 4.47 0.07
Ensure that no citizen is excluded from the acquisition of electricity and heat
4.53 To assure equitable access to energy serviceto all of its citizens
4.24 0.29
Research and development on new and innovative energy technolo-gies
4.42 To conduct research and development on new and inno-vative energy technologies
4.89 -0.47
Minimization of air pollution 4.38 To minimize air pollution 4.46 -0.08
High energy efficiency 4.34 To have low energy intensity (unit of energyrequired per unit of economic output)
4.57 -0.23
Minimization of negative impacts of energy production and use on forests, land and soil
4.34 To minimize the destruction of forests and the degrada-tion of land and soil
4.52 -0.18
Preservation of existing resources for future generations
4.33 To minimize depletion of domestically available energy fuels
4.07 0.26
Reduction of greenhouse gas emissions 4.28 To reduce greenhouse gas emissions (i.e. mitigation)
4.74 -0.46
A secure supply of oil, gas and other energy sources
4.26 To have a secure supply of oil, gas, coal, and/or uranium
3.75 0.51
Predictable and comprehensible development of energy prices
4.26 To have stable, predictable, and clear price signals
4.15 0.11
Minimization of the impact of climate change by mitigation measures
4.20 To minimize the impact of climate change (i.e., adapta-tion)
4.22 -0.02
Transparency in the approval and settlement of energy infrastructure projects and participation in decision-making processes
3.94 To ensure transparency and participation in energy per-mitting, siting, and decision-making
4.15 -0.21
Energy security as the subject of education in schools and infor-mation about it for all citizens
3.94 To inform consumers and promote social ancommunity education about energy issues
4.41 -0.47
Small-scale, decentralized energy systems 3.66 To have small-scale, decentralized energy systems
4.34 -0.68
Promotion of international trade in energy products and technologies
3.64 To promote trade in energy products, technologies, and exports
4.23 -0.59
1 Source: IEK-STE Panel Survey 2014; Question: “Now, I mention aspects of energy security. Please indicate on a scale of 1-7 how important you consider these aspects when you think about energy security in Germany. 1 means "extremely unimportant" and 7 means "extremely important".
2 Sources: [Sovacool, 2016, Sovacool et al., 2012], Question: “When you think about energy security for your country of residence for the next five years, how important is it…”
3 Scale from 1 (=extremely unimportant) to 5 (=extremely important). The results orig-inally gathered in the IEK-STE Survey 2014 on a seven-point Likert scale were recoded to the five-point scale.
4 Since in [Sovacool, 2016] no standard deviations for the German stake-holder perceptions are reported, we also refrain from reporting the standard deviations for the public perceptions.
136
Session 19– Energy supply and security References Blumer, Y. B., Moser, C., Patt, A. & Seidl, R. (2015) The precarious consensus on the importance of energy
security: Contrasting views between Swiss energy users and experts. Renewable and Sustainable Energy Reviews, 52, 927-936.
Chester, L. (2010) Conceptualising energy security and making explicit its polysemic nature. Energy Policy, 38:2, 887-895.
Fischer, W., Hake, J. F., Kuckshinrichs, W., Schröder, T. & Venghaus, S. (2016) German energy policy and the way to sustainability: Five controversial issues in the debate on the “Energiewende”. Energy, 115,
1580-1591. Jones, C. R., Kaklamanou, D. & Lazuras, L. (2017) Public perceptions of energy security in Greece and Turkey:
Exploring the relevance of pro-environmental and pro-cultural orientations. Energy Research & Social Science, 28, 17-28.
Leonavičius, V., Genys, D. & Krikštolaitis, R. (2015) Public Perception of Energy Security in Lithuania. Journal of Security and Sustainability Issues, 4:4, 311-322.
Roh, S. & Kim, D. (2017) Effect of Fukushima accident on public acceptance of nuclear energy (Fukushima accident and nuclear public acceptance). Energy Sources, Part B: Economics, Planning, and Policy, 12:6, 565-569.
Schumann, D. (2017) Public perception of energy systems transformation in Germany. Euro-Asian Journal of Sustainable Energy Development Policy (in print).
Sovacool, B. K. (2016) Differing cultures of energy security: An international comparison of public perceptions. Renewable and Sustainable Energy Reviews, 55, 811-822. Sovacool, B. K. & Brown, M.A. (2010) Competing Dimensions of Energy Security: An International
Perspective. Annual Review of Environment and Resources, 35:1, 77-108. Sovacool, B. K., et al. (2012) Exploring propositions about perceptions of energy security: An international
survey. Environmental Science & Policy, 16:0, 44-64. Yergin, D. (2006) Ensuring Energy Security. Foreign Affairs, 85:2, 69-82.
137
Session 19– Energy supply and security
EU ETS 2021-2030 – A TOO MUCH AMBITIOUS DIRECTIVE
Co-authors: Francesco Scalia, Lawyer and Senator of the Italian Republic, email: [email protected]
Agime Gerbeti, Adjunct professor, University of Roma, Lumsa, email: [email protected] Overview As far as 2020 period concerns, the EU is on track to reach its goal of the second Kyoto Protocol commitment period (2013-2020) with a QELRO (quantified emission limitation or reduction objectives) equivalent to a 20% emissions reduction compared to 1990. At European level, this objective has been divided into a reduction in emissions of 21% compared to 2005 for the Emissions Trading Scheme (ETS) sectors and a fall of 10% in the non-ETS sectors, having as a baseline the 2005 data. With the new targets set for 2030, the EU intends to address various issues related to energy, industry and environment, such as high energy prices and the vulnerability of the EU economy to future price increases, especially related to oil and gas; the EU’s dependence on energy imports, often from politically unstable regions; the need to replace and upgrade infrastructure and provide a stable regulatory framework for potential investors. In this article we will discuss only some novelties in the process of adoption of the EU recast ETS directive. In fact, at the EU institutions level the negotiations on the modification of the ETS Directive 2003/87/EC already amended by Directive 2009/29/EU are coming to closing. Method The method used is a comparative analysis of the two ETS directives: the current one and the upcoming text. The analysis of outcomes from European policies took into account the emissions actually reduced, net of the economic and industrial recession in Europe that characterized the five-year period 2007-2012, the incidence of other forms that reward the use of renewable energy and the increasing of energy efficiency in industry. Taking into consideration the bibliography used, we wanted to highlight on the amendments to the directive related to the allocation of allowances, both through auctions and allocated free of charge to manufacturing sectors and to those exposed to carbon leakage. This last aspect has been also investigated since it is strongly linked to the competitiveness of European industry in the global market. Results Preliminarily, it is observed that although a significant effort is recognized to the EU Commission for elaborating a legislation that also takes into account the trans-sectoral needs and a comprehensive understanding of the regulation that affects the carbon emitted for various production phases, in different ways, the carbon routes will still have to be deepened as well as the effects on the European industrial competitiveness of such rigorous legislation. The literature shows that the EU ETS, for now, has not achieved its environmental objectives. In fact, the price of CO2 allowances is currently still low, around 5-7 €/ton CO2, despite all the measures implemented so far by the European Union to support it. Such a low price level does not encourage the transition from fossil fuels to less emissive or renewable sources; on the contrary, it causes the opposite effect. The paradox is that the price failures of the previous regulated ETS periods have made the Commission more confident in the ETS instrument by outlining it more acutely and deeply. So profound that this regulation seems to completely empty the concept of “CO2 market”. The Commission seems to be saying that, by hook or by crook, a price level deemed useful for decarbonising the European industrial economy will have to be reached.
138
Session 19– Energy supply and security
Conclusions The reason for the ineffectiveness of the ETS is that it is an artificial market limited to the territory of only one part of the industrial power, Europe. If the price of emission allowances increases - and when the allocations free of charge will be definitively abandoned - the system will act as an incentive to cross those borders and delocalize productions where it is possible to use high emissive energy sources, but less expensive, without having to pay a pledge. The scientific literature has proposed different environmental tax solutions, not necessarily alternative to the ETS, which could even be complementary to the same, correcting the distortions. Among these stands out the solution the “Charge on Emissions” which, proposes to use the European market - today the world’s leading importer market - as an incentive to implement innovation and low-carbon technologies. This Charge would apply to the good, wherever it is produced, on the basis of its carbon content. Moreover, the charge on emissions, precisely because it relates to an asset (CO2eq) contained in the product and not discriminating according to the producer country, would be compatible with Article II of the GATT/WTO. The European Commission has foreseen the definition and approval by the end of 2018 of the National Energy and Climate Plans of each Member States, in order to make consistent objectives on emissions reduction and those for energy efficiency and renewable sources with the commitments undertaken under the Paris agreement. So the year we are living in is therefore, crucial for the adoption of measures to overcome the paradoxes that - even with the best intentions - have characterized European environmental policies.
References European Council conclusions of October 23rd 2014. Decision 406/2009/EC on Effort sharing. Commission Regulation (EU) No 176/2014 of 25 February 2014 amending Regulation (EU) No 1031/2010 in
particular to determine the volumes of greenhouse gas emission allowances to be auctioned in 2013-20 Proposal for a Directive of the European Parliament and of the Council amending Directive 2003/87/EC to
Directive 2009/29/EC of the European Parliament and of the Council of 23 April 2009 amending Directive 2003/87/EC so as to improve and extend the greenhouse gas emission allowance trading scheme of the Community.
Decision (EU) 2015/1814 of the European Parliament and of the Council of 6 October 2015 concerning the establishment and operation of a market stability reserve for the Union greenhouse gas emission trading scheme and amending Directive 2003/87/EC.
Senate of the Italian Republic, XVII Legislature (Doc. XXIV n. 79) Resolution of the meeting Committees 10th (Industry, commerce, tourism) 13th (Territory, environment, environmental assets) on the initiative of the Senators Dalla Zuana and Scalia, approved on August 1st, 2017
Senate of the Italian Republic, Legislature 17 Atto di Sindacato Ispettivo n ° 1-00593. Act No. 1-00593, Published June 21, 2016, in session no. 641.
Communication from the Commission “Guidelines on State aid for environmental protection and energy 2014-2020 (2014/C 200/01).
Trends and projections in Europe 2017. Tracking progress towards Europe’s climate and energy targets. EEA report no 17/2017.
Report on the functioning of the European carbon market. Report from the Commission to the European Parliament and the Council, Brussels, 23.11.2017 COM (2017) 693 final.
F. Scalia “L’accordo di Parigi e i “paradossi” delle politiche del Europa sul clima ed energia”. Diritto e giurisprudenza agraria alimentare e dell’ambiente, Numero 6 – 2016.
EU carbon price to average €23/t CO2 between 2021 and 2030: Thomson Reuters assess the future, https://blogs.thomsonreuters.com/financial-risk/commodities/eu-carbon-price-average-e23t-2021-2030-thomson-reuters-assess-future/
Nomisma Energia Cambiare il mercato della CO2 per decarbonizzare l’Europa e aumentare la competitività del sistema Italia, November 2016.
139
Session 19– Energy supply and security F. Valezano, In Europa il carbone uccide, ma la normativa lo permette, in QualEnergia.it 27 October 2016. M. Pellegrino, EU ETS: riforme in corso e potenziali rischi, in Newsletter del GME n. 109 November 2017. M. Cafagno, Principi e strumenti di tutela dell’ambiente. Come sistema complesso, adattivo, comune, Torino,
2007, from page 425. M. Clarich, La tutela dell’ambiente attraverso il mercato, in Dir. pubbl. n. 1/2017, from page 219. A. Gerbeti, “CO2 nei beni e competitività industriale europea”, Milano, 2014, translated in English “A Symphony
for Energy” Milano 2015. T. Fanelli, “L’emissione in affanno”, in QualEnergia, no 2, 2014. P. Krugman. The climate dominio, in www.nytimes.com, June 5, 2014.
140
Session 20– Integrating renewables in energy markets
Philipp Dees FEED-IN TARIFF, QUOTA OBLIGATION AND TENDERS FOR RENEWABLE SUPPORT: COMPARISON WITH REGARD TO INNOVATION, INVESTMENT INCENTIVES AND STRATEGIC BEHAVIOR
Philipp Dees, Friedrich-Alexander-Universität Erlangen-Nürnberg, Institute of Economics, e-mail [email protected]
Overview In recent years, many European Countries started to replace there hitherto existing renewable support schemes for the electricity sector gradually with tendering schemes. This follows European regulation demanding that renewable energy sources should be exposed to market competition. For most European countries, the tendering schemes replace feed-in tariffs, as they have been the most used support scheme. Only few European countries used quota systems, while they are the most common support scheme in the United States, there named “Renewable Portfolio Standards” and used by 29 states. The main idea behind shifting from feed-in tariffs to tendering schemes is that tenders as well as quota obligations would create more competition among generators – in some designs among different technologies, in others only of the same technology – and by this reduce cost of supporting renewables. Moreover, it is supposed that it is easier to trade renewable electricity and support of renewables cross-border, as an installation outside one country might participate in tenders or certificate trading within quota obligation schemes, but is in general not eligible for feed-in tariffs. A third aspect is that in most tender designs, renewable generators are exposed to the power market, as they receive a premium on the power price and not a fixed one; the same is true for quota obligation schemes, where they are obliged to sell the produced electricity to the market. This changes investment incentives in two ways: First, it is more profitable to use or to optimize a technology for high-price periods, for example by installing wind generators optimized for weak wind periods (which often means that total production is lower, as generators optimized for weak wind generate less in strong wind periods). Second, if one country has different pricing zones or one regards cross-border trade, there is an incentive to choose a location where total generation might be lower, but the price is higher (for example by shifting wind generators to the inland). Both effects might lower system costs arising from renewable generation, as the demand for reserve capacity might be lower due to a lower fluctuation of generation from renewables, and renewable installations might be located closer to load centers (as higher electricity prices in one region are an indicator for higher demand), reducing the need for grid expansion. On the other side, the discussion about different support schemes several years ago pointed to several weaknesses of tender and quota obligation schemes. The main concern was that those schemes might hinder innovation, as it prefers the technology with the lowest cost, which is in general an already established technology (for this reason, many existing quota and tendering schemes today use bands for different technologies). One second concern was that exposing renewable generators to the power market would increase the risk for investors and by this reduces investments in renewables; for the United States, there is an ongoing debate if portfolio standards really increased generation from renewable sources. And a third concern was that tendering schemes and quota obligations (the latter to a lower extend) might be prone to market power and strategic behavior. As one extreme, one argued that conventional generators might bid in auctions, ruling out renewable generators, and then would not use their rights to generate from renewable sources. For all three aspects, feed-in tariffs were regarded as superior, what might explain why they dominated European support schemes. This paper should contribute to this debate about support schemes by identifying several crucial factors in the design and outcomes of the three mentioned support schemes with regard to the mentioned aspects innovation, investment incentives and strategic behavior. By this, it should give useful insights for the ongoing debate about the future of renewable support schemes.
141
Session 20– Integrating renewables in energy markets Methods Starting point of the paper are theoretical considerations about the different support schemes. As pricing is different, one major aspect will be to explain price setting for quota obligations and tendering schemes (for feed- in tariffs, this is obvious), how this affects security of investments and how market design opens opportunities for strategic bidding and execution of market power. I will then turn to the question of innovation by including cost degression to the model, following a typical investment cycle, where the costs are high when a new technology is implemented but decrease sharply when the technology spreads to the market. The theoretical considerations will be substantiated by data from several European countries using the different support schemes. The main focus will be on Germany for feed-in tariffs, Sweden and the UK for quota obligations and Germany and Italy for tendering schemes. The data will be used for showing whether some of the theoretical concerns really happened and how different designs and changes in legislation dealt with arising problems. Results Although the results are preliminary, they show that there is no superior support scheme. Regarding the three aspects innovation, investment incentives and strategic behavior, feed-in tariffs have large advantages to quota obligation schemes and tendering schemes with regard to innovation. But for tendering schemes, well-considered design strongly reduces the disadvantages, as technology bands might generate higher revenues for pioneers. For quota obligation schemes, implementing bands has only small effects on the emergence of new technologies, as there is a huge uncertainty about future prices, making investment in new technologies very risky. For investment incentives, quota obligation schemes and tendering schemes dominate over feed-in tariffs, with advantages for the latter. Both are linked closer to the power market and transmit signals from the power market to renewable generators. In contrast, feed-in tariffs do not give any price signals. Transferring them to a premium tariff, where generators receive the electricity price and a fixed premium changes this situation, but then feed-in tariffs become very close to tendering schemes, but with higher system costs, as the premium is not set in a competitive way. For quota obligation schemes, investment is lower than under tendering schemes, as uncertainty about future prices is lower for the latter: Normally, premiums to the electricity price or even the total prices for renewables are fixed under tendering schemes after successful bidding, while they are determined in continuous trading under quota obligation schemes for all qualified generators. Security on investment is even higher for feed-in tariffs, but by far this does not overweight the disadvantages from missing incentives for locational choice or system integration. Tendering schemes are most prone to strategic behavior. For feed-in tariffs, there is almost no opportunity to execute market power; for quota obligation schemes, market power might exist in the certificate market – and considering the higher investment risks, the size of investments will be larger in quota obligation schemes than under feed-in tariffs, making market power more probable –, but there are less opportunities to execute it, as several ways of strategic bidding are not possible under a support scheme with day-to-day trading, others than in auctions. But it is to say that most tendering schemes implemented in recent years deal with the problem of strategic bidding by setting strong penalties and rules for exclusion from further tenders for those who did not deliver the promised installations. This widely solves the problem of strategic bidding. Conclusions Regarding the preliminary results, there are several suggestions for renewable support policy. First, when the aim is to introduce a new technology or certain new technologies to the market, there is a large advantage of feed-in tariffs particularly over quota obligations and also, but to a smaller extend, over auction mechanisms. Under quota obligation schemes, uncertainty over future prices might be prohibitive for the use of new technologies, even when technology bands are used.
142
Session 20– Integrating renewables in energy markets When the aim is to increase the share of renewables within the electricity sector by the use of existing and well-proven technologies, tendering might be the best choice, followed by quota obligations. When the share of renewables increases, aspects like system integration, incentives for the “right” locational choice or for optimization of generation to fluctuating demand becomes more and more important. Feed-in tariffs are rigid and difficult to adapt for those aspects, while tendering and quota obligations transfer price signals from the electricity market to the renewable generators. Moreover, both have a much stronger focus on cost effectiveness, as only those generators “survive” which keep up with the decreasing costs. The superiority of tendering over quota obligations arises as well-design auction mechanisms, avoiding the risks of strategic bidding, give investors a higher security about the revenues they will generate, leading to higher investments for a same given price level. For quota obligations, there is a higher risk of sunk investments, when installations from earlier years cannot compete with current prices and are squeezed out of the market. Summing up, this points out that the current trend in Europe to move from feed-in tariffs to tendering schemes might be appropriate, given the success of implementing innovative renewable technologies to the power market during the last years. But European politicians should keep in mind that they must keep an eye on innovation and how to set an environment where new technologies, far away from competitiveness with the existing ones, can be introduced to the renewable system: Relying only on existing technologies might, in the long run, result in higher system costs. And there are several hints that those countries still relying on quota obligation schemes should consider the use of tendering, too: The results signal that quota obligation schemes do perform worse compared to tendering. For latecomers, who did not yet set up a support scheme (mainly outside the European Union), it might be possible skip feed-in tariffs. They can rely on the pioneering of the frontrunners, who already brought renewables over the first period of high investment costs.
143
Session 20– Integrating renewables in energy markets
Maria Teresa Vespucci, Paolo Pisciella, Giacomo Viganò, Marco Rossi and Diana Moneta ESTIMATION OF BIDDING CURVES FOR ACTIVE DISTRIBUTION NETWORKS
Maria Teresa Vespucci, Department of Management, Information and Production Engineering, University of Bergamo, via Marconi 5, 24044 Dalmine (BG) Italy, e-mail: [email protected]
Paolo Pisciella, Department of Management, Economics and Quantitative Methods, Department of Industrial Economics and Technology Management, NTNU, 7491 Trondheim, Norway, e-mail: [email protected]
Giacomo Viganò, RSE - Ricerca sul Sistema Energetico S.p.A., via Rubattino, 20134 Milano, Italy, e-mail: [email protected]
Marco Rossi, RSE - Ricerca sul Sistema Energetico S.p.A., via Rubattino, 20134 Milano, Italy, e-mail: [email protected]
Diana Moneta, RSE - Ricerca sul Sistema Energetico S.p.A., via Rubattino, 20134 Milano, Italy e-mail: [email protected]
Overview In order to achieve European targets for greenhouse gases reduction, renewable energy sources (RESs) and energy efficiency (2030 Energy Strategy) the share of renewable resources should reach the target of 27% by 2030, in order to reduce the emission of carbon dioxide of 40%, also by the help of energy efficiency. Most of these new renewable generators (with the exception of large wind power plants and photovoltaic plants, directly connected to the transmission network) will be connected to distribution networks. Since exploitation of renewable resources must occur where these sources are available, it is usually not possible to choose optimally the connection site. Hence, the diffusion of RESs may involve possible criticalities in some MV networks, where traditional planning and operation practices could be inadequate to guarantee the desired power quality levels. In order to foster RESs diffusion, in the last few years the regulation has been changed, requiring the local resources to participate in the network operation. In order to maintain the simple “fit&forget” connection criteria, it has been primarily asked distributed generators to support the voltage profile by local control of reactive power, following a Q/V droop curve. In fact, with reference to possible problems deriving from the diffusion of distributed generation, alteration of feeder voltage profiles is one of the most common and relevant barrier to RES diffusion to be considered. However, the local voltage control of the generator is not the optimal solution for the network operation and planning, increasing for example the losses and the reactive power exchange with the HV network. Besides, the local controls affect the use of the voltage regulator of On-Load Tap Changer transformers, whose controls become more complex. A more efficient architecture would be based on the centralized approach, where the Distribution System Operator (DSO) has ideally the control over all the resources. However, the centralized control has the drawback of a high complexity and it requires a diffuse communication system, which can entail significant costs, especially for communicate with many small generators in rural areas. Thus, a third possibility is to adopt a hybrid solution, i.e. the DSO has a direct access to the relevant resources, while small generators implement local controls. Method We have developed a new Optimal Power Flow (OPF) model that integrates the droop control and considers different types of capability of generators, accordingly with the most recent regulation about DG participation to voltage control. We obtain an optimization model compatible with the fast response required by the real time network operation, which also allows to perform efficiently the multi scenario analysis required in the planning phase.
144
Session 20– Integrating renewables in energy markets Results A computational time compatible with the on-line operation of the network is required by the developed model to provide the optimal set points. The choice of alternative objective functions, e.g. minimization of active power losses, are also provided by the model. Conclusions In a future scenario with energy demand largely satisfied by RES distributed generation, it can be reasonably expected that distribution networks will be enabled to offer balancing and regulation services to the market. Since the DSOs are responsible for the management of distribution network, their role in the market is fundamental to foster the participation of distributed resources. In this scenario DSOs can play the role of market facilitators: they can technically aggregate all the local dispatchable resources and obtain from their combination a single bid curve that represents the flexibility of the entire network, taking into account the grid constraints. The developed OPF model can be reliably used by DSOs to offer a single power bid to the power balancing market, so as to optimize the use of distributed resources while avoiding local congestions. References Vespucci MT, Moneta D, Pisciella P, Viganò G (2016) “Modelli di ottimizzazione non lineare per il
dispacciamento ottimo di potenza attiva e reattiva in reti di media tensione”, RSE research report. Bosisio A, Moneta D, Vespucci MT, Zigrino S (2014) “A procedure for the optimal management of medium-
voltage AC networks with distributed generation and storage devices”. Procedia Social and Behavioral Sciences, Operational Research for Development, Sustainability and Local Economies, vol. 108, p. 164-186, ISSN: 1877-0428, doi:10.1016/j.sbspro.2013.12.829
145
Session 21– A new shape for electricity systems Stéphane Allard, Silvana Mima, Vincent Debusschere, Patrick Criqui and Nouredine Hadj-Saïd LONG-TERM TRANSMISSION CAPACITY PLANNING IN A SCENARIO WITH HIGH SHARE OF VARIABLE RENEWABLE ENERGIES
Patrick Criqui, Univ. Grenoble Alpes, GAEL - EDDEN, e-mail: [email protected] Nouredine Hadj-Saïd, Univ. Grenoble Alpes, G2Elab, e-mail: [email protected]
Overview Nowadays, the energy system is facing major challenges as important trends push for its transformation. As a main driver, fighting climate changes urges governments to implement efficient climate energy policies. Therefore, in order to strongly reduce CO2 emissions, large scale integration of variable renewable energies (VREs) is being encouraged. However, the power system was developed as a vertical system with a centralized electricity production together with an extensive transmission grid which transports electricity to the final consumer. Thanks to this architecture, the system was robust and reliable. On the opposite, VREs production is intermittent and less predictable. As a result, with high share of VREs, the system needs to be more flexible than before. Hence, energy security is a key issue to the success of climate-energy policies [1]. New flexibility options have arisen in order to achieve the security and the reliability of the power system: Demand Side Management, storage technologies, VREs curtailment. However, using all these options will not be enough to integrate a high share of VREs. Indeed, renewable energies potential are unevenly distributed in Europe but also within a country. Therefore, electricity generation will highly increase in some regions and thus, it will increase power flows exchanges with the neighbouring regions. Hence, the existing transmission grid would face congestion which will result in important investments such as reinforcements or new lines. These new situations lead to question the role of the transmission grid in case of large scale integration of VREs and how can the grid be considered as a new flexibility option for electricity management. Methods In order to answer these questions, a new module called EUTGRID (EUropean – Transmission Grid Investment and Dispatch) has been developed and coupled with the long-term energy model POLES[2]. Based on inputs from POLES such as power plant capacities and mean production costs per technology, EUTGRID performs an hourly power dispatch on typical days and gives back to POLES information on VREs curtailment or hourly production. The European transmission grid plays a crucial role for power exchanges but with more than 10,000 nodes it is too important to be implemented in EUTGRID. Thus, Europe has been divided into 96 nodes with several nodes per country [3]. This representation differs from long-term energy models which have only one node per country [4], [5]. Together with the implementation of a DC-loadflow, this cutting helps to get more realistic power flows and capture the impact of a large-scale integration of VREs [6]. EUTGRID includes also a grid investment mechanism which allows to consider transmission grid expansion thanks to the coupling with POLES model. It uses nodal prices as a signal to detect and reduces congestion in the transmission grid [7] [8]. Hence, it goes through the most congested lines and increases their capacity (either HVAC or HVDC).
146
Session 21– A new shape for electricity systems However, it is only allowed if the annualized reduction of the total costs covers the annualized investments in less than the return on investment (ROI), which in our case is assumed to be ten years [9]. Results A “2°C scenario” is being used as a scenario with large scale integration of VRES where the role of the European transmission grid can be analysed. In this context, 2 cases were compared: (S-1) a “2°C scenario” with investments in the transmission grid and; (S-2) a “2°C scenario” with no investments performed after 2030. Indeed, future investments in the network are already planned until 2030 [10]. In the two different cases, the total share of VREs reaches 46% (VREs only include solar and wind production). However, in (S-1), total investment needed in the transmission grid equals to 478 billion euros while in (S-2), it is limited to 179 billion euros which is in line with the value announced by ENTSOE in [10] (ie “Total investment costs for the portfolio of projects of pan-European significance amount to approximately €150 billion”). During the period 2015-2030, 320 GW of HVAC and 38 GW of HVDC are being added while during the period 2030- 2100, 138 GW of HVAC and 134 GW of HVDC. However, when looking at different parameters such as curtailment production, energy not distributed and mean production costs, it can be underlined the positive impact of transmission grid. Curtailment production increases up to 2.7% of total energy produced in 2100 in (S-2). However, adequate investment in the transmission grid helps to reduce RES spillage as it reaches only 1.18%. Similarly, energy which is not distributed appears when total share of VREs exceeds 33% and reaches in 2100 1.5% of the total demand. On the opposite in (S-1), the situation occurs when total share of VREs exceeds 43% and reaches in 2100 0.15% of the total demand. Because the energy not distributed is very expensive, one can observe that mean production costs increases greatly in (S-2): in 2015- 2020, mean production costs amount approximately 24€/MWh and in 2090-2100, it exceeds 340€/MWh. In (S-1), the transmission grid helps to keep mean production costs around 80€/MWh. Finally, when comparing installed storage technologies (ie hydro-pumped storage, batteries, vehicle-to-grid and adiabatic batteries) and their associated production in the 2 scenarios, in (S-2) up to 35 GW more are installed. During the period 2090-2100, when total share of VREs is at its highest point, the total energy produced by storage technologies in (S-2) exceeds by 35% the amount produced in (S-1). This shows that the transmission grid also competes with the storage technologies. Conclusions The coupling of two different models: EUTGRID, a power dispatch which includes a realistic grid investment mechanism based on nodal prices and POLES, a long-term energy model enables to analyse the role of the transmission grid in a scenario with high share of VREs. Investing in the transmission grid increases the power flows between the regions and thus, reduces curtailment of VREs production and the energy not distributed to customers. As a result, mean cost of the energy mix does not greatly increase. It has also been shown that transmission grid competes with the storage options as it reduces its production. References [1] P. Criqui and S. Mima, “European climate - energy security nexus: A model based scenario analysis”, Energy
Policy, vol. 41, pp. 827–842, Feb. 2012. [2] A. Kitous, P. Criqui, E. Bellevrat, and B. Chateau, “Transformation Patterns of the Worldwide Energy System
- Scenarios for the Century with the POLES Model,” Energy J., vol. 31, no. 01, Sep. 2010. [3] T. Anderski et al., “European cluster model of the Pan-European transmission grid”, e-HIGHWAY 2050, D
2.2, Jun. 2014. [4] L. Mantzos, K. Ciampi Stancova, and Institute for Prospective Technological Studies, POTEnCIA model
description: version 0.9. Luxembourg: Publications Office, 2016. [5] J. Després, “Modelling the long-term deployement of electricity storage in the global energy system”,
Grenoble Alpes, 2015.
147
Session 21– A new shape for electricity systems [6] “Loop flows – Final advice,” THEMA for European Commission, Oct. 2013. [7] D. Phillips, “Nodal pricing
basics”, Indep. Electr. Mark. Oper., 2004. [8] K. Dietrich et al., “Nodal Pricing in the German Electricity Sector–A Welfare Economics Analysis, with
Particular Reference to Implementing Offshore Wind Capacities. Final report of the study project:‘More Wind?’. Chair of Energy Economics and Public Sector Management at Dresden University of Technology”, Working Paper WPEM-08, Chair of Energy Economics and Public Sector Management, Dresden University of Technology, Dresden, Germany, 2005.
[9] “Schéma décennal de développement du réseau de transport d’électricité - Edition 2015 - Synthèse de la consultation publique et Annexes”, RTE, Jan. 2016.
[10] “10-Year Network Development Plan 2014”, European Network of Transmission System Operators for Electricity, 2014.
148
Session 21– A new shape for electricity systems Tim Felling, Caroline Deilen, Robin Leisen and Christoph Weber EVALUATION OF RISKS FOR POWER PLANT OPERATORS THROUGH RECONFIGURATION OF PRICE ZONES IN EXTENDED CENTRAL WESTERN EUROPE
Tim Felling, House of Energy Markets and Finance, University Duisburg-Essen, e-mail: [email protected] Caroline Deilen, House of Energy Markets and Finance, University Duisburg-Essen,
e-mail:[email protected] Robin Leisen, House of Energy Markets and Finance, University Duisburg-Essen,
e-mail: [email protected] Christoph Weber, House of Energy Markets and Finance, University Duisburg-Essen,
e-mail:[email protected] Overview In Central Western Europe (CWE) a reconfiguration of price zones for electricity is frequently discussed in view of an improved congestion management. The current EU guideline on Capacity Allocation and Congestion Management (CACM) even envisages reviews of the price zone configuration (PZC) in regular intervals of three years. Such a change of price zone configurations gives rise to additional regulatory risk for power plant operators. Their expected net present value (NPV) depends on the local prices that are directly influenced by the PZC. The paper at hand develops a methodology to investigate the impact of this regulatory risk. Therefore the risk of price zone changes is modeled using a partly meshed scenario tree. Among the risk factors reflected in the scenario tree are uncertainties in grid developments in combination with other risks such as changing coal and gas spreads, demand or renewable infeed variations. Methods Overall, a five-step methodology has been developed as sketched in Figure 1. First, a scenario tree is constructed using historical variations as estimates for future uncertainties wherever available. Second, the basis for the next two steps is the computation of locational marginal prices (LMPs) by applying a DC-Optimal Power Flow (OPF) (Zimmermann et al, 2012) for every scenario. Third, these LMPs are clustered into aggregated price zones using a hierarchical cluster
algorithm (c.f. Felling, Weber 2016). Pushing further, a robust price zone configuration is computed by combining the LMP of different economic scenarios with the same grid development status and base years (c.f. Felling, Weber 2017). In a fourth step, the robust PZC of step three is used to compute average zonal prices from the LMPs. With these new zonal prices, the contribution margin for a power plant is assessed in each scenario. Finally, the net present values are calculated for different types of power plants as the probability-weighted and discounted sum of operation margins across scenarios and time steps. Thereby the previously defined transition probabilities between scenarios are applied.
Figure 1: Methodology Overview
Session 21– A new shape for electricity systems
149
Figure 2: Exemplary Partly Meshed Scenario Tree Figure 3: Exemplary Price Zone Configurations assessed by Cluster Algorithm
Results Two major aspects are considered when computing the operation margin and accordingly the NPV of individual power plants. On the one hand, the investment decision in new power plants is investigated. On the other hand, the profitability of existing power plants is scrutinized. Preliminary results for power plants in Germany for the years 2020 till 2025 indicate that there is, at least in most scenarios, no incentive to invest in new power plants, especially in gas plants. In terms of continued operations, most existing plants realize sufficient margins for a continuation of operation in the majority of scenarios. Yet, some existing gas plants fail to cover their fixed costs (even without capital costs) and are forced to shut down. Moreover, it is foreseen to evaluate and quantify the risk of changing PZCs in comparison to permanent configurations. Thereby not only the current PZC of extended Central Western Europe (CWE+, i.e. Germany, France, Benelux, Austria and Switzerland), where national borders usually align with borders of price zones, is investigated but also a set of new PZC. For example a configuration with 5, 10 or 15 Zones for CWE+. Further investigations of additional years and scenarios will be undertaken to obtain results for future years and a broader range of uncertainties. In addition, it is foreseen to extend the geographical scope to Central Europe including Italy, Poland, Czech Republic, Hungary, Denmark-West, Slovenia and Slovakia. Conclusion In research, both the investment (and to a lesser extent disinvestment) decisions in power plants and the identification of new PZCs have been investigated frequently. However, the combination of both has not been addressed yet, especially not in conjunction with the new situation in Central Europe that PZCs might change every three years. The paper at hand aims to quantify the resulting investment risk and to evaluate the implications that come along with a frequent reconfiguration of price zones. Therefore, a novel methodology is applied to quantify that risk. For each scenario of the meshed scenario tree, nodal prices (LMPs) are computed and aggregated to zonal prices according to the particular price zone configuration. Investigated configurations are not only the current PZC in CWE+ but also new configurations derived using a cluster algorithm based on the LMPs. By computing the contribution margins of power plants in each scenario and afterwards the NPV of the particular plants, both investment and disinvestment decisions are considered in combination with the assessment of the overall risk and uncertainty of a frequent change of PZCs. References R. Zimmermann, C. E. Murillo-Sánchez, and R. Thomas, “Matpower: Steady-state operations, planning and
analysis tools for power system research and education”, IEEE Transactions on Power Systems, vol. 26, no. 1, pp. 12–19, 2011.
T. Felling and C. Weber, “Identifying price zones using nodal prices and supply demand weighted nodes” in 2016 IEEE International Energy Conference (ENERGYCON), April 2016, pp. 1–6.
T. Felling and C. Weber, “Consistent and robust delimitation of price zones under uncertainty with an application to Central Western Europe”, Working Paper, June 2017
150
Session 21– A new shape for electricity systems Kun Li and Joseph D. Cursio THE ELECTRICITY MARKET PRICE: VOLATILITY, PATTERN AND FORECAST ANALYSIS
Overview The wholesale electricity market is probably the most uncertain market from the perspective of economics. As electricity cannot be readily stored in a large amount, plus the compensation of tax credit to the new power generation such as wind, there are more and more extreme price values appeared in the electricity market, including price spike and negative pricing. These extreme price records imply larger and more frequent disequilibria of power supply and demand, compared with other asset markets, and bring larger uncertainty and mystery in the market. In terms of the economics theory, negative price implies an oversupply and consequently send distorted information to the market participants. Although the market attributes these extreme price records to technical issues on congestion, however, the investigation of power pricing has become a more and more important topic for both industrial engineers and economists. Therefore, we focus on the phenomenon of volatile prices, especially negative prices, in the electricity market and investigate its pattern, impact, and origin. Our study shed light on how these volatile prices affect the other market conditions for the policy makers. The paper is organized as follows: After the introduction the second section gives a brief overview about the negative price, how it arises under some specific regulatory settings. The third section provides the descriptive outcomes about the recent years locational marginal prices in the PJM electricity markets and depict the prevalence of the volatile price. In the fourth section, we introduce and compare methods of cluster analyses and examine how the price volatility performs for each node. In the final section policy implications are derived. Methods Cluster Analysis Panel Data Analysis Results This study investigates the prevalence of exhibited negative price in the PJM market during the recent years. First, we find that negative price can occur at any hour and mainly concentrates in the morning hours. Compared with the previous studies, negative price has become more and more prevalent in the electricity market. In some specific electricity node, the occurrence of negative price reaches up to 600 hours per year.
Second, we investigate the impact of negative price on the price volatility across individual electricity nodes. We find that the occurrence of negative price does not enlarge the fluctuation of price but lower it. Nodes with occurrence of negative price usually have a smaller volatility than those without negative price records.
Third, we find that even if the occurrence of negative price can help reduce the price volatility, it cannot eliminate the occurrence of peak load demand. We also investigate the reasons.
Conclusions Negative price is a outcome of inflexibility of generator and encouraged by some policy which benefits the new power generator. As the policy suggestion, our study first states that a dynamic pricing system is necessary to be established such that the market price can reach the economics equilibrium and thus provide more rational information to the market participant. Second, our study suggests that the fast electrical energy storage will be a good resolution to this issue.
151
Session 21– A new shape for electricity systems References Barbour, Edward, Grant Wilson, Peter Hall and Jonathan Radcliffe. “Can negative electricity prices encourage
inefficient electrical energy storage devices?”. International Journal of Environmental Studies. 2014. Vol. 71 Issue 6, 862-876.
Baradar, M., and M. R. Hesamzadeh. “Calculating negative LMPs from SOCP-OPF”. Energy Conference (ENERGYCON), 2014 IEEE International IEEE, 2014:1461-1466.
Bessembinder, Hendrik, and Michael L. Lemmon. “Equilibrium pricing and optimal hedging in electricity forward markets”. The Journal of Finance. 2002. 57.3. 1347-1382.
Borovkova, Svetlana, and Helyette Geman. “Analysis and modelling of electricity futures prices”. Studies in Nonlinear Dynamics & Econometrics, 2006, Volume 10, Issue 3.
Byström, Hans. “Extreme value theory and extremely large electricity price changes”. International Review of Economics & Finance. 2005 Vol 14. Issue 1:41–55.
Chakrabarty, Bidisha, and Tyurin, Konstantin. “Market Liquidity, Stock Characteristics and Order Cancellations: The Case of Fleeting Orders”. Financial Econometrics Modeling: Market Microstructure, Factor Models and Financial Risk Measures. Ed. Gregoriou, Greg N. and Razvan, Pascalau. Palgrave Macmillan, 2011. 33-66.
Chelmis, Charalampos, Jahanvi Kolte, and Viktor Prasanna. “Patterns of Electricity Demand Variation in Smart Grids.” Working paper, University of Southern California Engineering Department, 2015
Egloff, Daniel, Markus Leippold, and Liuren Wu. “The term structure of variance swap rates and optimal variance swap investments”. Journal of Financial and Quantitative Analysis, 2010. Vol. 45, 1279-1310.
Engle, Robert F, and Andrew J, Patton. “What Good is a Volatility Model?” Quantitative Finance 2001. 1: 231-245.
Evans, Lewis, Graeme Guthrie, and Steen Videbeck. “Assessing the integration of electricity markets using principal component analysis: Network and market structure effects”. Contemporary Economic Policy. 2008. Vol. 26, Issue 1. 145-161.
Geman, Hélyette, and Andrea Roncoroni. “Understanding the fine structure of electricity prices”. The Journal of Business. 2006. Vol. 79 Issue 3. 1225-1261.
Genoese, Fabio, M. Genoese, and M. Wietschel. “Occurrence of negative prices on the German spot market for electricity and their influence on balancing power markets.” Energy Market (EEM), 2010 7th International Conference on the European IEEE, 2010:1 - 6.
Hadsell, L., Marathe, A., and Shawky, H. A. “Estimating the volatility of wholesale electricity spot prices in the US”. The Energy Journal, 2004. Vol. 25 Issue 4, 23-40.
Hadsell, L., and Shawky, H. A. “Electricity price volatility and the marginal cost of congestion: An empirical study of peak hours on the NYISO market, 2001-2004”. The Energy Journal. 2006. Vol. 27 Issue 2, 157-179.
152
Session 21– A new shape for electricity systems
Alex Menu THE ELECTRIC SYSTEM AT THE TIME OF CHOICES : AN ECOSYSTEM THAT CREATES VALUE FOR FRANCE
Alex Menu, Sciences Po Paris, Energy, Environment and Regulation, 133 boulevard de Sébastopol F-75002, France, e-mail: [email protected]
Overview The energy transition in Germany results in a gradual reduction in conventional nuclear and thermal production offset by intermittent and unsustainable production. These situations lead to difficulties in steering the electric system to the point of compromising the equilibrium if their development is not controlled. The a priori fixation of an electric mix that predetermines the proportions given to the different types of energies by 2030, does not make much sense, given the techniques mastered and the technological evolutions of which we do not know which will prove operational. Methods To date, none of the technologies under control alone can meet all the challenges that are anticipated. The intermittence and the randomness of wind and photovoltaic electricity production have, among other consequences, increased volatility and amplitude of price variation which make it difficult to anticipate costs for industrial players and investment decisions. Results These elements call for an electric mix that, in the absence of solutions for storage as well as for non-CO2-emitting production solutions, can meet both volume and price needs. In order to meet energy needs in the years to come, the electric mix will validate the maintenance of the nuclear sector and even the increase of its capacities. France cannot deprive itself of its nuclear power generation. Indeed, in 2030, the problems of equilibrium of electric production in the current state of technology, in particular storage, can not hope to find solutions in line with the law on « the energy transition for green growth ». France has a recognized technological mastery and leadership. In a growing market, which has four hundred and thirty reactors in operation and seventy-two under construction, it should have its place if it is not long to reorganize the nuclear sector. In this perspective, would it be appropriate to let an industry die out in which we were still the world leader ? An awakening of consciousness is about to settle if we judge by what is happening in the world. It remains to put in place the provisions so that the desirable electric mix can be established and that the French nuclear industry can be perpetuated. Conclusions By 2030, France will have to progressively renew its nuclear fleet, it will need a framework capable of equitably paying for the sources of low-carbon electricity. Towards “Contracts for Difference” to pay for the next units? France is in the process of changing the remuneration of renewable energy sources on this principle. In the future, it could apply the same system for new nuclear installations. The British CFD system has been applied to wind, solar and nuclear power since 2015: on the Hinkley Point nuclear reactor project, the CFD mechanism guarantees a price of electricity over 35 years. References Power Outlooks ENTSOE (2016), Mid-term Adequacy Forecast 2016, ENTSOE Hermut Lauer (2017), Progress report on the German energy transition, Nuclear Review Dr. Albert Bressand (2017), What would be the rationalization of the European electricity system ? Passages SFEN Publication (2017), Nuclear power in the world, Nuclear Review
153
Session 22 – The Special Student Session Lorenzo De Santis THE EUROPEAN ENERGY POLICY ON RENEWABLE SOURCES AND ITS CONSEQUENCES ON MEMBER STATES
Lorenzo De Santis, University LUISS, Rome, Italy, [email protected] The purpose of the presentation is to explore the various stages in which the European Renewable Energy policy has been developed, to examine the reflections of this policy on that of some of the EU Member States and its achieved results, as well as to outline the prospects and scenarios for the future. Following the energy crises of the 1970s, the high dependence on imports from overseas countries urged community institutions to promote a new energy policy model aimed at achieving three main objectives. The first one concerned environmental sustainability, to be pursued through a reduction in CO2 emissions and an increase in the production of renewable energies. The second one was aimed on achieving security of supply by reducing domestic demand through greater efficiency in consumption and lower dependency on foreign countries. Finally, the third objective was to increase competitiveness, pursued through the realization of the internal energy market, capable of ensuring employment and economic growth. In the second half of the 1990s, the EU reinforced its environmental focus in view of the United Nations Climate Change Conference that took place in Kyoto in December 1997, followed by the White Paper draft. The White Paper was a fundamental aspect for the take-off of renewables. For the first time, a target (12%) was set for a given period of time (2010), and concrete measures were put in place to implement this action plan in order to provide a stable framework for the long term. Then the analysis was carried out the transition of the Lisbon Treaty. This Treaty was a fundamental turning point within the European institutional system. In fact, EU institutions received on energy issues a direct and specific competence. The EU became clearly stronger after the Lisbon Treaty. In particular, the energy policy took advantage of the new situation and the following Directives established mandatory targets for the member States. The 2009/28 Directive was extremely important to set energy targets for the member States (known as the 20-20-20 Strategy). For the EU became possible to realize by 2020 a sustainable energy system (-20% of CO2 emissions), a secure energy supply (-20% of consumption) and a higher clean energy internal production (+20% of RES). These targets were reinforced by the 2009/28 Directive. On this connection the EU, thanks to the Lisbon Treaty, had a greater independence vis a vis the member States. Furthermore, a binding target was assigned to each State taking into account its technological development and economic situation in order to achieve an average RES percentage of 20% in the European area. This presentation analyses the RES policies of each State. The values countries are analysed in according to their energy structure and political and economic role in the EU. We took into consideration the Scandinavian area (Sweden and Finland) with the highest development in renewables, the most relevant countries in EU for their economic and political strength (France, Germany and UK) and two countries of the Mediterranean area (Italy and Spain) that have made important progress in RES. Italy has experienced a huge progress in the energy and environmental sector. In the end of 2015, Italy has reached his target assigned by the European Directive in 2009 to achieve a share of 17% of RES on final energy consumption by 2020. This swift growth of the RES has the positive effect of contributing to the decrease of the CO2 emissions. However, there were negative consequences in the gas sector. In fact, the international fossil sources market situation was not considered along the development of RES with no consideration of high national gas prices and a low coal prices.
154
Session 22 – The Special Student Session As a result, RES national gas consumption in the electricity production declined by 35% between 2006 and 2015, in comparison to coal that declined only 11% between 2006 and 2015 with a significant negative impact on the activity of power generation fuelled natural gas. In 2009, based on the EU Directive 2009/28, member States changed their energy structure with a considerable increase in RES on final consumption. In this connection it is allowed that some States have shown a greater capability in reaching the EU targets. Member States analysed in this research can be divided in three categories. First of all, the Scandinavian countries (Finland and Sweden) have shown the highest RES quota and establish themselves as the leader countries in Europe. The second area is represented by Italy and Spain. In particular, Italy has overcome the percentage of the 2009 Directive, while Spain is on the right track to achieve its quota by 2020. In the third category, France, Germany and UK, although they are the most relevant countries in EU for their important political and economic role, have failed to achieve their milestones and in most probably they will not even reach in 2020. However, all the member States have the opportunities for a further development. Especially, the least-developed countries will be obliged to increase the investments in RES sector, to improve the incentives system and to remove the administrative barriers. Indeed, States that have already reached the 2020 targets, should focus their policies in the fossil energy sources reduction and in achieving the “decarbonisation” energy system. The Paris Agreement of December 2015 and the new European Directives will settle the long-term targets. In this way, RES development to fight against climate change and a greater energy efficiency will be achieve.
155
Session 22 – The Special Student Session
Elisabetta Glorioso THE ITALIAN ELECTRIC SYSTEM IN THE LIGHT OF EUROPEAN ENERGY POLICIES
This work analyses the Italian electric system’s development on the basis of three key points characterizing the European environmental and energy policies in the last twenty years: the beginning of free market competition in the late 90s, the consumer protection and the environmental protection. Specifically, it analyses the EU directives and their relative national implementing decrees that have designed the current governance of the Italian electric system. The analysis’ aim is not only descriptive but it wants to offer an impact’s assessment of the opening up of the electricity market to competition in terms of private investment’s trend, electricity price’s evolution - both wholesale and retail - and electrical service’s quality provided to consumers. Along that, the regulatory activity of the Authority for Energy, Gas and Water System and its annual surveys on the electricity sector’s state are examined. Following a first context and impact analysis, the research activity focuses on the new challenges that the electricity sector faces. In this light, reference is made to the new policy agenda of the European Commission on Energy, according to the principal goal to achieve in the 2050: the decarbonisation of electricity production processes and the penetration of electricity into final energy demand. Research’s results are the following: Twenty years after the start of liberalization, the electricity market is experiencing high competition both on the supply side and demand side. Lots of investments have been moved from energy carbon industry to gas and renewable energy sources industry; In 2015, consumers’ share who declared themselves satisfied with the service’s quality was particularly high and higher than in 1998; The increase in the Italian electricity bill in recent years doesn’t depend completely on the wholesale energy price, but rather on the increase in the costs of system charges and dispatching costs, plus additional increases due to taxation. On the hand of environmental protection, the need of a new energy market design is widely accepted. Currently, the European Commission is setting the instruments to face the GhG emissions reduction’s problem. According to the new EU guidelines, specifically based on the «Market design Package», national legislators have the task of encouraging both public and private investment in the upgrading of electricity infrastructures, in the electric mobility sector and in the energy efficiency’s field. Overall, Emission Trading System’s global reform is getting to be necessary in order to guarantee an effective achievement of the decarbonization’s goal in 2050.
156
157
PAPERS
159
CONTRACTING THE GAP: EMPIRICAL EVIDENCE ON THE ROLE OF ENERGY PERFORMANCE CONTRACTING TO PROMOTE INVESTMENT IN ENERGY EFFICIENCY Sandra Klinke, Mehdi Farsi, Martin Jakob, Ulrich Reiter Abstract Energy performance contracting (EPC) consists in outsourcing the design, the operation, and possibly the financing of an energy-efficiency project. The contractor provides its client with a reduction in energy costs in exchange of either a fixed fee or part of the savings achieved. This study explores the decision mechanisms through which EPC may induce investments in energy efficiency based on a discrete choice experiment among 297 managers and owners of large private and public buildings in Switzerland. In order to explore heterogeneity in preferences and decision-making processes, we compare conditional logit models with latent class models with attribute non-attendance. The empirical analysis shows that the performance guarantee and the resulting risk sharing mechanism are consistently improving the willingness to invest in energy efficiency. The contractor’s financing is valued positively only by a minority of respondents. These are mostly public entities, presumably with debt ceilings. This study provides interesting insights about the behavioral complexity and heterogeneity underlying the decision to invest in energy efficiency. While EPC may mitigate important barriers to investments, it is also facing an intrinsic reluctance from potential clients. We argue that this reluctance mostly stems from misunderstandings of the concept and could therefore be mitigated by fostering awareness. Keywords: Energy efficiency, transaction costs, risk sharing, Energy Service Company Abbreviations: Energy Performance Contracting (EPC), Energy Service Company (ESCO), attribute non-attendance (ANA)
1. Introduction Energy performance contracting counts amongst the set of instruments available in order to reach the objectives defined by the Swiss energy strategy 2050. This is particularly the case in terms of promotion of investments in renewable energy and energy efficiency. Such market- based instruments are especially important because public concerns about governments’ direct interventions, such as taxes and subsidies, could raise public reluctance against energy transition policies. Empirically assessing to which extent, and through which channels, EPC can promote investments in energy efficiency is of primary interest for policy-makers. Provided that EPC fosters investment, then this market, which is only emerging in Switzerland, should be deployed rapidly in order to take advantage of its potentials. Evidence of a positive impact of EPC on investments in energy-efficiency projects would be a rational basis for government support to mitigate potential barriers on the EPC markets, especially if the latter appear to be easier to address than the direct obstacles to energy efficiency investments. If the energy efficiency gap exists, it is of particular concern for policymakers to focus primarily on the most binding constraints. This study, in addition to informing about EPC adoption, also provides information on the determinants hampering investments in energy efficiency. The main channels through which EPC can induce investment, such as risk sharing, access to capital, technical expertise and enduring performance have been often highlighted in the literature (Sorrell (2007), Capelo (2011), IEA-RETD (2013)). However, quantitative evidence in support of these conjectures is scarce. A recent exception is Polzin et al. (2016) who surveyed 1,298 German municipalities and explored the determinants of EPC interest in the context of LED retrofits. They assessed the impacts of stated barriers and drivers of energy efficiency investments and of EPC projects on the probability to consider EPC for street lighting LED retrofits. They found that municipalities do not value the risk-sharing advantages of EPC. However, when constrained by budget or human resources capacity, they are more likely to consider EPC options. While providing useful insights, the current state of the EPC literature lacks empirical evidence on the decision mechanisms through which EPC can induce investments, and on their underlying trade-offs and heterogeneity. This study attempts to reduce the research gap using a discrete choice experiment targeted to managers of large energy-consuming buildings in Switzerland. While such experiments have been used extensively in other domains (e.g. Banfi et al. (2008), Rose et al. (2012), Blasch and Farsi (2014), Caputo et al. (2014), Hole et al. (2016)) it has, to our knowledge, never been applied to the EPC context. Heterogeneity in the value attached to EPC’s benefits and costs is accounted for
160
using stated attribute importance and inferred attribute non-attendance using a latent class model. This empirical strategy permits to explore the diversity of channels through which EPC can foster energy efficiency investments. The next section develops a series of hypotheses about drivers and mechanisms through which EPC could induce investments and reduce barriers to energy efficiency and renewable technologies. Section 3 presents the research context and the methodology, i.e. the survey design, the target group and the econometric framework. A description of the data and summary statistics are provided in section 4. The results are presented in section 5, followed by robustness checks and guidelines for further research. A general discussion, with conclusions and policy implications, is provided in the final section. 2. Background and hypotheses development In a 1979 study, Hausman investigated individuals’ purchases of energy-using durables. By comparing the capital costs with the expected operating costs, he estimated an implied discount rate of approximately 20% - well above the rates at which most individuals borrowed or invested money. Hausman’s observation that individuals seem not to invest optimally in energy efficiency, or, as stated by Jaffe and Staving (1994), the existence of an energy efficiency gap or paradox, has given rise to an important literature (See Gillingham and Palmer (2013)). The literature has explored the market failures or other reasons that could explain the energy efficiency gap, although the size of the gap remains unclear and the relative importance of its causes is unknown. The extent to which EPC can address the energy efficiency gap has first been explored by Soroye and Nilsson (2010). Using data on EPC projects implemented in the public sector in Sweden between 2000 and 2010, they find that these projects have led to a 22% energy saving for heating and hot water. They also observe that ESCOs helped to increase the awareness of firms about the usefulness of energy efficiency, although this could not be precisely measured. A few other studies attempted to measure the impact of EPC. Okay and Akman (2010) explore pairwise correlations between ESCO and country indicators in a sample of 38 countries and find that the volume and maturity of the EPC market is positively related with energy consumption. They conclude that this result stems from either the ineffectiveness or the non-saturation of the EPC market. But one could also interpret this result as countries with higher energy use having a greater need for EPC solutions. Fang et al. (2012) reach an opposite conclusion by using a GMM method with a panel data of 94 countries over the period 1981 to 2007. They find that the existence of the EPC market has a negative impact on energy use and that this effect has become stronger over time. However, these results may suffer from endogeneity and/or unobserved heterogeneity across countries. Goldman et al. (2012) provide interesting insights about the estimated amount of energy saved in the US thanks to energy performance contracting. Based on a sample of 2,484 projects implemented in US over the period 1990-2008, they evaluate that EPC generated a net direct economic benefit to their clients of $23 billion1.While these studies provide illustrations of the potential size of energy savings induced by EPC, they do not inform about the mechanisms through which these savings are achieved. The present study assesses the channels through which energy performance contracting can mitigate the energy efficiency gap, focusing especially on limited access to capital and risk. By exploring which EPC solutions are positively valued, this study also provides guidance on the most important barriers to investment in energy efficiency. ___________________________________________________________ 1 A total of $4 billion direct benefit has been measured for the projects in the sample.
161
2.1 Limited access to capital Limited access to capital has been cited as a market failure, characterizing investments in energy efficiency, in cases the lender cannot distinguish between good or bad credit risks borrowers (Gillingham and Palmer (2013)). This phenomenon may be exacerbated by the fact that borrowers with high energy savings potentials may have poor credit risk profiles (Palmer, Walls and Gerarden (2012)). Moreover, energy efficiency investments cannot be guaranteed by a collateral and the returns rely upon uncertain future energy cost savings (Hansen (2006)). Taken together, these elements result in higher interest rates hampering consumers to invest. Investors may also be insufficiently informed about the financing options or subsidies available when making their decisions (IEA-RETD (2013)). Other constraints may prevent entities to invest in energy efficiency, such as debt ceilings (particularly affecting the public sector) or limited budget for non-core activities (in the case of private firms). ESCOs can facilitate access to financing, either by financing the installation themselves through the shared-savings EPC scheme, or by guaranteeing a third-party investment via the “forfaiting” scheme (Swissesco (2016)). Li et al. (2014) find empirical evidence that ESCOs can relieve partly the clients from their financing need, using a sample of 140 EPC projects implemented in China. This is captured by the first hypothesis: H1: EPC induces energy efficiency investments through financing. This hypothesis may be challenged by the fact that the ESCO’s guarantee in the “forfaiting” scheme will provide added value only if the third-party investor evaluates the ESCO with a better risk profile than the client. In the shared-savings scheme, ESCOs may also have difficulties to find the necessary capital (Nolden and Sorrell (2016), Panev et al. (2014)). Whether the facilitated access to capital provided by ESCOs is indeed valued by building managers depends on their actual credit constraints with respect to energy efficiency investments. Given the context prevailing in Switzerland at the time of this study, and in particular the low level of interest rates, ESCO’s financing may be unattractive as compared to bank credits. Also, public entities may be able to circumvent debt ceilings via the ESCO’s financing only if the EPC project can be accounted off-balance sheet2 . As a matter of fact, the financing advantage of EPC is not consensually perceived as decisive by the Swiss ESCO market experts interviewed in Klinke et al. (2017). While some experts described the clients’ interest for ESCO’s financing, others mentioned that the lack of demand for external financing is actually hampering the deployment of the EPC market in Switzerland. 2.2 Risk The risk inherent to energy efficiency investments is not a market failure but reduces the number and amount of investments undertaken in energy efficiency (Anderson and Newell (2004)) and may explain the high implicit rates observed by Hausman (1979). Risk stems from financial or technical uncertainties. In the former case, it relates to unexpected realization costs or future energy prices variations. The technical risk in energy efficiency investment relates to unexpected technical failures of the equipment, possible under- performance or uncertain energy savings. Based on 50 retrofitted residential multifamily buildings in Switzerland, Khoury and Hollmuller (2017) for instance found that realized energy savings do not meet the expected savings, but are instead considerably lower due to a variety of reasons (mismatch between actual use and standards, uncertainty in users – both energy operators and clients – behaviour, poor input data quality)3. Imperfect information may also intensify the apparent risk of energy savings investments if the lack of technical knowledge prevents the investor to appropriately assess ex ante the potentials of an investment (Tietenberg (2009), Gillingham and Palmer (2013)). Gathering the necessary information about the differences in quality of these investments may also be too costly (Allcott and Greenstone (2012), Sorrell et al. (2004)). ____________________________________________________ 2 The feasibility for the off-balance sheet financing of EPC is not yet clarified (Klinke et al. (2017)) 3 According to their model, 500MJ/m2/year expected savings translate in 310MJ/m2/year realized
162
EPC is designed to give both the ESCO and the customer the incentive to reduce energy costs. ESCOs either provide a performance guarantee or get paid on a share of the energy savings achieved. In either case, the client benefits from the technical knowledge of the ESCO and shares some of the performance risk. This leads to the second hypothesis: H2: EPC induces energy efficiency investment through performance guarantee4 and risk sharing. A guarantee comes at the cost of a risk premium paid to the ESCO. As in the case of ESCO financing, respondents are likely to have heterogeneous preferences and perceptions towards the technological risk. Recent research from Polzin et al. (2016) show that German municipalities underestimate risks associated with street lighting LEDs retrofits and therefore do not value the risk-sharing advantage of EPC. While this result may be specific to the LED technology, which may be perceived as not risky, this study aims to explore further the impact of the performance guarantee on investment. It does so by considering the technical risk and the provision of a guarantee on the energy savings5. 2.3 Other determinants of the energy efficiency gap Limited access to capital and risk are not the only reasons that could explain the energy efficiency gap. The level of investment in energy efficiency may also be suboptimal if the person who owns the building and the energy appliances is not the person using them and paying for the energy use6. Split incentives may arise from this situation because the up- front costs are not paid by the individual who benefits from lower energy costs (IEA-RETD (2013)). Both theoretical models and empirical evidence show that this may result in under- investment in energy efficiency7. Split incentives can occur between landlords and tenants and within firms. The landlord-tenants split incentives may be of particular importance in the Swiss context where only 37% of the dwellings were inhabited by their owners in 2010 (OFS (2013)). There has been no attempt in the literature to determine whether and how EPC may reduce split incentives. One could argue that the ESCO, or the facilitator, may help tenants to coordinate in the case they were interested in investing in energy efficiency. The ESCO may also assist potentially interested owners in the legal process to redirect the costs of energy efficiency investments onto the tenants. Nevertheless, Klinke (2016) shows that having tenants is an important barrier to ESC adoption, and suggests that the Swiss legal framework regarding the transfer of costs onto the tenants should be clarified. In the UK (Nolden and Sorrell (2016)) as well as in the mature US and Canadian ESCO markets (Panev et al. (2014)), commercial centers and office buildings represent untapped potentials because of the tenants they involve. While EPC, in its standard form, therefore does not seem to solve split incentives issues, it seems possible that EPC with alternative payment schemes may be effective in that sense. Nolden and Sorrell (2016) provide a list of these schemes, such as on-bill financing, where repayments are typically tied to the property and not the owner or the tenant. ____________________________________________________ 4 We refer here to the general meaning of performance guarantee, which can either be provided indirectly through the shared-savings scheme or directly via the guaranteed-savings or the “forfaiting” scheme. Although for simplicity, in the choice experiment analysis, we consider the direct guarantee only, it is assumed to capture the general effect of direct and indirect performance guarantees provided by EPC. 5 The uncertainty on future energy prices is voluntarily excluded from the performance guarantee in the analysis in order to decrease the complexity of the choice experiment. In Switzerland in practice, the performance guarantee typically covers both technical and price variation risks since the energy price is often fixed for the contractual period and the guarantee is expressed in CHF saved. In the choice experiment, we voluntarily presented the guarantee as kWh saved in order to disentangle the technical and financial risk 6 Within firms, split incentives may arise when the department which is in charge of investing in building technologies and the department who has to pay for the energy costs are separated and also have separate financial accounting. 7 See Murtishaw and Sathaye (2006) and Davis (2010) for empirical evidence and the appendix of Gillingham et al. (2012) for a formal explanation.
163
However, because these schemes always involve a remuneration of the capital via electricity bill or increased rent, they may not be suitable in the current Swiss legal framework8. Hence, having tenants is expected to decrease the likelihood of energy efficiency investment, with or without EPC. Finally, the energy efficiency gap has also been explained by the fact that consumers may not act according to the standard assumptions underlying the neoclassical economic theory. Gillingham and Palmer (2013) describe in detail the related behaviors, such as loss aversion (Greene et al. (2009)) or a systematic undervaluation of discounted future energy costs (Allcott and Wozny (2012)). Limited attention or non-standard decision-making processes may lead individuals to simplify the decision by focusing only on certain attributes when making a choice or to stick to familiar or salient option9. Heterogeneity in preferences may also be an important explanation (Jaffe and Stavins (1994), Allcott and Greenstone (2012)). Empirically testing the existence of such behaviors and how EPC may overcome them is out of the scope of this study. The empirical evidence in this study nevertheless attempts to account for heterogeneity in preferences and decision-making using a latent class model with possible attribute non-attendance. Knowing the existence of these behaviors in the case of energy efficiency and EPC (Bleyl et al. (2012)) may be of considerable importance as it explains why policy instruments such as information campaigns may be insufficient to induce investment (Tietenberg (2009)). 2.4 The costs of EPC ESCO’s financing and performance guarantee give rise to transaction costs. For instance, protocols for the measure and verification of the energy savings must be contractually agreed in order to mitigate the potential moral hazard that may occur from the consumer’s behavior or asymmetry of information regarding the ESCO’s effort. These transaction costs, as well as the risk premium are included in the client’s annual payment to the ESCO. The latter is expected to have a negative impact on EPC adoption. Energy Performance Contracts also imply long contractual periods. The impact of the contract’s duration is ambiguous a priori: On the one hand, duration is valued negatively by the respondents reluctant to a long-term commitment and the lack of independence these contracts entail. On the other hand, a longer contractual period increases the duration of the performance maintenance and also allows for more comprehensive refurbishments. Private entities may be more responsive to the first argument while public entities are likely to attach greater value to long term contracts. Finally, while EPC is assumed to reduce barriers related to credit constraints or technical knowledge, other barriers hamper the deployment of EPC adoption (Backlund and Thollander (2011), Pätäri et al. (2016), Stuart et al. (2016)). In the Swiss context where the concept remains relatively unknown, the lack of awareness is likely to have an impact on the willingness to adopt EPC and results in reluctance towards EPC solutions. This reluctance may be visible in differences in the way costs and energy savings are valued depending on whether they are presented in an EPC or not, once all other contractual clauses are controlled for. It may also appear through the fact that some respondents never choose EPC, regardless of the attributes presented. Follow-up questions on the reasons why EPC is disregarded provide additional guidelines for ESCOs and policymakers. 3. Methodology 3.1 Research context EPC is a market niche in Switzerland, which has started to develop only recently (Klinke et al. (2017)). The first public tender for EPC was published in fall 2016 and a few others are currently being developed. In Spring 2017, to our knowledge, 5 to 10 ESCOs have implemented EPC projects ______________________________________ 8 The law explicitly mentions that the variable fee paid by a tenant cannot include retrofits capital costs repayment (except in the case of district heating). Moreover, transferring 100% of the capital costs of a retrofit onto the payment via an increased rent is in practice not possible. Nevertheless, in the case of EPC involving only energy equipment optimization without investment in equipment, the costs can be transferred via the variable fees onto the tenants. 9 This has been explored in other contexts, such as consumption practices on eBay ((Hossain and Morgan (2006)). Sensitivity to the framing of choices, whereby the presentation of choices can affect significantly the decision (Duflo et al. (2005)), are also cited as important drivers (Gillingham and Palmer (2013)).
164
in Switzerland with a total of around 25 EPC contracts signed. The clients are hotels, industries, education and health facilities, private office buildings, residential buildings and shopping centers. In addition to ESCOs with some contracts signed already, 5 to 10 additional ESCOs are active on the EPC market without any contract signed in Switzerland yet. We estimate around 40 contracts under negotiation mainly with private entities. The market being only at its infancy in Switzerland, this study provides insights about the advantages and shortcomings of EPC in a context characterized by a lack of awareness and possible misperceptions regarding EPC contracts. 3.2 Survey design 3.2.1 Target group The survey is targeted to the potential demand side of EPC in Switzerland. It includes participants from both the public and the private sectors, in order to explore potential differences in the decision-making process between these sectors. Public entities are assumed to have a long-term planning and investment horizon. Despite being credit-worthy, public collectivities are often credit constrained. They represent therefore interesting targets for EPC. Abroad, energy performance contracting projects with the public sector often triggered the deployment of EPC markets. In Switzerland on the opposite, EPC projects in the public sector only represent a small share of the market (Klinke et al. (2017)). The selection of private buildings has been performed by a bottom-up approach focusing on the technical energy savings potential, with an emphasis on relatively complex and therefore non-residential buildings. In total, around 2,200 addresses were collected including representatives of public entities, building owners and managers in charge of public or private education and health facilities, shopping centers, hotels, sport facilities and offices (public administration, banks, and insurance companies). Industries were not targeted to avoid too large heterogeneity across respondents. The list of participants included institutions from all regions of Switzerland. The survey was prepared in both main languages spoken in Switzerland (French and German). 3.2.2 Survey structure and choice experiment The survey divides into five main parts:
Part 1: Introductory questions on the building and the respondent Part 2: Current situation of the building Part 3: Information on Energy Performance Contracting Part 4: Choice experiment Part 5: Decision process
The methodology for the choice experiment is described in the next subsections. Information on the remaining parts of the survey is provided in the appendix. a) Introductory elements to the choice experiment Four choice tasks were presented to each respondent in the choice experiment. We asked expressly the respondents to imagine the situation in which a revision on the building were soon to be necessary when making their decisions. In each task, they were invited to decide if they would opt for energy efficiency measures, with or without contract, or if they would choose a simple overhaul. As illustrated in Figure 1, each choice task was presented as a two- step process in which they first had to choose between simple overhaul and invest in energy efficiency measures without contract. In a second step, an EPC proposition was added to these 2 alternatives. The simple overhaul alternative has a cost but no energy savings, while investments without contract include a cost, energy savings and a variation of energy savings. Energy performance contract, finally, adds the possibility of ESCO financing part of the upfront cost, the possibility to have a guarantee on the savings (therefore, reducing the energy savings variation presented) an additional payment fee to the ESCO and a contract’s duration.
165
Figure 1 - Choice task example 10
Shortly before starting the choice experiment part of the survey, two kinds of information were randomly presented to the respondents. First, we provided additional information on energy efficiency measures regarding their non-monetary benefits such as comfort, safety and CO2 emissions mitigation. Second, we directed the respondent’s attention to the fact that EPC also provides the client with guarantee on the upfront cost of the installations. Depending on a random distribution, respondents could see both information, one of them or none. This strategy was aimed at determining whether these additional features of EPC and energy efficiency measures had an impact on the decisions, without further increasing the information burden within the choice tasks. b) Choice experiment design The choice experiment has been designed so that the types of energy efficiency measures proposed were relevant to the respondent.
Figure 2 - Choice experiments allocation
_______________________________ 10 [SSI script] was replaced by the amount in CHF/m2 for respondents who gave a precise amount or an estimation of the building’s heated surface in squared meters. It was left blank for respondents who did not provide this information. The elements with a dashed-under-line provided further information to the respondent if she moved the mouse over these.
166
In order to do so, we used information regarding the realized retrofits from a prior question of the survey. We then distributed accordingly the respondents in different types of choice experiments, as illustrated in Figure 2. For instance, for a building in which the only refurbishment realized since the year 2005 has been its envelope, the respondent was directed towards type 2’s choice experiment, which includes measures such as new heating systems (with or without building automation) or building automation. The simple overhaul alternative (without energy efficiency measure) is, in this case, a revision of the boiler. In the case no refurbishment has been undertaken since 2005, the respondent was instead directed towards the type 1 choice experiment which includes proposition on the heating systems or envelope enhancement. The overhaul situations in this case might either be boiler revision or painting of walls and windows. The allocation of the respondents in one of the 5 choice experiment’s types resulted in different levels for each attribute as described in Table 1.
Table 1 - Attributes and levels
Attributes EE investments levels Overhauling levels Total up-front cost (includes realization cost but not payment to ESCO) CHF/m2 surface heated
Energy efficiency measure Allocation determined according to the upfront cost
Type 1 BA, HP+BA, Wood+BA, Envelope, Envelope+BA Type 2 BA, HP+BA, Wood+BA Type 3 BA, Envelope, Envelope+BA Type 4 BA, Nebo+, solar+BA, biogas-green elec.+BA Type 5 BA, ventil., solar+BA, biogas-green elec.+BA
Type 1 Revision boiler, painting wall and/or windows Type 2 Revision boiler Type 3 painting wall and/or windows Type 4 technical revision of building and ventilation Type 5 do nothing
Energy savings variation % of expected energy savings
Types 1-5 20–40–50–60
-
Part of up-front cost financed by ESCO (%)
Types 1-5 0–30–60–100
Guarantee from the ESCO
Types 1-5 1-Expected energy cost savings guaranteed 2-guaranteed savings at 0.5*upper bound determined by the savings variation level 3-guaranteed savings at upper bound determined by the savings variation level 4-No guarantee
Annual Payment to ESCO (interest rate (r) and ESCO’s value added (VA) in equation (1)) CHF/m2 surface heated
Types 1-5 (0%; 0%) (5%; 5%) (10%; 10%) (15%; 15%)
Contract’s duration years Types 1-2-3 5–10–15–20 Types 4-5 5–10
Notes: BA: building automation and control system (BACS class B): This includes automatic detection for lighting and daylight control, combined light and heating automatically controlled, control and optimization of operations, alarming and monitoring functions. HP: heat-pump. Wood: woodchips or pellets. Nebo+: durable energy operation optimization of ventilation and air conditioning, adaptation of operation durations, reduction of air volumes, optimization of air humidity, reduction of electric needs for air transportation, control of air purification.
167
The final designs have been elaborated using the Ngene software, which determined the combinations of attributes levels seen by the respondents in each choice task. The design was performed using a D-efficient Bayesian design11 in which the signs of the priors were determined based on economic theory. Cost, risk on savings and payment to the ESCO were assumed to have a negative effect on adoption, while expected savings and guarantee on savings were expected to have positive impacts. A prior of value zero was set on duration and ESCO’s financing, since we were uncertain on the sign of these determinants’ impact12. Since no priors could be effectively estimated on the magnitude of the impacts, the magnitude of the coefficients was set so that each attribute had a similar impact on the utility level. This assumes that no attribute was more important than another in the decision process. While being potentially restrictive, this hypothesis presents the advantage of hampering an attribute to become artificially important in the estimation. Several constraints were applied to the design elaborations in order to avoid irrelevant or dominated alternatives13. In a second step, the types of energy efficiency measures were allocated to the alternatives with respect to the upfront cost according to estimations derived from Jakob et al. (2014)14. Typically, measures such as envelope enhancing were assigned to the highest costs (120-300 CHF/m2) and building automation to the lowest costs (80-120 CHF/m2). Details of measures- costs allocation for each design type are provided in appendix 9.2. The yearly payment to the ESCO in CHF/m2 was computed from the levels determined by Ngene according to the following formula:
Where fin is the percentage of upfront cost (cost) financed by the ESCO, dur is the contract’s duration, and r and AV are, respectively, the interest rate and the added value (expressed as a share) with the levels determined as in Table 1. The first term on the right-hand side is thus the typical annuity computation resulting from the credit made by the ESCO. The second term represents a value added taken by the ESCO, which is set to be proportional to the upfront cost and the duration. ________________________________________________ 11 A design with 48 rows divided into 12 blocks of 4 choice tasks was elaborated. 12 Contract’s duration may be negatively valued by entities for whom outsourcing operation and maintenance may be constraining, while it may be positively valued by entities who perceive guarantees and maintenance benefits in a longer run. The impact of ESCO’s financing is positive for credit constrained entities, but may be negative for entities with access to credit at good conditions. 13 Constraints were for instance implemented to avoid dominated strategies when considering only cost and savings. Also, if the level for the payment to ESCO attribute was zero, then ESCO’s financing was constrained to be larger than zero, in order to make sure that the payment was always positive in the EPC alternative. Finally, the risk on savings was set to be smaller for very large amount of expected savings in order to avoid energy savings upper bounds larger than 85%. 14 Jakob et al. (2014) provide the costs for façade insulation enhancement (fig. 8, p.48) and window insulation enhancement (fig. 10, p.50) as CHF/m2 of wall or window. In order to translate these costs into CHF/heated m2, we used building geometries data (keeping only offices, hospitals, hotels, schools, shopping buildings) and wall surface/heated surface, windows surface/heated surface ratios provided by TEP Energy GmbH. We estimated the ranges of cost for walls and windows enhancement in CHF/heated surface from 50 CHF/m2 (for a large (>30’000m2) new building school) to 930 CHF/m2 (for a small (330m2) new office building with a large share of windows and a high ratio wall surface/heated surface)). Because the 1st quartile was at 120CHF/m2 and the 3rd quartile was at 345 CHF/m2, we conclude that a range lying between 120-300 CHF/m2 is plausible. We proceeded similarly for overhauling costs assuming painting cost of 80-140CHF/wall m2 and 50-200CHF/window m2. Building automation costs are also provided in Jakob et al. (2014) in table 11 as price per room and we estimated a range assuming rooms of 50-60m2 for schools, and 15-20m2 for residential buildings, p. 54. New heating systems (wood and heat pumps) always proposed with building automation are estimated to have an upfront cost of 100- 180CHF/heated m2 and operation optimization, solar panels and biogas/green electricity mix of 80-150CHF/heated m2.
168
c) Follow-up questions After responding to each of the four choice tasks, a question assessed the certainty with which the respondent made her decision. Then, depending on the choices made by the respondents, several follow up questions appeared. If for instance the respondent always chose the simple overhaul alternative, the fourth choice task was again presented but this time excluding the overhaul option. The respondent was asked to state which one of the 2 options (Investment without contract or EPC) she would choose or if she would be indifferent between the two. This additional choice task was implemented in order to make sure we ended up with sufficient data to estimate the attributes’ coefficients, even in the case a large share of the respondents was always to choose the overhaul option. In order to qualitatively explore the decision made by the respondents who never invested in energy efficiency measures and/or never opted for EPC, questions were asked on the reason behind these choices. Special emphasis has been put on the potential issue to transferring the cost onto the tenants, trust towards the ESCO and perceived legal and accounting difficulties. Finally, the respondents were asked to state up to 4 of the most important attributes they were considering when making their choices. This information is useful to explore preference heterogeneity and attribute non-attendance patterns. 3.3 Data collection The survey creation software Sawtooth has been used to prepare and host the survey online. 100 respondents with various building types were selected for a first pretest in September 2015. In order to gauge the survey’s effectiveness and comprehension, the respondents were asked to give feedback on its structure and content online or via phone calls. A second pretest was launched targeting the non-respondents of the first pretest and 25 additional respondents. These pretests were also aimed at collecting initial preferences regarding the choice experiment attributes in order to estimate more precise priors that would be used to construct a D-efficient Bayesian design for the main survey’s choice experiment15. After incorporating feedback from the pre-test, the main survey was sent to a further 2090 participants in June 2016, using both post and e-mailing. Reminder e-mails and phone calls were undertaken in August 2016 and data collection ended in mid-October 2016.
3.4 Econometric framework The decision to opt for energy efficiency measures, with or without contract, as opposed to adopt a simple overhaul is modeled by the random utility framework (McFadden (1974)). Uitj represents the utility of respondent i choosing alternative j which can be epc (for EPC), ee (for investment in energy efficiency measures without EPC) or ovh (for simple overhaul) in choice task t. Typically, the utility Uitj= Vitj+ εitj is constituted of an observed component Vitj and a residual unobserved element εitj capturing the unobserved heterogeneity across choice tasks, alternatives and individuals. The alternative chosen by the respondent is the one that maximizes his utility. The observed component of utility is described differently for each alternative as in:
(2) _________________________________ 15The number of respondents in the pretest however was not sufficient to estimate these priors. Therefore, as for the pretest, we constructed a Bayesian D-efficient design using economic intuition for the sign of the coefficients of each attribute. Further information on this is provided in the section regarding the choice experiment.
169
where 0,j denotes the alternative-specific constants with overhaul treated as baseline, cost is the upfront cost in CHF/heated m2, sav are the savings in % kWh saved, risk represents the energy savings variation determined in terms of percent difference from the expected savings sav, and meas is a vector of four energy efficiency measures types (envelope, technique16, electricity/biogas mix, new heating system)17. Energy performance contracting adds several attributes describing contractual terms which include fin (the amount of upfront cost financed by the ESCO in CHF/heated m2), guar (a dummy for guaranteed savings), pay (the annual payment to ESCO in CHF/m2) and dur (the contract’s duration in years). The overhaul alternative includes only the attributes’ cost, with all other attributes set equal to zero18. For now, parameters are assumed to be equal across alternatives (i.e. cost has the same impact in the ovh as in the ee or the epc alternative), except from constants which are alternative- specific. We will however show the results relaxing this assumption. a) Conditional logit model In the conditional logit framework (McFadden (1974), also called multinomial logit (Hensher et al. (2015)), the probability that individual i chooses alternative j in choice task t is expressed by:
where Vitj represents the observed part of the indirect utility as described in equation (2). This expression follows from the assumption that the error terms εitj are independently and identically distributed and drawn from a generalized extreme value distribution. This in turn implies that an individual’s unobserved preference for a certain alternative is independent of her unobserved tastes for other alternatives, a restrictive hypothesis known as the independence of irrelevant alternatives (IIA). The parameters βi in equation (2) are estimated as the arguments of the maximization of the following log-likelihood function:
where Probit is expressed in equation (3). 3.4.2 Relaxing the assumption of attribute full attendance Because the choice experiment in this study is relatively complex, it is reasonable to account for the fact that some respondents may have ignored some of the attributes when making their decision. Adopting an attribute processing rule under which one or several attributes are ignored may come from a voluntary basis to focus only on the more salient and important attributes, or may be somehow unconscious and be part of a simplification of the decision process. _____________________________________ 16 Building automation (BA), installation of ventilation or durable energy operation optimization of ventilation and air conditioning (NEBO+) 17 Taking groups for the type of energy efficiency measures reduces the number of parameters to estimate, which is particularly useful in the attribute non-attendance exploration with latent class models. The models were also improved when taking groups as opposed to individual dummies. This strategy is also supported by the fact that the purpose of research is to explore contractual mechanisms inducing investment in energy efficiency and not to estimate the WTP for specific energy efficiency measures. The overhaul measures are not controlled for in the analyses, since the emphasis is on the EE and EPC alternative and overhaul is taken as a baseline. 18 in design 5, the overhaul alternative is replaced by the status quo in which all attributes -including cost- are constrained to equal zero.
170
The reason that leads respondents to ignore some attributes is difficult to establish empirically19. However, regardless of the cause of a so-called attribute non-attendance (thereafter referred to as ANA), numerous studies in various domain of research have shown that accounting for it has an important impact on the parameters results (e.g. Campbell et al. (2011), Rose et al. (2012), Hensher et al. (2012), Lagarde (2013), Caputo et al (2014), Hole et al. (2016)). Two different methods can be used to explore ANA in the decision process: either through respondent’s stated heuristics or via inferred attribute processing strategies. a) Conditional logit model with stated weights on attributes The first method consists in directly asking the respondents which attributes were taken into consideration or ignored during the decision process (Hensher et al. (2005), Hensher and Rose (2009)). In our survey, the respondents were asked to state one to four of the most important attributes in their decision. These results can then be used to account for heterogeneity in the decision process and assess its impact on the parameters estimated. In order to do so, all the parameters are interacted with dummies equating one if the respondent stated that the attribute was important in her decision and zero otherwise. In addition to the characteristic of the question asked in our survey which imposes several assumptions20, this method presents some drawbacks such as the lack of reliability of responses (see for instance Hess and Hensher (2010)). b) Latent class model The second approach consists in exploring attribute processing strategies using inference. This can typically be done using a latent class framework in which restrictions are imposed on the parameters to account for attribute ignorance (Campbell et al. (2011), Hensher et al. (2012), Lagarde (2013)). Hess and Hensher (2010) showed that the inferred ANA at the individual- level was not consistent with the stated decision process answered by respondents. This supports the strategy to use both methods to compare the estimations results. In the latent class model, individuals are assigned into q classes of ANA patterns in a probabilistic fashion, which in the same framework as equation (3) results in the following probability of choosing alternative j in choice task t:
where xitj are the attributes described in equation (2) and βq is one possible vector of attribute non-attendance pattern in which the ignored attribute(s)’ coefficients are set to zero. This approach can be seen as a random parameter model with a discrete distribution21 allocating individuals into classes with different combinations of attributes ignored. Since the allocation of individuals within classes is a priori unobserved by the researcher, the probabilities for each individual to belong to class q must be estimated using the following expression:
19 Weller et al. (2014) have explored the impact of choice experiment dimensions on attribute non-attendance and showed that it does not depend on the design dimension, but that it may be influenced by the number of alternatives and sets. 20 Because of the characteristics of the question asked, i.e. respondents could not tick more than four important attributes, we were forced to make some assumptions regarding heuristics for those who ticked four attributes. Specifically, we assumed that if the respondent chose four attributes or ticked the answer “no attribute is more important than another”, then he was assumed to have fully attended to all attributes. 21 The latent class method, as opposed to the mixed logit model, presents the advantage of having no specific assumption about the distribution of the parameters across respondents but only estimate the underlying distribution in a discrete manner.
171
And the log likelihood function to be maximized to estimate the coefficients is transformed as follows:
The difficulty in this method is to explore all the possible combinations of ANA patterns. With eight attributes considered in this study, there are 28=256 combinations possible and therefore 256 potential classes. While some studies explore all combinations (Lagarde (2013)) using an iterative algorithm eliminating the irrelevant classes in the process, other studies focus on a subset of attributes (Hensher et al. (2012), Weller et al. (2014)). Accounting for all combinations requires the use of equality-constrained latent class models (ECLCM)22 (Lagarde (2013) and Hensher et al. (2012)). This reduces the number of parameters to be estimated at each iteration and also allows the analyst to detect irrelevant classes, which are determined by null average posterior class probabilities. This method however comes at the cost of restraining the heterogeneity to be only in attribute non-attendance patterns and not in preferences. While the method with equality-constrained latent class models has been tested and is provided in the appendix, the main results focus on a strategy using unconstrained latent class model. In order to explore the most relevant ANA patterns, we use information provided by the respondents’ stated importance of attributes: 1. Using respondents stated attributes’ importance, we explore all combinations of important
attributes concerning at least 4 persons in the sample. Each combination of important attributes represents a potential class.
2. Using an iterative process, the best combination of classes is determined by comparing unconstrained23 latent class models’ Akaike and Bayesian information criteria. Using unconstrained latent class models permits to consider heterogeneity in both attendance and preferences.
3. After selecting the best combination of ANA classes, we explore how individual or building characteristics can affect the class allocation. In order to do the latter, equation (6) is transformed by replacing the vector of parameters θq with a dot product of it with a vector of individual-specific variables zi.
3.4.3 Summary of the econometric strategy To summarize, the following three models will be compared: a. A basic conditional logit model assuming full attendance (CL) b. A conditional logit interacting the attributes with individual-specific dummies on stated
importance (CL-stated weights) c. A latent class model including inferred ANA strategies and individual/building characteristics
influencing class probabilities (LCM-ANA) In addition, we will explore whether there is some unobserved preferences for the labeled alternatives, especially between the ee alternative24 and the epc alternative that cannot be explained by the attributes. This will be done by relaxing the assumption that the parameters are equal across alternatives. Moreover, a special emphasis will be put on the respondents for whom EPC is likely to remove binding constraints hampering energy efficiency investments. We will explore through which mechanisms it may do so. Finally, the impacts of other individual or building characteristics will be assessed. ________________________________ 22 In which parameters are constrained to be the same across classes. 23 “Unconstrained” means that coefficients are not constrained to be equal across classes as opposed to the equality- constrained latent class model (ECLCM). 24 Investment in energy efficiency without energy performance contract.
172
4. Data 4.1 Response rate In total, 2215 survey invitations were sent, with 2203 of those successfully delivered. Overall 533 (26 %) of potential respondents looked at or began the online survey, and 297 respondents fully completed the survey (14 % of invitations delivered). The completion percentage has to be put in the perspective of a survey with a complex choice experiment and a high degree of information that must be looked for by the respondent about the building (e.g. retrofits done and planned, year of construction, year and type of heating system, energy consumption). Reminder phone calls provided additional information on the reasons not to complete our survey. The main reason stated by respondents was lack of time, lack of resources and lack of access to the necessary information. Only a small number of respondents evoked a lack of interest, which suggests that selection bias may not be so important in our sample. The response rate varied greatly between the categories of respondents. The highest rate of response was in the case of schools (56 %), whereas the lowest were from hotels (4 %). 4.2 Descriptive statistics of the participants 4.2.1 Building characteristics Education facilities represent the largest share in the sample (Table 2), followed by public administration and offices. A majority of buildings in the sample are publicly-owned and not rented. A large number of buildings in the sample could typically be targeted by EPC since they are in majority rather old buildings with a significant size, as shown in table 3. Almost a third of the buildings were constructed between 1966 and 1979 and 85 % of the sample were built before 1990. A majority of buildings (57 %) have a surface larger than 2000m2. A majority of respondents (60 %, i.e. 178 of 297) have a heating system installed before 2005. Oil heating systems are the more frequent in the sample (37%), followed by gas (29%), district heating (26%) and woodchips (12%). The average yearly electricity costs amount to 67,000CHF/year (median 50,000CHF/year) and the yearly energy costs (excluding electricity) to 60,000CHF/year (median 25,000CHF/year). Therefore, a majority of the buildings in the sample have medium to large energy consumption and could typically be targeted for EPC. The majority of the buildings in the sample are also promising in terms of retrofits opportunities. Only 3% of the owners have already retrofitted the building envelope, while it is planned for 33% of them in the next 5 years. Another 20% of the respondents stated to plan a simple building overhaul (such as wall painting or window painting). These could also be interesting targets for EPC. These respondents’ buildings will need a retrofit in the coming years, but they are not planning to enhance the insulation, maybe because of some barriers. Heating systems replacement and building automation (such as lighting and heating controls) may be less relevant for the 20% of the respondents who have already implemented these actions. We controlled for this in the analysis.
Table 2: Building types
Freq. Percentage in
sample (N=297) (%)
percentage of publicly-owned buildings
(%)
Percentage of (partly) rented
buildings
Education facility 145 48.82 97.18 22.07 Offices 22 7.41 63.64 68.18 Hotel 20 6.73 0.00 15.00 Hospital 14 4.71 71.43 35.71 Public 50 16.84 100.00 48.00 Shopping center 7 2.36 0.00 100.00 Sport facility 10 3.37 100.00 30.00 Residential 14 4.71 71.43 100.00 Mixed 5 1.68 40.00 100.00 Other 10 3.37 80.00 40.00 Total 297 100 82.25 37.71
4.2.2 Characteristics of respondents 195 respondents (66%) are from the Swiss German part. The largest share of respondents is managers in charge of public buildings at the cantonal or municipal level (Figure 3). Facility managers represent one quarter of the sample. In average, the respondents have an experience of 9 years in that function (std. dev. 7.82). 36 (12 %) of the respondents are women while 11 respondents (4 %) did not specify their gender. 148 (50 %) of the respondents have a university or a HES degree, 92 respondents (31 %) have a professional formation. All respondents are involved in the decision process regarding the building retrofits. 129 respondents (43%) take part of the decision. The others play a role in the pre-selection of the options, advising or making propositions to the decision-makers.
Figure 3 - Job function of the respondent (the category other includes for instance municipal secretary or directors)
5. Results 5.1 Familiarity with EPC concept 157 (53 %) out of the 297 respondents who completed the survey stated that they were already familiar with the concept of energy performance contracting. The emphasis we put in order to explain energy performance contracting within the survey bore fruit since 93% of them claimed that they understood clearly the concept after the survey’s explanation. Almost half of those who claimed to have understood the concept were respondents which were unfamiliar to EPC before the survey. This suggests that the majority of respondents answered the choice experiment with a clear perception of energy performance contracting.
174
5.2 Investment choices The percentage of respondents choosing each option is provided in Figure 4, averaged across the 4 choice tasks. The decisions when 2 alternatives are proposed are compared to the situation in which energy performance contracts are additionally proposed. In average, more than 5 respondents choosing simple overhaul in the 2 alternatives case switch for EPC when it becomes available (5.3 % out of 297, dashed green arrow in the figure). These represent more than 21 % of the 75 (25.1 %) respondents who chose overhaul in the first place. From another point of view, 34 (11.5 %) of the 297 respondents switched at least once from overhaul to EPC when it became available. This gives a rough idea of the number of persons for whom EPC might mitigate some barriers to investments in energy efficiency. We explore in section 5.7.1 which mechanisms of energy performance contracting might induce energy efficiency investment for these respondents that we call “EPC responsive”. In average, 24.1 % of the respondents choose energy efficiency in the first place and then opt for EPC when it becomes available. In total, 133 respondents switched at least once from energy efficiency investment to EPC when available. These respondents represent mainly education and public administration facilities as well as hotels. For these respondents, EPC may work as facilitating investment in energy efficiency.
Figure 4 - Experiment choices
Notes: percentage of respondents (out of N=297) choosing each option and switching from one option to another, once EPC is additionally proposed (percentage based on average number of persons across the four choice tasks). The dashed green arrow represents respondents who we call “EPC responsive”. The red arrows represent choices that do not satisfy the independence of irrelevant alternative (IIA) assumption. The design of the choice experiment, with a first choice of 2 alternatives and a second with an energy performance contract additionally proposed, presents the interesting advantage of revealing incoherent choices. An average of 2.7 % persons chose overhaul initially and changed to investment in energy efficiency once the contract was additionally proposed. Conversely, 0.8 % in average changed their mind from investment to overhaul once EPC alternative is added. These incoherent decisions, made at least once by 29 persons in the sample of 297 respondents, represent situations in which the independence of irrelevant alternative (IIA) assumption is not satisfied. This may result in biases in the estimations using conditional logit. The models were also estimated while excluding these respondents in the robustness checks section. Despite the variations in the attributes levels, the decision patterns are very similar across choice tasks, i.e. 46% of respondents choose the same alternatives (EE, EPC or overhaul) in all choice tasks. 26 respondents chose always overhaul, 79 always energy efficiency investments and 33 chose EPC every time it was proposed. From another point of view, 174 persons never chose overhaul, 149 never chose EPC and 33 never chose energy efficiency without contract. This observation supports the assumption of heterogeneous preferences across respondents.
175
The median time spent on each choice task suggests that respondents probably considered more carefully the first-choice task as suggested by the median time spent on choice tasks, which decreases drastically across the four choice tasks (table 5). This might suggest that respondents either got bored, simplified the decision process or learned by doing. The follow- up questions on the stated certainty of decisions made by the respondents provide additional information on the matter. Indeed, respondents stating that they consider their choice as being a clear decision are 62 % in task 1, 68 % in task 2, 72 % in task 3 and 4. This observation may therefore suggest that the respondents gained understanding throughout the choice experiment allowing them to save time. Robustness checks will anyhow explore the potential impacts of choice tasks, certainty and time spent on the estimates. The respondents with persistent choices are not necessarily those who spent the least time on the choice tasks25.
Table 5: Respondent's time on each choice task (seconds)a
5.3 Stated barriers to investment in energy efficiency actions Follow-up questions to respondents who never chose energy efficiency measures and/or energy performance contracts provide useful information on the barriers hampering the deployment of these options. Figure 5 provides a summary of the reasons why respondents never chose energy efficiency investments. 8 respondents (31 %) out of the 26 individuals who always chose overhaul stated that the building considered was already efficient. It is important to note that 3 of these respondents have already retrofitted the building envelope since 2006 and 4 others have replaced their heating systems since 2011. The second category is represented by respondents stating that energy efficiency investments are not economically viable. The same number of respondents (6) stated to never choose energy efficiency measures since the building was protected and change in aspects is impossible. 4 respondents chose always overhaul as a mechanism to deal with choices that were too complex for them. This suggests that, even when simplified energy efficiency options are proposed, one simple reaction is to opt for the simplest option, i.e. simple overhaul. These respondents are likely to be constrained by their lack of technical knowledge. 3 respondents stated to lack human resources. Finally, one person mentioned the problem of transferring the costs onto the tenants. This person also declared in a subsequent question that she does not think that ESCOs, by providing some advice on how to transfer costs onto tenants, can help her mitigate this barrier. ________________________________________________ 25 This can be seen in a pairwise correlation of -0.14 between median time spent on choice tasks and a dummy equating one when the respondent chose always the same alternative. This correlation does not change when omitting the respondents stating that their building is already efficient, protected or planned to be destroyed to compute the median time spent on choice tasks.
Respondent’s time on Median Mean Std.dev. Min Maxb N
Time on task 1 79 180.67 915.23 13 14,182 295 Time on task 2 33 62.17 125.845 6 1,265 295 Time on task 3 25 57.95 302.157 4 5,161 296 Time on task 4 18 43.63 189.118 3 2,879 297 a
When omitting respondents who stated that their building is already efficient, protected or planned to be destroyed and thus never chose energy efficiency investments (with or without EPC), the median times are the following: 76.5 in task 1, 34 in task 2, 25 in task 3 and 19 in task 4. b
A large duration can suggest that the respondent did other activities while keeping the survey screen open.
176
Figure 5 - Barriers to energy efficiency investments.
Note: Share of the 26 respondents who always opt for overhaul/status quo (nb. of respondents in brackets). Other reasons mentioned by respondents were the fact that such investments were not planned in the budget. No respondent mentioned a problem of access to credit for such investments. Participants who always opted for overhaul were also asked to perform an additional choice task, identical to the fourth task, but with only EPC and energy efficiency without contract options available. While 12 participants (46 %) chose energy efficiency without contracts, 13 stated they were indifferent between the two options and only one respondent opted for EPC. This suggests an intrinsic preference for investment without contract as compared with EPC. 5.4 Stated barriers to EPC The reluctance towards EPC is also visible in the fact that more than 50 % (149) of the sample of 297 completes never opted for energy performance contracting. The reasons as stated by the respondents are presented in Figure 6 (information is missing for one of these respondents). The main reason mentioned is the unwillingness to outsource the control of operation and maintenance for 58 respondents. This may come from respondents’ misperception as they may perceive the ESCO’s control of operation and maintenance as a necessity to forgive existing facility managers or employees in charge of the technical equipment. This is however not the case since the ESCO controls the operation by providing the facility managers with training courses on how to use and understand the new equipment or efficiently managing the building (Swissesco (2016)). It is followed by 44 individuals stating that EPC is not economically viable. A t-test shows that there is no significant difference in the mean size26 among respondents who see EPC as not economically viable and the others. Then, 36 respondents are concerned about legal issues resulting from such contracts and 33 with complex tendering processes. This can be closely related with the complexity of the contracts, perceived also by 33 individuals. Then, 25 respondents are preoccupied by the adequacy of EPC with universal conventions of objectives that large energy consumers in Switzerland have to implement with federal agencies to meet legal requirements. ______________________________________
26 The size is described here in terms of the building’s heated surface.
177
Finally, 21 persons mentioned accounting issues and 20 lack of trust. For respondents concerned about trust and universal convention of objectives adequacy, additional questions were asked to explore these further. Concerning trust, we asked the concerned participants to state whether their trust would increase should the ESCO be an energy utility. 26 % stated that indeed it would increase their trust, 68% stated that their trust would not change and 1 individual (5 %) mentioned a decrease trust towards utilities as ESCOs. This may suggest a different consideration for utilities in Switzerland as compared to Germany. Polzin et al. (2016) indeed show that existing partnerships with utilities impact negatively EPC adoption. Concerning universal convention of objectives, we asked whether they would be more inclined to sign EPC if the ESCO was certified by a federal agency to implement such a convention. Interestingly, only 8 respondents (35 %) stated that it would increase their willingness to adopt EPC. The rest was indifferent or even less inclined (1 person) to sign. This interesting observation suggests that an important priority for ESCOs is to inform about the adequacy of EPC with universal conventions of objectives for large consumers. This is the case even for ESCOs which are already certified to implement those conventions. 14 respondents did not provide any reason to explain the fact that they never chose EPC. This could suggest an unexplained unwillingness to adopt EPC. Interestingly, 13 of these respondents were unfamiliar with EPC before completing the survey. While this cannot provide information on the causality, the correlation between unexplained distaste for EPC and unfamiliarity with the concept can suggest that information campaigns with best practices are needed to overcome the barriers linked to the novelty of this model in some people’s mind. This lack of information and biased perception of EPC are also visible in the other reasons respondents mentioned for not choosing the contracts. For instance, some respondents stated that EPC was not possible since the building is public or because they were financially constrained. In fact, EPC are typically targeted to buildings with these characteristics. Other legitimate reasons mentioned are the commitment to an external firm that these contracts involve (7 respondents), the willingness to invest themselves especially in a context where credit is as cheap as now (5 persons), the contract’s duration which was too long (3 respondents) and qualified human resources already available internally (2 persons). One participant was also concerned about the difficulty to sell a building committed with an EPC. Other respondents gave the same reasons as those who always chose overhaul such as protected buildings where transformation is impossible.
Figure 6 - Stated barriers to energy performance contracting
178
To summarize, while EPC has been seen in foreign markets as an instrument to reduce and mitigate barriers to investments in energy efficiency (e.g. Capelo (2011), IEA-RETD (2013)), in an emerging market such as Switzerland where a lot of open issues remain on the concept, it appears a priori that the perceived barriers are even stronger and more numerous for EPC than for energy efficiency investments without contracts. If EPC can indeed reduce constraints on financing and performance on the clients’ side, hard work is still needed to mitigate transaction costs linked to those contracts. A large part of this task will probably include information campaigns and dissemination of best practices examples, which has already started under the impulse of the swissesco association and the Swiss federal office of energy. 5.5 Attributes summary statistics The percentage of times each measure was proposed in the choice experiment is presented in Table 6, in which N represents the total number of observations in the choice experiment analysis, i.e. the number of alternatives (3+2) multiplied by the number of choice tasks (4) and the total of respondents (297).
Table 6 - Summary statistics of measures
N=5940 Variables (dummies)
Mean (% of N)
Group dummy control technic 46.35
building automation 46.01 exploitation optimization 0.69
controlled ventilation 0.25 Group dummy control mix 13.64
biogas mix (if already gas) 13.43 green electricity mix 0.20
Group dummy control heating 16.90 new heat pump 11.03
new wood heating 5.13 solar panels 0.74
Dummy control envelope 27.95 Overhaul façade, windows (painting) 23.54 Overhaul boiler revision 14.58 Overhaul technical revision 1.21
Note: One alternative can include several measures (e.g. heat pump + building automation)
The dummies used in the analyses of the results section are the four group dummies technical, mix, heating and envelope. Because building automation was proposed alone and as a combination with other measures, it has been the most often proposed (46 % of the alternatives). 28 % of the options were including envelope enhancement, 17% new heating systems and 14 % proposed a mix of biogas or green electricity in the current consumption. The summary statistics of the attributes of interest are provided in Table 7.
Table 7 - Summary statistics of attributes
Variable Mean Std. dev. Min Max N Attribute of overhaul, ee, epc alternatives
upfront cost (CHF/m2 heated surf.) 119.3 77.8 0 300 5940 Attributes of ee and epc alternatives
The upfront cost lies between 0 and 300 CHF per heated squared meters of surface and is zero for status quo alternatives. Because expected savings and savings variation concern only alternatives with energy efficiency measures or energy performance contracts, these variables are set to zero in overhaul/status quo alternatives. Similarly, all the contractual elements concerning only the EPC alternative are set to zero in the other options. Upfront cost share can also be null in EPC options without external financing as well as guarantee which is not proposed in every contract. However, all contracts involve a positive payment per year to remunerate the ESCO and a positive contract’s duration27. The allocation of respondents across the 5 design types shaped the distributions of the attributes’ levels. Just before entering the choice experiments, the respondents were randomly assigned additional information on energy efficiency non-monetary benefits and/or on the advantage of EPC of having a guarantee on the costs. In total, 145 respondents (49%) were provided the additional information on energy efficiency supplementary benefits and 139 of them (47 %) received the information on EPC. Out of these, 54 participants (18 %) received both information. The impact of this information will be explored in the next section. 5.6 Stated attribute importance
Figure 7 - Stated attribute importance Because attribute non-attendance is expected to have an impact, it is interesting to explore the responses of participants regarding attributes importance. Figure 7 illustrates the share of respondents stating that the concerning attribute was considered important in the decision process of the choice experiment28. Table 8 provides additional details on the patterns of attributed non-attendance stated by at least 4 persons. These are the patterns that were considered in the latent class models exploration (see section 3.4.2 for more details). 19 respondents (6 %) stated that they considered the costs, the savings and the measures proposed as important. As a matter of fact, costs and savings are the attributes that are present the most often in the combinations. ____________________________________ 27 More details on the possible levels of the attributes are provided in Table 9. 28 A simple logit regression of stating the cost as an important attribute on diverse regressors did not allow identifying the determinants of attribute importance as these appear to be non-significant. The following regressors were tested: private buildings, rented buildings, the yearly energy and electricity costs of the building, the language, age, gender, education and experience of the respondent. Surprisingly, stated barriers to energy efficiency investments (e.g. non-economic viability of these investments, destruction planned for the building, protected buildings) did not have an impact on considering the cost as an important attribute either.
180
Conversely, 23 individuals stated that no attribute was more important than another in their decision making. This can either be interpreted as full-attendance or none-attendance. Although respondents were able to state 4 attributes considered as important, a majority of them (52 %) gave 1 to 3 attributes as important. This further supports the hypothesis of attribute non-attendance in the sample.
Table 8 - Combination of important attributes (>6 persons)
Combination of important attributes Nb resp. Share
No attribute is more important than another 23 0.08 Cost-sav.-meas. 19 0.06 Cost-sav.-meas.-risk 16 0.05 Cost-sav. 13 0.04 Cost-sav.-meas.-fin. by ESCO 12 0.04 Cost 9 0.03
Cost-sav.-meas.-guar. / sav.-meas.a
7 (2x) 0.02 (0.05) a In the last line of the table, two groups of 7 individuals can be observed. For instance, 7 individuals
considered costs, savings, measure and guarantee from the ESCO and 7 others stated that savings and measures were important attributes in their choices.
5.7 Estimation results: Does EPC induce investment in energy efficiency and through which mechanisms? The estimation results are provided in Table 9 for the basic conditional logit in the first column, the conditional logit for attributes interacted with individual stated attributes importance dummies in the second column. These dummies equate one when the individual stated that he considered this specific attribute as important and zero otherwise29. The latent class model for inferred attribute non-attendance (ANA) is provided in Table 10. One can first note that accounting for ANA increases the performance of the models according to the log likelihood, the Bayesian information criterion (BIC) and the Akaike-Schwartz Information Criterion (AIC). The upfront cost, expected savings, guarantee from the ESCO and the measure envelope are statistically significant in both conditional logit models and present intuitive directions. The hypothesis H2 is confirmed since a guarantee from the ESCO is consistently increasing the probability to invest in energy efficiency. Dividing the guarantee coefficient with the upfront cost coefficient results in a willingness to pay of CHF /m2 9930 for a guarantee in energy savings with 95% confidence interval lying from CHF/m2 4.41 to 194.42. The positive impact of a guarantee contrasts with the one from Polzin et al. (2016) who find that municipalities do not positively value the risk-sharing advantage of EPC in LED retrofits projects. Conversely, having a part of the upfront cost financed by the ESCO does not seem to be significantly positively valued by the respondents, a priori refuting hypothesis H1. This suggests that access to credit does not seem to be a barrier to energy efficiency investment in Switzerland, at least in the current conjuncture. This result contrasts with the general observation by Panev et al. (2014) that financing energy efficiency projects is one of the main issues. ______________________________________ 29 Full attendance (i.e. all dummies equate one) is assumed when the individual ticked the maximum number of attributes possible (i.e. 4 attributes) and when the respondent chose the option: “no attribute is more important than another”. 30 For the median respondent (with 2500 m2), the willingness to pay for a guarantee equals 247,500CHF.
181
Table 9 - Estimation conditional logit
Notes: conditional logits (clogit) are estimated using stata. Clogit stated weights uses an interaction of attributes with dummies of individual-stated attributes importance. These dummies equate one when the individual stated that he considered this specific attribute as important and zero otherwise. Individual-cluster robust standard errors in parentheses. ***P<0.01, **P>0.05, *P<0.1.
Except from ESCO financing, all the contractual attributes become statistically significant once stated weights are controlled for. Once we account for heterogeneity in the weights allocated to each attribute, the annual payment to the ESCO has the expected negative significant impact on the decision to opt for EPC. Also, contract’s duration unambiguously has a negative impact for the respondents who considered this attribute, suggesting the disadvantages of a long-term contract (e.g. commitment and dependence to an external firm) offset the advantages (such as maintained performance over the contractual period and more comprehensive refurbishments opportunities). The willingness to pay for a guarantee is also larger when accounting for stated attributes weights. It is estimated at CHF/m2 31731 (95% confidence interval from CHF/m2 -4.85 to 638.90). A latent class model is used to explore ANA and heterogeneity in preferences. In order to select the relevant ANA patterns, the respondents stated weights (Table 8) were used as a basis. All combinations figuring in Table 8 and concerning more than 6 persons were considered. By an iterative process and starting with the groups representing the largest number of respondents, we tested how including each group affects the efficiency of the model in terms of information criteria (Akaike and Bayesian information criteria). We started with a LCM with two classes: ______________________________ 31 For the median respondent with 2500m2, the willingness to pay therefore equals CHF 792,500.
dependent variable: choice (=1 if choose alternative j)
Full attendance, representing the group of respondents stating that no attribute was more important than another in their decision (23 persons).
Only upfront costs, savings and the energy efficiency measures are attended to (as these attributes are stated as important by 19 persons in the sample). All other attributes are constrained to equal zero.
We subsequently added the other groups, in the same order as in Table 8. When the group lead to smaller information criteria, it was kept, otherwise it was removed. In this manner, seven latent class models with two to six classes were tested32.
Table 10 - LCM with inferred attribute non-attendance
Dependent variable: choice (=1 if choose alternative j)
LCM Inferred ANA
(6classes) (1) (2) (3) (4) (5)
Upfront cost -0.016***
(0.005) -0.006* (0.003)
-0.006 (0.006)
0 -0.111***
(0.025)
Expected savings 0.018* (0.011)
0.034*** (0.006)
0.031** (0.012)
0.017** (0.007)
0
Savings variation -0.030 (0.032)
0 0 0 0
Upfront ESCO 0.019
(0.012) 0 0 0 0
Savings guarantee -0.167 (0.634)
0.660** (0.319)
0 0 0
Payment to ESCO -0.147** (0.057)
0 0 0 0
Contract’s duration -0.345***
(0.105) 0 0 0 0
Meas. envelope 7.135*** (1.127)
0.280 (1.067)
-2.474*** (0.902)
-0.688 (0.796)
0
Meas. technic 2.175*** (0.635)
0.282 (0.391)
1.874** (0.834)
-0.566 (0.356)
0
Meas. mix 2.800*** (0.654)
-0.819 (0.944)
-1.303* (0.757)
-1.291* (0.715)
0
Meas. heating 1.095** (0.950)
-0.312 (0.975)
0.104 (0.851)
-2.098** (0.822)
0
ASC ee alt. 0 3.753*** (1.093)
0 0.691
(0.772) 0
ASC epc alt. 0 3.978*** (1.138)
0 0.896
(0.823) 0
Class probability as a function of stated weights group
Constant 1.046*** (0.297)
0.777** (0.313)
-0.716 (0.521)
0.652** (0.326)
0
Familiar with epc(dummy) 0.625
(0.450) 0.808* (0.463)
0.938 (0.671)
-0.359 (0.589)
0
Average posterior class probabilities 0.363 0.309 0.075 0.159 0.094 observations 5940 Individuals 297 Loglikelihood -1214.374 AIC 2512.7 BIC 2755.2
Notes: Estimated using Nlogit. Standard errors are in parentheses. ***P<0.01, **P>0.05, *P<0.1. Attribute non- attendance is expressed as coefficients being constrained to equal zero. Familiar with EPC before the survey. ASC stands for alternative-specific constant.
_______________________________________ 32 From the model with minimized information criteria, we checked whether a more efficient model could be found by omitting one of the classes, or by adding a class previously eliminated. A second full attendance class or a complete none attendance class (with and without ASC) were also added to check whether the model would be improved. This was not the case
183
The final combination of selected ANA patterns which minimized the information criteria is presented in Table 10. Some classes showed a very large p-value for alternative specific constants (ASC). This suggests that for the respondents in these classes, the label of the alternative has no impact and the attributes entirely capture the differences of preferences among the alternatives. For these classes, we therefore also set the ASC to equal zero33. This suggests that some respondents have preferences towards energy efficiency, EPC or overhaul that are not entirely captured by the attributes. Further exploration of this phenomenon is provided in section 5.7.3. Once the classes and ANA patterns determined, we tested whether individual or building characteristics had any impact on the class probabilities. Being familiar with EPC is the only characteristic showing a significant impact34. The model retains five classes, with full attendance (class 1). In three of the classes (classes 3, 4, 5), EPC contractual attributes are not attended to. These 3 classes together are estimated to represent a third of the sample. Costs, savings and measures are the attributes that are the most often considered. This is consistent with the stated most important attributes. Respondents considering EPC contractual clauses are split into two classes (classes 1 and 2). Both classes are characterized by an average posterior class probability around one third. In the first group, respondents value negatively the payment to the ESCO and the contract’s duration. The respondents are also more sensitive to the upfront cost. In the second class, respondents are relatively more sensitive to the savings and the guarantee offered by EPC. The individuals previously familiar with the EPC concept are more likely to belong to the second class, i.e. valuing positively the guarantee. The second class’s respondents are also more likely to choose energy efficiency investments, with or without contracts, as expressed by the alternative-specific constants. In the third and fourth classes, respondents consider upfront costs, savings and measures35. The sensitivity to energy savings and measures is different in these two classes. The last class, with a class probability slightly larger than 9%, represents individuals considering only cost which is translated by a relatively large coefficient in this class. Overall, the latent class model distinguishes specific groups of respondents, while accounting for heterogeneity in both preferences and attribute non-attendance. The models also show that even by splitting the respondents considering contractual clauses into two distinct classes, the ESCO financing attribute is still not significantly valued by respondents. 5.7.1 Differences in preferences of respondents who are EPC responsive In order to test further the ESCO’s financing attribute (Hypothesis H1), we focus on the respondents whose decisions suggest that they may face barriers to energy efficiency investments that EPC could solve. These are typically the individuals who chose overhaul when EPC was not available and changed for EPC in the second-choice task when it was proposed. A dummy “EPC responsive” was created which equates one for all the respondents who behaved this way in one choice task at least. It concerns 34 participants (11% of the sample) and a majority of them (27) are representing public buildings and especially education facilities (17 buildings). __________________________________ 33 This phenomenon is however not observed in all classes (e.g. class 2). The model of Table 10 was also tested by completely omitting ASC in all classes. The model showed a milder performance in terms of information criteria, but the results in terms of sign and significance are similar. 34 We tested other characteristics such as private vs. public buildings, tenants, yearly energy/electricity costs, heated surface, retrofits done and planed, random information on non-economic benefits of energy efficiency investments, random information on cost guarantee from EPC, EPC not economically viable as stated by the respondent, function, experience, age, gender, education of the respondent. All these individual and building characteristics were also tested using interaction in conditional logit models. The results are provided in section 5.7.2. We also tested whether dummies for belonging to specific groups of stated attribute importance matters in the class probability. These dummies happen to be non-significant. This might suggest that the inferred attribute nonattendance not exactly corresponds to the weights stated by the respondents. 35 Even if the cost is not significant in the third class, colluding these two classes does not improve the model. The signs and significance of contractual, cost and savings attributes are the same when omitting class 4. The model performance is lower and the only difference lies in the signs and significance of the measures in class 3. This suggests that classes 3 and 4 have different preferences regarding measures and separate them permits to capture those differences.
184
These numbers are interesting to compare with the share of 20% of financially constrained municipalities in Germany found by Polzin et al. (2016). This dummy was interacted with all attributes and Table 11 shows the results when keeping only the interactions that are statistically significant36 . First of all, the coefficient for upfront cost presents a greater negative magnitude for these respondents, which may suggest that they are limited in terms of credit possibilities. The heterogeneity between the cost estimates is confirmed by a Wald test rejecting equality at more than 90% confidence level. These respondents are more likely to value significantly and positively financing from the ESCO, with a difference significant at more than 99 % confidence level. These respondents value also significantly more greatly the fact of having a guarantee (>99 % confidence level).
Table 11 - Impact of contractual clauses for individuals responsive to EPC
Notes: Individual-cluster robust standard errors in parentheses. ***P<0.01, **P>0.05, *P<0.1. EPC responsive indiv. is a dummy which equates 1 for respondents who, at least in one choice task, chose overhaul when EPC was not available and then switched to EPC once proposed. 34 respondents (11% of the sample) belong to the group of EPC responsive individuals.
Their estimated willingness to pay for a guarantee is estimated at CHF17437 ([90.00; 258.68] 95 % confidence interval) as compared to CHF 70 ([-38.69; 177.77] 95 % confidence interval) for respondents who are not responsive to EPC. ______________________________ 36 This dummy has also been tested as an individual characteristic influencing the classes’ probabilities in the unconstrained LCM. The model however could not converge when accounting for this variable.
Dependent variable: choice (=1 if choose alternative j)
clogit
Upfront cost (CHF/m2 heated surface)
-0.003** (0.002)
Upfront cost x EPC responsive indiv. (CHF/m2 heated surface)
Savings guarantee 0.235 (dummy) (0.175) Savings guarantee x EPC responsive indiv. 1.390*** (dummy) (0.286) Payment to ESCO 0.001 (CHF/m2 heated surface per year) (0.013) Contract’s duration -0.022 (years) (0.016) Measure envelope 0.965** (dummy) (0.444) Measures group technic 0.405** (dummy) (0.187) Measures group biogas/green elec mix 0.142 (dummy) (0.396) Measures group heating 0.027 (dummy) (0.398) Alternative specific constant ee alt. 0.337 (dummy) (0.415) Alternative specific constant epc alt. -0.283 (dummy) (0.525) Observations 5940 Individuals 297 Loglikelihood -1787.218 AIC 3606.4 BIC 3713.5
185
These results suggest that in a context where credit is available at attractive rates, most of the respondents are not facing limited access to credit for energy efficiency investments. There is however a relatively small number of exceptions, who are mostly public entities and who may be credit constrained. A natural deduction from this is that the financial constraint experienced by these collectivities comes from the credit limits set by the legislative organ such as debt ceilings. Hypothesis H1 is confirmed and is in line with the findings of Polzin et al. (2016) who find higher willingness to consider EPC when financially-constrained. As a matter of fact, in the current conjuncture, such credit limits are probably the only cases where financing from the ESCO is interesting and significantly positively valued. The estimated willingness to pay for 1 % of upfront cost financed by the ESCO is estimated at CHF/m2 1.0938 ([0.41; 1.78] 95 % confidence interval). The median upfront cost being 100CHF/m2 in the choice experiment, the estimated willingness to pay is 1.09 CHF/m2 for each additional 1 CHF/m2 paid by the ESCO. 5.7.2 Impact of individual or building characteristics As in the latent class model, being familiar with EPC is proven to be positively related to the willingness to adopt energy efficiency measures, with and without EPC in the basic conditional logit model. This has been shown by interacting a dummy for EPC familiarity with alternative- specific constants of EE and EPC model (cf. Table 18, column (1)). Other individual and building characteristics were tested and did not have a significant impact, neither in the LCM class probabilities nor when interacted with attributes in the conditional logit model. For instance, private vs. public buildings did not result in significantly different estimates (cf. Table 18, column (2)), even when interacted with the contract’s duration attribute in the conditional logit model. This result contrasts with the presumption of a divergence in contract’s duration valuation. Moreover, private firms do not value significantly differently a guarantee or the ESCO’s financing than public entities. The fact of having tenants did not show a significant impact on the likelihood to invest in energy efficiency, with or without contract (cf. Table 18, column (2)). The determinant was not significant either when interacted with the payment to the ESCO. This apparent absence of split incentives barrier to investment may be explained by the fact that buildings with tenants are a minority in the sample (38 %) and more importantly private rented buildings represent a small share (8 %). Split incentives issues may indeed be less representative in public rented buildings for which the motivation to retrofit is not mainly economically-driven. Therefore, this sample may not be representative to explore the split incentives barrier to energy efficiency investments. This is also supported by the observation in section 5.3 that only one respondent mentioned the tenants as being a potential barrier to energy efficiency investment. Then, there is no evidence of scale effects in the decision patterns, as when controlling for energy and/or electricity yearly costs (in CHF) (cf. Table 18, column (2)), or heated surface. We also tested whether heterogeneity in decision making processes had any significant impact on the valuation of attributes. The respondents were asked to state whether there were budget or contract’s duration thresholds above which they would need to consult other entities within the firm/the institution to decide. Interaction terms of these thresholds with upfront costs or contract’s duration were added to the basic conditional logit model. Because these interaction terms were not significant, it is possible to conclude that these thresholds did not have significant impacts on the estimates for these attributes. The barriers as stated by the respondents, such as EPC being seen as not economically viable were also tested and did not have a significant impact on the willingness to invest with or without EPC. Finally, the random information provided on the non-monetary benefits of energy efficiency investments as well as the guarantee on costs provided by EPC did not have either a statistically significant impact on the decision to invest. We tested whether the function of the respondent in the firm/institution has an impact on the investment decisions ((cf. Table 18, column 3). If the respondent is the energy manager of the building, the likelihood to invest in energy efficiency with and without EPC increases.
37 This equals to 435,000CHF for the median size respondent (2,500 m2) and 175,000CHF for respondents who are non-responsive to EPC. 38 For the median cost of 100CHF/m2 for energy efficiency measures
186
This could be explained by the fact that energy managers are likely to be better informed about the options to invest in energy efficiency and their positive benefits, including EPC, which may induce investment. This also means that energy managers are aware that performance contracts do not represent a threat to their job and thus are not reluctant towards EPC. When the respondent is a person in charge of municipal or cantonal buildings, there is a significant reluctance to opt for energy efficiency, with and without EPC. Moreover, the participant’s number of years of experience within the firm/institution also affects negatively the propensity to opt for EPC. Experience is however not significant when interacted with the ASC for EE. The age, the gender and the role in the decision process of the respondent does not have any significant impact. Finally, the building types do not have significant robust impact on the willingness to invest in energy efficiency, with or without contract. 5.7.3 Relaxing assumption of equality of parameters across alternatives: is there an intrinsic reluctance towards EPC? 149 respondents (50 % of the sample) never opted for EPC. Moreover, the previous results show that a large share of individuals did not attend to attributes specific to the EPC alternative. This suggests an intrinsic reluctance to invest in energy efficiency through EPC, even when controlling for the advantages (guarantee, financing) and costs (payment, duration) that are captured by the contractual attributes. In order to explore this conjecture further, a conditional logit with alternative specific estimates for all attributes is estimated. The results are provided in Table 12.
Table 12 - Alternative-specific estimates of attributes
Dependent variable: choice (=1 if choose alternative j) clogit
Savings guarantee 0.284** (dummy) (0.144) Payment to ESCO -0.007 (CHF/m2 heated surface per year) (0.011) Contract’s duration -0.026** (years) (0.012) Measure envelope 0.923** (dummy) (0.436) Measures group technic 0.474** (dummy) (0.185) Measures group biogas/green elec mix 0.007 (dummy) (0.384) Measures group heating -0.081 (dummy) (0.383) Alternative specific constant overhaul alt. -0.328 (dummy) (0.425) Observations 5940 Individuals 297 Loglikelihood -1838.062 AIC 3708.1 BIC 3815.2
Notes: Individual-cluster robust standard errors in parentheses. ***P<0.01, **P>0.05, *P<0.1. Interactions of attributes with alternative specific constants, except from the measures which are used as controls and not interacted.
187
While the cost of the overhaul alternative does not have a significant impact on adoption, this attribute is significantly valued more negatively in the EPC alternative than in the alternative of energy efficiency without contract (Wald test with >95 % confidence level). These significant differences in the cost attribute suggest a smaller willingness to invest in energy efficiency through EPC than without contract, even when controlling for all other observed differences between the two options. This means that other perceived barriers, not presented in the choice experiment, explain a reluctance to opt for energy performance contracting. An overview of the stated reasons is presented in section 5.4. Considering alternative-specific estimates results in a significant negative impact of contract’s duration as opposed to the basic conditional logit model in Table 9 column 1. This also points towards the perceived disadvantage of long run commitment with an external firm also described in section 5.4. 5.8 Robustness checks and further research Using an unconstrained latent class model, i.e. with varying coefficients across classes, permits to explore heterogeneity in attribute non-attendance patterns and in preferences. As opposed to an equality-constrained latent class model (ECLCM)39 however, this increases the model’s parameters to estimate and irrelevant classes are also more difficult to detect40. As a result, it is impossible to explore all ANA combinations using unconstrained LCM. In order to check the robustness of the LCM of Table 10, we used a method with equality-constrained latent class models to explore the relevant ANA combinations. The method follows the iterative algorithm proposed by Lagarde (2013) to explore ANA of single, pair and triple ignored attributes41. The irrelevant classes, i.e. with zero average posterior class probability are dropped and the others are kept for the next steps. The classes surviving to this process are then compared to patterns with four to seven attributes non-attended to. In order to limit the number of possible combinations to consider, we use the stated (one to four) important attributes. All combinations concerning at least 4 persons in the sample are tested. This entire process is implemented in Nlogit. The final model is presented in Table (appendix 9.3) and includes 7 classes. As in the unconstrained model, two classes include attendance to EPC attributes. These however represent a smaller share (around one third) of the individuals than in the unconstrained model. Cost, savings and measures are still the attributes being the most often considered. While larger in magnitude, the coefficients in the ECLCM are similar in sign and significance to the results found in the conditional logit with stated weights42.17 % of the respondents are expected to belong to a class in which no attribute matters. The existence of a none-attendance class may result from the restrictive assumption imposed on the equality of preferences across classes. In order to test whether equality constraint across classes is a restrictive assumption, one can compare the information criteria of the model once the constraint is relaxed. The ECLCM as presented in Table 17 does not converge when relaxing the equality constraint. However, we constrained the LCM of Table 10 and this lead to a poorer performance in terms of information criteria. This suggests that accounting for preferences heterogeneity represents an advantage. ___________________________________ 39 In which parameters are constrained to be the same across classes. 40 Indeed, equality-constrained latent class models (ECLCM) by forcing non-zero parameters to be equal across classes allows to detect irrelevant classes since these show an average posterior class probability equating zero. In unconstrained latent class model, it is really rare to obtain an estimated class probability of zero. 41 This process, beginning with single attributes ignored and following with a higher number of attributes ignored makes the assumption that a single-attribute ignored pattern is considered irrelevant at an early stage has no chance to become relevant once more attributes are ignored. In this process, the dummies for technologies groups representing the attribute for the energy efficiency measures are considered as a block and therefore assumed to be either all ignored or fully considered. This is justified by the fact that in this study, the focus is not on the willingness to adopt specific technologies but rather to assess the willingness to opt for energy efficiency measures as a whole, i.e. taking the measures as controls and focusing on contractual clauses, cost and savings, driving the decision. 42 Only risk has an unexpected significant positive sign, which may be explained in heterogeneity in the way risk is perceived. We can indeed show that some respondents considered the upper bound, the lower bound or both. This translates in a misleading positive coefficient in the ECLCM.
188
The design of the choice experiment, by asking respondents to first choose between energy efficiency and simple overhaul and then propose the same two alternatives with an additional EPC option, provides information on potential incoherent choices. For instance, a respondent stating that he would prefer simple overhaul in the choice task with two alternatives should have no reason to switch for energy efficiency once an additional option, i.e. EPC, is proposed. If he does so, then his decision does not satisfy the assumption of independence of irrelevant alternatives, necessary to estimate conditional logit models without bias. Because these decision patterns occurred for 29 respondents in this sample, it is necessary to check the robustness of the previously found results when ignoring these incoherent choices. Robustness was also tested by omitting the choice tasks in which the respondent took less than 5 seconds to answer43, and by eliminating the choice tasks in which the participant stated that he was uncertain to his choices. We also estimated all conditional logit models while omitting respondents who stated that their building is already energy efficient, planned to be destroyed or protected. Eliminating these choice tasks and individuals, together or individually, did not affect the signs of the estimates shown for conditional logit models. The differences in magnitudes were relatively small, with the largest differences (in the order of three-tenths) when omitting uncertain choices. This had also no impact on the sign and significance of individual and building characteristics described in section 5.7.2. The models were also estimated when accounting for differences across choice tasks, by interacting choice tasks dummies with the alternative-specific constants, in order to control for the possibility of decreased attention throughout the choice experiment. Accounting for it also did not affect the variables of interest in all conditional logit models, with a maximal difference in the estimates of two-tenths. The present study is subject to limitations due to the limited sample size and the low response rate. This however has to be put in the perspective of a complex survey with difficult decision processes for respondents. Moreover, most respondents evoked lack of time or resources to complete the survey. This reduces the risk of selection bias which would occur if respondents would lack interest. The willingness to pay estimates presented in the result section are computed using only the upfront cost coefficient. The choice experiment nevertheless involves two attributes for the cost, i.e. upfront cost and annual payment to ESCO. Another possibility to compute willingness to pay would include both of their coefficients. This would first require making an assumption on the interest rates considered by respondents to translate it into actualized value of all the annuities paid to the ESCO during the contract’s duration. Moreover, the attribute non- attendance patterns found in the previous section suggest that there is heterogeneity in the way that respondents considered the two cost attributes. Some of the participants may have considered cost alone, payment to the ESCO alone or a combination of them. In the same way, some respondents may have translated payment into an actualized value and added it to the upfront cost. This heterogeneity in the decision process heuristics could be explored in further research using for instance more elaborated versions of latent class models. The attribute non-attendance latent class models we used in this chapter could be further developed using the so-called common-metric attribute aggregation. In the same way that Nlogit permits to constrain parameters to be equal to zero in certain classes to account for ANA, it can allow two parameters to be estimated as being aggregated in other classes44. Both ANA and aggregation can be part of the same class. This could be an interesting strategy to apply in further research to explore the willingness to pay for energy savings, ESCO’s guarantee, ESCO’s financing or willingness to accept for contract’s duration. Other research would also be needed in order to determine whether the lack of necessity of ESCO’s financing from a large share of the respondents is specific to the Swiss context and if it is due to the current conjuncture or is a more structural phenomenon. _______________________________________ 43 This relates to 25 observations out of the 5940. 44 See Hensher et al. (2015) for more details on this.
189
The present study also focuses typically on potential clients of EPC, i.e. large energy consumers with consequent energy savings potentials. It would however be interesting to enlarge the focus to explore how smaller energy consumers could be induced to invest in energy efficiency by maybe simplified versions of EPC. Pätäri et al. (2016) show for instance that Finnish SMEs are financially constrained because of other investment needs. Targeting a similar survey as here towards SMEs could be useful to assess whether external financing becomes more interesting relative to a guarantee in this context. This could bring other interesting policy implications for small energy consumers. Landlord-tenant split incentives and legal issues linked to the transfer of retrofit costs onto the tenant did not show any significant impact on the willingness to adopt energy efficiency measures, contrasting with the results from Klinke (2016) regarding energy supply contracting. This subject should be further tested using a sample with a higher share of privately-owned rented buildings, such as residential buildings, office buildings and shopping centers. Finally, the exploration of attribute non-attendance provides interesting insights about the behaviors underlying the decisions to invest in energy efficiency. Further research is needed to explore how behavioral biases could be mitigated to foster investment and reduce the energy efficiency gap. More specifically, non-standard beliefs resulting from a systematic underestimation of discounted future energy costs as compared to the present purchase price may be explored using the aforementioned common-metric attribute aggregation to estimate WTP for energy savings. 6. Conclusions and Policy Implications This paper explores to which extent and through which channels EPC can induce or promote investment in energy efficiency. The analysis is based on a survey of 297 managers and owners of large private and public energy-consuming buildings in Switzerland. The data collection was challenged by a very low response rate, especially for municipalities. The econometric analysis showed first that ESCO’s financing is positively affecting investment only for a minority of respondents. These are mostly public entities, presumably with debt ceilings. This result implies that for the majority of our sample, limited access to credit at reasonable costs is not a determinant of underinvestment in energy efficiency. This result has to be put in the current Swiss conjuncture with low interest rates. For constrained public entities with debt ceilings, on the other hand, the ESCO’s financing’s advantage will only exist if it is possible to account for the EPC project as an operational expenditure off-balance sheet, which is currently not clarified (Klinke et al. (2017)). A first policy implication is the need to clarify the extent to which public entities can indeed legally use ESCO financing to circumvent credit constraints such as debt ceilings. The rationale for legally allowing off-balance sheet in that case is supported by the ESCO’s guarantee that the credit will be entirely financed by the energy savings achieved. While credit constraints seem to concern only a minority, asymmetric information, when the client cannot observe nor verify the performance or the adequacy of a technology and the risk relying energy efficiency investments, seems to be relevant for a majority of respondents. This conclusion stems from the fact that the ESCO’s guarantee has a persistent and significant positive impact on the willingness to invest. Risk sharing is an important driving factor for energy efficiency investments. This result provides importance policy guidance. While EPC may not be suitable for small energy consumers due to the entailed transaction costs, alternative instruments may be found to provide other forms of performance guarantee to reach all market segments. This study failed to capture any impact of landlord tenant split incentives as a barrier to energy efficiency investments. This should however be tested further using a sample with a larger share of private rented buildings. We found no divergence in the decision-making or in the valuation of contractual attributes between private and public entities. The energy costs and the size of the building did not have a significant impact either. However, we showed that if the respondent is an energy manager, the willingness to adopt EPC and energy efficiency increases. The director of cantonal or municipal buildings conversely considered less energy efficiency and EPC. This reluctance towards EPC increases with the respondent’s years of experience in her function. The results show important heterogeneity in the decision-making processes when it comes to energy efficiency and energy performance contracting. Some respondents simplified their decision process
190
using attribute non-attendance. This study provides insights about the behavioral complexity underlying decision processes with energy efficiency investment. Further research in that domain will provide interesting and crucial answers to reduce the energy efficiency gap. Finally, while EPC can mitigate important barriers to investments, it is also facing an intrinsic reluctance from potential clients which is likely to be caused by a lack of awareness. We argue that informing about EPC to reduce this reluctance is primordial. The recent efforts provided by the Swiss federal government to foster awareness of EPC solutions should therefore not decline. More specifically, we pointed towards specific misunderstandings of EPC which could be easily overcome using information dissemination. 7. Aknowledgement This study is based on Klinke et al. (2017) and has been financed by the Swiss Federal Office of Energy (Grant number SI/501121-01). It has also benefited from financial support from the Swiss Competence Center for Energy Research SCCER CREST funded by the Commission for Technology and Innovation (Grant KTI. 1155000154). The authors are grateful to the precious collaboration of Gregor Martius, Thomas Egli, Marco Morf (TEP Energy) and Cécile Hediger (University of Neuchâtel). We also thank Dr Boris Krey, Gabriela Weiss Di Spirito, Dr Markus Bareit, Dr Gian-Paolo Klinke for valuable comments and suggestions on earlier versions of this paper. Finally, we are grateful to all the respondents participating in the survey. References Allcott, H., Greenstone, M., 2012. Is there an energy efficiency gap? The Journal of Economic Perspectives, 3–28. Allcott, H., Wozny, N., 2012. Gasoline prices, fuel economy, and the energy paradox. Review of Economics and Statistics,
96(5), 779-795. Anderson, S. T., & Newell, R. G., 2004. Information programs for technology adoption: the case of energy-efficiency audits.
Resource and Energy Economics, 26(1), 27-50. Backlund, S., Thollander, P., 2011. The energy-service gap: what does it mean? In: ECEEE 2011 Summer Study -Energy
efficiency first: The foundation of a low-carbon society. Linkping University, Sweden, 649 – 656. Banfi, S., Farsi, M., Filippini, M. and Jakob, M. 2008. Willingness to pay for energy-saving measures in residential buildings.
Energy Economics, 30, 503-516. Blasch, J. and Farsi, M. 2014. Context effects and heterogeneity in voluntary carbon offsetting – a choice experiment in Switzerland. Journal of Environmental Economic and Policy, 3(1), 1- 24. Bleyl, J. W., Adilipour, N., Bareit, M., Kempen, G., Kil-Hwan, K., Hye-Bin, J., Cho, S.-H. and Vanstraelen, L., 2012. ESCo
market development: A role for facilitators to play. Tech. rep., International Agency’s Demand Side Management Implementing Agreement (IEA DSM Task XVI).
Campbell, D., Hensher, D.A. and Scarpa, R., 2011. Non-attendance to attributes in environmental choice analysis: a latent class specification. Journal of Environmental Planning and Management. 54(8), 1061-1076.
Capelo, C., 2011. Modeling the Diffusion of Energy Performance Contracting. In: International System Dynamics Conference. Washington DC, 500 – 519.
Caputo, V., Van Loo, E., Scarpa, R., Nayga, R. M., & Verbeke, W., 2014. Using experiments to address attribute non-attendance in consumer food choices. In 2014 AAEA Annual meeting. Agricultural and Applied Economics Association (AAEA).
Davis, L. W., 2010. Evaluating the slow adoption of energy efficient investments: are renters less likely to have energy efficient appliances? Tech. rep., National Bureau of Economic Research.
Fang, W. S., Miller, S. M., Yeh, C.-C., 2012. The effect of ESCOs on energy use. Energy Policy, 51, 558–568. Gillingham, K., Palmer, K., 2013. Bridging the energy efficiency gap: Insights for policy from economic theory and empirical
analysis. Resources for the Future Discussion Paper (13-02). Goldman, C. A., Larsen, P., Sat, May 2012. Evolution of the US energy service company industry: Market size and project
performance from 1990-2008. Tech. rep., Ernest Orlando Lawrence Berkely National Laboratory. Greene, D. L., German, J., Delucchi, M. A., 2009. Fuel economy: the case for market failure. In: Reducing climate impacts in
the transportation sector. Springer, pp. 181–205. Hansen, S. J., 2006. Performance contracting: expanding horizons. The Fairmont Press, Inc. Hausman, J. A., 1979. Individual discount rates and the purchase and utilization of energy- using durables. The Bell Journal of
Economics, 33–54.
191
Hensher, D.A., Rose, J.M. and Greene, W.H., 2005. The implications of willingness to pay of respondents ignoring specific attributes. Techn. Report, Working Paper ITLS-WP-05-02, Institute of transport and logistic studies, University of Sydney.
Hensher, D.A., Rose, J.M. and Greene, W.H., 2012. Inferring attribute non-attendance from stated choice data: implications for willingness to pay estimates and a warning for stated choice experiment design. Transportation, 39(2), 235-245.
Hensher, D.A., Rose, J.M., 2009. Simplifying choice through attribute preservation or non- attendance: Implications for willingness to pay. Transportation Research Part E, 45, 583-590
Hensher, D.A., Rose, J.M. and Greene, W.H., 2015. Applied Choice Analysis, second edition, Cambridge University Press. Hess, S. and Hensher, D.A., 2010. Using conditioning on observed choices to retrieve individual-specific attribute processing
strategies, Transportation Research Part B, 44(6), 781- 90. Hole, A.R., Norman, R. and Viney, R., 2016. Response patterns in health state valuation using endogenous attribute
attendance and latent class analysis. Health Economics, 25, 212-224. Hossain, T., Morgan, J., 2006. Plus Shipping and Handling: Revenue (Non) Equivalence in Field Experiments on eBay.
Advances in Economic Analysis & Policy, 6 (2). IEA-RETD, 2013. Business models for renewable energy in the built environment. Routledge. Jaffe, A. B., Stavins, R. N., 1994. The energy-efficiency gap: What does it mean? Energy Policy, 22 (10), 804 – 810. Klinke, S., 2016. Energy Supply Contracting Adoption: Empirical Evidence from the Swiss Market. Working paper (No. 16-
13), IRENE Institute of Economic Research. Klinke, S., Reiter, U., Farsi, M., Jakob, M., 2017. Contracting the gap: Energy efficiency investments and transaction costs.
Tech. Report. Swiss Federal Office of Energy. Khoury, J., Hollmuller, P. 2017. Deliverable Report D70 on (i) performance gap in building retrofits and benchmarking of
best practice vs. current practice; (ii) cost assessment of diverse energy efficiency solutions in building retrofit. Swiss Competence Center for Energy Research. January 2017, Geneva.
Lagarde, M., 2013. Investigating attribute non‐attendance and its consequences in choice experiments with latent class models. Health economics, 22(5), 554-567.
Li, Y., Qiu, Y., Wang, Y. D., 2014. Explaining the contract terms of energy performance contracting in china: The importance of effective financing. Energy Economics, 45, 401-411.
McFadden, D., 1974. Conditional logit analysis of qualitative choice behavior, in Zaremka, P. (ed.), Frontiers in Econometrics, Academic Press: New York, 105-142.
Murtishaw, S., Sathaye, J., 2006. Quantifying the effect of the principal-agent problem on US residential energy use. Lawrence Berkeley National Laboratory.
Nolden, C. and Sorrell, S., 2016. The UK market for energy service contracts in 2014-2015. Energy Efficiency, 9(6), 1405-1420. OFS, Office Fédéral de la Statistique suisse, 2013. Communiqué de presse: 200’000 ménages de plus propriétaires de leur
logement en dix ans. Relevé structurel du recensement de la population 2010, Construction et Logement, March, Neuchâtel.
Okay, N., Akman, U., 2010. Analysis of ESCO activities using country indicators. Renewable and Sustainable Energy Reviews, 14 (9), 2760–2771.
Palmer, K., Walls, M., & Gerarden, T., 2012. Borrowing to save energy: An assessment of energy-efficiency financing programs. Tech.. Report, Resources for the Future.
Panev, S., Labanca, N., Bertoldi, P., Serrenho, T., Cahill, C. and Boza Kiss, B. 2014. ESCO market report for non-european countries in 2013. Tech. Report, Joint Research Center and Policy Reports, Institute for Energy and Transport, European Commission.
Pätäri, S., Annala, S., Jantunen, A., Viljainen, S. and Sinkkonen, A. 2016. Enabling and hindering factors of diffusion of energy service companies in Finland- results of a Delphy study. Energy Efficiency, 9, 1447-1460
Polzin, F., Von Flotow, P., Nolden, C., 2016. What encourages logal authorities to engage with energy performance contracting for retrofitting? Evidence from german municipalities. Energy Policy, 94, 317-330.
Rose, J.M., Hensher, D.A., Greene, W.H. and Washington, S.P., 2012. Attribute exclusion strategies in airline choice: accounting for exogenous information on decision maker processing strategies in models of discrete choice. Transportmetrica, 8(5), 344-360
Sorrell, S., 2007. The economics of energy service contracts. Energy Policy, 35 (1), 507 – 521. Sorrell, S., O’Malley, E., Schleich, J., Scott, S., 2004. The economics of energy efficiency: barriers to cost-effective
investment. Edward Elgar, Cheltenham. Stuart, E., Larsen, P.H., Carvallo, J.P., Goldman, C.A. and Gilligan, D. 2016. U.S. Energy Service Company (ESCO)
Industry: Recent Market Trends, Tech. Report, Electricity Markets & Policy group, Energy Analysis & Environmental Impacts Division, Lawrence Berkeley National Laboratory.
Swissesco, 2016. Energiespar-Contracting – Leitfaden für die Vorbereitung und die Durchführung von Energiespar-Contracting. Tech. rep., Bern.
Tietenberg, T., 2009. Reflections: Energy Efficiency Policy: Pipe Dream or Pipeline to the Future? Review of Environmental Economics and Policy, 3 (2), 304–320.
Weller, P., Oehlmann, M., Mariel, P. and Meyerhoff, J., 2014. Stated and inferred attribute non-attendance in a design of designs approach. The Journal of Choice Modeling, 11, 43-56.
192
9. Appendix 9.1 Survey content a) Part 1: Introductory questions on the building and the respondent This section gathered general information on the building such as the type and the location of the building. The responsibility of the respondent and its decision role regarding the building was also assessed. If the respondent declared having no role in the decision process regarding investments, operation or revisions on energetic or technical aspects of the building, he was asked to give the contact of another person in charge and exited the survey. This implies that only respondents with a role to play in the decision process completed the survey. Therefore, part 1 was also intended to capture the potential heterogeneity in the respondents’ roles. These can lie between advising the directors on the alternatives and taking part in the final decision. b) Part 2: Current situation of the building The second part aimed at capturing in detail the building characteristics such as the construction year, the presence of tenants and the size in terms of heated floor area (square meters). Special emphasis was put on the type of heating system and its age. Information on energy and electricity yearly costs was also collected as well as the presence of ventilation or cold in the building. The respondents were then asked to state if the building was managed by an employee in charge of the energetic and technical aspects, if it was certified with the ‘Minergie’ label and if an audit has been made since 1990. Finally, grid questions as in Figure 8 gathered information on planned and realized retrofits on the walls, roof, windows, lighting, heating, ventilation and building automation.
Figure 8 - Example of question on realized and planned retrofits
c) Part 3: Information on Energy Performance Contracting Because the energy performance contracting market is only emerging in Switzerland, we expected to have a relatively high share of respondents unfamiliar with this notion. A complete section was therefore allocated to explain the concept in detail. This included Figure 9, describing the EPC concept; an EPC example illustrated as in Figure 10 and a simplified definition of these contracts: “Some companies provide their client with adapted energy efficiency improvement measures.
193
Through a contract of mid- to long-run, these providers insure the operation and maintenance of the installations. Sometimes, they finance themselves partly or completely the upfront investment and/or they guarantee the client that the energy savings will achieve a minimal amount, otherwise they pay the difference. In return, the client pays a fee during the contract’s duration.” For simplicity, the definition of EPC did not distinguish the “shared-savings” from the “guaranteed-savings” scheme. In the choice experiment (see next section), some of the contracts proposed included both a guarantee and a part of the investment financed by the ESCO. It was therefore important in the definition not to exclude one from the other. Also, because of the necessity to simplify the choice tasks in the experiment, only fixed payments were presented in the contract. We therefore excluded from the definition the case in which the client can pay according to a share of the energy savings achieved as in the “shared- savings EPC” scheme.
Figure 9 - EPC concept diagram The definition, diagram and example were selected in order to explain the EPC concept the more precisely and briefly as possible. The selection was made on a pretest targeted towards non-energy professionals in the friend and family circle of the authors. In these test survey, the respondents were asked between several combinations of explanations, examples and diagrams which one was the clearest. The combination used in the survey was the one which made the majority of respondents satisfied in this pretest. After the explanations of the EPC concept, the respondent was asked about his level of understanding of these contracts. This was used further to test the potential impact of misunderstanding on the choices made in the experiment.
194
Figure 10 - Example and illustration for EPC concept d) Part 4 - Choice experiment See section 3.2.2. e) Part 5 - Decision process Because of the potentially important heterogeneity in the decision process and the roles the respondent plays in it, this part aimed at assessing some factors that could have an impact on the decisions made in reality. For instance, we asked whether in practice the respondent could take alone certain or all the decisions he has made in the choice experiment. It was also assessed whether a certain contract’s duration or a budget limit would force the respondent to consult other sections in the firm/entity to make the decision. This ensures that we account for the fact that there may be threshold effects in the levels of costs and duration for some respondents. f) Part 6 - Socio-economic statistics of the respondent Since the emphasis of the survey was rather on the building characteristics, questions on the respondent himself were reduced to a minimum. Therefore, these included only the age, the gender, the level of education and the number of years of experience in the current function in the entity/firm. g) Part 7 - Contact and end Finally, the respondents were asked to give their e-mail address if they were interested in receiving the results of the present chapter. An open question dedicated to remarks concluded the survey
195
Finally, the respondents were asked to give their e-mail address if they were interested in receiving the results of the present chapter. An open question dedicated to remarks concluded the survey Allocation of energy efficiency measures according to upfront costs 9.2 Allocation of energy efficiency measures according to upfront costs The percentage represents the share of alternatives with the corresponding cost which is allocated with that type of energy efficiency measure Table 13 - Allocation measures type 1
Notes: BA: building automation and control system (BACS class B): This includes automatic detection for lighting and daylight control, combined light and heating automatically controlled, control and optimization of operations, alarming and monitoring functions. HP: heat-pump. Wood: woodchips or pellets. Nebo+: durable energy operation optimization (“Betriebsoptimierung”) of ventilation and air conditioning, adaptation of operation durations, reduction of air volumes, optimization of air humidity, reduction of electric needs for air transportation, control of air purification
25% BA only 25% BA only 33% Nebo+ only 33% Nebo+ only
25% Nebo+ only 25% Nebo+ only 33% solar panels
hotwater 33% solar panels
hotwater
25% solar panels hotwater
25% solar panels hotwater
33% biogas/green
elec+BACS
33% biogas/green
elec+BACS 25% biogas/green
elec+BACS 25% biogas/green
elec+BACS
Table 17 - Allocation measures type 5
COST (CHF/heated m2) 80 100 120 150
EE
mea
sure
typ
e
25% BA only 25% BA only 33% ventilation 33% ventilation
25% ventilation 25% ventilation 33% solar panels
hotwater 33% solar panels
hotwater
25% solar panels hotwater
25% solar panels hotwater
33% biogas/green
elec+BACS
33% biogas/green
elec+BACS 25% biogas/green
elec+BACS 25% biogas/green
elec+BACS
197
The allocation of respondents across the different types of choice experiment depending on the revisions they already implemented since 2005 resulted in a large majority (68 %) facing type 1, i.e. the design proposing both envelope enhancement and new heating systems (with or without building automation). Type 3, including only envelope enhancement, was faced by 68 respondents (23 %). 12 respondents had already implemented envelope enhancement and were thus proposed measures including new heating systems and automation. A minority of respondents (4%) already revised both the envelope and the heating systems since 2005. Hence, they saw type 4 (9 respondents) and type 5 (4 respondents). 9.3 - Equality-constrained latent class model for inferred attribute non-attendance Table 18 - ECLCM inferred ANA – potential clients choices
Dependent variable: choice (=1 if choose alternative j)
ECLCM Inferred ANA (7classes)
(1) (2) (3) (4) (5) (6) (7)
Upfront Cost
-0.019*** (0.003)
-0.019*** (0.003)
0 0.019*** (0.003) -0.019*** (0.003)
-0.019***
(0.003)
0
Expected savings 0.039***
(0.007)
0 0.039*** (0.007)
0 0.039*** (0.007)
0.039*** (0.007)
0
Risk: sav. variation 2.387***
(0.845)
0 0 0 0 0 0
Upfront ESCO 0.100
(0.131)
0 0 0 0 0 0
Savings guarantee 3.280***
(0.578)
0 0 0 3.280*** (0.578)
0 0
Payment to ESCO -1.278**
(0.588)
0 0 0 0 -1.278** (0.588)
0
Contract’s duration -4.158***
(1.138)
0 0 0 0 0 0
Meas. Envelope 5.922***
(0.493)
5.922***
(0.493)
5.922*** (0.493)
0 5.922*** (0.493)
5.922*** (0.493)
0
Meas. technic 1.501***
(0.277)
1.501***
(0.277)
1.501*** (0.277)
0 1.501*** (0.277)
1.501*** (0.277)
0
Meas. Mix 2.422***
(0.350)
2.422***
(0.350)
2.422*** (0.350)
0 2.422*** (0.350)
2.422*** (0.350)
0
Meas. Heating 1.562***
(0.299)
1.562***
(0.299)
1.562*** (0.299)
0 1.562*** (0.299)
1.562*** (0.299)
0
ASC ee alt. -1.025***
(0.231)
-1.025***
(0.231)
-1.025***
(0.231)
-1.025***
(0.231)
-1.025***
(0.231)
-1.025***
(0.231)
0
ASC epc alt. -1.523***
(0.261)
-1.523***
(0.261)
-1.523***
(0.261)
-1.523***
(0.261)
-1.523***
(0.261)
-1.523***
(0.261)
0
Average posterior 0.206 0.082 0.179 0.130 0.129 0.104 0.170 class probabilities Observations 5940
Individuals 297
Loglikelihood -1278.486
AIC 2595.0
BIC 2704.7
Notes: standard errors in parentheses. ***P<0.01, **P>0.05, *P<0.1
198
9.4 Conditional logit with individual and building characteristics
Table 19 - Conditional logit with individual and building characteristics
dependent variable: choice (=1 if choose alternative j)
(1) (2) (3)
ASC ee alt. 0.102 (0.428) 1.046* (0.535) 0.793 (0.528) ASC ee x familiar with EPC 0.589** (0.233) ASC ee x rented building -0.453 (0.324) ASC ee x privately owned building -0.206 (0.398) ASC ee x energy consumption (CHF/year -0.000 (0.000) ASC ee x respondent=owner 0.440 (0.339) ASC ee x respondent=financial Manager -0.741 (0.488) ASC ee x respondent=facility manager -0.509* (0.277) ASC ee x respondent=energy manager 0.827** (0.358) ASC ee x respondent=director of msunicipal/cantonal building -0.440* (0.266) ASC ee x respondent=municipal counsellor -0.191 (0.376) ASC ee x respondent=other type -0.105 (0.811) ASCee xexperienceofrespondentinthatfunction 0.005 (0.015)
ASC epc alt. -0.543 (0.545) 0.277 (0.710) 0.584 (0.639) ASC epc x familiar with EPC 0.580** (0.284) ASC epc x rented building -0.448 (0.405) ASC epc x privately owned building -0.648 (0.482) ASC epc x energy consumption (CHF/year) -0.000 (0.000) ASC epc x respondent=owner -0.411 (0.402) ASC epc x respondent=financial Manager -0.508 (0.569) ASC epc x respondent=facility manager -0.559 (0.341) ASC epc x respondent=energy manager 0.969** (0.412) ASC epc x respondent=director of municipal/cantonal buildings -0.666** (0.322) ASC epc x respondent=municipal counsellor -0.079 (0.417) ASC epc x respondent=other type -1.055 (1.154)
Notes: conditional logits (clogit) are estimated using stata. ASC=alternative specific constants with alt. overhaul as baseline. Individual-cluster robust standard errors in parentheses. ***P<0.01, **P>0.05, *P<0.1. In column (2), individual and building characteristics interacted with ASC taken individually in separate regressions are not significant either. In column (3), the status of respondent is given in non-mutually exclusive groups.
199
CARBON TAX, EU ETS VERSUS CHARGE ON EMISSIONS Gianluca Carrino
“Peace, development and environmental protection are interdependent and indissolub*”. 1. The consequences of Climate Change 1.1 Uncontrolled pollution as a result of industrial revolutions With the industrial revolutions the environment was considered as a container of useful resources ready to be used for economic purposes. With large-scale use of coal, oil and gas the level of CO2 started to increase steadily. How Figure 1 shows, in September 2017 the mean carbon dioxide measured was 403 PPM.
Figure 1: Global average surface temperature Source: Mauna Loa Observatory Hawai
The Figure 2 shows the anomaly of the Global average monthly temperature. The temperature since 2012 increased year by year. If the emissions will keep on increasing at this rate, within the year 2100 the world will have to face rise of the temperatures estimated between 2 and 4,8 degrees.
Figure 2: Global average monthly temperature 2012-2017 , Source: YALE Climate connections
____________________________ * "The Rio Declaration on environment and development, 1992.”
200
How the analysis of the IPCC in the Figure 3 underlines, during the time there have been an increase of the global average surface temperature (figure a) that influences the global average sea level (figure b) and the widespread melting of snow and ice (figure c) between 1850 and 2010.
Figure 3: Changes in the global average surface temperature (a), global average sea level (b) and Northern hemisphere snow cover (c) Source: IPCC
The consequences of the global warming: a) The global average sea level increased: as showed in the graph (b), the level of the see increased around 19 cm and its growth is linked to the global increase of the temperature (graph a). Within the year 2100, it will reach between 28 and 82 cm, because of the expansion of the liquid masses due to the increase of the temperature and the melting of glaciers1. b) The decrease of snow and ice: how the graph (c) shows, the melt of the ice is also related to global warming. Since 1978, satellite data show that the annual average Arctic sea ice extent has shrunk by 2.7% per decade, with a larger decrease during summer (7.4% per decade). Mountain glaciers and snow covers have declined in both hemispheres. Also, the more the frozen lands decrease in size the less they return the sunlight to the space, contributing to endless and cumulative vicious cycle and an increasing spiral2. c) The melting of the Permafrost: (or permanent ice3) it would disperse in short time a huge quantity of GHG, especially methane, because of the decomposition of the trapped biological materials present in the different layers of frozen ground. An increase of the global temperatures will speed up the melting of the arctic glaciers (introducing sweet water in the oceans) and alter the relationship among the salinities of the different oceanic flows. Such event could slow down some currents such as the Mexico gulf’s current that mitigates the temperature of northern America and Western Europe.
1 Fifth Assessment Report, IPCC, 27 September 2013 2 Mastrojeni G., L’arca di Noè p. 85-87 3 Stephen C. Riser, M. Lopez, Rethinking the Gulf Stream, “Scientific American” 2013
201
d) Ocean acidification: The effects of ocean acidification are expected to have high negative impacts on marine shell-forming organisms (corals, plankton) and their dependent species4. e) Deforestation and desertification: These phenomena are in constant advancement, the causes are also connected to human activities such as the unsustainable deforestation, the agricultural exploitation and the use of chemical fertilizers that, added to the global warming, amplify the issue. f) All the climatic extreme and violent phenomena (hurricanes, cyclones, floods and waves of heat) are going to increase because of the rising temperatures. The cyclones activity has increased, since 1970, in the Atlantic area but not in other parts of the world5. Examples, that underline the power of this phenomenon, are the hurricanes Irma and Harvey that have destroyed the Texas and the Caribbean countries in the summer 2017. g) Forced migration: In the last years, 7 civil disasters on 10 were connected to extreme climatic phenomena and in 2008 more than 20 million people had to migrate because of natural calamities. Scientists esteem that such issue could involve around 200 million people within 20506.
The consequences of the global warming
Each consequence has a strong impact on the society, creating situation of forced migration, economic losses and biodiversity’s loss. For this reasons emissions are considered as negative externalities. They influence directly the welfare of the community causing the biggest failure of the market. In order to fight Global warming countries have to cooperate to limit and eliminate the emissions in a global way. 2. The international goal to contrast global warming
2.1 The Paris Agreement To address climate change, countries adopted the Paris Agreement during the COP-21 in Paris on December 12th, 2015. The Paris Agreement was adopted from all the Countries of the UNFCCC. The Agreement entered into force on November 4th, 20167.
4 IPCC, Climate Change Report 2007 5 IPCC, Climate Change Report 2007 6 Mastrojeni G., L’arca di Noè, p. 278
202
The agreement is centred on six key elements: 1) Reducing emissions: all countries agreed to work together to keep the global temperature below 2°C, trying to maintain it around 1.5°C; 2) Transparency and global stocktake: governments must meet every five years to set more ambitious goals and to report, in a transparent way, the strategies they want to use to implement their goals; 3) Adaptation: governments agreed to reinforce society’s ability to adapt to the impacts of climate change, with particular support to the developing countries; 4) Loss and harm: all countries must prevent, minimalize and address loss and harm related to the aggressive effects of climate change; 5) Role of cities, regions and local authorities: they are all invited to encourage regional and international cooperation to support the activities aimed at reducing the emissions, to build resilience and to decrease vulnerability; 6) Support: Europe and other developed countries must support developing countries in investing on climate actions to decrease emissions and developing resilience to the climate change impacts. To legitimate the Paris Agreement, at least 55 countries of the world (producing about the 55% of global emissions) had to ratify it. On October 5th, 2016, the EU formally ratified the Paris Agreement that entered into force on November 4th, 2016. The Paris Agreement provides strong and ambitious goals that must be achieved by the international markets. During the Paris’ conferences (Cop-21), was created the Carbon Pricing Leadership Coalition (CPLC) to support and to encourage the diffusion and implementation of an effective carbon pricing. In the Article 6 of the agreement, countries have recognized the importance of the international carbon markets allowing each participant to create its own carbon policies to reduce or stop the greenhouse gases emissions. A special commission (the High-Level Commission) was officially introduced in 2016, within the Cop-22 in Marrakech. It had the task to find the right solutions to give a future to the Paris Agreement, which would not otherwise have concrete effects or a suitable corollary of measures to decarbonise the global economy. Global warming must be faced with urgency. In fact, it needs the participation and the collaboration of the highest possible number of countries, especially those with the greatest amount of CO2. The task of the Carbon Pricing Leadership Coalition, composed by economists and experts coming from all over the world, is to find the key measures to reach the objective of maintaining the temperature under 2°C, established during the Agreement. However, the Paris agreement does not provide any sanction nor a court or another organism that could verify if the various Nations act according to what established in the conference. Nations are able to manage their targets on their own. The imposition of sanctions or strict rules, would amplify the risk of failure even before the start of negotiations. In this way, the Paris Agreement left some freedom to each member state, pushing a lot of nations to declare their own Intended Nationally Determined Contributions (INDC). Every Nation established a series of different goals. The only bond to the agreement is the term of four years. The issues of the Paris Agreement are:
1) The promise to stay below the 2°C cannot be kept because, with this level of CO2 in the atmosphere, the temperature cannot be lowered more than 2.7°C.
2) As the climatologist James Hansen said: “Without a serious contribution from all the nations, the agreement stipulated in Paris is a fraud”. This issue has been discussed only during the Cop-22 of Marrakesh, where all the countries were obliged to provide a report on their own emissions of CO2. The purpose of this action was to verify the Intended
7 http://bigpicture.unfccc.int/
203
Nationally Determined Contributions within 2018 (and not within 2020, as initially planned in Paris)8.
3) The costs. The text of the Paris Agreement resumes a concept already proposed in Copenhagen in 2009: Within 2020, 100 million dollars a year will be necessary to support the developing countries in contrasting the effects of the climatic changes, the losses and damages generated by extreme climatic events, floods, torrential rains or waves of drought.
The country that did not sign the Paris’ Climate Agreement is, how the Figure 4 shows - the green area9:
Figure 4: Countries that joined the Paris Agreement Source: UNFCCC
Since September 2017, Nicaragua and Syria signed the Paris Agreement.10 Right now, the US is the only country that does not intend to be a part of the Paris Agreement. 3. The strategies of the European Union to reduce emissions 3.1 The EU ETS
The European Emission Trading Scheme Directive is a European’s tool to implement the Kyoto Protocol’s goals. It is consider such a Cap & Trade system that determines a maximum level of GHG emissions (Cap) and allows companies to trade allowances depending on their personal interest (Trade). The ETS should motivate producers to invest in green economy11. Companies, in fact, can choose to face the cost of carbon titles or to invest in technologies with low environmental impact. The EU emissions trading scheme (EU ETS) is the key of the EU’s policy to effectively fight climate change and reduce greenhouse gas emissions. The EU Cap and Trade is the major carbon market of the world. It operates in 31 countries (all 28 EU countries plus Iceland, Liechtenstein and Norway) covering around 52% of the EU's greenhouse gas emissions.
8 https://www.i4ce.org/wp-core/wp-content/uploads/2016/12/I4CE-Climate-Brief-n%C2%B043-COP22-in-Marrakech-a-push-for-accelerated-action-by-2018_-1.pdf 9 http://www.businessinsider.com/trump-paris-agreement-climate-change-2017-6?IR=T 10 https://www.lifegate.it/persone/news/siria-nellaccordo-di-parigi-restano-fuori-solo-gli-stati-uniti 11 Gerbeti A., A symphony for energy
204
The EU ETS legislation creates allowances, which are essentially rights to emit GHG emissions equivalent to the global warming potential of 1 ton of CO2. The level of the Cap defines the max number of allowances available in the whole system12. Under an establish Cap of emissions, companies, in order to pollute, needs to buy or “win” allowances that can be trade. The limit on the total number of allowances available on the market should ensure their value. For this reason, a high number of allowances create a negative impact on their final price. This means that a declining emissions cap would help to increase their cost and to reduce emissions over time. However, the cap is designed to decrease annually (starting from year 2013), reducing the number of allowances available in the market by 1.74% per year (Directive 2009/29/EC). In addition, companies can purchase limited quantities of JI and CDM from low carbon projects across the world.
However, once the maximum number of emissions has been chosen and the tradable permits distributed, the companies can follow different strategies:
- Reduce their carbon emissions having a surplus of EAU and sell (trade) allowances (case A); - Produce emissions, having a shortage of allowances and need to buy (trade) negotiable
permits from other companies or by through auction (case B). As showed in Figure 5:
Figure 5: Cap and Trade Scheme
Factory B does not have enough allowances to cover its emissions, it can buy allowances from auctions or from factory A who has reduced its emissions collecting a surplus of allowances, otherwise it would be subject to a sanction. Manufacturers can also decide to bank surplus allowances as a credit to use later in time13. However, the ETS is characterized by four phases, the current phase (the third one) of the EU ETS began in 2013 and will end in 2020. It was introduced by the 2020 Climate and Energy Package, that contains also the Directive 2009/28/EC, the Directive 2009/29/EC, the Directive 2009/31/EC and the Decision No. 406/2009/EC of the Parliament and the Council14. The changes of this phase tree can be summarised in the imagine below: 12European Commission, EU ETS Handbook, 2015 13 European Commission, EU ETS Handbook, 2015 14 Gerbeti A., A symphony for energy p. 45
205
3.2 The ETS’s Carbon Market The price of carbon in a Cap and Trade system can be difficult to forecast because the level of emissions varies for several reasons, such as variations in economic growth rates or in fossil fuel prices15. The economic crisis, started at the end of 2008, had a major impact on the ETS since the sectors involved are strongly linked to economic activities; when ETS cap was set, the recession, which reduced emissions, was not foreseen by economics and policy makers. So, the economic crisis has discouraged on one hand the European production and so the linked emissions produced; on the other hand the allowances’ supply generated a growing surplus of unused permits that have affected the carbon price in each phase of the ETS. In the EU-ETS the price of CO2 has decreased instead of rising. The drop of emissions (by 2.4% in 2016) in the EU ETS was also driven by the “carbon-price floor” introduced in the United Kingdom. There, thanks to a £18/t CO2 top-up on the EU ETS price. The coal power plants reduced their emissions by 58% in 201616 (decreasing the use of allowances). The Figure 6 shows the Europeans Union Allowances (EUA) Closing prices from 2006 to September 2016. However, during the second phase of the ETS, the carbon price was 29 €/EUA in the July of 2008 to reach a 13€/EUA in the first half of 200917. Due to economic crisis and the excessive supply of EUAs, the price of allowances has fallen drastically, reaching 3.88 €/t in June 2013. In September 2016 the EUS’s price was 3.91€/t. That is disconcerting compared to 29€/t in 2008. This price reduction makes ETS less effective. Companies have to face a very low cost to obtain new permits and are not encouraged to introduce new “environment friendly” production technologies. In each ETS’ phase there has been a surplus of CO2 allowances, due to different reasons, aggravated by the first two phases of the ETS where almost all permits (95% and 90%) were allocated for free instead of selling or auctioning them.
15 Report of the High-Level Commission on Carbon Prices, May 2017. 16 European Commission data on 2016 emissions data (https://ec.europa.eu/clima/policies/ets/registry_en#tab-0-1), accessed April 2017. 17 Data Committee on Climate Action, 2008/2009/2010
206
Figure 6: EUA’ Closing prices from 2006 to September 2016 Source: European Commission
Under these circumstances, enterprises find more convenience in paying a little cost for the “right” to emit a ton of CO2, rather than spending much more money to invest in green economy. However, as data show, is incontestable that EU ETS trade has grown since 2005. The trade volume in 2005 was 1.1 billion in 2006 to reach 2.1 billion in 2006, from 3.1 billion in 2008 to 6.3 in 2009 and 6.8 billion in 2010. In 2011, 7.9 billion shares were traded for a value of 147.9 billion $18. 4. Other international tools to mitigate Climate Change 4.1 The Carbon tax “Carbon tax is a tax on the pollution that charges a fee on the industries based on how much they impact the environment”19. The government establishes a cost per ton of carbon. The carbon tax, making the use of dirty fuels more expensive, incites companies and individuals to reduce the consumption and grow up energy efficiency. Carbon tax can also make alternative energy cheaper increasing the cost-competitiveness of coal, natural gas and oil20. In other words the carbon tax is imposed on the burning of fossil fuels (coal, oil, gas) based on the concept that more they produced carbon dioxide higher will be the taxation. How the Figure 7 shows the coal will be the higher taxed source.
18 European Union, Climate Change, EU Action, 2011 19 https://www.carbontax.org/dead-ends/cap-and-trade/ 20 Science, How carbon tax work?
207
Figure 7: CO2 Emissions per million Btu. Source: U.S. Energy Information Administration. Coal releases the most CO2 natural gas the least.
Of course, the aim is to increase the price of fossil fuels making it more expensive, and therefore less appealing, for producers to use it. It is the same strategy that has long been used with cigarettes and alcohol by a number of countries. Countries should price Carbon dioxide for different reasons, such as: - Reducing greenhouse gas emissions: A carbon price can help reduce GHG emissions by internalizing the costs of climate change in the market. - Spurring innovation in clean energy: Paying a carbon price on fossil fuels can help investments on innovation and clean energy resources that are less carbon intensive, decreasing the pollution. - Raising revenue for other: Revenues could be directed to support research and development, adapt to climate change impacts and invest in infrastructure maintenance and improvements. Moreover, they can be used to reduce other taxes, such as the tax on labour. The Carbon tax has been proclaimed or proposed around the world, such as: Sweden, United Kingdom, Australia, Ireland, Chile, British Columbia, Finland and New Zealand21. 4.2 Charge on emission The charge on emission (CoE) is a tool proposed and conceived by the Professor Agime Gerbeti illustrated in her book “A symphony for energy”. The goal of this innovative instrument is to introduce for each good, produced or imported in the European Union, a fee on the GHG emissions that must be charge at every single phase of the production. The emissions are, therefore, part of the product, and each manufacturer needs to consider them such as “raw materials” that compose it. The emissions are, therefore, considered as a part of the same product itself, such as the oil in a can of tuna: it is part of the product and fabricators have to compensate it. In other words the CO2 emitted during the process of creating a good or services became an intrinsic piece of the same good22. The charge on emission is paid directly on the value added tax (VAT) and works such as the VAT, charging on each phase of the production process.
21 http://www.wri.org/sites/default/files/carbonpricing_april_2015.pdf 22 Gerbeti A., A symphony for energy, Editoriale Delfino, Milano, 2015
208
The Value Added Tax (VAT) is a fee on each single phase of the production process of certain goods and services. The charge on emissions is not charged on consumers. It will be, in fact, a simply tax on the purchase price. The EU should just establish a right and rational price in each phase of the production for each quantity of GHG emitted. This control must be performed exactly where the product is manufactured, in an international way. The aim of the system should be not just to reduce emissions from what Europe exports, but also from what Europe imports. However, in a global economy, it makes any sense to have a territorial approach. The only way to limit globally emissions and to redirect the fuel mix for manufacturing output is to give a precise value to emissions linked to goods and services, monetizing them. For this reason we should introduce a “charge on emissions” on each phase of the production to harmonize the European competitiveness and to reduce global emissions. Using this kind of fees, countries outside the EU will be able to sell their product in Europe with a higher or lower price according to their emissions. Moreover, to pay less, they have to prove to be sustainable in each phase of their production. Without making any improvement or any emission reduction the cost of the imports will be higher forcing the increase of the final market price compare to the European’s “clean” goods, that in this case will be cheaper and “cleaner”. However, companies that will decrease pollution will affront a lower VAT for each quantity of emissions saved. The increase of competitiveness may raise again the European market forcing other countries such as China to adapt their-self to not lose competitiveness. One example of global adaptation is what happened to the fridges, the light bulbs or the cars market. Each of those products, to be sell in the Europe market, have to follow clear regulations and standards. Charge on emissions should work in the same way. Who wants to produce or to sell imports in EU have to pay for each ton of GHG emission produced in all the phase of the production.
Figure 8 : Cost of the hot rolled coils in China ( Red line) and Italy (Blue line) Source; Siderweb and Mysteel
209
How the Figure 8 - that represents the cost of the hot rolled coils in China (Red line) and Italy (Blue line) – shows we can exactly understand how the CoE could be applied in order to increase [decrease] the price of the China [Italy] steel’s derivate. Since 2014 the price of the China’s hot rolled coils are drastically decreased in comparison with the price of the inputs produced in Italy. This reduction can be easy linked on one side to the lower cost of the workforce, the raw materials, the infrastructures’ cost and the taxation of China. On the other side to the lack of specific carbon policies that impose cap or fee to induce Companies to mitigate emissions. Introducing a Charge on Emissions also to imports will develop competitiveness for the European market. Imports from China, in fact, will be subject to a charge, on the normal VAT, for each emission in excess. This means that the final consumers will have to face a higher VAT (in Italy IVA) for products manufactured in unsustainable way. The final price of the hot rolled coils produced in China in the previous examples, using a CoE, will be more expensive while the input manufactured in Italy, already following the ETS directive, will be “Cleaner” and in the same time cheaper. Probably, the prices of Chinese products will remain lower thanks to their cheap internal costs, but anyway, the price gap between the various products, such as hot rolled coils, will diminish by stimulating Europeans to consume inputs made in Europe. Charging a right fee will induce producers, focused on maximizing profit, to consume low and to disinvest on fossil fuels. However the Charge On Emissions is difficult to perform, on one hand is hard to identify a truthful and correct price for each emission; on the other hand is hard to properly quantify emission for each unit of a product within the manufactured. Nowadays, most of the emissions are generated by the manufacturer of the developing countries that are not considered unlike those on European’s territory. If producers of countries outside the European Union are allow to face no cost to pollute, they will not be responsible for their emissions stimulating a Free-riders’ attitude. This means that they will not be incentivized to invest on energy efficiency or renewable energies and they will not decrease emissions. Therefore, if the tax is a simply fee on the imports, producers of goods or services from a development countries would have not interest to make the production processes more efficient. They could, in fact, have revenues by increasing the production using very “dirty” energy to balance the EU carbon border tax. For this reason we should introduced a charge on emission on each phase of the production, increasing the value of the VAT in a measure proportionate to the emissions level itself, the final price will be higher for who produces more emission and lower for the enterprises that produce “clean” goods. Therefore, the producers in order to pay lower price, have to prove that it is reaching a sustainable production. The charge on emission suggested the creation of an Entity that verifies, controls and manages the emissions level declared by the private companies. 5. Conclusion The current carbon prices used by the countries are insufficient to induce the consistent decrease of the temperature respect to the objective of the Paris Agreement; so future prices will definitely have to be higher. The 85% of global emissions are not priced, and about three quarters of the emissions priced are covered by a carbon price that is lower than US$10/tCO2. Many Nations did not put price barriers on carbon or, as in the case of Australia, have removed/changed carbon-pricing mechanisms23. This means that the tools we are using or are inappropriate or are inadequate.
23 Report of the High-Level Commission on Carbon Prices , May 2017
210
Each of them: the unpredictability and the decrease of the allowances prices on the ETS, the cascading effect on the Carbon Tax, and the complexity of applying Charge on emissions, needs to be implemented to complete where they are inefficient. How the Report of the High-Level Commission on Carbon Prices said: ”Countries may choose different instruments to implement their climate policies, depending on national and local circumstances and on the support they receive… this Commission concludes that the explicit carbon-price level consistent with achieving the Paris temperature target is at least US$40–80/t CO2 by 2020 and US$50–100/tCO2 by 2030, provided a supportive policy environment is in place.” Moreover, how the Report of the High-Level Commission on Carbon Prices have reported in May 2017: the carbon-pricing corridors, in order to limit global warming to below 2°C, have to be combined with other policies and international collaboration. Therefore, each of these instruments, to be really effective, has to be implemented simultaneously with the right price. Implementing only one, as we have seen, is inefficient and ineffective. However, even if the growth of the carbon pricing in the world has been substantial in the last decade (from 2006 to 2016 the percentage of covered emissions is tripled, shifting from 4% to 13%24), until now, any policy of carbon pricing has succeeded in modifying in depth the behaviors of the industries. The Cap-and-trade, in fact, is not the most effective or efficient approach for reducing carbon emissions even if it establishes a maximum Cap tolerated by the society. It is inefficient for the excess of the allocation allowances, the price volatility and the energy price inflation. In contraposition carbon taxes can be structured to avoid all those problems while providing a more reliable market incentive to produce clean-energy technology. If on one hand Carbon tax gives value to each ton of CO2 (establishing a determine price and providing quick and transparent results) and produce more equitable outcomes than Cap-and-Trade; on the other hand, “in the Carbon Tax there is no provision for input tax credit”, which means that the final consumer may pay fee on an input that has already been taxed previously. This is known as cascading effect, it increases consumer tax and price levels, which developments the rate of evasion and can be unfavorable to economic growth. The charge of emissions system on the Value Added Tax can resolve these problems quite efficiently. The charge on emissions, imposing a value addition at every single phase, can be the proper solution to resolve the cascading effect. In this way, the final consumers will face only the cost of the value added tax, which will vary depending on the emissions produced for manufacture the product. This system involves absolute transparency at every stage of taxation, thereby making the tax system quite comprehensible and simple. Imposing a “charge on emissions” for exports and imports could be a solution to give the possibility to spread the sustainable value over the world. However, each tool should be mixed and complemented by other well-designed policies and regulations (in order to influence financial institutions to be transparent about the hazard of fossil fuels and to encourage green investment, and reduce financial sector risk). As the cases of Sweden and UK have shown, a combination of policies will be more dynamically efficient and attractive than a single carbon policy. The right mix of carbon policies will increase the competitiveness of the green market making low-carbon technology cheaper than traditional fossil fuel-based technologies. If green economy were the most viable option, companies would be forced to convert and produce “clean” goods that will be sell at a favorable price compared to those produced polluting that will reach higher prices by losing competitiveness. An important issue of each carbon policies is, however, that the target should be common and global and not just local; otherwise the country X might decide to move its investments and the productions in countries Y and Z with non-environmental restrictions (so-called carbon leakage).
24 Report of the High-Level Commission on Carbon Prices, May 2017
211
References Bates A., The Paris Agreement, Ecovillage, 2015 Data Committee on Climate Action, 2008/2009/2010 European Union, Climate Change, EU Action, 2011 European Commission, EU ETS Handbook, 2015 Fifth Assesment Report, IPCC, 27 September 2013 Financial Time, A carbon border tax is the best answer on climate change, 2017 Gerbeti A., A symphony for energy, Editoriale Delfino, Milano, 2015 IPCC, Climate Change Report 2007 Mastrojeni G., Pasini A., Effetto serra effetto Guerra, Chiarelettere editore, Milan, 2017 Mastrojeni G., L’arca di Noè Report of the High-Level Commission on Carbon Prices, May 2017 Science, How carbon tax work Stephen C. Riser, M. Lopez, Rethinking the Gulf Stream, “Scientific American” 2013 United Nations, UNFCCC, Article 1, 1992 Web-References http://www.wri.org/sites/default/files/carbonpricing_april_2015.pdf https://www.carbontax.org/dead-ends/cap-and-trade/ https://ec.europa.eu/clima/policies/ets/registry_en#tab-0-1 http://www.businessinsider.com/trump-paris-agreement-climate-change-2017-6?IR=T https://www.lifegate.it/persone/news/siria-nellaccordo-di-parigi-restano-fuori-solo-gli-stati-uniti https://www.i4ce.org/wp-core/wp-content/uploads/2016/12/I4CE-Climate-Brief-n%C2%B043-COP22-in-Marrakech-a-push-for-accelerated-action-by-2018_-1.pdf http://bigpicture.unfccc.int/
212
EVALUATION OF OIL & GAS FIRMS’ FINANCIAL PERFORMANCE: CASH FLOWS VS. ACCOUNTING EARNINGS Bård Misund*
Abstract For more than 40 years oil and gas companies have been able to choose between two competing methods for accounting for exploration activities. Two otherwise identical companies can report substantially different earnings depending on method chosen. This situation, where oil&gas company managers have discretion to choose between the different methods, has transpired because of intense lobbyism towards accounting standard setters by oil&gas companies in favor of one of the methods. The existence of two accounting methods, resulting in different reported profits, is concerning since investors will have a hard time understanding the true underlying performance of oil&gas companies. We conjecture that investors will resort to operating cash flows to evaluate oil company financial performance since cash flows are less affected by managers’ discretion than earnings are. In this study, we investigate the relevance to investors of earnings versus cash flow for oil and gas companies. Our results suggest cash flow measures, but not earnings, are significantly associated with oil company returns. These findings suggest that the financial markets lack confidence in oil company earnings, irrespective of accounting method choice, and investors therefore prefer cash flows as measures of underlying financial performance. Keywords: full cost, successful efforts, company valuation, oil and gas exploration, cash flows, earnings, profitability, oil and gas company *Corresponding author: Bård Misund, Associate Professor, University of Stavanger Business School, Faculty of Social Sciences, University of Stavanger, N-4036 Stavanger, Norway. E-mail address: [email protected]. Acknowledgements The author would like to thank the attendants at the 2nd AIEE Energy Symposium in Rome November 2017 for constructive and useful comments. 1. Introduction For over forty years, accounting standard setters, regulators, oil and gas companies and academics have discussed intensively the topic of how to capitalize exploration (pre-discovery1) expenses for oil and gas producers. Since the 1960s oil and gas companies have been using two competing methods, the full cost (FC) and successful efforts (SE) methods (Zeff, 1978). Under the FC method, oil and gas explorers are allowed to capitalize all expenses, while under the alternative method, SE, only expenses from successful discoveries are allowed to become assets on their balance sheets. While the use of either method has no direct cash flow effect that is relevant for security pricing, the literature suggests that the accounting method choice might have indirect cash flow effects through the interaction with company-specific variables such as leverage, political costs, and management compensation (Spear and Leis, 1997). These variables are related to the financial window-dressing effects inherent in the FC method, such as earnings smoothing and lower earnings volatility (Bryant, 2003; Boone and Raman, 2007). The topic of the impact of accounting method choice on the value relevance of oil company accounting information has been addressed in numerous academic studies, particularly in years surrounding the release of new accounting standards (e.g. the U.S. accounting standard in the late 1970s and early 1980s, and the international standards in the mid-2000s). Despite the attention in the academic literature, the empirical results are not conclusive. While many studies find support for the hypothesis that financial disclosures under the SE method (Harris and Ohlson, 1987; Bandyopadhyay, 1994) are more value-relevant than according to the FC approach, several studies arrive at the opposite conclusion (e.g. Collins et al., 1981; Bryant, 2003). A possible reason for varying value relevance of accruals found in the literature may be related to investor confidence in oil and gas firm accounting information.
1 Pre-discovery costs include property acquisition and carrying costs, geological and geophysical exploration costs and exploratory drilling costs.
213
The literature suggests that investors, faced with the difficulties of assessing the relevance of accounting numbers for predicting future cash flows due to accounting method heterogeneity may instead turn to cash flows. In fact, a survey reports that earnings are considered unreliable by oil and gas analysts comparing firm performance (Oil and gas investor, 1993)2 Moreover, DeFond and Hung (2003) find that analysts tend to forecast cash flows for firms with more heterogenous accounting method choices. There are two views on the impact of managements’ accounting method discretion on the interpretability of earnings. According to the first view, accounting discretion allows managers to communicate their private information about firm performance (Holthausen and Leftwich, 1983; Watts and Zimmerman, 1986; Healey and Palepu, 1993). Managerial discretion over recognition of accruals can be used to signal private information which is expected to improve the ability to of earnings to measure firm performance and thereby also the firm’s cash flow generating ability. In turn this signal can reduce information asymmetry and increase contracting efficiency. On the other hand, DeFond and Hung (2003) argue that accounting heterogeneity can impair comparability of company probability. Moreover, as Dechow (1994) notes, “to the extent that management use their discretion to opportunistically manipulate accruals, earnings will become a less reliable measure of firm performance and cash flow could be preferable.” Hence, if the choice between full cost and successful efforts methods are governed by financial window dressing motives, rather than signaling private information, then the accruals of oil and gas companies will likely lose their ability to predictive future cash flows. Consequently, investors are expected to turn to alternative measures. In our study, we address this second view. We hypothesis that investors will turn to two relevant measures for oil and gas companies, namely cash flow from operations, which can convey information on current profitability, and oil and gas reserves fair values, which can provide information on future profitability. Our empirical methodology explicitly examines the relative value relevance of accrual measures of probability versus that of cash flow measures. In order to examine the impact of accounting method heterogeneity on investors’ flight to cash flows, we test four hypotheses. The first two compares the significance of the parameters on earnings variables relative to those on cash flow, and the latter two address the relative value relevance of the overall empirical model. First, we test if accounting method choice impacts the value relevance of accruals. This provides evidence on the relevance of signals information about future profitability. Second, we test if accounting method heterogeneity confuses investors about the usefulness of accruals and will instead turn to cash flow from operations as measures of future profitability. Using the Vuong test (Vuong, 1989), the third test assesses whether a cash flow-based empirical model is better than an accruals-based model for FC firms, while the last hypothesis tests this also applies for SE firms. The results support the view that accounting method discretion reduces value-relevance of accruals. We find evidence that short-term cash flow from operations) or long-term (change in net present value of reserves), or both, are more value-relevant than accounting earnings for both SE and FC firms. In fact, we fail to find evidence that neither earnings nor the change in earnings are significantly associated with oil company returns. A possible explanation is the adverse effect on investor confidence in earnings figures disclosed by oil and gas producers that multiple accounting methods have. Ironically, it seems that the fears of both the proponents and opponents of the successful efforts method have materialized. In fact, it seems that more objective economic variables such cash flows and net present value of reserves are more important than historical costs, indeed a triumph of economics over politics. The results are line with the concept that accounting method heterogeneity has a detrimental effect on the accrual value relevance. We contribute to the literature in several ways. First and foremost, our main contribution is to show that in the face of accounting method heterogeneity, investors tend to resort to cash flows as measures of both short and long term performance. This is in line with the accrual relevance destruction view of DeFond and Hung (2003) and Dechow (1994). Second, we provide evidence that the market model is not sufficient for controlling for risk in value-relevance studies. We find that both commodity risk factors as well as conventional equity market risk factors are significant explanatory variables. Third, using a substantially larger dataset than in similar studies, both in terms of number of firms and time, can lead to more robust inference. According to Fields, Lys and Vincent (2001), small sample studies
2 as cited in DeFond and Hung (2003).
214
“exacerbate the problem of determining whether the results are due to unusual or pathological cases rather than to the general use of accounting in ‘normal’ day-to-day circumstances.” The remainder of the paper is organized as follows. The next section describes the background behind the current status quo situation of accounting method heterogeneity and reviews the literature on the relative value relevance of accounting method choice in the oil and gas sector. Section three describes the methodology and develops the hypotheses. Section four describes the data, followed by a presentation and discussion of the results in section five. Finally, section six concludes.
2. Background The full cost versus successful efforts debate goes back more than five decades. The processes leading up to, and including, the final decisions by the standard setters are considered to be very controversial, both the U.S. process during the late 1970s and the international process more than 20 years later (Sutton, 1984; Cortese, 2011; Cortese, Irvine and Kaidonis, 2009). According to Van Riper (1994) the full cost method had been gaining popularity among small and medium sized oil and gas producers since the 1960s due to the method’s favourable impact on earnings. As a consequence of the oil embargo of 1973 the U.S. Securities and Exchange Commission was tasked with standardizing accounting practices in the extractive industry, a commission it promptly delegated to the FASB. In 1977, the FASB published an Exposure Draft called Financial Accounting and Reporting by Oil and Gas Producing Companies. Under the new rules it was proposed that only the successful efforts method should be allowed, effectively discontinuing the full cost approach. According to (Cortese, 2011), the release of the Exposure Draft prompted an intensive lobby activity by the oil and gas industry, and especially by small and independent oil and gas producers who are the primary users of the full cost method. The subsequent debate involved many stakeholders including accounting standard setters, academics, and regulators such as the U.S. Securities and Exchange Commission (SEC), the U.S. Department of Energy and the U.S. Department of Justice, accounting firms, the oil and gas industry and lobby organisations sponsored by the oil and gas industry. Van Riper (1994, p. 56) refers to the full cost versus successful efforts controversy in the U.S. of the late 1970s as “probably the most intensely politicised accounting argument ever”. An important argument used by the full cost proponents was that the full cost method allowed companies to engage in risky exploration activities without having to expense the cost of dry holes. Implementation of the SE method as the single accounting method for oil and gas exploration activities as proposed by the Exposure Draft would therefore be a limiting factor for the U.S. oil and gas industry. It was further argued that this would have adverse effects on returns on full cost firms. Collins and Dent (1979) examining the negative difference in security returns between full cost and successful efforts firms surrounding the date of the announcement of the Exposure Draft attribute the “difference to the anticipated consequences which this mandated accounting change is likely to have on managerial behaviour and to increased costs that will have to be borne by the affected companies”. Although a switch in method from full cost to successful efforts would not affect the underlying fundamental situation for the companies it was feared that the switch would likely have an adverse effect on capital market behaviour which “would significantly disadvantage the competitive viability of any segment of the oil and gas producing industry”.3 Consequently, the SEC opposed the proposed new accounting standard, the SFAS No. 19 Financial Accounting and Reporting by Oil and Gas Producing Companies, forcing the FASB to make an amendment to the standard, effectively suspending its implementation for an indefinite period. According to Cortese et al. (2009), three reasons explain the apparent unwillingness of legislators and accounting standard setters to regulate oil and gas accounting disclosure rules. The first two refer to the economic importance and associated political influence that the industry exerts. The last explanation refers to the distinctive nature of oil and gas exploration activities. Wright and Gallun (2005) argue that certain distinguishing features of upstream oil and gas exploration and production activities separates oil companies from other operations involving asset acquisition and use; 1) typically high risks and low probability of discovering commercial reserves, 2) a long time lag
3 Extracted from Department of Justice response to the SEC dated February 27, 1978. Published in the Federal Register (43 F.R. 878), January 4, 1978 (as cited in Collins et al., 1981).
215
between acquiring permits and licenses and the subsequent production of reserves, 3) potentially low correlation between expenditures and results, 4) challenges with reliably valuing the underlying value of the reserves so that they merit capitalization on the balance sheet, 5) the discovery of new reserves cannot be recorded as income immediately but represent a major future income-earning event, and 6) high costs and risks often result in joint operations. Hence, the lack of confidence in historical costs and accrual accounting for the oil and gas sector could be a result of a ‘politicised’ process resulting in accounting method heterogeneity, combined with the distinctive nature of business. As the FASB expressed it: “An important quality of information that is useful in making rational investment, credit, and similar decisions is its predictive value, specifically its usefulness in assessing the amounts, timing, and uncertainty of prospective net cash inflows to the enterprise. Historical cost based financial statements for oil and gas producing enterprises have limited predictive value. Their usefulness is further reduced because a uniform accounting method is not required to be used for costs incurred in oil and gas producing activities.” FASB (1982). At the same time, both the SEC and FASB were working on alternative measures to historical costs which could alleviate some of the concerns among investors. Recognizing that historical cost measures provided limited information value for decision making, the SEC sought an alternative measure of the value of reserves. They proposed Reserve Recognition Accounting (RRA) (SEC, 1979). This measure was later replaced by the standardized measure of Statement of Financial Accounting Standard no. 69 (SFAS No. 69) proposed by the FASB (FASB, 1982) and which had support from the SEC (SEC, 1982). While the RRA was calculated as the pre-tax net present value of future cash flows from production of oil and gas reserves, the standardized measure was its after-tax equivalent. In addition to the standardized measure (and its change), the SFAS No. 69 required oil and gas companies to disclose a substantial amount of supplementary information relating to oil and gas activities. Moreover, SFAS no. 69 allowed oil and gas producers to choose between full cost and successful efforts methods. The SFAS No. 69 was updated in 2010 (FASB 2009; 2010), but this update did not address the choice of accounting methods.4 In the 2000s, IASB was working on an international standard for the extractive industries. Similar to the U.S. process in the late 1970s, this process also ended up with a standard for the extractive industries that allowed for accounting method heterogeneity, the IFRS 6. This process, like the U.S. process, was also controversial, with substantial pressure from lobbyists representing the oil and gas sector (Cortese et al., 2009; Cortese, Irvine and Kaidonis, 2010; Cortese and Irvine, 2010; Cortese, 2011). 3. Literature A vast body of research has addressed the impact of the Exposure Draft in the period following its release (Collins and Dent, 1978; Deakin, 1979; Dyckman and Smith, 1979; Lev, 1979; Dhaliwal, 1980; Collins et al 1981; Lilien and Pastena, 1981; Larcker and Revsine, 1983; Malmquist, 1990; Spear and Leis, 1997). These studies addressed several aspects surrounding the arguments of the FC proponents, especially under the topic of ‘economic consequences’.5 The overall impression from this body of literature is that the results are mixed, some provide evidence for the FC method, while others arrive at the opposite conclusions. One strand of the literature addresses the ceiling test that FC companies are required to implement. To address the concerns that full cost accounting was too optimistic compared to the more conservative successful efforts approach, a so-called ‘ceiling test’ was introduced for firms applying the FC method. The ceiling test effectively makes FC accounting more conservative. Under Regulation SX (SEC, 1982), FC firms need to carry out a ‘ceiling test’ at the end of each quarter, by comparing historical cost of exploration and other expenses against the standardized measure. If
4 The SEC also released an update of the reporting rules for oil and gas companies around the same time (SEC, 2008). The FASB changed its 2009 ASC (FASB, 2009) the following year (FASB, 2010) in order to accommodate the updated reporting rules from the SEC. 5 See e.g. Zeff (1978) for a discussion on ‘economic consequences’
216
periods of falling oil and gas prices result in a decrease in the standardized measure below the historical cost then the FC firms need to take a write-down of the assets. While FC firms have to recognize write-downs, SE firms are only required to disclose as-if-write-downs in footnotes. Although the FC approach is believed to provide opportunities for income smoothing (Bryant, 2003), high commodity price volatility might results in the opposite effect, as commented by Abraxas, an FC company, in their 2013 10-K report: “At the time it was adopted, management believed that the full cost method would be preferable, as earnings tend to be less volatile than under the successful efforts method. However, the full cost method makes us susceptible to significant non-cash charges during time of volatile commodity prices because the full cost pool may be impaired when price are low. These charges are not recoverable when prices return to higher levels. We have experienced this situation several times over the years, most recently in the third quarter of 2013, relating to our proved oil and gas properties in Canada. Our oil and gas reserves have a relatively long life. However, temporary drops in commodity prices can have a material impact on our business including impact from impairment testing procedures associated with the full cost method of accounting” (Abraxas 2013 10-K report) Arguably, the FC approach may not necessarily be less conservative than SE accounting, or result in lower earnings volatility, especially under conditions of high commodity price volatility. Studies on the ceiling test find that investors differentiate between recognition (FC firms) and disclosure (SE firms) (Aboody, 1996). Furthermore, the stock market impact occurs prior to recording of the write-down (Alciatore, Easton and Spear, 2000) either due to announcements of write-downs or perhaps in anticipation of a write-down. These studies suggest that the income smoothing effect of the FC may be offset by the impact of oil and gas price volatility on earnings volatility due to the ‘ceiling test’. Moreover, Boone and Raman (2007) find that differential guidance for recognizing impairment losses (a time limited jurisdictional split during 1996 to 2001 when FC and SE firms were subject to different rules) had a detrimental effect on value relevance. Of relevance to our study, one strand of the literature addresses the relationship between accounting information and valuation. Ramakrishnan and Thomas (1992) argue that the FC method produces considerable price-irrelevant elements to earnings through the capitalization and subsequent amortization of exploration costs associated with dry holes, i.e. assets which will not be generating future cash flows. A high quality of earnings requires that valuation relevant events, such as the recognition of a dry hole, happens in the same fiscal period in which they are recognized in returns (see e.g. Bandyopadhyay, 1994 and Lev, 1989). The earliest studies found evidence of an adverse effect in oil company security returns of the propose accounting method change. Collins and Dent (1979) examines the effect of the proposed elimination of full cost accounting (SFAS No. 19) for oil and gas producers. They present evidence that the proposal is associated with a significant negative difference between risk-adjusted rates between full cost companies and successful efforts companies. An earlier study by the same authors (Collins and Dent, 1979) found that there were no differences in the information content of earnings between full cost and successful efforts methods. Moreover, Collins et al. (1981) examining the abnormal returns surrounding the timing of the announcement of SFAS No. 19, find support for an adverse effect of the announcement of the change in accounting method. Duchac and Douthett (1997) find that the strength of the returns-earnings relation is significantly greater for full cost firms than for successful efforts firms in periods of declining oil prices and reduced exploration activity. The authors argue that this is consistent with the hypothesis that accounting methods that smooth income and thus lead to less earnings volatility lead to higher value relevance of earnings. More recently, Bryant (2003) examines the value relevance of FC versus SE firms in a novel way. She creates pro forma accounting figures for both SE and FC firms, so that the effects of accounting method choice on value relevance can be compared for the same firms irrespective of other firm characteristics. Bryant’s (2003) results suggest that FC earnings are more value relevant than earnings calculated under the SE approach. This results is recently also corroborated by Misund, Osmundsen and Sikveland (2015). Other studies find evidence in favor of the SE method. Dyckman and Smith (1979) repeated the tests of Collins et al. (1978) and found no significant effect. The author disagrees with Collins et al.’s (1978) argument that, in fact there is an adverse effect from the proposal to eliminate full cost
217
accounting, and that the resulting social costs will be severe. Furthermore, King and O’Keefe (1986) and Larcker et al. (1983) find that FC insiders were short FC and SE company insiders were long SE firm stocks. Hence, the stock market reaction can possibly be attributed to the decisions of oil company management. Finally, Bandyopadhyay (1994) find that SE earnings have a higher earnings response coefficient (ERC) than FC earnings. Harris and Ohlson (1987) find that book values for SE firms have greater explanatory power than for FC firms. They also find that SE firms have higher market-to-book coefficients than FC firms, which is due to the SE method producing more conservative net assets (see also Sunder, 1976). Ayres and Rayburn (1991) regress abnormal returns on accounting information and supplementary reserves disclosures and find higher regression coefficients SE firms are higher than for FC firms. Hence, the literature on the relative value relevance of FC versus SE is mixed. Several studies address the impact of the non-accounting supplementary information that oil and gas companies are required to disclose under SFAS No.69 (Clinch and Magliolo, 1992; Spear, 1994, 1996; Berry, Hasan and O’Bryan, 1998; Quirin et al., 2000; Berry and Wright, 2001; Boone, 2002; Misund, 2015).6 The general impression is that this body of literature find support for significant relationships between the supplementary information such as reserves and net present value of reserve and market valuation. The literature suggests that investors, faced with the difficulties of assessing the relevance of accounting numbers for predicting future cash flows due to accounting method heterogeneity may instead turn to cash flows. In fact, a survey reports that earnings are considered unreliable by oil and gas analysts comparing firm performance (Oil and gas investor, 1993, as quoted in Defond and Hung, 2003). Moreover, DeFond and Hung (2003) find that analysts tend to forecast cash flows for firms with more heterogenous accounting method choices. There are two views on the impact of managements’ accounting method discretion on the interpretability of earnings. According to the first view, accounting discretion allows managers to communicate their private information about firm performance (Holthausen and Leftwich, 1983; Watts and Zimmerman, 1986; Healey and Palepu, 1993). Managerial discretion over recognition of accruals can be used to signal private information which is expected to improve the ability to of earnings to measure firm performance and thereby also the firm’s cash flow generating ability. In turn this signal can reduce information asymmetry and increase contracting efficiency. On the other hand, DeFond and Hung (2003) argue that accounting heterogeneity can impair comparability of company probability. Moreover, as Dechow (1994) notes, “to the extent that management use their discretion to opportunistically manipulate accruals, earnings will become a less reliable measure of firm performance and cash flow could be preferable.” Hence, if the choice between full cost and successful efforts methods are governed by financial window dressing motives, rather than signaling private information, then the accruals of oil and gas companies will likely lose their ability to predictive future cash flows. Consequently, investors are expected to turn to alternative measures.7 Very few studies address the relative value relevance of accrual-based earnings measures and cash flow measure. Cormier and Magnan (2002), Misund, Asche and Osmundsen (2008), and Misund and Osmundsen (2015) find that cash flows are value relevant, but the latter studies exclude the standardized measure. Other studies include the discounted measure, but exclude cash flow from operations (e.g. Bryant, 2003). The aim of our paper is to provide insight into the relative value relevance of earnings versus cash flows.
4. Methodology Using the Ohlson (1995) as our starting point, we develop an empirical model that includes risk adjustment in the form of Fama-French-Carhart risk factors from (Fama and French, 1993; 1996;
6 Several studies also address the impact on oil&gas company valuation of information that oil&gas companies are not required to disclose (e.g. Kretzschmar et al., 2007; Asche and Misund, 2016; Misund, 2016; Misund and Osmundsen, 2017; Misund, Mohn and Sikveland, 2017). 7 Studies examining the impact of the association between financial ratios and valuation multiples did not find a significant relation (Osmundsen et al., 2006; 2007).
218
Carhart, 1997). In line with Sadorsky (2001) and Boyer and Filion (2007) we also include changes in oil and gas prices. The crux of the empirical analysis is the relationship between earnings and total shareholder returns.8 As the point of departure we apply the theoretical model of Ohlson (Ohlson, 1995):
∆ , (1)
where is the total shareholder returns in excess of the risk free rate (check), is current earnings, and ∆ is the change in earnings. is ‘other information’ [explain]. The right hand side also includes risk (hvis hvordan). We need to include both risk and other information. Following Misund (2015), we apply the Fama-French-Carhart asset pricing model (Fama and French, 1993; Carhart, 1997).
(2) where is the market risk premium, is the small-minus-big factor, is the high-minus-low factor and is the momentum factor. By combining the asset pricing models in Eqs. (1) and (2), the resulting model captures both the impact of earnings and risk. Furthermore, variables such as SMB also control for size premiums (smaller companies tend to provide larger returns than smaller, and FC companies tend to be smaller). In addition, we also include two additional elements. The first is ‘other information’. A relevant variable is the change in net present value of future oil and gas production, SM.9 Moreover, we scale all accounting variables with the previous year’s market value of equity to make them on the same form as returns. Moreover, this approach is also consistent with the approach of Sadorsky (2001), Boyer and Filion (2007), and Misund (2015). The resulting empirical model is
∆ ∆
∆ ∆ , (3)
where i denotes company i and is the previous year’s market value of equity. We also include oil and gas prices changes where ∆ and ∆ denote the changes (returns) in oil and gas prices from time t-1 to t, respectively. Fixed effects are denoted by the vectors and , for company and firm fixed effects, respectively.
In addition to the earnings model in Eq. (3) we estimate a cash flow version (Eq. (4)), where the earnings variables are replaced with cash flow variables
∆ ∆
∆ ∆ , (4)
where and ∆ denoted and changes in cash flow from operations, respectively. We estimate the relationship in Eq.’s (3) and (4) for both FC and SE firms separately, resulting in four empirical models. The reason for estimating separate model for FC and SE firms is that several studies have indicated the characteristics of the two types of firms are different (Malmquist, 1990; Spear and Leis, 1997). FC firms are typically smaller, more aggressive in their exploration activities, more leveraged, and less diversified making them more exposed to volatile commodity prices. If these characteristics manifest themselves as systematic risk factors associated with the small and independent FC companies, they might be picked up by the risk factors in the four factor model. The
8 Total shareholder returns include both capital gains and dividend yields. 9 Ideally we would have liked to include both the standardized measure and change in standardized measure (scaled by beginning of year market value of equity) but due to very high correlations between these two variables we only included one of them in the empirical models.
219
magnitude and significance on the parameters on the risk factors will therefore provide useful insights into the differing characteristics of the two types of companies.10 We include the Fama-French-Carhart risk factors and changes in oil and gas prices as fixed effects which are treated as fixed across firms. The downside of this approach is that we are not able to include firm specific exposures to the risk factors. By grouping the sample into two subsamples the characteristics of the two samples should be more homogenous. The benefit is that we are able to provide insights into the relative exposure to the risk factors and oil and gas price changes, which in itself will provide useful insights. The analysis is carried out in two steps. First, we estimate the earnings model and the cash flow model. Statistical significance of the coefficients on E and CF (likewise ΔE and ΔCF) will indicate their value relevance. A positive and significant loading on the parameter on E (CF) will provide evidence that earnings (cash flow from operations) are positively associated with total shareholder returns. We can further establish the following alternative hypotheses
: Significant coefficients on E and/or ΔE in combination with non-significant coefficients on CF and ΔCF. This is a test of the hypothesis that the accounting method choice and hence accruals signals information about future profitability.
: Significant coefficients on CF and/or ΔCF in combination with non-significant coefficients on E and ΔE. This is a test of the hypothesis that the accounting method heterogeneity confuses investors about the usefulness of accruals and will instead turn to cash flow from operations as measures of future profitability. In addition we carry out Vuong tests to compare the cash flow models with the earnings models. This will help us in the case that the hypotheses above ( , ) do not provide conclusive evidence. The following null hypotheses are used
: An earnings model is better than a cash flow model for FC firms. A significant Vuong z-statistic will reject the null hypothesis and we can accept the alternative hypothesis that a cash flow model is better than an earnings model for FC firms.
: An earnings model is better than a cash flow model for SE firms. A significant Vuong z-statistic will reject the null hypothesis and we can accept the alternative hypothesis that a cash flow model is better than an earnings model for SE firms. 5. Data The data is collected from the John S. Herold database (www.ihs.com/herold). The Herold database contains a substantial amount of information drawn from oil and gas companies’ financial reports (e.g. 10-K SEC filings) including the supplementary information from oil and gas activities. In order to improve the econometric modelling we clean the data by removing observation with missing data for some of the variables and remove outliers. Sometimes an outlier is created when dividing by a low number in the denominator. Visually inspecting the data corroborates this. We take out the outliers by removing the observations above the 99.9 percentile and lower than the 0.1 percentile. This process results in a total of 3517 firm-years, of which 1627 are FC firm-years and the remainder of 1890 are SE firm-years. The two samples are therefore quite balanced in terms of number of observations. Table 1 provides the descriptive statistics for the resulting sample for both FC and SE firms. Table 2 provides the correlations between the variables. As Table 1 shows the average excess return and standard deviation are higher for FC firms than SE firms. On average the FC firms in the sample have appreciated by 42.4% annually compared to 28.3% for SE firms. Interestingly, the average net income (scaled by beginning of year market value of equity) for FC firms has been negative over the period,
10 An alternative approach is to use dummy variable and interact these with the explanatory variables and test the significance of coefficients on the interaction variables.
220
while that of SE firms has been positive. This is not the case for cash flow from operations which has been much more similar, with an average of 0.261 for FC firms versus 0.223 for SE firms. Similarly, the mean changes in cash flow for operations are also very close for both types of firms. Another interesting finding is that the standard deviations in all earnings variables are much higher for FC firms than for SE firms. Moreover, the standard deviations in all earnings variables for are higher than that of the cash flow variables for FC firms. This is not consistent with expectations since the FC approach is thought to result in an income smoothing effect. A possible explanation is that the time period over which we have collected the sample has been characterized by high commodity price volatility, and this might have resulted in numerous write-downs for FC firms. The average change in the standardized measure is much higher for FC firms than SE firms. This is probably due to SE firms being more diversified. With the result that the denominator is also affected by the market values of assets other than reserves. The low difference in the averages of the remaining variables (the common factors) in Table 1 indicates that the two samples are quite balanced in terms of the years in which they have been collected. If the two samples were perfectly balanced then the means would be identical.
Table - Descriptive statistics for Full cost firms and Successful efforts firms
Note. R is total annual shareholder returns, calculated as the sum of capital gains and dividend yields. E and ΔE are earnings (net income) and annual changes to earnings, respectively (scaled by the market value of equity at the beginning of the year). CF and ΔCF are cash flow from operations and annual changes to cash flow from operations, respectively (scaled by the market value of equity at the beginning of the year). ΔNPV is the annual change in net present value of proven oil and gas reserves (the ‘standardized measure’), scaled by the beginning of year market value of equity. MRP, SMB, HML, and MOM are the annual Fama-French-Carhart market excess return, small-minus-big, high-minus-low, and momentum risk factors, respectively, as found on Ken French’ website. ΔOP and ΔGP are the annual changes in the front month crude oil and gas futures prices, respectively. 6. Results and discussion In the following section we present the results of the estimation of the four empirical models after carrying out some diagnostics procedures. First, we check if a fixed effects model is better than either random effects or pooled OLS models. Then, after the final model is selected, the residuals are tested for presence of both heteroskedasticity and serial correlation in order to determine if the robust covariance matrix estimators are necessary. The results from the final models are shown in Table 2. The coefficients on earnings and changes in earnings are not significant for neither FC nor SE firms. Secondly, the coefficients on cash flows for both firms and changes in cash flows for SE firms are significant. In fact, the parameters on cash flow from operations are significant at the 99% confidence level. Taken together these results allow us to reject hypothesis and accept hypothesis , implying that accounting method heterogeneity and management discretion does not provide a valuable signal for investors. Investors instead prefer cash flows to earnings. The Vuong tests also confirm this finding. The results are in line studies such as Cormier and Magnan (2002) and Misund et al. (2008) who find significant cash flow coefficients, but contradicts other studies such as Duchac and Douthett (1997) who find a significant earnings-returns relationship.
221
The results also show that changes in the net present value of reserves are value relevant for SE firms, but not for FC firms. This is surprising since this measure is independent of accounting method choice. Boone (2002) attributes this to a higher measurement error for FC firms. Even though it has been criticized, some studies have previously found it to be relevant, notably Boone (2002) and Bryant (2003). Interestingly, we find that the FC models give a higher adjusted R2, but by careful inspection of the coefficients we see that this clearly not related to earnings and earnings changes, but rather the effect of other variables. This illustrates comparisons based on adjusted R2 values must be interpreted with care. A higher R2 for the FC models does not imply a higher value relevance of earnings, but it could be the combinations of all the other variables.
Vuong test (z-statistic) -2.425 (<0.001) -1.629 (0.052)
Note: p-values in parantheses. E and ΔE are earnings (net income) and annual changes to earnings, respectively (scaled by the market value of equity at the beginning of the year). CF and ΔCF are cash flow from operations and annual changes to cash flow from operations, respectively (scaled by the market value of equity at the beginning of the year). ΔNPV is the annual change in net present value of proven oil and gas reserves (the ‘standardized measure’), scaled by the beginning of year market value of equity. MRP, SMB, HML, and MOM are the annual Fama-French-Carhart market excess return, small-minus-big, high-minus-low, and momentum risk factors, respectively, as found on Ken French’ website. ΔOP and ΔGP are the annual changes in the front month crude oil and gas futures prices, respectively. The loadings on the risk factors provide insight into the impact of different types of systematic risk on the returns on oil companies. Prior studies vary substantially with respect to treatment of risk in returns. Some disregard risk (e.g. Bryant, 2003), while others only include the market risk premium explicitly (e.g. Sadorsky, 2001; Boyer and Filion, 2007) or indirectly through risk adjustment of the returns before regressing on the explanatory variables (e.g. Boone and Raman, 2007). Value-relevance studies typically do not included the other risk factors identified by Fama and French (1993; 1996), Jegadeesh and Titman (1993) and Carhart (1997). We find that several of the risk factors are in fact important. While the loading on the market risk premium is quite similar for FC and SE firms, the loadings on the other risk factors are more different. For instance, the loading on the SMB risk factor (small-minus-big) is higher for FC firms than SE firms and is in line with the finding that FC firms tend to be smaller. Hence the higher average return for FC firms can in part be attributed to the SMB risk factor. The significance of the loadings on the HML and MOM factors are
222
less consistent and vary across the earnings and cash flow models making their interpretation challenging. Also the loadings on changes in oil and gas prices provide insight into the differences between FC and SE firms. Few value relevance studies explicitly model the change in oil and especially the gas price. Some studies, however, include fixed year effects captures some of the same effects as using fixed oil price changes, as we have done in our study. The benefit of using changes in oil and gas process separately instead of year-dummies is that we are able to assess the differential impact of oil price and gas price changes on the returns. The results show that FC firms, compared to SE firms, are slightly more exposed to the oil price (i.e. coefficients of 0.45 (FC) and 0.40 (SE)) in the earnings model, but much more exposed to the gas price i.e. coefficients of 0.39 (FC) and 0.12 (SE). This is consistent with the claims made that FC are more exposed to the commodity price. The results show that FC and SE firm characteristics are different and that the investors place different loadings on the variables and thus able to distinguish between the two types of firms. The overall impression from the results is that the returns on both FC and SE firms are determined by fundamental factors consistent with financial economic theory, rather than accounting based profitability measures. This is consistent with the theory that when faced with accruals that do not provide valuable signals investors will turn to cash flows measures. In addition, some of the differing characteristics of FC versus SE firms are prices by the markets. For instance, the smaller size of FC firms result in a higher loading on the SMB factor. Given the controversy surrounding the accounting method heterogeneity for oil and gas exploration activities (including longstanding debate, lobbying activities, interference by regulators, etc..) combined with specific characteristics in the oil and gas industry, it should therefore not be surprising that the financial markets turn to fundamental information contained in cash flows, financial asset pricing models and net present values of expected future cash flows. It is indeed a triumph of economics over politics. 7. Conclusions and Policy Implication In this paper, we have examined the relative value-relevance of cash flow versus earnings for oil and gas firms as a function of accounting method heterogeneity. We use an empirical model based on Ohlson (1995) that provides insight into the impact on oil and gas firm total shareholder returns of short term profitability (earnings or cash flow from operations), long term profitability (net present value of reserves) and Fama-French-Carhart and commodity price risk factors. We find that the accounting method heterogeneity combined with management discretion does not provide a valuable signal to investors. Instead it seems that the returns on both FC and SE firms are determined by fundamental factors consistent with financial economic theory, rather than accounting based profitability measures. This is in line with theory suggesting that when an investor is faced with accruals that do not provide valuable signals, she will turn to cash flows measures. In fact, we find a positive association of both short-term and long term cash flow measures with returns for oil and gas firms that use the SE approach. The results also suggest that although FC and SE firm characteristics are different, this seems to be recognized and priced by investors. Given the controversy surrounding the accounting method heterogeneity for oil and gas exploration activities (including longstanding debate, lobbying activities, interference by regulators, etc..), combined with specific characteristics in the oil and gas industry, it should therefore not be surprising that the financial markets turn to fundamental information contained in cash flows, financial asset pricing models and net present values of expected future cash flows. It is indeed a triumph of economics over politics. Moreover, the results provide support for the SEC’s and FASB’s efforts in developing a fair value measure of oil and gas reserves as an alternative to historical cost in light of the SE and FC debacle in the late 1970s. This result should be of interest to standard setters if they in the future again would like to promote a unified accounting method for exploration activities. The results from our study also highlight the importance of requiring the disclosure of alternative measures or supplementary disclosures in the instances where accounting method heterogeneity leads to reduced importance of accruals for forecasting future cash flows. Given the apparent importance to investors of the supplementary oil and gas disclosures, regulators and standard setters should consider recommending that this type of information is disclosed on a more frequent basis, e.g. quarterly disclosures, for oil and gas producers.
223
References Aboody, D. (1996). Recognition versus disclosure in the oil and gas industry. Journal of Accounting Research 34,
21-32. Alciatore, M, Easton P. and N. Spear (2000). Accounting for the impairment of long-lived assets: Evidence from
the petroleum industry. Journal of Accounting and Finance 29, 151-172. Asche, F. and B. Misund (2016). Who’s a major? A novel approach to peer group selection: Empirical evidence
from oil and gas companies. Cogent Economics & Finance 4:1264538. http://dx.doi.org/10.1080/23322039.2016.1264538. Ayres, F.L. and J.D. Rayburn (1991). Selectivity bias and the association between unexpected returns, earnings
and supplementary reserve disclosures in the petroleum industry. Working paper, University of Oklahoma, Norman, OK and University of Minneapolis, MN.
Bandyopadhyay, S.P. (1994). Market reaction to earnings announcements of SE and FC firms in the oil and gas industry. The Accounting Review 69 (October), 657-674.
Berry, K.T. and C.J. Wright (2001). The value relevance of oil and gas disclosures: An assessment of the market’s perception of firm’s effort and ability to discover reserves. Journal of Business Finance and Accounting, 28(5/6), 741-769.
Berry, K.T., Hasan, T. and D. O’Bryan (1998). Relative information content of proved reserves: The BOEs-Revenue vs BOEs-Energy. Journal of Energy Finance and Development 3 (1), 1-11.
Boone, J. (2002). Revisiting the reportedly weak value relevance of oil and gas asset present values: The roles of measurement error, model misspecification, and time-period idiosyncrasy. The Accounting Review 77 (1), 73-106.
Boone, J. and K.K. Raman (2007). Does implementation guidance affect opportunistic reporting and value relevance of earnings? Journal of Accounting and Public Policy 26, 160-192.
Boyer, M.M. and D. Filion (2007). Common and fundamental factors in stock returns of Canadian oil and gas companies. Energy Economics 29, 428-453.
Bryant, L. (2003). Relative value relevance of the successful efforts and full cost accounting methods in the oil and gas industry. Review of Accounting Studies 8 (1), 5-28.
Carhart, M.M. (1997). On persistence in mutual fund performance. The Journal of Finance 52 (1), 57-82. Clinch, G. and J. Magliolo (1992). Market perceptions of reserve disclosures under SFAS No. 69. The Accounting
Review 67(4), 843-861. Collins, D. and W. Dent (1979). The proposed elimination of full cost accounting in the extractive petroleum
industry: An empirical assessment of the market consequences. Journal of Accounting and Economics 1, 3-44. Collins, D.W., Dent, W.T. and M.C. O’Connor (1978). Market effects of the elimination of full cost accounting in
the oil and gas industry. Financial Analyst Journal, 34(6), 48-. Collins, D.W., Rozeff, M.S. and D.S. Dhaliwal (1981). The economic determinants of the market reaction to
proposed mandatory accounting changes in the oil and gas industry: A cross-sectional analysis. Journal of Accounting and Economics 3(1), 37-71.
Cormier, D. and M. Magnan (2002). Performance reporting by oil and gas firms: Contractual and value implications. Journal of International Accounting, Auditing and Taxation 11 (2), 131-153.
Cortese, C.L. (2011). Standardizing oil and gas accounting in the U.S. in the 1970s: Insights from the perspective of regulatory capture. Accounting History 16 (4), 403-421.
Cortese, C.L. and Irvine, H.J. (2010). Investigating international accounting standard setting: the black box of IFRS 6. Research in Accounting Regulation 22, 87-95.
Cortese, C.L., Irvine, H.J. and M.A. Kaidonis (2009). Extractive industries accounting and economic consequences: Past, present and future. Accounting Forum 33, 27-37.
Cortese, C.L., Irvine, H.J. and M.A. Kaidonis (2010). Powerful players: How constituents captured the setting of IFRS 6, an accounting standard for the extractive industries. Accounting Forum 34, 76-88.
Deakin, B.E. (1979). An analysis of differences between non-major oil firms using successful efforts and full cost methods. The Accounting Review 54 (4), 722-734.
Dechow, P.M. (1994). Accounting earnings and cash flows as measures of firm performance: The role of accounting accruals. Journal of Accounting and Economics 18, 3-42.
DeFond, M.L. and M. Hung (2003). An empirical analysis of analysts’ cash flow forecasts. Journal of Accounting and Economics 35, 73-100.
Dhaliwal, D.S. (1980). The effect of the firm’s capital structure on the choice of accounting methods. The Accounting Review 55 (1), 78-84.
Duchac, J. and Douthett, E. (1997). The effect of accounting for oil and gas reserves on the relation between returns and earnings. Journal of Accounting and Finance Research 4 (2), 20-32.
Dyckman, T.R. and A.J. Smith (1979). Financial accounting and reporting by oil and gas producing companies: A study of information effects. Journal of Accounting and Economics 1, 45-75.
224
Fama, E.F. and K.R. French (1993). Common risk factors in the returns on stocks and bonds. Journal of Financial Economics 33 (1), 3-56.
Fama, E.F. and K.R. French (1996). Multifactor explanations of asset anomalies. The Journal of Finance 51 (1), 55-84.
Fields, T.D., T.Z. Lys and L. Vincent (2001). Empirical research on accounting choice. Journal of Accounting and Economics 31, 255-307.
Financial Accounting Standards Board (1982). Statement of Financial Accounting Standards No. 69: Disclosures about Oil and Gas Producing Activities. FASB: Stamford, CT.
Financial Accounting Standards Board (2010). Financial Accounting Series. Accounting Standards Update. Extractive Activities – Oil and Gas (Topic 932): Oil and Gas Reserves Estimation and Disclosures. An Amendment of the FAB Accounting Standards Codification. FASB: Stamford, CT.
Harris, T.S. and J.A. Ohlson (1987). Accounting disclosures and the market’s valuation of oil and gas oroperties. The Accounting Review 62 (4), 651-670.
Healey, P. and K. Palepu (1993). The effects of firms’ financial disclosure strategies on stock prices. Accounting Horizons 7, 1-11.
Holthausen, R. and R. Leftwich (1983). The economic consequences of accounting choice: Implications of costly contracting and monitoring. Journal of Accounting and Economics 5, 77-117.
Jegadeesh, N. and S. Titman (1993). Returns to buying winners and selling losers: Implications for stock market efficiency. The Journal of Finance 48 (1), 65-91.
King, R.D. and T.B. O’Keefe (1986). Lobbying activities and insider trading. The Accounting Review (1), 76-90. Kretzschmar, G.L., Misund, B. and D. Hatherly (2007). Market risks and oilfield ownership – Refining oil and gas
disclosures. Energy Policy 35(11), 5909-5917. Larcker, D.F., Reder, R.E. and D.T. Simon (1983). Trades by insiders and mandated accounting standards. The
Accounting Review, 606-620. Lev, B. (1989). On the usefulness of earnings and earnings research: Lessons and directions from two decades of
Empirical Research. Journal of Accounting Research 27 (Supplement), 153-201. Lilien, S. and V. Pastena (1981). Intramethod comparability: The case of the oil and gas industry. The Accounting
Review 56 (3), 690-703. Malmquist, D.H. (1990). Efficient contracting and the choice of accounting method in the oil and gas industry.
Journal of Accounting and Economics 12, 173-205. Misund, B. (2015). Reserves replacement and oil and gas company shareholder returns. University of Stavanger
Working Paper. Misund, B. (2016). Vertical integration and value-relevance: Empirical evidence from oil and gas producers.
Cogent Economics & Finance 4:1264107, http://dx.doi.org/10.1080/23322039.2016.1264107. Misund, B. and P. Osmundsen (2015). The value-relevance of accounting figures in the oil and gas industry: Cash
flow or accruals? Petroleum Accounting and Financial Management Journal 34(2), 90-110. Misund, B. and P. Osmundsen (2017). Valuation of proved vs. probable oil and gas reserves. Cogent Economics &
Finance, 5: 1385443. https://doi.org/10.1080/23322039.2017.1385443. Misund, B., Asche, F. and P. Osmundsen (2008). Industry upheaval and valuation: empirical evidence from the
international oil and gas industry. The International Journal of Accounting 43 (4), 398-424. Misund, B., F.Asche and P. Osmundsen (2008). Industry upheaval and valuation: empirical evidence from the
international oil and gas industry. The International Journal of Accounting 43 (4), 398-424. Misund, B., Mohn, K. and M. Sikveland (2017). Exploration risk in oil and gas shareholder returns. Forthcoming
in Journal of Energy Markets. Misund, B., Osmundsen, P. and M. Sikveland (2015). International oil company valuation: The effect of
accounting method and vertical integration. Petroleum Accounting and Financial Management Journal 34(1), 1-19.
Ohlson, J.A. (1995). Earnings, book values, and dividends in equity valuation. Contemporary Accounting Research 11 (2), 661-687.
Osmundsen, P, Asche, F., Misund, B. and K. Mohn (2006). Valuation of international oil companies. The Energy Journal 27 (3), 49-64.
Osmundsen, P, K. Mohn, F. Asche, and B. Misund (2007). Is supply choked by financial market pressures? Energy Policy 31 (2), 467-474.
Quirin, J.J., Berry, K.T. and D. O’Brien (2000). A fundamental analysis approach to oil and gas firm valuation. Journal of Business Finance and Accounting, 27(7/8), 785-820.
Ramakrishnan, R.T.S. and J.K. Thomas (1992). Valuation of permanent, transitory and price-irrelevant components of reported earnings. Working paper, Columbia University. New York, NY.
Sadorsky, P. (2001). Risk factors in stock returns of Canadian oil and gas companies. Energy Economics 23, 17-28.
225
Securities and Exchange Commission (1979). Accounting Series Release No. 269: Oil and Gas Producers – Supplemental Disclosures on the Basis of Resereve Recognition Accounting. Washington, D.C.: Securities and Exchange Commission.
Securities and Exchange Commission (1982). Financial Reporting Release No. 9: Supplemental Disclosures of Oil and Gas Producing Activities. Washington, D.C.: Securities and Exchange Commission.
Securities and Exchange Commission (2008). Modernization of oil and gas reporting. Washington, D.C.: Securities and Exchange Commission.
Spear, A. and M. Leis (1997). Artificial neural networks and the accounting method choice in the oil and gas industry. Accounting, Management and Information Technologies 7 (3), 169-181.
Spear, N. (1994). The stock market reaction to the reserve quantity disclosures of U.S. oil and gas producers. Contemporary Accounting Research 11(1), 381-404.
Spear, N. (1996). The market reaction to the reserve-based value replacement measures of oil and gas producers. Journal of Business Finance and Accounting, 23(7), 953-974.
Sunder, S. (1976). Properties of accounting numbers under full costing and successful efforts costing in the petroleum industry. The Accounting Review 51 (), 1-18.
Sutton, T.G. (1984). Lobbying of accounting standard-setting bodies in the U.K. and the U.S.A.: A downsian analysis. Accounting, Organizations and Society 9 (1), 81-95.
Van Riper, R. (1994). Setting standards for financial reporting: FASB and the struggle for control of a critical process. Connecticut, USA: Quorom Books.
Vuong, Q.H. (1989). Likelihood ratio test for model selection and non-nested hypotheses. Econometrica 57, 307-333.
Watts, R.L. and J.L. Zimmerman (1986). Positive accounting theory. Englewood Cliffs, NJ: Prentice-Hall. Wright, C.J. and R.A. Gallun (2005). International Petroleum Accounting. Tulsa, Oklahoma: PennWell. Zeff, S.A. (1978). The risk of ‘economic’ consequences. Journal of Accountancy 146 (6), 56-63.
226
ENERGY EFFICIENCY IN BUILDINGS: A SIMPLE BUT ACCURATE WAY TO PERFORM CALCULATIONS Giuseppe Dell’Olio
Energy efficiency assessments of buildings are often criticized for being too expensive. This is due, i.a., to the complexity of the International Standards on which they are based. For the application of these Standards, technical expertise is often not enough: expensive software tools are also needed, which increases the fee for the hired professional. Not surprisingly, “simplified” methods are envisaged, albeit not detailed, by legislation. Is it possible to perform energy efficiency assessment in a simplified, yet accurate way? When assessing energy efficiency of a building, one of the most complicated steps is the calculation of solar heat contribution, especially through windows: for each month and for each exposure direction, the time percentage during which curtains, shutters etc. are expected to be kept closed needs to be taken into account. Even in the extremely simple case of a house with only four vertical walls, this involves handling approximately thirty numbers (a bit less in warm areas, where the heating annual period is short; a bit more in cold ones). Why not choose once and for all, out of those thirty numbers, a few that minimize solar heat? Calculation would become much simpler, and, moreover, conservative: solar contribution would be underestimated. We tested this method on an actual building. We selected a stand-alone, 2011 designed house in central Italy. The house is thermally isolated and equipped with heating (but no cooling) installation. We first assessed the EP (Energy Performance index) rigorously; namely, we distinguished the various months that make up the heating season, as well as the various directions of solar radiation incidence. EP turned out to be 78.15 kWh/(m2year). As per applicable legislation, we then performed the calculation, in the same condition, for the “reference building”: this time we obtained 72.39 kWh/(m2year). The house resulted to be a “B” class. After that, we repeated the whole procedure with the conservative hypothesis described above (solar heat contribution underestimated). Details follow. Let us first consider, for example, radiation from south. UNI TS 11300-1:2014 provides following information (Table 21): of all months that make up the heating annual period, October is the one during which curtains are kept closed for the longest duration (86% of overall time). We assumed conservatively that this figure is not only relevant to October, but to all months. During the whole of winter, therefore, curtains of windows facing south are kept closed during 86% of the time. Similarly, we assumed that curtains facing East were closed during 73% of the whole time (value for September, applied to all months), and curtains facing West were closed during 67 % of time (also value for September). As to North, based on Table 21, curtains were assumed to be constantly open (closing time: zero). A further assumption is about the effectiveness of curtains. Based on Table B.1, we assumed conservatively that they were able to shield 90% of solar radiation when closed. Advantages associated with this procedure are obvious. Not only did we replace some thirty numbers (from Table 21) with only four: but, which is more, those four, chosen once and for all, apply (after interpolation, if needed) to any other building in the same area. Calculation of EP’s was much simpler and rapid: 84.63 kWh/(m2year) for the real building; 78.61 kWh/(m2year) for the reference building. Both EP’s turned out to be higher (worse) than respective “rigorous” values. The energy efficiency class was unchanged (B). In order to test the method once more, we performed a further calculation, based, this time, on an overestimate of solar heat contribution. Not surprisingly, EP’s turned out to be lower (better) than corresponding rigorous values (68.38 kWh/(m2year) for the real building; 63.22 kWh/(m2year) for the reference building). Energy efficiency class: B.
227
All calculations are summarized in Figure 1.
Figure 1 – a comparison between underestimate, overestimate and rigorous calculation of solar heat
contribution: EP’s and corresponding limits for energy efficiency class B
Our conclusion: the energy classification of buildings is largely independent of solar heat contribution. This is because solar heat acts “in the same direction” on both EP’s: underestimating solar heat results in an overestimate of EP, both for the real building and for the reference building. The latter is especially important, as it also affects the upper and lower limits of ranges associated with energy efficiency classes: these limits, which are proportional to EP of the reference building, are in turn overestimated. As a result, conservatively underestimating solar heat is an efficient way to simplify calculation and to save costly calculation time. This implies no loss of accuracy: the energy efficiency class of the building is unchanged. If such an approximation were to be adopted in software tools used to perform energy calculations on buildings, a significant cost reduction might be expected. Following considerations further corroborate our conclusion. Can we really hope to know precisely how long, each month, the curtains of a building will be kept closed? With regard to this, UNI/TS11300 provides a merely probabilistic, largely uncertain estimate. Facing uncertainty, technicians are bound to have conservative approaches. We proposed one. Besides, the error affecting the above simplified method is low: in the example we gave, conservative EP only exceeds rigorous EP by 9%, both for the real building and for the reference one. This is a very high, case specific difference: the building is stand-alone; solar radiation is only shielded by mobile elements (curtains). Usually, however, steady shielding elements are present: namely trees, surrounding buildings, hills, protruding elements of the building itself like balconies. These elements further limit solar heat contribution, which makes our conservative assumption even more true. It is then reasonable to place a typical EP overestimate at 4-5%. This is very close to, or even smaller than, the uncertainty regarded as acceptable by legislation about software («decreto ministeriale 26 giugno 2015», art. 7, comma 1). Admittedly, steady shielding could be taken into account, as UNI TS 11300 provides a specific, allegedly rigorous calculation method. However, this method involves angles above horizon, latitude, different orientations, seasonal variations, all of which contribute to make it unpractical. Since, as we showed, a very small error (and, moreover, a conservative one) is at stake, it is legitimate to wonder once more: is it worth the effort?
(assessments in all the above text are based solely on the author’s personal opinions).
228
EU 2030 CLIMATE ENERGY POLICY Fabrizio Fabbri Introduction Impacts of climate change are not any longer a prospect for the future but a daily realty. The possibility of keeping the temperature raising below 1.5 o C by the end of century is still highly debated while keeping the warming below 2o C could have an higher chance provided concrete mitigation policies are adopted and implemented soon. Though the Paris Agreement has raised hopes, its not binding nature, and the consequent lack of a sanctioning system in place for not compliance, is less then optimal considering the magnitude of the damages impacts of climate change may have. In November 2016 the EU has submitted its national determined contribution as whole (EU NDC) to the UNFCCC committing to cut its emission by at least 40% by 2030 compared to 1990. The European Commission (EC) submitted a package of legislative proposals aimed at setting up emission reduction targets, targets for the promotion of the renewable energy and energy efficiency and to set up regulatory framework (ie Energy Market Directive, Energy Market Regulation, Governance of the Energy Union). The following review will try to picture possible scenario on the final outcome for some of most important legislation proposals that are in their final negotiation stage among co-legislators (ie so called “trilogue”). Some consideration about the consistency among policies and what is needed will be proposed for further discussions. 1. ETS Directive The revision of the ETS Directive is of outmost importance as the EC expects some 43% of the overall reduction in GHGs emissions by 2030 to come from industrial sectors under the scope of the Directive. In general, the Council and the European Parliament (EP) agreed on the broad approach that includes provision to protect the industrial sectors exposed to carbon leakage, to fund innovation on low carbon activities and new renewables and to fund the renovation of electricity production in some countries. The main points under negotiation between the Council and the Parliament include: A. Exclusion of installation from the scope of the Directive The Parliament proposed two main changes to the on going provisions: a. an extension of the opting out of installation with emissions up to 50 Kt CO2/yr from 25 Kt CO2/yr A corresponding reduction in emissions should be ensured by the Member states in other sectors covered by the Effort sharing regulation. This would amount to extend the possibility to opt out installation releasing up to 90 million t/y from less than 45 million with the threshold of 25 Kt/y; b. a further possibility to allow the opting out of very small emitters defined as those releasing less than 5 Kt CO2/year without any need for Member States to take measures to compensate them. These installations will benefit even of a simplified verification and reporting system. Such an exclusion will take off around 4 million tCO2/y. The implication for the Council to accept point “a” is that Member States will have to reduce more emissions from others sectors under the Effort Sharing Regulation (ESR). On the other hand, it is could be more flexible on accepting a further alleviation on the burden to very small emitters referred to in point be, but it’s unlikely that it will accept any threshold higher than 1-1.5 ktCO2/yr.
229
B. Funds a. Innovation fund The Fund is aimed at supporting the demonstration of innovative solutions to reduce GHGs emissions. While the Council has proposed a reduction to set a limit at 300 million allowances (down from 400 million proposed by the Commission), the EP proposed to raise it to 600 million, 450 million of which from the auctioning pot and the remaining 150 million form the allowances meant to be given for free. The best counterproposal so far offered by the Council is to raise it to 400 million, 300 of which from free allowances. b. Just Transition Fund (JTF) This fund has been proposed by the Parliament to support Regions with an high number of workers employed in industrial carbon dependent sectors and that have a GDP per capita well below EU average. The fund is supposed to be financed by the revenues from 2% of the total allowances to be auctioned by Members States. Council and Commission don’t support the creation of another fund possibly overlapping with the European Social Fund and the Regional Development Fund. While the principles referred to in the JTF are likely to be listed in the scope of one of existing fund, possibly the Modernization Fund, whether or not the hosting fund would be increased is still quite an open question. c. Modernization Fund This fund is aimed at helping the Member States with a GDP per capita lower than 60% of the EU average and higher emission from power generation, to promote low carbon energy production. The three institutions agree that the Fund should be financed by the 2% of total allowances to be auctioned, but the Parliament did introduce a maximum threshold for emissions from new power installation of 450 gr/kWh to avoid the funding of new coal firing plant. This is a condition that the Council is unlikely to accept as it will be fought by some Member States, headed by Poland with high investment in coal and lignite power plant of the grants received through the Modernization Fund. d. Indirect costs compensation The Parliament proposed to harmonize the treatment of sectors exposed to carbon leakage because of indirect costs of emissions passed on in electricity price, by destining 3% of the total allowances, 2% from those to be auctioned and 1% from free allowances, with further possibility for member States to cover the remaining part if needed. This proposal have been made mainly to resolve the intra EU controversy over the different treatment received by the same sectors mostly steel, in different Members States. The current legislation and the original proposal, allows the Members States to intervene to help reduce indirect costs as long as they respect the Stat aid rules but such provision has been applied only by some MS and not by others creating intra EU competition . The Council just proposed to continue to leave MS the freedom to use up to 25% of revenues from auctioning to compensate such costs, or more if duly justified. Apparently a compromise can be reached to make an explicitly reference to an harmonized measure during the revision that the Commission should do after every stocktake under UNFCCC. C. Greece provisions Both Council and EP agreed to help Greece to cope with the need to modernize the power generation sector, but while the EP simply introduced a specific derogation to allow the country to get access to the Modernization Fund, the Council did propose to fund it with 20 million allowances unallocated for the current trading phase. The institution seems to agree to set up a 25 million worth fund, taking 5 million allowances from the ones not allocated from the new entrants reserve in the current trading phase.
230
D. Free allocation and carbon leakage This is possibly the most sensitive part of the Directive as the EP and the Council are both very keen in avoiding any measures that could hinder the economic recovery and growth of EU manufacturing industries. This is the reason why both institutions agreed to continue the allocation of free allowances up to 43% of the total in a given year. Actually, for a sector to be recognized as highly exposed to carbon leakage the result of trade intensity by energy intensity (grCO2/euro of gross value added) shall be less than 0.2, condition necessary to get 100% of allowances for free. The other sectors with higher index will still get 30% of their need in form of free allocations, with the only exception of power generation whose ETS costs are passed on to final costumers. When allowances for free are not enough to cover the needs of all eligible sectors, a reduction on allowances allocated for free is applied evenly across the beneficiary sectors (cross sectorial correction factor - CSCF). Further provisions are envisaged to allow free allocation even to sectors with an index of exposure to carbon leakage over 1,5, when a risk of carbon leakage emerge from qualitative assessment of the sector or subsector. The Parliament introduced a mechanism to avoid the automatic application of CSCF in case of shortage in free allowances by providing that the share to be auctioned could be reduced by 5% over the entire period. In the event that even this amount won’t be enough, then a tiered CSCF will apply among sectors with a risk of exposition to intensity of trade with third countries lower than 15% or with a carbon intensity below 7 kgCO2/euro of gross added value. The Council seems determined to concede a maximum of 2,5% reduction from auctioning share, a percentage which is likely to be close to the one upon which an agreement can be reached. Further according to EC and Council a tiered CSCF not only could be unfair but even expose to the risk of legal challenges. Another point of disagreement regards the EP decision to treat the electricity generated by industrial waste gases as not being power generation and thus allowing it for being eligible for free allocation. On the benchmarking review, on the other hand, the Council and the EP are very close to reach an agreement on the dynamic benchmark update that takes into account the lower and the faster mover in industrial sectors. In this frame an adjustment of the benchmark values can be triggered with values of reduction annual rate between a lower threshold of 0,2 to 0,25% or higher than 1,55 to 1,75% as the two institutions are still debating on the final number. E. Strengthening the EU ETS On the environmental integrity side, the EP adopted two provisions aimed at having an upfront cancellation of 800 million allowances from the market stability reserve at the beginning of 2021 and a vague indication to raise the linear reduction factor from 2,2% up to 2,4% as soon as possible. Further, it proposed to phase out free allowances for less exposed sectors by 2026 but all those provisions have been rejected as unacceptable by the Council and the likely final outcome seems to be something referred to in the article on the review process and an early starting of the Market Stability Reserve (MSR) to store excess allowances. 2. Effort Sharing Regulation This is the second most important pillar for mitigating climate change as it is expected to contribute to an overall reduction of 30% of total emissions by 2030 with respect to 2005. The proposal builds upon the EC decision 2013/162/UE and continues to apply the same principle of repartition among Member States that take into account the average GDP per capita as well as the cost effectiveness of action in relation to reduction potential among the sectors of agriculture (non CO2 emissions), transport, building sector, waste management and the installation not covered by the ETS. The
231
resulted differentiated targets among Member States (MSs) span from emission reduction of 0% to -40%. The trilogue process has just started and though not striking, still the orientation of the EP and the Council present some differences that will need a deeper debate before an agreement will be possible. Starting point The EP proposed to start the application of the linear reduction trajectory in 2018 capping the starting amount on the average of GHGs emissions between 2016 and 2018 (as from the original proposal) or the annual emission allocation for the year 2020, whichever is the lowest, for each Member States. Further, it proposed to mention the continuing of the trajectory up to 2050 by when Member States have to release 80% less GHGs. B. Flexibilities Both institutions proposed to raise the possibility for Member States to fulfill the emission annual target of a date year by borrowing up to 10% of the allocation of the following year for the first half of the period (2021-2025) lowering it down to 5%, which was what Commission proposed for the entire period. Furthermore the EP proposed to: - allow the Member States whose emission in a date year are less then the allocation for the same year to bank credit up to 10% for the first 5 years and up to 5% until the end of the period: - allow Member States to sell up 5% for the first 5 years and up to 10% of their annual allocation to another Member State for the second period The Council, on its side included the possibility for MSs to buy emission credits by funding project in another Member State and by using the revenues from emission credit transfer to fund climate change projects in EU or in third countries. Two more flexibilities are allowed to address specific circumstances for some MSs. The first, already in the original Commission proposal, is aimed to address the constraints small countries with high GDP may face to reach their internal reduction targets. Those countries may transfer part of the allocation for auctioning under the ETS Directive up to a cumulative amount of 100 million allowances over the entire period. The Council proposed to give those countries the possibility to review downward the total amount of allowances transferred twice (in 2024 and 2027). The Parliament introduced a conditionality that would allow Member States to access this flexibility only in exchange of their commitment to take reduction measures on sectors where past achievements have been insufficient. The second is a new mechanism introduced by both the Council and the EP to help those Member States whose GDP per capita in 2013 was lower than EU average and whose verified emissions overachieved their reduction targets for 2020. The EP proposed a fund of 90 million tons CO2 while the Council proposes tu put 115 million tons CO2 to help these countries. The Council proposed to allow each eligible MS to benefit for a maximum of credits corresponding to 20% of its own overachievement. The last flexibility allows MS whose GHGs sequestration (as CO2 equivalent) in agriculture sectors are higher than emissions, to use of a cumulative amount of 280 million tonnes to compensate any excess of emissions compared to the allocations in a date year. The EP extended the possibility to account for GHGs removal from all categories covered by the Land Use Land Use Change and Forestry Regulation (LULUCF) which include wetlands and forestry
232
(ie managed forests to be distinguished from afforested land that is not meant for commercial purpose but only to replace deforested land and/or to increase wood coverage). C. Compliance When a MS exceeds its allocation for a date year, it has to present a compensation plan to provide a reduction in the surplus emissions multiplied by a penalty factor of 1,08. Contrary to the original proposal endorsed by the Council that foresees two compliance checks at five year interval (ie in 2027 and 2032), the EP proposed a two year round check. 3. LULUCF Regulation The Regulation sets a zero net account emissions (ie GHGs emissions equal the removals) from the categories covered compared to a reference level. The categories of land coverage include croplands, grasslands, deforested and afforested land, managed wetlands and managed forest. Though meant as an accounting system to keep on the reporting of emissions and removals by land coverage and wetlands provided for under Kyoto Protocol that will expire in 2020, LULUCF plays an important role in mitigation measures. As already seen, GHGs removals from LULUCF can be partly used toward the annual emissions reduction targets under the ESR and, if the Council proposal will be endorsed, it will be possible for MS to compensate emissions from managed forests in case they result higher than the removal by reducing a corresponding amount of allocation credits under the ESR up to over 360 millions tons. Further, the Paris agreement calls upon the parties to preserve and enhance sinks so that by the second half of the century emissions will be entirely offset by removals. Among all categories, managed forest is the most controversial one as it’s double linked to Renewable Energy Directive (RED II) that foresees the use of solid biomass for energy production that has already raise considerably as consequence of the on going legislation on renewables. In order to limit the support for forest biomass, Commission proposal set a reference level for this category as the emissions and sinks registered between 1990 (reference year under Kyoto accounting system) and 2009 (year of the adoption of ERD for 2020). While Council proposed to update the reference to the years 2000-2009 those preserving the integrity of the proposal, the EP proposed to take more recent data from 2000 to 2012. In doing so, part of the increase in use of biomass for energy purposes will be included in the reference level. Furthermore, EP proposed to exclude from the provision the need to level the intensity of forestry to that of the reference period and even to making a specific mention of the possibility to raise it though under certain conditions. As general condition, not more than 3,5% of GHGs removed from managed forest can be accounted toward MSs net removal accounting as net removal for the category. An attempt to counterweight the rush to biomass burning has been introduced by the EP by proposing two more accounting categories under the managed forest, namely wood products (aimed at replacing other more carbon intensive materials) and dead wood. The GHGs saving by these two categories may add a further 3,5% to the total amount of removal a MS can account for the managed forests balance. 4. Renewable Energy Directive (REDII) and Energy Efficiency Directive (EED) Though the entire package of energy-climate legislative proposals entails several aspects that may indirectly contribute to the achievement of the overall reduction targets, EED and the ERD II may play a crucial role in mitigation process. These two legislation proposals are still under negotiation either in the Council and the EP, and a first appraisal could be done only for the original proposal and the general orientation of the Institution. For RED II the Commission proposed a recasting mainly aimed at adopting new targets for renewables and at reviewing the use of bioenergy and sustainability criteria. The first and possibly more important change proposed was to set only on overall target of 27% (from 20% to be reached by 2020) at EU level that has to be reached by 2030 through contribution by all
233
MSs. The Commission should ensure that the sum of each MS contribution is adequate to the final goal and may request additional efforts. So far ENVI and ITRE Committees in the EP seem oriented to raise the target somewhere around 35% with binding national targets, but negotiation among political groups on those aspects are still pending and these proposals are opposed by more conservative groups. The vote in ENVI committee took place recently setting up the new sustainability criteria and provision on biofuels and bioenergy in general. These parts of the Directive are under exclusive competence of ENVI so that ITRE cannot change them, but still the plenary can. For the time being, anyway, the direction taken by the Parliament has some positive aspects regarding the use of first generation biofuels based on food and feed crops whose percentage should go down from 7% in 2021 to 0% in 2030 apart from that derived from crop with low ILUC factor (ie crops with low displacement effects from food and feed use) for which there will be no limit. Further from 2021 the use of palm oil cannot be accounted for the renewables targets. Fuels supplier should provide a 9% renewable fuels or electricity, a measure that should ensure a 7% in GHG savings compared to 2020. For the production of second generation biofuels, the ENVI Committee deleted all feedstock that could have had a market displacement because of their use by industrial sectors. The most problematic parts of the opinion include the possibility to use entire trees, round wood and stumps for energy purpose and to open the possibility to count as renewable biofuels from industrial waste gases (ie synthetic methane produced by making the CO2 captured by stack emissions to react with hydrogen produced by electrolysis carried out using renewable energy). As far as the EED is concerned, the Commission proposal is to save 30% energy by 2030 at EU level without setting binding national targets. Even in this case, in the EP negotiations are undergoing, among others on whether to raise the targets at least to 40% and break them down at national level. On the other hand, it is very unlikely that the Council could introduce national binding targets, nor raising them, neither for RED II nor for EED, as, according to the EC, the current proposal comes from the early consultation with MSs whose large majority opposed both national binding targets and an higher ambition level. 5. What the overall picture means for climate change mitigation? Though the incipit of trilogues is “anything is agreed until everything is agreed”, the final outcome of the most important legislations for the EU climate-energy policies for 2030 is very likely to introduce more flexibilities and measures deemed necessary to ensure the economic growth of the Union and of its MSs and to protect industrial sectors. On the ETS side, the system has presented several limits in shaping a CO2 market price at levels such as to prompt investments to curb the emissions through innovative technologies since its entering into force in 2005. It is generally recognized that over allocation of emission allowances has led to a such a huge surplus that depressed the market. Still for the next trading phase more than 93% of the overall industrial emissions will be covered by free allowances to compensate the risk of carbon leakage. This means around 6 billion of allowances for the entire period worth some 150 billion euro with at a market price of 25 €/ton CO2, below the projected price of 30 €/ton. The percentage of free allowances is likely to be raised further by a 2,5-3,0 as final agreement among the Institutions to avoid the risk of triggering the CSCF. On the other hand, compensating measures like raising the linear reduction factors to 2,4% as soon as possible or the cancellation of 800 million allowances by 2021 as proposed by the Parliament have been already dismissed. It is worth to consider that with a LRF of 2,2% the reductions are barely enough to reach the -40% reduction by 2030 as set in the UE NDC, but well over what would be needed to smooth the way the EU midterm commitment of cutting from 80% to 95% the emission by 2050 compared to 1990 base year. To get those reduction levels, a LRF of 2,4% and 2,6% respectively would be needed since 2021
234
Further a more general reflection is worth on the meaning of the LRF. The general understanding is that a reduction in available allowances means a equal reduction of emission, but this might be true in theory (i.e. each allowance on the market comes for real emission reductions in another installation under the ETS), much less in a market full of free allowances and over allocation. An estimated 2,2 billion allowances could be available on the market for the 4th phase. The recently established Market Stability Reserve (MSR) will mitigate price fluctuation but could not be enough to allow the price to raise at expected levels. Furthermore, it is still not clear at which CO2 market price which technologies can be applied to which sector to cut emissions at source. Nor it is clear whether, should the market price reach a level triggering the introduction of breakthrough technologies, the industries are willing to pay huge upfront investment face to an highly fluctuating market. Should the market CO2 price fall as often occurred so far, such huge investment could result in financial disaster. Nor it is clear how the MSR could still ensure the required stability for investments once the market will be opened to other comparable systems in other countries as is about to happen with Switzerland and as invoked by the majority. As long as the ETS will act as a mere application of the “polluter pays” principle, the only way to mitigate industrial emissions is to use the revenues from the auctioning of allowances by MSs to cut emissions in other sectors. In fact, the European Environment Agency, estimated that the reduction observed in ETS covered sectors was mainly due to the contraction of the production followed by the economic crisis of 2008 (year of beginning of the second ETS phase) coupled with some reduction in energy power sector due to the increase in renewables and energy saving, along with minor reduction in non CO2 gas in the chemistry sector. As far as the ESR and LULUCF is concerned the final outcome is likely to add around 100 million emission credits to be distributed among certain MSs to cope for their emission reduction targets. Further, there is a clear risk represented by the Council proposal to compensate the reduction of emissions removal from managed forests l by reducing a corresponding amount of allocation credits under the ESR. This is particularly risky as managed forests may represent a crucial sink but demand for energy forest biomass may lead to their reduction worsening the scenario proposed by the EC according to which the overall sink will be reduced by the actual 370 million t/y to 250 million t/y by 2030 mostly because of the bioenergy demand. The provisions adopted by ENVI Committee allowing for the use of entire tress, roundwood and logs does give to much hope neither According to a recent report by the Öko-Institut, the EU must raise its 2030 emissions reduction target up to 55% if it is to stand a realistic chance of making its contribution towards limiting global warming to 2°C. This could be achieved by raising to at least 37% the renewables share in energy production and by cutting energy demand by at least 44% by 2030 compared to 2005. Oddly enough, in fact, while generally recognized as the most cost effective investment, energy efficiency is still not sufficiently pushed for. On the other hand, while renewables showed an incredible raise in term of power installation and production facilities and employment still the target seems to be very modest. Further the lack of binding national targets for both these Directives, and especially the disappearance for the promotion of renewables, would create less stable market condition that may lead to less private investment in the sectors slowing down the trend observed during last decade. It is worth to highlight once again that substitution of energy produced by fossil fuels through renewables and the energy saved are the most important mitigation actions, by far more incisive than the main pillar of EU mitigation policies. And still the risk is that energy saving and renewables could be sacrificed in the name of CO2 market, as an amendment from the EP to the ETS Directive might entail. Though an effort toward the right direction, all in all, European Institutions seem still reluctant to endorse urgent concrete measures as an urgent circumstance, like climate change undoubtedly is, should suggest. During the revision foreseen after each stocktake process under the IPCCC, there will be still some
235
room for improvement, but for the time being the legislation revision process promise timid approach well far away from a decisive a long term oriented vision. This vision should prevail if a serious attempt to keep the temperature increases below irreversible point (assuming the no return point has not reached yet) should be tried. There are still some risk factors that can further require to speed the process up. The first is the possibility, if not the probability, that the climate changes according to non linear pattern, the application of which give much worrisome result in terms of general impact and speed of changes. Furthermore, it still unclear whether we could reverse the ongoing and growing permafrost melting, beneath which lay some 1300-1600 billion tons of GHGs (mainly methane) the release of which could lead to dire consequences. The last time it happened, almost 12000 year ago, the atmospheric CO2 concentration rose from 190 to 270 ppm. In the meantime human activity caused the atmospheric CO2 concentration to be well stabilized over 400 ppm. That is why we not only need to urgently reduce the emissions but even start removing more GHGs than those emitted by enhancing sinks toward a “negative emission era”.
236
LIGNOCELLULOSIC BIOREFINERIES AS REPLACEMENT OF FOSSILS
Himadri Roy Ghatak
Abstract At present most of the energy needs of humankind as well as the functional organic chemicals used is derived from fossil fuels. This practice is unsustainable due to the non-renewable nature of fossils and the environmental degradation it causes. Among the various renewable energy alternatives, biomass can be uniquely suited to replace fossils in its dual role. In this context, lignocelluloses are important because of their abundance and lack of conflict with food related consumption. These are available from diverse sources such as wood, herbaceous plants, grasses, agricultural residues like different straws, and industrial wastes like bagasse, and saw mill waste. Their utilization in a biorefinery framework can produce a spectrum of marketable products and energy, thereby competing with petroleum refineries. Lignocelluloses can be processed in a biorefinery by thermochemical, chemical, and biochemical means to yield gaseous and liquid hydrocarbon fuels, bioethanol, and a variety of useful chemicals like furfural, vanillin, different polymers, and carbon products.
Keywords: Lignocelluloses, biorefinery, second generation biofuel, lignin
Himadri Roy Ghatak: Department of Chemical Engineering, Sant Longowal Institute of Engineering & Overview Since the advent of industrial revolution, the world energy landscape has been overshadowed by the exploitation and utilization of fossils – initially coal and then petroleum. There is well established technological framework for the processing of fossils, especially petroleum, and harnessing energy out of it which makes it the primary energy source of choice. Technoeconomic advantages notwithstanding, fossils have several drawbacks as energy feedstock. During its utilization lifecycle the fossils release enormous amounts of carbon dioxide thus abetting global warming and climate change. Being non-renewable in nature their long term availability is uncertain. Concern for sustainable development, therefore, made the humankind rethink and obliged it to course correction (Ghatak, 2011). The Plan of Implementation under the 2002 World Summit on Sustainable Development looks to “Promote a sustainable use of biomass” (WSSD, 2002).
One of the critical aspects of fossils based energy system that is often overlooked, is that it also provides the organic feedstock that sustains the modern way of living. Materials ubiquitous by their indispensable presence all around, like plastics and polymers, are derived from petroleum. If we were to replace fossils then the replacement should also be capable of providing organic chemicals that are currently sourced from petroleum (Ghatak, 2011; USDOE, 2010). Among all the renewable sources of energy biomass is the only one that can fit into this role. We should, therefore, go beyond the traditional utilization of biomass as a low grade energy source. Here lies the role of biorefineries which according to the International Energy Agency “is the sustainable processing of biomass into a spectrum of marketable products and energy” (IEA, 2009).
Lignocelluloses
Early biorefineries were based on starch or sugar containing biomass or oilseeds to primarily produce first generation biofuels – bioethanol and biodiesel (Ghatak, 2011). Major exponents in this category are corn in North America and China, sugarcane in Brazil and India, palm oil in Malaysia, and oilseed rape in Germany (Hoekman, 2009; Linoj Kumar et al., 2006). However, these establishments run into direct conflict with food production for natural resources and compromises social sustainability (Tye et al., 2016).
Lignocelluloses are biomass of vegetative origin having cellulose, and lignin as their main chemical constituents. Carbohydrates other than cellulose – different hexosans and pentosans – are also present. All gymnosperms and angiosperms have lignocellulosic biomass. Cellulose is the most abundant organic substance on earth followed by lignin (Tejado et al., 2007). In spite of similar elemental
237
composition as starch, the human digestive system cannot digest cellulose. Similarly, lignin is not fit for human consumption as food. Therefore, their utilization as biorefinery feedstock for harnessing energy value and industrial chemicals would not compromise food security. Typical composition of lignocelluloses is; cellulose: 40-55%, lignin: 15-25%, other carbohydrates: 20-30% (Ghatak, 2002). Except bamboo, most of the non- wood lignocellulosic biomass contains less lignin than wood. Besides dedicated plantations that could provide lignocelluloses as wood, herbaceous plants, and grasses, lignocellulosic biomass is also available as agricultural residues like different straws, and industrial wastes like bagasse, and saw mill waste. Black liquor from paper mills contain lignin as the main organic constituent (Gabrielle and Gagnaire, 2008; Stephen et al., 2010). Thermochemical processing of lignocelluloses Like any other biomass, lignocelluloses can be gasified under combined heat and power mode to generate heat, electricity, and liquid biofuels. Compared to other thermochemical methods gasification gives better conversion yields (Alauddin et al., 2010). Gasification temperature and the amount of oxygen are important parameters. Fast pyrolysis – heating rates of several thousands K/s – in 400-500 °C temperature range can yield biocrude with intermediate yields. In comparison, a liquid biocrude can be obtained by direct thermal liquefaction that can subsequently yield liquid biofuels. A part of the bio-oil produced in liquefaction is itself used as liquefaction solvent. High yields of biocrude are reported (Kumar et al., 2015). Hydrothermal liquefaction of lignocelluloses can also produce biocrudes. The advantage of hydrothermal liquefaction is the possibility of using wet biomass. Hydrodeoxygenation and catalytic cracking to improve its subsequent processing can upgrade Biocrudes. Black liquor gasification is a commercially established process that expand the scope of paper mill operation. The primary product of gasification process is the syngas containing carbon monoxide and hydrogen (Safari et al., 2015). Catalysts are used to breakdown tar molecules during gasification, thereby, improving the gas yield and ease of downstream gas cleaning (Devi et al., 2003; Li et al., 2015). Dolomite, quartz, alumina, as well as Ni, Co, and Rh/CeO2/SiO2 have been used as catalysts. Liquid hydrocarbons can be synthesized from syngas using Fischer– Tropsch Synthesis, which is an established technology. Co based catalysts are preferred over Fe based catalysts for higher hydrocarbon yield. Compared to direct liquefaction and fast pyrolysis the biocrude obtained by Fischer–Tropsch Synthesis is low in aromatics. Syngas can also be catalytically transformed into methanol. Off late research work has shown the possibility of biochemical conversion of syngas into second generation biofuels using acetogenic, hydrogenogenic and methanogenic organisms (Mohammadi et al., 2011).
Second generation biofuels from lignocelluloses
Sustainability and food security concerns of first generation biofuels has driven the research interest and policy incentive for second generation biofuels. The United States envisages the use of 60 billion litres of second-generation biofuel by 2022 (Eisentraut, 2010). Developing countries like China and India have ambitious forecasts. Besides providing energy security these biorefineries can give much needed fillip to rural economic development and inclusive growth. Most of the initial establishments are likely to based on crop residues. Here collection, transportation, and other logistics issues needs to be critically assessed. For the viability of a lignocellulosic biorefinery producing second generation biofuels uninterrupted supply of biomass raw material would be critical.
Acid hydrolysis of lignocelluloses depolymerises the carbohydrates into respective monomers. Under mild conditions cellulose remains largely unaltered while the degradation of other carbohydrates yield pentoses and hexoses as resulting monomers. One of them is xylose, a pentose, that can undergo acid catalyzed dehydration to produce furfural, an important industrial chemical. Under strong acidic condition cellulose degrades into the constituent monomer glucose. It can then be transformed into bioethanol, the so called second generation biofuel. The initial acid hydrolysis leaves behind lignin as a solid residue that can either be utilized as a biofuel or converted into value added chemicals. As an alternative, enzymes can be used to depolymerise cellulose and other
238
carbohydrates into their constituent monomers. However, lignocelluloses are generally difficult to biodegrade compared to starchy biomass (Van Dyk and Pletschke, 2012). Biotechnological interventions through genetic and metabolic modifications can improve the process efficiencies (Zhao et al. 2012).
Lignin value addition Lignin, left behind after hydrolysis, can be derivatized into several value added chemicals like aromatic aldehydes and ketones, aromatic hydrocarbons, biopolymers, and adhesives. The amount of lignin from a lignocellulosic second generation bioethanol plant will range from ~100,000 to 200,000 tons per year (Wyman, 2003). The main building blocks of the complex lignin structure are three phenylpropane derivatives namely p-coumaryl, coniferyl and sinapyl alcohols. Lignins vary in structure according to their method of isolation and their plant source. Lignins are heterogeneous in relation to the presence of functional groups and type of bonds between functional units (Goncalves and Benar, 2001). The most predominant functional group in lignin is the phenolic hydroxyl group. As a result, many of its reactive attributes arise from it.
Technical lignins have been used for partial replacement of phenol in phenol-formaldehyde adhesives or resins (Tejado et al., 2007). Crosslinking of lignin has also been attempted with other aldehydes like glyoxal, gluteraldehyde, and furfural to prepare adhesive resins. Lignin based epoxy resins are another example of its use in adhesive applications. Lignin can be used in polymer blends as a property modifier (Mishra et.al., 2007). Lignin blends with polyolefins like LLDPE, LDPE, HDPE, polystyrene, and polypropylene give exciting results in terms of property mix. Incorporation of lower amounts of lignin stabilize the material against photo and thermo oxidation. Yet others have investigated the composites of lignin with different synthetic polymers like polypropylene, poly(3-hydroxybutyrate), and PET. Lignin is a macromolecule, hence susceptible to depolymerisation. One way is to heat lignin at elevated temperature in the presence of alkali. Another method is oxidative depolymerisation and derivatization. Besides many other possible industrial uses it can allow lignin to be used as raw material for an array of low molecular weight aromatic substances, especially oxygenated aromatics. The commercially successful of these products is the flavour chemical vanillin (Ghatak, 2017).
Besides vanillin, miscellaneous organic substances, like simple and hydroxylated aromatics, quinones, aldehydes, aliphatic acids, etc., can be produced by oxidative degradation of lignin (Johnson et.al., 2005). An integrated process for oxidizing kraft lignin to produce vanillin and lignin based polyurethanes is reported (Da Silva et.al., 2009). Owing to its aromatic nature, lignin is able to give a large amount of char when heated at high temperature in an inert atmosphere. Activated carbons from non-fossil sources are important from environmental considerations. Owing to its high carbon content and char producing capability, lignin can be a starting material for preparing activated carbons with different microporous structures and specific surface areas (Carrott et.al., 2008). Among other carbon products lignin has been used for preparing carbon films with controlled pore size (Shen and Zhong, 2007), and carbon fibers (Johnson et.al., 2005).
Conclusion Inclusive utilization of biomass to harness both energy and functional organic materials is indispensable for shifting to a sustainable fossils free energy system. In this context lignocellosic biorefineries provide an attractive option as lignocelluloses are abundant and non- food biomass resource. In energy realm, they can provide second generation bioethanol, biocrudes, liquid hydrocarbons, and methanol. In addition important industrial chemicals like furfural, aromatic aldehydes and ketones, aromatic hydrocarbons, biopolymers, and adhesives can be synthesized in these biorefineries.
239
References Alauddin, Z.A.B.Z., Lahijani, P., Mohammadi, M., and Mohamed, A.R. (2010) “Gasification of lignocellulosic
biomass in fluidized beds for renewable energy development: A review”, Ren. Sust. En. Rev. 14(9): 2852-2862. Carrot, P.J.M., Suhas, Ribeiro Carrott, M.M.L., Guerrero, C.I. and Delgado, L.A. (2008) “Reactivity and porosity
development during pyrolysis and physical activation in CO2 or steam of kraft and hydrolytic lignins”, J. Anal. Appl. Pyrol. 82: 264-271.
Da Silva, E.A.B., Zabkowa, M., Araujo, J.D., Cateto, C.A., Barreiro, M.F., Belgacem, M.N. and Rodrigues, A.E. (2009) “An integrated process to produce vanillin and lignin-based polyurethanes from kraft lignin”, Chem. Engg. Res. Des. 87: 1276-1292.
Devi, L., Ptasinski, K., and Janssen, F. (2003) “A review of the primary measures for tar elimination in biomass gasification processes”, Biomass Bioenergy. 24: 125-140.
Dutta, A., Talmadge, M., Hensley, J., Worley, M., Dudgeon, D., Barton, D., Groenendijk, P., Ferrari, D., Stears, B., Searcy, E., Wright, C., and Hess, J.R. (2012) “Techno-economics for conversion of lignocellulosic biomass to ethanol by indirect gasification and mixed alcohol synthesis”, Environ. Prog. Sus. En. 31(2): 182-190.
Eisentraut, A. (2010) “Sustainable production of second-generation biofuels; potential and perspectives in major economies and developing countries”, International Energy Agency, Information Paper.
Gabrielle, B., and Gagnaire, N. (2008) “Life-cycle assessment of straw use in bio-ethanol production: a case study based on biophysical modelling”, Biomass Bioenergy 32:431–41.
Ghatak, H.R. (2002) “Paper making potential of Congress Grass: pulpability and fiber characteristics”, Tappi J. 1:24–7. Ghatak, H.R. (2011) “Biorefineries from the perspective of sustainability: Feedstocks, products, and processes”,
Ren. Sus. En. Rev. 15(1): 4042-4052. Ghatak, H.R. (2017) “Vanillin formation by electrooxidation of lignin on stainless steel anode: kinetics and
byproducts”, J. Wood Chem. Technol. In press, DOI: 10.1080/02773813.2017.1310899 Goncalves, A.R. and Benar, P. (2001) “Hydroxymethylation and oxidation of Organosolv lignins and utilization of the
products”, Bioresource Technol. 79: 103-111. Hoekman, S.K. (2009) “Biofuels in the U.S.– challenges and opportunities”, Ren. En. 34: 14– 22. International
Energy Agency Bioenergy Task 42 Biorefinery Brochure. Available from: http://www.biorefinery.nl/fileadmin/biorefinery/docs/Brochure_Totaal_definitief_HR_opt.pdf [accessed 15.09.10].
International Energy Outlook 2010. Energy Information Administration, USDOE. Available from: http://www.eia.doe.gov/oiaf/ieo/pdf/0484(2010).pdf [accessed 27.09.10].
Johnson, D.K., Bozell, J., Holladay, J.E. and White, J.F. (2005) “Use of lignin in the biorefinery”, International Lignin Institute 7th Forum Proceedings, Barcelona, pp. 31–34.
Kumar, S., Lange, J.P., Rossum, G.V., and Kersten, S.R.A. (2015) “Liquefaction of lignocellulose in fractionated light bio-oil: proof of concept and techno-economic assessment”, ACS Sust. Chem. Eng. 3(9): 2271-2280.
Li, D., Tamura, M., Nakagawa, Y., and Tomishige, K. (2015) “Metal catalysts for steam reforming of tar derived from the gasification of lignocellulosic biomass”, Bioresource Technology. 178: 53-64.
Linoj Kumar, N.V., Dhavala, P., Goswami, A., and Maithel, S. (2006) “Liquid biofuels in South Asia: resources and technologies”, Asian Biotechnol. Dev. Rev. 8: 31–49.
Mishra, S.B., Mishra, A.K., Kaushik, N.K. and Khan, M.A. (2007) “Study of performance properties of lignin-based polyblends with polyvinyl chloride”, J. Mat. Processing Technol. 183: 273-276.
Mohammadi, M., Najafpour, G.D., Younesi, H., Lahijani, P., Uzir, M.H., and Mohamed, A.R. (2011) “Bioconversion of synthesis gas to second generation biofuels: A review”, Re. Sust. En. Rev. 15(9): 4255-4273. Report of the World Summit on Sustainable Development. Available from: http://www.un.org/jsummit/html/documents/summit_docs/131302_wssd_report_reissued. pdf [accessed 31.08.10].
Safari, F., Tavasoli, A., Ataei, A. and Choi, J. (2015) “Hydrogen and syngas production from gasification of lignocellulosic biomass in supercritical water media”, Int. J. Rec. Org. Waste Agri. 4(2): 121-125.
Shen, Q. and Zhong, L. (2007) “Lignin-based carbon films and controllable pore size and properties”, Materials Science and Engineering. A 445-446: 731-735.
Stephen, J.D., Sokhansanj, S., Bi, X., Kloeck, T., Townley-Smith, L., and Stumborg, M.A. (2010) “Analysis of biomass feedstock availability and variability for the Peace River region of Alberta, Canada”, Biosystems Engineering. 105:103–11.
Tejado, A., Pena, C., Labidi, J., Echeverria, J.M., and Mondragon, I. (2007) “Physicochemical characterization of lignins from different sources for use in phenol–formaldehyde resin synthesis”, Bioresour. Technol. 98(8): 1655–1663.
240
Tye, Y.Y., Lee, K.T., Wan Abdullah, W.N., and Leh, C.P. (2016) “The world availability of non-wood lignocellulosic
biomass for the production of cellulosic ethanol and potential pretreatments for the enhancement of enzymatic saccharification”, Renewable and Sustainable Energy Reviews 60: 155-172.
Van Dyk, J.S. and Pletschke, B.I. (2012) “A review of lignocellulose bioconversion using enzymatic hydrolysis and synergistic cooperation between enzymes - Factors affecting enzymes, conversion and synergy”, Biotechnol. Adv. 30(6): 1458-1480.
Wyman, C.E. (2003) “Potential synergies and challenges in refining cellulosic biomass to fuels, chemicals, and power”, Biotechnol. Progr. 19: 254–262.
Zhao, X., Zi, L., Bai, F., Lin, H., Hao, X., Yue, G. and Ho, N.W.Y. (2012) “Bioethanol from Lignocellulosic Biomass”, Adv. Biochem. Engin. Biotechnol. 128: 25-51.
241
MANAGING THE LIBERALIZATION OF ITALY’S RETAIL ELECTRICITY MARKET: A POLICY PROPOSAL1 Carlo Stagnaro, Carlo Amenta, Giulia Di Croce and Luciano Lavecchia 1. Introduction Italy’s 2015 Annual Competition Law2 provides for phasing out electricity retail prices regulation by July 1st, 2019. Under the current regulatory framework, compliant with the EU regulations,3 all electricity customers are free to choose their preferred supplier. However, residential customer and small and medium enterprises (SMEs)4 retain a right “not to choose”, in which case they are supplied by the local distribution system operator (DSO)5 at a price set by the regulator. This (transitional) scheme, known as “maggior tutela” or “greater protection”, has been in place since July 1st, 2007 . Full liberalization of retail electricity markets is strongly advocated by the EU Commission, as an instrument to achieve both a greater integration among national markets and as a way to enable all consumers to fully participate in the energy transition (EC 2015a, 2015b). As of 2015, end-user price regulation was in force in 12 out of 28 EU member states6. Of these, 6 had already started a roadmap for its repeal7 Italy introduced retail electricity competition in 2007, but kept in place an ex-ante intervention in price-setting which shares many features of price regulation and may have an impact on competition itself (Acer 2016) (similar policies have been adopted in Belgium and Croatia, too). Retail electricity competition has been comparatively less studied than other features of the system, such as wholesale markets or regulated infrastructures. This is in part due to the relatively low level of harmonization in the way markets have been opened in the several EU countries or elsewhere, as well as in the underlying regulation. As a general statement, there is a relatively widespread consensus that larger customers can draw significant benefits from retail competition, whereas smaller customers, who face comparatively higher transaction and switching costs, may or may not gain from the power to choose. Potential market power may also play a significant role in determining whether retail competition is beneficial to small customers (Joskow 2008). All in all, the effect of retail competition is still an open question; for sure it largely depends on the underlying regulatory framework, market structure, and how the liberalization roadmap is designed. Building upon previous experience, Italy may provide an interesting case study on how to manage retail electricity market opening. This paper is structured as follows. Section 2 reviews the relevant literature. Section 3 first describes Italy’s existing price-setting mechanisms, and then moves on in performing a structure-conduct-performance analysis of the market. Customer engagement and (potential) market power are identified as the major challenges ahead. Section 4 proposed a roadmap for phasing out the regulated regime. Section 5 summarizes and concludes. 2. Review of the literature In principle, competition in product markets is expected to deliver lower prices, better quality and/or more innovation to customers. Removing regulatory barriers while introducing smart regulation to protect customers, especially vulnerable ones (the so-called “energy poor”), and promote competition may help to capture the benefits from liberalization (Nicoletti et al. 2000, Koske et al. 2015). ____________________________________________ 1 The views expressed in this work are those of the authors and do not involve the responsibility of the institutions to which they belong. 2 Law 124/2017. 3 Directive 2009/72/CE. 4 Defined as businesses with fewer than 50 employees and a turnover lower than 10 million euro. 5 131 active suppliers as of Dec. 31st, 2016 (AEEGSI, 2017a) 6 Bulgaria, Cyprus, Denmark, France, Hungary, Lithuania, Malta, Poland, Portugal, Romania, Slovakia and Spain. 7 Denmark, Lithuania, Poland, Portugal, Romania and Spain.
242
In order to evaluate the outcome of a liberalization effort at least two dimensions should be considered: its effects on prices and its effects on innovation. With regard to prices, no conclusive evidence has been reached so far. Earlier studies found little or no effect on prices in the liberalized markets (for a review, see Joskow 2008), or even an increase of prices for small customers. Newbery and Pollitt (1997) found large gains from liberalization but they argue that they were, by and large, captured by suppliers. More recent studies offer a more nuanced perspective. The ECME Consortium (2010) performed a comprehensive study on behalf of the EU Commission, finding that: a) the generating portfolio is the most important determinant of the price level for households, b) where competition is allowed large gains are available but c) most households fail to take full advantage of such opportunities. Such conclusion is confirmed by the British Competition and Markets Authority’s investigation on electricity retail markets (CMA 2016) and other studies (see for example Waddams and Zhu 2016). In Italy, Polo and Airoldi (2017) developed a model of the electricity market where consumers search for price and firms compete in prices: they found that a) the outcome of retail competition on prices strongly depends on the actual and perceived search costs and b) lifting the regulated prices may result in higher prices if participation is already high before the liberalization (a condition that, as we shall see, is not likely to be met in Italy). In the US, some studies found little impact of retail competition on prices for residential customers (see for example Su 2014), while others argue that competition is associated with lower prices (O’Connor 2017), with a greater effect on large customers (Ros 2015) and that competition drives down the markup of retail prices over wholesale cost (Swadley and Yücel 2011). Since the onset of liberalization, innovation was seen as a feature no less important than prices. Littlechild (2002) argued that competition in retail electricity markets works as a dynamic discovery process whereby not just prices, but also services, are chosen by customers. On one hand, the demand-side response in retail markets appears to be an effective means of dealing with demand- and price-spikes in wholesale markets, as several studies have found (Rassenti et al. 2002, Cooke 2011), especially under real-time pricing regimes (Borenstein and Holland 2005). Bundling electricity with other services has been found to be instrumental to increase the customers’ involvement in retail markets (Eakin and Faruqui 2000); Italy is no exception under this perspective (Stagnaro 2017). On the other hand, competition is more likely to incentivize innovation in the so-called “neck-and-neck industries”, i.e. industries where firms compete on the same technological level (Aghion et al. 2014). That seems to be the case of the electricity industry. However, the industry’s regulatory framework has been remarkably stable over time, contributing to a slow rate of innovation therein. The opening of retail markets was largely induced by changes in the technology, with particular regard to generating technologies, smart appliances, and electricity networks, which ultimately made previous regulatory arrangements outdated (Kiesling 2008). Most recent changes in the retail markets critically depend on three drivers: i) the growing share of small-scale generation technologies, such as rooftop solar panels and other renewables; ii) the diffusion of interconnected, smart appliances and energy efficiency technologies; iii) the evolution of distribution grids, which have increasingly grown as platforms that manage data, beyond moving electricity (Kiesling 2010, Kiesling and Munson 2017). The development of digital technologies and smart meters and appliances is likely to increase rewards from market participation (Chen and Liu 2016, Lavrijssen and Parra 2017). A third stream of literature explores the issue of why consumers appear comparatively less interested in potential savings or better services related to electricity than they are in other public services, such as telecommunications. The above-mentioned inquiry by the CMA (CMA 2016) argues that large potential gains go wasted because of the consumers’ failure to switch to a more convenient tariff; it also suggests that consumer inertia may lay the basis for unilateral market power to be exercised by local incumbents, insofar as it allows them to price-discriminate against the least active consumers. That might apply to the Italian market, too (Aeegsi 2017). Grubb (2015) argues that the customer’s failure to choose the best offer may be exacerbated by the supplier’s opportunistic behavior, and suggests that potential regulatory solutions may include “simplifying the choice environment, for instance by restricting price to be a scalar; advising consumers of their expected costs under each option; or choosing on behalf of consumers”. However, the CMA itself found that regulations to
243
simplify the choice environment did not contribute to improve the consumers’ ability to choose, while it may have resulted in adverse consequences making the most convenient offers no longer available. Moreover, Acer (2016) shows that regulatory limits to the freedom of choice and/or price regulations or standard (default) offers may lead to further disengagement. Von der Fehr and Hansen (2010) found similar results in Norway, showing that liberalization was successful in creating better opportunities for consumers, but at the same time only the most active customers captured the benefits, whereas it is not clear whether less active consumers had a real gain. CEER (2016) identified four main reasons for consumer inertia: insufficient (perceived) monetary gain, lack of trust, complex switching procedures, and loyalty to the previous supplier, the first three being the result of market disruptions. Crampes and Waddams (2017) suggest to “automate” the switching process, either through third-party intermediaries or forms of competition for the market, in order to capture the best of the two worlds of retail competition and price regulation. We will build upon their proposal later in this paper. 3. An analysis of Italy’s retail electricity market 3.1. Price-setting mechanisms Under the Italian law, all electricity customers have been free to choose their supplier since July 1st, 2007 (July 1st, 2004 for non-residential customers). Residential consumers who have not chosen – or do not want to choose – their supplier are supplied under a transitional scheme called “maggior tutela”. Under such regime: the commercial counterpart of consumers is the local DSO (the largest DSO being vertically
integrated with the former monopolist, serving about 86% of the customers who have a regulated contract);
the contractual features are standardized and set by the energy regulator (“Autorità per l’energia elettrica, il gas e il Sistema idrico”);
the price is set by the energy regulator, based upon the costs incurred by Acquirente Unico (“Single Buyer”) in the wholesale markets. The Single Buyer is in charge of procuring electricity, through a mix of spot and long-term contracts, in order to cover the demand from small customers who are served under the regulated regime;
in order to match the costs of competitors and not displace competition, the regulated price includes a tariff component, set by the regulator in a way that it is supposedly equal to the entry cost of an “efficient” new entrant (8.47% of the final price for an household consuming 2,700 kWh in Q4-2017).
The maggior tutela has been found to be compliant with the EU law as long as: i) the resulting prices are equivalent to market prices; ii) the scheme is transitional.8 Even though Italy’s electricity regulated regime falls in a sort of grey zone between traditional price regulation and the free market, it substantially shares many features of price-regulation. In fact, Italy’s energy regulator itself qualifies it as a form of price-control (Aeegsi 2017b, p.4), whereas ACER (2016, p.48) calls it a “price-setting intervention”. As such, it may still distort the market in several ways, including (but not limited to) working as a focal point9 for competitors in the free market and generating a “feel-safe effect” whereby customers feel like as they were more protected under the regulated regime than under the free market (ACER 2015, 2016). Its name – maggior tutela – further discourages switching suppliers, nudging customers away from the free market. Behavioral economics has shown how important setting the default option is in _________________________________ 8 See infringement procedures no. 2006/2057 and the Judgement of the EU Court of Justice no.C-265/08. 9 To this extent, it is remarkable that many offers in the free market are priced at a discount with respect to the price in the regulated regime.
244
shaping economic agents’ actual behavior (Thaler and Sunstein 2003): when faced with the widespread evidence that small customers of electricity have a tendency towards inertia, Italy’s retail market design seems likely to make them even less, and not more, active. Not surprisingly, about two-thirds of residential customers and half of SMEs are still supplied under the regulated regime, even though the share of consumers supplied under the free market has been steadily growing since 2007. There is evidence that more energy-intensive customers tend to switch to a tariff under the free market (AEEGSI 2017a). 3.2. Structure-Conduct-Performance 3.2.1. The analytical framework In order to make an assessment of the progress of retail electricity market opening in the EU member states, the Agency for the Cooperation of Energy Regulators (ACER) asked the consultancy firm IPA to develop a synthetic indicator named Acer Retail Competition Index, or Arci (IPA 2015). The underlying analysis follows the structure-conduct-performance paradigm (SCP) (Bain 1968), which is frequently used in antitrust analysis (Weiss 1979, Hovenkamp 1985), including the electricity sector (Weiss 2006). In fact, this paradigm has been strongly criticized for not being able to capture the long-term contribution of technological progress to competition and, more generally, for the assumption that market structure determines the agents’ behavior which, in turns, results in the market performance, whereas the conduct may in fact retroact on market structure (Stigler 1983, Schmalensee 1989). Despite its shortcomings, SCP may be applied – and conveys useful information – when i) the focus is largely on short-term developments of a market (such as the period until 2019 in Italy) and ii) market structure is a dominant issue as compared to conduct, as is the case with market opening processes whereby the starting point resembles a form of monopolistic or quasi-monopolistic competition. Hence, we will follow IPA (2015) and employ the SCP approach to assess the situation of Italy’s retail electricity market on the hedge of liberalization. To begin with, we present the results of IPA’s Acer Retail Competition Index (IPA 2015), which ranks the EU member states according to how effective retail competition is. In Figure 1, the score of each country is broken down into its components.
Figure 1. Acer Retail Competition Index scores. Source: IPA (2015)
As it is evident from the chart, Italy performs relatively well in the overall indicator, ranking as the 5th most open retail electricity market among the surveyed countries (EU member states plus Norway).
245
IPA analysis takes into consideration the following variables: CR3 (i.e. the joint market shares of the three largest suppliers); number of nationwide suppliers; annual entry-exit; switching activity (i.e. how active the active customers are); share of non-switchers (i.e. how large is the group of disengaged customers); ability to compare price easily; number of offers per supplier; price dispersion; customer satisfaction (measured through surveys on whether markets meet the customers’ expectations); average mark-up of suppliers (Table 1). As we shall see, more detailed information confirms that Italy performs well in general, but competition may be hindered because of high concentration rates and relatively low switching activity.
Structure Conduct Performance Concentration: CR3 Number of suppliers Barriers: Price comparability
Entry/Exit activity: Annual entry/exit rates Switching: Annual switching rates (tariff and supplier) % of non-switcher Innovation: Number of offers per supplier
Prices: Price dispersion Quality: Does the market meet expectations? Costs and margins: Average annual markup
Table 1. Components of IPA’s Acer Retail Competition Index
The source for the data in the discussion below, unless otherwise specified, is Italy’s energy regulator (Aeegsi 2017a, 2017b, 2017c). 3.2.2. Structure Most residential customers (out of a total of 29.9 million in 2016) in Italy are supplied under the regulated regime (65.6% in 2016, down from 80% in 2012). Of these, about 86% are supplied by the largest operator (Enel). In the free market, the same operator claims a market share of about 50%. Overall, in 2016 the incumbent supplied 41.717 GWh to residential customers, vis-a-vis a total demand of 57.113 GWh (73%). The second largest operator, Eni supplied 3.146 GWh (5.5%), and the third one, Edison, 2.017 GWh (3.5%). Hence, the joint market share of the three largest operators (CR3) in the retail electricity market is as high as 82%. The Herfindahl-Hirschman Index (HHI) is around 2.800 if only the free market is considered, but it increases up to about 5.600 if the regulated regime is included, indicating an highly concentrated market. The situation is not significantly different if concentration indexes are computed with regard to the number of customers rather than to the volumes of traded electricity. Since the maggior tutela works as a default option for those who have not switched, it can be argued that market concentration is not a bug of market functioning, but a feature of market design. On the upside, the number of active suppliers is very high and their average size is growing. In 2016, 402 suppliers were active in the retail market (although many of them only trade with non-domestic customers). No public information is available on the size of operators in 2016, but in 2015 29% were active in at least 16 regions while 19% were active in one region only. As far as price comparability is concerned, the EU’s Consumer Market Scoreboard – which mixes perception indicators with hard data on complaints and problems – suggests that the ability of the Italian customers to compare alternative offers is slightly below the EU average, but the situation has been consistently improving over time (EC 2016) (Table 2).
246
Italy’s Score 2015 Difference w/ 2013 Difference w/ EU avg
Comparability (avg) 6.2 +0.6 -0.5
Trust (avg) 6.1 +1.1 -0.6
Problems (%) 13.4 -1.1 +2.5
Complaints (%) 80.2 -7.3 -2.4
Expectations (avg) 7.6 +0.8 -0.1
Electricity (overall score) 71.8 +6.4 -3.5
Table 2. Results from the Consumer Market Scoreboard for electricity. Source: elaboration on DG Just data. Note: Comparability = average score from consumer survey on price comparability (min: 1; max:10); Trust: average score from consumer survey on trust in the suppliers’ commercial behavior (1-10); Problems = % of consumers who had at least one problem in the previous year; Complaints = % of consumers who filed at least one complaint in the previous year; Expectations = average score from consumer survey on whether the service met expectations (1-10). 3.2.3. Conduct As shown from the high number of active suppliers and their steep increase year-on-year, entry barriers are relatively low in Italy and new entrants seem to believe there is headroom to compete either on prices or on the quality of the service with the incumbents. On the demand side, the situation is more puzzling. On one hand, switching rates are higher than the EU average, but below the levels of the most dynamic markets. In 2015, 13.2% of domestic customers in Italy changed tariff or supplier; more specifically, 6.1% switched supplier (from and to the free market), 2.7% chose another tariff keeping the same supplier, 3.6% left the regulated regime and 0.7% switched back to the regulated regime. In 2016, 8.7% of households switched supplier (while the information about changes of tariff within the same supplier is not publicly available at the time of writing). It follows that, while customers who are already in the free market tend to be relatively active, a large majority of customers – especially those under the regulated regime – tend to remain relatively inert. The share of non-switcher is around 90%, and gradually decreasing over time. 3.2.4. Performance In order to evaluate the market performance, IPA (2015) takes into consideration price dispersion, the gap between expectations and actual service, and the dynamics of the average markup. We will not touch upon expectations because we already mentioned them in the context of the discussion on the quality of the service in Section 3.2.2. To begin with, price dispersion should be viewed with a bit of caution and not necessarily as a sign of market failure. A high price dispersion might either suggest that competing supplier are striving to differentiate the product (in which case it is a sign of innovation) or that suppliers are effective in price-discriminating against the least active consumers (in which case it may imply an exercise of market power). Electricity has some features of a commodity, hence one would expect that the more effective competition is, the more prices converge towards marginal costs (Bertrand competition). At the same time, electricity retailers are devoting time and effort to differentiate their products by moving their value propositions away from the commodity, and towards a more sophisticated service. In 2015, the expected annual expenditure on electricity for a representative household10 was estimated by the regulator in the range between 457.6-554.6 euro for variable price offers and 462.8-623.7 euro for fixed price offers. __________________________________ 10 Defined by Italy’s energy regulator as an household with a 3 kW connected load and an annual consumption of 2,700 kWh
247
This is equivalent to almost 2% of household total expenditure on average, whereas heating expenditure is almost 3%. (Figure 2). The Trova Offerte – a price-comparison website set up by the regulator, to which suppliers may voluntarily submit their offers – had on average 40 available offers in the capital city, up from 32 in 2014.
Figure 2. Percentage of the average income spent on electricity and heating. Source: Faiella and Lavecchia (2017).
IPA (2015) estimates the mark-up as the difference between retail and wholesale prices and finds it in Italy to be in line with the EU average. Figures 3 and 4 show a different estimate, which uses the difference among retail prices for households and large industrial customers as a proxy for the markups. Intuitively, large industrial customers have more bargaining power and can take better advantage of liberalization than small consumers (Joskow 2008). Under this metric, Italy seems to have an average markup in the second half of 2016 which is relatively low as compared with other EU member states (Figure 3) (in reading Figure 3, one should take into consideration that some countries with very low mark-ups do regulate prices for residential customers below costs11 or very close to them). Figure 4 shows that average mark-ups in Italy tended to slightly increase in 2007-2016: that may be due either to market power or to the changing nature of the electricity service which is increasingly bundled with additional components (while that is unlikely to be the case for large industrial customers) (see also Acer 2016 on this).
_______________________________________
11 That was the case, in particular, for Latvia, Romania and Lithuania. See Acer (2016).
248
Figure 3. Difference between retail prices for residential customers (1,000 kWh < consumption < 2,500 kWh) and large industrial customers (20,000 MWh < consumption < 70,000 MWh) in 2016S2. Source: elaboration on Eurostat data
Figure 4. Difference between retail prices for residential customers (1,000 kWh < consumption < 2,500 kWh) and large industrial customers (20,000 MWh < consumption < 70,000 MWh) in Italy in 2008-2016. Source: elaboration on Eurostat data.
3.2.5. Summary The largest issue by far is market concentration. From this point of view, the market is distinctly divided into two segments. On one hand, the “free market” – where customers have switched at least once – is relatively concentrated but consumers seem on average able and willing to take advantage of the opportunity to choose their preferred tariffs, although prices appear sometimes higher than they might be. Hence, more detailed monitoring is needed in order to understand whether this phenomenon is due to customers consciously choosing higher value-added offers, or to the suppliers’ ability to charge too high prices. On the other hand, a large majority of residential customers are still supplied under the regulated regime, which is, by design, supplied by vertically integrated incumbents. The largest operator has a market share of 86% in the regulated market, which translates into an overall market share of 73%. This makes the incumbent potentially able to exercise market power, especially in such a delicate moment as the transition towards full liberalization. High market concentration is not, prima facie, the
249
result of market abuses, but derives from regulatory choices that were made at the time of initial market opening, and that have not been properly addressed in the past decade. Hence, a regulatory solution should be developed. On top of this, vulnerable customers deserve special protection. In the following section we will focus on the supply side, hence we will not deal directly with demand engagement, except to the extent that promoting demand engagement is instrumental to achieve lower market concentrations in the short run. Finally, we will discuss the issue of energy poverty, on which a rich flow of literature is developing (see, for example, Amenta and Lavecchia, 2017, Faiella and Lavecchia 2015, Faiella et al. 2017, Miniaci et al. 2014), providing an analysis and a proposal. 4. A policy proposal to achieve full liberalization 4.1. How to address the market concentration… In this section, we propose a roadmap to phase out the regulated tariff in Italy, while addressing the potential sources of market power and frictions to the consumers’ detriment. As we have showed, there are issues both on the demand- and the supply-side, namely customer inertia and market concentration, respectively. As far as the former is concerned, policies may be developed that rely on the expected behavioral responses to the way information is provided or default options are set; on price transparency and comparability; and on creating a framework to make more easily accessible to competitors the information about disengaged customers. Several such proposals are included in the CMA report on the British market (CMA 2016); we have detailed a few of them in Amenta et al. (2017). In this paper we will focus on market concentration. Our proposal leverages the lessons learned from the previous experiences while building on the Italian own experience. In particular, the liberalization process of the wholesale electricity market was successful because, since the onset of the reform, the incumbent was required to release generation capacity. By the same token, in the natural gas market – where the concentration bottleneck was higher in the supply chain – the incumbent was repeatedly obliged to release either volumes of natural gas or transit capacity, as well as to stick to an antitrust ceiling on natural gas imports (Beccarello and Piron 2008). This kind of asymmetric regulation, whereby the incumbent is put under specific constraints that do not apply to competitors, has been often used in several sectors and proved to be successful (Abel and Clements 2001, Baranes and Vuong 2011). While useful, asymmetric regulation may not be enough: in fact, it might be helpful to reduce the market share of the largest operator, but it would appear like a top-down approach that leaves little room to exploit the customer’s freedom of choice – which, after all, is the whole point of liberalization. At the same time, the incumbent might formally stick to the market share ceilings, while cherry-picking its customer basis and keeping the most valuable ones (cream skimming). Therefore, our policy proposal relies on three pillars. The first pillar is graduality: it took time for the market to develop and it will take time for both customers and suppliers to learn the rules of the game. The second pillar is about asymmetric regulation. We propose to define a three-year transitional period during which: i) customers formerly supplied under the regulated regime are still supplied by the incumbent under a standardized contract, whereby price variations should be approved by the regulator, in order to mimic the functioning of the regulated regime; ii) during this period, an antitrust ceiling is introduced, which is decreasing over time (for example, the national incumbent should reduce its market share below 60% by the end of the first year, below 50% by the end of the second year, and below 40% by the end of the third year); iii) if the incumbent’s market share exceeds the ceiling, a divestiture procedure will take place which is described under the second pillar. The third pillar mixes a top-down and a bottom-up approach. We take into account that the reason why the market is highly concentrated in Italy is that: i) those who do not choose a supplier are supplied under a regulated tariff by local DSO; ii) we have no information about how many customers fail to switch because they do not know or do not realize switching is convenient, as opposed to how many are just happy with their supplier. While the former ones are properly inactive customers, the latter can be regarded as customers who actively “choose not to choose”. The reason why it is not
250
possible to discriminate truly inactive customers from “active inactivity” lies in the way the default option is defined. Our proposal is then to turn inactivity into a feature that goes to advantage, and not to the detriment of, the customer by changing the default option, a behavioral approach already successfully applied other areas such as saving plans (Nobel 2017). In doing so, we follow the proposal set out by Crampes and Waddams (2017) of organizing an opt-out collective switching. We also take advantage of the municipal aggregation scheme adopted in Ohio (Littlechild 2008). One key feature of the proposal is the understanding that customers behavior is often led by what is set as the default option (Thaler and Sunstein 2003). If the policy goal is to incentivize consumers to switch to the best offer, then it may make sense to make switching the default option while leaving customers free to stay with their original supplier, revealing their preferences.Assume, for example, that by the end of the first year of the transitional period, the incumbent still holds a 65% market share, vis-a-vis a 60% antitrust ceiling. If that happens, the energy regulator and the competition authority will set up a collective switching procedure that involves about 5% of the customer basis, chosen among those who were initially supplied under the regulated regime (and who are supplied under a standardized contract at this point in time). Such customers would be given a right to opt out. The new supplier would be identified through one or more auctions, which are intended to select the supplier(s) able to offer the best deal (more info on the auction process below). By doing this, those customers who are happy with the incumbent are likely to opt out and reveal their preferences; others would just be supplied by a competitor under a more convenient tariff. The information accrued by this process will be used for fine tuning the following auctions. Finally, by the end of the third year (which coincides with the end of the transitional period), antitrust ceilings would expire. However, it is likely that some customers are still supplied by the incumbent (as well as by other smaller vertically integrated companies) not out of choice, but merely out of inactiveness. In order to give these customers a chance to take advantage from liberalization, a final collective switching will take place, that involves all those customers who were moved from the regulated regime to the standard contract, and who did never choose a different supplier or tariff. Again, an opt-out clause will be introduced in order to allow those who are happy with the historical supplier to actively show their preference vis-a-vis the opportunity of saving money off their electricity bill or getting a better service. Figure 4 shows a potential evolution of market shares over time, under a set of conservative assumptions regarding the degree of customer engagement.
Figure 4. Potential evolution of market shares under the proposed mechanism
251
4.2. …and the auction design… How should auctions be designed? While several options are available, the simplest one is the following. Suppliers would make a commitment to charge a spot-based price for at least one year. They would bid for an overhead to pay for their costs, and the most convenient offer would be submitted to customer groups within the collective switching scheme. As the contract expires, consumers would either switch tariff or supplier or become a client of the same supplier under a standardized contract. 4.3… while ensuring the right protection to vulnerable customers The alleged rationale behind the regulated regime is to ensure an adequate protection for vulnerable consumers. However, despite the decade-long effort to tackle energy poverty, there is evidence that the existing instruments, including the regulated regime, are not effective (Faiella and Lavecchia, 2017) in protecting the 2 million energy poor households (Amenta and Lavecchia, 2017; Faiella et al. 2017). A new approach is required and under way; in the 2017 National Energy Strategy, the Italian Government called for a comprehensive strategy to tackle energy poverty based on: 1) the adoption of an official definition and a national measure; 2) a thorough review of the existing policies; 3) the creation of an Italian Energy Poverty Observatory (IPOV) which will work in coordination with the European Energy Poverty Observatory (EPOV). Moreover, a new conditional cash transfer program, the Bonus Energia, could be put in place, with the following characteristics: 1. one program, substituting all the existing measures; 2. unique eligibility condition, based on the equivalized household income and wealth (ISEE); 3. the value depends on the climatic zone and on the ISEE (with a cut-off after a chosen threshold); 4. the maximum value should cover up to one quarter of energy expenditure for a household of 4
people, covering, ideally, winter heating or summer cooling costs. Therefore, the full liberalization of the retail market and an enhanced (and more targeted) protection of vulnerable consumers are complementary processes which should be carried on jointly. More details on this proposal are available in Amenta et al. (2017) 5. Conclusion Retail competition in electricity may deliver significant benefits to consumers, which may grow even bigger as technology develops. The ability of customers to reap the benefits – in the form of lower tariffs and/or innovative products – depends critically on the effective competition between suppliers and active engagement on the demand side. The former, in turn, relies on sound market design and structure. This paper focuses on the phase-out of regulated tariffs in Italy, which is due by July 1st, 2019. Customers have been free to choose since July 1st, 2007, but the “free market” option has coexisted ever since with a “transitional” regulated tariff – the maggior tutela – that still covers a large majority of the customers. Since the maggior tutela is supplied by vertically integrated incumbents, the market is extremely concentrated by design. As a consequence, in pursuing full liberalization, market concentration is a major issue. Another issue that needs to be addressed is customer engagement: while a minority of customers appear very active in the market, many others are not, especially those who have never switched supplier since 2007, who may even not know that they have a right to choose a different tariff. In this paper, we have performed a structure-conduct-performance analysis of the Italian market, that is pretty much consistent with our prior: most problems lie with market concentration and insufficient customer engagement. Other indicators – such as entry/exit activity, price dispersion, customer satisfaction, service quality, etc. – have been consistently improving over time. Therefore we propose a scheme that would simultaneously result in lower concentration, turning consumer inertia into a feature that translates into lower tariffs, rather than higher market power. Our proposal combines decreasing, transitional antitrust ceilings – that would reduce the incumbent’s market share from the
252
current 73% down to 40% over a three-year period – with a repeated collective switching exercise, under which customers would be left free to opt-out. As a result, disengaged customers would be automatically moved to a more convenient tariff, whereas those who make an explicit choice of not switching would remain with their current supplier. In a nutshell, the basic idea is that of turning the default option from “stay with the incumbent” to “switch”. Our proposal does not cover other relevant issues, including (but not limited to) customer engagement, information campaigns and promoting price comparison websites. More research is needed on these issues and many details should be explored in more depth. However, this proposal may serve as a starting point to design a feasible transition that puts customer empowerment at its core. References Abel, J. and M. Clements (2001), “Entry under Asymmetric Regulation”, Review of Industrial Organization,
vol.19, no.2, pp. 227-242. ACER (2014), “Annual Report on the Results of Monitoring the Internal Electricity and Natural Gas Markets in
2013”. ACER (2015), “Annual Report on the Results of Monitoring the Internal Electricity and Natural Gas Markets in
2014”. ACER (2016), “Acer Market Monitoring Report 2015 – Electricity and Gas Retail Markets”, November 2016. ACER (2017), “Public data underlying the figures of Annual Report on the Results of Monitoring the Internal
Electricity and Natural Gas Markets in 2015”, January 2017. AEEGSI (2017a), “Relazione annuale sullo stato dei servizi e sull’attività svolta”, 31 March 2017. AEEGSI (2017b), “Offerte a Prezzo libero a condizioni equiparate di tutela e opzioni minime per il mercato
libero”, Dco 204/2017/R/com. AEEGSI (2017c), “Monitoraggio retail. Aggiornamento del rapporto per gli anni 2014 e 2015”, Rapporto
168/2017/I/com. Aghion, P., S. Bechtold, L. Cassar and H. Herz (2014), “The Causal Effect of Competition on Innovation:
Experimental Evidence”, NBER Working Paper, no.19987. Amenta, C. and L. Lavecchia (2017), “La povertà energetica delle famiglie italiane”, Energia, no.2/2017. Amenta, C., G. Di Croce, L. Lavecchia and C. Stagnaro (2017), “La liberalizzazione del mercato elettrico - Una
proposta per superare la maggior tutela”, Annali dell’Università degli Studi di Palermo, novembre 2017. Bain, J.S. (1968), Industrial Organization, New York: Wiley. Baranes, E. and H.C. Vuong (2011), “Ex-Ante Asymmetric Regulation and Retail Market Competition: Evidence
from Europe’s Mobile Industry”, Technology and Investment, vol.2, no.4, pp. 301-310. Beccarello, M. and F. Piron (2008), La regolazione del mercato del gas natural, Soveria Mannelli (CZ):
Rubbettino. Borenstein, S. and S. Holland (2005), “On the Efficiency of Competitive Markets with Time-Invariant Retail
Prices”, Rand Journal of Economics, vol.36, no.3, pp.469-493. CEER (2016), “CEER Report on commercial barriers to switching in EU retail energy markets”, C15-CEM-80-04,
7 June 2016. Chen, S. and C.-C. Liu (2016), “From demand response to transactive energy: state of the art”, Journal of Modern
Power Systems and Clean Energy, vol.5, no.1, pp.10-19. Cooke, D. (2011), “Empowering Customer Choice in Electricity Markets”, IEA Information Paper. Crampes, C. and C. Waddams (2017), “Empowering electricity consumers in retail and wholesale markets”,
Centre on Regulation in Europe. Eakin, K. and A. Faruqui (2000), “Bundling Value-Added and Commodity Services in Retail Electricity Markets”,
The Electricity Journal, vol.13, no.10, pp.60-68. CMA (2016), “Energy Market Investigation: Final Report”. Deller, D., M. Giulietti, J.Y. Jeon, G. Loomes, A. Moniche and C. Waddams (2014), “Who Switched at the Big
Switch and Why', a report for Which?, the UK's consumer association. EC (2015a), “Delivering a New Deal for Energy Consumers”, COM(2015) 339. EC (2015b), “Best practices on Renewable Energy Self-consumption”, SWD(2015) 141. EC (2016), “Consumer Market Scoreboard. 2016 Edition”. ECME CONSORTIUM (2010), “The functioning of retail electricity markets for consumers in the European
Union. Final Report”, EAHC/FWC/2009 86 01, November 2010. Faiella, I. and L. Lavecchia (2017), “Energy poverty in Italy”, Fuel poverty network blog, July 8th 2017. Faiella, I., L. Lavecchia L. and M. Borgarello (2017), “Una nuova misura della povertà energetica”, Banca
d’Italia, Occasional Paper, n.404. Grubb, M.D. (2015), “Failing to Choose the Best Price: Theory, Evidence, and Policy”, Review of Industrial
Organization, vol.47, no.3, pp.303-340.
253
Hovenkamp, H. (1985), “Antitrust Policy after Chicago”, Michigan Law Review, vol.84, no.2, pp.213-285. IPA (2015), “Ranking the Competitiveness of Retail Electricity and Gas Markets: A proposed methodology”,
Report to Acer, 4 September 2015. Knieps, G. (2006), “Sector-Specific Market Power Regulation versus General Competition Law: Criteria for
Judging Competitive versus Regulated Markets”, in F.P. Sioshansi e W. Pfaffenberger (a cura di), Electricity Market Reform: An International Perspective, Amsterdam: Elsevier, pp.49-74.
Joskow, P.L. (2008), “Lessons Learned From Electricity Market Liberalization”, The Energy Journal, Special Issue. The Future of Electricity: Papers in Honor of David Newbery, pp.9-42.
Kiesling, L.L. (2008), Deregulation, Innovation and Market Liberalization: Electricity Restructuring in a Constantly Evolving Environment, London: Routledge.
Kiesling, L.L. (2010), “Promoting Innovation in the Electricity Industry”, Economic Affairs, vol.30, no.2, pp.6-12. Kiesling, L.L. and D. Munson (2017), “A Revolution in Power: Where We’ve Come from, Where We’re Headed”,
Electricity Policy. Koske, I., I. Wanner, R. Bitetti and O. Barbiero (2015), “The 2013 update of the OECD product market regulation
indicators: policy insights for OECD and non-OECD countries”, OECD Economics Department Working Papers, no.1200.
Lavrijssen, S. and A.C. Parra (2017), “Radical Prosumer Innovations in the Electricity Sector and the Impact on Prosumer Regulation”, Sustainability, vol.9, no.7.
Littlechild, S. (2008), “Municipal aggregation and retail competition in the Ohio energy sector”, Journal of Regulatory Economics, vol.34, no.2, pp.164-194.
Littlechild, S.C. (2002), “Competition in Retail Electricity Supply”, Journal des Économistes et des Études Humaines, vol.12, no.2.
Newbery, D. and M. Pollitt (1997), “The Restructuring and Privatization of Britain’s CEGB – Was It Worth It?”, Journal of Industrial Economics, vol.45, no.3, pp.269-303.
NOBEL (2017), “Richard H. Thaler: integrating economics with psychology”, Scientific Background on the Sveriges Riksbank Prize in Economic Sciences in Memory of Alfred Nobel 2017.
O’Connor, P.R. (2017), “Restructuring Recharged. The Superior Performance of Competitive Electricity Markets 2008-2016”, RESA, April 2017.
Polo, M. and A. Airoldi (2017), “Opening the Retail Electricity Markets: Puzzles, Drawbacks and Policy Options”, IEFE Working Paper, no.97.
Rassenti, S.J., V.J. Smith and B.J. Wilson (2002), “Using Experiments to Inform the Privatization/Deregulation Movement in Electricity”, Cato Journal, vol.21, no.3, pp.515-544.
Ros, A.J. (2015), “An Econometric Assessment of Electricity Demand in the United States Using Panel Data and the Impact of Retail Competition on Prices”, Nera Economic Consulting, 9 June 2015.
Schmalensee, R. (1989), “Inter-industries studies of structure and performance”, in R. Schmalensee e R. Willig (a cura di), Handbook of Industrial Organization, Amsterdam: North-Holland, pp.951-1009.
Stagnaro, C. (2017), “Competition and Innovation in Retail Electricity Markets: Evidence from Italy”, Economic Affairs, vol.37, no.1, pp.85-101.
Stigler, G. (1983), The Organization of Industry, Chicago: Chicago University Press. Su, X. (2015), “Have Customers Benefited from Electricity Retail Competition?”, Journal of Regulatory
Economics, vol.47, no.2, pp.146-182. Swadley, A. and M. Yücel (2011), “Did residential electricity rates fell after retail competition? A dynamic panel
analysis”, Energy Policy, vol.39, no.12, pp.7702-7711. Thaler, R.H. and C.R. Sunstein (2003), “Libertarian Paternalism”, The American Economic Review, vol.93, no.2,
pp.175-179. Von Der Fehr, N.-H. and P.V. Hansen (2010), “Electricity Retailing in Norway”, The Energy Journal, vol.31,
no.1, pp.25-46. Waddams, C. And M. Zhu (2016), “Empirical evidence of consumer response in regulated markets”, Journal of
Competition Law & Economics, vol.12, no.1, pp.113-149. Weiss, L.W. (1979), “The Structure-Conduct-Performance Paradigm and Antitrust”, The University of
Pennsylvania Law Review, vol.127, no.4, pp.1104-1140.
254
CONSIDERING HYDROGEN FUEL CELLS POWERTRAIN AS POWER GENERATION PLANT - 2017 REVIEW Mario Valentino Romeri Overview Worldwide Hydrogen energy vector and Fuel Cells technologies seem to be a Cinderella low-carbon solution in the current energy and transport debate. But in the coming years, hydrogen and fuel cells have the potential to be a disruptive low-carbon solution. The electricity produced by a Hydrogen Fuel Cell can be used both for stationary and transport application and the traditional model to link transport to energy sector is the Vehicle-to-Grid (V2G) approach. I think that it is time to consider the link between the transport sector and the energy sector not only in a V2G approach but in another perspective, more direct, relevant and disruptive. In fact the Hydrogen Fuel Cell Powertrain (H2FCPowertrain) or, in other words, the propulsion system of a Fuel Cell Vehicle (FCV), is a small power generation plant (typically the H2FCPowertrain size is around 100 kW). In the coming years the high volume associated with the possible FCVs mass production will permit to reduce dramatically the FC system manufacturing costs, in order to be competitive with gasoline in hybrid-electric vehicles. In a mass production perspective, H2FCPowertrain will be so cost competitive to be useful adopted also for stationary power generation application, also in LCOE perspective. 2017 Review It is longtime that I underlined the possible relevant implication of Hydrogen and Fuel Cell use in stationary and transport applications and, in recent years I presented different works in which I argued that it’s time to consider FCV as a relevant possible solution in energy debate. From 2010 I wrote, presented and published different studies where I compared the H2FCPowertrain LCOE, based on the U.S. Department of Energy (DOE) public data, with the traditional power generation technologies LCOE with very promising results, in the U.S. context and in many other contexts around the world. In this 2017 review, for the H2 production costs, I used also the International Energy Agency (IEA) data. 1. General Consideration 1.1 Investment Costs in Energy Sector Investment costs are probably the most important element in any investment decision. They vary greatly from technology to technology, from time to time and from country to country. Overnight cost is a common unit of measure of power investments. Overnight cost is the cost of a construction project if no interest was incurred during construction, as if the project was completed “overnight.” The unit of measure typically used for Overnight cost is USD/kW. The Levelized Costs of Generating Electricity (LCOE) is often cited as a handy tool for the analysis of generation costs and to compare the unit costs and the overall competiveness of different generating technologies. Focus of estimated average LCOE is the entire operating life of the power plants for a given technology. In LCOE model, different cost components are taken into account: capital costs, fuel costs, operations and maintenance costs (O&M), decommissioning costs. The resultant LCOE values, one for each generation option, are the main driver for choice technology. The unit of measure typically used for LCOE is USD/MWh.
255
1.2 Fuel Cells Fuel Cell is a device that uses a fuel and oxygen to create electricity by an electrochemical process, without combustion. A single Fuel Cell consists of an electrolyte and two electrodes (anode and cathode). Fuel Cells are classified primarily by the kind of electrolyte they employ and PEM Fuel Cells (PEMFC) use hydrogen as fuel and have emissions only of water. Today Fuel Cells are present in a wide range of products and prototypes and I chose to consider in my analysis the Hydrogen Fuel Cell Powertrain (H2FCPowertrain) as “Power Generation Plant” because the high volume associated with the FCVs mass production (from 10k to 500k and more units/year) will permit to reduce dramatically the Fuel Cell system manufacturing costs, in order to be competitive with gasoline in Hybrid-Electric Vehicles (HEVs). In my opinion, in this perspective, H2FCPowertrain will be so cost competitive to be useful adopted also for stationary power generation application as a power generation plant. 1.3 Beyond the Vehicle-to-Grid Concept: Considering H2FCPowertrain as Power Generation Plant Every day more than 90% of vehicles are parked, even during peak traffic hours. In this situation the vehicle power generation system H2FCPowertrain, if properly equipped, could become a new power generation source, supplying electricity to homes and to the grid like a new type of distributed generation: Vehicle-to-Grid (V2G). Academics, public and private operators well know the V2G concept V2G could be realized indifferently with Electric Vehicles and FCVs, but only in the case of FCV we are in presence of a real new power generation capacity greenhouse gas (GHG) emission free: the H2FC Powertrains. FCV in a V2G mode may profitably provide power to the grid when they are parked and connected to an electrical outlet. In this perspective, literature analyzed also the economic aspects. FCV have significant potential revenue streams from V2G, on peak power production, but it is possible to obtain higher return offering a series of high-value ancillary services to the grid. In my opinion, in the coming years, hydrogen and fuel cells have the potential to be a disruptive low-carbon solution. The electricity produced by a Hydrogen Fuel Cell can be used both for stationary and transport application and I think that it is time to consider the link between the transport sector and the energy sector not only in a V2G approach but in another perspective, more direct, relevant and disruptive. In fact the H2FCPowertrain or, in other words, the propulsion system of a FC Vehicle (FCV), is a small power generation plant (typically the H2FCPowertrain size is around 100 kW). In the coming years the high volume associated with the possible FCVs mass production will permit to reduce dramatically the FC system manufacturing costs, in order to be competitive with gasoline in hybrid-electric vehicles. In a mass production perspective, H2FCPowertrain will be so cost competitive to be useful adopted also for stationary power generation application, also in LCOE perspective. 2. H2FCPowertrain LCOE In order to calculate the H2FCPowertrain LCOE it is necessary to know some specific data: system cost and efficiency, expected system lifetime, fuel cost (i.e. H2 production cost). 2.1 2015 H2FCPowertrain LCOE Data According to my “Hydrogen and Fuel Cell: A Cinderella or a Disruptive Low-Carbon Solution?” – presented at 2015 Fuel Cell Seminar & Energy Exposition, Los Angeles CA, USA, and published in ECS Transaction 2016 (details in references) – based on 2015 DOE public data, I found: Current Status (2014): Overnight cost, 55 USD/kW (at 500k units/year, 66 USD/kW at 100k units/year, 280 USD/kW low volume); 54% System Efficiency; Lifetime, 2500 hours; H2 cost, 3 UDS/Kg-GGE (based on natural gas steam reforming).
H2FC Powertrain Levelised Cost of Electrìcity (USD/MWh)
Efficiency Hours LIFE
Hydrogen Cost
USD/GGE*
Capital Overnight (USD/kW)^
Levelized Capital Cost
LCC (USD/MWh)
O&M + Others(Assumed
Equal Cost to 10% LCC, USD/MWh)
Fuel Cost (USD/MWh)
LCOE (USD/MWh)
54% 2500 3,0 55,0 22,0 2,2 166,7 190,9 DOE 20 14 Status
60% 5000 4,0 40,0 8,0 0,8 200,0 208,8 2020 DOE Target s
60% 5000 3,0 40,0 8,0 0,8 150,0 158,8 2020 DOE Target s
60% 5000 2,0 40,0 8,0 0,8 100,0 108,8 2020 DOE Target s
The H2FCPowertrain LCOE, using these data referred to high projected production volume, would be USD 191 for MWh. Using the 2020 targets the LCOE range moved to USD 109-209 for MWh and, for the lower value of this range, it appeared competitive with many of the U.S. power generation technologies analyzed by the U.S. Energy Information Administration (EIA) that annually realizes forecast about the U.S. Overnight Costs and LCOE (table of 2012-2017 data).
The U.S. LCOE OF New Generation Resources from the EIA Annual Energy Outlook 2012-2017 (2016-2017 Data for Plants Entering in service in 2022)
In 2015, I considered these U.S. H2FCPowertrain LCOE data also in the EU context, having in mind the difference in natural gas prices present in these two areas and considering that, in EU, there are other cheap ways to produce H2 like from: brown coal (with CO2 capture, use and sequestration CCUS), nuclear power and all the situations of electricity overproduction. In 2020 perspective, based on our elaboration of the OECD-IEA-NEA Projected Costs of Generating Electricity 2015 Edition LCOE data, for the lower value of target range (109 USD/MWh) the H2FCPowertrain technology appeared competitive with many of the power generation technologies also considering the three different discount rate (3%, 7% and 10%) used in this OECD-IEA-NEA edition. More details in the published 2015 study. 2.2 2017 Review This analysis is based on DOE and IEA public data.
257
2.2.1 The U.S. DOE Data Current Status (2016): Overnight cost, 53 USD/kW (at 500k units/year; 59 USD/kW at 100k units/year; 215 USD/kW low volume – details down, in left table); 52% System Efficiency; Lifetime, 4100 hours; H2 cost, 5 UDS/kg-GGE (based on natural gas steam reforming, high volume projection; including: production, delivery & dispensing; in 2014 including only production & delivery).
2020 targets: Overnight cost, 40 USD/kW (at 500k units/year – annual data up, in right table); 60% System Efficiency; Lifetime, 8000 hours (in 2014, 5000 hours); H2 cost, 4 UDS/kg-GGE (with the same assumptions of current status). The 2017 H2FCPowertrain LCOE, using these DOE data & assumptions referred to high projected production volume, would be USD 303 for MWh, using the 2016 data and 206 USD for MWh using the 2020 targets (2017 data, bold in table; 2015 study data, italics in table).
258
H2FC Powertrain Levelised Cost of Electricity (USD/MWh)
Efficiency Hours LIFE
DOE Hydrogen
Cost USD/GGE
Capital Overnight
Cost (USD/kW)
Levelized Capital Cost(USD/MWh)
O&M + Others (Assumed Equal LCC to 10% LCC,
USD/MWh)
Fuel Cost(USO/ MWh)
LCOE (USD/ MWh)
ASSUMPTIONS
54% 2500 3,0 ^ 55,0 22,0 2,2 166,7 190,9 2014 DOE Status
52% 4100 5,0 * 53,0 12,9 1,3 288,5 302,7 2016 DOE Status
*Costs of producing and delivering hydrogen (from natural gas) ^Projected costs of hydrogen production, delivery and dispensing (from natural gas)
2.2.2 The IEA Data of H2 Production Costs Considering the fact that current DOE data regarding H2 projected costs including “production, delivery & dispensing” costs and not only the “production & delivery” costs as in the past, I decided to use in this analysis the IEA H2 production costs presented in two recent publications (2017): “Producing industrial hydrogen from renewable energy” and “Producing ammonia and fertilizers: new opportunities from renewable” (main data in next table, detail in references).
Cost of Hydrogen from electrolizers at USD 450/kW Capex for different electricity costs and load factors
Assumptions: Capex of electrolizers $ 450/kw (NEL 2017), WACC 7%, lifetime 30 years, efficiency 70% (IEA 2015); cost of hydrogen from SMR $ 1 to 3/kg H2 depending on natural gas prices
The IEA H2 production costs data-range is 1-4 UDS/kg-GGE and includes both H2 from natural gas steam reforming and H2 from electrolizers (for different electricity costs and load factors).
259
2.2.3 2017 Review – H2FCPowertrain LCOE Based on DOE and IEA Data
Combining the 2016 DOE fuel cell data and the 2017 IEA H2 production costs data-range (1-4 USD/kg-GGE) the current H2FCPowertrain LCOE value-range would be 72-245 USD/MWh and, for 2020, USD 56-206 USD/MWh.
H2FC Powertrain Levelised Cost of Electricity (USD/MWh)
^ Production costs: H2 from natural gas steam reforming and H2 from electrolizers (for different electricity costs and load factors)
It is interesting to note that these values are mainly due to the H2 production costs data-range that impact for 58-231 USD/MWh in the current LCOE and USD 50-200 USD/MWh in 2020 LCOE.
3. Conclusions
In this perspective, the H2FCPowertrain technology appears competitive with many of the power generation technologies and, especially in favorable conditions of H2 production costs, H2FCPowertrain seems to be useful to be adopted also for stationary power generation application. Observing these H2FCPowertrain data it will be necessary to think the FCVs link to energy sector considering also the possibility to utilize H2FCPowertrain as a power generation plant, smart grid connected, with relevant and positive consequences for a rapid development of this disruptive low-carbon solution. In line with the spirit of the Holy Father Francis Encyclical Letter “LAUDATO SI’” and with the new goals of United Nations “Transforming our world: the 2030 Agenda for Sustainable Development”, in 2015 the UNFCCC COP21 Conference adopted the historic “Paris Agreement” that introduced a new paradigm to a durable global framework to reduce global greenhouse gas emissions. After the 2017 decision of the United States of America to withdraw from the Paris Agreement, in July in Hamburg, the Leaders of the other G20 members stated that the Paris Agreement is irreversible. In this new and irreversible global framework it will be useful well explain the advantage to utilize H2FCPowertrain as power generation plant to all the actors involved in order to offer a new and feasible path to implement the Paris Agreement and to accelerate even more the introduction of this break-through low-carbon solution.
References
DOE, 2015: “Progress and Accomplishments in Hydrogen and Fuel Cells”, https://energy.gov/sites/prod/files/2015/08/f26/fcto_progress_and_accomplishments_august_2015.pdf ; DOE, 2016: “Progress and Accomplishments in Hydrogen and Fuel Cells”, https://energy.gov/sites/prod/files/2017/01/f34/fcto-progress-accomplishments-april-2016.pdf; DOE Hydrogen and Fuel Cells Program Record, 2014: “Fuel Cell System Cost - 2014”,
http://www.hydrogen.energy.gov/pdfs/14014_fuel_cell_system_cost_2014.pdf; DOE Hydrogen and Fuel Cells Program Record, 2016: “Fuel Cell System Cost – 2016”,
DOE Hydrogen and Fuel Cell Technologies Program Record, 2016: “On-Road Fuel Cell Stack Durability – 2016”, https://www.hydrogen.energy.gov/pdfs/16019_fuel_cell_stack_durability_2016.pdf;
EIA, 2015: “Levelized Cost and Levelized Avoided Cost of New Generation Resources in the Annual Energy Outlook 2015”, https://www.eia.gov/outlooks/archive/aeo15/pdf/electricity_generation_2015.pdf;
EIA, 2017: “Levelized Cost and Levelized Avoided Cost of New Generation Resources in the Annual Energy Outlook 2017”, https://www.eia.gov/outlooks/aeo/pdf/electricity_generation.pdf; EIA, 2015: “Assumptions to the Annual Energy Outlook 2015”, https://www.eia.gov/outlooks/archive/aeo15/assumptions/pdf/0554(2015).pdf; EIA, 2017: “Assumptions to the Annual Energy Outlook 2017”, https://www.eia.gov/outlooks/aeo/assumptions/pdf/0554(2017).pdf; G20 GERMANY 2017: “G20 Leaders´ Declaration Shaping an interconnected world Hamburg, 7/8 July 2017”
https://www.g20.org/gipfeldokumente/G20-leaders-declaration.pdf; Holy Father Francis, 2015: Encyclical Letter “LAUDATO SI’ on Care for Our Common Home”,
International Energy Agency (IEA), 2015: “Technology Roadmap: Hydrogen and Fuel Cells”, http://www.iea.org/publications/freepublications/publication/TechnologyRoadmapHydrogenandFuelCells.pdf;
http://www.iea.org/newsroom/news/2017/april/producing-industrial-hydrogen-from-renewable-energy.html; IEA, Cédric Philibert, 2017: “Producing ammonia and fertilizers: new opportunities from renewable”,
http://www.iea.org/media/news/2017/Fertilizer_manufacturing_Renewables_01102017.pdf;M.V. Romeri, 2010: “Considering Hydrogen Fuel Cells Powertrain as Power Generation Plant”, World Electric
Vehicles Symposium EVS 25, Shenzhen, Guangdong, China, World Electric Vehicle Journal Volume 4 (2011), http://www.evs24.org/wevajournal/php/download.php?f= vol4/WEVA4-4131.pdf;
M.V. Romeri, 2011: “Hydrogen Fuel Cell Powertrain Levelized Cost of Electricity”, 30th USAEE/IAEE North American Conference, Washington DC USA, USAEE & IAEE Research Paper Series, http://ssrn.com/abstract=2006758;
M.V. Romeri, 2011: “The Hydrogen Fuel Cell Vehicles Powertrain Roles in the Copenhagen Accord and Cancun Agreement Perspective”, 2011 Fuel Cell Seminar & Exposition, Orlando FL USA, ECS The Electrochemical Society, ECS Transaction, Volume 42, http://ecst.ecsdl.org/content/42/1/59.abstract;
M.V. Romeri, 2012: “Consideration about the Hydrogen Fuel Cell Powertrain LCOE”, 3rd IAEE Asian Conference, Kyoto Japan, http://eneken.ieej.or.jp/3rd_IAEE_Asia/pdf/paper/025p.pdf;
M.V. Romeri, 2012: “Considering Hydrogen Fuel Cells Powertrain as Power Generation Plant in the Copenhagen Accord and Cancun Agreements Perspective”, International Battery, Hybrid and Fuel Cell Electric Vehicle Symposium EVS 26, Los Angeles CA USA, http://toc.proceedings.com/16245webtoc.pdf;
M.V. Romeri, 2012: “The Hydrogen Fuel Cell Vehicles Powertrain Possible Roles in the Kyoto Protocol Second Commitment Period Perspective in the Pacific Rim Area”, ECS 222nd Meeting “PRIME 2012 Pacific Rim Meeting on Electrochemical and Solid-State Science”, Honolulu HI USA, ECS Transaction 2013, Volume 50, http://ecst.ecsdl.org/content/50/45/75.abstract;
M.V. Romeri, 2013: “Hydrogen Fuel Cell Vehicles Powertrain Possible Future Roles in a Global Perspective”, 36th Annual IAEE International Conference, Daegu Korea,
http://www.iaee2013daegu.org/eng/sub14/sub14_01.asp; M.V. Romeri, 2014 “Fuel Cell Vehicles are Close to Commercialization and it’s Time to Think Hydrogen Fuel
Cell Powertrain as Power Plant. Consideration about Germany, UK and Italy in EU Context”, 14th IAEE European Energy Conference, Rome Italy,
http://www.iaee2014europe.it/pages/october30.html and http://www.iaee.org/en/publications/proceedingssearch.aspx (Author: Romeri) ; M.V. Romeri, 2014: “Considering Hydrogen Fuel Cell Powertrain as Power Plant in the Three Main Automaker
Asian Countries: South Korea, Japan and China”, 4th IAEE Asian Conference, Beijing China, http://iaeeasia.csp.escience.cn/dct/page/70056 and
http://www.iaee.org/en/publications/proceedingssearch.aspx (Author: Romeri) ; M.V. Romeri, 2015: “Hydrogen and Fuel Cell: A Cinderella or a Disruptive Low-Carbon Solution?”, 2015 Fuel
Cell Seminar & Energy Exposition, Los Angeles CA, USA, ECS Transaction 2016, Vo. 71 http://ecst.ecsdl.org/content/71/1/227.abstract;
United Nations Framework Convention on Climate Change UNFCCC COP 21, 2015: “Adoption of the Paris Agreement. Proposal by the President”,
http://unfccc.int/documentation/documents/advanced_search/items/6911.php?priref=600008831; United Nations, Resolution adopted by the General Assembly on 25 September 2015: “Transforming our world:
the 2030 Agenda for Sustainable Development”, http://www.un.org/ga/search/view_doc.asp?symbol=A/RES/70/1&Lang=E.
261
EU ETS 2021-2030 – A TOO MUCH AMBITIOUS DIRECTIVE Francesco Scalia and Agime Gerbeti Context Since the first international agreements to fight climate change have been adopted by the European Union (EU), starting with the United Nation Framework Convention on Climate Change, then the Kyoto Protocol (2008-2012) and the recent Paris Agreement1, EU has been at the forefront fulfilling and pursuing the objectives of these treaties, with constancy and perseverance to make it unique in the international geo-energetic panorama. In fact, the EU aims to achieve the reduction of total emissions of 80 - 95% by 2050 compared to 1990 data. Based on the same guideline by 2030, the main and only target2 to be achieved at EU level is the decline of emissions by at least 40%. In particular3, through the Emissions Trading Scheme (ETS) by 20304 the emissions reduction effort has to be equivalent to 43% compared to 2005 and to 33 % for the non-ETS sectors. As far as 2013-2020 period is concerned, the EU is in line with its goal regarding the second commitment period deriving from the Kyoto Protocol5. The EU QELRO (Quantified Emission Limitation or Reduction Objectives) is equivalent to 20% compared to 1990. At European level, this objective has been divided into a 21% for the ETS sectors and 10% in the non-ETS6 sectors, considering as a baseline the 2005 data. With the new targets set for 20307, the EU intends to address various issues related to environment, energy and industry, such as high energy prices and the EU’s dependence on energy imports especially from politically unstable regions and the need to deliver a stable regulatory framework for potential investors. Preliminarily, it is observed that although a significant effort is recognized to the EU Commission for elaborating a legislation that also takes into account the trans-sectoral needs and a comprehensive understanding of the regulation that affects in many ways the carbon emitted for various production phases, the carbon routes will still have to be deepened as well as the effects on the European industrial competitiveness of such rigorous legislation. However, in this article we will discuss only some novelties in the process of adoption of the EU recast ETS directive. In fact, at the EU institutions level the negotiations on the modification of the ETS Directive 2003/87/EC already amended by Directive 2009/29/EU are closing.
1 EU ratified Paris Agreement on October 5th 2016 following an accelerating procedure. Also each Member States
has ratified the Paris agreement. The Intended Nationally Determined Contribution INDC has become the NDC of EU with the same emissions reduction target.
2 On October 23rd 2014 the European Council agreed the framework on Energy and climate change considering the 2030 horizon based on the European Commissions’ proposal of January 22nd 2014.
3 “Trends and projections in Europe 2017. Tracking progress towards Europe's climate and energy targets” EEA report no 17/2017. 4 The Environment Council approved on March 6th 2015 the EU’s intended nationally determined contribution to
achieve an at least 40% domestic reduction in greenhouse gas emissions compared to 1990 levels by 2030. These targets were included in the INDC communicated by the EU Presidency and the European Commission to the United Nations Secretariat.
5 With the so called EU 20-20-20 package. 6 Decision 406/2009 Effort sharing. 7 In particular, EU proposes the following actions: a commitment to continue reducing greenhouse gas emissions, setting a reduction target of 40% by 2030 relative to 1990 levels; a renewable energy target of at least 27% of energy consumption, with flexibility for member states to set national targets; improved energy efficiency through possible amendments to the energy efficiency directive; reform of the EU emissions trading scheme to include a market stability reserve; key indicators - on energy prices, supply diversification, interconnections between member states and technological developments - to measure progress towards a more competitive, secure and sustainable energy system; a new governance framework for reporting by member states, based on national plans coordinated and assessed at EU level.
262
It is important to highlight that the EU started to recognize that the desired environmental objectives have not been achieved with the current policies. The EU ETS has not yet provided price responses to accelerate the decarbonisation of the energy sector and increase the effectiveness of the EU emission trading scheme of CO2
8. So the European Commission for the first time, is working together with the Member States on a comprehensive package of an all-inclusive and wide-ranging measures including a new regulation on EU Governance that coordinates policies both on climate change and on energy. Adoption process of the recast directive The European Commission’s proposal9 for the revision of the EU ETS, on the basis of what was agreed at the October 2014 European Council, is negotiated according to the ordinary legislative procedure. The agreed text will be submitted to the European Parliament for final approval. The title of the new ETS Directive being adopted is different from the original one of Directive 2003/87/EC establishing a system for greenhouse gas emission allowance trading within the Community, which remains unchanged with Directive 2009/29/EC: now it will be called “to enhance cost-effective emission reductions and low- carbon investments”
It is worth highlighting that Europe is moving towards the integration of actions linked to low-carbon technological innovation. Beyond any evaluation of the functioning of the ETS scheme it is good that there is such an improvement of decarbonisation policies. Their interaction promotes the awareness that we must not act with a single flagship instrument such as the ETS but, through a combination of measures. However, tools such as innovation and energy efficiency in industry cannot be subordinated to the ETS mechanism which, for many reasons, has not been able to promote them so far.
Main Changes
Here below we will analyze the main elements where the legislative changes will have the main impact:
a) EU cap of allowances b) Allocation of CO2 allowances.
In conclusion, we will face the nascent Chinese ETS market and the desired linking with the EU ETS.
a) EU cap of allowances
On the basis of Article 9 of Directive 2009/29/EC, the EU cap of allowances to be issued each year, starting from 2013, decreases in a linear manner of 1.74% (the so-called linear reduction factor). The number of allowances of the 2013 starting year (with a reduction of three times for 1.74%) was calculated on the basis of 2010 (intermediate period 2008 - 2012). The amount of allowances in 2013 was equal to 2,084,301.856 units. The annual reduction is equivalent to 38 million of allowances per year.
With the new, higher objectives EU is aiming to reach a reduction of its emissions governed by the ETS equal to 43% compared to 2005 by 2030. Obviously to achieve this goal, was agreed to apply a higher linear reduction factor compared to the current phase, that is 2.2%.
According to the European Commission, this change included in Article 9 will result in a drop of CO2 allowances of around 556 million during the ten years 2021-2030, equivalent to 55 600 000 allowances per year.
8 See also the “Report on the functioning of the European carbon market” Report from the Commission to the European Parliament and the Council, Brussels, 23.11.2017 COM (2017) 693 final. 9 Proposal for a Directive of the European Parliament and of the Council amending Directive 2003/87/EC to enhance cost-effective emission reductions and low-carbon investments. (COM (2015) 337 final, 2015/0148 (COD)).
263
So, in the face of the problems that have emerged in order to reach a “useful” price, the changes of the directive, for the fourth ETS phase, aim to act on the “supply” side, reducing the number of overall CO2 allowances offered on the market faster.
b) Allocation of CO2 allowances
The ETS System, started in 2005, has undergone substantial changes over time with the purpose of improving its effectiveness and eliminating the competitive distortions deriving from its implementation. The most important of these changes is certainly the evolution of the system of allocation of the allowances necessary for the plants to offset their emissions and thus be compliant with the ETS obligations.
In the periods 2005 - 2007 and 2008 - 2012, the general principle of allocation of allowances was the so-called grandfathering, i.e. the allowances were allocated by the national competent authorities to their plants on the basis of historical emissions and free of charge. Only for the period 2008 - 2012, the directive 2003/87/EC allowed to replace grandfathering in some sectors in favour of a benchmark criterion with the aim of limiting the European emissions cap. The directive also gave to Member States the right to test the allocation through auction mechanisms for a quantity of allowances not exceeding 10% of the national allowances. Some countries like Germany, Great Britain, The Netherlands and Austria have chosen to experiment this solution.
Onerous allocation of allowances - The 2013-2020 period marks a radical change in the ETS system, sanctioning the allocation by way of an auction as the main criterion for allocating allowances to installations subject to this system.
The new directive states in article 10 foreseen that starting from 2019 Member States will auction all allowances that will not be allocated for free according to Articles 10. a) and 10. c) and which have not been placed in the market stability reserve created by Decision10 (EU) 2015/1814 (which will be established in 2018 in which the allowances are integrated from 1st January 2019) or cancelled pursuant to Article 12 paragraph 4 11.
From 2021 onwards, and subject to a possible reduction pursuant to art. 10a paragraph 5a at least 57% of allowances shall be auctioned.
Moreover, by way of derogation it is envisaged (Article 10. a paragraph 5b) to reduce the share of allowances to be auctioned in the decade 2020-2030 only if the request for free CO2 allowances triggers the necessity up to an additional 3% of the total quantity of allowances.
Free allocation of allowances – The free allocation has been harmonized at European level (Directive 2009/29/EC) on the basis of common benchmarks, i.e. benchmarks that quantify the average emissions content per unit of output calculated on the basis of the performance of the most efficient European plants. In particular, plants of the manufacturing sectors recognized at risk of carbon leakage - the risk of delocalizing factories and production as a consequence of the environmental costs linked to the ETS - received 100% of allowances for free. This was compared to the reference benchmark. The other manufacturing installations subordinated to the ETS were recognized only 80% based on benchmarks12. So, for all manufacturing plants, a period of transition and partial allocation of free allowances was envisaged, even though, decreasing from year to year,
10 Decision (EU) 2015/1814 of the European Parliament and of the Council of 6 October 2015 concerning the establishment and operation of a market stability reserve for the Union greenhouse gas emission trading scheme and amending Directive 2003/87/EC. 11 “In case of closure of electricity generation capacity in their territory due to additional national measures, Member States may cancel allowances from the total quantity of allowances to be auctioned by them referred to in Article 10(2) up to the average verified emissions of the installation concerned over a period of five years preceding the closure. The Member State concerned shall inform the Commission of such intended cancellation in accordance with the delegated acts adopted pursuant to Article 10(4).” 12 For each type of product, the quantity of allowances received from the installation will be quantified based on the historical production mean multiplied by the reference benchmark. An installation that makes different products will receive a number of allowances equal to the sum of the products between the historical production of each product for the respective benchmarks.
264
because were deemed at the risk of international competition with industries of countries not providing regulations similar to the ETS. However, also for the period 2020-2030, remains the continuation of the free allocation policy as an exemption for the carbon leakage sectors and subsectors that in the new directive is motivated as “a justification to temporarily postpone full auctioning, and targeted free allocation of allowances to industry is justified in order to address genuine risks of increases in greenhouse gas emissions in third countries where industry is not subject to comparable carbon constraints as long as comparable climate policy measures are not undertaken by other major economies13“.
In this regard it is noted that it is not clear why the Commission continues to say14 that, given the danger of carbon leakage, temporarily, free permits are recognized for certain sectors. What is surprising is the concept of temporality: indeed, the industrial production can bear the costs of the ETS or it cannot. If the temporariness refers to the hope that from now to 2030, or to another future date, other geo-energetic areas will impose similar obligations on the same sectors, and that therefore European industries will no longer be tempted to delocalize the plants, this is probably a naive hope. If the Commission considers that the costs of the energy transition are only initial and after that there is a soft landing phase, it should be remembered that the progression on the emission limits and on the allocation of free allowances on the one hand can be justified due to the lowering of the costs of renewable technologies, on the other hand it does not take into account the increase in the marginality of costs for the emission efficiency15. In other words, by approaching the maximum possible efficiency, the costs will rise exponentially, creating a constant and growing handicap for European industries with respect to the fewer obligations on non-European ones. What is certain is that if the Commission itself recognizes the danger of carbon leakage as real and current, it is well aware of the competitive asymmetry16 existing between the EU industry and that located elsewhere and to solve this problem it distributes free quotas. Perhaps it is here that an overview is lacking, not yet being exhaustive the ETS of a long list of environmental costs that European companies are called to support.
The particular attention that has been given to the revision of the system of assignments of allowances free of charge that will lead to allocation to the companies about 6.3 million allowances, in fifty sectors that are deemed to be at high risk of transferring their production outside the EU.
Particularly complex is the parameterization (Article 10. a) of the free allowances to be assigned to the manufacturing sectors: without prejudice to the adoption by the European Commission, through delegated acts, of the determination of the new benchmark values, it must be taken into account the following:
a) “For the period from 2021 to 2025, the benchmark values shall be determined on the basis of information submitted pursuant to Article 11 for the years 2016-2017. On the basis of a comparison of the benchmark values based on this information with the benchmark value contained in Commission Decision 2011/278, as adopted on 27 April 20118, the Commission shall determine the annual reduction rate for each benchmark and apply it to the benchmark values applicable in the period 2013-2020 in respect of each year between 2008 and 2023 to determine the benchmark values for the years 2021-2025.
b) Where the annual reduction rate exceeds 1,6% or is below 0,2%, the benchmark values for 2021-2025 shall be the benchmark values applicable in the period 2013 to 2020 reduced by the relevant one of these two percentage rates in respect of each year between 2008 and 2023.
c) For the period from 2026 to 2030, the benchmark values shall be determined in the same manner on the basis of information submitted pursuant to Article 11 for the years 2021-2022 and with the annual reduction rate applying in respect of each year between 2008 and 2028.”
13 Whereas 7 of the EU ETS recast Directive. 14 Whereas 7 e 10 of the EU ETS recast Directive. 15 Whereas 11 of the EU ETS recast Directive. 16Senate of the Italian Republic, XVII Legislature (Doc. XXIV n. 79) Resolution of the meeting Committees 10th (Industry, commerce, tourism) 13th (Territory, environment, environmental assets) on the initiative of the Senators Dalla Zuana and Scalia, approved on August 1st, 2017.
265
Therefore, for the purpose of defining the benchmarks for the next ETS phase, Member States will collect manufacturing plant production data twice:
a) For the period 2021 - 2025, the benchmark calculations will be based on 2016-2017 data. The resulting benchmark values will be compared with those adopted for the current ETS phase. After this comparison, the Commission will apply an annual reduction rate (to be defined) for each benchmark between 2008 and 2023, except when the deviation is not between 1.6% - 0.2%;
b) For the phase 2026 -2030, the procedure is the same but the data collection will cover the years 2021 - 2022 with the application of the annual rate between 2008 and 2028
Thus, it is clear that the number of allowances to be allocated for free for the whole 10-year period, will not be fixed but dynamic. On the one hand, the benchmarks will be flexible, i.e. reduced annually, and on the other hand the level of free allocations to plants whose activity has increased or decreased will be assessed on the basis of a two-year moving average to check if it exceeds 15% of the level initially used to determine this free allocation for the respective two sub-periods (Article 10a, paragraph 2017). Besides being complex, these calculations will increase administrative costs for the Member States, and therefore for those subject covers by the ETS which, together with the emissions, will also have to provide documentation on the productivity of the plants on an annual basis. A control that starts from the economic data to impose an environmental obligation but that has nothing to do with a desired environmental taxation. The paradox18 is that the price failures of the previous regulated ETS periods have made the Commission more confident in the ETS instrument, outlining it more aggressively and deeply. So deeply that this regulation seems to completely empty the concept of “CO2 market”. The Commission seems to be saying that, by hook or by crook, a price level deemed useful for decarbonising the European industrial economy will have to be achieved. In fact, in order to respect the auctioning quota referred to in Article 10, in each year in which the sum of the free allowances does not reach the maximum level that respects the auctioned share of the Member State, the remaining allowances up to this level are used to prevent or limit the reduction of free allocations to meet the share of Member States’ auctions in subsequent years. However, if the maximum level is reached, the free allocations must be adjusted accordingly. Any adaptation of this type must be done in a uniform manner and therefore a uniform trans-sectorial correction factor will be applied. The new directive allows Member States to adopt financial measures for sectors or sub-sectors that are exposed to genuine risk of delocalization due to significant indirect costs actually incurred by emissions commitments; these measures must obviously comply with Community law on State aid19 rules and competition in the internal market. In the event that these financial measures exceed 25% of the revenue generated from auctioning of allowances, the Member State should justify this exposure. The benchmarks for indirect CO2 emissions per unit of production for a given sector or sub-sector at risk of carbon leakage are calculated ex ante as the product of electricity consumption per unit of production in relation to the most efficient technologies available and according to CO2 emissions of the European electricity production mix. In other words, this is an analysis of how clean the products of the factories located on European territory are; that is, with these parameters it will be evaluated
17 Up to 200 million allowances set aside that are not allocated over the period from 2021 to 2030 shall be returned to the market stability reserve at the end of that period. 18 F. Scalia “L’accordo di Parigi e i “paradossi” delle politiche del Europa sul clima ed energia”. Diritto e giurisprudenza agraria alimentare e dell’ambiente, Numero 6 – 2016. 19 Communication from the Commission “Guidelines on State aid for environmental protection and energy 2014-2020 (2014/C 200/01).
266
how much CO2 has been emitted for the manufacture of a single product according to the energy mix consumed and the machinery used. Such a bright intuition20 of the Commission could in future become the basis for a comparison between similar products sold on the same European market but produced by factories intra and extra EU. It can become a starting point for a real comparison between production costs related to energy use and environmental commitments. Risk of carbon leakage - To establish whether a sector or subsector was exposed to a significant risk of carbon leakage based on directive 2009/29/CE, based on Article 10 a) par. 15 e 16, two criteria were taken into account:” A sector or subsector shall be deemed to be exposed to a significant risk of carbon leakage if:
(a) the sum of direct and indirect additional costs induced by the implementation of this Directive would lead to a substantial increase of production costs, calculated as a proportion of the gross value added, of at least 5 %; and
(b) the intensity of trade with third countries, defined as the ratio between the total value of exports to third countries plus the value of imports from third countries and the total market size for the Community (annual turnover plus total imports from third countries), is above10 %.
Notwithstanding paragraph 15, a sector or subsector is also deemed to be exposed to a significant risk of carbon leakage if: (a) the sum of direct and indirect additional costs induced by the implementation of this Directive would lead to a particularly high increase of production costs, calculated as a proportion of the gross value added, of at least 30 %; or
(b) the intensity of trade with third countries, defined as the ratio between the total value of exports to third countries plus the value of imports from third countries and the total market size for the Community (annual turnover plus total imports from third countries), is above30 %.
With the new directive, Articles 10.b and 10.c have been replaced by a single Article 10 b “Transitional measures to support certain energy intensive industries in the event of carbon leakage”.
The Commission’s awareness of the globalized market is also contextualized in the new definition of which sectors and sub-sectors are at risk of carbon leakage and, therefore, will be assigned free allowances for the period by 2030 the 100% of the benchmark (Article 10a). The parameter consists precisely in the fact of having an industrial comparison with industries in third countries.
Less brilliant, if not bizarre, appears the formula adopted by the Commission which defines that these sectors are at risk if “the product exceeds 0,2 from multiplying their intensity of trade with third countries, defined as the ratio between the total value of exports to third countries plus the value of imports from third countries and the total market size for the European Economic Area (annual turnover plus total imports from third countries), by their emission intensity, measured in kgCO2 divided by their gross value added (in euro)” .
Unlike the other sectors and sub-sectors, as mentioned above, which are considered to be able to transfer on the price of the product and therefore on final consumers a percentage of the cost of the allowances, will receive only 30% of the quantity determined according to the article 10. a. Unless otherwise decided in the review pursuant to Article 30, free allocations to other sectors and sub-sectors, with the exception of district heating, will decrease by the same amount after 2026 so as to reach zero of allowances given free of charge in 2030.
Through the introduction of these paragraphs the Commission aims to reduce the number of allowances allocated free of charge as the latter are always linked to the level of the benchmark. Instead, this provision aims to act on the “demand” side. As mentioned, there are about 50 industrial
20Senate of the Italian Republic, Legislature 17 Atto di Sindacato Ispettivo n ° 1-00593. Act No. 1-00593, Published June 21, 2016, in session no. 641.
267
sectors indicated in the carbon leakage list21 compared to the current 177. Analysts estimate that the sectors of the carbon leakage list would still represent over 90% of EU industrial emissions, albeit down from the current 97%. The reduction in the value of the benchmark translates into a reduction in the consumption of energy used and therefore a claim to greater efficiency. Any remaining (saved) allowances could then be sold on the market in the typical view of this instrument
The abrogation of the last part of paragraph 11 of Article 10. a. of the previous directive 2009/29/EC is clear: “Subject to Article 10b, the amount of allowances allocated free of charge under paragraphs 4 to 7 of this Article in 2013 shall be 80 % of the quantity determined in accordance with the measures referred to in paragraph 1. Thereafter the free allocation shall decrease each year by equal amounts resulting in 30 % free allocation in 2020, with a view to reaching no free allocation in 2027.” A clear turnaround appears, an awareness that will have an important role in the future debate: The Commission has realized that eliminating all the part of free allowances for companies at risk of carbon leakage entails a high risk of bankruptcies and delocalization in the involved sectors. Establishment of funds – Lastly, another aspect remains to be emphasized on the allowances to be auctioned because the new directive is pervaded by the creation of new funds of various kinds that use the revenues from CO2 allowances. In fact, with the Article 10. par.2 (market stability reserve) and par.3 b the auction incomes can even contribute to the achievement of the renewable sources target by 2030, Article 10 a (6 - 8), Article 10 c and 10 d foreseen the creation of funds to be used in the context of renewable energy projects or for the modernization of energy systems etc. For example, according to Article 10 c “Option for transitional free allocation for the modernisation of the energy sector” competitive tender procedures will be organized for projects implementation, which will take place in one or more rounds between 2021 and 2030, for projects with a total investment amount of more than 12.5 million euros to select the investments to be financed with free allocation. This process is recalls the Carbon Dioxide Capture and Storage Project that had to be financed with the CO2 allowances but their price was constantly low so, the investment was not sufficient to remunerate the CCS.
The 2% of the total amount of allowances between 2021 and 2030 will be auctioned to establish a fund to improve energy efficiency and modernize the energy systems of some Member States referred to in Article 10.d of the new Directive the so-called modernization fund. A 10% instead goes to Member States for reasons of solidarity and increased interconnection capacity within the EU.
c) Linking EU ETS & China ETS
China announced its own ETS market at the end of December 2017, which should be the main instrument through which Beijing plans to diminish emissions growth by 2030. The Chinese ETS, which should be operational within a year, will include 1,700 plants in the electricity sector responsible for 33.9% of the CO2 produced in the country and the exchange will be about 3.5 billion tons of CO2/year, therefore becoming the world’s first market.
Adopted as trial mechanism in some provinces of China in 2011, the Chinese national ETS, just like the European one, suffered of a weak CO2 price, around € 4 (30 yuan).
The European Commission has announced22 through the Commissioner for Energy and Climate, Miguel Arias Cañete, to start negotiations to link its ETS with that of the Asian country.
We observe, quietly, that the marginal cost to reduce a ton of CO2 for an inefficient Chinese industry will clearly be much lower than the cost for an efficient European industry to diminish its emissions for the equivalent tone of CO2. In other words, if for an industry that consumes electricity produced by 70-80% by burning coal, wants to reduce emissions, the cost will, initially, be rather limited differently if an industry that already supplies 40% from renewable sources, for another 40% is 21 The new carbon leakage list is expected to include sectors such as steel, aluminium, chemicals, paper, fertilisers, lime and glass. “Post-2020 reform of the EU Emissions Trading System” http://www.europarl.europa.eu/RegData/etudes/BRIE/2017/595926/EPRS_BRI(2017)595926_EN.pdf 22 https://ec.europa.eu/clima/news/eu-welcomes-launch-chinas-carbon-market_en
268
fuelled by natural gas and has an industrial process characterized by recent and very efficient machineries, to further improve its production efficiency will necessarily have to face much higher costs.
Therefore, the cost of emission titles on the two markets, the European and the Chinese, cannot be the same. They will not be able to exchanged, the two markets cannot be linked, worth an immediate devaluation of the Europeans emission titles, those that the European Commission hopes they could reach € 35/tonCO2, because all European industrialists would then buy Chinese23 emission titles to fulfil their EUETS obligations.
Moreover, the most recent estimate on allowance prices in the next regulatory period 2021-2030 Thomson Reuters24 has predicted that prices will increase up to € 24/tonCO2 by 2030: that is below the desired forecast. It seems unlikely that a non-mandatory market such as the Chinese CO2 market will help to raise the price of European allowances.
Conclusions
The ETS has - at least until now - failed its objective. This result is commonly attributed to the too low price of the CO2 allowances, which does not encouraged investments in low-carbon technologies. Due to this, the National25 Energy Strategy (SEN) adopted with Ministerial Decree of 10th November 2017, in defining the scenarios at the European level of the energy system, emphasizes that “Renewable growth would be substantially displacing mainly gas production, since the ETS would not be able to determine the lower convenience of coal”. Indeed, the price of CO2 allowances is currently still low, around 5-7 €/ton CO2, despite all the measures implemented so far by the European Union to raise it (especially with back loading26). Such a low price level does not encourage the transition from fossil fuels to less emissive or renewable sources; on the contrary, it causes the opposite effect. This is what happened and it was described in a Nomisma Energia study of November 201627 as “the European environmental paradox”: Europe has invested so much in the development of production from renewable sources, but the growth of these has occurred at the expense of combined cycle gas power plants rather than coal or lignite. This phenomenon has reduced by more than half the benefits that could have been obtained: if, in fact, the share of gas in the energy mix would had remain stable (to the detriment of coal), emissions would have decreased by 180 tons yearly, against of 70 tons occurred. Not only that, but emissions of other pollutants, such as air emissions, sulphur and nitrogen oxides28, have increased. In order to influence the price of allowances, in an attempt to make it constantly useful to incentivize the use of low-carbon technologies, the Commission has established the market stability reserve29. This mechanism will come into force from 2019 and should ensure the management of the existing emissions allowances surplus on the ETS market, ensuring structurally the balance between supply
23 Of course, these considerations apply to a free market. Otherwise if the price of European and Chinese CO2 titles becomes de facto an “administered” price, things change. Only one wonders why in an administered system one should exchange titles with a value of about 35 euros with other titles having the same value. 24 EU carbon price to average €23/t CO2 between 2021 and 2030: Thomson Reuters assess the future. https://blogs.thomsonreuters.com/financial-risk/commodities/eu-carbon-price-average-e23t-2021-2030-thomson-reuters-assess-future/ 25 It refers to the Italian Energy Strategy. 26Measure adopted with Regulation no. 176/2014/EU. Within this provision a portion of emission allowances for the three-year period 2014-2016 (400 in 2014, 300 in 2015 and 200 in 2016), to be then auctioned in the two-year period 2019-2020. This measure did not affect the price of allowances, either because the CO2 permits provisionally removed from the market did not eliminate the surplus of supply, and because the forecast of their reintroduction in the two-year period 2019-2020 operates as a negative signal on the price CO2. 27 Cambiare il mercato della CO2 per decarbonizzare l’Europa e aumentare la competitività del sistema Italia, November 2016. 28 The European coal power plants in 2013 were responsible for 52% of the SO2 overall emission, for 40% of NOx, for 37% of air pollution (particulate) and for 43% of mercury. See. F. Valezano, In Europa il carbone uccide, ma la normativa lo permette, in QualEnergia.it. 29 Decision (EU) 2015/1814 above mentioned.
269
and demand. But, notwithstanding from the considerations on the effectiveness of this instrument30, the differential between coal and gas prices would lead to favouring the first fuel at the expense of the latter, even in presence of CO2 prices far higher than those commonly considered as incentives for low carbon technologies (25-30 €/ton CO2). In fact, the SEN 2017 also notes that the price of CO2 in the European scenarios by 2030, depending on the energy efficiency target assumed as hypotheses (from 27% to the maximum hypothesis of 40%), varies from € 42 to € 14/ton. Well, the same scenarios - with the different prices of CO2 - foreshadow an energy mix in which the power coal generation remains almost constant (from 13.8% with the price of CO2 up to 42 €, and 15.1% with the price to 14 €), while the share of natural gas drops dramatically (from 15.1% to 9.2%). Moreover, the increase in price of CO2 allowances would make European production even less competitive on the market giving an advantage to those who use the most emissive energy sources. The possible consequence is the delocalization of energy-intensive industries to non-EU countries and the greater competitiveness in the same European market of the productions coming from those countries.
The reason for the ineffectiveness of the ETS is that it is an artificial31 market limited to the territory of only one of the industrial powers of the planet. If the price of emission allowances increases - and when the allocations free of charge will be definitively abandoned - the system will act as an incentive to cross those borders and delocalize productions where it is possible to use high emissive energy sources, but less expensive, without having to pay a pledge. Moreover, non-EU productions will be increasingly competitive in the same European market, which will not have to face the most virtuous energy mix costs, with the consequence that European consumers will finance the most emissive productions32.
This evidence should lead - as suggested in the consultation document of the SEN 2017 - to re-discuss the ETS in the European context “also taking into consideration measures of carbon pricing” (sentence, however, dismissed in the final text). The scientific literature has proposed different environmental tax solutions, not necessarily alternative to the ETS, which could even be complementary to the same, correcting the distortions. Among the countries that have moved towards these solutions stands out the United Kingdom, which has introduced a minimum price of CO2 with increasing trajectory and a maximum emission level for KWh electricity produced (Emission Performance Standard - EPS) of 450grCO2/KWh for new plants. This has stimulated the transition from coal to gas in electricity generation and drastically reduced CO2 emissions. Another possible solution is making the European market - today the world’s leading importer market - and its competition, an incentive to adopt low-carbon technologies33. This would be the case if Europe adopted a Charge on Emissions34, i.e. applied to the good, wherever it is produced, on the
30 See on this issue M. Pellegrino, EU ETS: riforme in corso e potenziali rischi, in Newsletter del GME n. 109 November 2017. The author considers that: the external intervention in the management of the quantities offered may generate greater uncertainty on the market, especially as the Commission's publication of the surplus value is close: the published figure refers to the final balance recorded the two previous years to that of application of the measure, with possible consequences on the range of expectations that the various operators will accrue on the effectiveness of the intervention, assessments that usually translate into an increase in the short-term volatility and the volumes traded. 31 Regarding the definition see M. Cafagno, Principi e strumenti di tutela dell’ambiente. Come sistema complesso, adattivo, comune, Torino, 2007, from page 425. 32 Today the impact of the overall EU ETS is equivalent to a decrease of about 0.4 percent of global emissions, which, however, continue to grow - business as usual - by more than 2% per year. 33 Recalling to what has been defined the “environmental protection through the market”. See on this point, M. Clarich, La tutela dell’ambiente attraverso il mercato, in Dir. pubbl. n. 1/2017, from page 219. 34 For this solution, see A. Gerbeti, “A Symphony for Energy” Milano 2015; “CO2 nei beni e competitività industriale europea”, Milano, 2014 passim . The proposal is based on the analysis of the product life cycle, which takes into account the energy costs in terms of emissions and environmental impact of a given good and the related production processes: the various production phases from the extraction of raw materials and their refining until the disposal of the good at the end of the life cycle. It consists in the modulation of the Value Added Tax (V.A.T.) – a charge on consumption – by reasons of the carbon intensity of individual products. See also T. Fanelli, “L’emissione in affanno”, in QualEnergia, no 2, 2014.
270
basis of its carbon content. The advantage of this Charge is that, unlike the classic carbon tax, it does not weigh on production (it is therefore not limited to the companies of the impository country, with the effect of delocalization and competitive asymmetry mentioned above), but on consumption. In essence, if the European Union were to apply this Charge, the goods placed on its market - wherever produced - would pay a Charge that will vary due to the carbon content. The Charge, therefore, would render the goods produced with the least amount of emissions more competitive on the market, giving an advantage to the more efficient industry and encouraging the more emissive industry to improve its environmental performance, worth the loss of market35 shares. Moreover, the Charge on Emissions, precisely because it relates to an asset (carbon) contained in the product and not discriminating according to the producer country, would be compatible with art. II of the GATT/WTO36. The European Commission has foreseen the definition and approval by the end of 2018 of the National Energy and Climate Plans of each Member States, in order to make consistent objectives on emissions reduction and those for energy efficiency and renewable sources with the commitments undertaken under the Paris agreement.
The year we are living in is therefore, crucial for the adoption of measures to overcome the paradoxes that - even with the best intentions - have characterized European environmental policies.
References
European Council conclusions of October 23rd 2014. Decision 406/2009/EC on Effort sharing. Commission Regulation (EU) No 176/2014 of 25 February 2014 amending Regulation (EU) No 1031/2010 in
particular to determine the volumes of greenhouse gas emission allowances to be auctioned in 2013-20 Proposal for a Directive of the European Parliament and of the Council amending Directive 2003/87/EC to
Directive 2009/29/EC of the European Parliament and of the Council of 23 April 2009 amending Directive 2003/87/EC so as to improve and extend the greenhouse gas emission allowance trading scheme of the Community.
Decision (EU) 2015/1814 of the European Parliament and of the Council of 6 October 2015 concerning the establishment and operation of a market stability reserve for the Union greenhouse gas emission trading scheme and amending Directive 2003/87/EC.
Senate of the Italian Republic, XVII Legislature (Doc. XXIV n. 79) Resolution of the meeting Committees 10th (Industry, commerce, tourism) 13th (Territory, environment, environmental assets) on the initiative of the Senators Dalla Zuana and Scalia, approved on August 1st, 2017
Senate of the Italian Republic, Legislature 17 Atto di Sindacato Ispettivo n ° 1-00593. Act No. 1-00593, Published June 21, 2016, in session no. 641.
Communication from the Commission “Guidelines on State aid for environmental protection and energy 2014-2020 (2014/C 200/01).
Trends and projections in Europe 2017. Tracking progress towards Europe’s climate and energy targets. EEA report no 17/2017.
Report on the functioning of the European carbon market. Report from the Commission to the European Parliament and the Council, Brussels, 23.11.2017 COM (2017) 693 final.
F. Scalia “L’accordo di Parigi e i “paradossi” delle politiche del Europa sul clima ed energia”. Diritto e giurisprudenza agraria alimentare e dell’ambiente, Numero 6 – 2016.
EU carbon price to average €23/t CO2 between 2021 and 2030: Thomson Reuters assess the future, https://blogs.thomsonreuters.com/financial-risk/commodities/eu-carbon-price-average-e23t-2021-2030-thomson-reuters-assess-future/
35 P. Krugman. The climate dominio, in www.nytimes.com, affirms that a carbon tariff would stimulate the decarbonisation process of China. 36This proposal has been the subject of a Resolution by the Italian Parliament: Doc. XXIV, n. 79 of the Senate Meeting Committees Production Activities and the Environment.
271
Nomisma Energia Cambiare il mercato della CO2 per decarbonizzare l’Europa e aumentare la competitività del sistema Italia, November 2016.
F. Valezano, In Europa il carbone uccide, ma la normativa lo permette, in QualEnergia.it, 27 October 2016. M. Pellegrino, EU ETS: riforme in corso e potenziali rischi, in Newsletter del GME n. 109 November 2017. M. Cafagno, Principi e strumenti di tutela dell’ambiente. Come sistema complesso, adattivo, comune, Torino,
2007, from page 425. M. Clarich, La tutela dell’ambiente attraverso il mercato, in Dir. pubbl. n. 1/2017, from page 219. A. Gerbeti, “CO2 nei beni e competitività industriale europea”, Milano, 2014, translated in English “A Symphony
for Energy” Milano 2015. T. Fanelli, “L’emissione in affanno”, in QualEnergia, no 2, 2014. P. Krugman. The climate dominio, in www.nytimes.com, June 5, 2014.
272
THE ELECTRICITY MARKET PRICE: VOLATILITY, PATTERN AND FORECAST ANALYSIS Kun Li and Joseph D. Cursio Abstract Electricity supply and demand have become an important topic related to economic development and environmental sustainability. The optimal resource allocation in the electricity market is tightly related to the investigation of calendar anomalies. This paper contributes to the discussion of calendar effects and their significance in the electricity market. We derive a powerful test for calendar specific anomalies, and assess the significance of the full universe of possible calendar effects. We implement our test to the PJM electricity market and assess the calendar effects in different time frequencies (Day-of-the-week, Hour-of-the-day, Month-of-the-year, Day-of-the-month and season). Our results show that calendar effects exist in every time frequency, and also specify those calendar effects with statistical significance. The assessment of calendar effects will help improve the market efficiency and environmental sustainability of the electricity market.
Overview The electricity market is widely viewed as the most difficultly balanced market between supply and demand (He and Victor, 2017; Yang, 2017). The consumption of electricity fluctuates along with various factors. Under this circumstance, the power generators, especially those with stable output, encounter more challenges in order to maintain an efficient supply. Such imbalance between power supply and demand are reflected by the high volatility of electricity prices. Previous studies observe the price swings in the electricity markets and claim that the price volatility is one of the distinct characteristics for electricity markets (Engle and Patton, 2001; Hadsell et al, 2004; Knittel and Roberts, 2005; Xiao et al 2014; Zareipour et al, 2007). Many studies focus on the extreme price records, and investigate the reason of the occurrence of these price records in the electricity market (Carlton, 1977; Crew and Kleindorfer, 1976; Hadsell and Shawky, 2006; Joskow and Wolfram, 2012; Nguyen, 1976; Spees and Lave, 2008; Wenders, 1976). Electricity supply and demand have become more and more important to support population growth, economic development and life standard improvement throughout the world (Cai et al., 2009). As a renewable energy, the use of electricity is not only a simple economic activity, but related to the circular economy and environmental sustainability (Murray et al, 2015). Therefore, to construct an electric power grid with low price volatility is not only an achievement of the market efficiency, but also the resource efficiency (Bilitewski, 2012; Yuan et al, 2006). In order to study the resource efficiency and market volatility in the electricity market, calendar effects will be a critical content. The aim of this study is to examine the significance of calendar effects in the electricity market. Calendar effect is a popular term appeared in empirical studies that investigate the anomalous movement of financial markets. In this study, we construct a powerful test and examine whether the calendar effects appear in the electric prices. To make our analyses accurate, we choose a big data analysis by using the real-time pricing (RTP) data from the wholesale Pennsylvania, New Jersey and Maryland (PJM) electricity market between 2013 and 2015. It includes over 12,000 transmission lines, and their RTP records update hourly and includes 26,280 hours (24 hours×365 days×3 years) for each transmission line. Since the universe of possible calendar effects is broad, the most effective way to establish whether a calendar effect is statistically significant, is to control for all possible calendar effects. In our empirical anlysis, we review the previous literature and summarize representative effects in different time frequencies (Day-of-the-week, Hour-of-the-day, Month-of-the-year, and Day-of-the-month). Our
273
results show that calendar effects exist in every time frequency. Our results also specify those calendar effects with statistical significance. The remainder of this paper is organized as follows. Section 2 introduces background information of calendar effects and the test. Section 3 describes the data. Section 4 presents results and implications of our test. Section 5 concludes. Selection of Calendar Effects This section presents the universe of possible calendar effects that we consider in our following analyses. In order to have a comprehensive investigation, we test possible calendar effects from diverse time frequencies, as described below. 1. Day-of-the-week: as we mentioned before, weekday/weekend effect is the most important and
widely-discussed calendar effect among related studies. In this study we consider effects from different days of the week. We include all the days and categorize them into seven groups, in order to evaluate the difference of price movement across days of the week.
2. Hour-of-the-day: in this study we include the 24 hour-of-the-day effects. Compared with previous traditional studies, this type of effects is new. As the advantage, our data updates hourly the electricity prices, which allows us to further observe and explore the price anomaly from an intraday perspective. In practice, we categorize price records by hours, and observe each hour’s price movement for the test of hour-of-the-day effects.
3. Month-of-the-year: we include the twelve month-of-the-year effects, to evaluate the difference of price movement across months.
4. Day-of-the-month: in order to test the intramonth effects, we include 31 day-of-the-month effects.
Data We use the dataset from the PJM electricity market. As a Regional Transmission Organization (RTO), PJM coordinates the movement of power within its region and is responsible for the operational and planning functions of the PJM bulk power system on behalf of participant members. In order to lower the energy costs of end users, the PJM system manages and coordinates competition among power suppliers located in multi-state service areas through establishing trading rules and protocols, as discussed by Bessembinder and Lemmon (2002), Geman and Roncoroni (2006), Longstaff and Wang (2004), and Seifert and Uhrig-Homburg (2007). Areas served by PJM are divided by the transmission lines which are referred to as the pricing nodes (Pnode). As a clearing house, PJM matches bids and offers and thus gives the market-clearing price for each service area. The market-clearing price is referred to as the locational marginal price (LMP) and updated hourly. LMP is the sum of the cost of energy, the marginal cost of transmission loss, and the marginal cost of congestion, which are the leading contributors to volatility in electricity prices. It represents the incremental value of an additional megawatt of power transported to a particular Pnode. Results We use the hourly LMP data between 2013 and 2015, which includes 26,280 hours (24 hours×365 days×3 years) for each Pnode. There are 12,350 Pnodes in this PJM dataset. Table 1 presents the descriptive statistics of LMPs. From 2013 to 2015, the overall PJM market has an average LMP equal to 38.56, and a standard deviation equal to 47.86. So the coefficient of variation is 1.24. Both the minimum and maximum of LMP are extreme values (-2,240 and 4,643), implying that the price in the electricity market has large volatility. Table 1 also presents the descriptive statistics of LMPs across the seven days of the week. We observe that the means of LMPs on Sunday (30.76) and Saturday (34.44) are below the overall average LMP, whereas those means of the remaining five days are above the overall average LMP. By contrast, Tuesday has the highest average LMP among the seven days (44.15). These results imply that the power demand on Tuesday is probably higher, while weekends are not time with high demand. Thus, the price anomaly may occur on Tuesdays more possibly than on weekends. Similarly,
274
the significant difference across days of the week is also observed on the coefficient of variation (CV). Tuesday has the highest value (1.80), while weekends have the lowest CVs (0.71 and 0.85), considered as low-variance. These results indicate that prices have small dispersion on weekends and have large dispersion and uncertainty on Tuesday. We continue to study the summary statistics in other time frequencies. From Figure 1 we can see the difference of average LMPs across hours more clearly. According to the means of LMPs, we find that on average the highest values are mostly located between Hour 18 (6pm) and Hour 21 (9pm), while lowest LMPs are usually located between Hour 24 (midnight) and Hour 5 (5am). As an inference, hour-of-the-day effects probably exist during the hours in the evening.
Figure 1: Mean of LMPs by Hour-of-the-day Next we observe LMPs from the monthly time level. From Figure 2, we find that January has the highest LMPs on average (59.07) among twelve months. Additionally, January also has the highest CV (2.01), which is far greater than the other eleven months. As an inference, there probably exist January effects in the price of electricity, which is consistent with Keim (1983), Reinganum (1983), Lakonishok and Smidt (1988), and Schwert (2002).
Figure 2: Mean of LMPs by Month
275
Finally, we observe LMPs by day-of-the-month. As described in Figure 3, we classify LMPs into 31 sections, corresponding to day 1 to day 31 of the month. We find that the average LMPs on Day 7 (54.24) is far greater than average LMPs on the other days. Furthermore, Day 7 also has the highest CV (2.64) among 31 days of the month, and its CV is almost twice as much as the second highest CV (1.56) on Day 24. The significant differences among these summary statistics across days of the month are symbols of potential calendar effects.
Figure 3: Mean of LMPs by Day-of-the-month In summary, we observe significance cross-sectional differences appeared in the summary statistics when we classify the electricity price in various time frequencies. These findings indicate that certain types of calendar effects exist in the electricity market. Empirical Results In this section, we test the significance of calendar effects on LMPs. Different from other markets, we observe negative electricity prices, implying that power generators may pay demanders to take electricity instead of lowering their output under some certain circumstances. The occurrence of negative prices is a symbol of price volatility, which may further lead to the existence of calendar effects. We apply the test method described in Section 2.2 to our PJM dataset, and investigate the calendar effects in different time frequencies listed in Section 2.3 (Day-of-the-week, Hour-of-the-day, Month-of-the-year, Season, and Day-of-the-month). To each time frequency level, we examine the hypothesis whether or not there are calendar specific anomalies across sections, as we described in Section 2. Table 2 presents the empirical test results for the performance of calendar effect in different time frequencies (Day-of-the-week, Hour-of-the-day, Month-of-the-year, Season, and Day-of-the-month). We start with the day-of-the-week. As described in Section 2.2, we test the null hypothesis that there are no calendar specific anomalies across the sections of days of the week. According to the p-value (<0.0001), the null hypothesis is rejected, indicating that calendar effects exist in the days of the week. The most significant calendar effects are among Tuesdays, Wednesdays and Mondays, three days of week with the highest average values of LMPs (44.15, 40.99 and 40.61 respectively). Our results indicate that in the electricity market, weekdays have larger calendar anomalies than weekends. It is different from the prevalent “weekend” effects in the financial market, as discussed by
276
French (1980), Harris (1986 a), Hawawini and Keim (1995), Rubinstein (2001). A potential reason is that the electricity market is a continuous market and has prices on electricity at any time; while stock markets have non-trading periods such as weekends, which makes the price movement between isolated trading periods convey more uncertainty. Second, our results also show the existence of calendar effects among 24 hours of the day. In Table 2, the p-value is still below 0.0001 and the null hypothesis is rejected again. The top three hours with the significant calendar effects are 6pm, 7pm and 8pm, with the top three average LMPs among 24 hours (49.35, 47.31 and 47.15). The results indicate that the calendar anomalies appear in the evening at a higher probability than in the other time of a day.
Third, we evaluate at the month level. The p-values of month-of-the-year and season are both below 0.0001, and show the existence of calendar effects across months and seasons. The top three months with the significant calendar effects are January, February and March, and their average LMPs are 59.07, 55.38 and 48.35 respectively. The similar result appears at the seasonal level. The winter season has the calendar effects during our test period, and the average LMP is 47.93. This finding is reasonable because during the winter a large amount of power is used for heating. The fluctuation of temperature is reflected by the change of power use and consequently the price volatility of electricity market.
Finally, the test at day-of-the-month level also show the existence of calendar effects. The top three days with the significant calendar effects are the 7th, 6th and 3rd day of the month. And their average LMPs are 54.24, 43.52 and 41.67 respectively. The results suggest that the calendar anomalies occur at the beginning of a month with a larger probability.
In summary, our results show that the calendar anomalies exist in different time frequencies. These hours, days and months with anomalies are significant, and display larger average values and volatilities than the remaining. Conclusions The operation of an electric power grid is a constant balancing act. According to the property of the electric power, maintaining a stable price level is not only the requirement of the electricity market efficiency, but also the requirement of the sustainability. The time-series movement of electric prices indicate the instant change between power supply and demand in the market. In order to improve the market efficiency and environmental sustainability, the assessment of the price volatility in the electricity market is a critical point. Therefore, we focus on calendar effect, the cyclical anomalies related to the calendar and classified as persistent cross-sectional and time series patterns in prices. We introduce a powerful test to assess the significance of calendar effects. In order to find the calendar effects with significant patterns, we include all possible effects in diverse time frequencies, including hourly, daily, monthly and seasonal frequencies. We use a PJM dataset including hourly updated prices for over 12,000 transmission lines during 3 calendar years. Our results indicate that significant calendar effects exist in every time frequency that we assess. First, we find significant effects among Tuesdays, Wednesdays and Mondays, implying that the electric consumption has “weekday effect”. Second, we find that at the hourly level, significant calendar effects appear in the evening (6pm to 8 pm), which is consistent to the peak load hours of a day. Third, at the monthly level, the top three months with the significant calendar effects and highest average LMPs are January, February and March. This result is equivalent to the result at the seasonal level, which find winter with the significant calendar effect. Finally, we observe that calendar anomalies appear at the beginning of a month with a larger probability than at the other days of a month.
277
References Aitken, M., et al., 1995. An Intraday Analysis of the Probability of Trading on the ASX at the Asking Price.
Australian Journal of Management. Ariel, R.A., 1990. High Stock Returns before Holidays: Existence and Evidence on Possible Causes, the Journal
of Finance, Vol. 45, No. 5. (Dec., 1990), pp. 1611-1626. Balijepalli, M., et al., 2011. Review of Demand Response under Smart GridParadigm. IEEE PES Innovative Smart
Grid Technologies, India. Bilitewski, B., 2012. The circular economy and its risks. Waste Manag. 32, 1-2,
http://dx.doi.org/10.1016/j.wasman.2011.10.004 . Cadsby, Charles Bram and Mitchell Ratner, 1992. Turn-of-month and pre-holiday effects on stock returns: Some
international evidence, Journal of Banking & Finance, Volume 16, Issue 3, June 1992, Pages 497-509. Carlton, D. W.. (1977). Peak Load Pricing with Stochastic Demand. The American Economic Review, 67(5),
1006–1010. Retrieved from http://www.jstor.org/stable/1828086 Chang, Y. and S. Tarlor, 1998. Intraday effects of central bank intervention by the bank of Japan. Journal of
International Money and Finance. Copeland, L. and S.A. Jones, 2002. Intradaily Patterns in the Korean Index Futures Market. Asian Economic
Journal. Crew, M. A., & Kleindorfer, P. R.. (1976). Peak Load Pricing with a Diverse Technology. The Bell Journal of
Economics, 7(1), 207–231. http://doi.org/10.2307/3003197 Cross, F. (1973), ‘The behavior of stock prices on Fridays and Mondays’, Financial Analysts Journal 29, 67–69. French, Kenneth R., 1980. Stock Returns and the Weekend Effect, Journal of Financial Economics, Volume 8,
Issue 1, March 1980, Pages 55-69. Gibbons, M. R. & Hess, P. (1981), ‘Day of the week effect and assets return’, Journal of Business54, 579–596. Hadsell, L., Marathe, A., and Shawky, H. A. “Estimating the volatility of wholesale electricity spot prices in the
US”. The Energy Journal, 2004. Vol. 25 Issue 4, 23-40. Hadsell, L., and Shawky, H. A. “Electricity price volatility and the marginal cost of congestion: An empirical
study of peak hours on the NYISO market, 2001-2004”. The Energy Journal. 2006. Vol. 27 Issue 2, 157-179. Hansen, P. R., Lunde, A., & Nason, J. M. (2005). Testing the Significance of Calendar Effects. Federal Reserve
Bank of Atlanta, Working Paper Series, 2005(2). Harris, Lawrence, 1986 a. A transaction data study of weekly and intradaily patterns in stock returns, Journal of
Financial Economics, Volume 16, Issue 1, May 1986, Pages 99-117. Harris, L., 1986 b. How to profit from intradaily stock returns. Journal of Portfolio Management. Harris, L., 1989. A Day-End Transaction Price Anomaly, The Journal of Financial and Quantitative Analysis,
Vol. 24, No. 1. (Mar., 1989), pp. 29-45. Hawawini, , G. and D.B. Keim, 1995. On the predictability of common stock returns: World-wide evidence. In:
Handbooks in Operations Research and Management Science, Volume 9, Finance, pages 497-544. He, Gang, and David G. Victor. "Experiences and lessons from China’s success in providing electricity for
all." Resources, Conservation and Recycling 122 (2017): 335-338. Hensel, Chris R. and William T. Ziemba, 1996. Investment results from exploiting turn-of-the-month effects
(Digest Summary). Journal of Portfolio Management, Vol. 22, No. 3: (1996)17-23. Jaffe, J. & Westerfield, R. (1985), ‘The weekend in common stock returns: The international evidence’, Journal of
Finance 40, 433–454. Joskow, Paul L., and C. D. Wolfram. “Dynamic Pricing of Electricity.” American Economic Review 2012. Vol.
102, Issue 3. 381-385. Keim, Donald B., 1983. Size-related anomalies and stock return seasonality : Further empirical evidence, Journal
of Financial Economics, Volume 12, Issue 1, June 1983, Pages 13-32. Keim, D. B. & Stambaugh, R. F. (1983), ‘A further investigation of the weekend effect in stock returns’, Journal
of Finance 39, 819–835. Kim, Chan-Wung and Jinwoo Park, 1994. Holiday Effects and Stock Returns: Further Evidence, the Journal of
Financial and Quantitative Analysis, Vol. 29, No. 1. (Mar., 1994), pp. 145-157. Knittel, Christopher R., and M. R. Roberts. “An empirical examination of restructured electricity prices.” Energy
Economics2005. 27.5. 791–817. Lakonishok, J. & Levi, M. (1980), ‘Weekend effects on stock returns: A note’, Journal of Finance 37. Lakonishok, J. & Smidt, S. (1988), ‘Are seasonal anomalies real? A ninety-year perspective’, Review of Financial
Studies 1, 403–425. Meneu, Vicente and Angel Pardo, 2004. Pre-holiday Effect, Large Trades and Small Investor Behaviour, Journal
of Empirical Finance, Volume 11, Issue 2, March 2004, Pages 231-246. Murray, A., Skene, K., Haynes, K., 2015. The circular economy: an interdisciplinaryexploration of the concept
and application in a global context. J. Bus. Ethics, http://dx.doi.org/10.1007/s10551-015-2693-2. Nguyen, D. T.. (1976). “The Problems of Peak Loads and Inventories. The Bell Journal of Economics, 7(1), 242–
248”. http://doi.org/10.2307/3003199
278
Ogden, J.P., 1990. Turn-of-month evaluations of liquid profits and stock returns: A common explanation for the monthly and January effects, The Journal of Finance, Vol. 45, No. 4. (Sep., 1990), pp. 1259-1272.
Penman, Stephen H., 1987. The distribution of earnings news over time and seasonalities in aggregate stock returns, Journal of Financial Economics, Volume 18, Issue 2, June 1987, Pages 199-228.
Reinganum, Marc R., 1983. The anomalous stock market behavior of small firms in January: Empirical tests for tax-loss selling effects, Journal of Financial Economics, Volume 12, Issue 1, June 1983, Pages 89-104.
Rogalski, R. J. (1984), ‘New findings regarding day-of-the-week returns over trading and nontrading periods: a note’, Journal of Finance 39, 1603–1614.
Rubinstein, M., 2001. Rational Markets: Yes or No? The Affirmative Case, Financial Analysts Journal, volume 57, number 3 (May/June), pages 15-29.
Schwert, G. William, 2002. Anomalies and Market Efficiency, Handbook of the Economics of Finance, pages 937-972.
Spees, Kathleen, and L. Lave. “Impacts of Responsive Load in PJM: Load Shifting and Real Time Pricing.” Energy Journal. 2008. Vol. 29 Issue 2.101-122.
Thaler, R.H., 1987. Seasonal Movements in Security Prices II: Weekend, Holiday, Turn of the Month and Intraday Effects. Journal of Economic Perspectives.
Wenders, J. T.. (1976). Peak Load Pricing in the Electric Utility Industry. The Bell Journal of Economics, 7(1), 232–241. http://doi.org/10.2307/3003198
Xiao, Yuewen, D. B. Colwell, and R. Bhar. “Risk Premium in Electricity Prices: Evidence from the PJM Market.” Journal of Futures Markets. 2014. Vol. 35:776-793.
Yang, Chi-Jen. "Opportunities and barriers to demand response in China." Resources, Conservation and Recycling (2015).
Yuan, Z., Bi, J., Moriguichi, Y., 2006. The circular economy: a new development strategy in China. J. Ind. Ecol. 10, 4–8.
Zareipour, Hamidreza, K. Bhattacharya, and C. A. Cañizares. “Electricity market price volatility: The case of Ontario.” Energy Policy. 2007. Vol. 35 Issue 9. 4739–4748.
279
ANALYTICAL INDEX Abstracts index by Presenter
Allard, Stéphane Long-term transmission capacity planning in a scenario with high share of variable renewable energies Stéphane Allard, Silvana Mima, Vincent Debusschere, Tuan Tran, Patrick Criqui, Nouredine Hadj-Saïd (p. 145)
Ascari, Sergio Modelling the cost of gas supply outages and their substitution as a way of assessing Security of Supply Measures Sergio Ascari (p. 71)
Bollino, Carlo Andrea Environmental and energy efficiency analysis of EU electricity industry: An almost spatial two stages DEA approach Carlo Andrea Bollino, Simona Bigerna, Maria Chiara D'Errico e Paolo Polinori (p. 35)
Buckley, Penelope
Incentivizing households to reduce electricity consumption: a meta-analysis of the experimental evidence Penelope Buckley (p.114)
Camporeale, Cecilia IT-DAMEE: a regional application to assess the macro-effect of RDP fund in Emilia Romagna Cecilia Camporeale Roberto Del Ciello (p. 53)
Carrino, Gianluca Carbon tax, EU ETS versus charge on emissions Gianluca Carrino (p.24) - full paper on p. 199
Chou, Kuei-Lan Constructing a Taiwan’s energy security analysis of liquefied nature gas by system dynamic model Kuei-Lan Chou (p. 128)
Chyong, Chi-Kong The Economics of Gazprom’s gas export strategies to Europe Chi-Kong Chyong (p. 28)
Clò, Stefano Imbalances and market rules in Italian wholesale electricity market Stefano Clò, Angelica Gianfreda (p. 41)
Colonna, Nicola Assessing the role of innovative farming techniques to reduce energy consumption and carbon emission Nicola Colonna, Stefano Lo Presti (p. 55)
D’Alessandro, Simone 2METE: An Ecological Macroeconomic Model for Energy Transition. Alternative Scenarios Towards Ecological Sustainability and Social Equity Simone D’Alessandro (p. 98)
De Santis, Lorenzo The European Energy Policy on Renewable Sources and its Consequences on Member States Lorenzo De Santis (p. 153)
Dees, Philip Feed-in-tariff, quota obligation and tenders for renewable support: Comparison with regard to innovation, investment incentives and strategic behavior Philip Dees (p. 140)
Dell’Olio, Giuseppe
Energy Efficiency in buildings: a simple but accurate way to perform calculations Giuseppe Dell’Olio (p. 37)
Dell’Olio, Giuseppe
Energy storage in wind turbines: a strategic contribution to energy security Giuseppe Dell’Olio (p.70)
D'Errico, Maria Chiara The Ideal Competitive Electricity Market. a simulation for Italy Carlo Andrea. Bollino, Simona Bigerna, Maria Chiara D'Errico, Paolo Polinori (p. 83)
280
Devogelaer, Danielle
Increasing interconnections in a small, open ecoomy: a quantitative evaluation Danielle Devogelaer (p. 1)
Di Porto, Fabiana
Algorithmic regulation: the case of information disclosure - Special session on Cognitive-based regulation for consumers empowerment (p. 15)
Du, Huibin Mapping carbon emissions embodied in inter-regional trade of China: final goods, intermediate goods and value chain Huibin Du, Zengkai Zhang (p. 104)
Fabbri, Fabrizio The revision of EU climate energy policies in the context of the Paris Agreement Fabrizio Fabbri (p. 69) - full paper on p. 226
Felling, Tim Jonathan Evaluation of risks for power plant operators through reconfiguration of price zones in extended Central Western Europe Tim Jonathan Felling, Caroline Deilen, Robin Leisen, Christoph Weber (p. 148)
Fumagalli, Elena Demand participation in electricity balancing markets Elena Fumagalli, Bastian Westbrock (p. 44)
Gerbeti, Agime EU ETS 2021-2030 – A too much ambitious directive Agime Gerbeti, Francesco Scalia (p. 137) - full paper on p. 258
Ghatak, Himadri Roy
Lignocellulosic biorefineries as replacement of fossils Himadri Roy Ghatak (p. 74) - full paper on p. 234
Glorioso, Elisabetta The Italian Electric System in the light of European energy policies Glorioso, Elisabetta (p. 155)
González Ventosa, Cristina Influence of interconnections on market prices - Spanish case of study María Sonsoles Madejon Concejal; Luis Villafruela Arranz, Ana Isabel Abril Pérez (p. 3 )
Hafner, Manfred Energy World in 2040: a scenario approach Manfred Hafner (p. 100)
Herbes, Carsten Factors influencing prices for heat from biogas plants Carsten Herbes, Verena Halbherr, Lorenz Braun (p. 76)
Hipólito Leal, Patrícia The impact of economic growth on the CO2 emissions in Australia: environmental Kuznets curve and decoupling index António Cardoso Marques, Patrícia Hipólito Leal, José Alberto Fuinhas (p. 121)
Iannotti, Mario Carbon pricing instruments for implementing the objectives of the Paris agreement Mario Iannotti (p. 65)
Kaninia, Maria Spot trading profits of energy storage systems in the region covered by EPEX SPOT Maria Kaninia (p. 73)
Kreuz, Sebastian
Pricing characteristics in the German diesel fuel market after the introduction of the market transparency scheme Sebastian Kreuz (p.32)
Leal Hipólito, Patrícia
Economic growth, CO2 emissions, fossil fuels consumption and renewable energy consumption in Australia António Cardoso Marques, José Alberto Fuinhas, Patrícia Hipólito Leal (p. 105)
Li, Kun The electricity market price: volatility, pattern and forecast analysis Kun Li, Joseph D. Cursio (p. 150) - full paper on p. 269
López Soto, David The evolution of price and income elasticities of electricity demand in Latin American countries: a time varying parameter approach David López Soto, Rodrigo Nicolás Aragón Salinas (p. 119)
281
Makridou, Georgia The financial performance of firms under the EU Emissions Trading Scheme (EU ETS) Georgia Makridou, Michael Doumpos, Kostas Andriosopoulos, Emilios Galariotis (p. 22)
Mantulet, Gabin Arbitrations for bioenergy use in the 21st century energy context: the significance of gasification and methanisation Gabin Mantulet, Adrien Bidaud, Silvana Mima (p. 78)
Martín-Moreno, José Maria Curbin carbon emissions: is a carbon tax the most efficient levy? José Maria Martín-Moreno, Jorge Blázquez, Rafaela Pérez, Jesús Ruiz (p. 108)
Mastropietro, Paolo Critical analysis of the “new” Italian capacity remuneration mechanism Fulvio Fontini, Pablo Rodilla, Carlos Batlle (p. 4)
McCoy, Daire The longer term effects of home energy efficiency investments Daire McCoy, Antoine Dechezlepretre, Francois Cohen (p. 38)
McKenna, Russell Securing local energy supply through municipal energy autonomy: assessing the feasibility of increased district heating from German biogas plants Russell McKenna, Jann Weinand, Lorenz Braun, Carsten Herbes (p. 81)
Menges, Roland
Using sticks or carrots to promote energy efficiency – how do individuals react? Results of an experimental investigation Roland Menges (p. 8)
Menu, Alex The electric system at the time of choices : an ecosystem that creates value for France (p. 152) Alex Menu
Misund, Bård
Evaluation of oil & gas firms’ financial performance: cash flows vs. accounting earnings Bård Misund (p. 58) - full paper on p. 212
Mittone, Luigi
Feedback and efficient behavior - Special session on Cognitive-based regulation for consumers empowerment (p. 15)
Moretti, Gaia Electricity grid evolution in Europe pre-access Countries: the Turkish case Gaia Moretti (p. 85)
Nikoloudakis, George Air pollution externalities in Greek ports and airports George Nikoloudakis, Spiros Papaefthimiou (p. 124)
Osmundsen, Petter Capital rationing. A threat to energy security Petter Osmundsen, Magne Emhjellen (p. 130)
Parisio Visconti, Lucia The RES-Induced switching effect across fossil fuels: an analysis of day-ahead and balancing prices Lucia Visconti Parisio, Angelica Gianfreda, Matteo Pelagatti (p. 47)
Piacentini, Alessandro Big Data and Cloud Computing technologies applied to the energy sector: from buzzwords to market optimization through an SaaS solution Alessandro Piacentini (p. 90)
Pinzone, Alessio The blockchain challenge for the electricity system Alessio Pinzone, Fabrizio Armani (p. 87)
Poletti, Clara
How to improve the functioning of electricity retail markets: push or pull? - Special session on Cognitive-based regulation for consumers empowerment (p. 15)
Purica, Ionut Energy volatilities and the cost of security Ionut Purica (p. 110)
Rangone, Nicoletta Special session on Cognitive-based regulation for consumers empowerment (p. 15)
282
Reiter, Ulrich Contracting the Gap: Empirical evidence on the role of energy performance contracting to promote investment in energy efficiency Sandra Klinke, Mehdi Farsi, Martin Jakob, Ulrich Reiter (p. 13) - full paper on pag. 159
Romeri, Mario Valentino Considering Hydrogen Fuel Cells Powertrain as Power Generation Plant - 2017 review Mario Valentino Romeri (p. 93) - full paper on p. 251
Sapio Alessandro Quantile merit order effects and network upgrades Alessandro Sapio (p. 49)
Scarpa, Carlo Is energy efficiency efficient for the European market? Carlo Scarpa, Giovanna Landi (p. 11)
Schumann, Diana Similarities and Differences in Views on Energy Security. A Comparison of Public and Stakeholder Perceptions in Germany Diana Schumann, Sophia Dieken (p. 133)
Scorsoni, Valeria European Issues and trends of regulation Valeria Scorsoni (p. 17)
Shahzad, Syed J. Hussain Asymmetric risk spillovers between oil and agricultural commodities Syed Jawad Hussain Shahzad (p. 57)
Shokripour, Mona Natural Gas Market Prediction via Statistical and Neural Network Methods Mona Shokripour (p. 60)
Soroush, Golnoush Impacts of Prosumers on DSO Investments: Updating Tariff Structures Golnoush Soroush, Carlo Cambini (p. 116)
Sorrentino, Nicola Imbalances costs of small scale renewable not dispatchable power plants in the Italian electricity market Nicola Sorrentino, Daniele Menniti, Anna Pinnarelli (p. 51)
Spindler, Christian Investigation of Advantages from Future Integration of Wind Electricity in EU Christian Spindler, Yuri Yegorov, Franz Wirl, Ondrisek Thomas (p. 7)
Stagnaro, Carlo Managing the liberalization of Italy’s retail electricity market: a policy proposal Carlo Stagnaro, Carlo Amenta, Giulia Di Croce, Luciano Lavecchia (p. 88) - full paper on p. 238
Stefani, Silvana
Financial instruments to mitigate the risk of climate change: rainfall and temperature Silvana Stefani, Enrico Moretto, Matteo Parravicini, Simone Cambiaghi, Adeyemy Sonub, Gleda Kutrolli (p. 63)
Stolyarova, Elena Evaluating the Implication of COP21 for Energy Security at Member State and EU Level Elena Stolyarova, Sandrine Mathy, Silavana Mima (p. 20)
Teotónio, Carla Assessing the economic impacts of climate change on competition for water resources in the framework of the water-energy nexus: a hybrid general equilibrium approach for Portugal Carla Teotónio, Miguel Rodriguez-Mendez, Peter Roebeling, Patrícia Fortes da Silva
Troise, Raffaele Forecasting models for short and long term gas price Raffaele Troise, Claudio Pregagnoli, Claudio Dicembrino, Michele Frate (p. 34)
Vespucci, Maria Teresa Estimation of Bidding Curves for Active Distribution Networks Maria Teresa Vespucci, Paolo Pisciella, Giacomo Viganò, Marco Rossi, Diana Moneta (p. 143)
283
Vetrò, Francesco Energy consumer empowerment in Italy - Special session on Cognitive-based regulation for consumers empowerment (p. 15)
Vogler, Arne Forecasting the distributions of hourly electricity spot prices Arne Vogler, Christian Pape, Oliver Woll, Christoph Weber (p. 102)
Waterworth, Alec The current and future role of natural gas in China Alec Waterworth, Michael J. Bradshaw (p. 26)
Weissenbacher, Manfred
The environmental impact of photovoltaic panels imported from China compared to Germany in a central Mediterranean setting Manfred Weissenbacher (p. 67)
Papers index by Author Carrino, Gianluca Carbon tax, EU ETS versus charge on emissions
Gianluca Carrino (p. 199)
Dell’Olio, Giuseppe Energy Efficiency in buildings: a simple but accurate way to perform calculations Giuseppe Dell’Olio (p.226)
Fabbri, Fabrizio EU 2030 climate energy policy Fabrizio Fabbri (p. 228)
Gerbeti, Agime EU ETS 2021-2030 – A too much ambitious directive Agime Gerbeti, Francesco Scalia (p. 261)
Ghatak, Himadri Roy Lignocellulosic biorefineries as replacement of fossils Himadri Roy Ghatak (p. 236)
Li, Kun The electricity market price: volatility, pattern and forecast analysis Kun Li, Joseph D. Cursio (p. 272)
Misund, Bård Evaluation of oil & gas firms’ financial performance: cash flows vs. accounting earnings Bård Misund (p. 212)
Reiter, Ulrich,
Contracting the Gap: Empirical evidence on the role of energy performance contracting to promote investment in energy efficiency. Reiter, Ulrich, Sandra Klinke, Mehdi Farsi, Martin Jakob (p. 159)
Romeri , Mario Valentino
Considering Hydrogen Fuel Cells Powertrain as Power Generation Plant - 2017 review Mario Valentino Romeri (p. 254)
Stagnaro, Carlo Managing the liberalization of Italy’s retail electricity market: a policy proposal Carlo Stagnaro, Carlo Amenta, Giulia Di Croce, Luciano Lavecchia (p. 241)


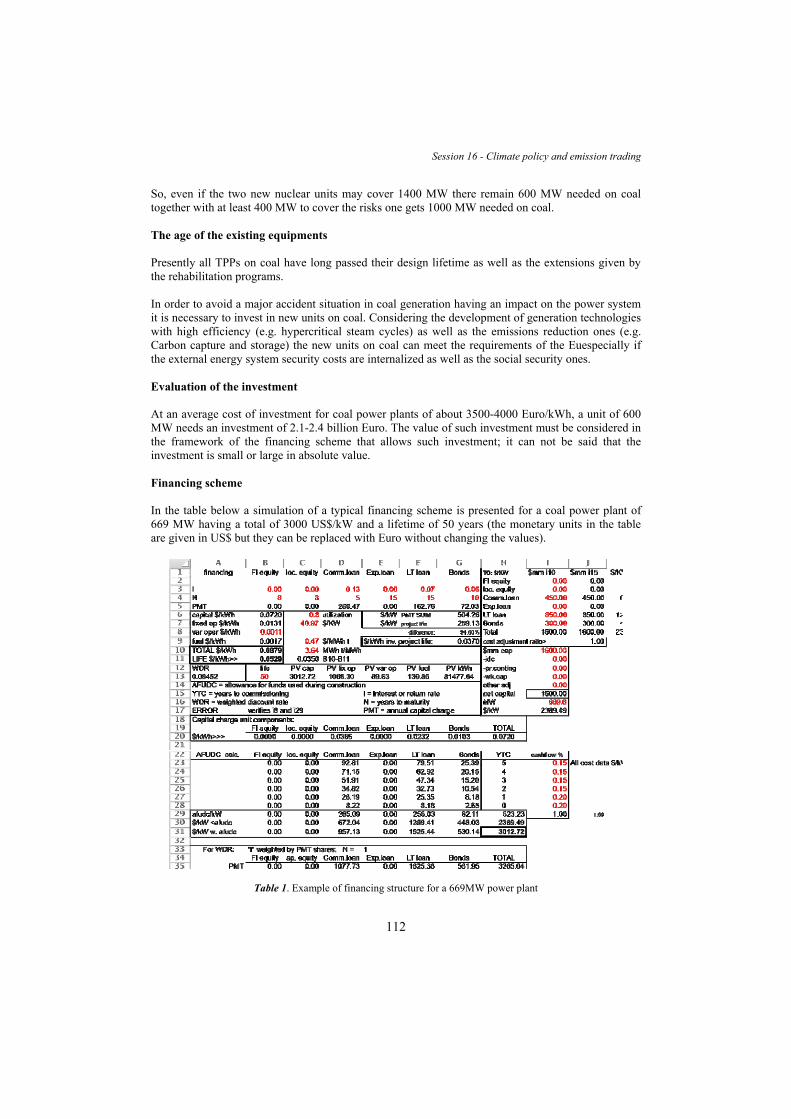


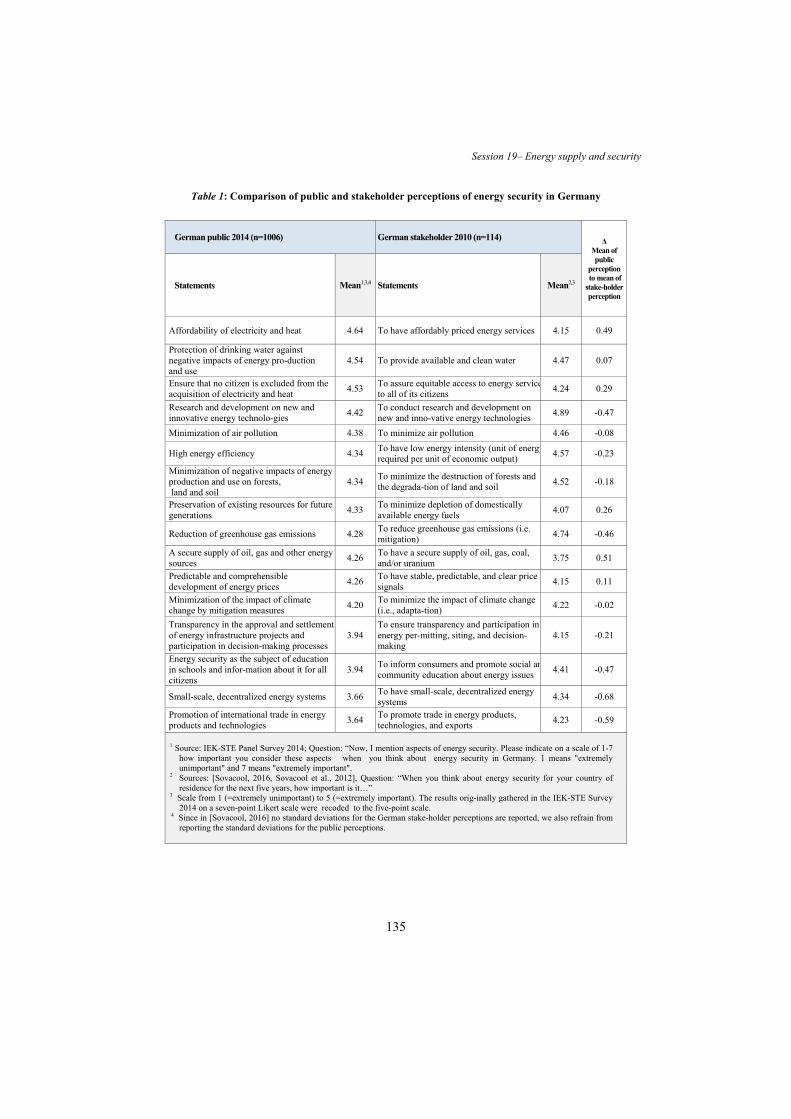


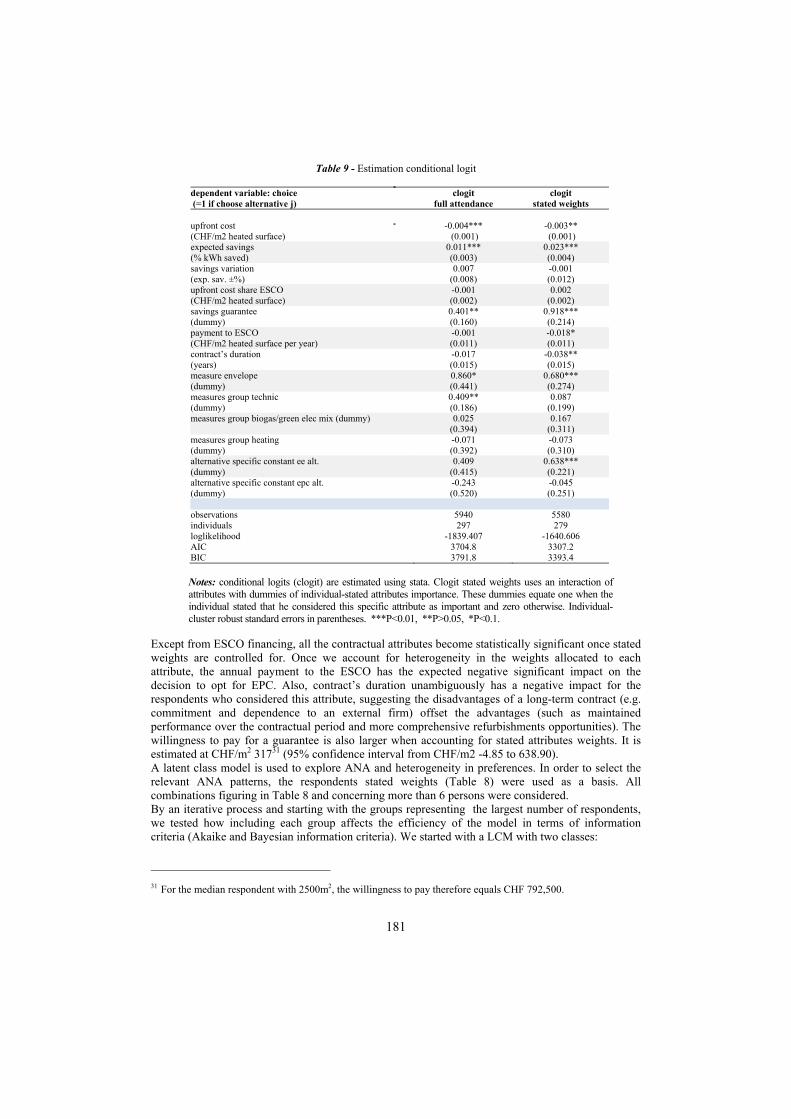


![Sindrom Koroner Akut IMELS [Compatibility Mode]](https://static.documents.pub/doc/80x56/5695d0cc1a28ab9b0293ee42/sindrom-koroner-akut-imels-compatibility-mode.jpg)


