What is inflation? Inflation is an increase in the average price level. Negative Impact of Inflation on households e.g Savers and holders of monetary wealth – the real value of their savings / monetary wealth falls - with high inflation the purchasing power of their money falls as it is unable to buy as much as before. Also the real interest rate that they receive falls – if interest rate is 6% and inflation is 6% then real interest rate is 0% People with fixed incomes or incomes that rise at a slower rate than in inflation + explanation. Inequality increases – low income families worse off, beneficiaries worse off + explanation why. Fiscal Drag - + explanation of what this is. Negative Impact on Producers – Firms trading internationally – if NZ’s inflation rate is high then NZ’s cost of production will be increasing faster than our overseas competitors – this means that the prices of our commodities are rising faster and so NZ producers become less competitive, this will lead to a decline in sales of NZ producer goods. Exports fall as NZ producers sell less overseas and imports rise as NZ imports cheaper overseas made products. Investment is more expensive as interest rates increase + explanation. Market signals are distorted as investors speculate + explanation. Difficult to plan for future + explanation. Costs of production increase as nominal wages rise + explanation. Causes of Inflation: Demand Pull Inflation. Caused by an increase in AD. PL Yf AS Ple2 PLe AD2 AD Output/ RGDP / Y Ye Ye2 An increase in AD caused by and increase in C – consumption, I – Investment, (x-m) - Net exports. + explanation of this. Causes of Inflation: Cost Push Inflation. Caused by an decrease / shift left in AS. Yf AS2 PL AS PLe2 PLe AD Ye2 Ye Ouput / RGDP/Y Nominal Wages: are likely to rise in response to worker efforts to increase or maintain standards of living. Increases in nominal wages cause cost push inflation. Import Prices: import prices change in response to exchange rate changes and inflationary pressure overseas. A depreciation of the NZ$ can cause imported raw material costs to increase. Productivity: rises through improved technology use of capital goods. A fall in productivity can cause cost push inflation. Production Costs: Any factor that causes a change in the cost of production for a large number of firms such as an increase in the cost of electricity, stricter government regulations, increase in GST, environmental taxes or company taxes.icter government regulations, increase in GST, Causes of inflation. MV = PQ X If the economy is producing near fully capacity then any increase in M or V will have an impact on the price level as Q (output) cannot change much. + explanation. Current Definition of price stability. This is defined between the government and the RBNZ through the Policy Targets Agreement. Price stability is currently defined as keeping the rate if inflation as measured by the CPI between 1 and 3% Price stability is considered important to try and stop the negative effects of inflation such as - Inflationary expectations. - Make it easier for business planning and business confidence. - help NZ products to remain competitive. - help make investment by firms more likely. Control Of Inflation in NZ This done by the RBNZ through two main methods. - the OCR (Official Cash Rate) - OMO (Open Market Operations) The OCR is the interest rate set by the RBNZ An increase in the OCR or the selling of Reserve Banks Bonds will influence the Money Supply to decrease. r MS2 MS r2 r MD Q2 Q1 Q So OCR rw retail interest rates. So Savings , Borrowing Consumption Investment Value of NZ$ SNZ$2 NZ$ in US$ SNZ$ PNZ$2 PNZ$ DNZ$2 DNZ$ Qe Qe2 Q Increase demand and decrease supply NZ$ + explanation. Appreciation of NZ $ so Exports (X) decrease. Imports (M) Increase. Decrease in Net Exports (X-M) This causes a decrease in AD and increase AS. PL Yf AS AS2 PLe PLe2 AD AD2 Ye2 Ye Output / RGDP/ Y So increase in OCR / Selling Reserve Banks Bills causes AD to fall from AD to AD2 which will cause a decrease in the rate of inflation – reducing the inflation rate from PLe to PLe2 Negative Impacts Fall in exports as NZ products become more expensive. Increase unemployment. Decrease growth. Decrease in investment so no new capital and not replacing old capital. Inequality may increase. + explanation of these.
Transcript
What is inflation?
Inflation is an increase in the average price level.
Negative Impact of Inflation on households e.g
Savers and holders of monetary wealth – the real
value of their savings / monetary wealth falls - with
high inflation the purchasing power of their money
falls as it is unable to buy as much as before. Also the
real interest rate that they receive falls – if interest
rate is 6% and inflation is 6% then real interest rate is
0%
People with fixed incomes or incomes that rise at a
slower rate than in inflation + explanation.
Inequality increases – low income families worse off,
beneficiaries worse off + explanation why.
Fiscal Drag - + explanation of what this is.
Negative Impact on Producers –
Firms trading internationally – if NZ’s inflation rate is
high then NZ’s cost of production will be increasing
faster than our overseas competitors – this means
that the prices of our commodities are rising faster
and so NZ producers become less competitive, this will
lead to a decline in sales of NZ producer goods.
Exports fall as NZ producers sell less overseas and
imports rise as NZ imports cheaper overseas made
products.
Investment is more expensive as interest rates
increase + explanation.
Market signals are distorted as investors speculate +
explanation.
Difficult to plan for future + explanation.
Costs of production increase as nominal wages rise +
explanation.
Causes of Inflation:
Demand Pull Inflation.
Caused by an increase in AD.
PL Yf AS
Ple2
PLe AD2
AD
Output/ RGDP / Y
Ye Ye2
An increase in AD caused by and increase in
C – consumption, I – Investment, (x-m) - Net exports.
+ explanation of this.
Causes of Inflation:
Cost Push Inflation.
Caused by an decrease / shift left in AS.
Yf AS2
PL AS
PLe2
PLe
AD
Ye2 Ye Ouput / RGDP/Y
Nominal Wages: are likely to rise in response to worker efforts to
increase or maintain standards of living. Increases in nominal
wages cause cost push inflation.
Import Prices: import prices change in response to exchange rate
changes and inflationary pressure overseas. A depreciation of the
NZ$ can cause imported raw material costs to
increase.
Productivity: rises through improved technology use of capital
goods. A fall in productivity can cause cost push inflation.
Production Costs: Any factor that causes a change in the cost of
production for a large number of firms such as an increase in the
cost of electricity, stricter government regulations, increase in
GST, environmental taxes or company taxes.icter
government regulations, increase in GST,
environmental taxes or company taxes.
Causes of inflation.
MV = PQ
X
If the economy is producing near fully capacity then any
increase in M or V will have an impact on the price level as
Q (output) cannot change much.
+ explanation.
Current Definition of price stability.
This is defined between the government and the RBNZ
through the Policy Targets Agreement.
Price stability is currently defined as keeping the rate if
inflation as measured by the CPI between 1 and 3%
Price stability is considered important to try and stop the
negative effects of inflation such as
- Inflationary expectations.
- Make it easier for business planning and business
confidence.
- help NZ products to remain competitive.
- help make investment by firms more likely.
Control Of Inflation in NZ
This done by the RBNZ through two main methods.
- the OCR (Official Cash Rate)
- OMO (Open Market Operations)
The OCR is the interest rate set by the RBNZ
An increase in the OCR or the selling of Reserve Banks
Bonds will influence the Money Supply to decrease.
r MS2 MS
r2
r
MD
Q2 Q1 Q
So OCR rw retail interest rates.
So Savings , Borrowing Consumption
Investment
Value of NZ$ SNZ$2
NZ$ in US$ SNZ$
PNZ$2
PNZ$
DNZ$2
DNZ$
Qe Qe2 Q
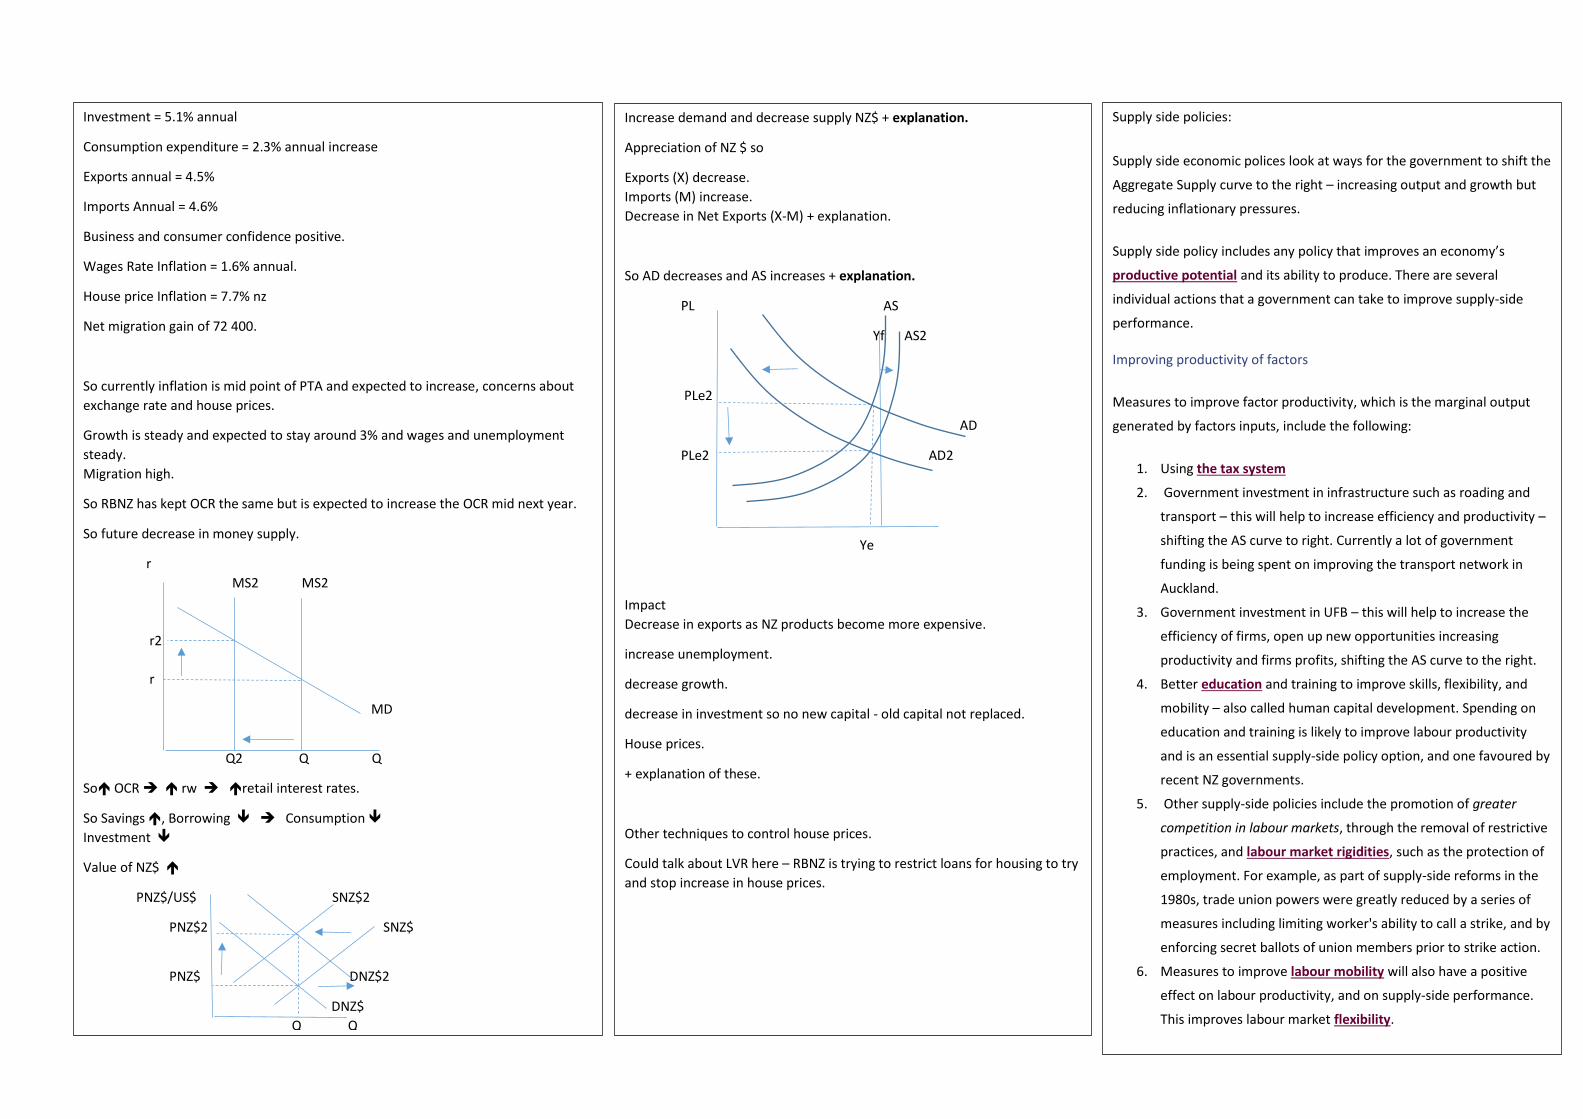
Increase demand and decrease supply NZ$ + explanation.
Appreciation of NZ $ so
Exports (X) decrease.
Imports (M) Increase.
Decrease in Net Exports (X-M)
This causes a decrease in AD and increase AS.
PL Yf AS AS2
PLe
PLe2 AD
AD2
Ye2 Ye Output / RGDP/ Y
So increase in OCR / Selling Reserve Banks Bills causes AD to
fall from AD to AD2 which will cause a decrease in the rate
of inflation – reducing the inflation rate from PLe to PLe2
Negative Impacts
Fall in exports as NZ products become more expensive.
Increase unemployment.
Decrease growth.
Decrease in investment so no new capital and not replacing
old capital.
Inequality may increase.
+ explanation of these.
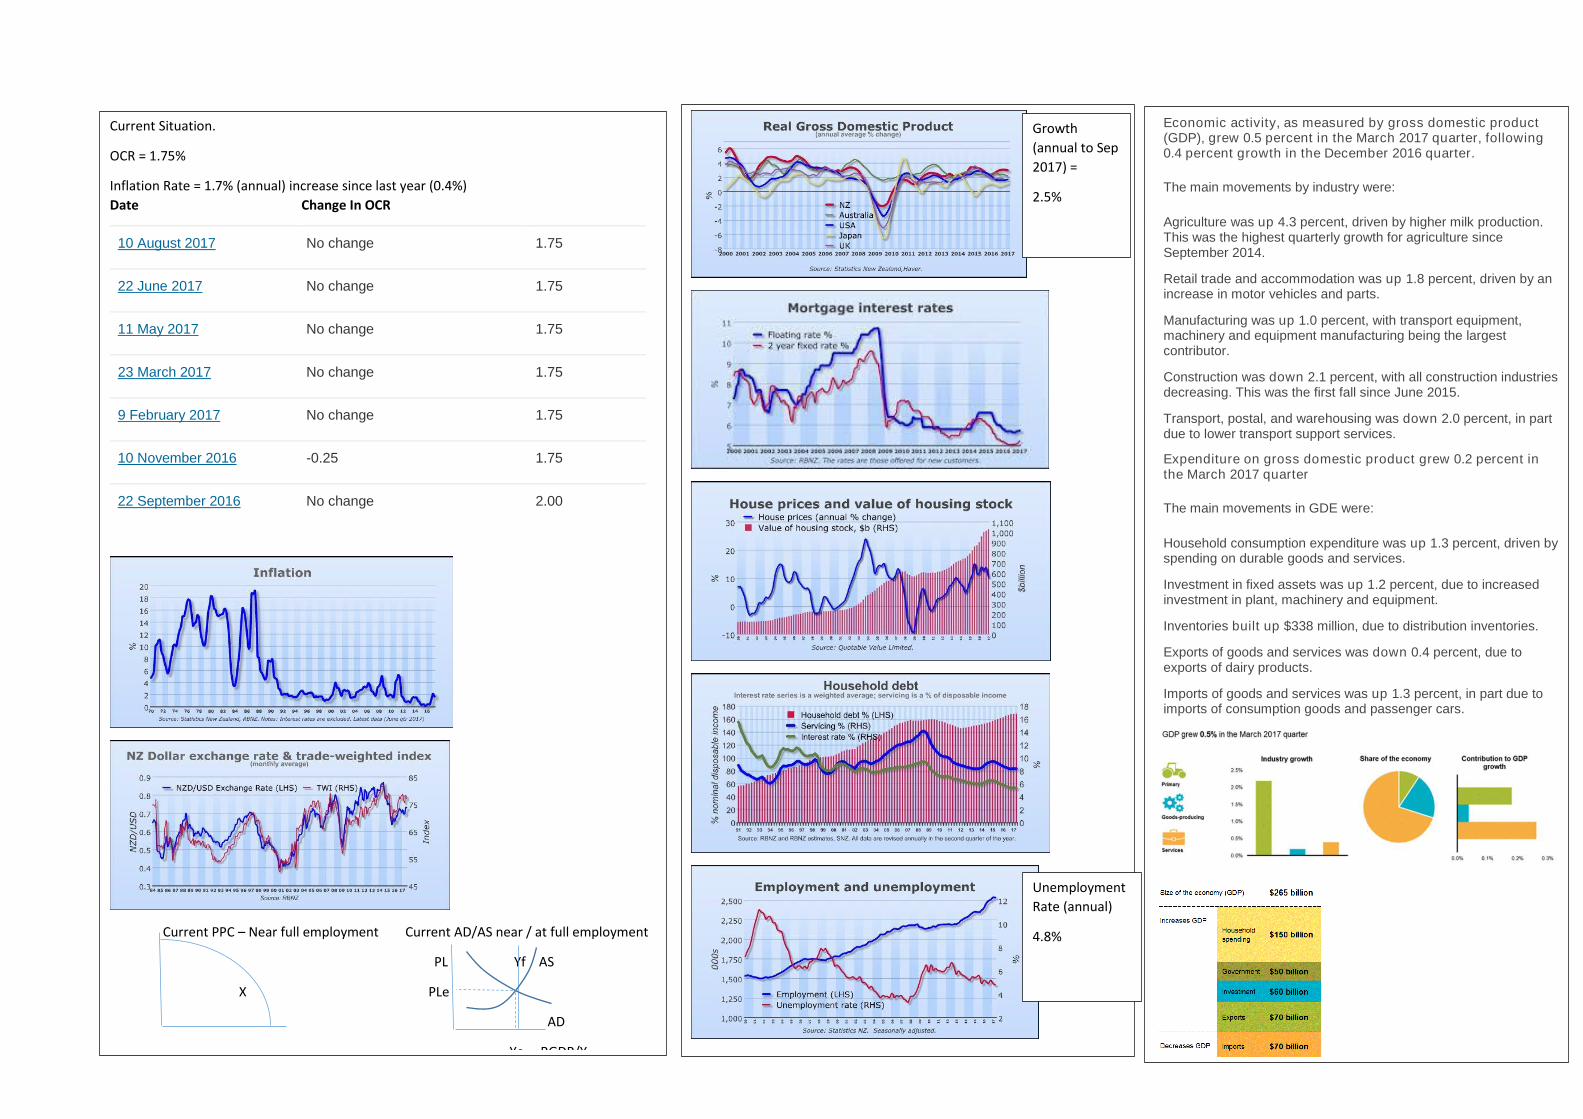
Current Situation.
OCR = 1.75%
Inflation Rate = 1.7% (annual) increase since last year (0.4%)
Date Change In OCR
10 August 2017 No change 1.75
22 June 2017 No change 1.75
11 May 2017 No change 1.75
23 March 2017 No change 1.75
9 February 2017 No change 1.75
10 November 2016 -0.25 1.75
22 September 2016 No change 2.00
Current PPC – Near full employment Current AD/AS near / at full employment
PL Yf AS
X PLe
AD
Ye RGDP/Y
Unemployment
Rate (annual)
4.8%
Growth
(annual to Sep
2017) =
2.5%
Economic activity, as measured by gross domestic product (GDP), grew 0.5 percent in the March 2017 quarter, following 0.4 percent growth in the December 2016 quarter.
The main movements by industry were:
• Agriculture was up 4.3 percent, driven by higher milk production. This was the highest quarterly growth for agriculture since September 2014.
• Retail trade and accommodation was up 1.8 percent, driven by an increase in motor vehicles and parts.
• Manufacturing was up 1.0 percent, with transport equipment, machinery and equipment manufacturing being the largest contributor.
• Construction was down 2.1 percent, with all construction industries decreasing. This was the first fall since June 2015.
• Transport, postal, and warehousing was down 2.0 percent, in part due to lower transport support services.
Expenditure on gross domestic product grew 0.2 percent in the March 2017 quarter
The main movements in GDE were:
• Household consumption expenditure was up 1.3 percent, driven by spending on durable goods and services.
• Investment in fixed assets was up 1.2 percent, due to increased investment in plant, machinery and equipment.
• Inventories built up $338 million, due to distribution inventories.
• Exports of goods and services was down 0.4 percent, due to exports of dairy products.
• Imports of goods and services was up 1.3 percent, in part due to imports of consumption goods and passenger cars.
Medium-term Outlook from June 2017 to 2020 Growth increases in 2018 before declining later in the forecast… June year annual average real GDP growth is forecast to lift from 2.9% in 2017 to 3.2% in 2018, and then decline to 2.8% in 2019 and 2.5% in 2020. Key drivers of growth are expected to steadily
return to their long-run average levels. Growth in goods exports is forecast to pick up in the 2018 June year owing to a recovery in soft commodity prices as trading partner growth gains traction and
dairy supply growth slows. Rising terms of trade are expected to support business investment growth, while previous high population growth boosts residential investment growth. However, the
decline in net migration from previously elevated levels and softening real income growth in 2017 are expected to lead to slower private consumption growth, while real public consumption growth
moderates as inflation rises and growth in government spending slows. The slowdown in GDP growth over the last two years of the forecast reflects lower net migration inflows, a steady rise in
interest rates and the levelling-off in the terms of trade after a period of increases.
Annual growth in the labour force is expected to slow from 1.9% in June 2017 to 1.1% by June 2020. A relatively solid outlook for GDP growth is expected to support employment growth, which
encourages people to seek work, and the participation rate is projected to rise from 68.4% in the June quarter 2017 to 68.9% in June 2019.
The economy's potential growth rate is expected to be high over the first half of the forecast period (Figure 1.10), owing to historically high population growth boosted by net migration inflows.
Potential growth is expected to fall in annual average terms from 2.9% in June 2017 to 2.4% by the end of the forecast period, as net migration inflows taper off. Potential growth has been revised
up across the forecast period from the Half Year Update (Figure 1.10), owing to a higher projection for population growth.
Figure 1.10 - Potential growth
Source: Statistics New Zealand, the Treasury
…as export prices recover as a result of adjustment in global supply and demand… The goods terms of trade are expected to recover following a forecast pick-up in late 2016, driven by commodity export prices rising from a low level. An anticipated slowdown in global
supply growth is a key driver for some commodities, including dairy, lamb and forestry, alongside broad-based higher demand as world growth regains momentum. Accommodative monetary
conditions are expected to support the recovery in advanced economies, while higher commodity export prices lift growth in emerging economies.
Dairy prices are projected to increase steadily towards their assumed long-run average level of around US$3,400/mt by June 2018. On the other hand, rising import prices over the forecast
period, as crude oil prices rise from a low level, will be a partial offset to the strengthening export prices. Oil prices are assumed to trend incrementally higher to reach US$63/barrel by June
2020. Owing to a continued rise in import prices, the terms of trade are expected to ease again after 2018 following a recovery.
…leading to a pick-up in commodity exports… Goods exports are expected to rebound strongly in 2017 (Figure 1.11). Agricultural production is expected to recover in the 2016/17 season, as rising dairy prices stabilise milk production
and meat production normalises. The assumed depreciation of the New Zealand dollar over 2016 is also expected to support exports from the middle of 2017. Rising exports growth is
expected to be sustained into 2018 before moderating. Services exports are projected to grow steadily over the forecast period, on the back of travel services exports (chiefly tourism),
supported by solid income growth in the source countries of tourist arrivals to New Zealand.
Figure 1.11 - Real goods exports
Source: Statistics New Zealand, the Treasury
…and monetary policy is expected to remain accommodative… After remaining at low levels in 2016 and 2017, short-term interest rates are assumed to gradually rise to 4.2% by June 2020 (Figure 1.12), still below their assumed long-run level of
4.5%, as monetary policy is tightened in New Zealand in response to higher inflation. However, short-term interest rates are expected to be lower than in the Half Year Update over the
forecast period, owing to the OCR reduction in March and one additional reduction this year. Long-term interest rates are expected to rise from late 2017, to 4.4% by June 2020, as
monetary policy is expected to be tightened in New Zealand and the US. However, the long-term interest rate forecast has been revised lower, as the US Federal Reserve slowed its
anticipated pace of policy tightening in early 2016 from its previous projections.
Figure 1.12 - 90-day interest rates
Source: Reserve Bank, the Treasury
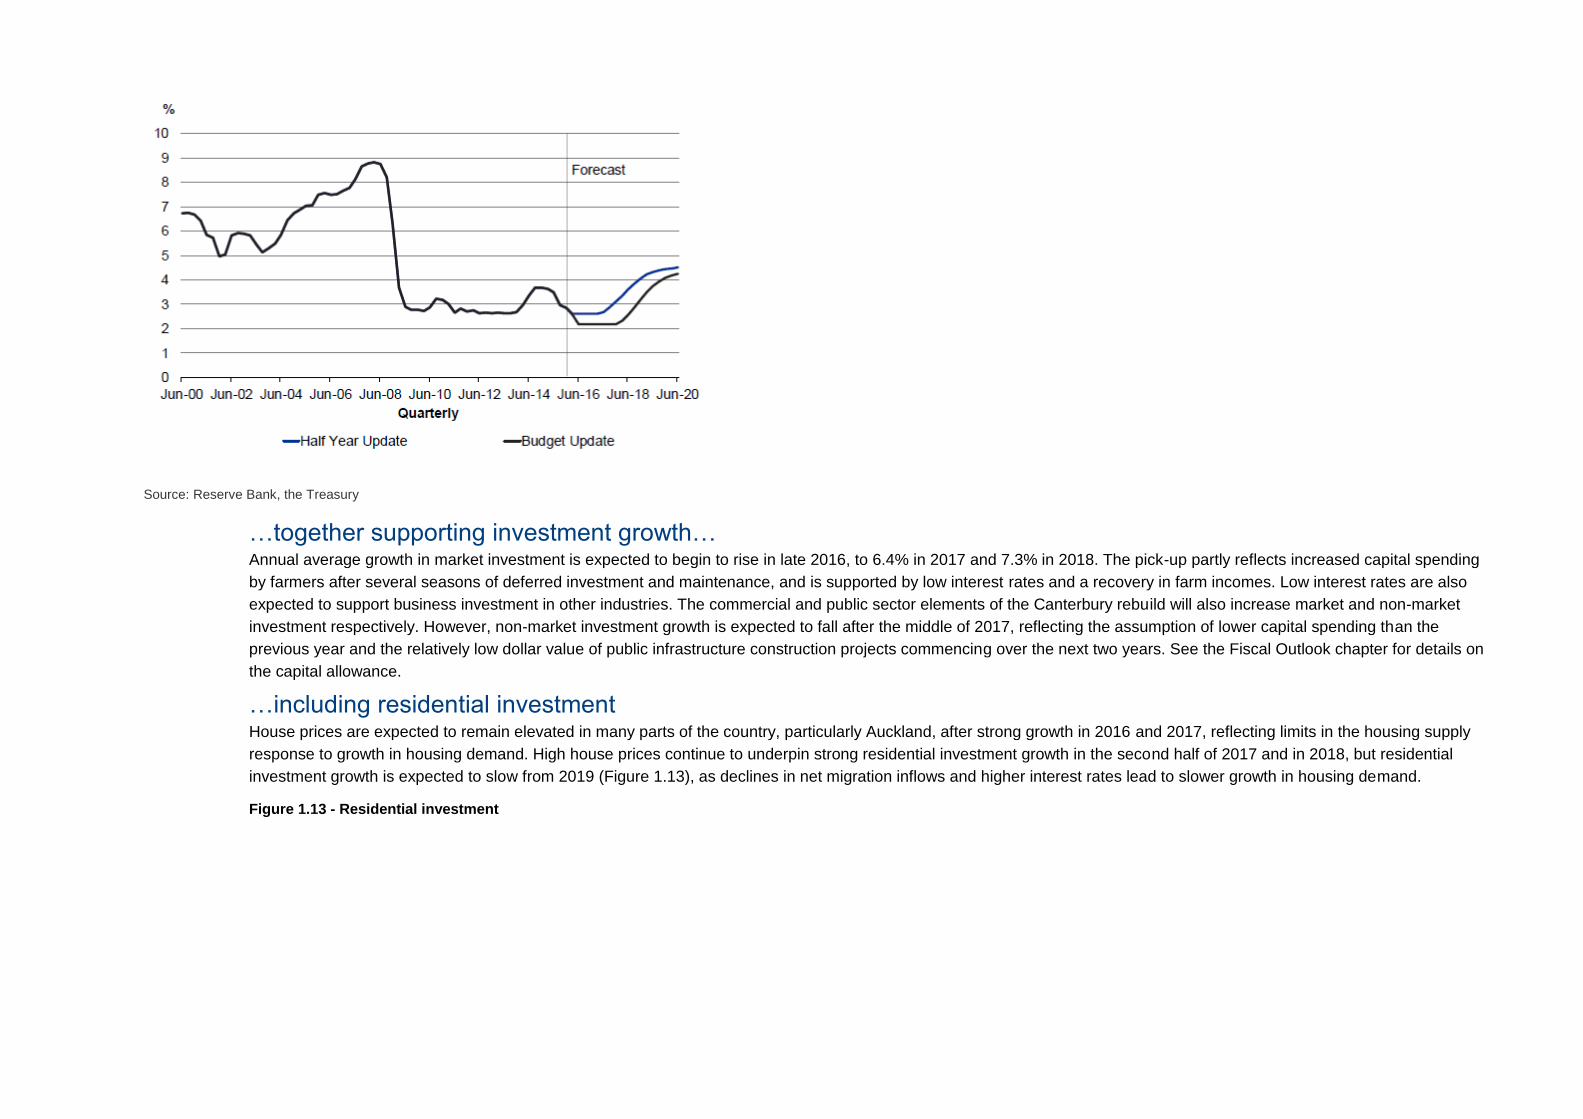
…together supporting investment growth… Annual average growth in market investment is expected to begin to rise in late 2016, to 6.4% in 2017 and 7.3% in 2018. The pick-up partly reflects increased capital spending
by farmers after several seasons of deferred investment and maintenance, and is supported by low interest rates and a recovery in farm incomes. Low interest rates are also
expected to support business investment in other industries. The commercial and public sector elements of the Canterbury rebuild will also increase market and non-market
investment respectively. However, non-market investment growth is expected to fall after the middle of 2017, reflecting the assumption of lower capital spending than the
previous year and the relatively low dollar value of public infrastructure construction projects commencing over the next two years. See the Fiscal Outlook chapter for details on
the capital allowance.
…including residential investment House prices are expected to remain elevated in many parts of the country, particularly Auckland, after strong growth in 2016 and 2017, reflecting limits in the housing supply
response to growth in housing demand. High house prices continue to underpin strong residential investment growth in the second half of 2017 and in 2018, but residential
investment growth is expected to slow from 2019 (Figure 1.13), as declines in net migration inflows and higher interest rates lead to slower growth in housing demand.
Figure 1.13 - Residential investment
Source: Statistics New Zealand, the Treasury
Positive domestic drivers more than offset declining net migration inflows Net migration is projected to decline from its forecast peak of 70,700 in the middle of 2016, and return to its assumed long-run level of 12,000 per year in 2019, leading
population growth to fall from 2.0% in 2016 to 0.9% in 2019. Reflecting slower population growth and rising interest rates, private consumption growth slows to 2.9% in
2017 and 2.5% in 2018, from 3.5% in 2016, and continues to ease for the rest of the forecast period. Real income growth is expected to slow as inflation picks up, and
households are assumed to lower their saving rates to buffer reduced incomes and smooth their consumption to an extent.
Real public consumption growth begins to slow slightly in the second half of 2017 as inflation is expected to rise and growth in nominal government spending slows. The
fiscal impulse is expected to be mildly contractionary in the last three years of the forecast, and to be broadly neutral over the period as a whole. See the Structural
balance indicators box on page 38 for details on how discretionary changes in the fiscal position impact the economy.
Relatively low productivity growth… Growth in labour productivity over the forecast period is projected to average 1% per year, slightly below its historical average. Below-average labour productivity growth
reflects firms using a high proportion of labour in their input mix as growth is expected to be driven by the relatively labour-intensive industries. Below-trend labour
productivity growth is expected to contribute to slowing growth in the productive capacity of the economy and to higher inflation. While per capita GDP growth is
expected to pick up from 2017, it is forecast to decline again after mid-2019 as growth in labour productivity slows. (The box on page 24 examines in detail the
relationship between labour productivity and per capita GDP.)
…contributes to a reduction in spare capacity in the economy... The degree of spare capacity in the economy is expected to fall over the medium term, as growth in the labour force slows and labour productivity growth remains
relatively subdued. The negative output gap, a measure of this spare capacity, narrows through 2017 and 2018, before closing fully in early 2019. This is reflected in a
decline in the unemployment rate to 5.1% in June 2018 and 4.6% in June 2019, from a peak of 5.7% in 2016, as growth in the labour force falls below employment
growth.
Population growth and GDP per capita The population is growing at its fastest pace in over 40 years. To employ a growing population and maintain incomes requires the total size of the economy to keep increasing. Growth in the total
size of the economy is positive for nominal GDP and for tax revenue. However, growth in average income (or output) per person (ie, GDP per capita) is what matters for achieving higher material
living standards. This box discusses the outlook for GDP per capita and the implications of revisions in the assumptions underpinning the outlook.
GDP growth can be divided into contributions from population growth and growth in GDP per capita. Growth in GDP per capita can be further decomposed into contributions from labour productivity
(output per hour worked) and labour utilisation (average hours worked per person).
Increases in labour utilisation come from three main sources: growth in the share of the working-age population in the total population; increases in the proportion of the working-age population in
employment (the employment rate); and increases in the average hours worked per employee.
Figure 1.15 shows that real GDP growth is forecast to be around 2.8%, similar to the average growth rate over the 1995-2015 period. It also shows that, over the forecast period, the contribution
from population growth (1.5 percentage points per year) is higher than usual (1.1 percentage points per year), reflecting the strength of the current migration cycle. The corollary is that, over the
forecast period the contribution from growth in real GDP per capita, of 1.3 percentage points per year, is below its 1995-2015 average of 1.8 percentage points per year, and its 1995-2008 average
of 2.4 percentage points per year. However, the contribution from per capita growth is forecast to be higher than the post-2008 average of 0.5%.
Figure 1.15 - Contributions to GDP growth
Source: Statistics New Zealand, the Treasury
Much of the forecast increase in average per capita GDP growth reflects the reversal of the large fall in labour utilisation that occurred in 2009 and 2010. Excluding this fall, GDP per capita
grew at an average rate of 1.5% per year over 2011-2015. Prior to the fall in labour utilisation, the employment rate had been trending up, from around 60% of the working-age population in
1995 to a peak of 66% in 2008, and was the major contributor to increasing labour utilisation. Over this pre-2008 period, increases in labour utilisation contributed around 0.9 percentage
points to the average GDP per capita growth rate of 2.4%; increases in labour productivity provided the balance. The employment rate fell to 63.5% in 2010 and remained around this rate
until 2013 and subsequently increased to 65.1% in the March 2016 quarter. The employment rate is forecast to rise to 66% by the end of the period, contributing around 0.2% per year to
growth in GDP per capita.
In contrast, average hours worked per person have trended down over much of the past 20 years, although they have been more stable in recent years (Figure 1.16). Reflecting this
stabilisation, the Treasury has revised up its assumption of average hours worked per employee over the forecast period. By the end of the forecast period average hours worked per
employee are around 1.0% higher than previously assumed, which flows through to increases in the Treasury's estimate of the productive capacity (or potential output) of the economy.
Figure 1.16 - Trends in average hours worked
Source: Statistics New Zealand, the Treasury
Partly offsetting the impact of increased average hours of work, growth in labour productivity is assumed to be lower than previously. This reflects both the strength of recent
employment growth and the expected sources of growth underpinning the outlook. In particular, growth in construction, retail trade and accommodation, and other tourism-related
sectors, which are expected to support growth, are relatively labour-intensive and tend to have relatively low levels of productivity. Labour productivity growth contributes around 1.0
percentage point per year to growth in GDP per capita over the forecast period, compared to a contribution of 1.2 percentage points over the 20 years from 1995 to 2015.
The net impact of the increase in average hours worked and slower labour productivity growth is a slight reduction in GDP per capita growth to 1.3% per year from 1.4% per year in