34
Current Drivers Impacting Steel Competitiveness Thomas A. Danjczek, President Steel Manufacturers Association October 15, 2004 Valve Manufacturers Association of America Annual Meeting
| Date post: | 29-Dec-2015 |
| Category: |
Documents |
| Upload: | bryce-glenn |
| View: | 219 times |
| Download: | 3 times |

Current Drivers Impacting
Steel Competitiveness
Thomas A. Danjczek, PresidentSteel Manufacturers AssociationOctober 15, 2004
Valve Manufacturers Association of AmericaAnnual Meeting

VMAA – Annual Meeting
1. SMA
2. Changes– August 2003– Scrap Impact– World Steel Production
3. China, China, China…– Key Statistics– Steel Production– SMA Mission– Lessons Learned– Currency
4. Steel Production Costs– Key Issues– Energy & Raw Material Costs– Asset Values– Exchange Rates– Bankruptcy/Restarts– Scrap Costs
5. Other Costs– Restrictive Scrap Exports– Freights– Coke– Energy
6. Market– Overview– Public Works Construction
7. Conclusion
Current Drivers ImpactingSteel Competitiveness
VMAA – Annual Meeting
•The Steel Manufacturers Association (SMA)
–37 North American companies:
30 U.S., 5 Canadian, and 2 Mexican
–107 Associate members:
Suppliers of goods and services to the steel industry
•SMA member companies
–Operate 120 Steel plants in North America
–Employ about 40,000 people
–Mini-mill Electric Arc Furnace (EAF) producers

VMAA – Annual Meeting
•Production capability
–SMA represents over half of U.S. steel production
•Recycling
–SMA members are the largest recyclers in the U.S.
–Last year, the U.S. recycled over 70 million tons of ferrous scrap
•Growth of SMA members
–Efficiency and quality due to low cost
–Flexible organizations
–EAF growth surpassed 50% in 2002 & 2003, and anticipated to be 60% by 2010

In August 2003, The Times they were a’changing…
VMAA – Annual Meeting
Steel DemandWeakening
201 Tariffs/ExclusionsIncreasing
Imports
Bankruptcies
Semi-Finished Imports
N.A. Economy
Plant Closures/Restarts
Perennial Problems
Consolidations
US PBGC
Mini-mill IndustryCondition
Pricing Volatility
ISG’s Labor Contract
Exchange RateShifts
Public Policy
Legacy Costs
Operating Costs Benefits& Energy
Capital Constraints

VMAA – Annual Meeting
Up $130 since June 2004!
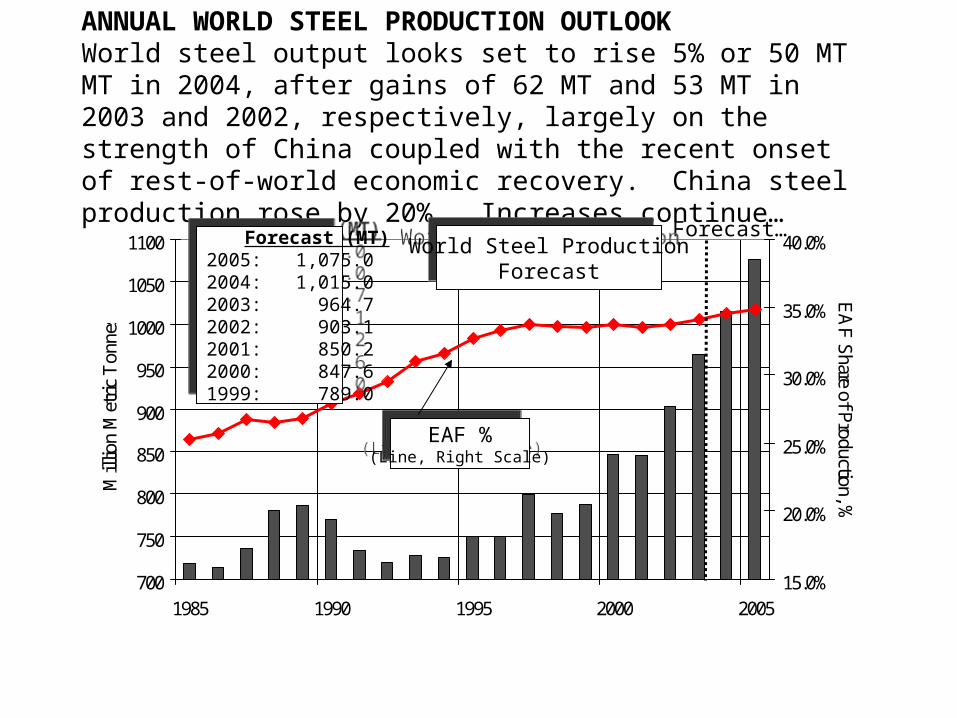
ANNUAL WORLD STEEL PRODUCTION OUTLOOKWorld steel output looks set to rise 5% or 50 MT MT in 2004, after gains of 62 MT and 53 MT in 2003 and 2002, respectively, largely on the strength of China coupled with the recent onset of rest-of-world economic recovery. China steel production rose by 20%. Increases continue…
700
750
800
850
900
950
1000
1050
1100
1985 1990 1995 2000 2005
Mill
ion
Met
ric
Ton
nes
15.0%
20.0%
25.0%
30.0%
35.0%
40.0%
EA
F S
hare of Production, %
Forecast… Forecast (MT)2005: 1,075.02004: 1,015.02003: 964.72002: 903.12001: 850.22000: 847.61999: 789.0
Forecast (MT)2005: 1,075.02004: 1,015.02003: 964.72002: 903.12001: 850.22000: 847.61999: 789.0
EAF %(Line, Right Scale)
EAF %(Line, Right Scale)
World Steel ProductionForecast
World Steel ProductionForecast

A few notes on China from 2003, 2004 and forward:•Consumed ≈ 25% of world coke supply in ’03
•Coke production ramping up in ’04 and ‘05
•Consumed ≈ 25% of world iron ore supply in ’03
•Iron ore production ramping up in ’04 and ’05
•Consumed ≈ 20% of world scrap supply in ‘03
•Consumed ≈ 240M mtons of steel in ‘03
•Produced ≈ 220M mtons of steel last year (est. 240M mtons ’04)
•Consumed ≈ 40% of world concrete supply
•VW will produce and sell 150M cars in China this year
•GM will invest $6B in China by 2006 (rival VW as #1 supplier)
•Average income / year $1,200 US (≈ $5,000 for steelmakers)
VMAA – Annual Meeting China China China…
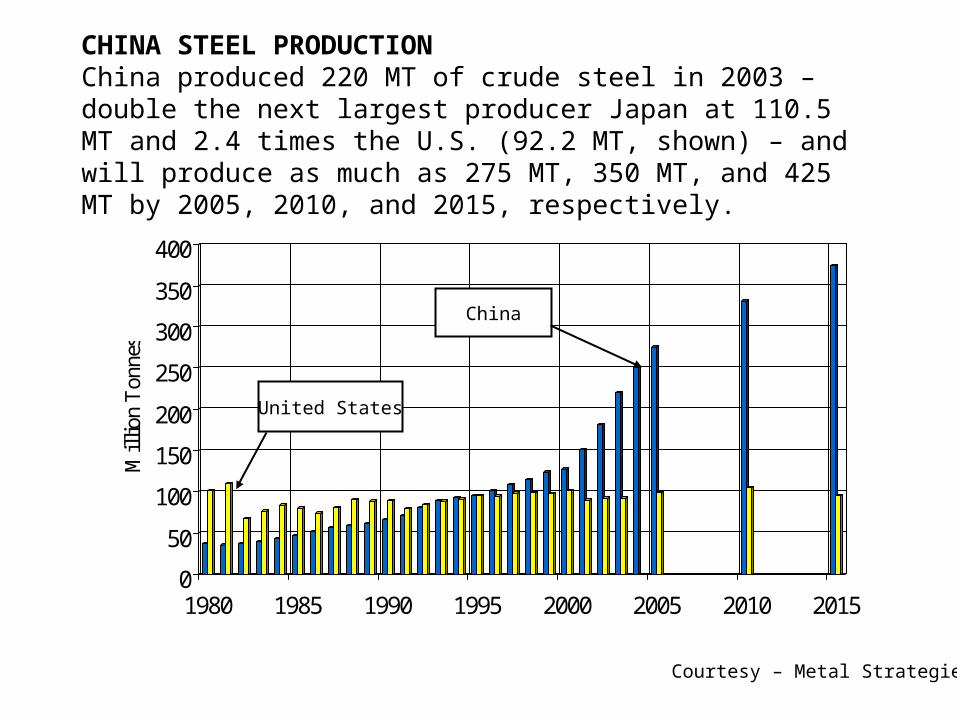
CHINA STEEL PRODUCTIONChina produced 220 MT of crude steel in 2003 – double the next largest producer Japan at 110.5 MT and 2.4 times the U.S. (92.2 MT, shown) – and will produce as much as 275 MT, 350 MT, and 425 MT by 2005, 2010, and 2015, respectively.
0
50
100
150
200
250
300
350
400
Mil
lion
Ton
nes
1980 1985 1990 1995 2000 2005 2010 2015
China
United States
Courtesy – Metal Strategies
VMAA – Annual Meeting
Team Nine member steel company representatives(3 presidents; 3 V.P. – operations; 3 experts -
melting, rolling & engineering)
Purpose Gain First Hand Knowledge in mills & mill builders
Major Concern Given high degree of Chinese Governmentsubsidies provided, loss of US steel customer base
Key Question When will capacity & production exceed domestic demands
SMA Study Mission to China – August 2004

VMAA – Annual Meeting
Government - Control capital through state banks- Control growth through land availability- Control output through electrical power andplanning assets- Steel ownership – 90% SUBSIDIZED!- Government shutting down less efficient
operation measured by energy consumption &environmental pollution
Infrastructure - Massive construction – Vacant office space? - Significant power outages – building nuclear plants
- Organized approach to Growth- Water transportation is a major asset
Quality - Qualified personnel with enthusiasm and pride- Observed both world class & marginal facilities
Lessons Learned
VMAA – Annual Meeting
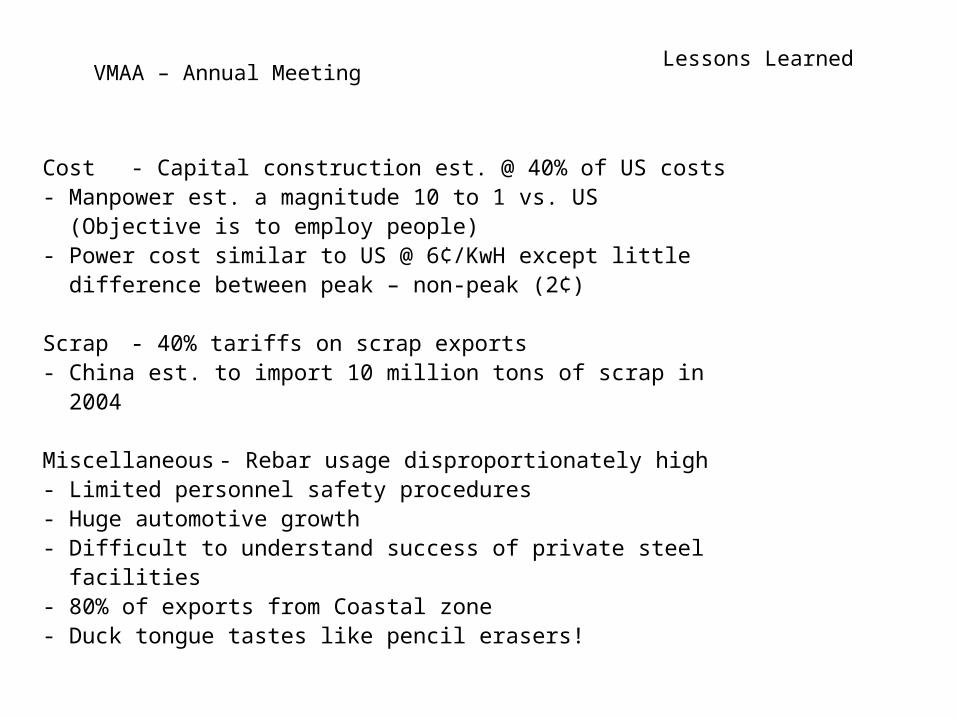
Cost - Capital construction est. @ 40% of US costs- Manpower est. a magnitude 10 to 1 vs. US (Objective is to employ people)- Power cost similar to US @ 6¢/KwH except little difference between peak – non-peak (2¢)
Scrap - 40% tariffs on scrap exports- China est. to import 10 million tons of scrap in
2004
Miscellaneous - Rebar usage disproportionately high - Limited personnel safety procedures
- Huge automotive growth- Difficult to understand success of private steel
facilities- 80% of exports from Coastal zone- Duck tongue tastes like pencil erasers!
Lessons Learned

Courtesy – IMF

Courtesy – IMF

Courtesy – IMF

CHINA CONCLUSIONS Currency Manipulations
For eight and one-half years, China has maintained a fixed exchange rate of 8.3 Yuan to the dollar. China has printed any amount of yuan necessary to purchase dollars to maintain a fixed artificial rate, giving it enormous export advantage, and creating a China trade surplus with the US reaching $124 billion in 2003.
In the two-year period, 2002-2003, US imports of manufactured goods from China accounted for 56 percent of the total growth in US imports of manufactured goods during the period. The US trade deficit in manufactured goods with China was $128 billion in 2003. The overall US trade deficit with China is now the largest bilateral trade imbalance ever seen in the history of world trade.
The United States should insist that China change its exchange rate regime which allows it to sell undervalued goods in export markets at costs denominated in undervalued yuan. Simultaneously, China must relax its tight capital controls, which have resulted in an accumulation of foreign exchange acquired from export sales, amounting to $420 billion in 2003, about one-third of China’s GDP. China must stop excessive issuance of undervalued yuan, and pay for its imports with foreign exchange.
Today, China can absorb a revaluation without an economic collapse, versus a token one which would respond to the problem in form only, rather than a needed significant revaluation. If inadequate US policy causes a delay for another five years, however, China, the US, and the world economy are in for a very hard landing. At that point, an inevitable huge revaluation of the yuan will occur, which it must, when US policy officials then confront US trade, current account, and capital account deficits of disastrous proportions. US policy must effectively address this problem, now. So far, it has not.
May 12, 2004 SMA Press Release

Summary of Key Issues
• Relative operating costs in the U.S. steel industry have changed dramatically over the past 12 months:
• First with the introduction of the ISG-style restructuring which took out $40-$50 per of hot band costs as a result of labor contract changes, and a further $25-$50 per ton with the removal of past legacy costs.
• Secondly, with the surge in metallics and energy prices and this development’s far greater relative impact on sheet minimills until the successful implementation of surcharges.
• Third, ore, coal, and coke prices have risen significantly.
US Steel Production CostsVMAA – Annual Meeting
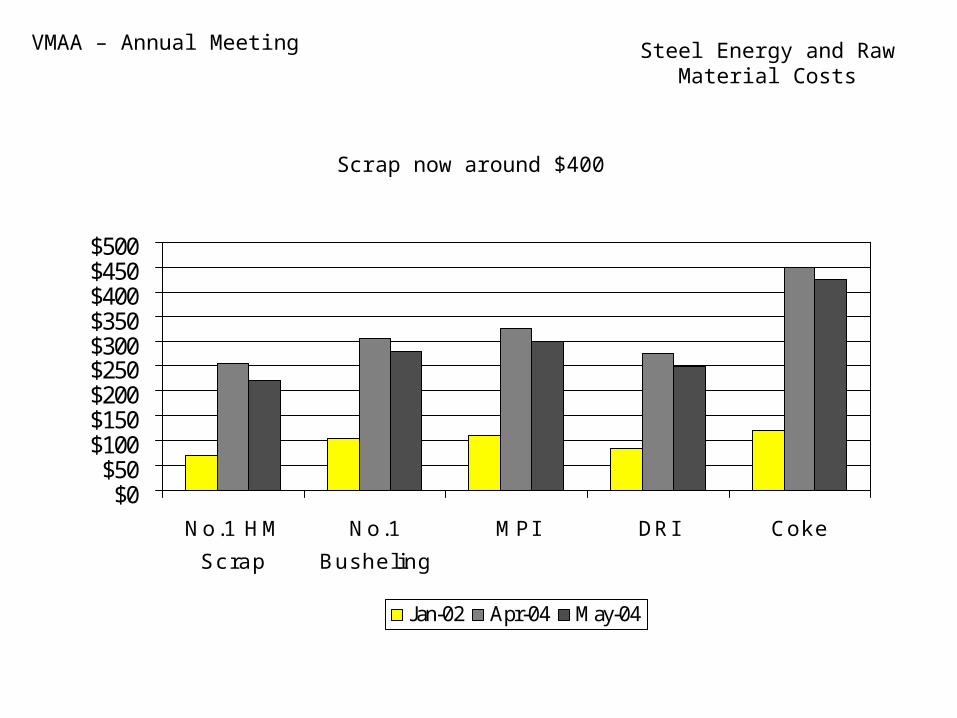
Scrap now around $400
$0$50
$100$150$200$250$300$350$400$450$500
No.1 HM
Scrap
No.1
Busheling
MPI DRI Coke
Jan-02 Apr-04 May-04
VMAA – Annual Meeting Steel Energy and RawMaterial Costs
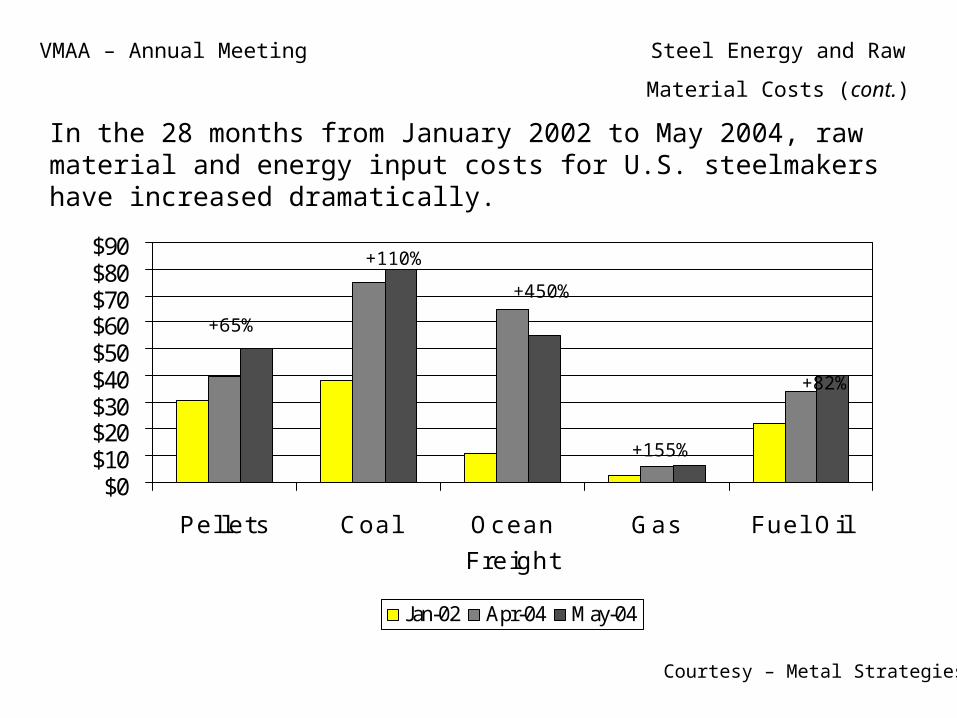
In the 28 months from January 2002 to May 2004, raw material and energy input costs for U.S. steelmakers have increased dramatically.
$0$10$20$30$40$50$60$70$80$90
Pellets Coal Ocean
Freight
Gas Fuel Oil
Jan-02 Apr-04 May-04
+65%
+110%
+450%
+155%
+82%
Courtesy – Metal Strategies
VMAA – Annual Meeting Steel Energy and Raw
Material Costs (cont.)
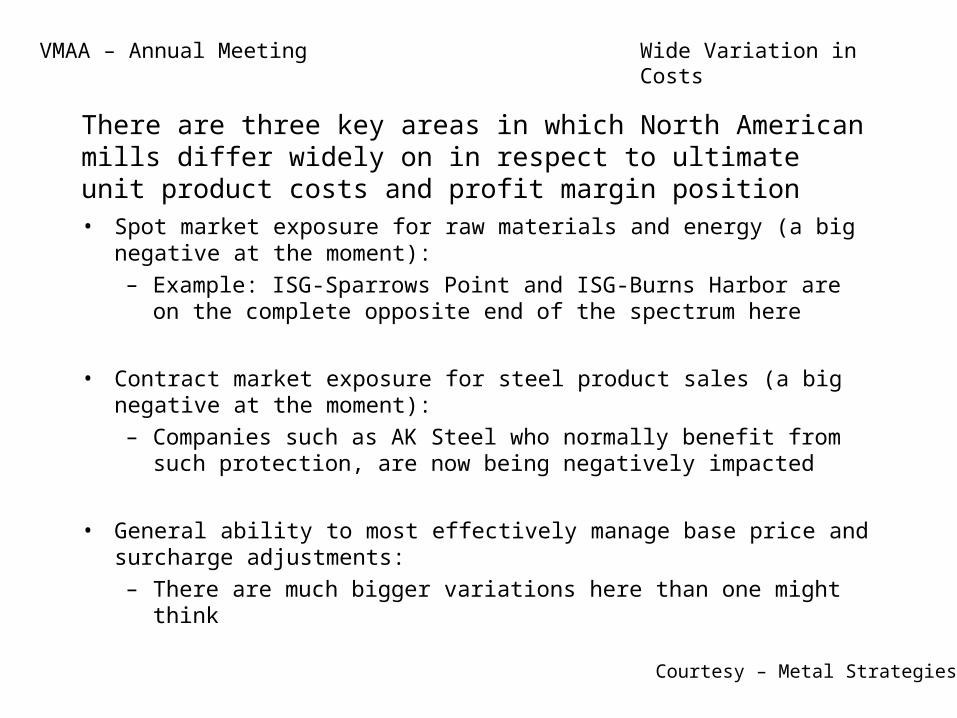
There are three key areas in which North American mills differ widely on in respect to ultimate unit product costs and profit margin position
• Spot market exposure for raw materials and energy (a big negative at the moment):
– Example: ISG-Sparrows Point and ISG-Burns Harbor are on the complete opposite end of the spectrum here
• Contract market exposure for steel product sales (a big negative at the moment):
– Companies such as AK Steel who normally benefit from such protection, are now being negatively impacted
• General ability to most effectively manage base price and surcharge adjustments:
– There are much bigger variations here than one might think
Courtesy – Metal Strategies
Wide Variation in CostsVMAA – Annual Meeting

RECENT U.S. STEEL ASSET TRANSACTION VALUESAcquisition range has been $60 to $90/ton shipped for shuttered operations and $160 to $260/ton for ongoing businesses.
0
50
100
150
200
250
300
$/Ton 20 $60 $68 $70 $79 $90 92 $102 $167 $175 $180 $194 $225 $230 $255 $265
G'twn LTV Acme Kingm. Trico Qual. Rouge Weir Beth Nat'lCo-Steel
Heartl REPAubur
nBirmin
g.LTV HDG
Liquidated Companies
Ongoing Businesses
CSN disclosed in October 2003 that its acquisition price for Heartland was actually $175 million instead of the previously-report $69 million.Acquisition prices include all assumed liabilities.
Courtesy – Metal Strategies
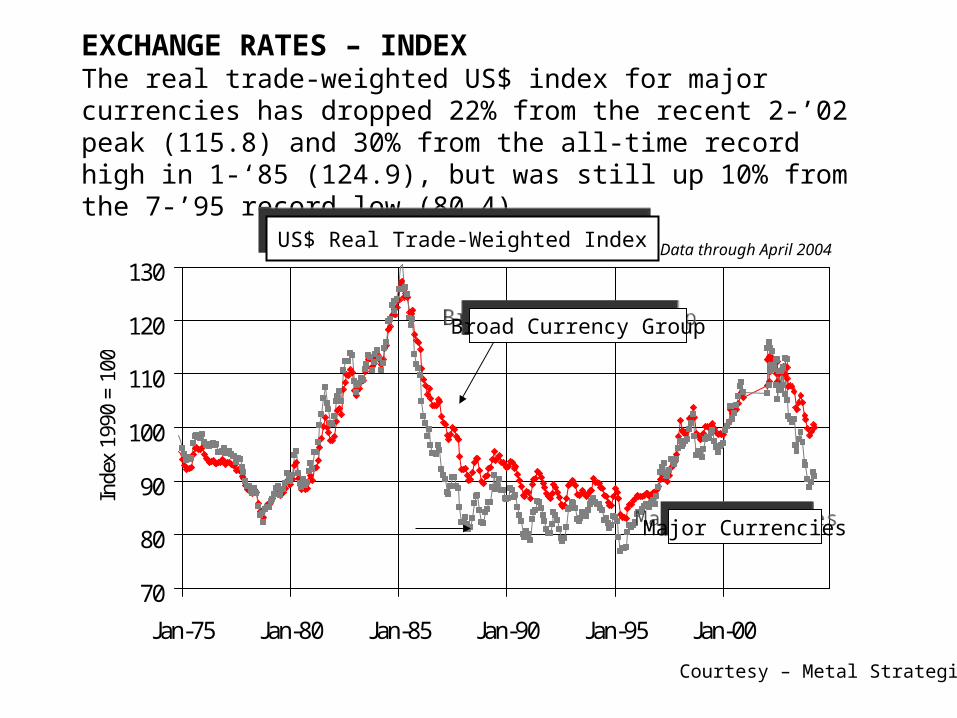
EXCHANGE RATES – INDEXThe real trade-weighted US$ index for major currencies has dropped 22% from the recent 2-’02 peak (115.8) and 30% from the all-time record high in 1-‘85 (124.9), but was still up 10% from the 7-’95 record low (80.4).
70
80
90
100
110
120
130
Jan-75 Jan-80 Jan-85 Jan-90 Jan-95 Jan-00
Inde
x 19
90 =
100
Broad Currency GroupBroad Currency Group
Major CurrenciesMajor Currencies
Data through April 2004US$ Real Trade-Weighted IndexUS$ Real Trade-Weighted Index
Courtesy – Metal Strategies

VALUE OF THE U.S. DOLLARScrap prices are inversely related to the dollar
50
75
100
125
150
1990 1992 1994 1996 1998 2000 2002 2004
Ma
jor
Cu
rre
nci
es
Do
llar
Ind
ex
$0
$50
$100
$150
$200
$250
Scr
ap
Pric
e -
$/G
T
Source: AMM, Federal Reserve
Scrap Price
Dollar Index
Courtesy – Metal Strategies

VALUE OF THE U.S. DOLLARThe strong relationship between steel imports and the dollar is even more clear when a 12-month moving average is used.
50
75
100
125
150
1990 1992 1994 1996 1998 2000 2002 2004
Ma
jor
Cu
rre
nci
es
Do
llar
Ind
ex
0.5
1.0
1.5
2.0
2.5
3.0
3.5
4.0
Fin
ish
ed
Ste
el I
mp
ort
s -
MT
Source: AISI, Federal Reserve
Finished Steel Imports(12-Month Moving Avg)
Dollar Index
Courtesy – Metal Strategies

July 2004 – July 2004 – Above $300 Above $300
Again!Again!

Back to the top in July!
Courtesy - AMM
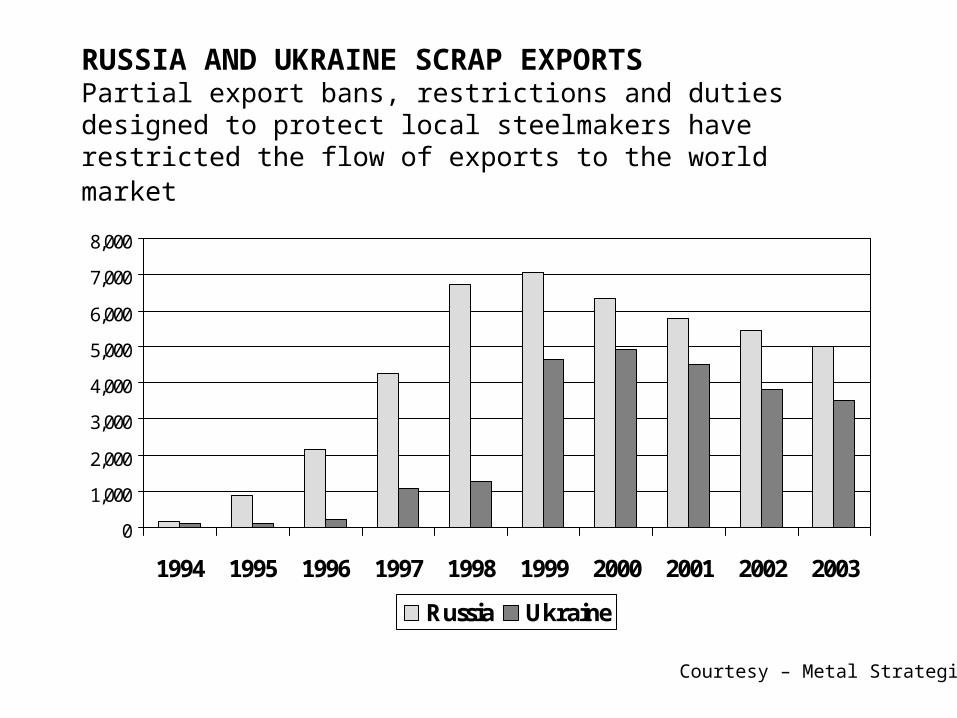
RUSSIA AND UKRAINE SCRAP EXPORTSPartial export bans, restrictions and duties designed to protect local steelmakers have restricted the flow of exports to the world market
0
1,000
2,000
3,000
4,000
5,000
6,000
7,000
8,000
1994 1995 1996 1997 1998 1999 2000 2001 2002 2003
Russia Ukraine
Courtesy – Metal Strategies

U.S. SCRAP CONSUMPTION AND EXPORTSDemand for U.S. scrap increased by 3 MT in 2003, driven by a 15% surge in exports and a slight gain in domestic demand (EAF and BOF production down 3% and up 1%, respectively)
40
50
60
70
80
1980 1985 1990 1995 2000
Mill
ion
Ton
s
Consumption Exports
Courtesy – Metal Strategies

OCEAN FREIGHT RATESOcean freight rates increased 4.5-fold from $10,000/day to $45,000/day between early-2003 and early-2004 and have recently declined by about $5 to $10 pr tonne since late-March.
$0
$10
$20
$30
$40
$50
$60
$70
Jan-00 Jan-01 Jan-02 Jan-03 Jan-04
US
$ P
er T
onne
Brazil-China Australia-China
Courtesy – Metal Strategies

IRON ORE PRICES - ANNUALThe 2004 iron ore price-increase benchmark of 18.5% was established in early-January by CVRD, following a 9% gain in 2003. China now accounts for over 25% (110 MT) of world sea-borne demand, while three producers (CVRD, RTZ
and BHP) now control over 80% of the supply.
$15
$20
$25
$30
$35
$40
1980 1985 1990 1995 2000
US
$/T
onne
@ 6
2.4%
Fe
PelletsPellets
LumpLump
FinesFines
Prices shown are from CVRD (Brazil) to Western European steel customers (fob)
Courtesy – Metal Strategies

Technical Read on Crude Oil Prices
Courtesy – JP Morgan
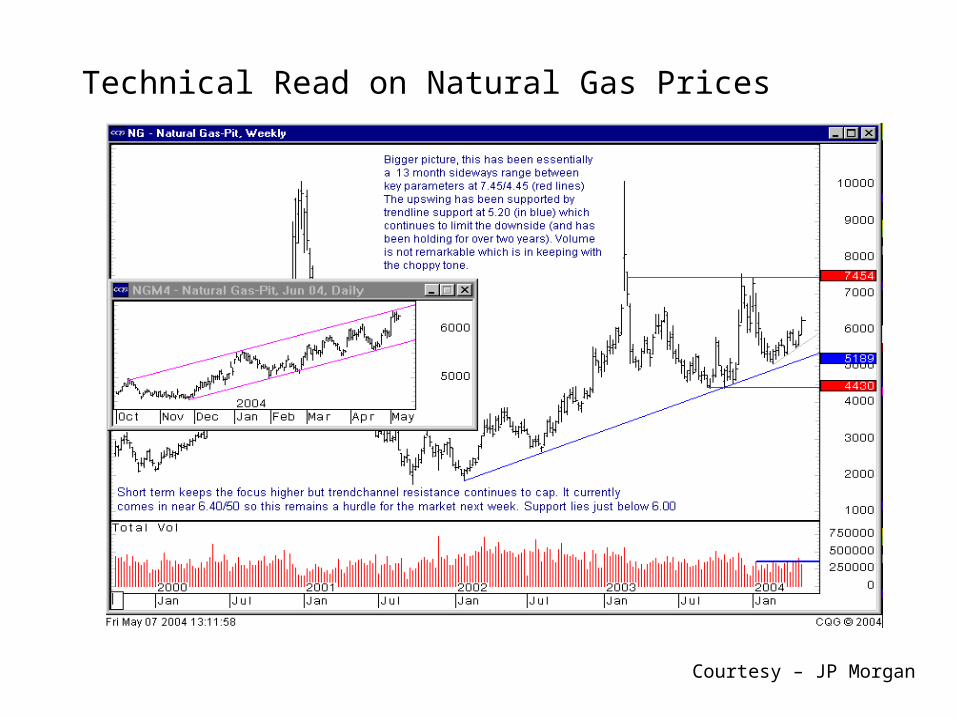
Technical Read on Natural Gas Prices
Courtesy – JP Morgan

STEEL END-MARKET OVERVIEWThree broad sectors – construction, autos, and industrial equipment – account for over 75% of total U.S. steel consumption by ultimate users.
Construction40-45%
Autos18-20%
Ind. Equip.15-18%
Energy-4%
Containers4%
Appliances,Office Furniture
2.5%
All Other15%
60% Non-Residential30% Public Works10% Residential
60% Non-Residential30% Public Works10% Residential
55% Light Trucks/ SUVs30% Passenger Cars 5% Commercial Trucks, Buses10% After Market
55% Light Trucks/ SUVs30% Passenger Cars 5% Commercial Trucks, Buses10% After Market
Off-Highway VehiclesFreight CarsBarges, ShipsOther Industrial Equip.
Off-Highway VehiclesFreight CarsBarges, ShipsOther Industrial Equip.
Courtesy – Metal Strategies

VMAA – Annual Meeting Conclusion
•Uncertainty – Cycle has Changed (Shorter Term & Greater Peaks & Valleys)
•Revenue vs. Costs – Not the Same Business Model
•CHINA, CHINA, CHINA…
•Bankruptcy Laws Unfair to Competitors
•Investments – Earn Cost of Capital
•Mini-Mills Must Compete in the World, as it is, and We Can!
•Meaningful Optimism with Good Long Term Consumption, Relative Value, and Excellent Recyclability for Steel


