60
Curves and Loops in Mechanical Ventilation Frank Rittner Martin Döring D-36-2011

Curves and Loops in Mechanical VentilationFrank RittnerMartin Döring
D-3
6-20
11

Curves and Loops in Mechanical Ventilation
Frank RittnerMartin Döring

5
Contents
Ventilation curve patterns 6
nPressure-time diagram 6nFlow-time diagram 10n Volume-time diagram 12n Interpretation of curve patterns 14
Loops – a good thing all round 21nPV loops 21 nThe static PV loop 21 nThe dynamic PV loop in ventilation 23 n Interpretation of PV loops in ventilation 26 nPV loops before and after the tube 34nLoops – other possibilities 38 nFlow-volume loop 38
Trends reviewed 40nDocumentation of a weaning process 41n Lung parameters based on peak and
plateau pressure 43
Capnography – keeping an eye on the details 44nThe physiological capnogram 46n Interpretations of capnograms 47
6
Ventilation curve patterns
All the ventilators of the Evita family offer graphic representation of the gradual changes in ventilation pressure and breathing gas flow. Evita 4, Evita 2 dura and the PC software EvitaView additionally show the gradual changes in the breathing volume. Two or in some monitors three curves can be shown on the screen at the same time, and particularly the fact that pressure, flow and volume can be displayed simultaneously makes it easier to detect changes caused by the system or the lungs. The gradual change in pressure, flow and volume depend to an equal extent on the properties and settings of the ventilator, as well as on the respiratory properties of the lung.
One respiratory cycle comprises an inspiratory and an expiratory phase. Under normal conditions these two periods contain a flow phase and a no flow pause phase. No volume passes into the lung during the no flow phase during inspiration.
Pressure-time diagram Volume-controlled, constant flow
The pressure-time diagram shows the gradual changes in the airway pressure. Pressure is given in mbar (or in cmH2O,) and time in seconds.
At a preset volume (volume-controlled ventilation) and constant flow the airway pressure depends on the alveolar pressure and the total of all airway resistances, and can be affected by resistance and compliance values specific to the ventilator and the lung. As the ventilator values are constant, the pressure-time diagram allows conclusions to be drawn about the status of the lung and changes to it.
The gradual changes in pressure, flow and volume depend to an equal extent on the properties and settings of the ventilator, as well as on the respiratory properties of the lung.

Ventilation curve patterns 7
Resistance = airway resistanceCompliance = compliance of the entire system
(lungs, hoses etc.)
At the beginning of inspiration the pressure between points A and B increases dramatically on account of the resistances in the system. The level of the pressure at break point B is equivalent to the product of resistance R and flow (*).
Δp = R ∗ *
This relationship, as well as the following examples, is only valid if there is no intrinsic PEEP. The higher the selected Flow * or overall resistance R, the greater the pressure rise up to point B. Reduced inspiratory flow and low resistance values lead to a low pressure at point B.
Pressure-time diagram for volume controlled constant flow ventilation.

Ventilation curve patterns8
After point B the pressure increases in a straight line, until the peak pressure at point C is reached. The gradient of the pressure curve is dependent on the inspiratory flow * and the overall compliance C.
Δp/Δt = * / C
At point C the ventilator applied the set tidal volume and no further flow is delivered (* = 0).
As a result, pressure p quickly falls to plateau pressure. This drop in pressure is equivalent to the rise in pressure caused by the resistance at the beginning of inspiration. The base line between points A and D runs parallel to the line B - C.
Further on there may be a slight decrease in pressure (points D to E). Lung recruitment and leaks in the system are possible reasons for this. The level of the plateau pressure is determined by the compliance and the tidal volume. The difference between plateau pressure (E) and end-expiratory pressure F (PEEP) is obtained by dividing the delivered volume VT (tidal volume) by compliance C.
ΔP = Pplat - PEEP
By reversing this equation the effective compliance can easily be calculated.
C = VT /Δp
The level of the plateau pressure is determined by the compliance and the tidal volume.

Ventilation curve patterns 9
During the plateau time no volume is supplied to the lung, and inspiratory flow is zero. As already mentioned, there is a displacement of volume on account of different time constants, and this results in pressure compensation between different compartments of the lung.
Expiration begins at point E. Expiration is a passive process, whereby the elastic recoil forces of the thorax force the air against atmospheric pressure out of the lung. The change in pressure is obtained by multiplying exhalation resistance R of the ventilator by expiratory flow *exp.
Δp = R ∗ *exp.
Once expiration is completely finished, pressure once again reaches the end-expiratory level F (PEEP).
Pressure-orientedIn pressure-oriented ventilation (e.g. PCV/BIPAP) the pressure curve is quite different.
Pressure-time diagramm for pressure controlled ventilation.

Ventilation curve patterns10
Pressure increases rapidly from the lower pressure level (ambient pressure or PEEP) until it reaches the upper pressure value PInsp. and then remains constant for the inspiration time Tinsp. set on the ventilator.
The drop in pressure during the expiratory phase follows the same curve as in volume-oriented ventilation, as expiration is under normal conditions a passive process, as mentioned above. Until the next breath pressure remains at the lower pressure level PEEP.
As pressure is preset and regulated in the case of pressure-oriented ventilation modes such as BIPAP, pressure-time diagrams show either no changes, or changes which are hard to detect, as a consequence of changes in resistance and compliance of the entire system.
As a general rule it can be said that the pressure curves displayed reflect the development of pressure measured in the ventilator. Real pressures in the lung can only be calculated and assessed if all influential factors are taken into account.
Flow-time diagramThe flow-time diagram shows the gradual changes in the inspiratory and expiratory flows *insp and *exsp respectively. Flow is given in L/min and time in seconds. The transferred volume is calculated as the integration of the flow * over time, and is thus equivalent to the area underneath the flow curve. During inspiration the course of the flow curve is dependent on or at least strongly influenced by the ventilation mode set on the ventilator. Only the course of the flow in the expiratory phase permits conclusions to be drawn as to overall resistance and
The course of the flow in the expiratory phase permits conclusions to be drawn as to overall resistance and compliance of the lung and the system.

Ventilation curve patterns 11
compliance of the lung and the system.In normal clinical practice constant flow and decelerating flow have become established as the standard forms for ventilator control.
To date there has been no evidence to suggest that particular therapeutic success could be achieved using other flow forms.
In the case of constant flow the volume flow rate during inspiration remains constant throughout the entire flow phase. When inspiration starts the flow value very quickly rises to the value set on the ventilator and then remains constant until the tidal volume VT, likewise set on the ventilator, has been delivered (this is the square area under the curve.) At the beginning of the pause time (plateau time) the flow rapidly returns to zero. At the end of the pause time expiratory flow begins, the course of which depends only on resistances in the ventilation system and on parameters of the lung and airways. Constant flow is a typical feature of a classic volume-oriented mode of ventilation.
Vmax
Flow-time diagram
Ventilation curve patterns12
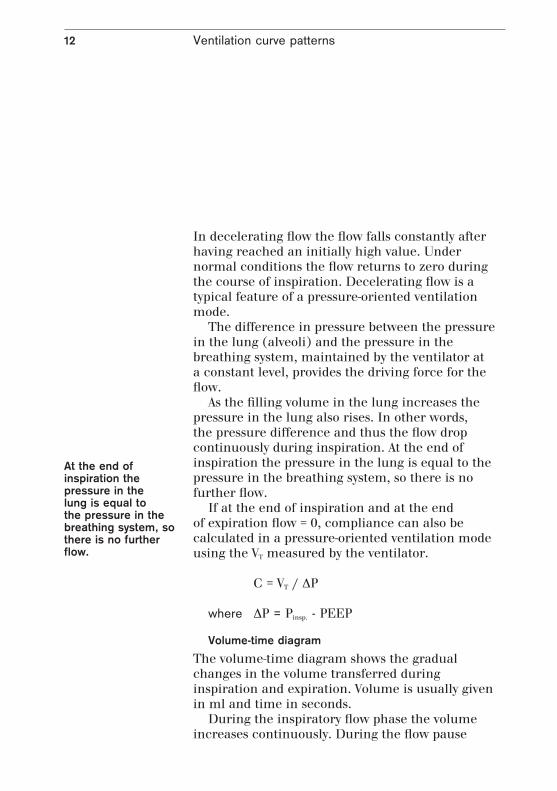
In decelerating flow the flow falls constantly after having reached an initially high value. Under normal conditions the flow returns to zero during the course of inspiration. Decelerating flow is a typical feature of a pressure-oriented ventilation mode.
The difference in pressure between the pressure in the lung (alveoli) and the pressure in the breathing system, maintained by the ventilator at a constant level, provides the driving force for the flow.
As the filling volume in the lung increases the pressure in the lung also rises. In other words, the pressure difference and thus the flow drop continuously during inspiration. At the end of inspiration the pressure in the lung is equal to the pressure in the breathing system, so there is no further flow.
If at the end of inspiration and at the end of expiration flow = 0, compliance can also be calculated in a pressure-oriented ventilation mode using the VT measured by the ventilator.
C = VT / ΔP
where ΔP = Pinsp. - PEEP
Volume-time diagramThe volume-time diagram shows the gradual changes in the volume transferred during inspiration and expiration. Volume is usually given in ml and time in seconds.
During the inspiratory flow phase the volume increases continuously. During the flow pause
At the end of inspiration the pressure in the lung is equal to the pressure in the breathing system, so there is no further flow.

Ventilation curve patterns 13
(plateau time) it remains constant as there is no further volume entering the lung. This maximum volume value is an index of the transferred tidal volume and does not represent the entire volume in the lung. The functional residual capacity (FRC) is not taken into account. During expiration the transferred volume decreases as a result of passive exhalation.
The relationships between pressure, flow and volume are particularly obvious when these parameters are all displayed at the same time.
Pressure, flow and volume diagram of volume-oriented and pressure-oriented ventilation
Ventilation curve patterns14
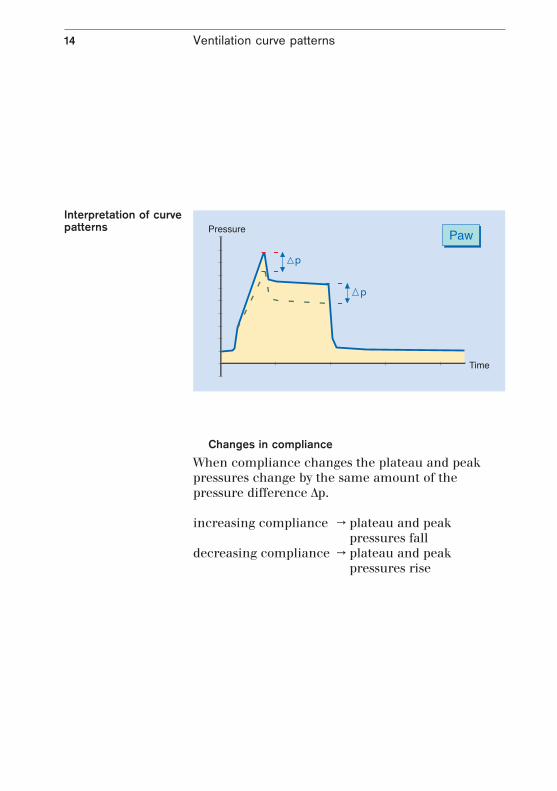
Changes in complianceWhen compliance changes the plateau and peak pressures change by the same amount of the pressure difference Δp.
increasing compliance → plateau and peak pressures fall
decreasing compliance → plateau and peak pressures rise
p
p
Interpretation of curve patterns

Ventilation curve patterns 15
Changes in inspiratory airway resistance
When the inspiratory airway resistance changes the peak pressure changes and the plateau pressure remains the same.
increasing resistance → peak pressure risesdecreasing resistance → peak pressure falls
The expiratory lung resistance cannot be seen on the pressure curve as the alveolar pressure would need to be known. Conclusions can be drawn however from the expiratory flow curve (see «Flow curve at increased expiratory resistances»).
The expiratory lung resistance cannot be seen on the pressure curve as the alveolar pressure would need to be known.
Ventilation curve patterns16
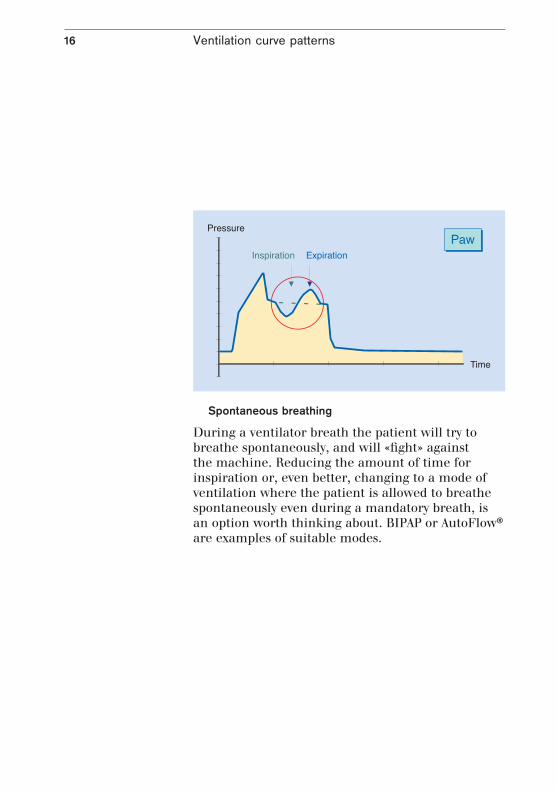
Spontaneous breathing
During a ventilator breath the patient will try to breathe spontaneously, and will «fight» against the machine. Reducing the amount of time for inspiration or, even better, changing to a mode of ventilation where the patient is allowed to breathe spontaneously even during a mandatory breath, is an option worth thinking about. BIPAP or AutoFlow® are examples of suitable modes.
Ventilation curve patterns 17
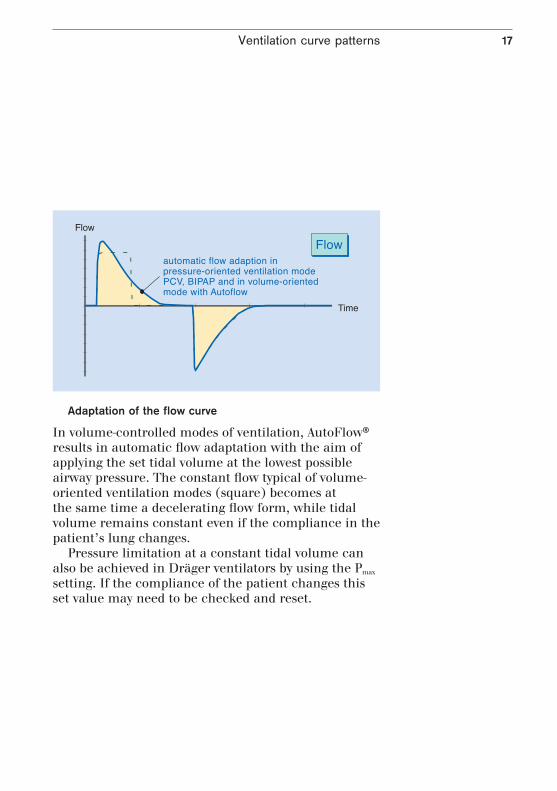
Adaptation of the flow curve
In volume-controlled modes of ventilation, AutoFlow® results in automatic flow adaptation with the aim of applying the set tidal volume at the lowest possible airway pressure. The constant flow typical of volume-oriented ventilation modes (square) becomes at the same time a decelerating flow form, while tidal volume remains constant even if the compliance in the patient’s lung changes.
Pressure limitation at a constant tidal volume can also be achieved in Dräger ventilators by using the Pmax setting. If the compliance of the patient changes this set value may need to be checked and reset.
Ventilation curve patterns18
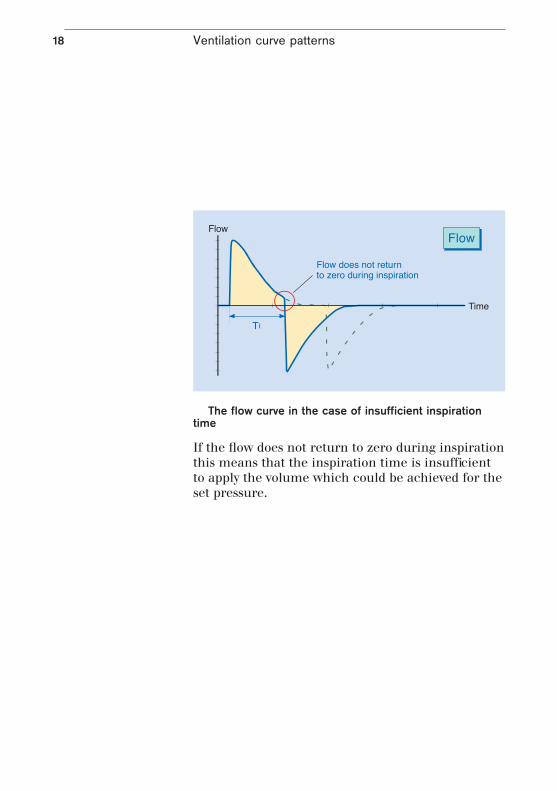
The flow curve in the case of insufficient inspiration time
If the flow does not return to zero during inspiration this means that the inspiration time is insufficient to apply the volume which could be achieved for the set pressure.
Ventilation curve patterns 19
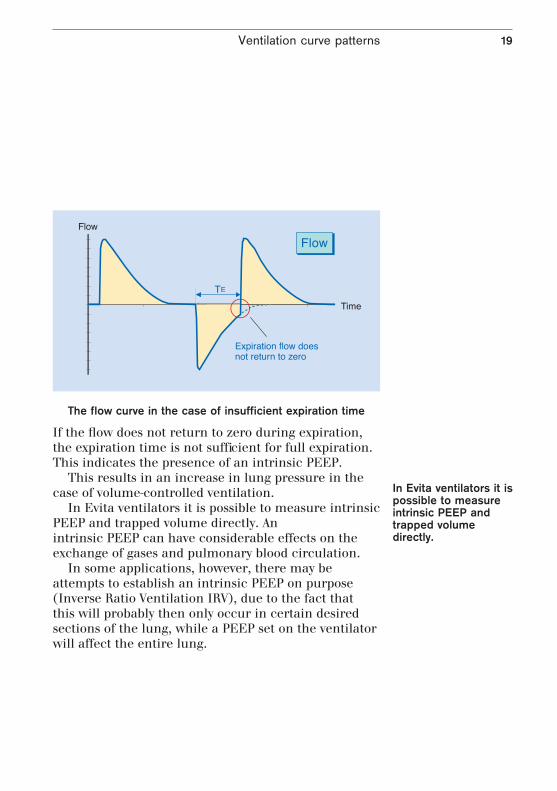
The flow curve in the case of insufficient expiration time
If the flow does not return to zero during expiration, the expiration time is not sufficient for full expiration. This indicates the presence of an intrinsic PEEP.
This results in an increase in lung pressure in the case of volume-controlled ventilation.
In Evita ventilators it is possible to measure intrinsic PEEP and trapped volume directly. An intrinsic PEEP can have considerable effects on the exchange of gases and pulmonary blood circulation.
In some applications, however, there may be attempts to establish an intrinsic PEEP on purpose (Inverse Ratio Ventilation IRV), due to the fact that this will probably then only occur in certain desired sections of the lung, while a PEEP set on the ventilator will affect the entire lung.
In Evita ventilators it is possible to measure intrinsic PEEP and trapped volume directly.

Ventilation curve patterns20
Flow curve in the case of increased expiratory resistances
A more gentle expiratory flow curve indicates increased expiratory resistances which may be caused by expiratory filters which have become damp or blocked as a result of nebulization. This may lead to a considerable increase in expiration time and a deviation from the set PEEP value.
21
Loops – a good thing all round
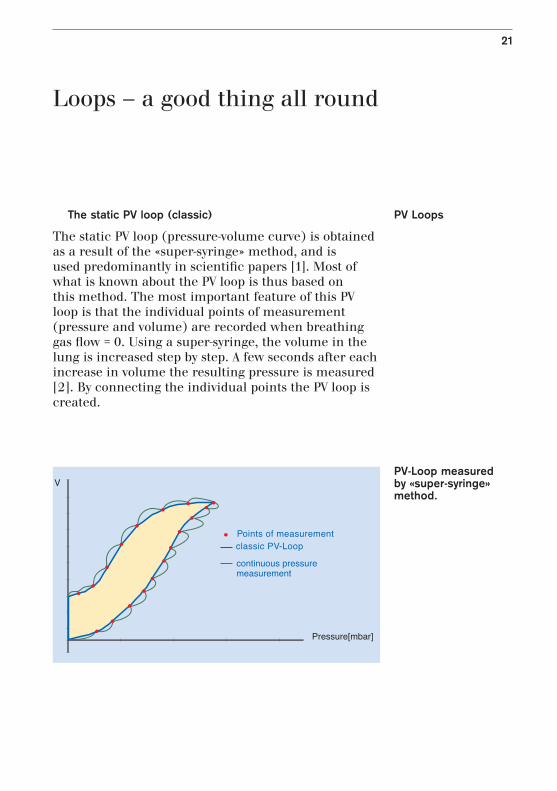
The static PV loop (classic)
The static PV loop (pressure-volume curve) is obtained as a result of the «super-syringe» method, and is used predominantly in scientific papers [1]. Most of what is known about the PV loop is thus based on this method. The most important feature of this PV loop is that the individual points of measurement (pressure and volume) are recorded when breathing gas flow = 0. Using a super-syringe, the volume in the lung is increased step by step. A few seconds after each increase in volume the resulting pressure is measured [2]. By connecting the individual points the PV loop is created.
PV Loops
PV-Loop measured by «super-syringe» method.

Loops – a good thing all round22
PV-Loop with upper and lower inflection point.
Loops – a good thing all round 23
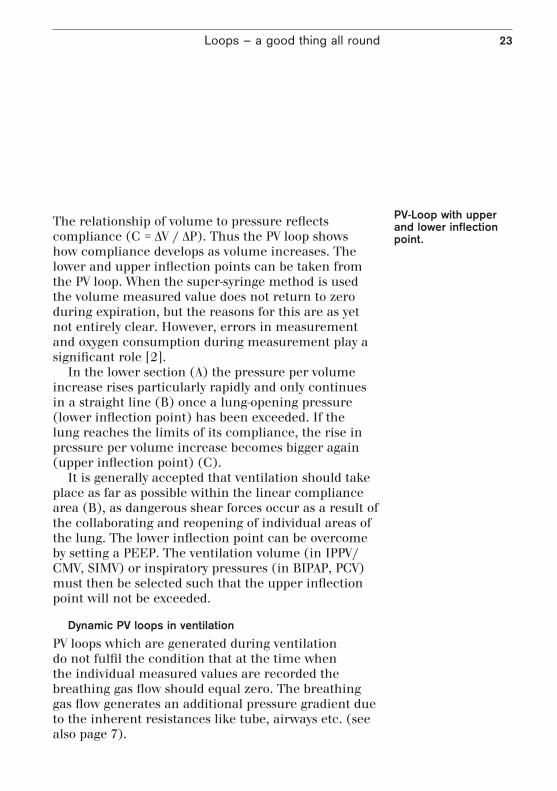
The relationship of volume to pressure reflects compliance (C = ΔV / ΔP). Thus the PV loop shows how compliance develops as volume increases. The lower and upper inflection points can be taken from the PV loop. When the super-syringe method is used the volume measured value does not return to zero during expiration, but the reasons for this are as yet not entirely clear. However, errors in measurement and oxygen consumption during measurement play a significant role [2].
In the lower section (A) the pressure per volume increase rises particularly rapidly and only continues in a straight line (B) once a lung-opening pressure (lower inflection point) has been exceeded. If the lung reaches the limits of its compliance, the rise in pressure per volume increase becomes bigger again (upper inflection point) (C).
It is generally accepted that ventilation should take place as far as possible within the linear compliance area (B), as dangerous shear forces occur as a result of the collaborating and reopening of individual areas of the lung. The lower inflection point can be overcome by setting a PEEP. The ventilation volume (in IPPV/CMV, SIMV) or inspiratory pressures (in BIPAP, PCV) must then be selected such that the upper inflection point will not be exceeded.
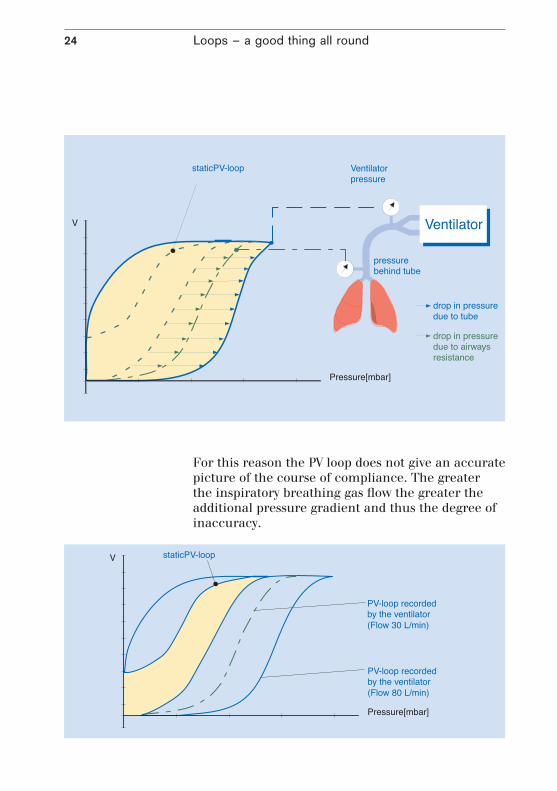
Dynamic PV loops in ventilationPV loops which are generated during ventilation do not fulfil the condition that at the time when the individual measured values are recorded the breathing gas flow should equal zero. The breathing gas flow generates an additional pressure gradient due to the inherent resistances like tube, airways etc. (see also page 7).
Loops – a good thing all round24
For this reason the PV loop does not give an accurate picture of the course of compliance. The greater the inspiratory breathing gas flow the greater the additional pressure gradient and thus the degree of inaccuracy.

In ventilation modes with decelerating flow (BIPAP, PCV etc.) it is not possible to draw conclusions from the PV loop concerning the development of compliance of the lung.
Loops – a good thing all round 25
Since ventilators open the exhalation valve either to ambient pressure or set PEEP at the beginning of expiration, the pressure displayed by the PV loop also falls almost immediately to this value.
In the static PV loop, on the other hand, the reduction is again a gradual process.
As regards the PV loop obtained for controlled ventilation it can generally be said that the slower the lung is filled the better the rising branch reflects the course of compliance.
A number of studies and publications have shown that PV loops recorded during the course of ventilation correlate well with loops from standard procedures, so long as the inspiratory flow is constant [3]. The studies are based on the assumption that the drop in pressure resulting from inspiratory resistances will also remain constant at constant flow, and that the steepness of the inspiratory loop will thus reflect only the elastance of thorax and lung. Although as a result the PV loop recorded by the ventilator is offset (the rising branch shifts position), it otherwise retains its original shape, on the basis of which conclusions can be drawn about compliance.
This also shows that in ventilation modes with decelerating flow (BIPAP, PCV etc.) it is not possible to draw conclusions from the PV loop concerning the development of compliance of the lung.
Loops – a good thing all round26
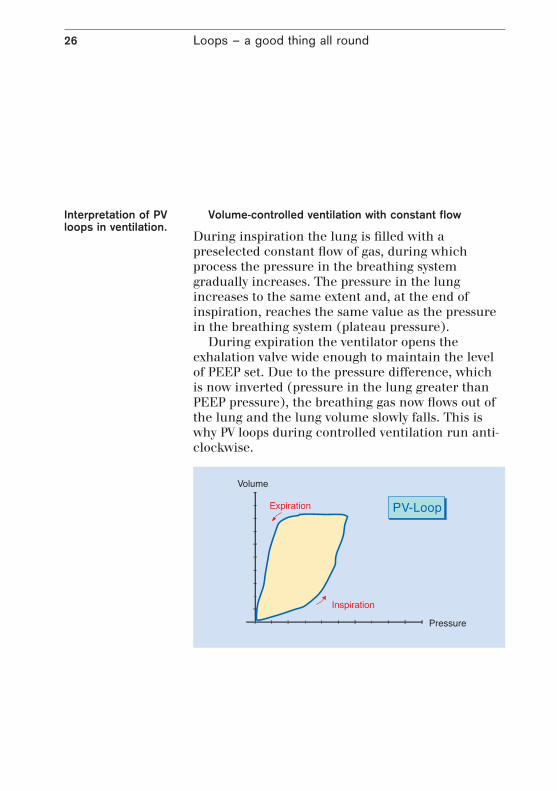
Volume-controlled ventilation with constant flow
During inspiration the lung is filled with a preselected constant flow of gas, during which process the pressure in the breathing system gradually increases. The pressure in the lung increases to the same extent and, at the end of inspiration, reaches the same value as the pressure in the breathing system (plateau pressure).
During expiration the ventilator opens the exhalation valve wide enough to maintain the level of PEEP set. Due to the pressure difference, which is now inverted (pressure in the lung greater than PEEP pressure), the breathing gas now flows out of the lung and the lung volume slowly falls. This is why PV loops during controlled ventilation run anti-clockwise.
Interpretation of PV loops in ventilation.

Loops – a good thing all round 27
Pressure-controlled ventilation (decelerating flow)
Even during pressure-controlled ventilation the PV loops run anti-clockwise. However, in this case the lung is not filled with an even gas flow. At the beginning of inspiration the ventilator generates a greater pressure in the ventilation system than in the lung, which is then kept constant by the ventilator throughout the entire inspiration. As a result of this difference in pressure air flows into the lung and the volume of the lung slowly increases. As the volume increases the pressure in the lung also rises and the difference between the lung pressure and the pressure in the breathing system becomes smaller.

Loops – a good thing all round28
Since due to the laws of physics the difference in pressure determines the resulting breathing flow, the breathing flow becomes ever smaller during inspiration, thus creating a decelerating flow.
The pressure in the breathing system is kept at a constant level by the ventilator throughout inspiration, giving the PV loop during pressure-controlled ventilation a more or less box-like shape.
Assumptions cannot be made on the basis of this loop about the course of lung compliance. When the breathing gas flow is equal to zero at the end of inspiration, however, the steepness of a line drawn between the start of inspiration (A) and the point at the end of inspiration (B) does represent a measure of dynamic compliance. This presupposes, however, that flow equals zero both at the end of inspiration and at the end of expiration.
Loops – a good thing all round 29
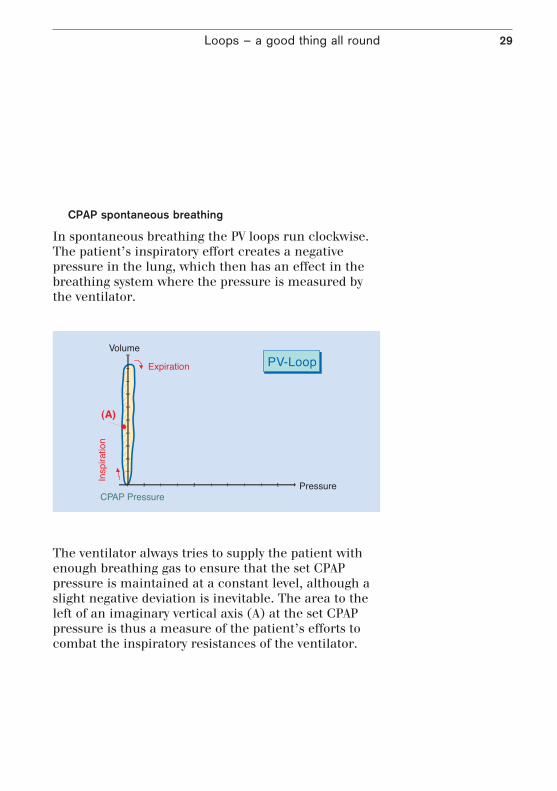
CPAP spontaneous breathing
In spontaneous breathing the PV loops run clockwise. The patient’s inspiratory effort creates a negative pressure in the lung, which then has an effect in the breathing system where the pressure is measured by the ventilator.
The ventilator always tries to supply the patient with enough breathing gas to ensure that the set CPAP pressure is maintained at a constant level, although a slight negative deviation is inevitable. The area to the left of an imaginary vertical axis (A) at the set CPAP pressure is thus a measure of the patient’s efforts to combat the inspiratory resistances of the ventilator.
Loops – a good thing all round30
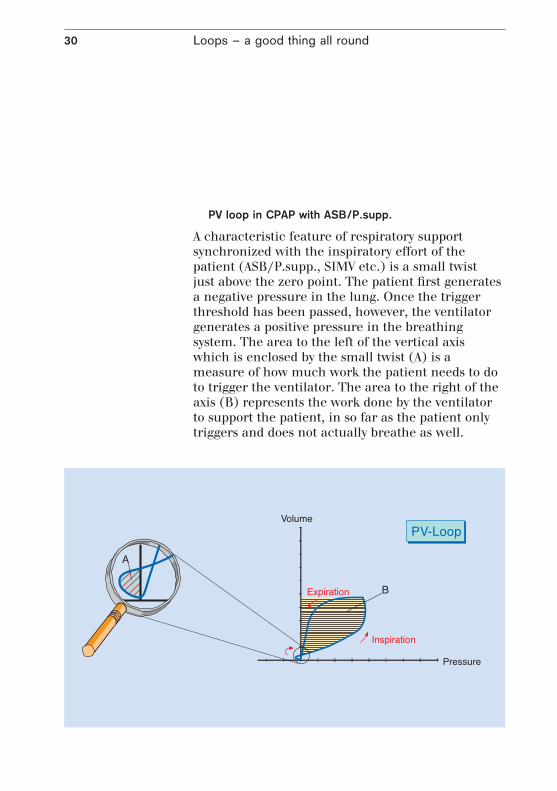
PV loop in CPAP with ASB/P.supp.
A characteristic feature of respiratory support synchronized with the inspiratory effort of the patient (ASB/P.supp., SIMV etc.) is a small twist just above the zero point. The patient first generates a negative pressure in the lung. Once the trigger threshold has been passed, however, the ventilator generates a positive pressure in the breathing system. The area to the left of the vertical axis which is enclosed by the small twist (A) is a measure of how much work the patient needs to do to trigger the ventilator. The area to the right of the axis (B) represents the work done by the ventilator to support the patient, in so far as the patient only triggers and does not actually breathe as well.

The change in steepness of the inspiratory branch of the PV loop is proportional to the change in lung compliance.
Loops – a good thing all round 31
PV loops in the case of compliance changes
As compliance decreases, in other words as the lung becomes less elastic, and the ventilator settings remain the same, the PV loop in volume-controlled ventilation takes an increasingly flat course.
The change in steepness of the inspiratory branch of the PV loop is proportional to the change in lung compliance.

Loops – a good thing all round32
PV loops in the case of resistance changesIf resistance changes during constant flow ventilation the steepness of the right branch of the loop remains unchanged, but changes position.
PV loop section reflecting lung over-extension
If during constant flow ventilation the loop starts to become flatter in the upper part of the inspiratory branch, then this could be an indication of over-extension of certain areas of the lung. See also «The static PV loop».

Loops – a good thing all round 33
PV loop in ASB/P.supp.
If during ASB/P.supp. the patient is only able to manage the trigger impulse and then does not continue to breathe, then only a volume equal to the support pressure in accordance to current lung compliance will be reached. However, if the patient continues an inspiratory effort throughout the entire support phase then he or she will be able to inhale greater volumes, whilst the support pressure remaining unchanged.
A change in the height of the PV loop is thus a measure of the strength of the patient’s inspiratory effort.
A patient is only prompted to make an inspiratory effort if the tidal volume which can be achieved by the set pressure support (without the patient’s own breathing) is smaller than the patient’s individual needs. On the other hand, the support pressure should at least compensate for the artificial airway resistances (tube) (see also «PV loops before and after the tube»).
‘
‘

Loops – a good thing all round34
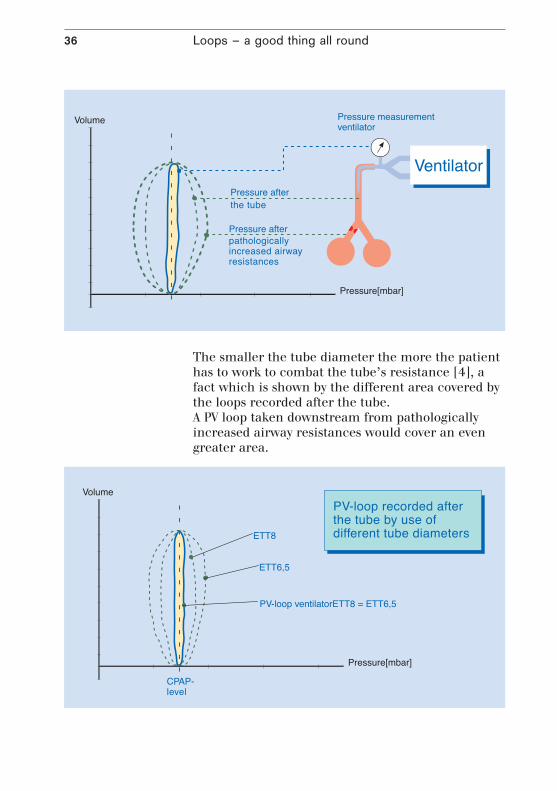
PV loops before and after the tube
The PV loop measured by the ventilator gives only half the picture. As described in the section «dynamic PV loop», further pressure drops occur after the point where the ventilator takes the pressure measurement (Y-piece) e.g. across the tube length and the physio logical airways.
PV loop in CPAP before and after the tubeThe PV loop displayed by the ventilator shows a narrow loop for purely spontaneous patient breathing at an increased pressure level (CPAP). The narrower the area to the left of the vertical axis, the less additional work of breathing needs to be done to combat the ventilator’s inspiratory resistances. The area to the right of the axis, on the other hand, is only deter mined by the expiratory resistances of the ventilator. The entire area which the loop encompasses is thus at the same time a measure of the quality of the ventilator, although it should be remembered that for the purposes of a direct comparison of ventilators the same system of measurement needs to be used for all ventilators, since the specifications of the various systems may differ considerably from one another. A further consideration is the fact that some ventilators apply a small additional support pressure (some 3 mbar) even when no support pressure has been set, thus making a direct comparison no longer possible.
The narrower the area to the left of the vertical axis, the less additional work of breathing needs to be done to combat the ventilator’s inspiratory resistances.

Loops – a good thing all round 35
The belief that a narrow PV loop is synonymous with less work of breathing for the patient is not correct in every case.
A comparison with a loop recorded directly after the tube shows that this loop covers a considerably greater area. Due to the comparatively small diameter of the tube the patient must do considerably more work of breathing.
Loops – a good thing all round36
The smaller the tube diameter the more the patient has to work to combat the tube’s resistance [4], a fact which is shown by the different area covered by the loops recorded after the tube.A PV loop taken downstream from pathologically increased airway resistances would cover an even greater area.

Loops – a good thing all round 37
Assistance from pressure support (ASB)
Increased airway resistances, whether caused by disease or intubation, thus result in increased work of breathing for the patient.
The reason for setting assisted spontaneous breath-ing (ASB/P.supp.) is generally to try to compensate for these airway resistances. A comparison with loops recorded during CPAP shows that the area of the loop taken after the tube can also be reduced with ASB/P.supp.
If the inspiratory branch of the loop lies exactly on the vertical line of the CPAP set value, the tube resistance will only just be compensated for. If the inspiratory branch lies to the right of the CPAP line then support is provided above and beyond merely compensating for the tube resistance, thus compensating for possible pathological resistances in the lower airways. If the

Loops – a good thing all round38
support pressure is inadequate and the patient is being forced to inhale, however, negative pressure may still occur at the distal end of the tube.
Unfortunately, the PV loop at the distal end of the tube is not usually available. In the Evita 4 and Evita 2 dura with ATC® (Automatic Tube Compensation), it is now possible for the first time to display a PV loop after the tube. The flow-dependent drop in pressure across the tube is measured in real-time, and the pressure after the tube (tracheal pressure Ptrach) is then calculated on this basis. The PtrachV loop thus allows the physician to assess to what extent the ventilator is actually supporting the patient‘s breathing and how much of the work of breathing the patient is doing himself.
Loops – other possibilitiesIn addition to pressure-volume (PV) loops, other combinations of parameters are also possible. Some of these are already used in pulmonology but are not particularly widespread in intensive care medicine. Some diagnostic procedures require the patient’s cooperation.
Flow-volume loopThe flow-volume loop is occasionally used to obtain information about airway resistance, when aspiration should be carried out and about the patient’s reaction to bronchial therapy.
Increased airway resistances as a result of sputum etc. can in many patients be recognized by a saw-toothed-shape loop. A smoother loop then verifies that measures such as suctioning which ATC® is a registered trademark of Drägerwerk AG in Germany and the USA
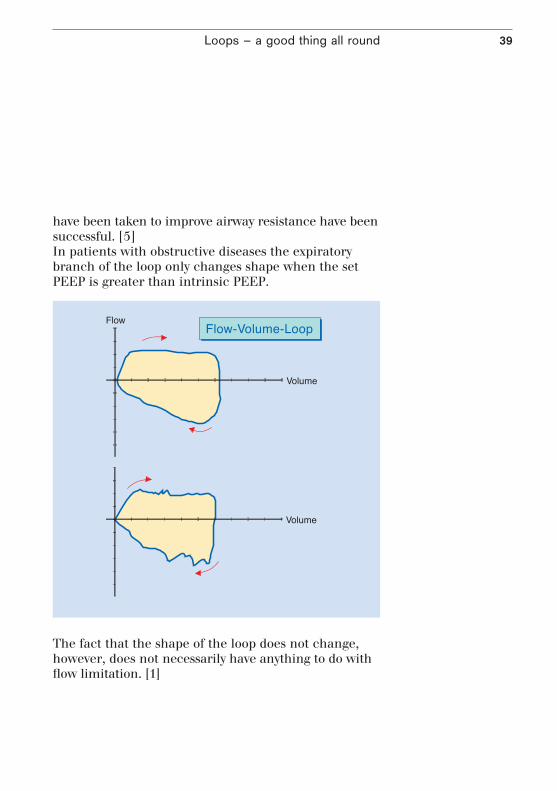
Loops – a good thing all round 39
have been taken to improve airway resistance have been successful. [5]In patients with obstructive diseases the expiratory branch of the loop only changes shape when the set PEEP is greater than intrinsic PEEP.
The fact that the shape of the loop does not change, however, does not necessarily have anything to do with flow limitation. [1]

40
Trends reviewed
Graphic trend displays enable ventilation processes to be assessed at a later stage, with the development of continuously measured values displayed in graphic form. Trend displays may be of interest in a variety of different applications, and each application will require a different period of observation. For instance, for assessing a process of weaning, several days or even weeks will need to be displayed in one diagram, while an event which occurs suddenly calls for as much detail as possible to be shown in the diagram.
The areas of application for trend displays in ventilation are extremely varied due to the wide range of possible combinations of the individual parameters. The following are just a few examples, designed to make the reader think of further possible applications.
Trends reviewed 41
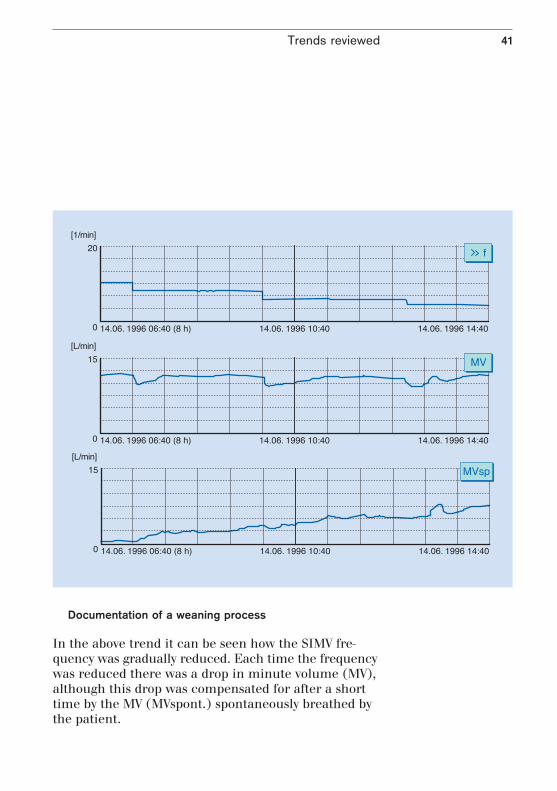
Documentation of a weaning process
In the above trend it can be seen how the SIMV fre-quency was gradually reduced. Each time the frequency was reduced there was a drop in minute volume (MV), although this drop was compensated for after a short time by the MV (MVspont.) spontaneously breathed by the patient.

Trends reviewed42
The second trend display shows the further course of the weaning process and its effects. Above a particular IMV frequency this was kept constant and only the pressure support was reduced. Initially this reduction was also compensated for by the patient, though later on a lasting reduction in MV can be seen, after which the ventilator support was once again increased.

Trends reviewed 43
Lung parameters based on peak and plateau pressure
As already described in the chapter on curves, the changes in peak pressure and plateau pressure allow statements to be made about airway resistance and lung compliance. Thus the trend display of both these parameters is at the same time a trend of R and C.
If during volume-controlled ventilation without pressure-limiting peak pressure (Ppeak) increases while plateau pressure (Pplat) remains constant, then this indicates an increase in airway resistance. This may be caused among other things by constriction of the airways by secretion on account of insufficient suctioning or aspiration.
If both peak pressure (Ppeak) and plateau pressure (Pplat) increase, then this indicates falling compliance.

44
Capnography – keeping an eye on the details
Besides the uptake of O2, the removal of CO2 is the most important function of respiration, and therefore the proportion of CO2 in the exhaled air is closely related to the physiological processes in the human body. The size and development over time of the proportion of CO2 in the gas mixture flowing past the Y-piece is thus a meaningful parameter with regard to patient status and the success of therapy.
The graphical representation of the proportion of CO2 in the breathing air and its development over time is called a capnogram. Normally, this curve is displayed as CO2 partial pressure or is given in volume percent. During inspiration, the CO2 partial pressure of the inhaled air is virtually zero, assuming that the open breathing systems normally used in long-term ventilation are used. At the onset of expiration, the proportion of CO2 in the exhaled gas mix is initially low, and it is only after exhalation of the dead space volume not involved in the process of gas exchange that an increase in the proportion of CO2 can be observed. The capnogram finally reaches a plateau phase during which the CO2 proportion rises only slowly. When the next inspiration starts, the curve quickly drops back to the value of the inhaled gas mixture.
However, it is not only the capnogram itself which is of interest, but also the parameters which can be derived from it. The endtidal CO2 proportion of breathing air is shown by the height of the plateau phase at the end of expiration. The integration of the exhaled CO2 over time, i.e. the exhaled CO2 volume per unit time, is described as CO2 elimination. Furthermore, capnography allows a calculation of the dead space volume which does
Capnography – keeping an eye on the details 45
not take part in the gas exchange process during a breathing cycle. In this context, the dead space volume per breath as a proportion of the overall tidal volume is of particular interest.
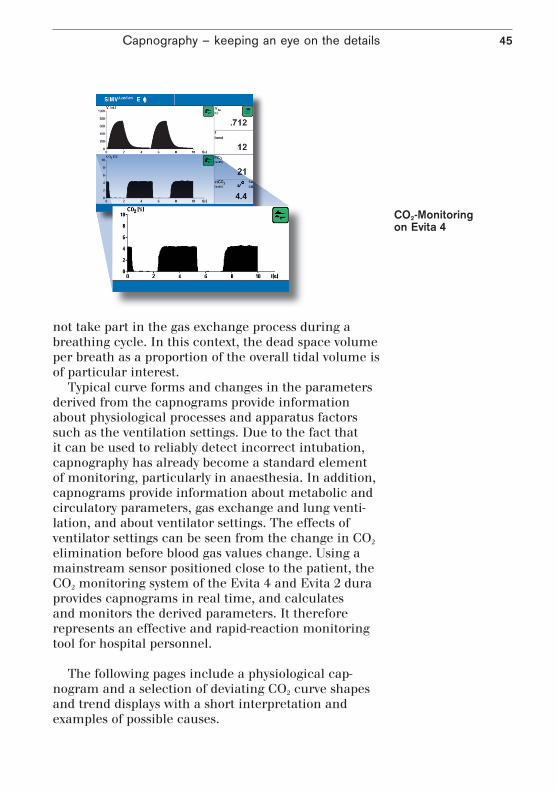
Typical curve forms and changes in the parameters derived from the capnograms provide information about physiological processes and apparatus factors such as the ventilation settings. Due to the fact that it can be used to reliably detect incorrect intubation, capnography has already become a standard element of monitoring, particularly in anaesthesia. In addition, capnograms provide information about metabolic and circulatory parameters, gas exchange and lung venti-lation, and about ventilator settings. The effects of ventilator settings can be seen from the change in CO2 elimination before blood gas values change. Using a mainstream sensor positioned close to the patient, the CO2 monitoring system of the Evita 4 and Evita 2 dura provides capnograms in real time, and calculates and monitors the derived parameters. It therefore represents an effective and rapid-reaction monitoring tool for hospital personnel.
The following pages include a physiological cap-
nogram and a selection of deviating CO2 curve shapes and trend displays with a short interpretation and examples of possible causes.
CO2-Monitoring on Evita 4

Capnography – keeping an eye on the details46
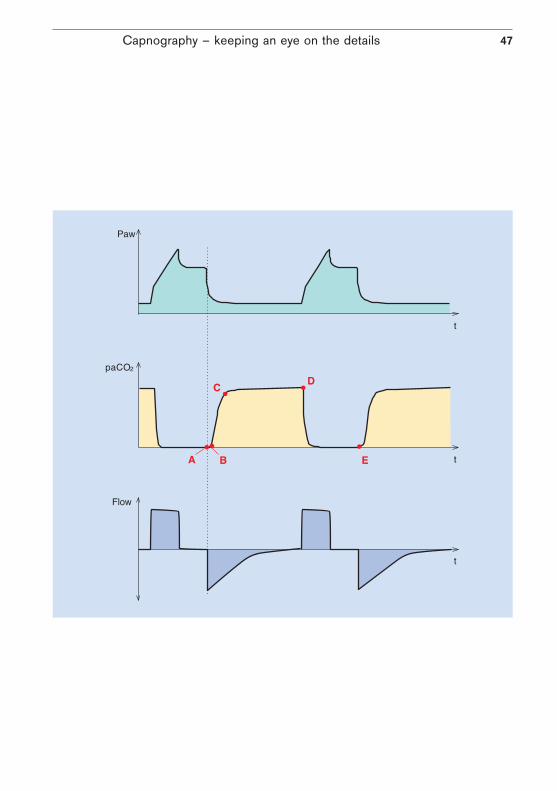
The physiological capnogram
A - B: Emptying of the upper dead space of the airways The CO2 concentration in this section of the curve equals zero, as this is the first phase of expiration during which air from the upper airways, which has not been involved in the process of gas exchange, is analysed.
B - C: Gas from the lower dead space and alveoli The CO2 concentration increases continuously, as the air being analysed comes partly from the upper airways and partly from the alveoli which are rich in CO2.
C - D: Alveolar gas This phase is described as the «alveolar plateau». The curve rises very slowly. The air being analysed comes mainly from the alveolar area.
D: Endtidal CO2 partial pressure Represents the highest possible concentration of exhaled CO2 and is reached at the end of expiration. This point is described as endtidal CO2 (etCO2) and represents the final portion of air which was involved in the exchange of gases in the alveolar area. It thus represents under certain conditions a reliable index of CO2 partial pressure in the arterial blood. Normal values for endtidal CO2 concentration approx. 5.0-5.3 %, 5.1-5.3 kPa or 38-40 mmHg
D - E: Inspiration The CO2 concentration falls rapidly, as fresh gas not containing CO2 forces its way into the airways at the beginning of inspiration.
Capnography – keeping an eye on the details 47

Capnography – keeping an eye on the details48
Exponential fall in pCO2
Possible causes:– Cardiopulmonary bypass– Cardiac arrest– Pulmonary embolism– Large loss of blood– Sudden drop in blood pressure
Interpretations of capnogram

Capnography – keeping an eye on the details 49
A persistently low pCO2
Possible causes:– Hyperventilation as a result of high minute volume– Low body temperature– Following shock
Capnography – keeping an eye on the details50
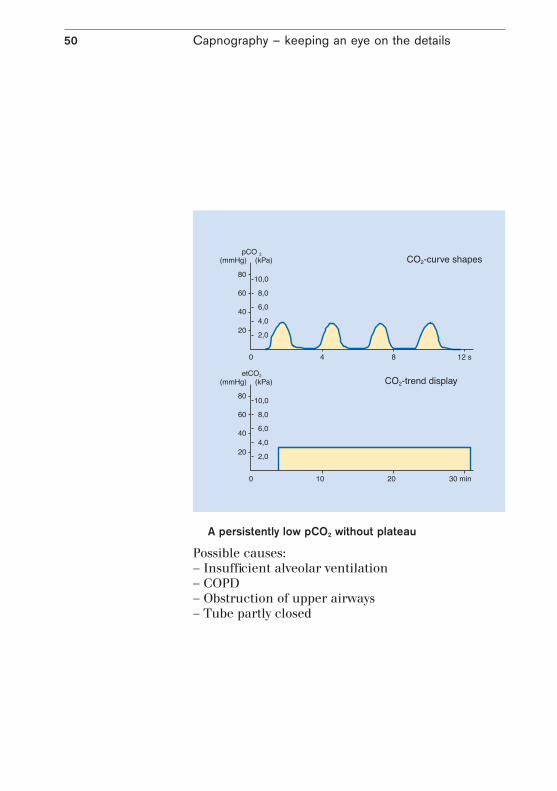
A persistently low pCO2 without plateau
Possible causes:– Insufficient alveolar ventilation– COPD– Obstruction of upper airways– Tube partly closed
Capnography – keeping an eye on the details 51
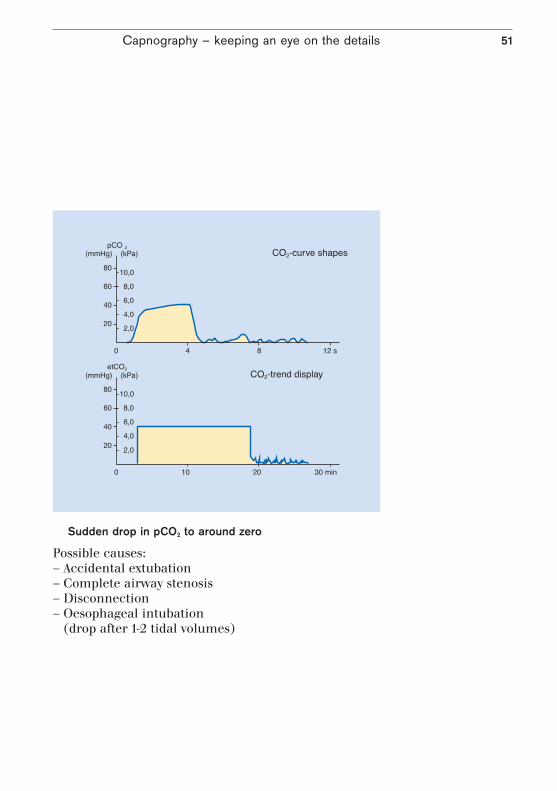
Sudden drop in pCO2 to around zero
Possible causes:– Accidental extubation– Complete airway stenosis– Disconnection– Oesophageal intubation
(drop after 1-2 tidal volumes)

Capnography – keeping an eye on the details52
Gradual increase in pCO2
Possible causes:– Increase in metabolism and body temperature
(with MV=const.)– Beginning of hypoventilation– Reduction in effective alveolar ventilation

Capnography – keeping an eye on the details 53
Sudden drop in pCO2, but still above zero
Possible causes:– Leaks in hose system (tube)– Partial airway stenosis– Tube in laryngopharynx
Capnography – keeping an eye on the details54
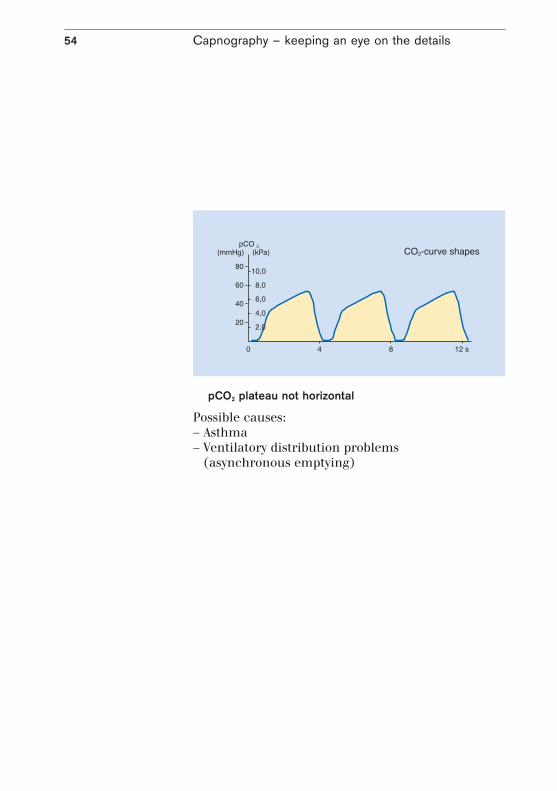
pCO2 plateau not horizontal
Possible causes:– Asthma– Ventilatory distribution problems
(asynchronous emptying)

Capnography – keeping an eye on the details 55
A constantly high pCO2
Possible causes:– Respiratory depression due to drugs– Metabolic alkalosis (respiratory compensation)– Insufficient minute ventilation
56
Literature
[1] A. Nahum, Use of Pressure and Flow Waveforms to Monitor Mechanically Ventilated Patients, Yearbook of Intensive Care and Emergency Medicine 1995, 89-114
[2] Sydow M.,Burchardi H.,Zinserling J., Ische H., Crozier Th.A., Weyland W. Improved determination of static compliance …; Intensive Care Med (1991) 17:108-114
[3] Marco Ranieri, Rocco Giuliani, Tommaso Fiore, Michele Dambrosio, Joseph Milic-Emili. Volume-Pressure Curve of the Respiratory System Predicts Effects of PEEP in ARDS: «Occlusion» versus «Constant Flow» Technique. Am J Respir Crit Care Med.; Vol 149. pp 19-27, 1994
56[4] Michael Shapiro, MD; R. Keith Wilson, MD; Gregorio Casar, MD; Kim Bloom, MD; Robert B. Teague, MD. Work of breathing through different sized endotracheal tubes. Critical Care Medicine, Vol. 14, No. 12
56[5] Jurban A, Tobin MJ (1994) Use of Flow-Volume curves in detecting secretions in ventilator dependent patients. Am J Respir Crit Care Med 150:766-769

57

58

59

90 9
7 42
1 |
15.0
7-2
| C
omm
unic
atio
ns &
Sal
es M
arke
ting
| P
P |
LE
| P
rinte
d in
Ger
man
y |
Sub
ject
to m
odifi
catio
ns |
© 2
015
Drä
gerw
erk
AG &
Co.
KG
aA
CORPORATE HEADQUARTERSDrägerwerk AG & Co. KGaAMoislinger Allee 53–5523558 Lübeck, Germany
www.draeger.com
Manufacturer:Drägerwerk AG & Co. KGaAMoislinger Allee 53–5523558 Lübeck, Germany
REGION EUROPE CENTRAL AND EUROPE NORTHDrägerwerk AG & Co. KGaA Moislinger Allee 53–5523558 Lübeck, GermanyTel +49 451 882 0Fax +49 451 882 [email protected]
REGION EUROPE SOUTHDräger Médical S.A.S. Parc de Haute Technologie d’Antony 225, rue Georges Besse92182 Antony Cedex, FranceTel +33 1 46 11 56 00Fax +33 1 40 96 97 [email protected]
REGION MIDDLE EAST, AFRICADrägerwerk AG & Co. KGaABranch OfficeP.O. Box 505108Dubai, United Arab EmiratesTel +971 4 4294 600Fax +971 4 4294 [email protected]
Locate your Regional Sales Representative at: www.draeger.com/contact
REGION ASIA / PACIFICDraeger Medical South East Asia Pte Ltd.25 International Business Park#04-27/29 German CentreSingapore 609916, SingaporeTel +65 6572 4388Fax +65 6572 4399 [email protected]
REGION NORTH AMERICADraeger Medical, Inc.3135 Quarry Road Telford, PA 18969-1042, USATel +1 215 721 5400Toll-free+1 800 437 2437Fax +1 215 723 [email protected]
REGION CENTRAL AND SOUTH AMERICADräger Panama Comercial S. de R.L.Complejo Business Park, V tower, 10th floorPanama CityTel +507 377 9100Fax +507 377 [email protected]


