An innovative precast concrete (PC) T-wall panel system was devel-oped to enhance constructibility and lateral load resistance of fast-track, low-rise buildings. The system consists of bolt-type connec-tions between PC wall panels and emulated cast-in-place joints between the flange-wall and web-wall components. To confirm its lateral-load-resisting and seismic performance, reversed cyclic tests of two two-thirds-scale PC T-walls with and without diag-onal reinforcing bars were conducted under displacement control. Test results showed that the T-wall specimen without diagonal reinforcement performed reasonably well in terms of lateral stiff-ness, strength, and ductility, except for slip behavior. On the other hand, the use of supplementary diagonal reinforcement in each panel adversely affected the lateral ductility and energy dissipating capacity. All the details of the bolt-type connections between the lower and upper panels proved to be robust and practical. Finally, simplified prediction methods for strength and displacement are presented that can be used to develop design guidelines.
INTRODUCTIONReinforced concrete (RC) structural walls with various
cross sections such as T-shaped, L-shaped, and rectangular sections have been used for both low- and high-rise build-ings in many countries. Such asymmetric wall systems are often necessary for architectural purposes; however, the asymmetric walls tend to influence the structural behavior, constructability, and economic feasibility of a building depending on their arrangement and cross-sectional shapes. The T-walls have asymmetric characteristics in terms of lateral strength, stiffness, and ductility. When the web of a T-wall is subjected to compressive force, the depth of the neutral axis is larger than that of a rectangular wall with same width; consequently, brittle failure may occur due to the concrete crushing in the narrow compression zone. Conversely, when the web-wall is subjected to tensile force, the neutral axis depth is significantly small and is typically located in the flange wall, which induces greater ductility at the ultimate limit state.
Several researchers have investigated the behavior and design of reinforced concrete T-walls.1-4 However, to the authors’ knowledge, no previous experimental and analytical studies of precast concrete (PC) “T-walls” were conducted, though a handful of previous experimental research programs on the behavior of PC “rectangular walls” were carried out.5-10 Lateral load resistance of PC walls is gener-ally achieved by emulating cast-in-place detailing or by the use of post-tensioning. In this study, the former method is adopted to connect two rectangular walls, along with an innovative bolting system consisting of end-threaded rein-
forcing bars, hex nuts, and C-shaped steel plate connec-tions (Fig. 1). The T-walls are developed for fast low-rise construction, as it enhances the constructibility and lateral load resistance of low-rise precast buildings.
RESEARCH SIGNIFICANCEAn innovative PC T-wall system was proposed that would
improve constructibility and provide the lateral load resis-tance of low-rise PC buildings, and their seismic perfor-mance was verified by cyclic lateral testing. The PC T-wall system consists of several modular PC panels with bolt-type connections and cast-in-place concrete at the interface of flange- and web walls. Two two-thirds-scale specimens with and without diagonal reinforcement in the panel were tested under reversed cyclic deformations. Promising results from the tests verify practical feasibility of the developed system.
TEST PROGRAMDevelopment of C-shaped steel plate connection
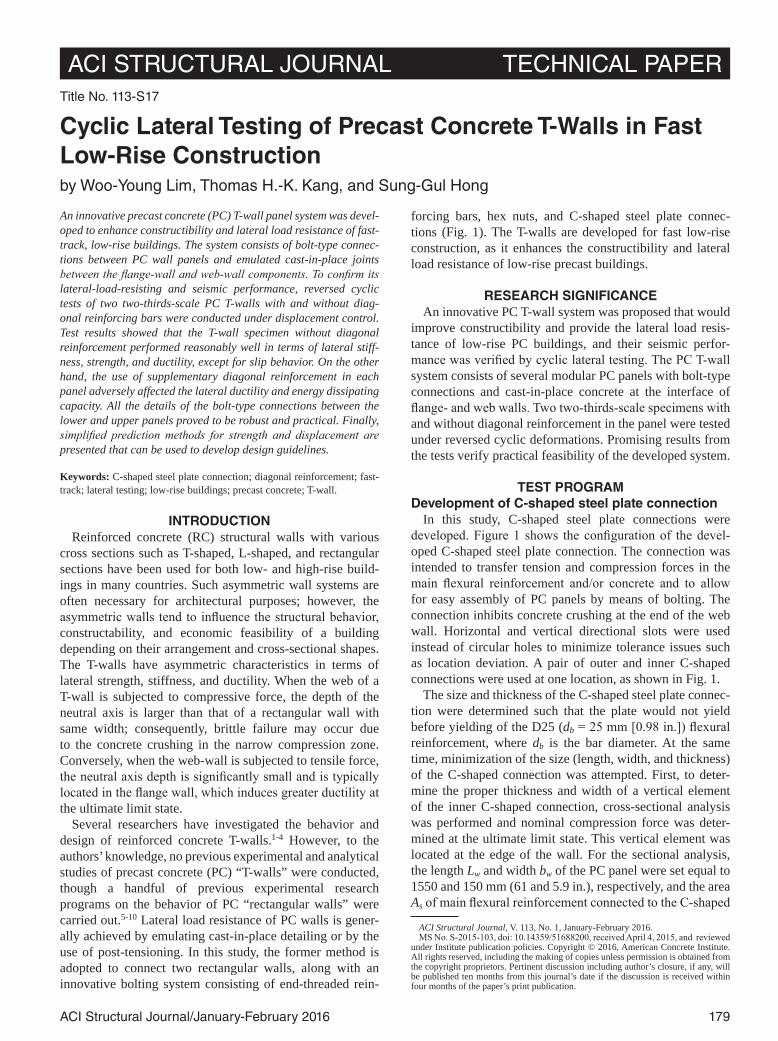
In this study, C-shaped steel plate connections were developed. Figure 1 shows the configuration of the devel-oped C-shaped steel plate connection. The connection was intended to transfer tension and compression forces in the main flexural reinforcement and/or concrete and to allow for easy assembly of PC panels by means of bolting. The connection inhibits concrete crushing at the end of the web wall. Horizontal and vertical directional slots were used instead of circular holes to minimize tolerance issues such as location deviation. A pair of outer and inner C-shaped connections were used at one location, as shown in Fig. 1.
The size and thickness of the C-shaped steel plate connec-tion were determined such that the plate would not yield before yielding of the D25 (db = 25 mm [0.98 in.]) flexural reinforcement, where db is the bar diameter. At the same time, minimization of the size (length, width, and thickness) of the C-shaped connection was attempted. First, to deter-mine the proper thickness and width of a vertical element of the inner C-shaped connection, cross-sectional analysis was performed and nominal compression force was deter-mined at the ultimate limit state. This vertical element was located at the edge of the wall. For the sectional analysis, the length Lw and width bw of the PC panel were set equal to 1550 and 150 mm (61 and 5.9 in.), respectively, and the area As of main flexural reinforcement connected to the C-shaped
Title No. 113-S17
Cyclic Lateral Testing of Precast Concrete T-Walls in Fast Low-Rise Constructionby Woo-Young Lim, Thomas H.-K. Kang, and Sung-Gul Hong
ACI Structural Journal, V. 113, No. 1, January-February 2016.MS No. S-2015-103, doi: 10.14359/51688200, received April 4, 2015, and reviewed
connection was assumed to be 506.7 mm2 (0.785 in.2). As a result, the thickness of the vertical element of the inner connection was determined as 30 mm (1.18 in.).
For the outer connection, the thickness and width of a horizontal element were determined such that yielding of the plate would not occur prior to yielding of the main rein-forcement. The fixed end of the plate was assumed and the horizontal element was subjected to a tension force equiv-alent to the specified yield strength of the main reinforce-ment. Once the horizontal element size was determined, the same dimension was used for two vertical elements of the inner connection after checking their buckling strengths under force reversal. As such, the resulting cross-sectional dimensions of the inner and outer connections were 160 x 150 mm (6.3 x 5.9 in.) and 140 x 150 mm (5.5 x 5.9 in.), respectively (refer to Fig. 1). The heights of the inner and
outer connections were determined to be 250 mm (9.8 in.) and 210 mm (8.3 in.), respectively. These C-shaped steel plate connections are used as a link between the PC panels or between the PC panel and foundation, as detailed in the following section.
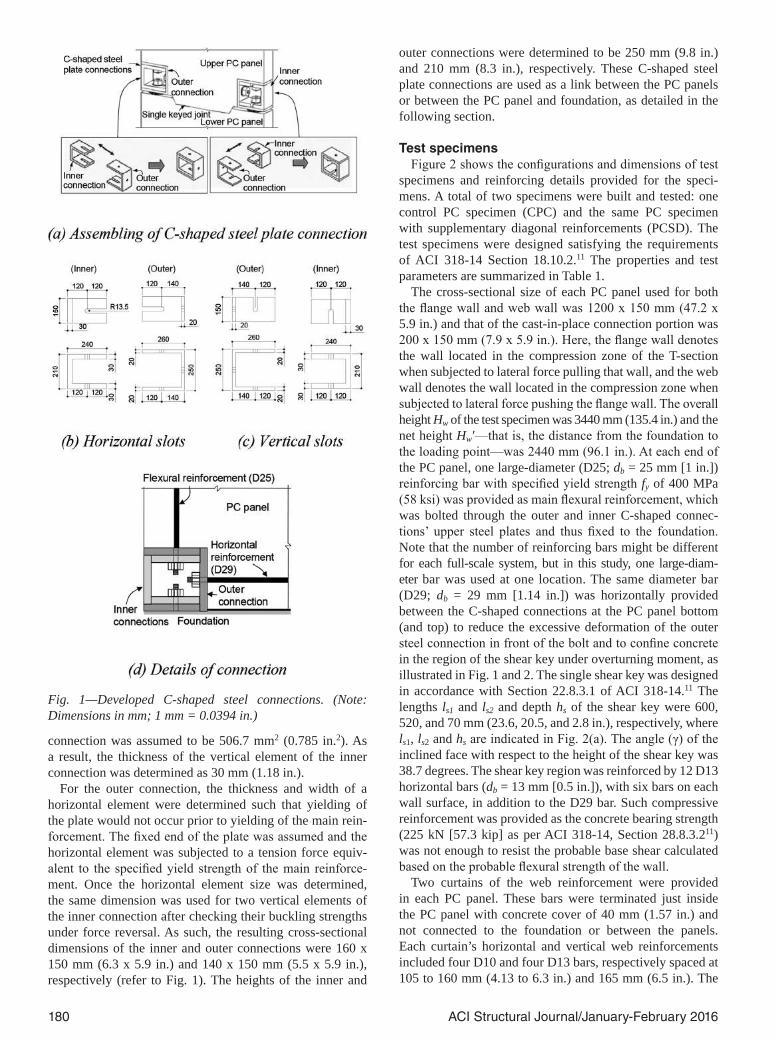
Test specimensFigure 2 shows the configurations and dimensions of test
specimens and reinforcing details provided for the speci-mens. A total of two specimens were built and tested: one control PC specimen (CPC) and the same PC specimen with supplementary diagonal reinforcements (PCSD). The test specimens were designed satisfying the requirements of ACI 318-14 Section 18.10.2.11 The properties and test parameters are summarized in Table 1.
The cross-sectional size of each PC panel used for both the flange wall and web wall was 1200 x 150 mm (47.2 x 5.9 in.) and that of the cast-in-place connection portion was 200 x 150 mm (7.9 x 5.9 in.). Here, the flange wall denotes the wall located in the compression zone of the T-section when subjected to lateral force pulling that wall, and the web wall denotes the wall located in the compression zone when subjected to lateral force pushing the flange wall. The overall height Hw of the test specimen was 3440 mm (135.4 in.) and the net height Hw′—that is, the distance from the foundation to the loading point—was 2440 mm (96.1 in.). At each end of the PC panel, one large-diameter (D25; db = 25 mm [1 in.]) reinforcing bar with specified yield strength fy of 400 MPa (58 ksi) was provided as main flexural reinforcement, which was bolted through the outer and inner C-shaped connec-tions’ upper steel plates and thus fixed to the foundation. Note that the number of reinforcing bars might be different for each full-scale system, but in this study, one large-diam-eter bar was used at one location. The same diameter bar (D29; db = 29 mm [1.14 in.]) was horizontally provided between the C-shaped connections at the PC panel bottom (and top) to reduce the excessive deformation of the outer steel connection in front of the bolt and to confine concrete in the region of the shear key under overturning moment, as illustrated in Fig. 1 and 2. The single shear key was designed in accordance with Section 22.8.3.1 of ACI 318-14.11 The lengths ls1 and ls2 and depth hs of the shear key were 600, 520, and 70 mm (23.6, 20.5, and 2.8 in.), respectively, where ls1, ls2 and hs are indicated in Fig. 2(a). The angle (γ) of the inclined face with respect to the height of the shear key was 38.7 degrees. The shear key region was reinforced by 12 D13 horizontal bars (db = 13 mm [0.5 in.]), with six bars on each wall surface, in addition to the D29 bar. Such compressive reinforcement was provided as the concrete bearing strength (225 kN [57.3 kip] as per ACI 318-14, Section 28.8.3.211) was not enough to resist the probable base shear calculated based on the probable flexural strength of the wall.
Two curtains of the web reinforcement were provided in each PC panel. These bars were terminated just inside the PC panel with concrete cover of 40 mm (1.57 in.) and not connected to the foundation or between the panels. Each curtain’s horizontal and vertical web reinforcements included four D10 and four D13 bars, respectively spaced at 105 to 160 mm (4.13 to 6.3 in.) and 165 mm (6.5 in.). The
Fig. 1—Developed C-shaped steel connections. (Note: Dimensions in mm; 1 mm = 0.0394 in.)
181ACI Structural Journal/January-February 2016
horizontal and vertical web reinforcing ratios were 0.63 and 1.47%, sufficiently larger than the required ratio (0.25%) by ACI 318-14 Section 18.10.2.1.11
For Specimen PCSD, 16 D13 diagonal reinforcing bars (db = 13 mm [0.5 in.]) were additionally placed in each PC wall, with eight installed on each surface of the PC panel, as shown in Fig. 2(a) and 2(c). The diagonal reinforcement had yield strength fy of 400 MPa (58 ksi). The lateral shear force
was designed to be transferred by the interfacial shear friction, the shear key action, and the dowel action of the flexural reinforcement at the base of the wall. The joint between the PC flange- and web walls was placed in place.
Design of cast-in-place concrete jointThe cast-in-place (CIP) joint connecting flange and web
walls had dimensions of 200 x 150 x 2440 mm (7.9 x 5.9 x 96.1 in.) and its size was minimized without sacrificing constructibility. In the connection, the vertical web rein-forcement was provided based on the strain compatibility at the ultimate limit state (that is, when the strain of the extreme compression fiber in the web wall reaches 0.003). For horizontal web reinforcement, the stress friction design method was applied, as explained later in this section. The horizontal web bars were post-installed onto the edge of the web wall after injecting chemical mortar into drilled holes, and were overlapped in the CIP joint with the portion of closed hoops partially protruded from the flange wall (refer to Fig. 3). The closed hoops were spaced at 165 mm (6.5 in.) to provide confinement for the CIP portion. Finally, before mortar placement, four vertical D13 (db = 13 mm [0.5 in.]) bars were inserted inside the closed hoops and anchored to the foundation using couplers and hooked anchorage connected to the coupler in the foundation. The mortar used in the connection is the bar connection sleeve (BCS) mortar,
Fig. 2—Details of test specimens. (Note: Dimensions in mm; 1 mm = 0.0394 in.)
Fig. 3—Assembly process of CIP joint.
182 ACI Structural Journal/January-February 2016
a special flowable mortar with 50 MPa (3.5 ksi) compressive strength and superior bond strength.
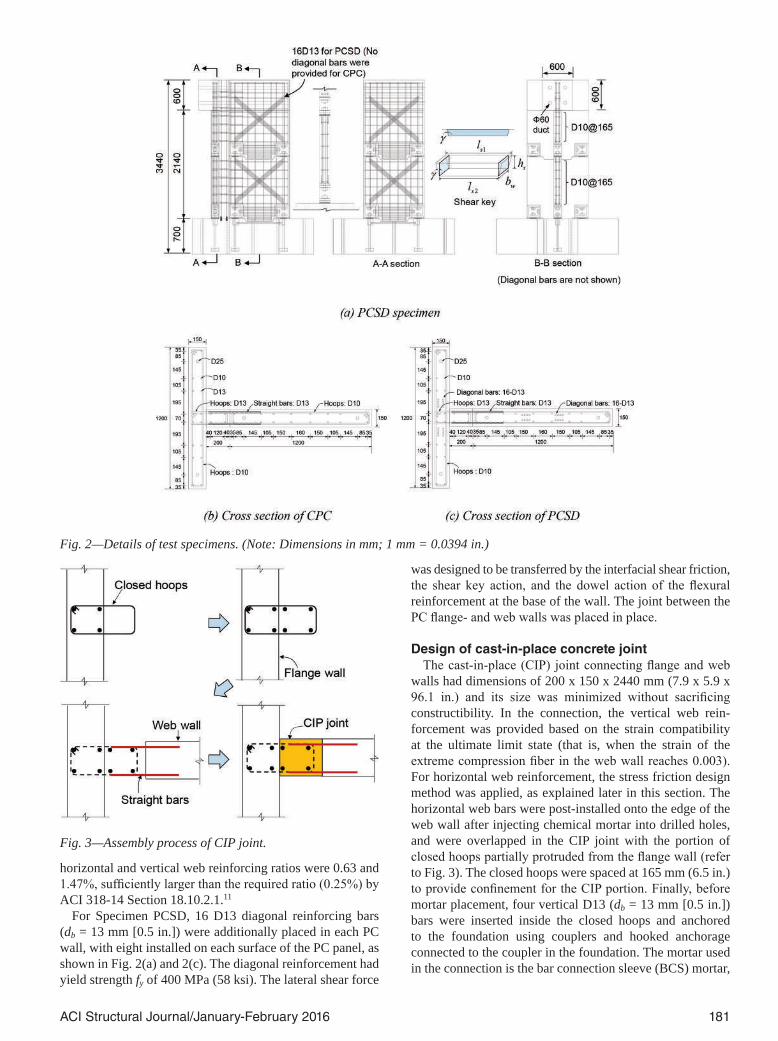
When the well-connected PC T-wall system is subjected to the lateral deformation causing tension in the flange wall, the shear stress distribution shown in Fig. 4 is expected to occur. Based on this distribution and Section 22.9.4.2 of ACI 318-14,11 the area of the horizontal web reinforcement can be determined as follows
AV
fvfu
yt
≥φ µ
(1)
where Avf is the total area of the horizontal web reinforce-ment in the CIP joint; Vu is the maximum applied shear of τ2@CIPAvi at the vertical interface of the web wall and CIP joint under nominal bending moment of the wall Mn; τ2@CIP is the applied average shear stress at the vertical interface under Mn (refer to Eq. (2) and Fig. 4); Avi is the area of the vertical interface; ϕ is the strength reduction factor (= 1.0 in this study); fyt is the specified yield strength of horizontal web reinforcement; and μ is the coefficient of friction, taken as 0.6λ for concrete placed against hardened concrete not intentionally roughened (λ is the lightweight concrete modi-fier [λ = 1 for normalweight concrete]).11
τ2
2 2
2
1
2@CIP
bs f
g wf w j
f
w j
V b
I bl l l
bc l l c r= + + −
+ + −( ) −{ }
(2)
where Vbs is the base shear applied at which nominal wall moment strength Mn is reached; bf is the thickness of the flange wall; Ig is the moment of inertia of the T-wall section; bw is the width of the web wall; lf is the length of the flange wall; lw is the length of the web wall; lj is the length of the CIP joint in the direction of lateral loading; c is the distance from the web-wall end to the neutral axis at the ultimate state; r is the distance between the neutral axis and the inter-face of the web wall and CIP joint. The shear stress τ2@CIP over the height of the vertical interface was assumed to be constant as recommended by MC2010.12
MaterialsThe specified concrete strength (fc′) was 40 MPa (5.8 ksi),
and the measured strength on testing day fc′_meas was 45.1 MPa (6.5 ksi) on average. Three 100 x 200 mm (3.9 x 7.9 in.) concrete cylinders were tested according to ASTM C39.13 The average compressive strength of the BCS mortar used in the CIP joint was 50 MPa (7.3 ksi). Three 50 x 50 x 50 mm
Table 1—Properties of test specimens
Specimens
CPC PCSD
Web panel Flange panel CIP joint Web panel Flange panel CIP joint
Dimensions, mm 1200 x 1200 1200 x 1200 200 x 150 1200 x 1200 1200 x 1200 200 x 150
*V@Mn = (Mn/H′w), where H′w is net height (= 2440 mm [96.1 in.]).†Vn = Acv(αc√fc′ + ρt fy) in Section 18.10.4 of ACI 318-14, where Acv is the gross area of the cross section; the coefficient αc is 0.25 for (hw/lw) ≤ 1.5, is 0.17 for (hw/lw) ≥ 2.0, and varies linearly between 0.25 and 0.17 for (hw/lw) between 1.5 and 2.0; fy is the yield strength of transverse reinforcement; and hw and lw are height and length of the wall, respectively.
(2.0 x 2.0 x 2.0 in.) cube specimens were tested in the same method used for the compressive tests of precast concrete.
The measured yield strengths fy_meas of the D25, D29, and D32 of deformed bars were 426.6, 444.2, and 425.0 MPa (61.9, 64.4, and 61.6 ksi), respectively. The measured yield strengths of the 20 mm (0.79 in.) thick and 30 mm (1.18 in.) thick steel plates were 324 MPa (47.1 ksi) and 316 MPa (45.8 ksi), respectively.
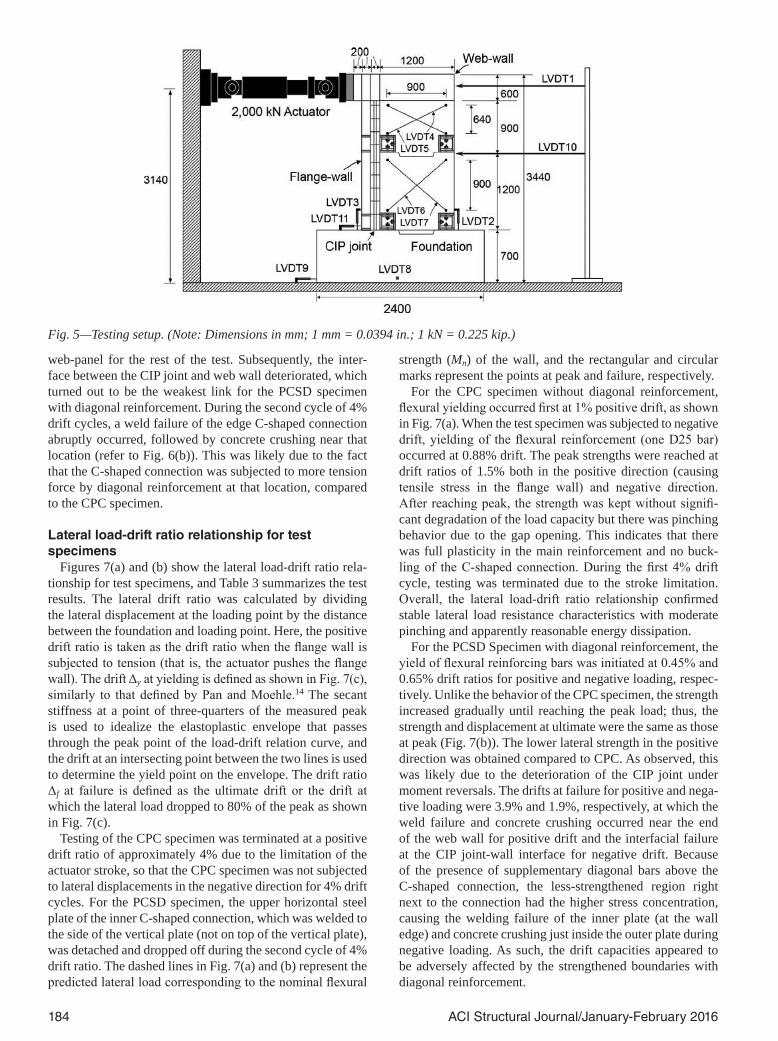
Test setup and instrumentationTwo two-thirds-scale T-walls were tested under cyclic
lateral loads (refer to Fig. 5). Table 2 shows the loading protocol. No axial loads were applied, as it would be negli-gible for low-rise construction. The lateral load was applied at the top of the flange wall and was controlled by the lateral displacement of the actuator. To monitor the lateral displace-ment, shear distortion, and vertical displacement of the test specimens, a total of 11 linear variable displacement trans-ducers (LVDTs) were used for each specimen: 1) LVDTs 1 and 10 denoted horizontal LDVTs at the top and bottom of the upper PC wall panel, respectively; 2) LVDTs 4 and 5 monitored the shear distortion of the upper wall panels, while 6 and 7 were monitored the lower panels; 3) LVDTs 2 and 3 were for measuring vertical displacement of C-shaped connections of flange wall and web wall, respectively; 4) LVDTs 8 and 9 were installed in case of the occurrence of unexpected displacement of the foundation; and 5) LVDT Number 11 was used to gauge horizontal slip.
TEST RESULTS AND DISCUSSIONDamage patterns and failure modes
Figure 6 shows the damage patterns and failure modes of the T-wall specimens. In both specimens, initial cracks were concentrated at the interface between the PC wall and the CIP joint at approximately 0.5 to 0.7% drift ratio. For the CPC specimen, some inclined cracks were propagated from the top PC panel to the edge of the lower PC panel at
0.35% drift ratio (refer to Fig. 6(a)), but most of the inclined cracks formed inside the lower panel. As a result, the width of concrete strut of the lower wall panel was almost the same as half the wall length. After reaching the peak load, no more inclined cracks and other cracks were developed, indicating that the nonlinear deformation was mainly due to the connec-tion deformation or gap opening at the C-shaped connec-tions. At 3% drift ratio, concrete deterioration initiated in the shear key region of the web wall at the panel-to-panel interface of the web wall without failure of the C-shaped connection (refer to Fig. 6(a)). Subsequently, the CPC had substantial damage of the CIP joint due to compression, but no compressive damage was observed in the flange wall or in the C-shaped connections.
For the PCSD specimen, flexural horizontal cracks occurred in the CIP joint at 0.3% drift ratio due to tension. Initial inclined cracks were developed at 1.5% drift in both the upper and lower web walls, but substantial inclined cracks were concentrated in the lower web-panel—that is, no prominent inclined cracks were observed in the upper
Fig. 4—Shear stresses and shear flow.
Table 2—Loading protocol for testing
Story drift ratio, %
No. of cycles
Displace-ment, mm
Story drift ratio, %
No. of cycles
Displace-ment, mm
0.02 1 ±0.5 0.70 3 ±17.1
0.04 2 ±1.0 0.84 3 ±20.5
0.08 2 ±2.0 1.0 3 ±24.4
0.12 3 ±2.9 1.5 3 ±36.6
0.20 3 ±4.9 2.0 3 ±48.8
0.28 3 ±6.8 2.5 3 ±61.0
0.36 3 ±8.8 3.0 3 ±73.2
0.44 3 ±10.7 4.0 3 ±97.6
0.56 3 ±13.7
Note: 1 mm = 0.0394 in.
184 ACI Structural Journal/January-February 2016
web-panel for the rest of the test. Subsequently, the inter-face between the CIP joint and web wall deteriorated, which turned out to be the weakest link for the PCSD specimen with diagonal reinforcement. During the second cycle of 4% drift cycles, a weld failure of the edge C-shaped connection abruptly occurred, followed by concrete crushing near that location (refer to Fig. 6(b)). This was likely due to the fact that the C-shaped connection was subjected to more tension force by diagonal reinforcement at that location, compared to the CPC specimen.
Lateral load-drift ratio relationship for test specimens
Figures 7(a) and (b) show the lateral load-drift ratio rela-tionship for test specimens, and Table 3 summarizes the test results. The lateral drift ratio was calculated by dividing the lateral displacement at the loading point by the distance between the foundation and loading point. Here, the positive drift ratio is taken as the drift ratio when the flange wall is subjected to tension (that is, the actuator pushes the flange wall). The drift Δy at yielding is defined as shown in Fig. 7(c), similarly to that defined by Pan and Moehle.14 The secant stiffness at a point of three-quarters of the measured peak is used to idealize the elastoplastic envelope that passes through the peak point of the load-drift relation curve, and the drift at an intersecting point between the two lines is used to determine the yield point on the envelope. The drift ratio Δf at failure is defined as the ultimate drift or the drift at which the lateral load dropped to 80% of the peak as shown in Fig. 7(c).
Testing of the CPC specimen was terminated at a positive drift ratio of approximately 4% due to the limitation of the actuator stroke, so that the CPC specimen was not subjected to lateral displacements in the negative direction for 4% drift cycles. For the PCSD specimen, the upper horizontal steel plate of the inner C-shaped connection, which was welded to the side of the vertical plate (not on top of the vertical plate), was detached and dropped off during the second cycle of 4% drift ratio. The dashed lines in Fig. 7(a) and (b) represent the predicted lateral load corresponding to the nominal flexural
strength (Mn) of the wall, and the rectangular and circular marks represent the points at peak and failure, respectively.
For the CPC specimen without diagonal reinforcement, flexural yielding occurred first at 1% positive drift, as shown in Fig. 7(a). When the test specimen was subjected to negative drift, yielding of the flexural reinforcement (one D25 bar) occurred at 0.88% drift. The peak strengths were reached at drift ratios of 1.5% both in the positive direction (causing tensile stress in the flange wall) and negative direction. After reaching peak, the strength was kept without signifi-cant degradation of the load capacity but there was pinching behavior due to the gap opening. This indicates that there was full plasticity in the main reinforcement and no buck-ling of the C-shaped connection. During the first 4% drift cycle, testing was terminated due to the stroke limitation. Overall, the lateral load-drift ratio relationship confirmed stable lateral load resistance characteristics with moderate pinching and apparently reasonable energy dissipation.
For the PCSD Specimen with diagonal reinforcement, the yield of flexural reinforcing bars was initiated at 0.45% and 0.65% drift ratios for positive and negative loading, respec-tively. Unlike the behavior of the CPC specimen, the strength increased gradually until reaching the peak load; thus, the strength and displacement at ultimate were the same as those at peak (Fig. 7(b)). The lower lateral strength in the positive direction was obtained compared to CPC. As observed, this was likely due to the deterioration of the CIP joint under moment reversals. The drifts at failure for positive and nega-tive loading were 3.9% and 1.9%, respectively, at which the weld failure and concrete crushing occurred near the end of the web wall for positive drift and the interfacial failure at the CIP joint-wall interface for negative drift. Because of the presence of supplementary diagonal bars above the C-shaped connection, the less-strengthened region right next to the connection had the higher stress concentration, causing the welding failure of the inner plate (at the wall edge) and concrete crushing just inside the outer plate during negative loading. As such, the drift capacities appeared to be adversely affected by the strengthened boundaries with diagonal reinforcement.
Fig. 5—Testing setup. (Note: Dimensions in mm; 1 mm = 0.0394 in.; 1 kN = 0.225 kip.)
185ACI Structural Journal/January-February 2016
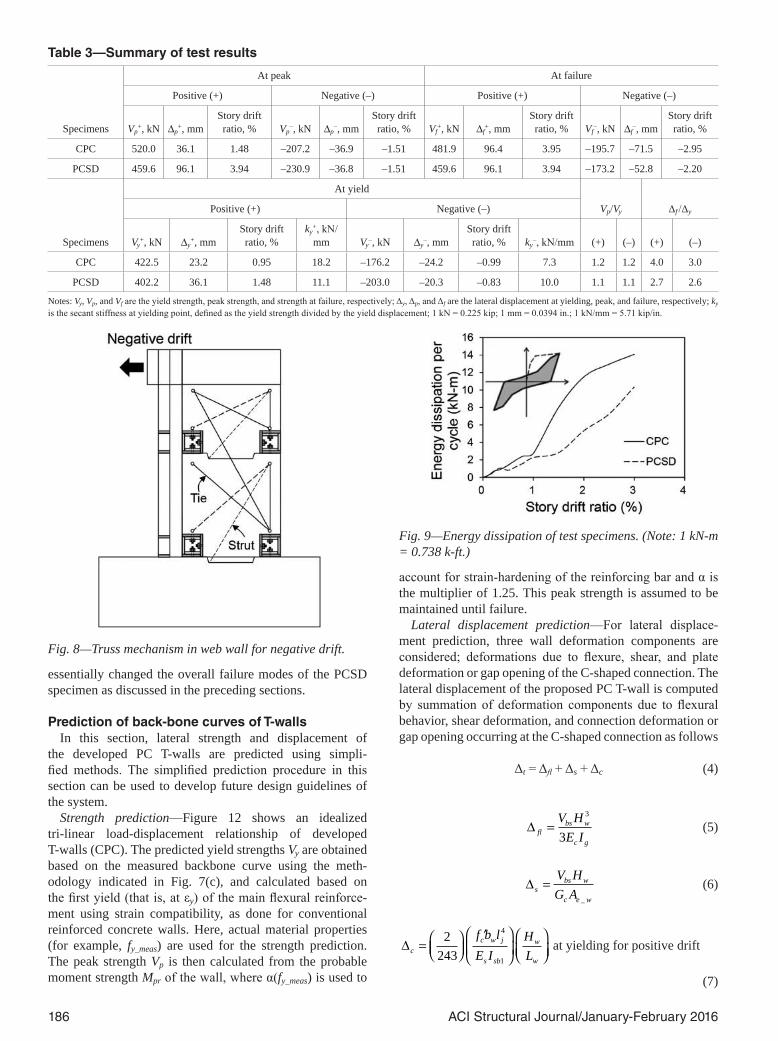
The measured-to-nominal flexural strength ratios for CPC and PCSD were 1.3 and 1.15, respectively, for positive loading, and 1.5 and 1.67 for negative loading. The value of 1.67 (versus 1.5) was because the diagonal reinforcement additionally acted as tension ties of the truss mechanism when the specimen was subjected to the negative drift, as shown in Fig. 8, resulting in the higher moment and inter-facial shear at the CIP joint. Overall, the CPC specimen showed a more stable behavior than PCSD under reversed cyclic loading.
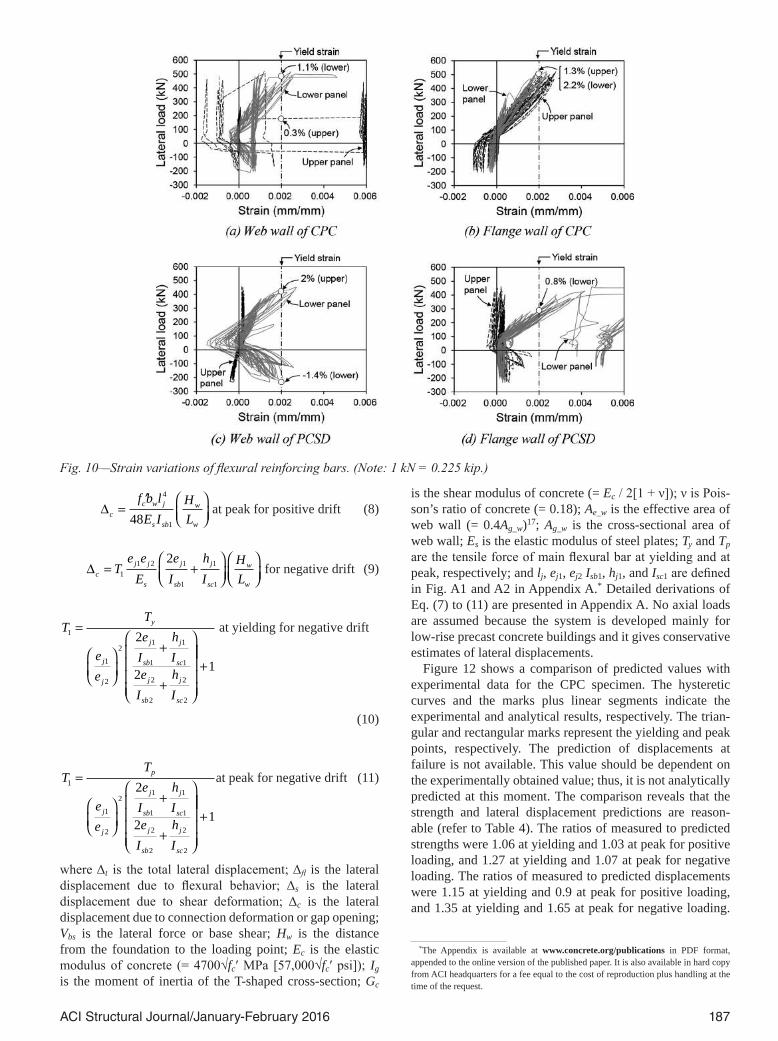
Figure 9 shows the energy dissipation for the third cycle at each drift level. The energy is defined as the enclosed area of the load-displacement hysteresis loop, as shown in Fig. 9. The energy dissipations of the test specimens were very similar until 1% drift ratio; however, the specimens dissipated quite differently beyond 1% drift. For example, at 2 and 3% drift ratios, the energy dissipation of CPC was larger than PCSD by approximately 120% and 40%, respectively. Such an increase in energy dissipation was due to the earlier yielding of web-wall flexural reinforcement in CPC at approximately 1% drift and significant inelastic behavior of the reinforce-ment beyond 1% drift (refer to Fig. 10(a) versus Fig. 10(b)).
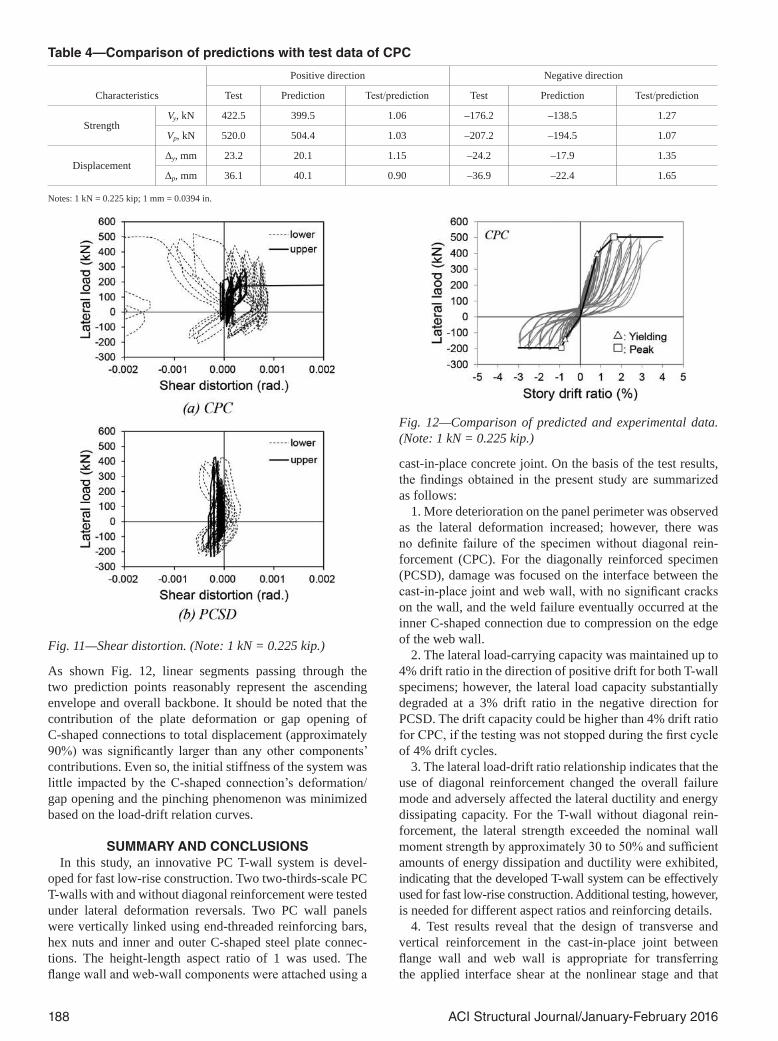
Shear distortion of web wallFigure 11 shows the average shear distortion of the web
wall. The average shear distortion γavg was obtained from the LVDTs (refer to LV4, LV5, LV6, and LV7 in Fig. 5) and calculated as follows
γδ δ
avg
d d
HL=
−1 1 2 2
2 (3)
where δ1 and δ2 are the measured displacements from LV4 or LV6 and LV5 or LV7, respectively (refer to Fig. 5); d1 and d2 are the diagonal lengths; and H and L are the vertical and horizontal lengths.
Both CPC and PCSD showed much larger shear distortion in the lower web wall compared to the upper web wall. The
larger degree of damage due to inclined cracking appeared to decrease the shear stiffness of the lower panel. The shear distortions of the PCSD walls were significantly smaller than those of the CPC walls due to the presence of supple-mentary diagonal reinforcements. Such results are consis-tent with the previous experimental findings from squat walls with height-length aspect ratios of 1 to 2. For example, Sittipunt et al.15 and Shaingchin et al.16 reported that the addi-tion of diagonal reinforcement in conventional reinforced concrete walls effectively reduced the shear distortion by approximately 20%. In this test, the maximum shear distor-tion ratios between the specimens were 0.56 and 0.7 for the lower and upper walls, respectively, indicating that the diag-onal reinforcement was effective in controlling shear cracks and enhancing shear stiffness of the panel. The improved shear integrity, however, adversely affected the lateral drift capacity, because the presence of diagonal reinforcement
Fig. 6—Damage and failure modes of test specimens. (Note: Numbers in figure indicate drift ratio [%] at which crack occurred.)
essentially changed the overall failure modes of the PCSD specimen as discussed in the preceding sections.
Prediction of back-bone curves of T-wallsIn this section, lateral strength and displacement of
the developed PC T-walls are predicted using simpli-fied methods. The simplified prediction procedure in this section can be used to develop future design guidelines of the system.
Strength prediction—Figure 12 shows an idealized tri-linear load-displacement relationship of developed T-walls (CPC). The predicted yield strengths Vy are obtained based on the measured backbone curve using the meth-odology indicated in Fig. 7(c), and calculated based on the first yield (that is, at εy) of the main flexural reinforce-ment using strain compatibility, as done for conventional reinforced concrete walls. Here, actual material properties (for example, fy_meas) are used for the strength prediction. The peak strength Vp is then calculated from the probable moment strength Mpr of the wall, where α(fy_meas) is used to
account for strain-hardening of the reinforcing bar and α is the multiplier of 1.25. This peak strength is assumed to be maintained until failure.
Lateral displacement prediction—For lateral displace-ment prediction, three wall deformation components are considered; deformations due to flexure, shear, and plate deformation or gap opening of the C-shaped connection. The lateral displacement of the proposed PC T-wall is computed by summation of deformation components due to flexural behavior, shear deformation, and connection deformation or gap opening occurring at the C-shaped connection as follows
Notes: Vy, Vp, and Vf are the yield strength, peak strength, and strength at failure, respectively; Δy, Δp, and Δf are the lateral displacement at yielding, peak, and failure, respectively; ky is the secant stiffness at yielding point, defined as the yield strength divided by the yield displacement; 1 kN = 0.225 kip; 1 mm = 0.0394 in.; 1 kN/mm = 5.71 kip/in.
Fig. 8—Truss mechanism in web wall for negative drift.
Fig. 9—Energy dissipation of test specimens. (Note: 1 kN-m = 0.738 k-ft.)
187ACI Structural Journal/January-February 2016
Dc
c w j
s sb
w
w
f b l
E I
H
L=
′
4
148 at peak for positive drift (8)
Dc
j j
s
j
sb
j
sc
w
w
Te e
E
e
I
h
I
H
L= +
1
1 2 1
1
1
1
2 for negative drift (9)
TT
e
e
e
I
h
Ie
I
h
I
y
j
j
j
sb
j
sc
j
sb
j
sc
1
1
2
21
1
1
1
2
2
2
2
2
2
=
+
+
+1
at yielding for negative drift
(10)
TT
e
e
e
I
h
Ie
I
h
I
p
j
j
j
sb
j
sc
j
sb
j
sc
1
1
2
21
1
1
1
2
2
2
2
2
2
=
+
+
+1
at peak for negative drift (11)
where Δt is the total lateral displacement; Δfl is the lateral displacement due to flexural behavior; Δs is the lateral displacement due to shear deformation; Δc is the lateral displacement due to connection deformation or gap opening; Vbs is the lateral force or base shear; Hw is the distance from the foundation to the loading point; Ec is the elastic modulus of concrete (= 4700√fc′ MPa [57,000√fc′ psi]); Ig is the moment of inertia of the T-shaped cross-section; Gc
is the shear modulus of concrete (= Ec / 2[1 + ν]); ν is Pois-son’s ratio of concrete (= 0.18); Ae_w is the effective area of web wall (= 0.4Ag_w)17; Ag_w is the cross-sectional area of web wall; Es is the elastic modulus of steel plates; Ty and Tp are the tensile force of main flexural bar at yielding and at peak, respectively; and lj, ej1, ej2 Isb1, hj1, and Isc1 are defined in Fig. A1 and A2 in Appendix A.* Detailed derivations of Eq. (7) to (11) are presented in Appendix A. No axial loads are assumed because the system is developed mainly for low-rise precast concrete buildings and it gives conservative estimates of lateral displacements.
Figure 12 shows a comparison of predicted values with experimental data for the CPC specimen. The hysteretic curves and the marks plus linear segments indicate the experimental and analytical results, respectively. The trian-gular and rectangular marks represent the yielding and peak points, respectively. The prediction of displacements at failure is not available. This value should be dependent on the experimentally obtained value; thus, it is not analytically predicted at this moment. The comparison reveals that the strength and lateral displacement predictions are reason-able (refer to Table 4). The ratios of measured to predicted strengths were 1.06 at yielding and 1.03 at peak for positive loading, and 1.27 at yielding and 1.07 at peak for negative loading. The ratios of measured to predicted displacements were 1.15 at yielding and 0.9 at peak for positive loading, and 1.35 at yielding and 1.65 at peak for negative loading.
*The Appendix is available at www.concrete.org/publications in PDF format, appended to the online version of the published paper. It is also available in hard copy from ACI headquarters for a fee equal to the cost of reproduction plus handling at the time of the request.
As shown Fig. 12, linear segments passing through the two prediction points reasonably represent the ascending envelope and overall backbone. It should be noted that the contribution of the plate deformation or gap opening of C-shaped connections to total displacement (approximately 90%) was significantly larger than any other components’ contributions. Even so, the initial stiffness of the system was little impacted by the C-shaped connection’s deformation/gap opening and the pinching phenomenon was minimized based on the load-drift relation curves.
SUMMARY AND CONCLUSIONSIn this study, an innovative PC T-wall system is devel-
oped for fast low-rise construction. Two two-thirds-scale PC T-walls with and without diagonal reinforcement were tested under lateral deformation reversals. Two PC wall panels were vertically linked using end-threaded reinforcing bars, hex nuts and inner and outer C-shaped steel plate connec-tions. The height-length aspect ratio of 1 was used. The flange wall and web-wall components were attached using a
cast-in-place concrete joint. On the basis of the test results, the findings obtained in the present study are summarized as follows:
1. More deterioration on the panel perimeter was observed as the lateral deformation increased; however, there was no definite failure of the specimen without diagonal rein-forcement (CPC). For the diagonally reinforced specimen (PCSD), damage was focused on the interface between the cast-in-place joint and web wall, with no significant cracks on the wall, and the weld failure eventually occurred at the inner C-shaped connection due to compression on the edge of the web wall.
2. The lateral load-carrying capacity was maintained up to 4% drift ratio in the direction of positive drift for both T-wall specimens; however, the lateral load capacity substantially degraded at a 3% drift ratio in the negative direction for PCSD. The drift capacity could be higher than 4% drift ratio for CPC, if the testing was not stopped during the first cycle of 4% drift cycles.
3. The lateral load-drift ratio relationship indicates that the use of diagonal reinforcement changed the overall failure mode and adversely affected the lateral ductility and energy dissipating capacity. For the T-wall without diagonal rein-forcement, the lateral strength exceeded the nominal wall moment strength by approximately 30 to 50% and sufficient amounts of energy dissipation and ductility were exhibited, indicating that the developed T-wall system can be effectively used for fast low-rise construction. Additional testing, however, is needed for different aspect ratios and reinforcing details.
4. Test results reveal that the design of transverse and vertical reinforcement in the cast-in-place joint between flange wall and web wall is appropriate for transferring the applied interface shear at the nonlinear stage and that
DisplacementΔy, mm 23.2 20.1 1.15 –24.2 –17.9 1.35
Δp, mm 36.1 40.1 0.90 –36.9 –22.4 1.65
Notes: 1 kN = 0.225 kip; 1 mm = 0.0394 in.
189ACI Structural Journal/January-February 2016
the developed bolt-type C-shaped connections are robust and practical.
5. The developed, simplified prediction methods for strength and displacement are practically accurate, which can be used to develop design guidelines. It is worth mentioning that the contribution of the plate deformation or gap opening of C-shaped connections to total displacement (approximately 90%) was significantly larger than any other components’ contributions.
AUTHOR BIOSWoo-Young Lim is a Postdoctoral Researcher in the Department of Archi-tecture and Architectural Engineering at Seoul National University, Seoul, Korea. He received his PhD from Seoul National University in 2012. His research interests include the behavior of reinforced and precast concrete members in shear.
Thomas H.-K. Kang, FACI, is an Associate Professor at Seoul National University. He is a member of ACI Committee 369, Seismic Repair and Rehabilitation; Joint ACI-ASCE Committees 335, Composite and Hybrid Structures; 352, Joints and Connections in Monolithic Concrete Struc-tures; and 423, Prestressed Concrete; and the ACI International Advisory Committee. He received the 2009 ACI Wason Medal for Most Meritorious Paper. His research interests include the design and behavior of reinforced, prestressed, and precast concrete structures.
ACI member Sung-Gul Hong is a Professor at Seoul National University. He is Past President of Earthquake Engineering Society of Korea and Past Vice President of Korea Concrete Institute. He received his BS and MS from Seoul National University in 1981 and 1983, respectively, and his PhD from Lehigh University, Bethlehem, PA, in 1994. His research interests include strut-and-tie models for bond transfer, shear strength of reinforced concrete members, shear friction with creep, anchorage of multiple bars, and defor-mation of reinforced concrete columns in shear.
ACKNOWLEDGMENTSThis research was supported by the Ministry of Construction and Trans-
portation of Korea (03 R&D A07-06) and National Research Foundation of Korea (NRF) grant (No. 2015-001535). The opinions, findings, and conclu-sions in this paper are those of the authors and do not necessarily represent those of the sponsors.
REFERENCES1. Goodsir, W. J., “The Design of Coupled Frame-Wall Structures for
Seismic Action,” Research Report 85-8, Department of Civil Engineering, University of Canterbury, Christchurch, New Zealand, 1985, 383 pp.
2. Thomsen, J. H. IV, and Wallace, J. W., “Displacement-Based Design of Slender Reinforced Concrete Structural Walls-Experimental Verifi-cation,” Journal of Structural Engineering, ASCE, V. 130, No. 4, 2004, pp. 618-630. doi: 10.1061/(ASCE)0733-9445(2004)130:4(618)
3. Panagiotou, M., and Restrepo, J. I., “Displacement-Based Method of Analysis for Regular Reinforced-Concrete Wall Buildings: Application to a Full-Scale 7-Story Building Slice Tested at UC-San Diego,” Journal of Structural Engineering, ASCE, V. 137, No. 6, 2011, pp. 677-690. doi: 10.1061/(ASCE)ST.1943-541X.0000333
4. Brueggen, B. L., “Performance of T-Shaped Reinforced Concrete Structural Walls under Multi-Directional Loading,” PhD thesis, University of Minnesota, Minneapolis, MN, 498 pp.
5. Rahman, A. M., and Restrepo, J. I., “Earthquake Resistant Precast Concrete Buildings: Seismic Performance of Cantilever Walls Prestressed Using Unbonded Tendons,” Civil Engineering Research Report No. 2000-5, University of Canterbury, Christchurch, New Zealand, 2000, 129 pp.
6. Holden, T. J., “A Comparison of the Seismic Performance of Precast Wall Construction: Emulation and Hybrid Approaches,” Civil Engineering Research Report No. 2001-4, University of Canterbury, Christchurch, New Zealand, 2001, 169 pp.
7. Kurama, Y. C., “Seismic Analysis, Behavior, and Design of Unbonded Post-Tensioned Precast Concrete Walls,” PhD thesis, Department of Civil and Environmental Engineering, Lehigh University, Bethlehem, PA, 1997, 508 pp.
8. Perez, F. J.; Pessiki, S.; Sause, R.; and Lu, L.-W., “Lateral Load Tests of Unbonded Post-Tensioned Precast Concrete Walls,” Large Scale-Scale Structural Testing, SP-211, M. A. Issa and Y. L. Mo, eds., American Concrete Institute, Farmington Hills, MI, 2003, pp. 161-183.
9. Soudki, K. A.; Rizkalla, S. H.; and LeBlanc, B., “Horizontal Connec-tions for Precast Concrete Shear Walls Subjected to Cyclic Deformations. Part 1: Mild Steel Connections,” PCI Journal, V. 40, No. 4, 1995, pp. 78-96. doi: 10.15554/pcij.07011995.78.96
10. Soudki, K. A.; Rizkalla, S. H.; and Daikiw, R. W., “Horizontal Connections for Precast Concrete Shear Walls subjected to Cyclic Defor-mations. Part 2: Prestressed Connections,” PCI Journal, V. 40, No. 5, 1995, pp. 82-96. doi: 10.15554/pcij.09011995.82.96
11. ACI Committee 318, “Building Code Requirements for Structural Concrete (ACI 318-14) and Commentary (ACI 318R-14),” American Concrete Institute, Farmington Hills, MI, 2014, 519 pp.
12. MC2010, “fib Model Code for Concrete Structures 2010,” Federation internationale du beton, Ernst & Sohn, Lausanne, Switzerland, 2010, 434 pp.
13. ASTM C39/C39M-01, “Standard Test Method for Compressive Strength of Cylindrical Concrete Specimens,” ASTM International, West Conshohocken, PA, 2001, 5 pp.
14. Pan, A., and Moehle, J. P., “Lateral Displacement Ductility of Reinforced Concrete Flat Plates,” ACI Structural Journal, V. 86, No. 3, May-June 1989, pp. 250-258.
15. Sittipunt, C.; Wood, S. L.; Lukkunaprasit, P.; and Pattararattanakul, P., “Cyclic Behavior of Reinforced Structural Walls with Diagonal Web Rein-forcement,” ACI Structural Journal, V. 98, No. 4, July-Aug. 2001, pp. 554-562.
16. Shaingchin, S.; Lukkunaprasit, P.; and Wood, S. L., “Influence of Diagonal Web Reinforcement on Cyclic Behavior of Structural Walls,” Engineering Structures, V. 29, No. 4, 2007, pp. 498-510. doi: 10.1016/j.engstruct.2006.05.016
17. Panneton, M.; Leger, P.; and Tremblay, R., “Inelastic Analysis of a Reinforced Concrete Shear Wall Building According to the National Building Code of Canada 2005,” Canadian Journal of Civil Engineering, V. 33, No. 7, 2006, pp. 854-871. doi: 10.1139/l06-026
190 ACI Structural Journal/January-February 2016
NOTES:
1
APPENDIX A 1
Lateral Displacement due to Connection Deformation or Connection Gap Opening 2
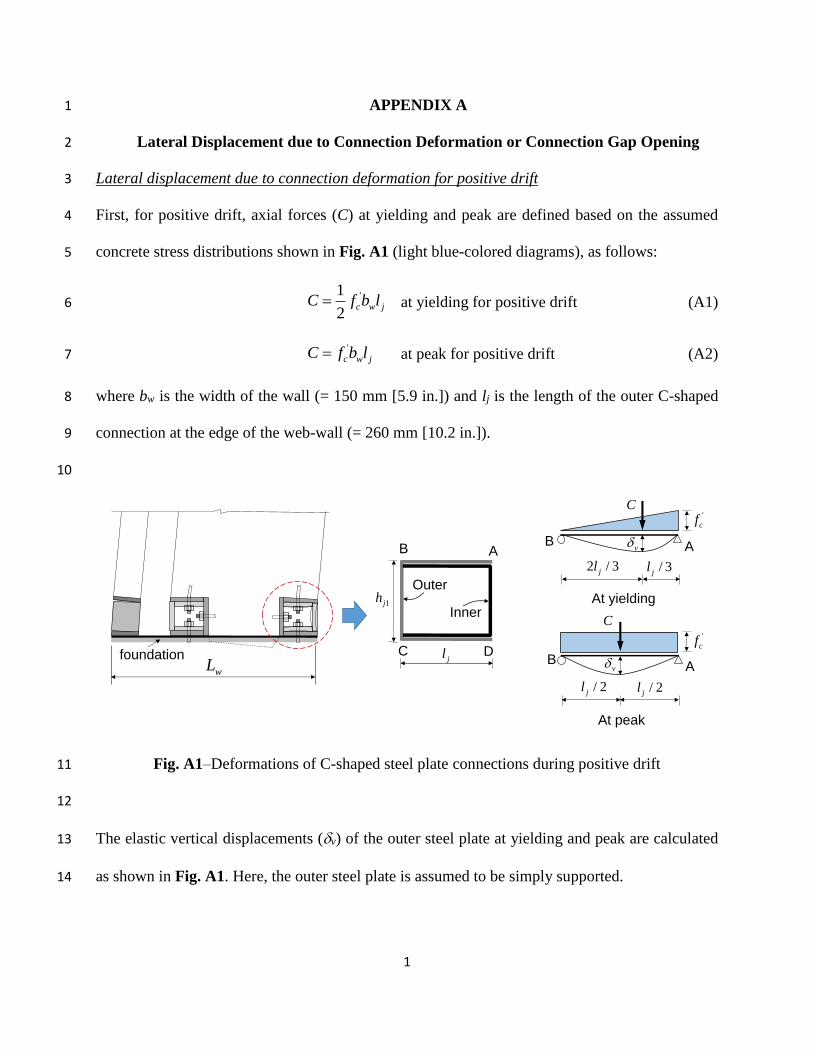
Lateral displacement due to connection deformation for positive drift 3
First, for positive drift, axial forces (C) at yielding and peak are defined based on the assumed 4
concrete stress distributions shown in Fig. A1 (light blue-colored diagrams), as follows: 5
'1
2 c w jC f b l at yielding for positive drift (A1) 6
'c w jC f b l at peak for positive drift (A2) 7
where bw is the width of the wall (= 150 mm [5.9 in.]) and lj is the length of the outer C-shaped 8
connection at the edge of the web-wall (= 260 mm [10.2 in.]). 9
10
Fig. A1–Deformations of C-shaped steel plate connections during positive drift 11
12
The elastic vertical displacements (v) of the outer steel plate at yielding and peak are calculated 13
as shown in Fig. A1. Here, the outer steel plate is assumed to be simply supported. 14
foundationwL
A
D
Inner
C
Outer
B
1jh
jl
2 / 3jl / 3jl
v
C'
cf
AB
/ 2jl / 2jl
v
C'
cf
AB
At yielding
At peak
2
2 2
1
2
3 3
3
j j
vs sb j
l lC
E I l
at yielding for positive drift (A3) 1
3
148j
vs sb
Cl
E I at peak for positive drift (A4) 2
where Es is the elastic modulus of the steel plate (200,000 MPa [29,000 ksi]); and Isb1 and Isc1 are 3
the moments of inertia of the horizontal and vertical elements of the outer C-shaped connection 4
(Isb1 = Isc1 =150 x 303 / 12 mm4 or 5.9 x 1.23 / 12 in.4), respectively. 5
The deflection slope angle (c) due to connection deformation on the assumed support (both at 6
yielding and at peak) is then as follows: 7
vc
wL
(A5) 8
where Lw is the total length of the T-wall (= 1,550 mm [61 in.]). 9
Finally, the lateral displacements (c) of the wall (both at yielding and at peak) for positive drift 10
are given by: 11
' 4
1
2
243c w j w
c c ws sb w
f b l HH
E I L
at yielding for positive drift (A6) 12
' 4
148c w j w
c c ws sb w
f b l HH
E I L
at peak for positive drift (A7) 13
where Hw is the total height of the T-wall (= 2,440mm [96.1 in.]). Note that Eqs. (A6) and (A7) 14
are exactly the same as Eqs. (7) and (8). 15
16
17
18
3
1
2
3
4
5
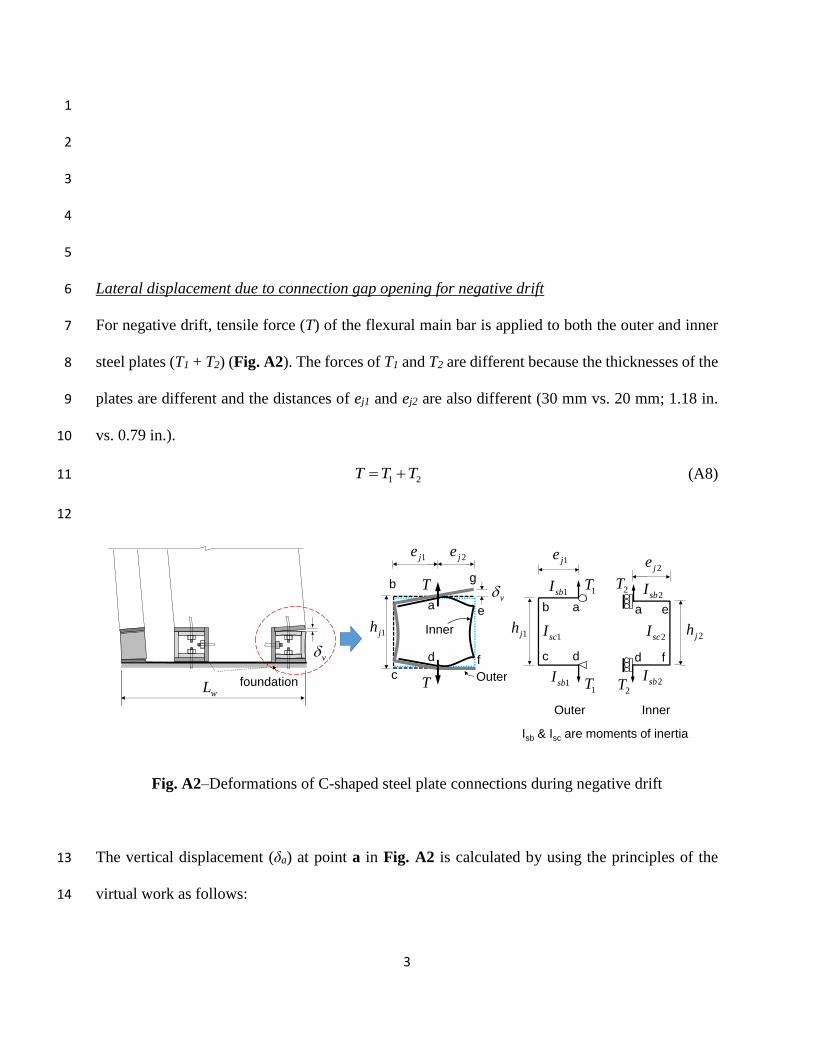
Lateral displacement due to connection gap opening for negative drift 6
For negative drift, tensile force (T) of the flexural main bar is applied to both the outer and inner 7
steel plates (T1 + T2) (Fig. A2). The forces of T1 and T2 are different because the thicknesses of the 8
plates are different and the distances of ej1 and ej2 are also different (30 mm vs. 20 mm; 1.18 in. 9
vs. 0.79 in.). 10
1 2T T T (A8) 11
12
Fig. A2–Deformations of C-shaped steel plate connections during negative drift
The vertical displacement (δa) at point a in Fig. A2 is calculated by using the principles of the 13
virtual work as follows: 14
T
T
1jh
1je 2je
v
Inner
1jh
1je
1T
1T
ab
c d
1sbI
1scI
1sbI
2jh
2je
a e
fd
2sbI
2scI
2sbI
2T
2T
Outer
a
d
Outer
Inner
b
cf
e
foundationwL
v
Isb & Isc are moments of inertia
g
4
b c d
aa b cs sb s sc s sb
mM mM mMdx dy dx
E I E I E I
(A9) 1
where m is the internal virtual moment caused by the external virtual unit load (= –1 x ej1 for outer 2
connection and 1 x ej2 for inner connection); M is the internal moment caused by the real loads (= 3
–T1ej1 for outer connection and T2ej2 for inner connection); Isb and Isc are the moment of inertia of 4
the horizontal and vertical elements of the C-shaped connection (Isc1 = Isb1; Isc2 = Isb2), respectively; 5
ej1 and ej2 are the distances from the center of the flexural reinforcing bar to the edge of the C-6
shape connection (ej1 = 140 mm or 5.5 in., ej2 = 120 mm or 4.7 in.); and hj1 and hj2 are the heights 7
of the inner and outer connections (hj1 = 250 mm or 9.8 in., hj2 = 210 mm or 8.3 in.), respectively. 8
Thus, the vertical displacements (δa_outer and δa_innter) of the outer and inner connections at the point 9
a in Fig. A2 are determined as follows: 10
1 121_ 1
1 1
2 j ja outer j
s sb sc
e hTe
E I I
(A10) 11
2 222_ 2
2 2
2 j ja inner j
s sb sc
e hTe
E I I
(A11) 12
Because the vertical displacements of the inner and outer connections at point a in Fig. A2 are the 13
same (i.e., δa_inner = δa_outer at the same point), the tensile force T1 is calculated as follows: 14
11 1
2
1 1 1
2 22
2 2
2
12
j j
j sb sc
j jj
sb sc
TT
e h
e I Ie he
I I
(A12) 15
Note that Eq. (A12) is exactly the same as Eq. (10) or (11). The tensile forces (Ty and Tp) at yielding 16
and at peak are calculated using the yield strength and cross-sectional area of the bar as well as the 17
multiplier (= 1.25) accounting for strain-hardening of the bar. 18
5
Then, the slope angle of the outer connection at point a in Fig. A2 is calculated using the principles 1
of the virtual work as follows: 2
b c d
aa b cs sb s sc s sb
mM mM mMdx dy dx
E I E I E I
(A13) 3
where m is the internal virtual moment caused by the external virtual unit moment (= –1 for outer 4
connection and 1 for inner connection) and M is the internal moment caused by the real loads (= –5
T1ej1 for outer connection and T2ej2 for inner connection). 6
Using Eq. (A13), Eqs. (A14), (A15) and (A16) are derived for the slope angle of the a-b element 7
of the outer connection at point a in Fig. A2; the vertical displacement due to connection gap 8
opening at point g in Fig. A2; and the rotation angle at point g in Fig. A2 with respect to the 9
horizontal line, respectively. 10
1 1 1 1
1 1
2j j ja
s sb sc
T e e h
E I I
(A14) 11
2v a je (A15) 12
vc
wL
(A16) 13
Finally, the lateral displacement due to connection gap opening for negative drift is determined as 14
follows: 15
1 2 1 11
1 1
2j j j j wc c w
s sb sc w
e e e h HH T
E I I L
for negative drift (A17) 16
where T1 is from Eq. (A12). Note that Eq. (A17) is exactly the same as Eq. (9). 17


![POLYACRYLAMIDE GEL ENTRAPMENT OF ADENYLATE … › files › gmwgroup › files › 104.pdfoped a coupled enzymatic process for the regeneration of ATP from AMP or ADP [6 - 11] . The](https://static.documents.pub/doc/80x56/60bd21db1074fd7fb75b7db5/polyacrylamide-gel-entrapment-of-adenylate-a-files-a-gmwgroup-a-files-a.jpg)

