Page 1
VARIATIONS IN ORGANIC GEOCHEMISTRY AND PETROGRAPHY
WITH DEPTH OF BURIAL, GREEN RIVER FORMATION OIL SHALES
PICEANCE CREEK BASIN, COLORADO
W. Scott Meddaugh (D S. Imbus (2) F. T. C Ting(2) and C A. Salotti (D
{*' Production Research Division
Gulf Research and Development Co.
Houston, TX
'' Department of Geology and Geography
West Virginia University
Morgantown, WV
ABSTRACT
Chemical analysis,*
C NMR, and IR spec
troscopy were used to characterize organic
matter concentrates (HC1/HF dissolution) and
carbonate mineral -free (HCI dissolution) oil
shale samples from a 213 m (700 ft) interval
between the top of the Mahogany Zone and the
base of the R4 zone, C-a Tract, Colorado. The
H/C, 0/C, and N/C ratios and the fraction of
aliphathic C of the organic matter decrease with
depth. The aliphatic/aromatic ratio also with
depth. Organic petrography data, both quali
tative and quantitative, were obtained by
reflected white-light and reflected blue-light
fluorescence microscopy. Qualitative petro
graphic parameters, such as overall fluorescence
color, show regular and systematic trends with
depth. Vitrinite reflectance increases slightly
with depth. The observed chemical and petro
graphic variations are consistent with
increasing thermal maturation with depth.
INTRODUCTION
Efficient extraction of any natural
resource requires a detailed understanding of
the resource. In the case of the Eocene-age
Green River Formation oil shales of Colorado,
Utah, and Wyoming a detailed understanding of
the variability of the organic and inorganic
fraction is required. Unfortunately, our
knowledge of such variability is limited. The
few studies on the variability of the organic
fraction that have been published are somewhat
contradictory. Smith (1961, 1963, 1983)
reported that the only significant variation in
the composition of the organic matter is a
decrease in the 0/C ratio with depth; lateral
variability, at least in the Mahogany zone, was
reported to be mini nal. Robison and Cook (1971,
1973) reported significant differences in the
properties of kerogen taken from different
stratigraphic and geographic locations. In the
Colorado No. 1 core, for example, the H/C ratio
of the kerogen varied between 0.92 and 1.77.
Robinson (1978) noted that there appeared to be
no correlation between the H/C ratio (or other
measured properties) and depth of burial.
In the present study a variety of analy
tical techniques have been used to characterize
the variation of the total organic fraction with
depth in a single core from the C-a Tract,
Piceance Creek Basin, Colorado. Techniques used
include elemental analysis (C, H, N, 0, S, and
1 o
ash), xoC NMR, and IR spectroscopy. Quantita
tive petrographic data for the organic fraction
were also obtained.
159
Page 2
METHODS AND PROCEDURES
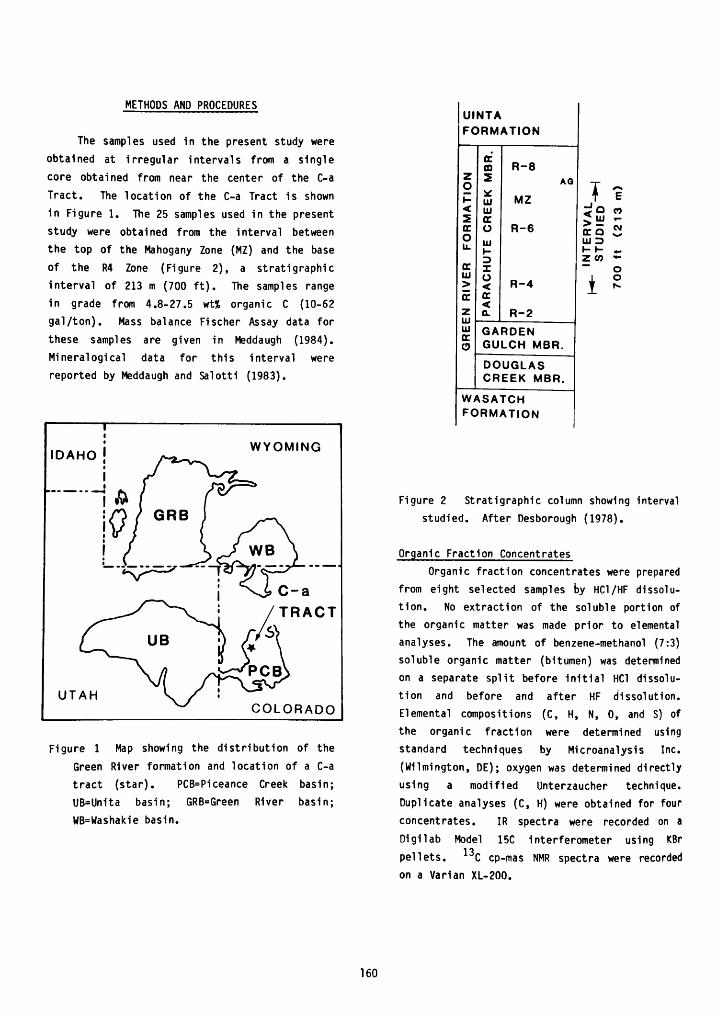
The samples used in the present study were
obtained at irregular intervals from a single
core obtained from near the center of the C-a
Tract. The location of the C-a Tract is shown
in Figure 1. The 25 samples used in the present
study were obtained from the interval between
the top of the Mahogany Zone (MZ) and the base
of the R4 Zone (Figure 2), a stratigraphic
interval of 213 m (700 ft). The samples range
in grade from 4.8-27.5 wt% organic C (10-62
gal /ton). Mass balance Fischer Assay data for
these samples are given in Meddaugh (1984).
Mineralogical data for this interval were
reported by Meddaugh and Salotti (1983).
IDAHO !WYOMING
UTAH
COLORADO
Figure 1 Map showing the distribution of the
Green River formation and location of a C-a
tract (star). PCB=Piceance Creek basin;
UB=Unita basin; GRB=Green River basin;
WB=Washakie basin.
1 UINTAFORMATION
or
CO R-8z
o5 AG
1-Ul MZ
< Ui
2 cc
cc o R-6Ou.
Ul1-
cc ZUl o> < R-4
cc cc
<z o. R-2UJ i
UJ
cr
O
GARDEN
GULCH MBR.
DOUGLAS
CREEK MBR.
WASATCH
FORMATION
TiQ n
Ul T-
CM
<
> -
cca
UJ Z>
z co*-
o
o
i
Figure 2 Stratigraphic column showing interval
studied. After Desborough (1978).
Organic Fraction Concentrates
Organic fraction concentrates were prepared
from eight selected samples by HC1/HF dissolu
tion. No extraction of the soluble portion of
the organic matter was made prior to elemental
analyses. The amount of benzene-methanol (7:3)
soluble organic matter (bitumen) was determined
on a separate split before initial HCI dissolu
tion and before and after HF dissolution.
Elemental compositions (C, H, N, 0, and S) of
the organic fraction were determined using
standard techniques by Microanalysis Inc.
(Wilmington, DE); oxygen was determined directly
using a modified Unterzaucher technique.
Duplicate analyses (C, H) were obtained for four
concentrates. IR spectra were recorded on a
Digilab Model 15C interferometer using KBr
pellets. 10C cp-mas NMR spectra were recorded
on a Varian XL-200.
160
Page 3
Carbonate-Free (HCl-!eached) Samples
Organic H and C and total N were determined
for 25 samples by standard techniques (Micro
analysis Inc.) following removal of carbonates
and analcite by HCI dissolution. Organic H
values obtained from the HCI -leached samples
have been corrected for H2 released from illite
during analysis (high temperature combustion).
Figure 3 shows the excellent correlation between
the organic H/C values obtained from the organic
matter concentates and the corrected organic H/C
values obtained from the HCI -leached samples.
1.6
H/C
1.7 1.8
CONCENTRATE
1.9
Figure 3 Plot of H/C ratio determined on
organic concentrates and H/C ratio obtained
on carbonate mineral-free (HCI -leached)
samples (corrected for water released from
illite during analysis.
Organic Petrography
Polished blocks were prepared for 19
samples and examined in reflected white-light
and reflected blue-light fluorescence at 400X
magnification. After initial examination of the
sample suite a set of petrographic parameters
suspected of changing with depth (or shale
grade) were qualitatively described and quanti
tatively measured. Quantitative data were
obtained by point counting (500 points) in the
fluorescent mode to obtain the volume percent of
various organic constitutents (see Table 3).
Vitrinite refletance data were also obtained.
RESULTS
Organic Geochemistry
Chemical data for the organic matter
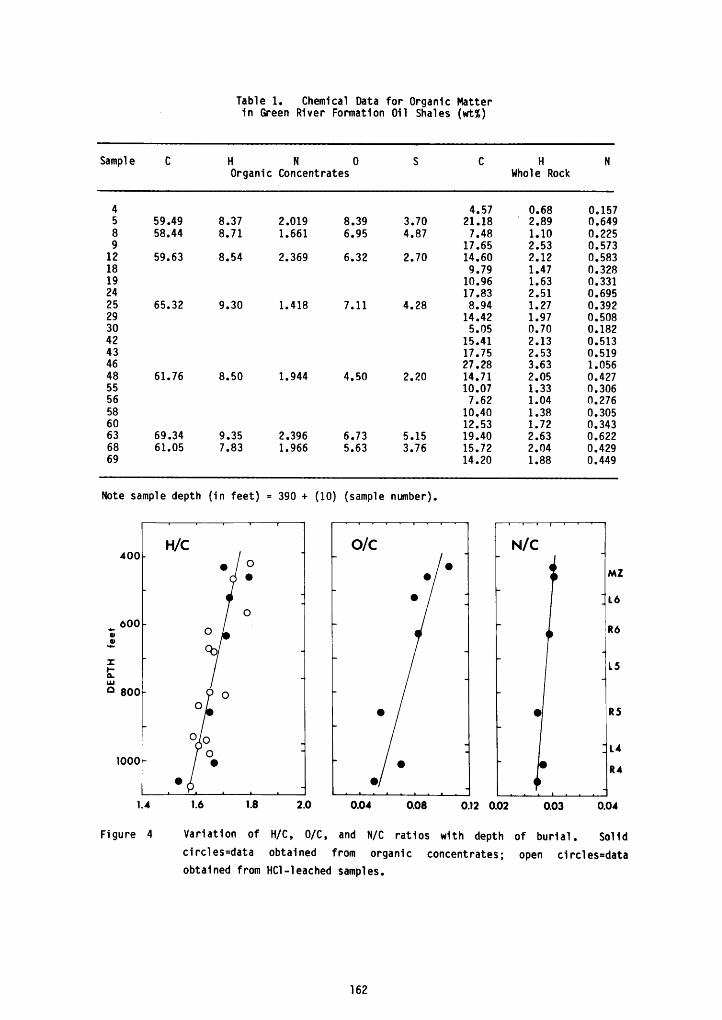
concentrates are reported in Table 1. Figure 4
shows the variation of the H/C, N/C, and 0/C
ratios of the organic matter in the oil shale
with depth. Note that there is a strong
decrease in the 0/C ratio with depth, from about
0.11 in the Mahogany Zone (MZ) to about 0.05 at
the base of the R4 Zone. This is consistent
with the observations of Smith (1963, 1983).
Figure 4 also shows a significant decrease
in the H/C ratio of the organic matter, from
about 1.7-1.8 in the MZ to 1.55-1.68 in the R4
zone. The trend of decreasing H/C ratio with
depth is partially obscurred by an apparent
negative correlation between the H/C ratio of
the oganic matter and the oil shale grade (wt%
organic C). This is shown in Figure 5. Note
that for a given shale grade there is a decrese
in the H/C ratio of the organic matter with
increasing depth. This is particularly obvious
for oil shales with less than 15 wt% organic C
(about 35 gal /ton). The relationship between
shale grade and organic matter H/C ratio
suggests that there may be some fundamental
difference in the"type"
of organic matter in
rich and lean oil shales. Superimposition of
the apparent decrease in the H/C ratio of the
organic matter with increasing shale grade and
the decrease in the H/C ratio with increasing
depth of burial may explain why previous workers
have not reported any systematic variation in
the H/C ratio of the organic matter.
Figure 6 is a plot of H/C vs 0/C for the
organic matter concentrates. Note the clear
decrease in both H/C and 0/C ratios with
increasing depth.
161
Page 4
Table 1. Chemical Data for Organic Matter
in Green River Formation Oil Shales (wt%)
Sampl e H N 0
Organic Concentrates
H
Whole Rock
4 4.57 0.68 0.157
5 59.49 8.37 2.019 8.39 3.70 21.18 2.89 0.649
8 58.44 8.71 1.661 6.95 4.87 7.48 1.10 0.225
9 17.65 2.53 0.573
12 59.63 8.54 2.369 6.32 2.70 14.60 2.12 0.583
18 9.79 1.47 0.328
19 10.96 1.63 0.331
24 17.83 2.51 0.695
25 65.32 9.30 1.418 7.11 4.28 8.94 1.27 0.392
29 14.42 1.97 0.508
30 5.05 0.70 0.182
42 15.41 2.13 0.513
43 17.75 2.53 0.519
46 27.28 3.63 1.056
48 61.76 8.50 1.944 4.50 2.20 14.71 2.05 0.427
55 10.07 1.33 0.306
56 7.62 1.04 0.276
58 10.40 1.38 0.305
60 12.53 1.72 0.343
63 69.34 9.35 2.396 6.73 5.15 19.40 2.63 0.622
68 61.05 7.83 1.966 5.63 3.76 15.72 2.04 0.429
69 14.20 1.88 0.449
Note sample depth (in feet) = 390 + (10) (sample number).
2.0 0.04 0.08 0.12 0.02 0.03 0.04
Variation of H/C, 0/C, and N/C ratios with depth of burial. Solid
circles=data obtained from organic concentrates; open circles=data
obtained from HCI -leached samples.
162
Page 5
Figure 4 shows a slight decrease in the N/C
ratio of the organic matter concentrates with
depth, from about 0.030 in the MZ to about 0.029
in the R4 Zone. Such a variation is probably
within the analytical error of the analyses,
however. There is no variation of the total
N/organic C ratio with depth of burial. Recent
workers (Cooper et al , 1983) have suggested that
the N in the Green River oil shales is largely
present in the inorganic fraction, particularly
as NH4 substituting for K in illite and/or K-
feldspar. However, there is no correlation
bewteen wt% total N and wt% normative illite and
K-feldspar (orthoclse). There is a strong
correlation between wt% total N and wt% organic
C (Figure 7). This suggests that inorganic N is
relatively unimportant in the samples studied.0.15
60
8.40
UJ
Q
<oc
O
20-
1.4
-
1 1 1 1 1
\<*>
- 0DEPTH \
0
%)c)
_
-
O
O
O
1 1 1
O
1 "
30
1.6
H/C
1.8
20c
0o>k.
0
d*
in *
2.0
Figure 5 Variation of H/C ratio with shale
grade. Open circles=data obtained from
shallow samples (core depth 390-600 ft;
partially filled circles-data obtained from
intermediate depths (core depths 600-900
ft); solid circles=data obtained from deep
samples (core depth 900-1200 ft).
Figure 6 Plot of H/C vs 0/C for organic
matter concentrates. Numbers=sample depths.
Wt* Ntotal
Figure 7 Plot of wt% total N vs wt% organic
C
163
Page 6
11
10C NMR data for six organic matter concen
trates are shown in Figure 8. Note that while
there are no major differences in the NMR
spectra, there is a clear decrease in the
aliphatic/aromatic ratio with depth, from about
3 in the MZ to 2.5-2.6 in the R4 Zone; the
aromatic C content of the concentrates increases
from about 23% in the MZ to 26-27% in the R4
20 25oo /a Aromatic C
Figure 8 Summary of 13C NMR data showing
variation of aliphatic/aromatic ratio and
fraction of aromatic C with depth.
Individual spectra are also shown. Note the
overall similarity of the NMR spectra.
Zone. The decrease in the aliphatic/aromatic
ratio and the increase in percent aromatic C
with depth is consistent with the decrease in
the H/C ratio with depth shown in Figure 4.
IR spectra for organic matter concentrates
are shown in Figure 9. Note that there are no
major differences in the IR spectra of concen
trates obtained from the top and bottom of the
interval studied. Table 2 shows the variation
of the relative importance of selected absor
bance bands with depth of burial. Note that
there is little change in the absorbance at 2920
cm"1
(aliphatic CH) or at 1640cm"1
(aromatic
C=C) with depth. There is a slight decrease in
the 1705cm"1
band (due to C=0) , consistent with
the observed decrease in the C/0 ratio with
depth. There is also a slight decrase in the
absorbance at 1375cm"1
(aliphatic CH3).
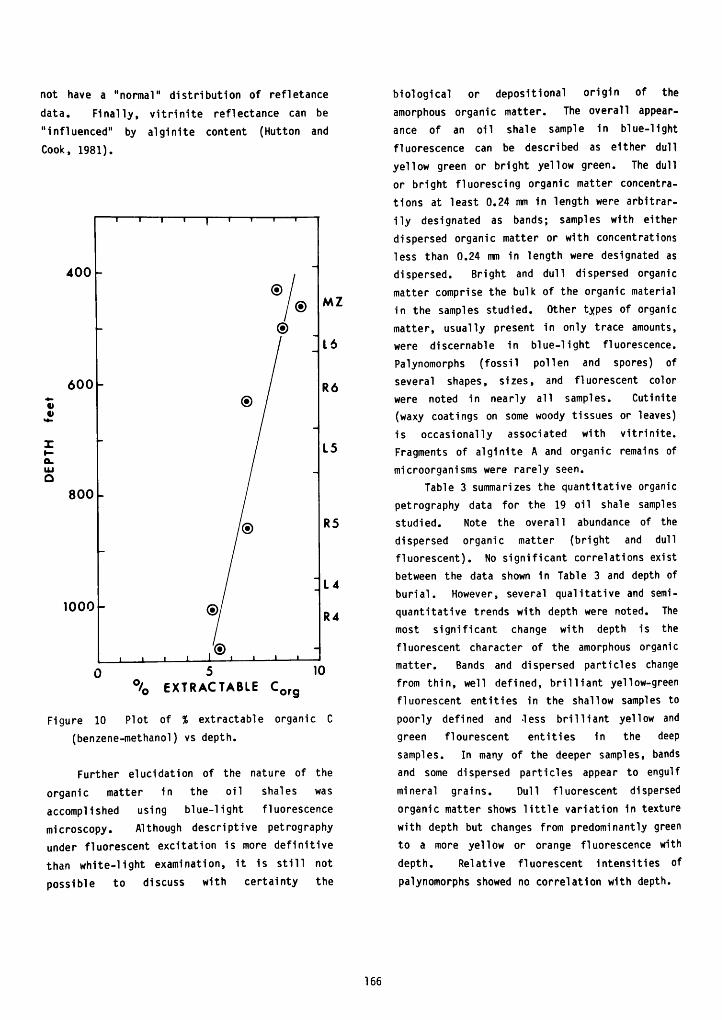
Figure 10 shows a decrease in the percent
extractable organic C with depth: three samples
from the MZ contain 8-9.5% extractable organic
C; two samples from the R4 Zone contain about 5%
extractable organic C.
Organic Petrography
Bradley (1929) provided early descriptions
of Green River formation oil shales from thin
section studies. He found that the most common
type of varve is comprised of a pair of
distinctly segregated dark and light laminae
possessing sharp and regular contacts with each
other and with neighboring varves. The organic
matter in dark laminae is most often light to
dark orange. Black, light, and dark shades of
gray, and brown occur less frequently. Mineral-
free concentrations of organic matter are
usually dark orange or brown whereas organic
concentrations rich in clay minerals are
generally gray or black. Light laminae
generally have yellow or orange colored inter-
stital spaces but may appear as a pure, almost
brilliant white.
164
Page 7
Table 2. IR Absorbance for Selected Peaks (Relative Units)
Sample 2920 cm-1 1705 cm-1 1640 cm-1 1460 cm-1 1375 cm-1
CH C=0 C=C CH2 + CH3 CH3
5 0.82 0.19 0.12 0.16 0.06
8 0.87 0.17 0.12 0.17 0.07
12 0.90 0.21 0.13 0.18 0.07
48 0.94 0.18 0.14 0.20 0.06
63 0.84 0.16 0.12 0.19 0.05
68 0.83 0.16 0.12 0.18 0.04
4000 3000 2000
WAVENUMBER cm
1000
Figure 9 Typical IR spectra for organic
matter concentrates. Sample A from core
depth=430 ft; sample B from core depth=870
ft; sample C from core depth 1180 ft.
In addition to the amorphous organic matter
found concentrated or dispersed in the dark or
light bands, respectively, vitrinite is also
visible in reflected light. Vitrinite
(huminite) occurs most commonly in thin, contin
uous bands (0.001-0.007 mm wide), as dispersed,
elongate particles (0.007-0.6 mm in diameter).
Figure 11 shows the variation of mean vitrinite
reflectance with depth in the interval studied;
samples from the MZ have vitrinite reflectances
of about 0.18 (excluding yery low grade samples
which appear to have anomalously high vitrinite
reflectances; see below); samples from the R4
Zone have reflectance near 0.27. Although
vitrinite reflectances increase systematicaly
with depth (especially if samples of similar
grade are compared), several factors limit the
significance of the trend shown in Figure 11.
First, there is some question as to the
precision and accuracy of vitrinite reflectance
measurements for Rm% <0.3. Second, in samples
with comparatively low vitrinite abundances, re
worked organic matter may appreciably"skew"
the
reflectance histograms. (Re-worked vitrinite
probably accounts for the flat histograms and
comparatively high mean reflectances for the
very low grade oil shale samples.) Thirdly,
some samples with very uniform petrography do
165
Page 8
not have a"normal"
distribution of refletance
data. Finally, vitrinite reflectance can be
"influenced"
by alginite content (Hutton and
Cook, 1981).
Z
a.
UJ
O
400
I T~
t 1 1 r i i'
/
600
-
800 _,
-
-
@
1000
-
i i i i 1 j i i
MZ
16
R6
L5
R5
L4
R4
10
EXTRACTABLE Corg
Figure 10 Plot of % extractable organic C
(benzene-methanol) vs depth.
Further elucidation of the nature of the
organic matter in the oil shales was
accomplished using blue-light fluorescence
microscopy. Although descriptive petrography
under fluorescent excitation is more definitive
than white-light examination, it is still not
possible to discuss with certainty the
biological or depositional origin of the
amorphous organic matter. The overall appear
ance of an oil shale sample in blue-light
fluorescence can be described as either dull
yellow green or bright yellow green. The dull
or bright fluorescing organic matter concentra
tions at least 0.24 mm in length were arbitrar
ily designated as bands; samples with either
dispersed organic matter or with concentrations
less than 0.24 mm in length were designated as
dispersed. Bright and dull dispersed organic
matter comprise the bulk of the organic material
in the samples studied. Other types of organic
matter, usually present in only trace amounts,
were discernable in blue-light fluorescence.
Palynomorphs (fossil pollen and spores) of
several shapes, sizes, and fluorescent color
were noted in nearly all samples. Cutinite
(waxy coatings on some woody tissues or leaves)
is occasionally associated with vitrinite.
Fragments of alginite A and organic remains of
microorganisms were rarely seen.
Table 3 summarizes the quantitative organic
petrography data for the 19 oil shale samples
studied. Note the overall abundance of the
dispersed organic matter (bright and dull
fluorescent). No significant correlations exist
between the data shown in Table 3 and depth of
burial. However, several qualitative and semi
quantitative trends with depth were noted. The
most significant change with depth is the
fluorescent character of the amorphous organic
matter. Bands and dispersed particles change
from thin, well defined, brilliant yellow-green
fluorescent entities in the shallow samples to
poorly defined and less brilliant yellow and
green flourescent entities in the deep
samples. In many of the deeper samples, bands
and some dispersed particles appear to engulf
mineral grains. Dull fluorescent dispersed
organic matter shows little variation in texture
with depth but changes from predominantly green
to a more yellow or orange fluorescence with
depth. Relative fluorescent intensities of
palynomorphs showed no correlation with depth.
166
Page 9
Table 3. Quantitative Petrogramic Data (Vol%)
Sample Bright Dull Bright Dull V1t. Palyn. Other
Banded Dispersed
4 0.0 0.2 4.8 33.6 2.0 0.8 1.8 (1)5 3.8 1.2 10.0 24.2 4.8 0.0 1.4 (1)8 0.0 0.0 1.8 38.4 0.0 0.0 0.4 (2)9 0.0 0.0 13.6 26.8 0.0 0.0 1.4 (3)18 0.2 0.0 7.8 32.6 0.0 0.2 2.6 (4)19 0.2 0.0 9.5 32.3 1.0 0.0 1.0 (5)24 0.0 0.6 1.2 25.0 0.0 0.0 16.0 (1)25 0.0 0.0 21.2 26.6 0.8 0.0 0.0
29 0.0 0.0 0.6 41.8 0.2 0.0 0.4 (7)42 0.0 0.0 35.4 8.8 0.0 0.0 0.0
43 2.2 0.0 18.4 32.0 0.2 0.0 0.2 (6)0.6 (7)46 0.0 0.6 39.2 8.4 0.4 0.0
48 3.8 0.8 13.0 33.0 0.6 0.0 10.1 (7)55 1.2 1.2 5.2 35.2 0.0 0.2 2.2 (7)58 0.0 0.0 2.2 39.6 0.0 0.2 41.4 7)60 0.2 0.2 3.8 36.4 0.4 0.0 27.3 (7)63 2.2 1.8 13.8 34.8 1.0 0.0 0.0
68 3.6 0.6 20.2 24.3 0.4 0.0 0.4 (7)69 0.0 0.0 4.0 36.0 0.2 0.2 0.0
?minimum 500 points counted, organic density assumed = 1.0
(1) dark black fluorescing matter, (2) alginite, (3) bituminite, (4) fluorescent porosity fill,
(5) microfossils, (6) solid hydrocarbon, (7) voids (excluded from point count total)
DISCUSSIONS AND CONCLUSIONS
The change in the chemical composition of
the organic matter with depth in the Green River
Formation oil shales studied almost certainly
reflects increasing organic maturation with
depth. The observed decrease in both the H/C
and 0/C ratios of the organic matter is consis
tent with the maturation pathway given by Tisot
and Welte (1978) for Type I organic matter.
This 1s shown in Figure 12. Note that the
organic matter concentrates analyzed in this
study all plot slightly above the"mean"
Type I
maturation pathway. The apparently high H/C
ratios of the concentrates analyzed in this
study (although well within the overall range
reported by other workers; i.e. Robinson and
Cook, 1971, 1973) may reflect the fact that the
total organic fraction in the shales was
analyzed instead of only the kerogen (or non-
soluble) fraction. The decrease 1n the alipha
tic/aromatic ratio of the organic matter and the
increase in the percent aromatic C (NMR data) is
also consistent with increasing organic matura
tion with depth. Recently, Miknis et al .
(1982), showed a significant decrease in the
fraction of aliphatic C with depth in the
Permian Phosphoria Formation organic rich shale
units using NMR techniques. The IR data
reported in this study are consistent with the
decrease in the 0/C ratio of th organic matter
with depth of burial.
The correlation between the H/C ratio of
the organic matter and oil shale grade (wt%
organic C or gal /ton) suggests that there may be
a difference in the type of organic matter in
organic-rich and organic-poor shales. Minor
petrographic differences exist between organic-
rich and organic poor laminae: organic matter
in dark (=organic-r1ch) laminae are typically
light or dark orange colored while organic
matter in light laminae are typically yellow or
orange. Recall, also, that the vitrinite
reflectances of organic-poor oil shales appear
167
Page 10
anomalously high. (Unfortunately, not enough
high-grade low-grade sample pairs from similar
depths were analyzed.) The limited NMR and IR
data, however, show no clear relationship with
oil shale grade. Clearly, additional studies
are needed in order to determine if such differ
ences actually exist.
400-
600 -
800-
1000 -
0.15 0.20 0.25
REFLECTANCE Rm %
0.30
Figure 11 Variation of vitrinite reflectance
with depth. Stars=samples with less than 5
wt% organic C.
Changes in the appearance of the organic
matter with depth in the oil shales are diffi
cult to detect because of non-uniform distribu
tion of organic matter, varying organic-inor
ganic associations, and the relatively small
stratigraphic separation between shallow and
deep samples in the section studied. The
significance of the changes actually observed
with depth depends on the relative influence of
changing depositional environment vs thermal
maturation. Several workers (i.e. Robinson,
1976; Cane, 1976; Bradley, 1976) believe that a
variety of source materials, depositional
environments, and microbial degradation
processes occurred throughout deposition of the
Green River formation. Although such changes
may affect the appearance of the amorphous
organic matter in the shales, some of the quali
tative and semi-quantitative changes observed
with depth are so systematic that explanations
involving thermal maturation are necessary. The
most convincing petrographic evidence for
increased thermal maturation with depth in the
interval studied is the fluorescent character of
the organic matter. The absence of thin,
sharply defined individual bands in the deeper
samples and the corresponding lack of diffuse
bands in the shallow samples suggest that some
thermal threshold must have been reached by the
near the middle of the sequence studied (R5
zone). Overall, the fluorescent color of the
organic matter shifts from green to yellow with
depth (provided mineral interferences are
minimal). Although the authors are not aware of
literature documenting substantial changes in
the fluorescent character of the organic matter
with depth in the Green River formation, the
variation reported in this study is consistent
with changes reported for low rank coals (i.e.
Stach, 1975), particularly the shift in fluores
cence maxima (green to yellow). Vitrinite
reflectance is the only quantitative parameter
that showed significant variation with depth.
The observed increase in vitrinite reflectance
is consistent with increased thermal maturation
with depth. As noted earlier, several factors
limit the usefulness of the vitrinite data as a
thermal maturation indicator.
Considered together, the organic geochem
istry data and the organic petrography data
reported in this study indicate that significant
differences in the nature of the organic
fraction with depth of burial exist in the oil
shales of the Green River formation. The
observed changes largely reflect increasing
thermal maturation of the organic matter with
168
Page 11
depth. Changes due to differences in deposi
tional environments are minor in the interval
studied. Depth-related variations in the
composition of the organic matter need to be
considered in process design, particularly the
decrease in the H/C and 0/C ratios and the
Increase in the aromatic/aliphatic ratio of the
organic matter. The relationship between the
composition of Green River formation oil shale,
both the organic and inorganic fraction, and
pyrolysis products in this interval are
discussed by Meddaugh (1984).
REFERENCES
Bradley, W. H., 1929. The varves and climate of
the Green River epoch, U.S. Geol. Surv.
Prof. Paper 158-E, p. 87-110.
Bradley, W. H., 1976. Green River oil shale -
concept of origin extended: Geol. Soc.
Amer. Bull., 81, 985-1000.
Cane, R. F., 1976. The origin and formation of
oil shale, p. 61-79 in Oil Shale, Yen, T. F.
and Chilingarian, eds., Elsevier.
2.0r
1.5
U
,.0
0.5
0.1
o/c
0.2 0.3
Cooper, J. E. and Evans, W. S., 1983. Science
219, p. 493-4.
Meddaugh, W. S., 1984. Variation of Fischer
Assay pyrolysis products with depth, Green
River Formation oil shales, Piceance Creek
Basin, Colorado in 17th Oil Shale Symposium
Proceedings, Colorado School of Mines,
Golden, Colorado (April,, 1984).
Meddaugh, W. S. and Salotti, C. A., 1983.
Mineralogy and geochemistry of Green River
Formation in oil shales, C-a Tract,
Colorado, p. 113-123 in 16th Oil Shale
Symposium Proceedings, Gary, J. H., ed.,
Colorado School of Mines, April, 1983.
Micknis, F. P., Smith, J. W. , Maughan, E. K.,
and Maciel, G. E., 1982. Nuclear magnetic
resonance: technique for direct non
destructive evalation of source-rock
potential: AAPG .v. 66, no. 9, p. 1396-1401.
Figure 12 Van Krevelen diagram showing the
relationship between the oil shale samples
analyzed in this study and the various
maturation pathways (I, II, III) of Tisot
and Welte (1978).
Robinson, W. E., 1976. Origin and character
istics of Green River Formation oil shale,
p. 61-79 in Oil Shale, Yen, T. F. and
Chilingarian, G. V., eds., Elsevier, 292 p.
Robinson, W. E. and Cook, G. L., 1971. USBM Rep
Inv. 7491, 32 p.
169
Page 12
Smith, J. W., 1983. The chemistry that formed
Green River Formation oil shales, p. 225-248
in Geochemistry and Chemistry of Oil Shales,
Micknis, F. P. and McKay, J. F. (eds.),
Amer. Cham. Soc. Sym. Ser. 230, 565 p.
Smith, J. W. , 1963. Stratigraphic change in
organic composition demonstrated by specific
gravity-depth correlation in Tertiary Green
River Formation oil shales: AAPG Bull. 47,
p. 804-813.
Smith, J. W. and Harbaugh, J. W., 1966. UYSBM
Rep. Inv. 6883, 11 p.
Stach, E., Mackowski, M. Th., Teichmuller, M.,
Taylor, G. H. , and Teichmuller, R., 1975.
Stach'
s Textbook of Coal Petrology,
Borntraegar, Berlin, 428 p.
Tissot, B. P. and Welte, D. H., 1978. Petroleum
Formation and Occurrence, Springer-Verlag,
Berlin, 538 p.
170
Page 13
VARIATION OF FISCHER ASSAY PYROLYSIS PRODUCTS WITH DEPTH
GREEN RIVER FORMATION OIL SHALES
PICEANCE CREEK BASIN, COLORADO
W. Scott Meddaugh
Production Research Division
Gulf Research and Development Company
Houston, TX
ABSTRACT
Material -balance Fischer Assay data have
been obtained for 22 samples (10-62 gal/ton) 1n
the 213 m (700 ft) interval between the top of
the Mahogany Zone (MZ) and the base of the R4
zone. Significant variations in product yield
and composition exist in the Interval studied.
In the MZ-L5 interval the product gas composi
tion is (mol%) H2 > C02 >CH4. In the R5-R4
interval the product gas composition is CO2Ho *> CHyi The increased C02 content of the
product gas, due largely to dawsonite decomposi
tion, significantly lowers the thermal value of
the product gas from about 900BTU/ft3
in the MZ
to 200-500BTU/ft3
in the R5-R4 Interval.
Product oil composition also varies with
depth. In the MZ-L5 interval the most important
changes are a decrease 1n the H/C ratio and an
increase in oil gravity (g/cm3) with depth.
These changes are related to changes 1n the
composition of the organic matter. In the
dawsonitic R5-R4 zone the principal change Is an
increase 1n the H/C ratio and a decrease in the
oil gravity with depth. This apparent reversal
probably reflects some catalytic action of
dawsonite (and/or nacholite) or Its decomposi
tion products (such as A1203). Average
pyrolysis stochiometries obtained for the MZ,
R6, R5, and R4 zones are similar.
INTRODUCTION
The Fischer Assay (FA) pyrolysis technique
is widely used to determine the oil yield (oil
volume/shale weight) of oil shales. The assay
products (oil, gas, and water) are often
subjected to additional analyses 1n order to
obtain an understanding of the pyrolysis stoch-
iometry as well as the nature and quality of the
products.
In this study material -balance FA data were
obtained from 22 oil shales samples from a core
from near the center of the C-a Tract, Piceance
Creek Basin, Colorado. The samples were
obtained at irregular intervals from the 213 m
(700 ft) interval between the top of the
Mahogany Zone (MZ) and the base of the R4
zone. The material -balance FA data are used to
asess variations in product yield and quality
with depth in the MZ-R4 interval. The data are
also used assess correlations between product
yield and quality and the in place nature of oil
shale. The mineralogy of the oil shales within
the MZ-R4 interval has been reported by Meddaugh
and Salotti (1983). The organic geochemistry
and petrography of this Interval is discussed by
Meddaugh et al. (1984).
171