153
Second Quarter 2020/21 Volume 37 No. 2 የኢትዮጵያ ብሔራዊ ባንክ National Bank of Ethiopia

Second Quarter 2020/21
Volume 37 No. 2
የኢትዮጵያ ብሔራዊ ባንክNational Bank of Ethiopia

National Bank of Ethiopia (Central Bank)
: http://www.nbe.gov.et
Prepared By: Domestic Economic Analysis & Publications Directorate
Domestic Economic Analysis & Publications DirectorateNational Bank of EthiopiaP. O. Box 5550Tel. 251 11 517 2247/ 11 517 5297Addis Ababa, Ethiopia
National Bank of Ethiopia
Web Site
This Publication can be acquired by subscription or exchange. Please Contact:
P.O. Box: 5550, Addis Ababa, Ethiopia
Tel. 251-11-551 7430
Tel. 251-11-551 4588
Telegraphic Address:
NATIONAL BANK, TELEX 21020, CODES
USED PETERSON 3rd & 4th ED
BENTLEY’S 2nd PHRAS A.B.C...6th H EDITION
NATIONAL BANK OF ETHIOPIAQuarterly Bulletin
Volume 37, No.2Second Quarter 2020/21
Fiscal year Series
Addis Ababa 2021


Table of Contents Pages
Ethiopia: Macroeconomic and Social Indicators .....................................................................i
I. Overview ....................................................................................................................................1
1.1: International Economic Developments .................................................................. 1
1.2: Macroeconomic Developments in Ethiopia .......................................................... 2
II. Energy Production and Processing .........................................................................................5
2.1: Import of Petroleum Products .................................................................................... 5
2.2: Electric Power Generation ......................................................................................... 10
III. Quarterly Price Developments ...............................................................................................12
3.1: Developments in National CPI .................................................................................. 12
3.2: Developments in Regional Inflation ......................................................................... 14
IV. Monetary Developments .......................................................................................................17
4.1: Money Supply and Credit ........................................................................................... 17
4.2: Developments in Reserve Money and Monetary Ratio .......................................... 20
4.3: Interest Rate Developments ...................................................................................... 22
4.4: Developments in the Financial Sector ...................................................................... 24
4.5: Activities of the Banking System ................................................................................. 27
4.5.1: Resource Mobilization ................................................................................... 27
4.5.1.1: Deposit Mobilization ................................................................................... 29
4.5.1.2: Collection of Loans ................................................................................ 30
4.5.1.3: Borrowing ................................................................................................ 31
4.5.2: Disbursement of Fresh Loans ....................................................................... 31
4.5.3: Outstanding Credit ........................................................................................ 33
4.6: Financial Activities of NBE .......................................................................................... 34
4.7: Developments in Financial Markets .......................................................................... 35
4.7.1:Treasury Bills Market ........................................................................................ 35
4.7.2: Inter-bank Money Market ............................................................................ 38
4.7.3: Corporate Bond Market ................................................................................ 38
V. External Sector Developments ...............................................................................................40
5.1: Balance of Payments ................................................................................................ 40
5.2: Balance of Trade ......................................................................................................... 43
5.2.1: Exports of Goods ........................................................................................... 44
5.2.2: Imports of Goods ........................................................................................... 49
5.2.3: Direction of Trade ........................................................................................ 52
5.2.3.1: Exports of goods ..................................................................................... 52

| Second Quarter 2020/21
National Bank of Ethiopia Quarterly Bulletin 5.2.3.2: Imports of goods .................................................................................... 53
5.3: Services and Transfers ................................................................................................. 54
5.4: Current Account Balance ......................................................................................... 57
5.5: Capital Account .......................................................................................................... 58
5.6: Changes in Reserve Position ..................................................................................... 58
5.7: Developments in Foreign Exchange Market ............................................................ 58
5.7.1: Exchange Rate Movements ........................................................................ 58
5.7.2: Movements in the Real Effective Exchange Rate .................................... 66
5.7.3: Volume of Transactions ................................................................................ 68
VI. Federal Government Finance ................................................................................................69
6.1: Revenue and Grants ................................................................................................... 71
6.2: Expenditure ................................................................................................................... 73
6.3: Deficit Financing .......................................................................................................... 76
VII. Developments in Investment .................................................................................................77
VIII. International Economic Developments ...............................................................................81
8.1: Overview of the World Economy .............................................................................. 81
8.2: Inflation Developments ............................................................................................... 82
8.3: Commodity Price ......................................................................................................... 82
8.4: Exchange Rate Development .................................................................................... 82
8.5: Impact of Global Economic Dev't on Ethiopian Economy .................................. 83
Statistical Tables .........................................................................................................................87

| i
Ethi
opia
: Mac
roec
onom
ic a
nd S
ocia
l Ind
icat
ors
In
dica
tors
2004
/05
2005
/06
2006
/07
2007
/08
2008
/09
2009
/10
2010
/11
2011
/12
2012
/13
2013
/14
2014
/15
201
5/16
201
6/17
2017
/18
201
8/19
201
9/20
(199
7)(1
998)
(199
9)(2
000)
(200
1)(2
002)
(200
3)(2
004)
(200
5)(2
006)
(200
7)(2
008)
(200
9)(2
010)
(201
1)(2
012)
1.
Cou
ntry
Pro
file
L
and
Are
a (t
otal
, In
Sq.K
m)
1.14
milli
on1.
14m
illion
1.14
milli
on1.
14m
illion
1.14
milli
on 1
.14m
illion
1.1
4 m
illion
1.1
4 m
illion
1.1
4 m
illion
1.1
4 m
illion
1.
14 m
illion
1.1
4 m
illion
1.1
4 m
illion
1.
14 m
illion
1.14
milli
on1.
14 m
illion
A
rabl
e La
nd (
% o
f tot
al a
rea
)45
.045
.045
.045
.045
.0 4
5.00
4
5.00
4
5.00
N
A
NA
N
A
NA
N
A
15.
20
15.2
10
Ir
rigat
ed L
and
( %
of t
otal
are
a )
3.0
3.0
3.0
3.0
3.0
NA
N
A
NA
N
A
NA
N
A
NA
N
A
2,9
00.0
0 3
,100
.00
5.0
P
opul
atio
n D
ensit
y ( p
erso
n pe
r sq.
km )*
99.7
101.
299
.610
2.1
104.
7 1
07.4
0 1
10.1
4 1
12.9
4 1
15.7
6 1
18.6
1 1
21.5
0
2.
Soci
al In
dica
tors
Popu
latio
n to
tal, i
n m
illion
s (M
id-Y
ear p
opul
atio
n)68
.30
70.0
072
.40
74.9
076
.8 7
8.80
8
0.70
8
2.7
84.
8 8
7.0
89.
1 9
1.2
93.
4 9
5.5
97.6
99.7
5
(o/w
Urb
an P
oula
tion,
in %
)15
.97
16.2
116
.45
1716
.14
16.
30
16.
10
16.
3 1
8.6
19.
0 1
9.5
19.
9 2
0.3
20.
8 21
22.8
Wor
king
Age
Pop
ulat
ion
( In
Milli
ons )
Urb
an6.
957.
67.
68.
08.
4 8
.92
9.4
3 1
0.0
10.
5 1
1.1
11.
6 1
2.2
12.
8 7
10
.1N
A
Rur
al
32.6
33.2
32.9
31.3
33.0
33.
89
34.
83
35.
8 3
6.8
37.
7 3
8.7
39.
7 4
0.8
49
49.8
NA
Tot
al
39.6
40.7
40.6
39.3
41.4
42.
82
44.
26
45.
7 4
7.3
48.
8 5
0.4
52.
0 5
3.6
56
59.9
NA
Age
Dep
end
ency
Rat
io84
.784
.384
.393
93 9
3.00
9
3.00
9
3.0
75.
0 7
5.0
75.
0 7
5.0
75.
0 6
9 69
69
Life
Exp
ecta
ncy
at B
irth
( Mal
e - F
emal
e )
53.4
2-55
.42
55.6
-57.
955
.6-5
7.9
53.4
-55.
453
.4-5
5.4
53.
4-55
.4
58.
4-60
.4
53.
4-55
.4
60.
2-64
.2
60.
2-64
.2
60.
2-64
.2
60.
2-64
.2
60.
2-64
.2
62.
4-66
.6
62.4
-66.
662
.4-6
6.7
Cru
de
Birth
Rat
e35
.7:1
,000
36.9
:1,0
0036
.9:1
,000
35.7
:1,0
0035
.7:1
000
35.
7:10
00
33.
6:10
00
33.
6:10
00
30.
3:10
00
30.
3:10
00
30.
3:10
00
30.
3:10
00
30.
3:10
00
27:
1000
27
:100
027
:100
1
Cru
de
Dea
th R
ate
12.6
:100
010
.8:1
,000
10.8
:1,0
0010
.8:1
,000
NA
NA
9
.2:1
,000
9
.2:1
,000
7
.2:1
000
7.2
:100
0 7
.2:1
000
7.2
:100
0 7
.2:1
000
6.3
0 6
6
Nat
ural
Rat
e of
Pop
ulat
ion
Incr
ease
( In
% )
2.7
2.7
2.7
2.7
2.7
2.6
0 2
.40
2.4
0 2
.31
2.3
1 2
.31
2.3
1 2
.31
2.0
7 2.
072.
07
Tot
al F
ertil
ity R
ate
5.4c
hild
:W5.
4chi
ld:W
5.4c
hild
:W5.
4chi
ld:W
5.4c
hild
:W 5
chi
ld:W
4.
8chi
ld:W
4.
8chi
ld:W
3
.94c
hil:W
3
.94c
hil:W
3
.94c
hil:W
3
.94c
hil:W
3
.94c
hil:W
3
.45c
hil:W
3.
45ch
il:W3.
5chi
l:W
Peo
ple
: Hos
pita
l Bed
s 52
73.5
:150
28:1
5293
:156
98:1
5082
:1 7
815:
1 N
A
NA
2
516:
1 N
A
NA
28
50:1
2980
:136
17:1
3150
:127
50
Peo
ple
: Phy
sicia
n129
777:
135
493:
149
888:
136
374:
136
175:
1 5
6013
:1
536
42:1
2
8847
:1
321
32:1
2
0970
:1
171
60:1
1
4045
:1
227
66:1
2
6635
:1
-99
77
Peo
ple
: Nur
se 1
3956
.8:1
4206
:146
01:1
4524
:138
70:1
301
2:1
276
2:1
229
9:1
188
4:1
199
5:1
1999
:01:
0019
99:1
1194
:117
80:1
1624
:117
05
Infa
nt M
orta
lity
Rate
80:1
,000
80:1
,000
80:1
,000
77:1
,000
77:1
,000
77:
1,00
0 7
3:10
00
59:
1000
6
2.2:
1000
6
2.4:
1000
6
2.4:
1000
6
2.4:
1000
6
2.4:
100
53.
3:10
00
53.3
:100
043
.3:1
000
Acc
ess t
o Sa
fe W
ater
( In
%)
C
ount
ry L
evel
45
.647
.352
.559
.566
.2 6
8.50
7
3.30
5
8.3
68.
5 7
6.7
84.
0 6
1.0
66.
0 7
1.0
7679
Ur
ban
Popu
latio
n 82
NA
82.0
86.2
88.6
91.
50
92.
50
78.
7 8
1.3
84.
2 9
1.0
52.
5 5
5.0
60.
0 66
66.5
Ru
ral P
opul
atio
n 38
.442
.246
.453
.961
.5 6
5.80
7
1.30
5
5.2
66.
5 7
5.5
82.
0 6
3.1
68.
0 7
4.0
7982
.7
Stu
den
t-Tea
cher
Rat
io
Prim
ary
( 1-8
)66
:162
:159
:157
:154
:1 5
1:1
51:
1 5
0:1
49:
1 4
7:1
46:
1 4
6:1
- 39
39
Sec
ond
ary
( 9-1
2 )
51:1
57:1
48:1
43:1
41:1
36:
1 3
1:1
29:
1 2
8.7:
1 2
7.8:
1 2
6.4:
1 2
6.5:
1 -
22.5
24
Tec
hnic
al &
Voc
atio
nal
21:1
20:1
27:1
25:1
34:1
NA
2
9:1
24.
7:1
18.
6:1
16.
5:1
16.
5:1
12.
6:1
- 13
.313
.3
Stu
den
t-Sch
ool R
atio
Pr
imar
y ( 1
-8 )
690:
165
4:1
677:
165
7:1
619:
1 5
73:1
5
90:1
5
76:1
5
71:1
5
71:1
7
44.9
:1
573
:1
- 62
852
8
Sec
ond
ary
( 9-1
2 )
1350
:114
25:1
1440
:113
81:1
1345
:1 1
270:
1 1
160:
1 1
033:
1 9
94:1
8
57:1
3
69:1
7
67.2
:1
- 56
894
0
Tec
hnic
al &
Voc
atio
nal
534:
146
8:1
493:
150
1:1
673:
1 7
88:1
7
35:1
6
54:1
5
44:1
5
45:1
3
83:1
5
23:1
-
246.
8N
A

ii | Second Quarter 2020/21
National Bank of Ethiopia Quarterly BulletinC
ontin
ued.
..
Indi
cato
rs20
04/0
520
05/0
620
06/0
720
07/0
820
08/0
920
09/1
020
10/1
120
11/1
220
12/1
320
13/1
420
14/1
5 2
015/
16 2
016/
1720
17/1
8 2
018/
19 2
019/
20
(199
7)(1
998)
(199
9)(2
000)
(200
1)(2
002)
(200
3)(2
004)
(200
5)(2
006)
(200
7)(2
008)
(200
9)(2
010)
(201
1)(2
012)
3.
Mac
roec
onom
ic In
dica
tors
3.1:
Rea
l sec
tor D
evel
opm
ent2
GD
P at
Cur
rent
Mar
ket P
rice
(In M
n. B
irr)
105
,415
.0
130
,334
.0
170
,281
.0
245
,836
.0
332
,060
.0
379
,135
.00
515
,078
.5
747
,326
.5
866
,921
.1
1,06
0,82
5.4
1,29
7,96
1.4
1,56
8,09
7.5
1,71
7,12
7.2
1,83
4,06
6.5
1987
157.
533
7434
9.0
Nom
inal
GD
P G
row
th R
ate
(In %
) 2
2.9
23.
6 3
0.6
44.
4 3
5.1
14.
18
35.
9 4
5.1
15.
3 2
2.4
22.
4 1
8.2
17.
7 2
1.4
23.3
25.5
Ave
rage
Mar
gina
l Exc
hang
e Ra
te (B
irr p
er U
SD)
8.6
518
8.6
810
8.7
943
9.2
400
10.
4200
1
2.89
1
6.1
17.
3 1
8.3
19.
1 2
0.1
21.
10
22.
40
26.
10
28.
10
31.
34
GD
P at
Cur
rent
Mar
ket P
rice
(IN M
n. U
SD)
12,
184.
2 1
5,01
3.7
19,
362.
7 2
6,60
5.6
31,
867.
6 2
9,41
3.11
3
1,95
7.1
43,
314.
2 4
7,42
4.6
55,
628.
0 6
4,57
5.2
74,
297.
0 8
1,76
0.0
84,
356.
0 96
107.
010
7660
.0
Nom
inal
GD
P pe
r Cap
ita (I
n US
D)
178
.4
214
.5
267
.4
355
.2
415
3
73.2
6 3
96.1
5
23.5
5
59.1
6
39.6
7
25.0
8
15.0
8
76.0
8
83.0
98
5.0
1080
.0
Real
GD
P pe
r Cap
ita (
In B
irr )
3,9
76.7
4
,300
.5
4,6
34.2
4
,962
.8
5,2
66.1
5
,776
.60
5,8
95.0
0 6
,947
.5
7,2
99.1
7
,625
.2
8,5
71.2
8
,864
.0
18,
257.
5 1
9,20
4.9
2036
0.2
2114
4.1
Real
GD
P pe
r Cap
ita G
row
th R
ate
(In %
) 8
.9
8.1
7
.8
7.1
6
.1
9.6
9 9
.00
6.1
5
.1
4.5
1
2.4
3.4
8
.0
5.2
6.
03.
8
GD
P D
eflat
or (%
cha
nge)
9.9
1
1.6
17.
2 3
0.3
24.
2 1
.70
20.
08
33.
5 4
.9
11.
0 1
0.8
9.5
6
.7
12.
5 20
.118
.2
Real
GD
P a
t con
stan
t bas
ic p
rice
(In M
n. B
irr)
248
,354
.8
277
,013
.3
309
,686
.8
344
,331
.9
378
,907
.4
418
,946
.95
475
,647
.50
517
,026
.5
568
,432
.3
626
,977
.4
692
,221
.7
1,44
9,39
7.5
1,59
6,48
1.6
1,71
9,49
1.3
1874
689.
319
8951
9005
.0
Real
GD
P at
con
stan
t mar
ket p
rice
(In M
n. B
irr)
271
,605
.2
301
,032
.7
335
,519
.0
371
,716
.7
404
,437
.0
455
,196
.02
515
,078
.50
559
,621
.6
618
,842
.2
682
,358
.5
753
,229
.7
1,56
8,09
7.5
1,71
7,12
7.2
1,83
4,06
6.5
1,98
7,15
7.5
2,1
09,1
22.2
Real
GD
P G
row
th R
ate
(In %
) 1
2.6
11.
5 1
1.8
11.
2 1
0.0
10.
57
11.
40
8.7
9
.9
10.
3 1
0.4
8.0
1
0.1
7.7
9.
06.
1
Agr
icul
ture
& A
llied
Act
ivtie
s(In
Billi
on B
irr)
130
.5
144
.8
158
.5
170
.3
181
.2
195
.00
212
.50
222
.9
238
.8
251
.8
267
.8
544
.1
580
.4
600
.9
624
650
Ind
ustri
al S
ecto
r (In
Billi
on B
irr)
25.
9 2
8.4
30.
6 3
3.9
37.
3 4
1.99
4
9.80
5
9.6
73.
9 8
6.5
103
.7
343
.9
413
.8
464
.4
526.
257
6.9
Serv
ice
Sect
or(In
Billi
on B
irr)
94.
6 1
07.6
1
24.1
1
44.1
1
63.9
1
85.1
0 2
16.6
0 2
37.4
2
58.8
2
92.5
3
25.0
5
75.9
6
19.3
6
73.9
74
5.7
786.
8
A
gric
ultu
re &
Allie
d A
ctiv
ties (
% o
f GD
P) 5
1.9
51.
5 5
0.5
48.
8 4
7.3
46.
13
44.
37
43.
1 4
2.0
40.
2 3
8.7
37.
5 3
6.4
34.
9 33
.332
.7
I
ndus
trial
Sec
tor (
% o
f GD
P )
10.
6 1
0.4
10.
2 1
0.1
10.
1 1
0.17
1
0.40
1
1.5
13.
0 1
3.8
15.
0 2
3.7
25.
9 2
7.0
28.1
29
S
ervi
ce S
ecto
r ( %
of G
DP
) 3
7.5
38.
0 3
9.3
41.
0 4
2.6
43.
70
45.
23
45.
9 4
5.5
46.
6 4
7.0
39.
7 3
8.8
39.
2 40
40
Priv
ate
Con
sum
ptio
n Ex
pend
iture
81,
445.
0 1
02,5
37.0
1
30,1
18.0
1
97,4
61.0
2
68,0
02.0
3
09,1
32.0
0 3
73,0
88.5
0 5
41,5
36.3
6
36,9
01.3
7
44,9
78.0
1,
042,
265.
0 1,
219,
366.
0 1,
147,
628.
0 1,
441,
581.
0 18
8407
0.0
2360
896.
0
Gov
ernm
ent C
onsu
mpt
ion
Expe
nditu
re 1
3,97
1.0
17,
016.
0 1
9,12
3.0
25,
782.
0 3
1,54
4.0
34,
801.
00
53,
147.
10
62,
044.
5 7
7,63
6.9
98,
121.
0 1
16,9
95.0
1
74,5
99.0
2
03,6
08.0
2
25,5
23.0
24
7362
.030
7769
.0
Inve
stm
ent
27,
409.
0 3
5,95
2.0
41,
227.
0 6
0,15
6.0
82,
560.
0 1
02,4
03.0
0 1
65,3
80.0
0 2
77,2
43.7
2
95,4
56.4
4
02,9
22.0
5
11,6
18.0
5
85,6
65.0
7
04,5
96.0
7
51,6
26.0
94
8866
.010
3768
5.0
Expo
rts 1
6,07
6.9
18,
205.
4 2
1,85
4.2
28,
317.
0 3
5,23
3.0
52,
168.
00
85,
949.
80
102
,887
.0
108
,227
.1
123
,496
.0
121
,532
.2
122
,501
.0
139
,830
.0
184
,282
.0
2134
37.0
2392
29.0
Impo
rts 3
7,77
6.3
48,
092.
4 5
5,08
8.7
76,
564.
0 9
6,28
5.0
126
,319
.00
162
,486
.80
236
,384
.7
251
,300
.6
308
,691
.3
393
,189
.0
424
,750
.0
430
,233
.0
502
,113
.0
5615
12.0
5712
30.0
Reso
urce
Bal
ance
-21,
699.
4-2
9,88
7.0
-33,
234.
4-4
8,24
7.0
-61,
052.
0 (7
4,15
1.00
) (7
6,53
7.00
) (1
33,4
98.0
) (1
43,0
73.5
) (1
85,1
95.3
) (2
71,6
56.0
) (3
02,2
49.0
) (2
90,4
03.0
) (3
17,8
31.0
)-3
4807
5.0
-332
001.
0
G
ross
Priv
ate
Con
sum
ptio
n (%
of G
DP)
77.
3 7
8.7
76.
4 8
0.3
80.
7 8
1.54
7
2.43
7
2.5
73.
5 7
0.2
69.
0 6
7.9
63.
5 7
5.7
94.8
70.0
G
ross
Gov
ernm
ent C
osum
ptio
n
(%
of G
DP)
13.
3 1
3.1
11.
2 1
0.5
9.5
9
.18
10.
32
8.3
9
.0
9.2
9
.0
9.7
1
2.3
10.
2 12
.49.
1
Gro
ss D
omes
tic F
ixed
Inve
stm
ent
(
% o
f GD
P) 2
6.0
27.
6 2
4.2
24.
5 2
4.9
27.
01
32.
11
37.
1 3
4.1
38.
0 3
9.4
37.
3 3
8.4
34.
1 47
.730
.8
R
esou
rce
Bala
nce
(% o
f GD
P)-2
0.6
-22.
9-1
9.5
-19.
6-1
8.4
(19.
56)
(14.
86)
(17.
9) (1
6.5)
(17.
5) (2
0.9)
(19.
3) (1
5.9)
(14.
4) (1
7.5)
(9.8
)

| iii
Con
tinue
d….
Indi
cato
rs20
04/0
520
05/0
620
06/0
720
07/0
820
08/0
920
09/1
020
10/1
120
11/1
220
12/1
320
13/1
420
14/1
5 2
015/
16 2
016/
1720
17/1
8 2
018/
19 2
019/
20
(199
7)(1
998)
(199
9)(2
000)
(200
1)(2
002)
(200
3)(2
004)
(200
5)(2
006)
(200
7)(2
008)
(200
9)(2
010)
(201
1)(2
012)
3.2:
Mon
etor
y In
dict
ors
Nar
row
Mon
ey S
uppl
y (M
1) (
In M
n. B
irr )
21,2
89.8
23,8
11.9
29,7
73.4
36,8
75.5
42,1
12.7
52,4
34.6
76,
171.
00
94,
849.
88
114,
745.
69
134,
063.
78
154,
706.
34
178,
609.
66
216,
794.
60
281,
154.
70
308
,937
.1
360
,585
.5
Bro
ad M
oney
Sup
ply
(M2)
( In
Mn.
Birr
)40
,212
.146
,377
.456
,860
.369
,918
.282
,509
.810
4,43
2.4
145
,376
.97
189
,398
.78
235
,313
.59
297
,746
.59
371
,328
.91
445
,266
.25
573
,408
.60
740
,572
.50
886
,752
.5
1,0
37,6
46.3
N
et F
orei
gn A
sset
s ( In
Mn.
Birr
)13
,868
.012
,109
.613
,927
.312
,140
.617
,976
.827
,189
.8 5
5,53
4.68
3
9,78
7.69
4
5,64
8.53
4
5,97
2.30
3
7,57
0.95
2
1,52
4.19
3
8,03
4.79
3
9,37
6.20
1
4,50
5.2
(22,
101.
0)
R
eser
ve R
equi
rem
ent (
CBs
)1,
828.
42,
120.
92,
592.
59,
112.
911
,183
.314
,368
.0 2
0,49
5.20
1
8,08
0.56
1
1,70
8.82
1
4,47
9.39
1
8,25
0.35
2
1,74
5.43
2
8,28
0.80
3
6,38
5.80
4
4,86
1.8
51,
952.
6
In
tere
st R
ate
( In
% )
Min
imum
Dep
osit
Rate
3
34
44.
04.
0 5
.00
5.0
0 5
.00
5.0
0 5
.00
5.0
0 5
.00
7.0
0 7
.0
7.0
Le
ndin
g Ra
te
7-14
7-14
7-14
8-15
8-16
.512
.25
11.
88
11.
88
11.
88
11.
88
11.
88
12.
75
12.
75
13.
50
13.
5 1
4.3
4030
5.8
4929
5.9
6158
5.0
8077
2.6
89,2
03.0
104,
413.
5 1
35,5
53.8
7 1
89,0
80.8
1 2
33,4
04.3
2 3
00,0
26.5
8 3
93,4
21.7
3 4
90,2
30.3
5 6
31,0
92.7
0 7
84,6
21.7
0 9
63,6
99.9
1
,190
,705
.1
Gov
ernm
ent
2166
3.8
2526
6.4
3029
0.2
3416
9.2
32,7
86.5
33,0
13.1
28,
651.
65
21,
557.
41
21,
965.
52
26,
929.
74
30,
735.
25
47,
548.
36
85,
441.
85
102,
002.
80 1
09,7
99.2
1
50,8
61.6
Oth
er S
ecto
rs18
642.
024
029.
631
294.
846
603.
456
,416
.571
,400
.4 1
06,9
02.2
2 1
67,5
23.4
0 2
11,4
38.8
0 2
73,0
96.8
4 3
62,6
86.4
8 4
42,6
81.9
9 54
5,65
0.85
682,
618.
90 8
53,9
00.7
1
,039
,843
.5
3.3:
Ave
rage
ann
ual in
flatio
n ra
te (C
PI g
row
th ra
te)3
Cou
ntry
Lev
el
-
Gen
eral
infla
tion
6.1
10.6
15.8
25.3
36.4
2.8
18.1
34.1
13.5
8.1
7.7
9.7
7.4
14.6
12.6
19.9
-Fo
od in
flatio
n7.
413
.017
.534
.944
.2-5
.415
.742
.912
.65.
97.
411
.27.
213
.413
.123
.3
-N
on-fo
od in
flatio
n (c
ore
infla
tion)
4.4
7.1
13.5
12.5
23.5
18.2
21.8
22.7
14.6
10.6
88.
17.
515
.811
.915
.8
Ad
dis
Aba
ba
-
Gen
eral
infla
tion
7.2
8.4
19.2
20.8
29.4
10.1
19.4
24.8
12.6
8.5
7.6
10.3
2.3
16.5
14.6
18.8
-Fo
od in
flatio
n5.
713
.025
.432
.141
.54.
114
.830
.613
.14.
612
.216
.61.
28.
715
.025
.9
-N
on-F
ood
infla
tion
(cor
e in
flatio
n)7.
64.
614
.012
.719
.216
.023
.521
.111
.911
.44.
45.
83.
222
.614
.013
.93.
4: E
xter
nal T
rade
(In M
n.US
D)
Exp
ort o
f goo
ds &
serv
ices
1895
.821
49.5
2498
.131
27.9
3399
.5 4
,050
.33
5,3
43.1
2 5
,993
.41
5,9
78.4
7 6
,451
.62
6,0
46.5
1 6
,077
.3
6,2
57.2
7
,095
.9
7,6
94.9
7
,715
.7
I
mpo
rt of
goo
ds &
serv
ices
4,4
39.6
5
,602
.7
6,2
54.2
8
,326
.9
9,2
92.3
9
,858
.40
10,
160.
72
13,
805.
17
13,
864.
19
16,
197.
24
19,
842.
8 2
0,55
2.1
19,
714.
0 1
9,70
7.4
20,
691.
0 1
8,82
2.8
N
et tr
ade
in g
ood
s & se
rvic
es-2
,543
.8-3
,453
.2-3
,756
.1-5
,199
.0-5
,892
.8-5
,808
.4-4
,817
.6-7
,811
.8-7
,885
.7-9
,745
.6-1
3,79
6.3
-14,
474.
7-1
3,45
6.9
-12,
611.
4-1
2,99
6.1
-11,
107.
1
Cur
rent
acc
ount
bal
ance
incl
udin
g of
ficia
l tra
nsfe
rs-7
71.3
-1,4
70.9
-991
.3-1
,492
.4-1
,634
.7-1
,193
.2-2
01.9
-2,7
78.0
-2,7
80.3
-4,1
68.1
-7,4
06.8
-6,6
55.1
-6,5
43.2
-5,2
85.0
-4,9
34.2
-4,3
96.4
C
apita
l acc
ount
bal
ance
491.
961
4.3
760.
41,
031.
516
48 2
,421
.02
2,9
95.9
3 2
,283
.28
3,2
91.2
3 4
,134
.57
7,8
16.9
2 6
,554
.1
6,8
85.3
6
,184
.6
4,8
07.5
4
,147
.3
O
vera
ll bal
ance
of p
aym
ents
66.4
0934
667
3729
.98
-251
.693
9401
18.7
316
.68
1,3
84.2
0 (9
72.7
9)-6
.5-9
6.9
-521
.4-8
30.9
658.
6-2
01.6
-941
.6-1
227.
33.
5: G
over
nmen
t Fin
ance
(In
Mn
.Birr
4)
T
otal
Rev
enue
(inc
lud
ing
gran
ts)
20,1
47.0
23,2
25.0
29,3
81.0
39,7
05.0
40,4
21.9
66,
237.
44
85,
611.
00
115,
658.
50
137,
192.
00
158,
076.
52
199,
639.
11
243,
671.
56
269,
105.
94
287,
562.
14
344,
936.
50
394,
965.
83
Tot
al R
even
ue (e
xclu
din
g gr
ants
)15
,582
.019
,493
.021
,797
.029
,794
.031
,924
.0 5
3,86
1.34
6
9,12
0.00
10
2,86
3.65
12
4,07
7.00
14
6,17
2.77
18
6,61
8.69
23
0,65
7.28
25
6,62
9.04
26
9,64
8.19
31
1,31
7.43
35
4,31
2.80
o/w
Tax
-Rev
enue
1239
8.0
1412
2.0
1735
4.0
2380
1.0
2321
6.2
43,
315.
36
58,
981.
00
85,
739.
86
107,
010.
30
133,
118.
26
165,
312.
47
189,
717.
18
210,
135.
85
235,
229.
48
268,
457.
41
311,
476.
46
Tax
-Rev
enue
as %
of G
DP
11.8
10.8
10.2
9.7
7.0
11.
42
11.
45
11.
47
12.
50
12.
71
15.
09
14.
71
14.
00
12.
26
11.
55
10.
50
Tot
al E
xpen
ditu
res
2480
3.0
2932
5.0
3560
7.0
4691
5.0
4387
5.2
71,
334.
79
93,
831.
00
124,
416.
72
153,
929.
00
185,
471.
78
230,
521.
18
272,
930.
09
329,
286.
84
354,
205.
32
413,
105.
72
480,
143.
19
C
urre
nt E
xpen
ditu
res
13,2
35.0
15,2
34.0
17,1
65.0
22,7
94.0
2631
5.5
32,
012.
38
40,
535.
00
51,
445.
45
62,
745.
80
78,
086.
90
113,
375.
50
131,
902.
78
176,
703.
00
210,
470.
21
238,
156.
59
275,
967.
04
C
apita
l Exp
end
iture
s11
,343
.014
,042
.018
,398
.024
,121
.017
,559
.7 3
9,32
2.41
5
3,29
7.00
7
2,97
1.26
9
1,18
2.90
10
7,38
4.88
11
7,14
5.68
14
1,02
7.31
15
2,58
3.83
14
3,73
5.10
17
4,94
9.13
20
4,17
6.15
Equi
ty C
ontri
butio
n ( S
inki
ng F
und
)
Spec
ial P
rogr
ams
224.
050
.044
.00.
00.
00.
0 -
- -
Tot
al E
xpen
ditu
res a
s % o
f GD
P23
.522
.520
.919
.113
.218
.8 1
8.2
16.
6 1
8.1
17.
7 1
8.64
1
7.41
1
7.97
1
6.10
1
5.32
1
4.23
C
urre
nt S
urpl
us/D
efici
t6,
652.
74,
259.
04,
632.
07,
000.
05,
608.
534
,225
.1 4
5,07
6.5
64,
213.
0 7
4,44
7.0
79,
989.
6 8
6,26
3.61
11
1,76
8.78
9
2,40
2.94
7
7,09
1.92
10
6,77
9.91
11
8,99
8.78
O
vera
ll Bud
get D
efici
t ( in
clud
ing
gran
ts )
-4,6
55.0
-6,1
00.0
-622
6.0
-721
0.0
-345
3.3
-5,0
97.4
(8,2
20.2
) (8
,758
.2)
(16,
736.
0) (2
7,39
5.3)
(30,
882.
07)
(29,
258.
53)
(60,
180.
90)
(66,
643.
18)
(68,
169.
22)
(85,
177.
36)
Defi
cit a
s % o
f GD
P-4
.4-4
.7-3
.7-2
.9-1
.0-1
.3-1
.6-1
.2-2
.0-2
.6 (2
.50)
(1.8
7) (3
.28)
(3.0
3) (2
.53)
(2.5
2)
O
vera
ll Bud
get D
efici
t ( e
xclu
din
g gr
ants
)-9
,220
.0-9
,832
.0-1
3,81
0.0
-17,
121.
0-1
1951
.1-1
7473
.5 (2
4,71
1.5)
(21,
553.
1) (2
9,85
1.0)
(39,
299.
0) (4
3,90
2.49
) (4
2,27
2.81
) (7
2,65
7.79
) (8
4,55
7.13
) (1
01,7
88.2
9) (1
25,8
30.4
0)
D
efici
t as %
of G
DP
-8.7
-7.5
-8.1
-7.0
-3.6
-4.6
-4.8
-2.9
-3.5
-3.8
(3.5
5) (2
.70)
(3.9
6) (3
.84)
(3.7
8) (3
.73)
3.6:
Exc
hang
e Ra
te (B
irr/
USD)
In
ter-B
ank
Fore
x M
arke
t Rat
e5
*
Per
iod
wei
ghte
d A
vera
ge8.
652
8.68
18.
794
9.24
410
.420
512
.890
916
.117
817
.253
618
.194
719
.074
8 2
0.09
56
21.
1059
2
2.41
37
26.
1082
2
8.05
43
31.
3427
*
End
per
iod
8.66
08.
.69
9.03
09.
610
11.3
009
13.5
321
16.9
081
17.7
305
18.6
426
19.5
771
20.
5659
2
1.80
04
23.
1081
2
7.26
21
28.
9109
3
4.98
22
iv | Second Quarter 2020/21
National Bank of Ethiopia Quarterly BulletinC
ontin
ued…
.
Indi
cato
rs20
04/0
520
05/0
620
06/0
720
07/0
820
08/0
920
09/1
020
10/1
120
11/1
220
12/1
320
13/1
420
14/1
5 2
015/
16 2
016/
1720
17/1
8 2
018/
19 2
019/
20
(199
7)(1
998)
(199
9)(2
000)
(200
1)(2
002)
(200
3)(2
004)
(200
5)(2
006)
(200
7)(2
008)
(200
9)(2
010)
(201
1)(2
012)
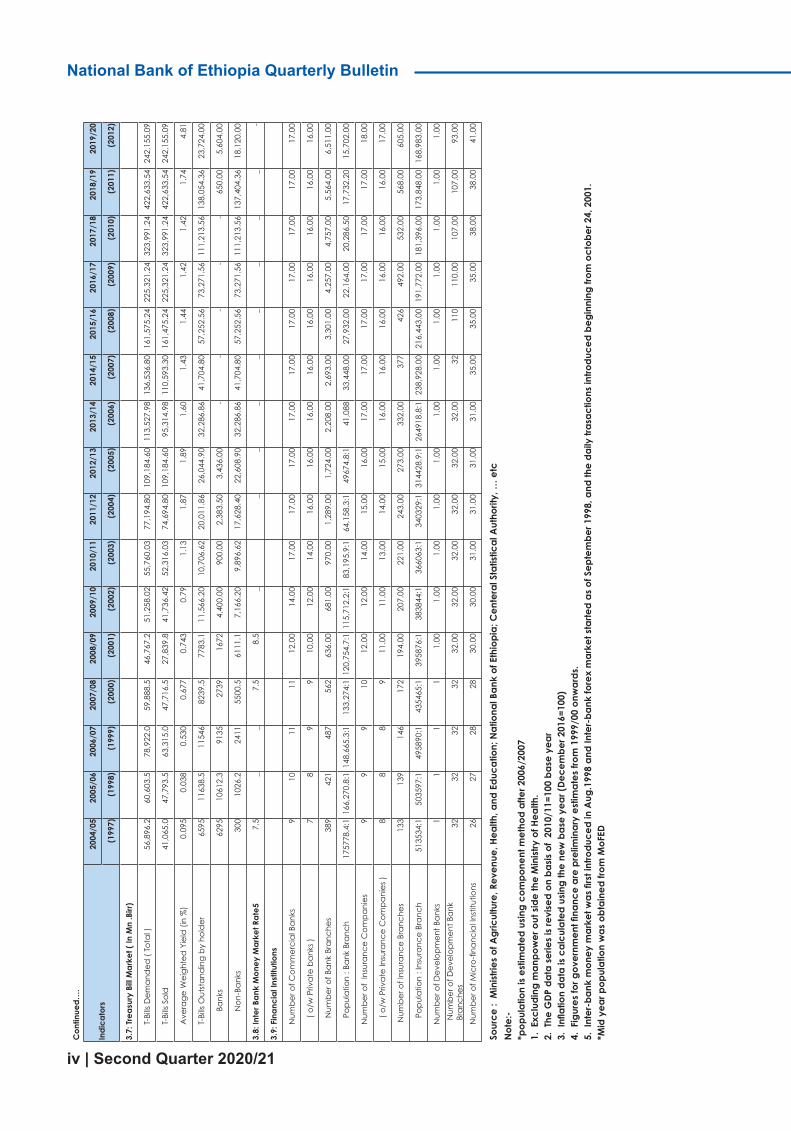
3.7:
Trea
sury
Bill
Mar
ket (
In M
n .B
irr)
T-B
ills D
eman
ded
( To
tal )
56,8
96.2
60,6
03.5
78,9
22.0
59,8
88.5
46,7
67.2
51,
258.
02
55,
760.
03
77,
194.
80
109,
184.
60
113,
527.
98
136,
536.
80
161,
575.
24
225,
321.
24
323,
991.
24
422,
633.
54
242,
155.
09
T-B
ills S
old
41,0
65.0
47,7
93.5
63,3
15.0
47,7
16.5
27,8
39.8
41,
736.
42
52,
316.
03
74,
694.
80
109,
184.
60
95,
314.
98
110,
593.
30
161,
475.
24
225,
321.
24
323,
991.
24
422,
633.
54
242,
155.
09
Ave
rage
Wei
ghte
d Y
ield
(in
%)
0.09
50.
038
0.53
00.
677
0.74
3 0
.79
1.1
3 1
.87
1.8
9 1
.60
1.4
3 1
.44
1.4
2 1
.42
1.7
4 4
.81
T-B
ills O
utst
and
ing
by h
old
er65
9511
638.
511
546
8239
.577
83.1
11,
566.
20
10,
706.
62
20,
011.
86
26,
044.
90
32,
286.
86
41,
704.
80
57,
252.
56
73,
271.
56
111,
213.
56
138,
054.
36
23,
724.
00
Ban
ks62
9510
612.
391
3527
3916
72 4
,400
.00
900
.00
2,3
83.5
0 3
,436
.00
- -
- -
- 6
50.0
0 5
,604
.00
Non
-Ban
ks30
010
26.2
2411
5500
.561
11.1
7,1
66.2
0 9
,896
.62
17,
628.
40
22,
608.
90
32,
286.
86
41,
704.
80
57,
252.
56
73,
271.
56
111,
213.
56
137,
404.
36
18,
120.
00
3.8:
Inte
r Ban
k M
oney
Mar
ket R
ate5
7.5
_
_
7.5
8.5
_
_
_
_
_
_
_
_
_
-
3.9:
Fin
anci
al In
stitu
tions
Num
ber o
f Com
mer
cial
Ban
ks9
1011
11 1
2.00
1
4.00
1
7.00
1
7.00
1
7.00
1
7.00
1
7.00
1
7.00
1
7.00
1
7.00
1
7.00
1
7.00
(
o/w
Priv
ate
bank
s )7
89
9 1
0.00
1
2.00
1
4.00
1
6.00
1
6.00
1
6.00
1
6.00
1
6.00
1
6.00
1
6.00
1
6.00
1
6.00
N
umbe
r of B
ank
Bran
ches
389
421
487
562
636
.00
681
.00
970
.00
1,2
89.0
0 1
,724
.00
2,2
08.0
0 2
,693
.00
3,3
01.0
0 4
,257
.00
4,7
57.0
0 5
,564
.00
6,5
11.0
0
P
opul
atio
n : B
ank
Bran
ch17
5778
.4:1
166,
270.
8:1
148,
665.
3:1
133,
274:
1 1
20,7
54.7
:1 1
15,7
12.2
:1
83,
195.
9:1
64,
158.
3:1
496
74.8
:1
41,
088
33,
448.
00
27,
932.
00
22,
164.
00
20,
286.
50
17,
732.
20
15,
702.
00
Num
ber o
f In
sura
nce
Com
pani
es9
99
10 1
2.00
1
2.00
1
4.00
1
5.00
1
6.00
1
7.00
1
7.00
1
7.00
1
7.00
1
7.00
1
7.00
1
8.00
(
o/w
Priv
ate
Insu
ranc
e C
ompa
nies
)8
88
9 1
1.00
1
1.00
1
3.00
1
4.00
1
5.00
1
6.00
1
6.00
1
6.00
1
6.00
1
6.00
1
6.00
1
7.00
Num
ber o
f Ins
uran
ce B
ranc
hes
133
139
146
172
194
.00
207
.00
221
.00
243
.00
273
.00
332
.00
377
4
26
492
.00
532
.00
568
.00
605
.00
P
opul
atio
n : I
nsur
ance
Bra
nch
5135
34:1
5035
97:1
4958
90:1
4354
65:1
395
876:
1 3
8384
4:1
366
063:
1
340
329:
1 3
1442
8.9:
1 2
6491
8.8:
1 2
38,9
28.0
0 2
16,4
43.0
0 1
91,7
72.0
0 1
81,3
96.0
0 1
73,8
48.0
0 1
68,9
83.0
0
Num
ber o
f Dev
elop
men
t Ban
ks1
11
1 1
.00
1.0
0 1
.00
1.0
0 1
.00
1.0
0 1
.00
1.0
0 1
.00
1.0
0 1
.00
1.0
0
Num
ber o
f Dev
elop
men
t Ban
k
Bran
ches
3232
3232
32.
00
32.
00
32.
00
32.
00
32.
00
32.
00
32
110
1
10.0
0 1
07.0
0 1
07.0
0 9
3.00
Num
ber o
f Mic
ro-fi
nanc
ial I
nstit
utio
ns26
2728
28 3
0.00
3
0.00
3
1.00
3
1.00
3
1.00
3
1.00
3
5.00
3
5.00
3
5.00
3
8.00
3
8.00
4
1.00
Sour
ce :
Min
istrie
s of
Agr
icul
ture
, Rev
enue
, Hea
lth, a
nd E
duca
tion;
Nat
iona
l Ban
k of
Eth
iopi
a; C
ente
ral S
tatis
tical
Aut
horit
y, …
etc
Not
e:-
*p
opul
atio
n is
estim
ated
usin
g co
mpo
nent
met
hod
afte
r 200
6/20
07
1.
Exc
ludi
ng m
anpo
wer
out
sid
e th
e M
inist
ry o
f Hea
lth.
2. T
he G
DP d
ata
serie
s is
revi
sed
on b
asis
of 2
010/
11=1
00 b
ase
year
3.
Infl
atio
n da
ta is
cal
cula
ted
usin
g th
e ne
w b
ase
year
(Dec
embe
r 201
6=10
0)
4. F
igur
es fo
r gov
ernm
ent fi
nanc
e ar
e pr
elim
inar
y es
timat
es fr
om 1
999/
00 o
nwar
ds.
5. I
nter
-ban
k m
oney
mar
ket w
as fi
rst i
ntro
duce
d in
Aug
.199
8 an
d In
ter-
bank
fore
x m
arke
t sta
rted
as o
f Sep
tem
ber 1
998,
and
the
daily
tras
actio
ns in
trodu
ced
begi
nnin
g fro
m o
ctob
er 2
4, 2
001.
*Mid
yea
r pop
ulat
ion
was
obt
aine
d fro
m M
oFED

| 1
I. OVERVIEW
1.1. International Economic Developments
According to the European Central Bank’s monthly bulletin of 7/2020, the global economy continued its recovery during the second quarter of 2020/21. The global composite output PMI (excluding the euro area) improved for the second time in a row to 54.1 compared to 51.9 in the previous quarter.
In the United States, economic growth is set to lose momentum slightly following a sharp recovery in the first quarter of 2020/21. Subdued consumer confidence, combined with rising number of daily new COVID-19 infections pose downside risks to economic activity.
In the United Kingdom, the monthly GDP data and survey signal a decline in growth to negative territory in the second quarter of 2020/21. The rebound in economic activity remains weak by the end of the quarter. Despite the agreement between EU and the UK diminishes the uncertainity surrounding the Brexit negotiations, the worsening pandemic situation and deteriorating labor market conditions continue to weigh on consumer confidence and demand.
Japan is experiencing a stalled economic recovery during the second quarter of 2020/21, as the third wave of COVID-19 prompted additional lockdown measures. While Consumption remained relatively robust, growth in industrial production weakened in November.
In China, real GDP growth during the second quarter of 2020/21 confirmed the continuation of robust recovery and broadening of the recovery momentum from investment towards consumption.
Global inflation remained stable in November. Annual consumer price inflation in Member countries of the Organization for Economic Co-operation and Development (OECD) remained unchanged at 1.2 percent in November. Commodity prices have continued to show broad-based increases with oil and non-energy prices increasing by more than 10 percent during the month of December 2020 compared to previous month. The upward pressure in prices is driven by a surge in global demand following the recovery from the COVID-19 shock.
Over all, the global economy during the second quarter of 2020/21 registered a continuous rebound. Likewise, global inflation remained stable, despite the increase in oil and non- energy prices.

2 | Second Quarter 2020/21
National Bank of Ethiopia Quarterly Bulletin
1.2. Macroeconomic Developments in Ethiopia
1.2.1. Inflation
In the second quarter of 2020/21, headline inflation has slowed down to 1.1 percent from 5.1 percent in the preceding quarter on account of 6.4 percentage point decline in food & non-alcoholic beverages and 0.9 percentage point decrease in non-food inflation.
Likewise, year-on-year basis, headline inflation went down by 1.3 percentage point due to 0.4 percentage point decrease in food & non-alcoholic beverages inflation and 2.3 percentage point drop in non-food inflation. Consequently, food & non-alcoholic beverages and non-food inflations contributed 0.4 and 0.7 percent, respectively, to the headline inflation registered in the review quarter.
1.2.2. Monetary Developments
Broad money supply (M2) stood at Birr 1.2 trillion, at the end of second quarter of 2020/21 showing a 23.9 percent growth over the corresponding quarter of last fiscal year owing to 114.9 percent growth of domestic credit offsetting the 8.9 percent contraction of external asset (net).
Likewise, reserve money at Birr 258.7 billion, depicted a 31.3 percent annual expansion while excess reserve of commercial banks increased 39.9 percent during the same period.
1.2.3. Interest rate
Average savings deposit rate stood at 8 percent and weighted average time deposit rate decreased by 0.27 percent while average lending rate was 14.25 percent year-on-year basis. Weighted average yield on T-bills has increased by 6.25 percentage point over last year same quarter. Yet, considering the 18.2 percent headline inflation in December 2020, real interest rates on deposit, lending and T-bill yields remained negative.
1.2.4. Financial Sector Developments
a) Banks
The number of banks operating in Ethiopia reached 19 of which 17 were private and 2 state owned. These banks have opened 269 new bank branches during the review period thereby raising the total number of bank branches to 6,897. As a result, population to bank branch ratio stood at 14,619.31. About 34.3 percent of the total bank branches were located in Addis Ababa. Of the total bank branches, the share of state owned banks was 28.1 percent and that of private banks 71.9 percent.
Total capital of the banking system amounted to Birr 120.8 billion, of which state owned banks accounted for 48.1 percent and private banks 51.9 percent. The share of Commercial Bank of Ethiopia, the biggest state owned bank, in total capital of the
1 Total population is 100,829,000 as CSA Estimation for 2020

| 3
banking system was 41.7 percent.
During the review quarter, Birr 100.4 billion was disbursed in fresh loans, indicating a 51.5 percent annual increase. Of the total new loans disbursed, the share of state owned banks was 40.5 percent and that of private banks was 59.5 percent (Table 4.12).
Of the total new loans, housing and construction took Birr 23.5 billion (23.4 percent) followed by domestic trade (Birr 17.5 billion or 17.4 percent), international trade (Birr 16.8 billion or 16.7 percent), industry (Birr 15.1 billion or 15 percent). The share of Mines, Power & Water Resource was Birr 10.0 billion or 9.9 percent, while that of transport and communication was Birr 6.0 billion or 5.4 percent), and personal loans Birr 4.5 billion or 4.5 percent with the remaining balance being taken up by other sectors.
During the review period, the banking system collected loans amounting to Birr 39.6 billion, depicting 2.4 percent annual increase. Of the total loans, 60.6 percent was collected by private banks and 39.4 percent by state owned banks.
Total outstanding credit of the banking system (including corporate bond) reached Birr 1.2 trillion, about 28.6 percent higher than last year same quarter. Out of the total outstanding credit, the share of private banks was 37.4 percent and that of state owned banks 62.6 percent.
b) Insurance Sector
The number of insurance companies stood at 18, of which 17 were private and 1 state owned. Their branches increased to 622 from 585 a year ago, of which, about 54.2 percent were located in Addis Ababa. Likewise, the total capital of insurance companies reached Birr 10.2 billion, with private insurance companies accounting for 71.4 percent.
c) Microfinance Institutions
The 39 micro-finance institutions (MFIs) operating in the country have mobilized Birr 48.4 billion in saving deposit which grew 16.2 percent over last year same period. Their total outstanding credit also increased by 5.3 percent to Birr 64.9 billion while their total asset expanded 13.3 percent to Birr 97.1 billion as of December, 2020.
1.2.5. External Sector and Foreign Exchange Developments
a) External Sector Development
In the second quarter of 2020/21, merchandise export earnings amounted to USD 722.3 million, showing 28.0 percent annual growth due to higher export receipts from gold (1,693.8 percent), oil seeds (79.4 percent), flower (21.0 percent), chat (14.5 percent), meat & meat products (1.7 percent), live-animals (1.8 percent), electricity (25.4 percent) and other export products (38.1 percent).

4 | Second Quarter 2020/21
National Bank of Ethiopia Quarterly Bulletin
In contrast, merchandise import bill at USD 3.3 billion, depicted 13.0 percent annual decline as import values of capital goods, fuel, semi-finished goods, raw materials and miscellaneous goods dropped. Average price of brent crude oil, which is used as a benchmark for international oil price, decreased by 30 percent to USD 44.3 per barrel vis-à-vis USD 63.4 a year ago. Similarly, capital goods import decreased by 26.4 percent, semi-finished goods by 27.2 percent and raw materials by 9.3 percent.
During the review period, current account receipts amounted to USD 4.1 billion, 6.6 percent higher than a year earlier on account of a rise in receipts from goods (28.0 percent), and public transfers (28.4 percent), despite the decline in service export receipts (0.8 percent) and private transfers (1.7 percent). Meanwhile, total current account payments decreased by 9.8 percent relative to the same quarter of last year due to the drop in goods payment (13.0 percent), service payment (0.4 percent), private transfers (53.8 percent) and public transfers (10.6 percent).
Therefore, current account balance (including official transfers) registered USD 592.6 million deficit compared to USD 1.4 billion deficit a year ago. On the other hand, capital account balance registered USD 880.5 million in surplus, which was 40.1 percent lower than that of a year earlier. As a result, the overall balance of payments recorded USD 129.3 million deficit compared to USD 205.6 million deficit a year earlier.
b) Exchange Rate Development
Weighted average official exchange rate of Birr showed a 25.3 percent annual depreciation and reached Birr 37.8663/USD during the second quarter of 2020/21. Similarly, real effective exchange rate index (REERI) of the Birr depreciated by 32.8 percent on annual basis due to the weakening of the nominal effective exchanged rates of the Birr against major trading partner currencies. Likewise, the nominal effective exchange rate index (NEERI) depreciated 14.0 percent over last year same quarter.
1.2.6. Federal Government Fiscal Operations
Total revenue and grants collected by the Federal government during the second quarter of 2020/21 showed a 28.5 percent annual growth to Birr 93.1 billion while its total expenditure increased by 59.2 percent to Birr 126.2 billion. As a result, the overall fiscal deficit (including grants) was Birr 32.9 billion during the review quarter.
1.2.7. Investment
During the second quarter of 2020/21, five investment projects having investment capital of Birr 161.5 million became operational. Compared to last year same quarter, the number of investment projects slowed down by 50 percent while investment capital was increased by 62.1 percent.

| 5
II. ENERGY PRODUCTION AND PROCESSING2.1. Import of Petroleum Products
During the second quarter of 2020/21, the volume of petroleum products imported was about 937.9 thousand metric tons; showing 7.5 percent annual decrease due to lower volume of imports of jet fuel (49.2 percent) and oil gas (2.7 percent) despite of the increase in import of regular gasoline (32.3 percent) and fuel oil (17.9 percent). In terms of
the preceding quarter, however, the amount of petroleum products imported rose 6.7 percent.
Of the total petroleum imports, gas oil accounted for 67.2 percent, followed by regular gasoline (18.9 percent), jet fuel (11.5 percent), and fuel oil (2.4 percent) (Table 2.1).
Table 2.1: Volume of Petroleum Products Imported
(In Metric Ton)
Petroleum Products
2019/20 2020/21 Percentage Change
Qtr. II Qtr. I Qtr. II
AShare (In %)
BShare
(In %)C
Share (In %)
C/A C/B
Regular Gasoline (MGR) 133,745.93
13.2145,183.01 16.5 176,894.50 18.9 32.3 21.8
Jet Fuel 212,529.51 21.0 99,180.54 11.3 107,969.29 11.5 -49.2 8.9
Fuel Oil 19,007.88 1.9 20,495.65 2.3 22,414.50 2.4 17.9 9.4
Gas Oil (ADO) 648,408.02 64.0 613,828.06 69.9 630,617.51 67.2 -2.7 2.7
Total 1,013,691.33 100 878,687.25 100 937,895.80 100.0 -7.5 6.7
Source: Ethiopian Petroleum Enterprise

6 | Second Quarter 2020/21
National Bank of Ethiopia Quarterly Bulletin
Fig.2.1: Trends in the Volume of Petroleum Products Imported
Source: Ethiopian Petroleum Enterprise
Meanwhile, the total value of petroleum products imported during the period under review reached Birr 14.7 billion, showed a 20.8 percent decline compared to a year ago on account of reduction in the value and volume of jet fuel and gas oil, except for regular gasoline and fuel oil (Table 2.2).

| 7
Table 2.2: Value of Petroleum Products Imported
(In ‘000Birr)
Petroleum Products
2019/20 2020/21 Percentage ChangeQtr. II Qtr. I Qtr. II
A Share (In %) B Share
(In %) C Share (In %) C/A C/B
Regular Gas-oline (MGR) 2,624,239.4 14.1 2,391,824.2 18.7 3,191,180.6 21.7 21.6 33.4
Jet Fuel 4,054,106.7 21.8 1,357,688.8 10.6 1,687,041.3 11.4 -58.4 24.3
Fuel Oil 215,528.2 1.2 267,938.4 2.1 329,665.4 2.2 53.0 23.0
Gas Oil (ADO) 11,722,479.5 63.0 8,782,556.0 68.6 9,528,043.2 64.7 -18.7 8.5
Total 18,616,353.8 100 12,800,007.3 100 14,735,930.5 100 -20.8 15.1
Source: Ethiopian Petroleum Enterprise
Fig.2.2: Trends in the Value of Petroleum Products Imported
Source: Ethiopian Petroleum Enterprise
The average FOB price of petroleum products depicted 39 percent annual decline due to the drop in FOB price of all types of petroleum products except fuel oil. However, average FOB price of petroleum products went up by 5.7 percent Vis-a-Vis the preceding quarter
as a result of 11.2 percent increase in jet fuel followed by fuel oil (10.1 percent), gas oil (2 percent) and regular gasoline (1.8 percent) (Table 2.3).

8 | Second Quarter 2020/21
National Bank of Ethiopia Quarterly Bulletin
Table 2.3: FOB Price of Petroleum Products Imported
(In USD/ Metric Ton)
Petroleum Products2019/20 2020/21
Percentage ChangeQtr. II Qtr. I Qtr. II
A B C C/A C/B
(Regular Gasoline (MGR 867.4 388.2 395.0 -54.5 1.8
Jet Fuel 583.3 322.9 359.0 -38.5 11.2Fuel Oil 251.8 246.4 271.3 7.8 10.1
(Gas Oil (ADO 554.9 344.8 351.8 -36.6 2.0Average 564.3 325.6 344.3 -39.0 5.7
Brent Crude Oil (USD/(Barrel 63.4 42.7 44.3 -30.2 3.7
Source: Ethiopian Petroleum Enterprise
Fig.2.3: Trends in the FOB Price of Imported Petroleum Products
Source: Ethiopian Petroleum Enterprise
The average price of Brent crude oil, which is used as a benchmark for international oil price, dropped 30.2 percent to USD 44.3 per barrel compared with USD 63.4 a year ago although it increased by 3.7 percent relative to the preceding quarter.
The average retail price of fuel in Addis Ababa during the review period fall in to Birr 23.57 per litter from Birr 23.70 per litter a year ago depicting a slight decline of 0.6 percent as result of 6.9 percent drop in jet fuel price (Table 2.4).

| 9
Table2.4: Addis Ababa Average Retail Prices of Fuel (Birr/Liter)
Petroleum Products
2019/20 2020/21Percentage ChangeQtr. II Qtr. I Qtr. II
A B C C/A C/B
(Regular Gasoline (MGR 21.53 21.53 21.87 1.6 1.6
Fuel Oil 32.91 32.91 33.27 1.1 1.1
(Gas Oil (ADO 18.75 18.75 18.98 1.2 1.2
Kerosene 18.75 18.75 18.98 1.2 1.2
Jet fuel 26.58 25.87 24.74 -6.9 -4.4
Average 23.70 23.56 23.57 -0.6 0.0
Source: Ministry of Trade
Fig.2.4: Trends of Addis Ababa Average Retail Prices
Source: Ministry of Trade

10 | Second Quarter 2020/21
National Bank of Ethiopia Quarterly Bulletin
2.2. Electric Power Generation
Total electric power generated during the second quarter was about 3.8 billion KWH showing 1.8 percent annual and 6.9 percent quarterly (Table 2.5) decrease
due to lower electric production from hydropower and biomass sources (table 2.5).
Table 2.5: Electricity Generation by Sources (In ‘000 of K.W.H)
Power Source
2019/20 2020/21 Percentage ChangeQtr. II Qtr. I Qtr. II
A Share (In %) B
Share (In %)
C Share (In %) C/A C/B
Hydropower 3,591,542.1 93.4 3,918,091.3 96.7 3,554,618.5 94.2 -1.0 -9.3
Thermal Power - - - - - - - -
Geothermal - - - - - - - -
Wind 203,219.8 5.3 113,199.8 2.8 197,852.0 5.2 -2.6 74.8
Biomass 48,522.0 1.3 22,287.0 0.5 21,217.5 0.6 -56.3 -4.8
Total 3,843,283.8 100 4,053,578.2 100 3,773,688.0 100 -1.8 -6.9
Source: Ethiopian Electric Power
Of the total energy generated, 94.2 percent was from hydropower, 5.2 percent from wind and 0.6 percent from biomass (Table 2.5).
Virtually all the power was generated through the interconnected systems (ICS) 2(Table 2.6).
2 The generated power from different power stations stored in substations before distribution

| 11
Table 2.6: Generation of electricity power in the interconnected system (ICS) and self-contained system (SCS)
System of Pow-er supply
2019/20 2020/21 Percentage ShareQtr. II Qtr. I Qtr. II
A Share (in %) B
Share
(in %)C
Share
(In %)C/A C/B
ICSHydro power 3,591,542.1 93.4 3,918,091.3 96.7 3,554,618.5 94.2 -1.0 -9.3Thermal Power - - - - - 0.0 0 0Gethermal - - - - - 0.0 0 0Wind 203,219.8 5.3 113,199.8 2.8 197,852.0 5.2 -2.6 74.8Biomass 48,522.0 1.3 22,287.0 0.5 21,217.5 0.6 -56.3 -4.8Sub-Total 3,843,283.8 100 4,053,578.2 100 3,773,688.0 100 -1.8 -6.9SCS
Hydro power - - - - - - -Thermal Power - - - - - - - -Geothermal - - - - - - - -Wind - - - - - - - -Sub-Total - - - - - - - -Grand Total 3,843,283.8 100 4,053,578.2 100 3,773,688.0 100 -1.8 -6.9
Source: Ethiopian Electric Power
Fig.2.5: Volume of Electricity Production by Type
010000002000000300000040000005000000
Thou
sand
kw
h
Quarter
Hydropower Thermal Power Geo- thermal Wind Biomass
Source: Ethiopian Electric Power

12 | Second Quarter 2020/21
National Bank of Ethiopia Quarterly Bulletin
III. QUARTERLY PRICE DEVELOPMENTS
3.1 Developments in National CPI
Headline inflation decreased to 1.1 percent during the second quarter of 2020/21 from 5.1 percent a quarter earlier and 2.4 percent last year same quarter. The slowdown in quarterly headline inflation was attributed to 6.4 percentage point decrease in food & non-alcoholic beverages and 0.9 percentage point drop in non-food inflation. Similarly, headline inflation scaled down annually by 1.3 percentage points as a result of a 2.3 percentage point decrease in non-food inflation and 0.4 percentage point decline in food & non-alcoholic beverages inflation. Food & non-alcoholic beverages inflation and non-food inflation made 0.4 and 0.7 percent, respective contribution, to the headline inflation registered in the review quarter (Table 3.1 and Fig 3.1).
Food & non-alcoholic beverages inflation decreased to 0.8 percent from 7.2 percent in the previous quarter, owing to lower inflation in the prices of vegetables (17.4 percentage point), fish and sea food (9.5 percentage point), food products n.e.c (6.7 percentage point), bread & cereals (4.5 percentage point) and non-alcoholic beverages (4.4 percentage point). On the other hand, inflation related to fruits, sugar jam, honey, chocolate, oils & fats, milk, cheese & egg and meat tended to
slowdown (Table 3.2).
Likewise, the 1.5 percent decline in non-food inflation from 2.4 percent a quarter earlier and 3.8 percent last year same quarter was attributed mainly to lower inflation for transport, furnishings, household equipment & routine maintenance of houses and housing, water, electricity, gas & fuel (Table 3.3).

| 13
Table 3.1: Quarterly National General Consumer Prices (%) (Dec2016=100)
Items
Weights in %
2019/202020/21 Change in
%age Points Contributions in (%) to
QII QI QII
A B C C-A C-B
Headline Inflation
Change over QII-2019/20
Headline Inflation
Change Over QI-2020/21
QII-2020/21
Headline Inflation
Absolute Rela-tive
Headline 100 2.4 5.1 1.1 -1.3 -4.0 -1.3 -4.0 1.1 100Food & Non-al-coholic beverage
54 1.2 7.2 0.8 -0.4 -6.4 -0.2 -3.5 0.4 38.5
Non-food 46 3.8 2.4 1.5 -2.3 -0.9 -1.1 -0.4 0.7 61.5
Source: CSA and NBE Staff Computation
Table 3.2: Quarterly National Food & non-alcoholic beverages CPI Inflation (Dec2016=100)
Items Weights
2019/20 2020/21 Change in %age points Contribution to
QII QI QII
A B C C-A C-B
Headline Inflation Change
over QII-2019/20(%)
Headline In-flation Change
over QI-2020/21
(%)Food & Non-alcoholic beverages Inflation 0.54 1.2 7.2 0.8 -0.4 -6.4 -0.2 -3.4
Bread & Cereals 0.17 3.9 7.6 3.2 -0.8 -4.5 -0.1 -0.8Meat 0.04 2.4 1.6 1.9 -0.6 0.2 0.0 0.0Fish and sea food 0.00 1.9 8.2 -1.3 -3.2 -9.5 0.0 0.0Milk, cheese & egg 0.03 -0.4 2.8 5.6 6.1 2.9 0.2 0.1Oils & Fats 0.04 -1.3 4.3 9.8 11.0 5.4 0.5 0.2Fruit 0.00 8.5 -5.9 3.8 -4.7 9.7 0.0 0.0Vegetables 0.12 -2.3 10.0 -7.3 -5.0 -17.4 -0.6 -2.1Sugar jam, honey, choc-olate 0.01 -2.3 -0.9 7.5 9.8 8.4 0.1 0.1
Food products n.e.c 0.06 0.5 7.1 0.3 -0.1 -6.7 0.0 -0.4Non-alcoholic bever-ages 0.05 2.8 9.8 5.5 2.6 -4.4 0.1 -0.2
Source: CSA and NBE Staff Computation

14 | Second Quarter 2020/21
National Bank of Ethiopia Quarterly Bulletin
Table 3.3: Quarterly National Non-food CPI Inflations (Dec2016=100)
Items Weights
2019/20 2019/21Change in %age
points Contribution toQII QI QII
A B C C-A C-B
Headline Inflation
Change over QIV-2018/19
Headline In-flation Change
over QIII-2019/20(%)
Non-Food Inflation 0.46 3.8 2.4 1.5 -2.3 -0.9 -1.1 -0.4Alcoholic Beverages and to-bacco 0.05 3.6 -2.8 6.5 2.9 9.3 0.1 0.5
Clothing and Footwear 0.06 1.4 1.9 4.1 2.7 2.2 0.2 0.1
Housing, Water, Electricity, Gas and other Fuel 0.17 6.2 2.2 1.5 -4.7 -0.7 -0.8 -0.1
Furnishings, Household Equipment and Routine main-tenance of houses
0.05 0.9 1.5 0.7 -0.2 -0.8 0.0 0.0
Health 0.01 5.3 2.8 5.8 0.5 3.0 0.0 0.0
Transport 0.02 2.5 13.3 -21.6 -24.2 -35.0 -0.6 -0.9
Communication 0.02 -2.7 -1.9 -1.7 1.0 0.2 0.0 0.0
Recreation and culture 0.00 8.9 -0.1 9.7 0.9 9.8 0.0 0.0
Education 0.00 1.1 -3.9 11.7 10.6 15.6 0.0 0.0
Restaurant & hotel 0.05 4.2 3.7 7.0 2.8 3.2 0.1 0.2
Miscellaneous Goods 0.03 3.1 3.9 3.8 0.7 -0.1 0.0 0.0
Source: CSA and NBE Staff Computation
3.2. Developments in Regional CPI
The regional average headline inflation in the second quarter of 2020/21 decreased to 0.7 percent from 6.7 percent in the preceding quarter and 2.2 percent a year ago.
Tigray, Somali, SNNP, Benshangul Gumuz and Oromia had higher headline inflation than the regional average.
The highest headline inflation (6.7 percent) was seen in Tigray and the lowest (-5.1 percent) in Dire Dawa. Hence, the margin between the highest and the lowest headline inflation was 11.8 percentage points signifying a 2.8 percent quarterly deviation compared with 2.6 percent last year same quarter (Table 3.4)

| 15
The regional average food & non-alcoholic beverage inflation fell to 0.4 percent from 8.6 percent in the preceding quarter and 1.4 percent last year same quarter. Food & non-alcoholic beverages inflation in Tigray, Afar, SNNP, Harari, Oromia and Somali was higher than the regional average. The highest food & non-alcoholic beverages inflation was recorded in Tigray (4.8 percent) and the lowest in Dire Dawa (-5.8 percent), showing a 10.6 percentage point margin. The variation in food & non-alcoholic beverages inflation, measured by standard deviation, was 3.0 percent compared to 3.2 percent a year ago (Table 3.4).
Likewise, the regional average non-food inflation has decreased to 1.0 percent from 4.6 percent in the previous quarter and 3.2 percent last year same quarter. Tigray, Somali, Benshangul gumuz, Amhara, and Gambella regional states recorded higher non-food inflation than the regional average. Non-food inflation was the highest in Tigray (8.7 percent) and the lowest in Afar (-6.3 percent), revealing 15.0 percentage point margin. The variation in non-food inflation, measured by the standard deviation, was 4.1 percent in contrast to 4.2 percent in the previous quarter (Table 3.4).

16 | Second Quarter 2020/21
National Bank of Ethiopia Quarterly BulletinTa
ble
3.4:
Qua
rterly
Reg
iona
l Gen
eral
, Foo
d &
non-
alco
holic
bev
erag
es a
nd N
on-fo
od In
flatio
n
Reg
ions
2019
/20
2020
/21
Ann
ual C
hang
e Q
uart
erly
Cha
nge
QII
QI
QII
AB
CC
-AC
-B
Gen
eral
Food
&
Non
-al-
coho
lic
beve
rage
sN
on-f
ood
Gen
eral
Food
&
Non
-al-
coho
lic
beve
rage
sN
on-
food
Gen
eral
Food
&
Non
-al-
coho
lic
beve
rage
sN
on-
food
Gen
eral
Food
&
Non
-al-
coho
lic
beve
r-ag
esN
on-
food
Gen
eral
Food
&
Non
-al-
coho
lic
beve
r-ag
esN
on-
food
SNN
P5.
33.
77.
56.
07.
14.
32.
03.
10.
4-3
.3-0
.6-7
.0-4
.0-4
.0-3
.9
Har
ari
2.5
4.0
1.3
10.1
9.7
10.5
0.7
1.4
0.2
-1.8
-2.6
-1.2
-9.4
-8.3
-10.
3
Oro
mia
1.9
1.7
2.1
5.0
6.9
2.3
0.8
0.9
0.5
-1.1
-0.8
-1.6
-4.2
-6.0
-1.8
Tigr
ay4.
02.
16.
17.
59.
43.
96.
74.
88.
72.
72.
82.
6-0
.8-4
.64.
8
Gam
bella
0.6
-1.1
2.8
4.8
6.0
3.1
0.0
-0.8
1.1
-0.7
0.3
-1.8
-4.8
-6.8
-2.0
Add
is A
baba
2.5
1.0
3.8
4.6
10.7
-0.1
-0.3
-1.7
0.8
-2.9
-2.7
-3.0
-4.9
-12.
40.
9
Dire
Daw
a5.
24.
55.
910
.615
.55.
9-5
.1-5
.8-4
.4-1
0.3
-10.
2-1
0.4
-15.
7-2
1.3
-10.
3
Ben
shan
gul.
Gum
uz1.
51.
31.
611
.716
.66.
61.
1-0
.93.
5-0
.4-2
.31.
9-1
0.6
-17.
5-3
.1So
mal
i3.
54.
72.
02.
23.
01.
22.
70.
75.
1-0
.8-4
.03.
10.
5-2
.33.
9A
far
-4.0
-6.4
-1.1
7.6
3.0
13.2
-0.9
4.1
-6.3
3.1
10.6
-5.1
-8.5
1.1
-19.
5A
mha
ra1.
4-0
.33.
33.
86.
70.
10.
1-1
.01.
6-1
.3-0
.8-1
.7-3
.7-7
.71.
5R
egio
ns A
vera
ge2.
21.
43.
26.
78.
64.
60.
70.
41.
0
Stan
dard
dev
iatio
n2.
63.
22.
53.
14.
44.
22.
83.
04.
1C
oeffi
cien
t of v
ari-
atio
n1.
22.
30.
80.
50.
50.
94.
06.
74.
0
Sou
rce:
CSA
and
NBE
Sta
ff C
ompu
tatio
n

| 17
4. MONETARY DEVELOPMENTS
4.1. Money Supply and Credit
Broad money supply (M2) stood at Birr 1.2 trillion, showing a 23.9 percent annual growth owing to 25.1 percent surge
in domestic credit which offset 111.4 percent contraction in external asset (net).
Table 4.1: Factors Influencing Broad Money(In Millions of Birr)
Particulars
Qtr. II Qtr. I Qtr. II Percentage Change
Contributions of Each Component to Broad Money
growth
(Dec. 19) (Sept. 20) (Dec. 20)C/A C/B Annual
A B C1. External Assets (net) (18,250.0) (28,149.3) (38,577.0) -111.4 -37.0 -8.92. Domestic Credit 1,040,967.8 1,219,546.6 1,301,882.7 25.1 6.8 114.9
. Claims on Central Gov’t (net) 111,154.2 148,399.1 139,723.4 25.7 -5.8 12.6
. Claims on Non-Central Gov’t 929,813.5 1,071,147.6 1,162,159.3 15.2 8.5 62.2
. Financial Institutions 55,942.7 57,642.7 56,642.7 1.3 -1.7 0.3
. Others 873,870.8 1,013,504.9 1,105,516.6 26.5 9.1 102.03. Other Items (net) 72,165.2 106,408.7 85,591.1 18.6 -19.6 5.94. Broad Money (M2) 950,552.6 1,084,988.7 1,177,714.6 23.9 8.5 100.0
Source: Staff Computation, NBE
Fig.IV.1: Major Determinants of Monetary Expansion (Quarterly Change in Percent)
Source: Staff Computation, NBE

18 | Second Quarter 2020/21
National Bank of Ethiopia Quarterly Bulletin
Fig.IV.2: Composition of Domestic Credit (Quarterly Change in Percent)
Source: Staff computation, NBE
Component wise, quasi-money supply exhibited 27.2 percent annual and 4.9 percent quarterly expansion while narrow money supply saw 17.7 percent growth on annual and 16.7 percent contraction in quarterly terms. Year-on-year basis, narrow money contributed 25.9 percent and quasi money 74.1 percent to broad money growth (Table 4.2).
The growth in quasi-money supply was attributed bank branch expansion and improved service outreach, currency demonetization and cash withdrawal limit set by the National Bank of Ethiopia.

| 19
Table 4.2: Components of Broad Money (In millions of Birr, unless specified)
Particulars
Qtr. II Qtr. I Qtr. IIPercentage
Change
Contributions of Each Compo-nent to Broad Money growth
(Dec. 19) (Sept. 20) (Dec. 20) C/A C/B Annual A B C
1. Narrow Money Supply 331,684.1 334,583.2 390,480.7 17.7 16.7 25.9 . Currency outside banks 98,665.3 64,666.1 108,326.1 9.8 67.5 4.3 . Demand Deposits (net) 233,018.8 269,917.2 282,154.6 21.1 4.5 21.62. Quasi-Money 618,868.5 750,405.4 787,233.9 27.2 4.9 74.1 . Savings Deposits 529,147.6 658,821.5 698,079.0 31.9 6.0 74.4 . Time Deposits 89,720.9 91,583.9 89,154.9 -0.6 -2.7 -0.23. Broad Money Supply 950,552.6 1,084,988.7 1,177,714.6 23.9 8.5 100.0
Source: Staff Computation, NBE
Fig.IV.3: Composition of Monetary Stock
Source: Staff computation, NBE

20 | Second Quarter 2020/21
National Bank of Ethiopia Quarterly Bulletin
4.2. Developments in Reserve Money and Monetary Ratio
Reserve money reached Birr 258.7 billion in the second quarter of 2020/21, showing 31.3 percent year-on-year expansion and 1.0 percent quarterly contraction. Similarly, excess reserve of commercial banks increased 39.9 percent over last year same quarter while it declined 17.7 percent on quarterly basis (Table 4.3).
Money multiplier, measured by the ratio of broad money to reserve money decreased to 4.6 from 4.8 last year while the ratio of narrow money and reserve money declined to 1.5 from 1.7 a year ago.
Table 4.3: Monetary Aggregates and Ratios(In millions of Birr unless otherwise indicated)
Particulars
Qtr. II Qtr. I Qtr. II Percentage Change
(Dec. 19) (Sept. 20) (Dec. 20)
A B C C/A C/B
1. Reserve Requirement (CB’s) 47,858.3 57,211.4 60,394.2 26.2 5.62. Actual Reserve (CB’s) 87,714.4 124,961.2 116,138.0 32.4 -7.13. Excess Reserve (CB’s) 39,856.1 67,749.7 55,743.9 39.9 -17.74. Reserve Money 197,049.9 261,352.9 258,706.6 31.3 -1.0 . Currency in Circulation 128,071.6 124,403.5 138,864.5 8.4 11.6 . Banks deposits at NBE 68,978.3 136,949.4 119,842.1 73.7 -12.55. Money Multiplier (Ratio): . Narrow Money to Reserve Money 1.7 1.3 1.5 -10.3 17.9 . Broad Money to Reserve Money 4.8 4.2 4.6 -5.6 9.76. Other Monetary Ratios (%): . Currency to Narrow Money 38.6 37.2 35.6 -7.9 -4.4 . Currency to Broad Money 13.5 11.5 11.8 -12.5 2.8 . Narrow Money to Broad Money 34.9 30.8 33.2 -5.0 7.5 . Quasi Money to Broad Money 65.1 69.2 66.8 2.7 -3.4
Source: Staff Computation, NBE

| 21
Fig.IV.4: Quarterly Growth of Reserve Money and Its Components
Source: Staff Computation NBE
Fig.IV.5: Monetary Aggregates
Source: Staff Computation NBE

22 | Second Quarter 2020/21
National Bank of Ethiopia Quarterly Bulletin
4.3. Interest Rate Developments
Average savings deposit rate remained at 8.0 percent and lending rate at 14.25 percent, while weighted average time deposit rate witnessed a 0.27 percent annual decline. In contrast, the yield on T-bills has witnessed significant rise since the market based T-bills market was introduced. Accordingly, weighted average yield on T-bills increased from
2.7 percent in December 2019 to 8.9 percent in December 2020. Considering the December 2020 headline inflation of 18.2 percent, interest rates on deposit, lending and the T-bills yield remained negative in real terms (Table 4.4).
Table 4.4: Interest Rate Structure of Commercial Banks (Percent per annum)
Particulars 2019/20 2020/21 Percentage point
ChangesQII QI QII Annual Quarterly
1. Savings Deposit Rate 1/
Minimum 7.00 7.00 7.00 - -
Maximum 9.00 9.00 9.00 - -
Average Saving Rate 8.00 8.00 8.00 - - 2. Time Deposits
Up to 1yr 8.00 7.83 7.73 (0.27) (0.10)
1-2 years 8.05 7.88 7.78 (0.27) (0.10)
Over 2 yrs 8.09 7.93 7.83 (0.26) (0.10)Average Time Dep. Rate (Weighted) 8.05 7.88 7.78 (0.27) (0.10)
3. Demand Deposit (Weighted) 0.05 0.04 0.05 - 0.01 4. Lending Rate 2/
Minimum 7.00 7.00 7.00 - -
Maximum 21.50 21.50 21.50 - -
Average Lending Rate 14.25
14.25 14.25 - -
5. T-bills Rate (Weighted) 2.71 6.28 8.95 6.25 2.67 6. GERD Bond Yield 3/ 6.1 Maturity within 5 Years 7.50 7.50 7.50 - - 6.1 Maturity above 5 Years 8.00 8.00 8.00 - - 7. Headline Inflation (Year-on-year) 19.5 18.6 18.2 (1.30) (0.40)8. Food Inflation (Year-on-year) 22.8 21.2 21.3 (1.50) 0.10 9. Core/non-food Inflation (Year-on-year) 15.8 15.4 14.5 (1.30) (0.90)
1/ Minimum interest rate on saving bond is set by NBE, whereas the maximum indicates the highest rate some banks are paying voluntarily.2/ Lending rates (minimum & maximum rates) are determined by banks.3/ GERD stands for Grand Ethiopian Renaissance Dam

| 23
Fig.IV.6: Interest Rate Structure of Commercial Banks (In percent per annum)
Fig.IV.7: Average Lending Rate, Average Saving Deposit Rate, 91-day T-bills Yield & Core Inflation Rate(In percent per annum)
N.B: Inflation rate (core) is depicted on the right axis while lending rate, 91 day T-bills yield and average saving deposit rate are shown on the left axis Source: Staff computation, NBE

24 | Second Quarter 2020/21
National Bank of Ethiopia Quarterly Bulletin
4.4. Developments in the Financial Sector
The total number of banks in Ethiopia has reached 19, of which 17 were private and the remaining 2 state owned .These banks have opened 269 new bank branches during the review period thereby increasing the number of bank branches to 6,897. Thus, population to bank branch ratio stood at 14,619.33. About 34.3 percent of the total bank branches were located in Addis Ababa. Of the total bank branches, the share of state owned banks was 28.1 percent while that of private banks stood at 71.9 percent.
Total capital of the banking system reached Birr 120.8 billion, of which state owned banks accounted for 48.1 percent while private banks took 51.9 percent share. The share of Commercial Bank of Ethiopia (CBE) in total capital of the banking system was 41.7 percent as of December 2020 (Table 4.5).
Similarly, the number of insurance companies stood at 18, of which 17 were private and 1 state owned. Their branch network increased to 622 from 585 a year ago, of which, about 54.2 percent were located in Addis Ababa.
3 Total population is 100,829,000 as CSA Estimation for 2020
Total capital of insurance companies reached Birr 10.2 billion compared to Birr 8.9 billion a year ago. Private insurance companies accounted for 71.4 percent of the total capital of the insurance sector (Table 4.6).
During the review quarter, there were 39 micro-finance institutions (MFIs) which have mobilized Birr 48.4 billion in saving deposit, depicting 16.2 percent annual growth. Similarly, their outstanding credit rose 5.3 percent to Birr 64.9 billion while their total assets increased 13.3 percent growth to reach Birr 97.1 billion. Their capital also increased to Birr 20.3 billion showing 15.0 percent annual growth (Table 4.7).
The top five largest MFIs namely, Amhara, Dedebit, Oromia, Omo and Addis Credit and Savings Institutions accounted for 81.0 percent of the total capital, 89.5 percent of the total deposit, 84.5 percent of total credit and 85.6 percent of total assets of MFIs.

| 25
Table 4.5: Branch Network and Capital of the Banking System(Branch in Number & Capital in Millions of Birr)
Banks
Branch Network Capital
2019/20 2020/21 2019/20 2020/21
Quarter II Quarter I Quarter II Quarter II Quarter I Quarter II
Reg A.A Total % Share Reg. A.A Total %
Share Reg. A.A Total % Share
1. Public Banks
Commercial Bank of Ethiopia 1,383 392 1,775 28.9 1,419 398 1,817 27.4 1,449 410 1,859 27.0 49,979.3 49,645.98 50,323.44
Development Bank of Ethiopia 88 5 93 1.5 77 5 82 1.2 77 5 82 1.2 7,676.5 7,676.53 7,748.10
Total Public Banks 1,471 397 1,868 30 1,496 403 1,899 29 1,526 415 1,941 28 57,655.8 57,322.5 58,071.5
2. Private Banks -
Awash International Bank 259 188 447 7.3 292 199 491 7.4 311 213 524 7.6 7,782.6 8,095.91 10,945.6
Dashen Bank 268 158 426 6.9 286 164 450 6.8 290 165 455 6.6 5,761.2 5,464.42 5,848.7
Abyssinia Bank 290 196 486 7.9 375 228 603 9.1 389 239 628 9.1 4,160.6 4,179.23 4,658.2
Wegagen Bank 247 144 391 6.4 256 146 402 6.1 268 148 416 6.0 3,866.8 4,137.13 4,388.4
United Bank 163 148 311 5.1 191 165 356 5.4 194 169 363 5.3 3,854.1 4,374.48 4,604.9
Nib International Bank 141 163 304 5.0 159 188 347 5.2 186 207 393 5.7 4,269.7 4,950.78 5,166.6
Cooperative Bank of Oromiya 344 79 423 6.9 348 87 435 6.6 356 92 448 6.5 3,244.5 3,906.34 4,317.7
Lion International Bank 178 81 259 4.2 194 86 280 4.2 202 86 288 4.2 2,456.3 2,767.05 2,974.9
Oromia International Bank 186 101 287 4.7 208 108 316 4.8 214 108 322 4.7 3,475.9 3,650.61 3,865.2
Zemen Bank 22 27 49 0.8 22 32 54 0.8 22 36 58 0.8 2,170.3 2,376.81 2,793.6
Buna International Bank 120 109 229 3.7 130 115 245 3.7 146 124 270 3.9 2,369.9 2,552.40 2,738.1
Berhan International Bank 124 111 235 3.8 137 125 262 4.0 143 127 270 3.9 2,247.3 2,742.52 3,081.4
Abay Bank 143 79 222 3.6 166 88 254 3.8 180 94 274 4.0 2,150.6 2,580.09 3,088.4
Addis Interational Bank 28 43 71 1.2 32 53 85 1.3 33 55 88 1.3 1,033.7 1,113.28 1,196.3
Debub Global Bank 32 41 73 1.2 39 53 92 1.4 42 58 100 1.4 891.2 1,099.88 1,373.2
Enat Bank S.C 25 30 55 0.9 27 30 57 0.9 27 32 59 0.9 1,558.2 1,584.78 1,697.5
Total Private Banks 2,570 1,698 4,268 70 2,862 1,867 4,729 71 3,003 1,953 4,956 72 51,293 55,576 62,739
3.Grand Total Banks 4,041 2,095 6,136 100 4,358 2,270 6,628 100 4,529 2,368 6,897 100 108,949 112,898 120,810
Source: Bank Supervision Directorate (BSD), National Bank of Ethiopia (NBE)
Note: ‘Reg’ Stands for Region and ‘A.A’ for Addis Ababa

26 | Second Quarter 2020/21
National Bank of Ethiopia Quarterly Bulletin
Fig.IV.8: Share of Branch Network and Capital of Banking System
30.4 28.7 28.1
52.9 50.8 48.1
69.6 71.3 71.9
47.1 49.2 51.9
0%10%20%30%40%50%60%70%80%90%
100%
perce
ntag
e sha
re fro
m to
tal
Public Private
Source: Staff Compilation, NBE
Table 4.6: Branch Network & Capital of Insurance Companies (Branch in Number & Capital in Millions of Birr)
2019/20Quarter I Quarter I Quarter II
A.A Reg Total A.A Reg Total A.A Reg Total Capital Capital Capital1.0 25 63 88 25 65 90 25 65 90 2,768 2,911 2,933 2.0 28 20 48 28 20 48 28 22 50 1,224 1,379 1,467 3.0 17 14 31 18 14 32 18 14 32 232 367 326 4.0 22 17 39 22 17 39 22 17 39 152 179 152 5.0 26 12 38 28 12 40 28 12 40 621 744 673 6.0 11 8 19 12 8 20 12 8 20 183 204 189 7.0 22 21 43 27 22 49 28 22 50 539 638 562 8.0 16 16 32 17 18 35 17 18 35 892 961 1,009 9.0 27 14 41 28 14 42 28 14 42 521 628 546
10.0 16 19 35 16 20 36 16 20 36 192 328 352 11.0 17 5 22 18 6 24 18 6 24 155 177 166 12.0 22 20 42 22 20 42 22 21 43 431 548 567 13.0 13 13 26 15 13 28 15 13 28 307 349 396 14.0 Berhan insurance S.C 12 6 18 13 8 21 13 8 21 131 169 170 15.0 18 8 26 18 9 27 18 9 27 181 267 291 16.0 Lucy Insurance S.C. 12 4 16 12 5 17 12 6 18 125 135 132 17.0 Bunna Insurance S.C. 13 8 21 16 9 25 16 10 26 139 171 197 18.0 Zemen Insurance S.C. - 1 - 1 1 - 1 - 119 116
317 268 585 336 280 616 337 285 622 8,793 10,274 10,244
p p ,
TOTAL
United Insurance Company Global Insurance Company Nile Insurance Company Nyala Insurance Company Nib Insurance Company
E-Life & General Insurance S.C.Oromia Insurance CompanyAbay Insurance Company S.C.
Lion Insurance Company
Tsehay Insurance S.C.
Ethiopia
Quarter II
Ethiopian Insurance CorporationAwash Insurance Company Africa Insurance Company
Quarter I
Branch Capital
Quarter IIInsurance Companies
2020/212019/20 2020/21
Source: Insurance Supervision Directorate, NBE

| 27
Table 4.7: Microfinance Institutions Performance as of September 30, 2020
(In Thousands of Birr)
2019/20QII QI QIIA B C C/A C/B
Total Capital 17,663,808.0 19,695,910.5 20,318,381.2 15.0 3.2Saving 41,604,016.4 46,911,371.6 48,345,831.9 16.2 3.1Credit 61,612,556.3 64,630,555.5 64,895,444.5 5.3 0.4Total Assets 85,735,527.9 93,405,604.6 97,131,162.1 13.3 4.0
% ChangeParticulars2020/21
Source: Microfinance Supervision Directorate, NBE
4.5. Activities of the Banking System
4.5.1. Resource Mobilization
Total resources mobilized by the banking system (the sum of net change in deposit, loans collected and net change in borrowings) rose 33.7 percent over last year due to the policy change made by the National Bank of Ethiopia with respect to Legal Tender Protection Directive that restricts cash holding and cash withdrawal limits and demonetization measures that resulted in high deposit mobilization during the first half of 2020/21 (Table 4.8).

28 | Second Quarter 2020/21
National Bank of Ethiopia Quarterly Bulletin
Table 4.8: Summary of Resource Mobilization & Disbursement of the Banking System
(In Millions of Birr)
Qtr.I 2019/20
Qtr.I 2020/21
Qtr.II 2020/21
A B C C/A C/B1.Deposits (net change) 59,327.2 24,125.9 45,691.5 39,383.7 41,719.4 105,018.7 63,509.7 52.2 -39.5 -Demand 19,752.6 9,762.9 12,193.5 15,632.2 15,559.0 31,946.1 25,395.0 63.2 -20.5 -Saving 37,592.2 17,864.7 31,979.3 21,534.6 26,987.6 69,571.5 39,399.3 46.0 -43.4 -Time 1,982.3 -3,501.7 1,518.8 2,217.0 -827.3 3,501.1 -1,284.7 55.3 -136.72. Borrowing (net change) 85.5 1,370.8 0.0 0.0 -2,230.0 85.5 1,370.8 -161.5 1,503.2 -Local 40.0 -992.1 0.0 0.0 -2,238.9 40.0 -992.1 -55.7 -2,583.0 -Foreign 45.5 2,362.9 0.0 0.0 8.9 45.5 2,362.9 26,582.2 5,087.73. Collection of Loans 13,765.3 12,160.5 21,206.2 27,502.3 38,729.2 34,971.5 39,662.9 2.4 13.44. Total Resources Mobilized (1+2 73,178.0 37,657.3 66,897.7 66,886.1 78,218.6 140,075.8 104,543.3 33.7 -25.45. Disbursement 16,688.3 40,608.8 38,339.7 59,771.7 66,244.9 55,028.0 100,380.4 51.5 82.46. Change in Liquidity (4-5) 56,489.8 -2,951.5 28,558.0 7,114.4 11,973.7 85,047.8 4,162.9 -65.2 -95.1 Memorandum Item:
Outstanding Credit* 696,481.2 736,027.9 377,813.2 439,092.4 913,906.7 1,074,294.4 1,175,120.3 28.6 9.4
Particulars
Public Banks Private Banks Grand Total
% Change
1 2 (3) = (1) + (2)
Qtr.I 2020/21
Qtr.II 2020/21
Qtr.I 2020/21
Qtr.II 2020/21
Source: Commercial Banks and staff computationNotes: *Includes corporate bonds of Commercial Bank of Ethiopia
Fig.IV.9: Trends in Resource Mobilization and Disbursement of Loans
-
20,000.00
40,000.00
60,000.00
80,000.00
100,000.00
120,000.00
140,000.00
160,000.00
I II III IV
I II III IV
I II III IV
I II
2017/18 2018/2019 2019/2020 2020/21
In M
illio
ns o
f Birr
Total Resource Mobilization Collection of Loans Disbursement of Loans
Source: Staff computation

| 29
4.5.1.1. Deposit Mobilization
Total deposit liabilities reached Birr 1.2 trillion by the end of second quarter 2020/21 indicating 26.2 percent annual growth driven by NBE’s policy measures of setting daily cash withdrawal and cash holding limits as well as demonetization process, all of which helped in boosting deposit mobilization.
Demand deposits which accounted for 34.2 percent of the total deposits
reached Birr 413.7 billion showing 24.0 percent year- on -year growth. Similarly, saving deposits surged 31.9 percent to Birr 698.4 billion with a 57.7 percent share in total deposits. Time deposits, which constituted 8.1 percent of the total deposit liabilities, increased by 2.0 percent to Birr 97.8 billion. The share of state owned banks in total deposit was 56.3 percent and that of private banks 43.7 percent (Table 4.9).
Table 4.9: Stock of Deposits Mobilized by the Banking System
(In Millions of Birr)
Quarter II Quarter I Quarter II2019/20 2020/21 2020/21
A B CDemand Deposit 333,564.6 34.8 388,274.7 33.9 413,669.7 34.2 24.0 6.5 Saving Deposit 529,446.7 55.2 659,036.5 57.5 698,435.8 57.7 31.9 6.0 Time Deposit 95,903.5 10.0 99,117.8 8.6 97,833.1 8.1 2.0 (1.3)Total 958,914.8 100.0 1,146,429.0 100.0 1,209,938.6 100.0 26.2 5.5 Share of Public Banks 58.6 57.3 56.3 Share of Private Banks 41.4 42.7 43.7
C/A C/B
% Share
Deposit by types %
Share%
Share
Source: Commercial Banks and DBE

30 | Second Quarter 2020/21
National Bank of Ethiopia Quarterly Bulletin
Fig.IV.10: Quarterly Growth of Banks’ Deposit Liabilities by Ownership
-2.0
0.0
2.0
4.0
6.0
8.0
10.0
12.0
I II III IV I II III IV I II III IV I II
2017/18 2018/19 2019/2020 2020/21
In p
erce
nt
Publlic Banks Private Banks All Banks
Source: Staff Computation, NBE
4.5.1.2. Collection of Loans
During the review period, banks collected loans (including corporate bonds) amounting to Birr 39.6 billion, which was 2.4 percent higher than last year (Table 4.8). About 60.6 percent of the total loan was collected by private banks and 39.4 percent by state owned banks of which 95.6 percent was from private sector (Table 4.12).

| 31
4.5.1.3. Borrowing
Total outstanding borrowing of the banking system stood at Birr 81.6 billion, showing a 14.1 percent annual growth.
Of the total borrowing, Birr 67.5 billion (82.7 percent) was from domestic and Birr 14.1 billion (17.3 percent) from external sources (Table 4.10).
Table 4.10: Banks’ Outstanding Borrowing by Sources (In Millions of Birr)
2019/20Quarter II Quarter I Quarter II
A B C C/B C/ADomestic Borrowing 61,046.5 68,456.9 67,464.7 (1.4) 10.5 Foreign Borrowing 10,476.7 12,071.5 14,134.4 17.1 34.9 Total 71,523.2 80,528.4 81,599.2 1.3 14.1
Banks Percentage change
(In Millions of Birr)2020/21
Source: Commercial Bank of Ethiopia and Development Bank of Ethiopia
4.5.2. Disbursement of Fresh Loans
Fresh loans (including in CBE bonds) amounted to Birr100.4 billion, indicating a 51.5 percent annual growth of which 40.5 percent was the share of state owned banks, 59.5 percent went to private banks (Table 4.12).
Housing and construction, domestic trade, international trade, industry, mines, Power & water resources were the major beneficiaries of disbursed loan (Table4.11).

32 | Second Quarter 2020/21
National Bank of Ethiopia Quarterly Bulletin
Fig.IV.11: Trends in Fresh Loan Disbursement by Ownership
-
20,000.00
40,000.00
60,000.00
80,000.00
100,000.00
120,000.00
QI
QII
QIII
QIV Q
I
QII
QIII
QIV Q
I
QII
QIII
QIV Q
I
QII
2017/18 2018/19 2019/20 2020/21
Val
ue
in M
illio
n B
irr
Years/Quarters
Total Public Banks Private Banks
Source: Commercial Banks and Development Bank of Ethiopia
Table 4.11: Banking Loans & advances by Sectors (including corporate bond) in QII-2020/21
(In Millions of Birr)
D* C* O/S* D* C* O/S * D* C* O/S* Corporate Bonds* 28,005 3,266 439,001 - - - 28,005 3,266 439,001 Agriculture 1,559 1,091 18,777 1,287 186 4,244 2,846 1,277 23,021 Industry 4,498 2,888 174,539 10,585 3,991 67,753 15,084 6,878 242,292 Domestic Trade 1,400 984 7,978 16,054 7,184 91,672 17,454 8,168 99,650 International Trade 1,055 304 30,141 15,753 8,485 143,630 16,807 8,790 173,770 Export 961 259 11,856 11,962 5,980 103,299 12,922 6,238 115,155 Imports 94 46 18,285 3,791 2,505 40,331 3,885 2,551 58,615 Hotels and Tourism 100 351 4,647 2,031 662 19,421 2,131 1,013 24,068 Transport & Communication 4,582 75 69,837 1,376 1,215 11,633 5,958 1,290 81,470 Housing & Construction 14,816 4,572 74,018 8,650 3,725 63,572 23,466 8,297 137,591 Mines, Power & Water Res. 9,911 121 316,088 57 12 397 9,968 133 316,485 Others 1,493 312 10,393 639 617 2,977 2,131 929 13,370 Personal 1,194 1,462 29,609 3,340 1,426 33,794 4,534 2,889 63,403
Total 68,614 15,427 1,175,029 59,772 27,502 439,092 100,380 39,663 1,175,120 Source: Commercial Banks and staff computation
For the Second quarter of 2020/21, December 31, 2021
Borrowing Sector
Public Banks Private Banks Total (1) (2) (3)
(In Millions of Birr)
D*= Disbursement, C*= Collection, O/S*= Outstanding Credit

| 33
4.5.3. Outstanding Credit
Total outstanding credit of the banking system (including corporate bond) rose 28.6 percent to Birr 1.2 trillion, about 99.6 percent of the total outstanding credit of which was claims on private sector (Table 4.12).
Mines, power & water resources sector was the major holder of the credit outstanding (Birr 316.5 billion) followed by industry (Birr 242.3 billion), international trade (Birr 173.8 billion), housing & construction (Birr 137.6 billion), domestic trade (Birr 99.7 billion), and transport & communication (Birr 81.5 billion) (Table 4.11).
Table 4.12: Breakdown of Banking System Credit by Clients in QII-2020/21
(In Millions of Birr)
Qtr.I 2019/20
Qtr.I 2020/21
Qtr.II 2020/21
A B C C/A C/B1.Deposits (net change) 59,327.2 24,125.9 45,691.5 39,383.7 41,719.4 105,018.7 63,509.7 52.2 -39.5 -Demand 19,752.6 9,762.9 12,193.5 15,632.2 15,559.0 31,946.1 25,395.0 63.2 -20.5 -Saving 37,592.2 17,864.7 31,979.3 21,534.6 26,987.6 69,571.5 39,399.3 46.0 -43.4 -Time 1,982.3 -3,501.7 1,518.8 2,217.0 -827.3 3,501.1 -1,284.7 55.3 -136.72. Borrowing (net change) 85.5 1,370.8 0.0 0.0 -2,230.0 85.5 1,370.8 -161.5 1,503.2 -Local 40.0 -992.1 0.0 0.0 -2,238.9 40.0 -992.1 -55.7 -2,583.0 -Foreign 45.5 2,362.9 0.0 0.0 8.9 45.5 2,362.9 26,582.2 5,087.73. Collection of Loans 13,765.3 12,160.5 21,206.2 27,502.3 38,729.2 34,971.5 39,662.9 2.4 13.44. Total Resources Mobilized (1+2+ 73,178.0 37,657.3 66,897.7 66,886.1 78,218.6 140,075.8 104,543.3 33.7 -25.45. Disbursement 16,688.3 40,608.8 38,339.7 59,771.7 66,244.9 55,028.0 100,380.4 51.5 82.46. Change in Liquidity (4-5) 56,489.8 -2,951.5 28,558.0 7,114.4 11,973.7 85,047.8 4,162.9 -65.2 -95.1 Memorandum Item:
Outstanding Credit* 696,481.2 736,027.9 377,813.2 439,092.4 913,906.7 1,074,294.4 1,175,120.3 28.6 9.4Source: Commercial Banks and staff computation
sectors other than NBE 572259.51Notes: *Excludes government borrowing in the form of bonds and treasury bills from commercial banks and other
Table 4.8: Summary of Resource Mobilization & Disbursement of Banking System
Particulars
Public Banks Private Banks Grand Total
% Change
1 2 (3) = (1) + (2)
Qtr.I 2020/21
Qtr.II 2020/21
Qtr.I 2020/21
Qtr.II 2020/21
Source: Commercial banks and staff computation Notes: *Corporate Bonds of Commercial Bank of Ethiopia

34 | Second Quarter 2020/21
National Bank of Ethiopia Quarterly Bulletin
Fig.IV.12: Share of Public and Private Banks in Credit Outstanding
0.010.020.030.040.050.060.070.080.0
QI
QII
QIII
QIV Q
I
QII
QIII
QIV Q
I
QII
QIII
QIV Q
I
QII
2017/18 2018/19 2019/20 2020/21
Val
ue
in P
erce
nt
Years/Quarters
Total Public Total Private
Source: Staff computation, NBE
4.6. Financial Activities of NBE
NBE gross claims on the central government as of end December 2020 has reached Birr 248.1 billion about 21.5 percent higher than a year earlier of which, government bonds accounted for 79.9 percent and direct advance 20.1 percent. The share of direct advance dropped by 74.8 percent compared with last year due to its conversion to government bond, thereby increasing the share of bonds.
Deposit of financial institution at the NBE surged 73.8 percent owing to an increase in bank deposits as their liquidity position improved as a result of NBE policy measures discussed earlier (Table 4.13).

| 35
Table 4 .13: Financial Activities of NBE
(In Millions of Birr)(In Millions of Birr)2019/20
Qtr.II Qtr.I Qtr.IIA B C C/A C/B
1.Loans and Advances 260,180.46 300,784.02 304,784.02 17.1 1.31.1. To Central Government 204,237.75 243,141.31 248,141.31 21.5 2.1
Direct Advances 197,264.95 44,778.66 49,778.66 -74.8 11.2 Bonds 6,972.80 198,362.65 198,362.65 2,744.8 0.0
1.2.To Development Bank of Ethiopia 55,942.71 57,642.71 56,642.71 1.3 -1.72.Deposit Liabilities 100,001.41 170,701.77 151,740.25 51.7 -11.1
2.1. Government 30,939.51 33,548.57 31,702.07 2.5 -5.5 2.2. Financial Institutions 69,061.91 137,153.20 120,038.18 73.8 -12.5
O/W: -Banks 69,053.92 137,141.99 120,034.59 73.8 -12.5 -Insurance companies 8.0 11.2 3.6 -55.2 -68.03.Net Claims of NBE(1-2) 160,179.0 130,082.2 153,043.8 -4.5 17.7
20.1 79.9
% Change Particulars
Table 4 .13: Financial Activities of NBE during the Second Quarter of 2020/21
2020/21
Source: National Bank of Ethiopia (NBE)
4.7. Developments in Financial Markets
4.7.1. Treasury Bills Market
The amount of T-bills supplied to the bi-weekly T-bills auction during the second quarter reached Birr 67.5 billion, which was 20.5 percent lower than last year same period. Similarly, the demand for T-bills contracted by 38.4 percent to Birr 55.2 billion (Table 14.4). The total amount of T-bill sold was Birr 45.6 billion, about 88.8 percent lower than a year ago. Non-bank institutions bought T-bills worth
Birr 36.1 billion while banks purchased T-bills amounting to Birr 9.6 billion.
Total T-bills at the end of the quarter stood at Birr 50.3 billion, reflecting a 55.1 percent year-on-year decline. Average weighted T-bill yield was 8.952 percent about 230.3 percentage points higher than a year earlier, mainly due to policy change on the issuance and operability of T-bills markets (Table 4.14).

36 | Second Quarter 2020/21
National Bank of Ethiopia Quarterly Bulletin
Table 4.14: Results of Treasury Bills Auction (In Millions of Birr)
2019/20 2020/21
% Change Quarter II Quarter I Quarter II
A B C C/A C/BNumber of Bidders 49.00 159.00 82.00 67.35 -48.43
Public 36.00 26.00 25.00 -30.56 -3.85
Private 13.00 133.00 57.00 0.00 -
Number of Bids received 42.00 159.00 82.00 95.24 -48.43
Public 35.00 26.00 25.00 -28.57 -3.85
Private 7.00 133.00 57.00 - -41.86
Amount Demanded (Mn. Birr) 89,622.53 53,261.00 55,196.60 -38.41 3.63
28-day bill 659.00 3,558.00 3,010.00 356.75 -15.40
91-day bill 86,313.53 34,967.00 25,516.00 -70.44 -27.03
182-day bill 650.00 14,736.00 23,289.60 3,483.02 58.05
364-day bill 2,000.00 - 3,381.00 - - Amount Supplied (Mn. Birr) 84,916.53 33,173.00 67,500.00 -20.51 103.48
28-day bill 630.00 1,320.00 1,810.00 187.30 37.12
91-day bill 81,626.53 20,517.00 19,400.00 -76.23 -5.44
182-day bill 660.00 11,336.00 36,340.00 5406.06 220.57
364-day bill 2,000.00 - 9,950.00 - -
Amount Sold (Mn. Birr) 407,971.65 33,350.00 45,642.60 -88.81 36.86
Banks 196.00 14,343.86 9,592.00 -33.13
Non-Banks 407,775.65 19,006.15 36,050.60 -91.16 89.68
Redemption (Mn. Birr) 28,309.00 Average Weighted Price for Successful bids (%) 98.53 98.21 128.96 30.88 31.31
28-day bill 99.80 99.59 99.62 -0.17 0.03
91-day bill 99.35 98.40 98.37 -0.99 -0.03
182-day bill 99.74 96.63 96.77 -2.98 0.14
364-day bill 95.25 - 92.13 - -
Average Weighted Yield for Successful bids (%) 2.71 6.28 8.952 230.33 42.55
28-day bill 2.65 5.34 4.924 85.89 -7.85 91-day bill 2.641 6.518 6.659 152.10 2.16 182-day bill 0.53 6.99 6.704 1158.13 -4.08 364-day bill 5.00 - 8.569 - - Outstanding bills at the end of Period (Mn.Br.) 112,045.53 38,760.00 50,281.60 -55.12 29.73
Banks 196.00 12,982.04 10,829.00 - -16.58
Non-Banks 111,849.53 25,777.96 39,452.60 -64.73 53.05
Source: NBE

| 37
Fig.IV.13: Development in Treasury- bills Markets
-
50,000.00
100,000.00
150,000.00
200,000.00
250,000.00
300,000.00
I II III IV I II III IV I II III IV I II
2017/18 2018/19 2019/20 2020/21
Supply Demand
Source: NBE
Fig.IV.14: Developments in Average weighted Yields of T-bills
0
2.5
5
7.5
10
4.9238
I II III IV I II III IV I II III IV I II
2017/18 2018/19 2019/20 2020/21
(In p
erce
nt)
Fig IV.14: Developments in Average Weighted Yields of T-bills with Di�erent Maturities
28-day 91-day 182-day 364-day
Source: NBE

38 | Second Quarter 2020/21
National Bank of Ethiopia Quarterly Bulletin
4.7.2. Inter- Bank Money Market
There has been no inter-bank money market conducted during the quarter under review.
4.7.3. Corporate Bond Market
Corporate bond market continued to stay limited to few institutional investors such as public institutions and regional governments. The purchaser of these bonds was solely Commercial Bank of Ethiopia (CBE). During the second quarter, CBE purchased corporate bonds worth Birr 28.0 billion issued by City Governments of Addis Ababa (Birr 13.6 billion), Ethiopian Electric power (EEP) (Birr 9.9 billion) Ethiopian Electric Utility (EEU) (Birr 9.9 billion) and Ethiopian Railways Corporations (Birr 4.6 billion).
Thus, the stock of corporate bonds held by the CBE at end of December 2020 stood at Birr 439.0 billion, of which 87.3 percent was claims on public enterprises, and the remaining balance (13.7 percent) on regional governments (Table 4.15). EEP&EEU accounted for 68.3 percent of the bonds issued by public enterprises and 71.7 percent of the total outstanding corporate bond balance.

| 39
Table 4.15: Corporate Bond Purchase, Redemption and Outstand during the Second Quarter of 2020/21
In millions of Birr
Issuer of the Bond
2019/20 2020/21
QII Q II
New Pur-chase Redemption Outstand-
ing
NP Red O/S
1.Puplic Enterprises 2,500.0 50.0 316,654.6 14,417.4 71.4 383,476.5
EEP&EEU 2,500.0 50.0 269,648.9 9,850.16 71.43 314,843.25
Railways Corporation - - 43,029.95 4,567.23 - 68,633.22DBE - - - - - -
2. Regional Governments 0.0 3,096.5 24,222.4 13,587.37 3,194.71 55,524.33 Oromia - 0.5 421.38 - 16.29 376.06
Amhara - - - - 0.00
Tigray - - 131.52 - - 91.54
SNNPRS - - - - -
Dire Dawa - - - - - - Harari - - - - - - City Government of Addis
Ababa - 3,096.0 44,297.1 13,587.37 3,178.42 55,056.74
3.Grand Total (1+2)2,500.0 3,146.5 357,528.86 28,004.76 3,266.14 439,000.81
Source: NBENote: NP= New Purchase, Red. = Redemption, O/S= outstanding

40 | Second Quarter 2020/21
National Bank of Ethiopia Quarterly Bulletin
V. EXTERNAL SECTOR DEVELOPMENTS
5.1. Balance of Payments
The deficit in the overall balance of payments narrowed to USD 129.3 million during the second quarter of FY 2020/21 compared to USD 205.6 million deficit a year ago. This was mainly attributed to narrowing of the merchandise trade deficit coupled with an increase in surplus of net official transfers. In contrast, the deficit in net service receipts widened while net private transfers and net capital account showed contraction (Table 5.1).

| 41
Table 5.1: Balance of Payments (In Millions of USD)
S/N Particulars2019/20 2020/21 Percentage Change
QII QI1 QII2
A B C D=C/A E=C/B1 Exports, f.o.b. 564.2 834.7 722.3 28.0 -13.5 Coffee 133.3 185.3 120.2 -9.8 -35.1 Other 430.9 649.4 602.0 39.7 -7.32 Imports 3,820.0 3,480.3 3,321.7 -13.0 -4.6 Fuel 639.0 377.9 404.4 -36.7 7.0 Cereals 203.1 195.7 327.3 61.1 67.3 Aircraft 28.9 14.7 12.3 -57.3 -15.9 Imports excl. fuel, cereals, aircraft 2,949.0 2,892.1 2,577.8 -12.6 -10.93 Trade Balance (1-2) -3,255.8 -2,645.6 -2,599.4 -20.2 -1.74 Services, net -25.4 37.3 -30.5 20.4 -181.8 Non-factor services, net 111.7 172.3 179.5 60.7 4.2 Exports of non-factor services 1,288.4 1,079.3 1,287.7 -0.1 19.3 Imports of non-factor services 1,176.8 907.1 1,108.3 -5.8 22.2 Factor services (Investment income), net -137.0 -134.9 -210.0 53.2 55.6 Interest, net -137.0 -134.9 -210.0 53.2 55.6 Dividend, net 5 Private transfers, net 1,491.1 1,550.9 1,469.7 -1.4 -5.2 o/w: NGO’s,(Net) 291.7 215.6 327.5 12.3 51.9 Private Individuals 1,199.4 1,335.3 1,142.2 -4.8 -14.56 Current account balance excluding official transfers (3+4+5) -1,790.0 -1,057.4 -1,160.2 -35.2 9.77 Official transfers, net 435.4 328.3 567.6 30.3 72.98 Current account balance including official transfers(6+7) -1,354.6 -729.1 -592.6 -56.2 -18.79 Capital account 1,469.5 457.2 880.5 -40.1 92.6 Official Long-term Capital, net 553.1 186.3 281.7 -49.1 51.2 Disbursements 593.8 202.9 321.4 -45.9 58.4 Amortization 40.7 16.6 39.7 -2.4 139.1 Other public long-term capital 199.1 -344.0 36.1 -81.9 -110.5 Private sector, long term 51.8 33.1 24.4 -52.9 -26.3 Foreign Direct Investment, net 661.6 632.0 706.5 6.8 11.8 Short-term Capital 3.9 -50.2 -168.2 -4,376.3 235.210 Errors and Omissions [11-(9+8)] -320.6 94.5 -417.2 11 Overall balance (-13) -205.6 -177.4 -129.3 12 Financing (13+16) 205.6 177.4 129.3 13 Reserves [ Increase(-), Decrease (+)] (14+15) 205.6 177.4 129.3 14 Central Bank (NFA) 45.4 27.3 314.7 Asset -366.8 -29.9 118.5 Liabilities 412.2 57.2 196.2 15 Commercial banks (NFA) 160.2 150.1 -185.3 16 Debt Relief Principal Interest
Source: NBE Staff Compilation 1 Revised2 Preliminary

42 | Second Quarter 2020/21
National Bank of Ethiopia Quarterly Bulletin
Total current receipts amounted to USD 4.1 billion which about 6.6 percent higher than a year earlier. This was on account of a rise in receipts from merchandise proceeds (28.0 percent) and public transfers (28.4 percent) despite a decrease in private transfers (1.7 percent) and services (0.8 percent).
In contrast, total current payments decreased by 9.8 percent and reached USD 4.7 billion due to decline in merchandise import (13.0 percent), services payment (0.4 percent), private transfers (53.8 percent) and public transfers (10.6 percent). Thus, the deficit in the current account balance narrowed to USD 592.6 million compared with USD 1.4 billion deficit a year ago (Table 5.2) .
Table 5.2: Current Receipts and Payments (In millions of USD)
S/N Particulars
2019/20 2020/21
Percentage ChangeQII QI QII
A B C D=C/A E=C/B1 Current Receipts 3,818.6 3,838.4 4,071.0 6.6 6.1
Export Proceeds 564.2 834.7 722.3 28.0 -13.5Service Proceeds 1,299.5 1,080.1 1,289.1 -0.8 19.3
Private Transfers 1,498.1 1,558.9 1,472.9 -1.7 -5.5
Public Transfer 456.8 364.7 586.7 28.4 60.9
2 Current Payments 5,173.2 4,567.5 4,663.6 -9.8 2.1Import Payments 3,820.0 3,480.3 3,321.7 -13.0 -4.6
Service Payments 1,324.9 1,042.8 1,319.6 -0.4 26.5Private Transfers 7.0 8.0 3.2 -53.8 -59.8Public Transfer 21.4 36.4 19.1 -10.6 -47.6
3 Net, (1-2) -1,354.6 -729.1 -592.6 -56.2 -18.7
Source: NBE Staff Compilation

| 43
5.2. Balance of Trade
Merchandise trade deficit in the second quarter declined to USD 2.6 billion from USD 3.3 billion last year due
to lower import payments and higher merchandise export receipts.

44 | Second Quarter 2020/21
National Bank of Ethiopia Quarterly Bulletin
5.2.1. Export of Goods
Total receipts from export of goods increased by 28.0 percent over last year same quarter owing to higher export revenue from gold (1,693.8 percent), oilseeds (79.4), flower (21.0 percent) chat (14.5 percent), meat & meat products (1.7 percent), live-animals (1.8 percent), electricity (25.4 percent) and other export products (38.1 percent). On the other hand, receipts from coffee (9.8 percent), pulses (23.3 percent), leather & leather products (65.7 percent), fruits & vegetables (2.5 percent) and textile & textile products (25.3 percent) registered decrement in the review quarter.
Specifically, export earnings from gold surged significantly mainly due to remarkable increase in export volume and international price. As a result, the share of gold in total merchandise export rose to 18.3 percent from 1.3 percent.
Likewise, export revenue from oilseeds grew 79.4 percent owing to an increase in export volume despite decline in international price. Thus, the share of oilseeds in total export earnings went up to 13.2 percent from 9.4 percent a year ago.
Earnings from chat and electricity export rose 14.5 and 25.4 percent because of higher export volume despite decline in international price. Consequently, the share of chat in total merchandise export decreased to 12.9 percent from 14.4 percent of last year same period while that of electricity slightly dropped from 2.7 to 2.6 percent.
Similarly, receipts from flower export increased by 21.0 percent due to higher export volume (18.3 percent) and international price (2.2 percent).

| 45
However, the share of flower in total merchandise export decreased to 15.4 percent from 16.3 percent a year ago.
Export receipts from meat & meat products and live animals showed annual growth as export volume increased despite decline in international price. Thus, the share of meat & meat products and live animals in total export earnings tended to decline compared with last year same quarter.
On the other hand, export revenue from coffee and pulses decreased vis-à-vis the same quarter of last year due to lower export volume despite higher international price. As a result, the share of coffee in total export earnings decreased to 16.6 percent from 23.6 percent while that of pulses fell from 8.8 percent to 5.3 percent during the review period.
Likewise, export revenue from textile & textile products , fruits and vegetables and leather and leather products decreased on account of export volume and international price, which resulted in their share in total merchandise export earnings falling compared with last year ( see Tables 5.3 - 5.5).

46 | Second Quarter 2020/21
National Bank of Ethiopia Quarterly Bulletin
Table 5.3: Values of Major Export Items (In millions of USD)
Particulars
2019/20 2020/21 Percentage Change QII QI QII
A %share B %share C %share C/A C/B
Coffee 133.3 23.6 185.3 22.2 120.2 16.6 (9.8) (35.1)
Oilseeds 53.2 9.4 58.0 7.0 95.5 13.2 79.4 64.6
Leather and Leather Products 25.0 4.4 9.3 1.1 8.6 1.2 (65.7) (7.8)
Pulses 49.9 8.8 46.7 5.6 38.3 5.3 (23.3) (18.0)
Meat & Meat Products 16.1 2.9 16.0 1.9 16.4 2.3 1.7 2.6
Fruits & Vegetables 15.1 2.7 13.2 1.6 14.8 2.0 (2.5) 11.5
Textile & Textile Prod. 45.5 8.1 41.5 5.0 34.0 4.7 (25.3) (18.1)
Live Animals 8.5 1.5 12.4 1.5 8.6 1.2 1.8 (30.3)
Chat 81.2 14.4 94.7 11.3 93.0 12.9 14.5 (1.8)
Gold 7.4 1.3 203.3 24.4 132.4 18.3 1,693.8 (34.9)
Flower 91.7 16.2 102.5 12.3 110.9 15.4 21.0 8.3
Electricity 15.2 2.7 23.3 2.8 19.1 2.6 25.4 (18.0)
Others 22.1 3.9 28.6 3.4 30.5 4.2 38.1 6.6
Total Export 564.2 100.0 834.7 100.0 722.3 100.0 28.0 (13.5)
Total Export excluding Electricity 549.0 811.5 703.2 28.1 (13.3)
Source: Ministry of Revenues, Ethiopian Electric Utility and Ethiopian Electric Power

| 47
Table 5.4: Volume of Major Export Items (In millions of Kg)
Particulars2019/20 2020/21
Percentage Change QII QI QIIA B C C/A C/B
Coffee 52.53 53.53 38.45 -26.80 -28.17
Oilseeds 35.57 46.20 68.41 92.34 48.09
Leather and Leather Products 1.13 0.55 0.52 -53.86 -5.39
Pulses 81.77 63.77 50.46 -38.29 -20.87Meat & Meat Products 3.07 3.20 3.17 3.35 -0.93Fruits & Vegetables 43.46 38.86 46.30 6.56 19.14Textile & Textile Prod. 5.79 6.09 5.41 -6.64 -11.28Live Animals 4.77 6.91 5.07 6.18 -26.68Chat 14.17 16.67 16.80 18.57 0.82Gold(In mn. of grams) 0.20 2.70 1.90 852.26 -29.57Flower 20.30 22.74 24.01 18.30 5.60
Electricity(In mn of kwh) 262.45 430.11 342.28 30.42 -20.42
Source: Ministry of Revenues, Ethiopian Electric Utility and Ethiopian Electric Power

48 | Second Quarter 2020/21
National Bank of Ethiopia Quarterly Bulletin
Table 5.5: Unit Value of Major Export Items (In USD/kg)
Particulars
2019/20 2020/21Percentage Change
QII QI QIIA B C C/A C/B
Coffee 2.54 3.46 3.13 1.26 16.82Oilseeds 1.50 1.26 1.40 -6.71 11.18Leather and Leather Products 22.07 16.82 16.39 -25.73 -2.51Pulses 0.61 0.73 0.76 24.34 3.62Meat & Meat Products 5.25 4.99 5.16 -1.55 3.60Fruits & Vegetables 0.35 0.34 0.32 -8.46 -6.45Textile & Textile Prod. 7.85 6.80 6.28 -19.99 -7.67Live Animals 1.78 1.79 1.70 -4.08 -4.97Chat 5.73 5.68 5.54 -3.44 -2.59Gold (USD/kg) 36.93 75.22 69.57 88.37 -7.51Flower 4.51 4.51 4.62 2.30 2.51Electricity (USD/kwh) 0.06 0.05 0.06 -3.87 3.02
Source: Ministry of Revenues, Ethiopian Electric Utility and Ethiopian Electric Power

| 49
5.2.2. Import of Goods
Total merchandise import stood at USD 3.3 billion during the second quarter of 2020/21, depicting 13.0 percent year-on-year decline due to lower import values of capital goods, fuel, semi-finished goods, raw materials and miscellaneous goods.
Capital goods import decreased by 26.4 percent due to lower import bills of transport and industrial capital goods by 37.6 percent and 27.2 percent, respectively. Imports of agricultural capital goods, however, increased by 42.0 percent. Thus, the share of capital goods in total goods import declined to 29.0 percent from 34.3 percent a year earlier.
Likewise, import value of fuel decreased by 36.7 percent and its share in total import payments fell to 12.2 percent from 16.7 percent during the same period.
Import of semi-finished goods showed 27.2 percent decline despite 179.3 percent surge in fertilizer imports. Thus, the share of semi-finished goods in total merchandise import decreased to 15.4 percent from 18.4 percent a year earlier.
Import of raw materials declined by 9.3 percent although, their share in total merchandise import marginally increased to 1.2 percent from 1.1 percent a year ago.
Similarly, imports of miscellaneous goods decreased by 37.7 percent and their share in total imports slightly went down to 1.3 percent from 1.9 percent a year ago.
In contrast, import payments for consumer goods rose 29.0 percent over last year same quarter due to 43.3 percent increase in import payments for non-durable goods, while durable goods import payments saw 17.6 percent decline. As a result, the share of consumer goods in total imports increased to 40.8 percent from 27.5 percent a year ago.
Meanwhile, total franco-valuta imports increased by 8.4 percent and stood at USD 1.2 billion accounting for 35.2 percent of the total import value.

50 | Second Quarter 2020/21
National Bank of Ethiopia Quarterly Bulletin
Table 5.6: Values of Major Import Items
(In millions Of USD)
Particular
2019/20 2020/21Percentage Changes
Qtr II Share (%) Qtr I Share (%) Qtr II Share (%)
A B C C/A C/BRaw Materials 43.7 1.1 34.9 1.0 39.7 1.2 -9.3 13.6Semi-finished Goods 704.5 18.4 572.5 16.5 512.8 15.4 -27.2 -10.4 Fertilizers 8.9 0.2 9.6 0.3 24.9 0.7 179.3 160.4Fuel 639.0 16.7 377.9 10.9 404.4 12.2 -36.7 7.0
Petroleum Products 614.1 16.1 358.3 10.3 388.7 11.7 -36.7 8.5
Others 24.9 0.7 19.7 0.6 15.6 0.5 -37.2 -20.5Capital Goods 1310.3 34.3 966.1 27.8 963.9 29.0 -26.4 -0.2 Transport 108.3 2.8 106.6 3.1 67.5 2.0 -37.6 -36.6 Agricultural 31.3 0.8 20.8 0.6 44.5 1.3 42.0 114.3 Industrial 1170.7 30.6 838.7 24.1 851.8 25.6 -27.2 1.6Consumer Goods 1051.3 27.5 1491.5 42.9 1356.7 40.8 29.0 -9.0 Durables 246.2 6.4 207.4 6.0 202.9 6.1 -17.6 -2.1 Non-durables 805.1 21.1 1284.2 36.9 1153.8 34.7 43.3 -10.2Miscellaneous 71.1 1.9 37.3 1.1 44.3 1.3 -37.7 18.6
Total Imports 3820.0 100.0 3480.3 100.0 3321.7 100.0 -13.0 -4.6
Source: Ministry of Revenues

| 51
Table 5.7: The Value of Franco Valuta Import (In Millions of USD
Commodity Group
2019/20 2020/21 Percentage Change
Qtr II Qtr I Qtr II
A B C C/A C/B
Beverages 0.2 0.8 1.7 910.8 125.6
Chemicals 5.1 8.0 2.1 -58.3 -73.3Clothing 3.9 5.4 7.3 88.5 34.6Food and live animals 110.6 133.3 292.5 164.5 119.4Textiles 11.6 23.5 42.2 262.0 79.7Tobacco 0.0 0.0 0.0 -48.4 -19.4
Soap & polish 0.4 0.7 0.9 114.7 34.7
Fertilizer 59.4 12.6 106.7 79.6 749.1 Paper & paper manufacturing 3.3 1.4 2.2 -34.6 57.7 Metal & metal manufacturing 104.2 103.6 64.9 -37.7 -37.4Medical and pharmaceuticals prod-ucts 26.3 23.7 17.2 -34.4 -27.3
Rubber products 7.6 11.9 9.0 18.4 -24.1Petroleum crudes 0.0 0.0 0.0 -10.3 Petroleum products 7.0 5.3 6.1 -13.8 13.9Glass & glass wares 2.1 2.4 1.6 -23.8 -32.1Electrical materials 88.2 46.7 77.2 -12.5 65.2
Machines 374.7 204.7 203.6 -45.7 -0.6Road & motor vehicles 26.6 30.5 8.0 -70.1 -73.9Tele apparatus 1.2 0.9 5.3 335.8 470.2Cement 0.1 0.1 0.1 0.0 0.0Others 244.8 421.3 319.4 30.5 -24.2Total 1077.3 1036.6 1167.7 8.4 12.6
Source: Ministry of Revenues

52 | Second Quarter 2020/21
National Bank of Ethiopia Quarterly Bulletin
5.2.3 Direction of Trade
5.2.3.1 Export of Goods
Europe, Asia and Africa were the major destinations for Ethiopian exports where Europe constituted 40.6 percent, Asia 32.1 percent and Africa 20.5 percent of Ethiopia’s total export revenue. In terms of Europe, Switzerland took 45.2 percent share, followed by the Netherlands (27.2 percent), Germany (7.8 percent), Belgium (5.0 percent), Italy (2.8 percent), Turkey (2.4 percent), United Kingdom (2.1 percent), France (1.5 percent), Spain (1.1 percent), and Russia (1.0 percent). These European countries together had a 96.1 percent share of Ethiopia’s total exports to Europe.
In Asia, United Arab Emirates was the main destination for Ethiopia’s export having 20.8 percent share, followed by Saudi Arabia (19.8 percent), Israel (7.3 percent), China (6.8 percent), Japan (6.7 percent), India (6.6 percent), Singapore (6.5 percent), South Korea
(3.8 percent), Yemen (3.0 percent), Indonesia (2.8 Percent), Hong Kong (1.5 percent), Pakistan (1.4 percent), Taiwan (1.1 percent) and Malaysia (1.0 percent). All these countries combined accounted for 89.1 percent of Ethiopia’s total export to Asia.
Africa accounted for about 20.5 percent of Ethiopia’s export earnings with major destination being Somalia (22.6 percent), Djibouti (14.1 percent), Sudan (13.0 percent), Kenya (1.5 percent) and Egypt (1.0 percent), which altogether took 52.3 percent share of the total exports to Africa.
America had 6.3 percent share in Ethiopia’s total export earnings, of which 89.7 percent was from exports to the United States and 8.6 percent to Canada. Both countries accounted for 98.3 percent of Ethiopia’s total exports to America.
Source: NBE Staff Compilation

| 53
5.2.3.2. Import of Goods
During the second quarter of 2020/21, Asia accounted for 65.5 percent of the total import bills of Ethiopia with the major imports coming from China (40.9 percent), India (21.1 percent), U.A.E (16.0 percent), Malaysia (4.9 percent), Indonesia (3.9 percent), Saudi Arabia (3.3 percent), Thailand (3.3 percent), South Korea (2.0 percent) and Japan (1.3 percent) whose combined share was 96.7 percent.
Imports from Europe had a 22.9 percent share with the major countries being Turkey (19.3 percent), Ukraine (19.3 percent), Italy (12.3 percent), United Kingdom (10.5 percent), Germany (7.6 percent), France (4.8 percent), Belgium (4.4 percent), Russia (3.9 percent), Switzerland (3.9 percent),
the Netherlands (3.1 percent), Poland (2.9 percent), Spain (1.8 percent) and Sweden (1.5 percent). These countries jointly accounted for 95.3 percent of Ethiopia’s total imports from Europe.
Africa accounted for about 3.8 percent of Ethiopia’s total merchandise import. The major countries of origin were Egypt (48.4 percent), South Africa (22.1 percent), Djibouti (12.5 percent), Kenya (9.1 percent) and Sudan (5.2 percent) which altogether represented 97.3 percent of the total imports from the continent.
Imports from America comprised 7.6 percent of Ethiopia’s import, of which the share of United States was 83.3 percent followed by Canada (11.1 percent) and Brazil (3.0 percent).
Source: NBE Staff Compilation

54 | Second Quarter 2020/21
National Bank of Ethiopia Quarterly Bulletin
5.3. Services and Transfers
5.3.1. Net Services
During the review quarter, net deficit in trade services deteriorated widened by 20.4 percent and reached USD 30.5 million compared to USD 25.4 million deficit a year ago; due to increases in the deficits of net investment income (53.2
percent) and net other services (41.6 percent) which outweighed substantial improvements in surplus of net travel services improvements in net surpluses of transport services and government services, respectively (Table 5.8).

| 55
Table 5.8: Developments in Services Accounts
(In Millions of USD)
S/N Particulars
2019/20 2020/21Percentage
ChangeQII QI QII
A B C D=C/A E=C/B
1 Investment Income (2+5) -137.0 -134.9 -210.0 53.2 55.6
2 Interest, net (3-4) -137.0 -134.9 -210.0 53.2 55.6
3 Credit 11.1 0.8 1.3 -88.2 68.1
4 Debit 148.1 135.7 211.3 42.7 55.7
5 Dividend, net
6 NON-FACTOR SERVICES, net (7-8) 111.7 172.3 179.5 60.7 4.2
7 Exports of non-factor services 1,288.4
1,079.3
1,287.7 -0.1 19.3
8 Travel 220.7 289.5 292.7 32.6 1.1
9 Transport 1 927.9 686.8 863.8 -6.9 25.8
10 Gov’t 2 47.9 38.7 55.7 16.3 43.7
11 Other 3 91.9 64.3 75.6 -17.8 17.5
12 Imports of non-factor services 1,176.8
907.1
1,108.3 -5.8 22.2
13 Travel 154.4 49.0 95.0 -38.5 93.9
14 Transport 1 678.4 543.9 600.5 -11.5 10.4
15 Gov’t 2 14.1 11.1 0.2 -98.4 -98.0
16 Other 3 329.9 303.0 412.5 25.1 36.1
17 Net Services (18+19+20+21+22) -25.4 37.3 -30.5 20.4 -181.8
18 Travel (8-13) 66.3 240.5 197.7 198.2 -17.8
19 Transport (9-14) 249.5 142.9 263.2 5.5 84.3
20 Gov’t (10-15) 33.8 27.6 55.4 64.0 100.9
21 Other (11-16) -238.0 -238.7 -337.0 41.6 41.1
22 Investment Income (2+5) -137.0 -134.9 -210.0 53.2 55.6
Source: MoF, Transport and Telecommunication Companies, NBE- FEMRMD and Staff Compilation 1/ Includes Ethiopian Airlines receipts and payments 2/ Includes transactions with Embassies and international organizations such as UN-ECA, AU, EU, IMF and WB 3/ Includes communication, construction, insurance, financial, information, other business

56 | Second Quarter 2020/21
National Bank of Ethiopia Quarterly Bulletin
5.3.2. Transfers
During the review period, total transfer receipts increased by 5.4 percent and reached USD 2.1 billion due to 28.4 percent rise in official transfers despite 1.7 percent reduction in private transfers.
On the other hand, total transfer
payments decreased by 21.2 percent owing to 10.6 percent decline in official transfers and 53.8 percent drop in private transfer payments. As a result, net transfers increased 5.7 percent to USD 2.04 billion (Table 5.9).
Table 5.9: Developments in Transfer Accounts(In Millions of USD)
S/N Particulars
2019/20 2020/21 Percentage Change
QII Share
(In %)
QI Share
(In %)
QII Share
(In %)A B C D=C/A E=C/B
1 Private transfers, net (2-5) 1,491.1 77.4 1,550.9 82.5 1,469.7 72.1 -1.4 -5.2
2 Credit (3+4) 1,498.1 76.6 1,558.9 81.0 1,472.9 71.5 -1.7 -5.53 NGO’s 298.7 15.3 223.6 11.6 330.7 16.1 10.7 47.9
4 Private individuals 1,199.4 61.4 1,335.3 69.4 1,142.2 55.5 -4.8 -14.5
5 Debit 7.0 24.6 8.0 18.0 3.2 14.4 -53.8 -59.8
6 Official transfers, net (7-8) 435.4 22.6 328.3 17.5 567.6 27.9 30.3 72.9
7 Credit 456.8 23.4 364.7 19.0 586.7 28.5 28.4 60.98 Debit 21.4 75.4 36.4 82.0 19.1 85.6 -10.6 -47.69 Total Receipts 1,954.9 100.0 1,923.6 100.0 2,059.6 100.0 5.4 7.1
10 Total Payments 28.3 100.0 44.4 100.0 22.3 100.0 -21.2 -49.8
11 Net Transfers 1,926.5 100.0 1,879.1 100.0 2,037.3 100.0 5.7 8.4
Source: NBE Staff Computation

| 57
5.4. Current Account Balance
The deficit in the current account balance (including official transfers) narrowed to USD 592.6 million compared to USD 1.4 billion deficit a year ago. This was due to narrowing of merchandise trade deficit by 20.2 percent , a 30.3
percent increase in surplus of net official transfers despite 20.4 percent rise in net deficit of service receipts widened and 1.4 percent decline in net private transfers (Table 5.1).

58 | Second Quarter 2020/21
National Bank of Ethiopia Quarterly Bulletin
5.5. Capital Account
Capital account recorded USD 880.5 million in surplus which was 40.1 percent lower than that of a year earlier. The slowdown in surplus was attributed to decreases in net official long term capital (49.1 percent), other public sector long
term capital (81.9 percent), private sector long term capital (52.9 percent) and short term capital. Meanwhile, foreign direct investment registered 6.8 percent annual growth (Table 5.1).
5.6. Changes in Reserve Position
The deficit in the overall balance of payments during the second quarter of FY 2020/21 reached USD 129.3 million compared to USD 205.6 million deficit a year earlier. Consequently, net foreign assets of the National Bank of Ethiopia showed USD 314.7 million draw down
despite USD 185.3 million build up in NFA of Commercial banks. Thus, as of 31st of December 2020, gross foreign reserve coverage stood at 2.4 months of imports of goods and non-factor services of next fiscal year (Table 5.1).
5.7. Developments in the Foreign Exchange Market
5.7.1. Exchange Rate Movements
Weighted average official exchange rate of Birr in the inter-bank forex market reached Birr 37.8663/USD in the second quarter of 2020/21, depicting 25.3 percent annual depreciation. The end
period exchange rate of the Birr was 39.1809/USD, indicating the weakening of the Birr against USD by 23.2 percent vis-à-vis last year same period.

| 59
Table 5.10: Developments in Inter-bank Market Forex Traded and Exchange Rates (USD/ETB)
Period
Official Market
End Period Weighted Rate
Average Weighted Rate
Amount Traded in Millions of USD
Total Among CBs
2019/20 34.9822 31.3427 12.6 0.0
Qtr. II C 31.8041 30.2107 3.30 0.00
October 29.4303 29.3560 1.15 0.00
November 30.6158 29.8168 1.05 0.00
December 31.8041 31.4594 1.10 0.00
2020/21
Qtr. I B 36.7488 35.7771 3.10 0.00
July 35.2684 35.1278 1.00 0.00
August 36.1553 35.6843 1.05 0.00
September 36.7488 36.5192 1.05 0.00
Qtr. II A 39.1809 37.8663 3.25 0.00
October 37.5468 37.1586 1.05 0.00
November 38.0516 37.8053 1.05 0.00
December 39.1809 38.6350 1.15 0.00
Percentage Changes
A/B 6.62 5.84 4.84
A/C 23.19 25.34 -1.52
Source: National Bank of Ethiopia
In retail foreign exchange market, the average buying rate in the forex bureau of commercial banks stood at Birr 37.8726/USD, showing 25.1 percent depreciation, while the selling rate was Birr 38.6340/USD, depicting the same depreciation rate over last year same quarter.
Thus, the average spread between the buying and selling rates remained at 2.0 percent (Table 5.11).

60 | Second Quarter 2020/21
National Bank of Ethiopia Quarterly BulletinTa
ble
5.11
: A
mou
nt o
f For
eign
Exc
hang
e Pu
rcha
sed
and
Sold
by
Fore
x Bu
reau
of C
omm
erci
al B
anks
(In
‘000
of U
SD)
No.
Nam
e of
For
ex B
urea
ux
2019
/20
2020
/21
Perc
enta
ge C
hang
eQ
uart
er II
AQ
uart
er I
BQ
uart
er II
C
C/B
C/A
Purc
hase
sSa
les
Purc
hase
sSa
les
Purc
hase
sSa
les
Purc
hase
sSa
les
Purc
hase
sSa
les
1C
omm
erci
al B
ank
of E
thio
pia
69,6
90.8
20,9
66.9
26,5
08.6
5,75
1.9
36,9
20.7
6,07
3.7
39.2
85.
59-4
7.02
-71.
032
Ban
k of
Aby
ssin
ia2,
329.
46,
012.
71,
062.
61,
444.
572
4.3
2,34
1.6
-31.
8462
.11
-68.
91-6
1.06
3D
ashe
n B
ank
5,70
0.3
7,20
7.7
2,57
1.7
2,06
0.7
5,84
0.7
4,16
3.7
127.
1210
2.06
2.46
-42.
234
Awas
h In
tern
atio
nal B
ank
1,97
9.8
13,3
82.6
839.
21,
651.
71,
334.
34,
584.
159
.017
7.5
-32.
6-6
5.7
5C
onstr
uctio
n &
Bus
ines
s Ban
k-
154.
095
.3-
-6
Weg
agen
Ban
k4,
523.
92,
283.
12,
797.
669
0.4
1,19
9.4
710.
4-5
7.1
2.9
-73.
5-6
8.9
7U
nite
d B
ank
17,1
12.3
6,30
8.2
6,30
2.8
543.
45,
637.
01,
389.
9-1
0.6
155.
8-6
7.1
-78.
08
Dev
elop
men
t Ban
k2.
320
7.0
54.6
41.2
-2.
2-9
8.9
9N
ib In
tern
atio
nal B
ank
982.
31,
795.
677
7.6
267.
464
7.0
1,32
4.8
-16.
839
5.4
-34.
1-2
6.2
10Li
on In
tern
atio
nal B
ank
25,6
53.3
1,84
7.1
3,04
4.2
197.
171
6.5
99.4
-76.
5-4
9.6
-97.
2-9
4.6
11O
rom
ia In
tern
atio
nal B
ank
4,93
5.1
4,36
2.0
2,33
5.8
849.
14,
091.
238
7.8
75.2
-54.
3-1
7.1
-91.
112
Zem
en B
ank
74.3
4,79
5.1
65.6
1,18
5.1
65.7
2,68
9.0
0.2
126.
9-1
1.5
-43.
913
Coo
pera
tive
Ban
k of
Oro
mia
250.
13,
428.
090
.741
0.9
84.5
945.
3-6
.813
0.1
-66.
2-7
2.4
14B
una
Inte
rnat
iona
l Ban
k1,
435.
257
8.1
296.
654
.933
.597
.7-8
8.7
77.9
-97.
7-8
3.1
15B
irhan
Inte
rnat
iona
l Ban
k15
3.9
2,36
7.1
324.
936
4.6
213.
769
4.4
-90
.438
.8-
16A
bay
Ban
k33
1.5
362.
860
2.6
67.1
54.3
161.
6-9
1.0
--8
3.6
-55.
417
Add
is In
tern
atio
nal B
ank
1,76
4.1
644.
199
0.9
238.
555
6.0
127.
0-4
3.9
-46.
8-6
8.5
-80.
318
Deb
ub G
loba
l Ban
k21
1.6
522.
546
.399
.51,
951.
124
3.1
4117
.814
4.3
822.
2-5
3.5
19En
at B
ank
4,14
6.1
713.
23,
659.
51,
561.
111
1.6
206.
2-9
7.0
-86.
8-9
7.3
-71.
1To
tal
141,
276.
577
,783
.652
,525
.617
,574
.560
,181
.626
,241
.914
.649
.3-5
7.4
-66.
3
Aver
age
Exc
hang
e R
ate
30.2
650
30.8
766
35.6
792
36.3
535
37.8
726
38.6
340
6.1
6.3
25.1
25.1
Spre
ad2.
01.
92.
0
Sour
ce: N
atio
nal B
ank
of E
thio
pia
Not
e: *
Ref
ers t
he p
erce
ntag
e sp
read
bet
wee
n fo
rex
bure
aus a
vera
ge b
uyin
g an
d se
lling
exch
ange
rate
in a
giv
en q
uarte
r.

| 61
Fig.V.11: Average Buying, Selling Rates and Spread of Forex Bureau of Commercial Banks
In the official forex market, US dollar has depreciated against major currencies both on quarterly and annual bases. I n annual terms, USD depreciated against
Japanese Yen (11.1 percent), Swiss Franc (9.5 percent), Euro (7.8 percent), SDR (3.6 percent) and Pound Sterling (2.6 percent)
Likewise, on quarterly basis, USD depreciated against Pound Sterling (2.2 percent), Euro (2.1 percent), Japanese
Yen (1.5 percent), SDR (1.4 percent) and Swiss Franc (1.8 percent) (Table 5.12).

62 | Second Quarter 2020/21
National Bank of Ethiopia Quarterly BulletinTa
ble
5.12
: Ave
rage
Offi
cial
Exc
hang
e Ra
tes
(USD
per
Maj
or In
tern
atio
nal C
urre
ncie
s)
Perio
d
EURO
JAPA
NES
E YE
NSD
RPO
UN
DSTE
LIN
GSW
ISS
FRAN
K
Buyi
ngSe
lling
Mid
-Rat
eBu
ying
Selli
ngM
id-R
ate
Buyi
ngSe
lling
Mid
-Rat
eBu
ying
Selli
ngM
id-R
ate
Buyi
ngSe
lling
Mid
-Rat
e
2019
/20
QII
C1.
1067
1.10
671.
1067
0.00
860.
0086
0.00
861.
3747
1.37
471.
3747
1.28
591.
2861
1.28
601.
0093
1.00
931.
0093
Oct
ober
1.
1042
1.10
421.
1042
0.00
920.
0092
0.00
921.
3707
1.37
071.
3707
1.26
051.
2605
1.26
051.
0060
1.00
601.
0060
Nov
embe
r
1.10
591.
1059
1.10
590.
0083
0.00
830.
0083
1.37
541.
3754
1.37
541.
2880
1.28
871.
2884
1.00
651.
0065
1.00
65
Dece
mbe
r
1.11
001.
1100
1.11
000.
0083
0.00
830.
0083
1.37
796
1.37
801.
3780
1.30
911.
3091
1.30
911.
0155
1.01
541.
0155
2020
/21
QI
B1.
1678
1.16
781.
1678
0.00
940.
0094
0.00
941.
4039
1.40
391.
4039
1.29
121.
2910
1.29
111.
0861
1.08
621.
0862
July
1.
1419
1.14
191.
1419
0.00
930.
0093
0.00
931.
3875
1.38
751.
3875
1.26
111.
2611
1.26
111.
0669
1.06
691.
0669
Augu
st
1.18
181.
1818
1.18
180.
0094
0.00
940.
0094
1.41
081.
4108
1.41
081.
3119
1.31
121.
3115
1.09
771.
0977
1.09
77
Sept
embe
r
1.17
981.
1798
1.17
980.
0095
0.00
950.
0095
1.41
341.
4134
1.41
341.
3006
1.30
061.
3006
1.09
381.
0940
1.09
39
QII
A1.
1917
1.19
381.
1927
0.00
960.
0096
0.00
961.
4238
1.42
381.
4238
1.31
951.
3192
1.31
931.
1054
1.10
551.
1055
Oct
ober
1.
1777
1.17
771.
1777
0.00
950.
0095
0.00
951.
4136
1.41
361.
4136
1.29
711.
2971
1.29
711.
0958
1.09
581.
0958
Nov
embe
r
1.18
231.
1884
1.18
540.
0096
0.00
960.
0096
1.42
041.
4204
1.42
041.
3190
1.31
901.
3190
1.09
711.
0971
1.09
71
Dece
mbe
r
1.21
521.
2152
1.21
520.
0096
0.00
960.
0096
1.43
721.
4373
1.43
731.
3424
1.34
141.
3419
1.12
341.
1235
1.12
35
Perc
enta
ge
Chan
ges
A/B
2.04
2.22
2.13
1.50
1.48
1.49
1.41
1.41
1.41
2.20
2.18
2.19
1.78
1.77
1.78
A/C
7.68
7.87
7.77
11.0
911
.08
11.0
93.
573.
573.
572.
622.
572.
599.
529.
539.
52
Sour
ce: N
atio
nal B
ank
of E
thio
pia

| 63
The Birr has also depreciated against all major currencies. On yearly basis, it depreciated against Swiss Franc (37.3 percent), Euro (35.1 percent), Japanese Yen (30.3 percent), SDR (30.3 percent), Pound Sterling (28.6 percent) USD (25.3 percent).
In the meantime, the Birr weakened against Pound Sterling (8.2 percent), Euro (8.1 percent), Swiss Franc (8.1 percent), Japanese Yen (7.7 percent), SDR (7.3 percent) and USD (5.8 percent) in quarterly terms (Table5.13).

64 | Second Quarter 2020/21
National Bank of Ethiopia Quarterly BulletinTa
ble
5.13
: Per
iod
Ave
rage
Exc
hang
e Ra
tes
(Birr
per
Maj
or C
urre
ncie
s)
Perio
d
Curr
ency
USD
EURO
JAPA
NES
E YE
NSD
RPO
UN
DSTE
RLIN
GSW
ISS
FRAN
K
Buyi
ngSe
lling
Mid
-Ra
teBu
ying
Selli
ngM
id-
Rate
Buyi
ngSe
lling
Mid
-Ra
teBu
ying
Selli
ngM
id-
Rate
Buyi
ngSe
lling
Mid
-Ra
teBu
ying
Selli
ngM
id-
Rate
2019
/20
QII
C30
.210
730
.512
830
.361
833
.436
633
.771
033
.603
80.
2779
0.28
070.
2793
41.5
331
41.9
484
41.7
408
38.8
643
39.2
604
39.0
624
30.4
9733
30.8
0084
30.6
491
Oct
ober
29
.356
029
.649
529
.502
832
.414
932
.739
132
.577
00.
2715
0.27
420.
2729
40.2
385
40.6
408
40.4
397
37.0
042
37.3
742
37.1
892
29.5
329
29.8
283
29.6
806
Nov
embe
r
29.8
168
30.1
150
29.9
659
32.9
730
33.3
027
33.1
379
0.27
400.
2767
0.27
5441
.010
341
.420
541
.215
438
.403
838
.810
238
.607
030
.009
430
.309
530
.159
5
Dece
mbe
r
31.4
594
31.7
740
31.6
167
34.9
219
35.2
711
35.0
965
0.28
810.
2910
0.28
9543
.350
543
.784
043
.567
341
.185
041
.596
941
.390
931
.949
632
.264
732
.107
1
2020
/21
QI
B35
.777
136
.134
735
.955
941
.793
142
.211
042
.002
10.
3369
0.34
030.
3386
50.2
356
50.7
379
50.4
867
46.2
075
46.6
622
46.4
349
38.8
677
39.2
589
39.0
633
July
35
.127
835
.478
635
.303
240
.113
140
.514
040
.313
50.
3284
0.33
170.
3301
48.7
412
49.2
286
48.9
849
44.2
995
44.7
425
44.5
210
37.4
791
37.8
538
37.6
665
Augu
st
35.6
843
36.0
411
35.8
627
42.1
803
42.6
022
42.3
912
0.33
630.
3398
0.33
8150
.350
250
.853
750
.602
046
.829
747
.275
847
.052
739
.181
639
.573
439
.377
5
Sept
embe
r
36.5
192
36.8
844
36.7
018
43.0
860
43.5
169
43.3
014
0.34
600.
3494
0.34
7751
.615
352
.131
551
.873
447
.493
547
.968
547
.731
039
.942
4940
.349
440
.145
9
QII
A37
.866
338
.244
338
.055
345
.135
445
.664
145
.399
80.
3619
0.36
550.
3637
53.9
182
54.4
574
54.1
878
49.9
764
50.4
617
50.2
190
41.8
6607
42.2
8467
42.0
754
Oct
ober
37
.158
637
.530
237
.344
443
.759
944
.197
543
.978
70.
3520
0.35
590.
3540
52.5
277
53.0
530
52.7
903
48.1
988
48.6
808
48.4
398
40.7
182
41.1
254
40.9
218
Nov
embe
r
37.8
053
38.1
833
37.9
943
44.6
976
45.3
770
45.0
373
0.36
210.
3657
0.36
3953
.699
954
.236
853
.968
449
.866
450
.365
150
.115
841
.476
341
.891
141
.683
7
Dece
mbe
r
38.6
350
39.0
194
38.8
272
46.9
486
47.4
180
47.1
833
0.37
180.
3749
0.37
3355
.527
056
.082
355
.804
751
.864
052
.339
152
.101
543
.403
743
.837
543
.620
6
Per-
cent
age
Chan
ge
A/B
5.84
5.84
5.84
8.00
8.18
8.09
7.43
7.40
7.41
7.33
7.33
7.33
8.16
8.14
8.15
7.71
7.71
7.71
A/C
25.3
425
.34
25.3
434
.99
35.2
235
.10
30.2
630
.23
30.2
529
.82
29.8
229
.82
28.5
928
.53
28.5
637
.28
37.2
837
.28
Sour
ce: N
atio
nal B
ank
of E
thio
pia
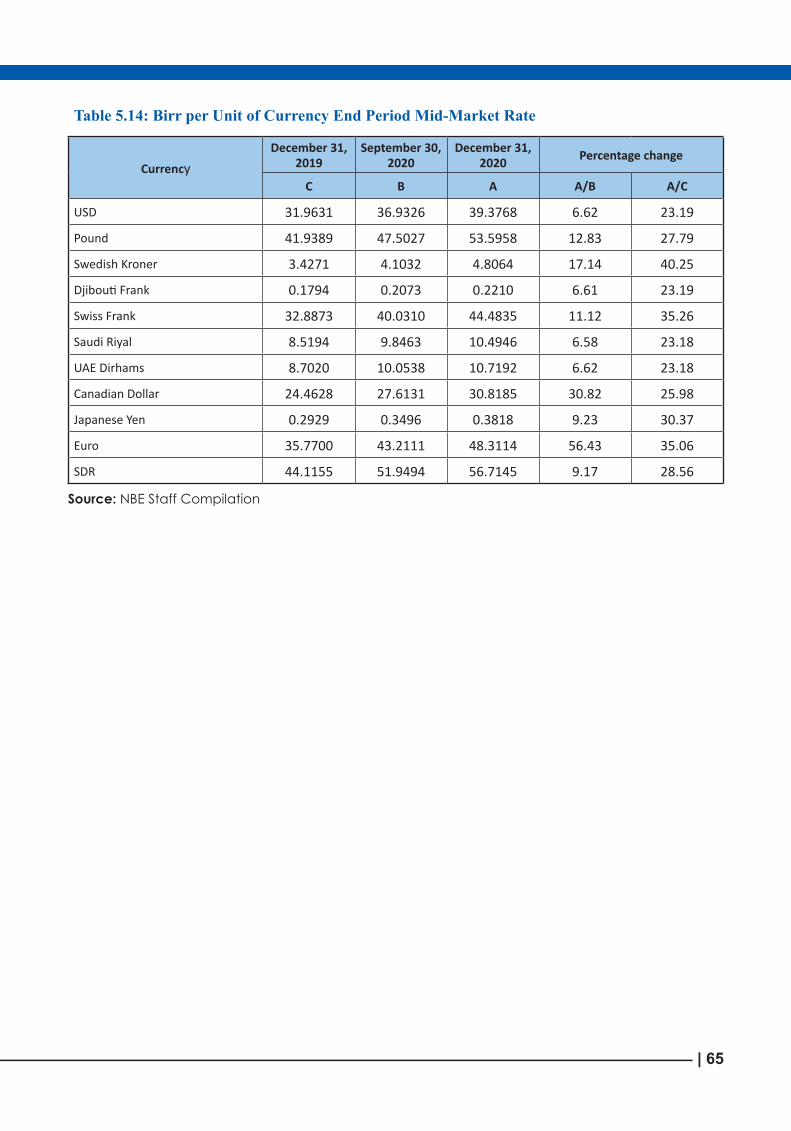
| 65
Table 5.14: Birr per Unit of Currency End Period Mid-Market Rate
Currency December 31,
2019 September 30,
2020 December 31,
2020 Percentage change
C B A A/B A/C
USD 31.9631 36.9326 39.3768 6.62 23.19
Pound 41.9389 47.5027 53.5958 12.83 27.79
Swedish Kroner 3.4271 4.1032 4.8064 17.14 40.25
Djibouti Frank 0.1794 0.2073 0.2210 6.61 23.19
Swiss Frank 32.8873 40.0310 44.4835 11.12 35.26
Saudi Riyal 8.5194 9.8463 10.4946 6.58 23.18
UAE Dirhams 8.7020 10.0538 10.7192 6.62 23.18
Canadian Dollar 24.4628 27.6131 30.8185 30.82 25.98
Japanese Yen 0.2929 0.3496 0.3818 9.23 30.37
Euro 35.7700 43.2111 48.3114 56.43 35.06
SDR 44.1155 51.9494 56.7145 9.17 28.56
Source: NBE Staff Compilation

66 | Second Quarter 2020/21
National Bank of Ethiopia Quarterly Bulletin
5.7.2. Movements in the Real Effective Exchange Rate
During the second quarter of 2020/21, the Birr depreciated by 32.8 percent in real terms largely due to the weakening of the Birr with respect to the trading partners’ currencies as well as Ethiopia’s price advantage over its trading partners4.
Likewise, the NEERI depreciated by 14.0 percent compared with last year same quarter (Table 5.15).
4Sudanese inflation for the month of December 2020 was 269.3 percent thereby eroding Ethiopia’s price advantage.

| 67
Table 5.15: Trends in the Real and Nominal Effective Exchange Rates
Item
2019/20 2020/21Percentage Change
QII QI QII
A B C C/B C/A
REERI 190.2 148.0 127.8 -13.7 -32.8
NEERI 40.3 36.4 34.6 -4.8 -14.0
Source: NBE Staff Compilation NB: • REERI = Real Effective Exchange Rate Index, • NEERI = Nominal Effective Exchange Rate Index • A decrease in the REERI and NEERI implies depreciation and vice versa.
Fig.V.12: Movements in the Real and Nominal Effective Exchange Rate

68 | Second Quarter 2020/21
National Bank of Ethiopia Quarterly Bulletin
5.7.3. Volume of Transactions
In the second quarter of 2020/21, the volume of foreign exchange traded in the inter-bank foreign exchange was USD 3.3 million showing 1.5 percent
annual decrease. Virtually all the foreign exchange was supplied by NBE with a view to stabilize the foreign exchange market (Table 5:10).
Fig.V.13: Foreign Exchange Trade in the Interbank Foreign Exchange Market
01122334
QI QII QIII QIV QI QII QIII QIV QI QII QIII QIV QI QII QIII QIV QI QII
2016/17 2017/18 2018/19 2019/20 2020/21
(In M
ill. U
SD)
Total Amount Traded Amount Traded among CBs
During the same period, forex bureaus of commercial banks purchased USD 60.2 million and sold USD 26.2 million which indicated 57.4 percent and 66.3 percent respective decline largely due to COVID- 19 pandemic (Table 5.11).

| 69
VI. FEDERAL GOVERNMENT FINANCETotal revenue and grants of the Federal government during the second quarter of 2020/21 was Birr 93.1 billion about 28.5 percent higher than last year same quarter and indicating a 28.7 percent performance of annual budget (Table 6.1).
Similarly, Federal government expenditure showed a 59.2 percent annual growth
due to an increase in all components of expenditure. The total expenditure performance was 29.4 percent of the annual plan.
Consequently, the overall fiscal balance of the Federal government (including grants) resulted in Birr 32.9 billion deficit (Table 6.1).

70 | Second Quarter 2020/21
National Bank of Ethiopia Quarterly Bulletin
Table 6.1: Summary of Quarterly Federal Government Finance [In millions of Birr]
No Finer points2019/20 2020/21 Percentage
changesperformance
rateQII Budget QI QII
D/A D/C D/B A B C D
1 Revenue and Grants 72,490.0 325,212.6 81,108.6 93,178.4 28.5 14.9 28.7
1.1 Total Revenue 71,531.2 304,552.2 75,074.7 86,949.2 21.6 15.8 28.5
Tax Revenue 68,936.3 271,748.2 61,909.9 84,002.4 21.9
35.7 30.9
Direct tax 26,991.5 65,850.7 19,003.4 40,587.2
50.4 113.6 61.6
Indirect tax 41,944.8 205,897.5 42,906.5 43,415.2 3.5
1.2 21.1
Non-Tax Revenue 2,594.9 32,804.0 13,164.8 2,946.8
13.6 (77.6) 9.0
1.2 Grant & Relief 958.7 20,660.4 6,033.8 6,229.2
549.7 3.2 30.2
2 Current Expenditure 18,931.5 116,102.5 24,487.3 46,979.1 148.2
91.9 40.5
3 Current Surplus/Deficit - - - - -
(Including Grants) 53,558.4 209,110.1 56,621.3 46,199.3 (13.7)
(18.4) 22.1
(Excluding Grants) 52,599.7 188,449.7 50,587.4 39,970.1 (24.0)
(21.0) 21.2
4 Capital Expenditure 24,674.5 136,794.2 22,225.3 35,124.2 42.4
58.0 25.7
5 Regional Transfers 35,654.9 175,805.7 42,187.3 44,068.6 23.6
4.5 25.1
6 Total Expenditure 79,260.9 428,702.4 88,900.0 126,172.0 59.2
41.9 29.4
7 Overall Surplus/Deficit - - - - - -
(Including Grants) (6,771.0) (103,489.7) (7,791.4) (32,993.6)
387.3 323.5 31.9
(Excluding Grants) (7,729.7) (124,150.1) (13,825.2) (39,222.8) 407.4 183.7 31.6
8 Total Financing 6,771.0 103,489.7 7,791.4 32,993.6 387.3
323.5 31.9
8.1 Net External Borrowings 10,990.4 31,044.2 2,902.6 8,468.3 (22.9)
191.7 27.3
External Borrowing 8,349.4 21,557.2 3,130.3 12,770.5 53.0
308.0 59.2
Amortization 1,118.9 11,755.4 586.7 1,530.9 36.8
160.9 13.0
8.2 Net Domestic Borrowings (5,296.8) 72,445.6 (1,837.6) 33,375.1 (730.1) (1,916.3) 46.1
Banking System (11,360.8) - (1,451.5) 9,731.5 (185.7) (770.4)
Non-Bank Sources 6,064.0 - (386.0) 23,643.6 289.9 (6,224.7)
8.3 Privatization receipts - - 0.4 - - - -
8.4 Others and Residuals 1,077.3 0.0 6,726.0 (8,849.9) (921.5) (231.6)
Source: Ministry of Finance

| 71
6.1 Revenue and Grants
Total revenue and grants under the review quarter reached Birr 93.1 billion of which 93.3 percent was from domestic sources and 6.7 percent from grant and relief. Of the total domestic revenue Birr 86.9 billion (96.6 percent) was collected
from taxes and Birr 2.9 billion (3.4 percent) from non-taxes external grants & relief in the quarter amounted to Birr 6.2 billion. The performance of total revenue and grant was 28.5 percent of the annual plan (Table 6.2).
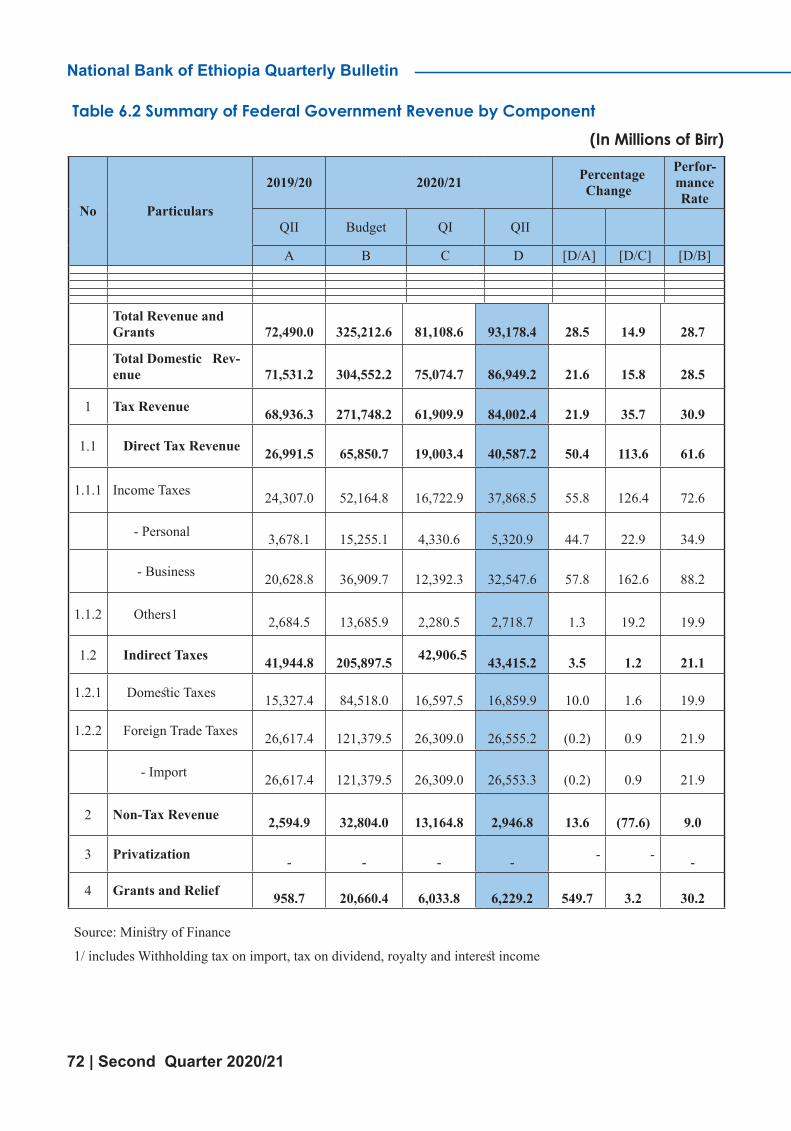
72 | Second Quarter 2020/21
National Bank of Ethiopia Quarterly Bulletin
Table 6.2 Summary of Federal Government Revenue by Component (In Millions of Birr)
No Particulars
2019/20 2020/21 Percentage Change
Perfor-mance Rate
QII Budget QI QII
A B C D [D/A] [D/C] [D/B]
Total Revenue and Grants
72,490.0
325,212.6
81,108.6
93,178.4
28.5
14.9
28.7
Total Domestic Rev-enue
71,531.2
304,552.2
75,074.7
86,949.2
21.6
15.8
28.5
1 Tax Revenue 68,936.3
271,748.2
61,909.9
84,002.4
21.9
35.7
30.9
1.1 Direct Tax Revenue 26,991.5
65,850.7
19,003.4
40,587.2
50.4
113.6
61.6
1.1.1 Income Taxes 24,307.0
52,164.8
16,722.9
37,868.5
55.8
126.4
72.6
- Personal 3,678.1
15,255.1
4,330.6
5,320.9
44.7
22.9
34.9
- Business 20,628.8
36,909.7
12,392.3
32,547.6
57.8
162.6
88.2
1.1.2 Others1 2,684.5
13,685.9
2,280.5
2,718.7
1.3
19.2
19.9
1.2 Indirect Taxes 41,944.8
205,897.5 42,906.5
43,415.2 3.5
1.2
21.1
1.2.1 Domestic Taxes 15,327.4
84,518.0
16,597.5
16,859.9
10.0
1.6
19.9
1.2.2 Foreign Trade Taxes 26,617.4
121,379.5
26,309.0
26,555.2
(0.2)
0.9
21.9
- Import 26,617.4
121,379.5
26,309.0
26,553.3
(0.2)
0.9
21.9
2 Non-Tax Revenue 2,594.9
32,804.0
13,164.8
2,946.8
13.6
(77.6)
9.0
3 Privatization -
-
-
- - -
-
4 Grants and Relief 958.7
20,660.4
6,033.8
6,229.2
549.7
3.2
30.2
Source: Ministry of Finance
1/ includes Withholding tax on import, tax on dividend, royalty and interest income

| 73
Fig.VI.1: Quarterly Developments in Major Components of Domestic Revenue of the Federal Government
Tax revenue mainly originated from indirect taxes which accounted for 51.6 percent of the total tax revenue. Revenue from indirect taxes went up by 3.5 percent compared to the same quarter of last fiscal year.
About 61.1 percent of the indirect tax revenue was from foreign trade taxes, while direct taxes constituted the remaining balance which grew 50.4 percent over last year.
Fig.VI.2: Domestic Revenue of federal government by Major Components during the Second Quarter of 2020/21
6.2 Expenditure
Total Federal government expenditure (including regional transfers) amounted to Birr 126.1 billion indicating 59.2 percent annual growth
Current expenditure reached Birr 46.9 billion or 37.2 percent of the total expendi tu re, capital expenditure
amounted to Birr 35.1 billion or 27.9 percent of total expenditure. Regional transfers constituted Birr 44.0 billion or 34.9 percent of the total Federal government budgetary expenses (Table 6.3).

74 | Second Quarter 2020/21
National Bank of Ethiopia Quarterly Bulletin
Tale 6.3: Summary of Federal Government Expenditure by components
(In Millions of Birr)
No Particulars2019/20 2020/21 Percentage
ChangePerformance
Rate
QII Budget QI QII [A] [B] [C] [D] [D/A] [D/C] [D/B]
Total Expenditure 79,260.9 428,702.4 88,900.0 126,172.0 59.2 41.9 29.4
1 Current Expenditure 18,931.5 116,102.5 24,487.3 46,979.1 148.2 91.9 40.5
- General Services 8,716.3 38,465.5 9,720.4 22,066.8 153.2 127.0 57.4
- Economic Services 1,616.8 6,770.2 1,954.0 2,498.6 54.5 27.9 36.9
- Social Services 9,590.6 37,099.0 10,757.1 13,088.3 36.5 21.7 35.3
- Others expenditure 123.3 14,002.8 236.8 235.0 90.6 (0.7) 1.7
- Debt Service (1,115.5) 19,765.1 1,819.1 9,090.5 (914.9) 399.7 46.0
2 Capital Expenditure 24,674.5 136,794.2 22,225.3 35,124.2 42.4 58.0 25.7
- Economic Development 16,455.9 99,746.8 17,028.3 25,235.0 53.3 48.2 25.3
- Social Development 7,379.6 29,180.2 4,691.2 8,809.3 19.4 87.8 30.2
- General Development 839.0 7,867.1 505.8 1,080.0 28.7 113.5 13.7
3 Regional Transfers 35,654.9 175,805.7 42,187.3 44,068.6 23.6 4.5 25.1
Source: Ministry of Finance
Fig.VI.3: Major Components of Federal Governments Expenditure during the Second Quarter of 2020/21

| 75
Fig.VI.4: Quarterly Development in Federal Government Expenditure by Components Second Quarterof2020/21
0
20000
40000
60000
80000
100000
120000
140000
2017/18 2018/19 2019/20 2020/21
(In M
illion
s of B
irr)
Quarters/Years Total Expenditure Current Expenditure
Capital Expenditure Regional Transfers

76 | Second Quarter 2020/21
National Bank of Ethiopia Quarterly Bulletin
6.3 Deficit Financing
Federal government budget operation during second quarter 2020/21 depicted an overall deficit (including grant) of Birr 32.9 billion, which was much higher than
Birr 6.7 billion deficits seen a year ago. The deficit was financed by net external loan and domestic borrowing largely from non-bank sources.
Fig.VI.5: Federal Government Finance during Second Quarter of F.Y 2020/21
020000400006000080000
100000120000140000160000180000200000
2017/18 2018/19 2019/20 2020/21
(In M
illio
ns o
f Birr
)
Quarters/Years
Expenditure De�cit Revenue Including Grants

| 77
VII. Developments in Investment During the second quarter of 2020/21, five investment projects having investment capital of Birr 161.5 million became operational. Compared to last year same quarter, the number of investment projects slowed down by 50 percent while investment capital was increased by 62.1 percent.
Virtually, all of the investment projects reported was private foreign investment.
There was no domestic and public investment during the period under review.
These investment projects have generated employment opportunities for 725 employees which was 30.8 percent lower than the same quarter of last year. Of the total employment created during the period, 35.2 percent was permanent and 64.8 percent casual (Table 7.1).

78 | Second Quarter 2020/21
National Bank of Ethiopia Quarterly Bulletin
Table 7.1: Performance of Operational Investment ProjectsCapital (In millions of Birr)
Type of Projects Items2019/20 2020/21 Percentage
ChangesQII QI QIIA B C Share C/A C/B
1. Total Investment
Number of projects 10 16 5 100 -50.0 -68.8Capital 99.7 1,846.2 161.5 100 62.1 -91.3Permanent Employ-ment 387 36 255 100 -34.1 608.3
Temporary Employment 660 2 470 100 -28.8 23,400.0
2. Private Investment
Number of projects 10 16 5 100 -50.0 -68.8
Capital 99.7 1,846.2 161.5 100 62.1 -91.3Permanent Employ-ment 387 36 255 100 -34.1 608.3
Temporary Employment 660 2 470 100 -28.8 23,400.0
2.1 Domestic Investment
Number of projects 6 14 - - - -
Capital 51.4 75.7 - - - -Permanent Employ-ment 12 - - - - -
Temporary Employment 160 - - - - -
2.2. Foreign Investment
Number of projects 4 2 5 100 25.0 150.0
Capital 48.3 1,770.5 161.5 100 234.5 -90.9
Permanent Employ-ment 375 36 255 100 -32.0 608.3
Temporary Employment 500 2 470 100 -6.0 23,400.0
3. Public Investment
Number of projects - - - - - -Capital - - - - - -Permanent Employ-ment - - - - - -
Temporary Employment - - - - - -
Source: Ethiopian Investment Commission.
As for sectoral distribution, real estate, renting and business activities constituted the lion’s share by accounting 60 percent of total investment projects while that of manufacturing and others sector on their parts constitutes 20 percent each. Out of the total Birr 161.5 million capitals invested, manufacturing received 82.3 percent, real estate, renting and business activities 9.2 and others sector
8.4 percent (Table 7.2).
About 78.4 percent of the permanent employment was created by real estate, renting and business activities, 20.4 percent by manufacturing and 1.2 percent by other sectors. Conversely, real estate, renting and business activities constitute 100 percent of temporary labor force employed (Table 7.2).

| 79
Table 7.2: Investment Distribution by Sector during the Second Quarter of 2020/21
Sectors No. of Proj.
Share (%)
Capital (in Million Birr) Share (%) Perm.
Emp. Share (%) Temp. Emp. Share (%)
Agriculture, hunting and forestry - - - - - - - -
Construction - - - - - - - -Education - - - - - - - -Electricity, gas, steam and water supply - - - - - - - -
Health and social work - - - - - - - -Hotels and restaurants - - - - - - - -
Manufacturing 1 20.0 133.0 82.3 52 20.4 0
Mining and quarrying - - - - - - - -Other community, social and personal service activities
- - - - - - - -
Real estate, renting and business activities 3 60.0 14.9 9.2 200 78.4 470 100
Tour operation, trans-port, and communica-tion
- - - - - - - -
Wholesale, retail trade & repair service - - - - - - - -
Others* 1 20.0 13.6 8.4 3 1.2 0
Grand Total 5 100 161.5 100 255 100 470 100
Source: Ethiopian Investment Commission.
*Export of flowers, spices, cotton and cotton product, cly spots, wooden handicrafts, souvenirs and flower baskets, data canter services.
In terms of regional distribution, there was no project under operation during the review quarter while all projects presented were multi regional projects.
When compared with the preceding quarter multi regional projects show a remarkable step forward (Table 7.3).

80 | Second Quarter 2020/21
National Bank of Ethiopia Quarterly BulletinTa
ble
7.3:
Per
form
ance
of O
pera
tiona
l Inv
estm
ent P
roje
cts
by R
eigi
on
Region20
19/2
020
20/2
1G
row
th R
ate
QII
QI
QII
C/A
C/B
A B
C
Sh
are
In (%
)No of Proj
Capital
Perm emp
Temp emp
No of Proj
Capital
Perm emp
Temp emp
No of Proj
Capital
Perm emp
Temp emp
No of Proj
Capital
Perm emp
Temp emp
No of Proj
Capital.
Perm emp
Temp emp
No of Proj
Capital.
Perm emp
Temp emp
Ad
dis
Aba
ba7
57.4
1616
014
760
0-
--
--
--
--
--
--
--
Afa
r-
--
--
--
--
--
--
--
--
--
--
--
Am
hara
--
--
--
--
--
--
--
--
--
--
--
-
B.G
umuz
--
--
--
--
--
--
--
--
--
--
--
-
Dire
Daw
a-
--
--
--
--
--
--
--
--
--
--
--
Oro
mia
342
.337
150
0-
--
--
--
--
--
--
--
--
-
SNN
PR-
--
--
--
--
--
--
--
--
--
--
-
Gam
b-
--
--
--
--
--
--
--
--
--
--
-
Som
ali
--
--
--
--
--
--
--
--
--
--
--
Hara
ri-
--
--
--
--
--
--
--
--
--
--
-
Tigra
y-
--
--
--
--
--
--
--
--
--
--
-
Mul
ti-re
gion
al-
--
-2
1,77
036
25
162
255
470
100
100
100
100
--
--
150.
0-9
0.9
608.
323
,400
.0
Gra
nd T
otal
1099
.738
766
016
1,84
636
25
162
255
470
100
100
100
100
-50.
062
.1-3
4.1
-28.
8-6
8.8
-91.
360
8.3
23,4
00.0

| 81
VIII. INTERNATIONAL ECONOMIC DEVELOPMENTS8.1. Overview of the World Economy7
The global economy continued its recovery during the second quarter of 2020/21, despite new wave of the pandemic and associated containment measures. The global composite output PMI (excluding the euro area) improved for the second time in a row to 54.1 compared to 51.9 in the previous quarter. However, it showed marginal contraction in December, signalling some moderation in the momentum of economic recovery.
In the United States, economic growth is set to lose momentum slightly following a sharp recovery in the first quarter of 2020/21. Subdued consumer confidence, combined with rising number of daily new COVID-19 infections pose downside risks to economic activity. Despite the economy benefited from new fiscal stimulus, the weakness in the labour market prevails, as suggested by rising permanent job losses through November. The unemployment rate continued to be high at 6.7 percent in November, supported by a reduction in temporary layoffs.
In the United Kingdom, the rebound in economic activity remains weak by the end of the second quarter of 2020/21. Despite the agreement between EU and the UK diminishes the uncertainty surrounding the Brexit negotiations, the worsening pandemic situation and deteriorating labor market conditions
continue to weigh on consumer confidence and demand. Especially in UK, the emergence of a new variant of coronavirus prompts the government to implement nationwide lockdown in a bid to curb the rapidly spreading virus. As a result, monthly GDP data and surveys signal a decline in growth into negative territory in the second quarter of 2020/21.The composite PMI deteriorated to 50.5 vis-a-vis 57.5 of the previous quarter.
Japan is experiencing a stalled economic recovery during the second quarter of 2020/21, as the third wave of COVID-19 prompted additional lockdown measures. While consumption remained relatively robust, growth in industrial production weakened in November, while the services PMI continues to stand below the neutral threshold, signalling on going weakness. During the second quarter of 2020/21, the composite PMI remained low and stood at 48.2.
In China, real GDP growth during the second quarter of 2020/21 confirmed the continuation of robust recovery and broadening of the recovery momentum from investment towards consumption. During the period, China experienced a quarter on quarter GDP growth rate of 2.6 percent. PMI data also improved from 54.7 to 56.3 which signal that the economy is gaining strength as the pandemic remains broadly under control in China.
________________________________________________________________________________________
7 Section 8.1 - 8.3 are Extracted from Eurpean Central Bank Monthly Bulltein of 7/2020.
82 | Second Quarter 2020/21
National Bank of Ethiopia Quarterly Bulletin
8.2. Inflation Developments
Global inflation remained stable in November. Annual consumer price inflation in member countries of the Organization for Economic Co-operation and Development (OECD) remained unchanged at 1.2 percent in November. Similarly, annual OECD CPI inflation excluding food and energy stayed 1.6 percent. Global wage and price inflationary pressures are expected to remain contained amid ample spare capacity in most economies.
8.3 Commodity Price
Commodity prices have continued to show broad-based increases since the last Governing Council meeting, with oil and non-energy prices increasing by more than 10 percent during the month of December 2020 compare to previous month. The rebound in prices for most commodities is driven by a surge in global demand following the recovery from the COVID-19 shock. Demand from China for metals seems to be particularly strong. Copper prices have also been supported by government programs for renewable infrastructure projects and electric vehicles, which are usually copper- intensive. Food prices have
been supported by strong demand as governments stockpile and by supply disruptions as a result of hot and dry weather conditions in South America.
8.4 Exchange rate developments
In foreign exchange markets, the euro depreciated slightly in trade-weighted terms. Since 10 December 2020 data, the nominal effective exchange rate of the euro, as measured against the currencies of 42 of the euro area’s most important trading partners, depreciated by 0.7 percent. Regarding bilateral exchange rate developments, the euro depreciated against the pound sterling by 2.8 percent, mainly reflecting the pound’s appreciation following the conclusion of the Brexit process with the announcement of the EU-UK Trade and Cooperation Agreement. Amid stabilization in the global risk sentiment, the euro appreciated slightly against the Swiss franc (by 0.2 percent), while depreciating moderately against the Japanese yen (by 0.7 percent) and the US dollar (by 0.1 percent). The euro weakened against the Turkish Lira (by 5.4 percent) and the Chinese Renminbi (by 1.2 percent) and strengthened against the Brazilian real (by 4.5 percent).
| 83
8.5 Impact of Global Economic Development on Ethiopian Economy
During the second quarter of 2020/21, the global economy continued its recovery, but also the momentum slowing down afterwards. Likewise, global inflation remained stable. During the review quarter, the fast depreciation of Birr along with the relative price advantage of domestic economy over trading partners economy resulted in the REER to depreciate by 32.8 percent (The price advantage is highly influenced by Sudan’s rising inflation and REER, excluding Sudan, depreciated by 4.7 percent). Thus, it enhances international competitiveness of the country in global market. On the other hand, the decline in crude oil prices helps the country to save additional payments vis-à-vis relatively higher oil price a year ago, and avoided further suppressing impact on current account balance compared to last year the same period.

STATISTICAL TABLES

| 85
Table 1(a): Statement of Condition of National Bank of Ethipia: Assets
(In Millions of Birr)
End of Period
Foreign Assets Claims on GovernmentAdvance
to DBESilver Coins
Other AssetsTotal Gold Reserve
TrancheForeign
Exchange Others Total Bond Direct Advance Others
2008/09Qtr.I 8,636.72 15.01 110.78 8,010.33 500.60 44,270.98 9,692.98 34,578.00 - - - 2,516.61 Qtr.II 9,260.43 81.90 112.13 8,551.39 515.01 42,948.98 9,692.98 33,256.00 - - - 2,567.86 Qtr.III 13,284.94 8.60 120.45 12,580.96 574.93 42,248.98 9,692.98 32,556.00 - - - 2,690.57 Qtr.IV 17,214.61 18.17 127.45 16,488.13 580.86 44,498.73 9,607.73 34,891.00 - - - 2,627.60
2009/10Qtr.I 22,262.14 120.26 143.91 21,002.66 995.32 44,326.63 9,555.63 34,771.00 - - - 2,664.26 Qtr.II 23,445.68 287.33 144.34 22,018.26 995.76 43,610.83 9,555.63 34,055.20 - - - 2,705.57 Qtr.III 27,285.95 267.70 148.18 24,480.32 2,389.76 45,989.73 9,555.63 36,434.10 - - - 3,048.61 Qtr.IV 27,289.34 443.30 145.70 23,490.22 3,210.12 45,522.78 9,478.68 36,044.10 - - - 3,041.10
2010/11Qtr.I 35,852.22 490.52 184.31 31,229.17 3,948.22 47,983.68 9,426.58 38,557.10 - - - 3,150.64 Qtr.II 40,042.00 444.17 184.63 34,418.71 4,994.49 50,488.58 9,426.58 41,062.00 - - - 3,269.68 Qtr.III 45,367.31 1,636.24 192.33 38,413.88 5,124.86 51,930.58 9,426.58 42,504.00 - - - 7,413.23 Qtr.IV 51,551.39 1,395.23 195.67 44,738.80 5,221.68 55,614.64 9,349.64 46,265.00 - 6,250.00 - 7,650.19
2011/12Qtr.I 59,724.20 1,037.56 195.24 53,248.95 5,242.45 55,566.48 9,301.54 46,264.95 - 7,400.00 - 7,928.55 Qtr.II 51,965.40 479.44 193.30 46,056.19 5,236.48 55,562.48 9,297.54 46,264.95 - 10,070.00 - 10,747.88 Qtr.III 40,349.89 669.26 195.77 34,192.43 5,292.44 55,562.48 9,297.54 46,264.95 - 11,870.00 - 10,948.76 Qtr.IV 40,101.45 2,038.08 195.32 32,528.76 5,339.29 55,562.48 9,297.54 46,264.95 - 12,502.00 - 12,951.32
2012/13Qtr.I 44,307.75 (24.32) 201.51 38,671.89 5,458.67 55,510.38 9,245.44 46,264.95 - 12,502.00 - 16,383.71 Qtr.II 46,620.93 1,964.27 203.98 38,926.61 5,526.08 55,510.38 9,245.44 46,264.95 - 13,307.00 - 20,867.63 Qtr.III 50,358.05 1,310.29 201.42 43,334.32 5,512.02 59,510.38 9,245.44 50,264.95 - 14,807.00 - 25,469.44 Qtr.IV 44,140.03 2,253.17 201.78 36,078.39 5,606.69 64,510.38 9,245.44 55,264.95 - 16,507.00 - 20,560.93
2013/14 Qtr.I 46,471.52 2,656.15 209.91 37,900.27 5,705.18 64,381.33 9,116.39 55,264.95 - 16,807.00 - 25,388.28 Qtr.II 49,513.05 1,522.50 214.30 41,971.87 5,804.38 64,381.33 9,116.39 55,264.95 - 17,207.00 - 28,944.33 Qtr.III 45,838.73 1,333.55 217.05 38,439.61 5,848.52 73,381.33 9,116.39 64,264.95 - 17,507.00 - 26,128.62 Qtr.IV 50,624.47 1,217.59 218.41 43,237.44 5,951.02 73,304.39 9,039.44 64,264.95 - 20,257.00 - 25,566.64
2014/15Qtr.I 52,555.40 1,217.59 215.08 45,256.47 5,866.25 73,175.34 8,910.39 64,264.95 - 21,957.00 - 26,679.17 Qtr.II 74,840.58 741.24 317.35 67,914.12 5,867.87 78,175.34 8,910.39 69,264.95 - 22,157.00 - 27,953.04 Qtr.III 64,152.02 206.89 307.11 57,837.68 5,800.34 81,175.34 8,910.39 72,264.95 - 22,857.00 - 33,275.33 Qtr.IV 66,817.67 79.30 315.26 60,856.52 5,566.59 92,175.34 8,910.39 83,264.95 - 23,357.00 - 27,477.29
2015/16Qtr.I 65,085.59 (101.65) 318.69 59,349.29 5,519.27 99,657.34 8,392.40 91,264.95 - 23,857.00 - 27,240.74 Qtr.II 84,226.48 222.87 319.06 78,442.72 5,241.83 104,657.34 8,392.40 96,264.95 - 24,857.00 - 36,166.96 Qtr.III 72,889.54 1,136.99 325.65 66,362.68 5,064.22 104,657.34 8,392.40 96,264.95 - 24,857.00 - 49,245.99 Qtr.IV 74,156.73 1,113.92 331.50 67,851.69 4,859.62 109,080.40 8,315.45 100,764.95 - 25,607.00 - 53,471.19
2016/17Qtr.I 74,949.60 8.43 336.04 69,963.93 4,641.20 115,640.85 7,875.90 107,764.95 - 25,607.00 - 60,022.94 Qtr.II 72,397.44 1,139.58 326.66 66,561.06 4,370.15 120,640.85 7,875.90 112,764.95 - 26,107.00 - 60,244.19 Qtr.III 70,874.56 1,135.37 337.66 61,851.06 7,550.46 129,640.85 7,875.90 121,764.95 - 26,607.00 - 61,151.48 Qtr.IV 73,874.32 741.33 349.42 68,851.84 3,931.73 135,632.85 7,867.90 127,764.95 - 27,226.00 - 53,200.57
2017/18Qtr.I 68,636.42 0.01 359.52 64,643.51 3,633.38 150,632.85 7,867.90 142,764.95 - 27,226.00 - 53,714.62 Qtr.II 82,254.04 0.01 420.35 77,584.06 4,249.63 160,128.85 7,863.90 152,264.95 - 28,055.71 - 55,288.17 Qtr.III 85,287.93 81.43 432.67 80,464.52 4,309.30 160,128.85 7,863.90 152,264.95 - 29,992.71 - 54,691.37 Qtr.IV 77,617.37 750.54 418.41 72,217.34 4,231.09 160,128.85 7,863.90 152,264.95 - 47,292.71 - 56,407.16
2018/19Qtr.I 103,307.08 750.99 422.10 97,678.76 4,455.23 166,685.30 7,420.35 159,264.95 - 46,992.71 - 56,965.81 Qtr.II 110,973.71 750.54 423.72 105,145.06 4,654.41 178,685.30 7,420.35 171,264.95 - 52,092.71 - 57,949.69 Qtr.III 111,651.22 198.87 431.88 106,132.87 4,887.60 182,685.30 7,420.35 175,264.95 - 52,792.71 - 76,825.13 Qtr.IV 98,726.63 804.88 437.79 92,853.80 4,630.17 194,685.30 7,420.35 187,264.95 - 52,142.71 - 95,430.96
2019/20Qtr.I 69,790.04 15.26 435.36 64,693.13 4,646.29 199,237.75 6,972.80 192,264.95 - 52,142.71 - 106,893.95 Qtr.II 94,289.16 19.38 478.35 88,749.48 5,041.96 204,237.75 6,972.80 197,264.95 - 55,942.71 - 115,902.36 Qtr.III 80,407.49 316.70 488.33 74,412.19 5,190.27 221,237.75 6,972.80 214,264.95 - 55,242.71 - 120,561.48 Qtr.IV 112,086.32 3,280.63 525.42 102,412.06 5,868.20 230,237.75 199,237.75 31,000.00 - 58,142.71 - 148,024.70
2020/21 Qtr.I 120,432.59 5,033.13 563.29 108,717.20 6,118.98 243,141.31 198,362.65 44,778.66 - 57,642.71 - 139,732.21 Qtr.II 120,263.57 1,868.95 614.96 111,460.69 6,318.98 248,141.31 198,362.65 49,778.66 - 56,642.71 - 145,286.21

National Bank of Ethiopia Quarterly Bulletin
86 | Second Quarter 2020/21
Table 1(b): Statement of Condition of National Bank of Ethipia: Liabilities
(In Millions of Birr)
End of Period
Total Liab.= Assets
Currency (Notes
+ Coins)
Deposits Foreign Liabilities Capital Account
Other Liab.Total Gov't Banker Total Fund
Credit Others
2008/09Qtr.I 55,424.30 19,640.12 23,365.96 7,222.97 16,143.00 3,660.06 - 3,660.06 3,592.76 5,165.40 Qtr.II 54,777.27 20,870.35 25,148.92 6,215.84 18,933.09 3,123.02 - 3,123.02 2,088.31 3,546.68 Qtr.III 58,224.49 23,303.92 24,710.29 6,682.81 18,027.48 3,713.38 556.02 3,157.36 2,101.15 4,395.76 Qtr.IV 64,340.94 23,836.35 27,942.19 6,671.53 21,270.67 5,380.94 588.35 4,792.59 2,094.84 5,086.60
2009/10Qtr.I 69,253.03 22,773.23 31,494.51 7,373.32 24,121.19 8,049.53 2,127.19 5,922.33 1,588.53 5,347.24 Qtr.II 69,762.08 25,663.17 28,307.16 7,785.92 20,521.24 8,693.10 2,132.24 6,560.86 1,576.74 5,521.92 Qtr.III 76,324.29 27,277.96 30,107.70 7,036.56 23,071.13 10,995.53 2,188.91 8,806.62 1,576.18 6,366.93 Qtr.IV 75,853.22 28,802.93 26,803.98 6,182.46 20,621.52 11,906.03 2,152.27 9,753.76 1,574.95 6,765.34
2010/11Qtr.I 86,986.54 29,711.72 31,872.51 8,265.64 23,606.88 12,848.92 2,722.65 10,126.26 2,809.67 9,743.72 Qtr.II 93,800.26 33,949.03 32,141.88 9,369.75 22,772.12 15,062.65 4,769.71 10,292.95 2,757.53 9,889.18 Qtr.III 104,711.13 37,456.68 37,453.93 11,276.68 26,177.25 15,282.84 4,972.05 10,310.80 2,757.53 11,760.16 Qtr.IV 121,066.21 39,100.58 40,233.45 10,290.93 29,942.52 18,695.39 5,058.24 13,637.15 2,749.74 20,287.05
2011/12Qtr.I 130,619.23 38,732.57 48,523.29 19,133.30 29,389.99 20,368.49 5,047.27 15,321.22 8,848.06 14,146.82 Qtr.II 128,345.76 42,048.13 43,045.28 17,307.05 25,738.23 17,289.74 4,996.96 12,292.78 8,848.06 17,114.54 Qtr.III 118,731.13 44,710.64 29,832.27 11,962.11 17,870.17 15,825.84 5,060.88 10,764.96 8,831.80 19,530.58 Qtr.IV 121,117.25 45,785.24 30,405.78 10,218.40 20,187.38 18,847.12 5,049.31 13,797.81 4,841.48 21,237.65
2012/13Qtr.I 128,703.84 46,183.34 38,073.19 17,980.48 20,092.72 19,311.91 5,209.14 14,102.77 4,841.92 20,293.48 Qtr.II 136,305.95 50,971.94 36,872.57 12,778.13 24,094.44 20,263.30 5,273.03 14,990.27 4,833.78 23,364.36 Qtr.III 150,144.87 54,292.91 34,503.60 17,952.55 16,551.06 20,750.51 5,181.16 15,569.34 4,833.78 35,764.07 Qtr.IV 145,718.34 54,917.74 29,031.39 9,133.04 19,898.35 19,494.41 5,297.81 14,196.60 4,834.47 37,440.33
2013/14Qtr.I 153,048.13 50,571.65 37,323.17 16,548.01 20,775.16 23,064.82 5,426.52 17,638.30 4,842.06 37,246.44 Qtr.II 160,045.71 53,864.09 32,759.15 14,339.95 18,419.21 28,216.04 5,456.21 22,759.83 4,842.06 40,364.38 Qtr.III 162,855.69 61,372.47 35,971.75 12,807.36 23,164.39 22,394.73 5,468.90 16,925.83 4,842.06 38,274.68 Qtr.IV 169,752.50 64,355.05 33,760.96 8,793.48 24,967.48 23,910.57 5,685.44 18,225.13 4,849.06 42,876.86
2014/15Qtr.I 174,366.91 63,714.21 37,053.76 14,407.98 22,645.78 25,489.57 5,577.32 19,912.25 4,849.07 43,260.30 Qtr.II 203,125.95 70,709.06 33,899.35 13,882.20 20,017.15 46,447.12 5,577.32 40,869.81 4,849.07 47,221.36 Qtr.III 201,459.69 74,337.79 42,291.49 21,308.75 20,982.74 36,511.44 5,490.54 31,020.90 4,849.07 43,469.90 Qtr.IV 209,827.30 75,240.70 42,325.60 15,098.54 27,227.06 36,844.30 5,034.04 31,810.26 4,849.07 50,567.64
2015/16Qtr.I 215,840.68 74,745.66 48,887.10 31,740.19 17,146.91 36,004.39 4,988.41 31,015.98 4,849.20 51,354.33 Qtr.II 249,907.78 77,830.00 49,034.83 25,739.39 23,295.44 61,731.80 4,662.00 57,069.80 4,849.20 56,461.95 Qtr.III 251,649.87 80,258.93 45,004.03 20,077.26 24,926.76 59,027.31 4,479.63 54,547.68 4,849.20 62,510.41 Qtr.IV 262,315.31 82,592.70 50,614.34 14,042.32 36,572.02 63,650.30 4,271.47 59,378.84 4,849.20 60,608.76
2016/17Qtr.I 276,220.38 85,811.90 54,484.65 18,220.23 36,264.42 71,483.16 4,027.65 67,455.51 4,849.20 59,591.48 Qtr.II 279,389.48 90,247.04 53,908.66 15,628.13 38,280.53 66,855.56 3,645.20 63,210.36 4,849.20 63,529.02 Qtr.III 288,273.88 92,212.49 66,239.19 19,084.80 47,154.39 56,579.86 3,434.90 53,144.96 4,849.20 68,393.15 Qtr.IV 289,933.74 94,245.51 66,754.22 14,741.81 52,012.41 49,897.29 3,296.00 46,601.29 4,849.20 74,187.52
2017/18 Qtr.I 300,209.88 94,962.74 76,379.95 19,337.75 57,042.20 50,984.56 3,036.68 47,947.88 4,849.20 73,033.43 Qtr.II 325,726.77 105,936.80 61,913.44 16,680.94 45,232.50 70,862.22 3,239.47 67,622.75 4,849.20 82,165.11 Qtr.III 330,100.86 112,438.63 68,720.48 18,874.93 49,845.54 59,522.34 2,907.62 56,614.71 4,849.20 84,570.22 Qtr.IV 341,446.08 112,910.96 81,186.45 19,921.99 61,264.46 48,857.99 2,502.21 46,355.78 4,849.20 93,641.49
2018/19 Qtr.I 373,950.89 110,876.51 83,541.82 19,601.81 63,940.01 82,036.37 2,107.92 79,928.45 4,849.20 92,646.99 Qtr.II 399,701.41 120,349.03 73,912.83 23,783.26 50,129.57 99,909.75 1,802.49 98,107.25 4,849.20 100,680.60 Qtr.III 423,954.35 125,298.33 90,171.76 37,661.76 52,510.00 93,865.15 1,705.62 92,159.53 4,849.20 109,769.91
Qtr.IV 440,985.60 121,800.02 101,463.14 22,513.90 78,949.25 94,758.88 1,106.63 93,652.25 4,849.20 118,114.36 2019/20
Qtr.I 428,064.45 123,976.32 83,257.85 20,433.47 62,824.38 94,208.78 805.24 93,403.54 4,849.20 121,772.30 Qtr.II 470,371.98 128,071.58 99,917.83 30,939.51 68,978.32 111,833.99 530.84 111,303.15 4,849.20 125,699.38 Qtr.III 477,449.43 139,106.29 109,747.07 26,131.42 83,615.66 110,558.25 6,560.60 103,997.65 4,849.20 113,188.61 Qtr.IV 548,491.47 140,521.13 140,553.83 34,529.59 106,024.24 127,307.32 6,670.16 120,637.16 4,849.20 135,260.00
2020/21 Qtr.I 560,948.82 124,403.48 170,497.94 33,548.57 136,949.38 154,135.85 24,550.96 129,584.89 4,849.20 107,062.35 Qtr.II 570,333.80 138,864.54 151,544.16 31,702.07 119,842.09 172,023.04 24,979.40 147,043.65 1,013.45 106,888.61

| 87
Table 2(a): Statement of Condition of Commercial Banks: Assets
(In Millions of Birr)
End of Period
Total (2+3)
1
Reserves Cash in Hand
2
Deposits with NBE
3
Foreign Assets
4
Claims On Gov't
5
Total (7+8+9)
6
Claims on Non-Central Gov'tOther
Assets 10
Loans & Adv.
7
Invest- ment
8
Commercial Banks
92008/09
Qtr.I 17,673.90 3,302.53 14,371.38 7,726.62 6,234.94 50,116.36 34,397.64 14,818.58 900.13 26,922.77 Qtr.II 20,659.25 3,437.48 17,221.77 6,950.64 5,547.24 54,252.77 35,946.71 17,436.57 869.49 33,601.83 Qtr.III 21,886.74 4,039.91 17,846.83 8,093.58 5,548.90 57,041.57 37,079.81 18,852.70 1,109.06 31,611.17 Qtr.IV 23,690.72 4,121.34 19,569.38 9,219.66 5,409.36 57,651.07 38,802.03 17,614.51 1,234.53 49,113.08
2009/10Qtr.I 27,119.02 4,226.02 22,893.00 9,172.96 5,740.11 60,703.15 39,701.38 19,805.10 1,196.66 40,436.92 Qtr.II 24,371.67 3,907.33 20,464.34 9,731.23 5,177.56 65,942.83 44,092.84 20,297.50 1,552.48 48,475.03 Qtr.III 26,921.09 4,209.86 22,711.23 12,949.12 5,627.86 70,716.27 46,900.67 21,733.09 2,082.51 48,973.02 Qtr.IV 25,217.08 4,596.14 20,620.94 15,060.75 7,415.27 73,299.81 47,540.18 23,796.85 1,962.79 36,932.92
2010/11Qtr.I 28,768.06 5,861.80 22,906.26 19,245.97 5,480.72 75,434.99 48,436.98 25,124.50 1,873.51 38,067.24 Qtr.II 27,486.93 5,636.70 21,850.23 20,194.12 4,102.86 85,357.09 55,653.80 27,485.93 2,217.36 44,732.22 Qtr.III 31,482.17 6,921.98 24,560.19 21,148.87 4,953.20 100,590.17 62,088.83 35,549.12 2,952.21 52,150.16 Qtr.IV 34,282.97 6,525.70 27,757.27 28,394.16 3,568.67 110,114.46 61,871.31 45,547.45 2,695.70 49,545.00
2011/12Qtr.I 34,514.38 6,658.96 27,855.43 22,565.30 4,121.67 118,399.53 64,979.01 50,781.33 2,639.19 51,494.85 Qtr.II 30,154.47 5,773.53 24,380.95 23,089.59 2,857.24 135,328.52 75,725.45 58,171.12 1,431.94 63,801.94 Qtr.III 17,652.45 6,982.96 10,669.49 28,640.04 3,068.28 156,445.50 88,608.28 66,455.73 1,381.50 70,487.48 Qtr.IV 29,039.93 7,248.10 21,791.83 24,017.57 4,421.18 170,379.68 94,617.04 73,472.51 2,290.12 105,360.90
2012/13Qtr.I 27,882.48 8,265.81 19,616.67 20,182.74 8,511.89 171,722.32 94,081.93 75,849.86 1,790.53 83,987.99 Qtr.II 33,108.11 8,294.92 24,813.19 19,475.22 6,693.03 188,001.68 102,409.08 83,727.13 1,865.48 80,835.23 Qtr.III 32,417.53 9,150.51 23,267.02 23,412.02 5,407.49 208,833.85 113,423.09 92,141.62 3,269.14 103,959.36 Qtr.IV 30,375.31 9,236.07 21,139.24 28,509.18 5,699.97 222,393.59 114,378.39 99,396.97 8,618.23 82,403.13
2013/14Qtr.I 31,747.72 9,699.16 22,048.56 22,706.08 4,089.11 228,006.18 112,906.99 106,635.50 8,463.70 75,318.88 Qtr.II 29,413.17 9,778.39 19,634.78 20,170.98 3,464.05 253,312.63 127,152.46 117,797.59 8,362.58 68,754.51 Qtr.III 34,921.78 11,397.19 23,524.59 21,162.46 1,753.80 272,894.01 138,291.24 126,344.08 8,258.68 66,924.58 Qtr.IV 35,672.30 11,179.02 24,493.28 27,253.50 1,629.68 288,212.71 141,975.83 136,904.30 9,332.58 70,099.87
2014/15 Qtr.I 38,690.72 12,931.48 25,759.24 19,597.01 1,227.50 297,817.51 144,435.07 144,679.15 8,703.29 69,897.16 Qtr.II 35,148.79 12,580.20 22,568.59 18,800.84 1,246.35 329,512.50 162,570.66 159,004.32 7,937.52 68,417.37 Qtr.III 35,280.66 13,872.76 21,407.90 15,862.13 1,252.35 355,615.38 179,552.27 173,479.03 2,584.09 78,370.49 Qtr.IV 42,342.37 14,779.78 27,562.60 15,924.15 1,256.02 379,393.58 185,501.92 191,246.21 2,645.44 79,584.26
2015/16Qtr.I 39,809.59 15,337.93 24,471.66 15,463.04 905.43 390,966.45 188,671.02 199,896.80 2,398.62 79,531.90 Qtr.II 37,943.40 14,322.94 23,620.46 18,368.24 905.43 421,417.51 206,946.76 212,968.82 1,501.93 87,671.16 Qtr.III 40,401.93 14,635.18 25,766.75 21,316.42 905.43 445,653.52 219,399.61 225,001.87 1,252.04 92,444.68 Qtr.IV 50,905.91 15,906.53 34,999.38 20,898.27 785.65 461,664.43 226,849.25 231,953.28 2,861.91 98,731.37
2016/17Qtr.I 53,728.78 17,326.81 36,401.97 21,116.01 554.28 475,564.62 231,569.06 240,872.08 3,123.48 106,597.14 Qtr.II 54,499.76 16,544.49 37,955.27 20,370.84 554.28 509,890.48 253,196.53 252,915.43 3,778.52 101,539.01 Qtr.III 64,854.52 17,034.56 47,819.97 20,975.60 530.28 544,327.92 272,606.06 267,906.04 3,815.82 109,207.67 Qtr.IV 75,305.69 20,327.77 54,977.93 24,876.54 21,982.71 582,426.70 283,911.51 294,089.24 4,425.95 111,779.13
2017/18 Qtr.I 81,683.92 21,035.73 60,648.19 25,253.39 22,208.82 594,599.99 288,878.52 300,579.22 5,142.26 110,830.25 Qtr.II 68,091.40 19,152.65 48,938.76 26,326.86 22,186.62 635,646.86 308,050.08 322,392.50 5,204.29 120,419.44 Qtr.III 74,352.05 21,843.87 52,508.19 24,664.20 22,186.62 673,008.41 327,935.85 338,881.74 6,190.82 129,191.54 Qtr.IV 89,611.48 26,493.67 63,117.81 25,121.57 22,186.62 714,685.11 346,314.30 359,418.93 8,951.88 137,783.39
2018/19Qtr.I 91,062.85 27,496.50 63,566.35 30,835.45 22,567.12 731,013.59 355,971.41 364,102.91 10,939.27 151,722.28 Qtr.II 85,123.08 28,156.45 56,966.63 28,357.05 22,521.73 779,265.80 392,263.57 378,472.13 8,530.10 165,243.37 Qtr.III 82,819.61 28,223.23 54,596.38 26,880.84 22,952.93 843,659.70 418,777.00 417,474.71 7,408.00 168,443.19 Qtr.IV 118,506.49 29,783.05 88,723.44 28,543.82 23,620.21 898,733.08 443,362.21 447,380.43 7,990.45 170,578.44
2019/20 Qtr.I 116,740.09 32,453.58 84,286.51 25,980.84 22,927.78 928,496.12 463,151.74 456,261.93 9,082.46 211,425.69 Qtr.II 117,120.70 29,406.33 87,714.37 23,973.08 23,123.42 977,370.59 512,299.58 456,233.83 8,837.18 232,194.69 Qtr.III 114,998.82 29,771.00 85,227.82 24,606.29 22,927.78 1,025,047.29 528,438.89 487,766.96 8,841.44 257,616.79 Qtr.IV 136,738.41 31,449.32 105,289.09 35,116.52 28,838.49 1,074,869.20 571,811.98 490,492.71 12,564.51 219,185.38
2020/21 Qtr.I 184,698.60 59,737.43 124,961.18 33,204.14 36,506.06 1,126,390.63 611,983.47 500,592.74 13,814.42 233,131.04 Qtr.II 146,676.51 30,538.49 116,138.02 43,367.05 32,698.32 1,203,355.10 660,534.64 526,006.13 16,814.34 259,022.95

National Bank of Ethiopia Quarterly Bulletin
88 | Second Quarter 2020/21
Table 2(b): Statement of Condition of Commercial Banks: Liabilities
(In Millions of Birr)
End of Period
Total (Liab.= Assets)
1
Non-Central Gov't Deposits
Gov't Depos.
6
Foreign Liab.
7
Capital Account
Other Liab.
12
Total (3+4+5)
2Demand
3Time
4Saving
5
Total (9+10+11)
8 Capital 9
Legal Reserve
10Others
112008/09
Qtr.I 108,674.58 56,010.62 21,545.78 3,001.17 31,463.68 8,410.60 2,315.51 9,645.17 6,733.48 1,230.03 1,681.66 32,292.69 Qtr.II 121,011.72 59,279.79 23,758.17 2,977.84 32,543.78 10,336.00 2,854.59 10,537.09 7,140.83 1,251.78 2,144.49 38,004.24 Qtr.III 124,181.95 62,157.88 24,447.53 3,051.31 34,659.04 11,766.01 2,801.54 11,577.30 7,188.23 1,251.88 3,137.19 35,879.23 Qtr.IV 145,083.89 64,134.18 23,737.09 3,248.37 37,148.72 10,450.06 3,076.51 10,286.27 7,289.87 1,817.11 1,179.29 57,136.87
2009/10Qtr.I 143,172.15 69,799.47 26,482.89 3,502.06 39,814.53 10,193.02 3,856.62 11,615.74 7,351.48 1,864.96 2,399.30 47,707.30 Qtr.II 153,698.31 70,853.05 25,540.12 3,498.80 41,814.13 12,446.66 3,690.78 12,382.87 7,779.28 1,999.39 2,604.20 54,324.95 Qtr.III 165,187.35 76,068.96 28,137.85 3,568.66 44,362.45 14,542.87 3,960.93 13,733.68 7,988.50 1,999.39 3,745.79 56,880.92 Qtr.IV 157,925.83 81,081.39 29,083.62 3,956.21 48,041.57 13,742.50 3,254.28 12,410.85 8,104.15 2,627.14 1,679.56 47,436.80
2010/11Qtr.I 166,996.99 85,850.72 30,488.06 3,901.29 51,461.37 13,830.65 4,246.06 16,074.71 8,251.77 2,800.15 5,022.79 46,994.83 Qtr.II 181,873.22 90,753.82 33,017.73 3,860.06 53,876.03 17,847.47 4,942.59 15,372.02 8,814.85 2,875.59 3,681.59 52,957.32 Qtr.III 210,324.55 101,160.55 36,557.44 4,462.70 60,140.41 22,023.33 5,595.24 17,203.71 8,993.68 2,875.59 5,334.44 64,341.73 Qtr.IV 225,905.26 114,155.42 44,949.45 4,666.41 64,539.56 20,240.72 5,715.48 15,598.31 9,352.30 3,720.04 2,525.97 70,195.32
2011/12Qtr.I 231,095.73 119,908.86 47,241.19 4,679.92 67,987.76 20,211.73 6,441.17 18,039.70 9,463.93 3,873.96 4,701.81 66,494.27 Qtr.II 255,231.76 120,849.46 44,105.79 5,165.29 71,578.38 27,669.07 8,419.69 20,118.90 10,273.75 4,082.96 5,762.20 78,174.64 Qtr.III 276,293.75 135,663.57 49,133.42 10,136.38 76,393.77 30,994.76 7,392.24 23,505.51 10,588.88 4,082.96 8,833.67 78,737.68 Qtr.IV 333,219.25 152,894.71 58,345.81 12,061.06 82,487.84 28,207.85 5,484.21 26,333.75 10,766.19 4,341.88 11,225.68 120,298.72
2012/13Qtr.I 312,287.41 154,727.02 55,112.80 12,112.46 87,501.75 29,560.96 5,873.98 22,096.52 10,848.48 5,848.45 5,399.59 100,028.94 Qtr.II 328,113.27 163,882.22 57,818.51 12,930.05 93,133.66 35,693.26 6,078.30 23,819.49 11,410.19 6,095.88 6,313.43 98,639.99 Qtr.III 374,030.25 181,078.62 66,836.46 13,515.66 100,726.49 34,173.15 6,038.08 26,732.87 11,848.34 6,095.79 8,788.74 126,007.54 Qtr.IV 369,381.17 189,762.82 69,253.31 14,278.69 106,230.82 39,111.79 7,515.18 23,668.93 16,207.65 3,737.13 3,724.15 109,322.44
2013/14Qtr.I 361,867.96 196,546.98 67,873.86 15,611.58 113,061.54 30,347.65 7,787.68 27,244.86 16,648.31 4,289.25 6,307.29 99,940.79 Qtr.II 375,115.34 208,389.34 69,703.14 15,928.74 122,757.46 35,196.57 7,933.50 29,890.38 18,021.29 4,432.14 7,436.95 93,705.55 Qtr.III 397,656.63 223,632.13 71,185.39 17,192.59 135,254.15 41,483.14 7,843.13 34,089.20 19,040.22 4,452.88 10,596.10 90,609.01 Qtr.IV 422,868.05 244,630.10 80,947.33 17,872.27 145,810.51 39,210.84 7,995.09 28,116.57 19,412.60 4,874.11 3,829.87 102,915.44
2014/15Qtr.I 427,229.91 253,720.44 79,404.57 18,878.38 155,437.49 34,524.85 7,599.61 33,579.69 19,576.17 6,809.31 7,194.22 97,805.31 Qtr.II 453,125.86 267,761.37 82,145.60 21,324.70 164,291.07 41,958.38 7,784.85 35,980.61 20,786.66 7,102.85 8,091.10 99,640.66 Qtr.III 486,381.01 288,748.61 87,992.92 37,731.13 163,024.57 39,876.94 7,985.81 41,100.74 21,089.10 7,150.07 12,861.57 108,668.91 Qtr.IV 518,500.38 310,905.47 94,282.90 41,990.59 174,631.98 47,597.57 8,326.57 46,345.99 21,607.18 7,657.37 17,081.44 105,324.78
2015/16Qtr.I 526,676.42 321,277.08 94,511.03 44,846.83 181,919.21 44,750.57 8,351.74 40,988.33 21,854.91 10,061.03 9,072.39 111,308.70 Qtr.II 566,305.74 333,108.04 95,784.87 45,039.02 192,284.15 54,814.93 9,418.30 44,605.48 22,365.60 10,260.55 11,979.33 124,358.98 Qtr.III 600,721.98 346,500.77 97,666.68 47,318.84 201,515.25 55,903.51 10,021.13 50,099.86 23,925.73 10,503.55 15,670.58 138,196.72 Qtr.IV 632,985.63 378,580.10 111,923.51 49,622.31 217,034.28 48,275.36 9,880.50 54,282.67 24,741.97 11,066.22 18,474.49 141,967.00
2016/17 Qtr.I 657,560.82 395,283.96 114,563.30 52,113.56 228,607.10 48,122.05 10,224.60 48,306.09 25,430.72 13,555.78 9,319.59 155,624.12 Qtr.II 686,854.36 422,592.69 122,551.62 56,019.12 244,021.95 59,973.04 9,442.47 53,837.72 25,907.50 14,058.71 13,871.51 141,008.44 Qtr.III 739,896.00 459,035.83 134,885.28 59,330.90 264,819.66 59,514.06 9,775.09 58,827.88 28,022.68 14,160.64 16,644.56 152,743.14 Qtr.IV 816,370.77 499,497.48 142,883.04 63,182.74 293,431.70 57,431.90 10,818.77 91,591.79 60,893.89 9,875.33 20,822.57 157,030.82
2017/18 Qtr.I 834,576.37 528,377.97 155,587.95 65,890.63 306,899.39 57,282.65 11,920.65 82,506.03 61,439.56 11,571.16 9,495.31 154,489.07 Qtr.II 872,671.18 557,368.92 161,094.75 71,726.79 324,547.38 65,662.50 15,190.78 82,934.75 62,190.72 12,080.49 8,663.54 151,514.23 Qtr.III 923,402.82 605,324.66 178,222.22 74,478.38 352,624.07 66,838.21 14,436.48 88,987.79 63,762.86 12,299.12 12,925.81 147,815.69 Qtr.IV 989,388.16 654,155.59 194,737.37 76,868.79 382,549.43 60,390.64 14,504.75 95,507.04 66,196.61 12,595.70 16,714.73 164,830.14
2018/19 Qtr.I 1,027,201.29 668,751.40 182,882.17 78,698.46 407,170.77 66,445.07 14,163.89 94,700.64 67,062.59 14,917.55 12,720.51 183,140.28 Qtr.II 1,080,511.02 696,969.21 185,405.32 81,465.14 430,098.75 78,865.30 15,913.29 103,262.58 69,816.60 16,293.97 17,152.00 185,500.64 Qtr.III 1,144,756.26 734,934.84 186,067.65 86,071.53 462,795.66 84,437.25 17,251.34 114,740.74 71,712.80 17,604.93 25,423.00 193,392.10 Qtr.IV 1,239,982.05 794,735.58 216,920.17 90,513.29 487,302.12 85,992.40 18,006.38 123,412.65 73,711.99 17,916.21 31,784.45 217,835.04
2019/20 Qtr.I 1,305,570.51 818,414.16 225,668.94 90,546.90 502,198.32 79,401.21 18,605.21 120,129.32 74,852.82 21,407.51 23,869.00 269,020.62 Qtr.II 1,373,782.48 851,887.36 233,018.82 89,720.91 529,147.63 85,267.44 21,056.84 123,826.12 77,283.99 23,471.46 23,070.67 291,744.72 Qtr.III 1,445,196.96 877,428.13 246,556.75 80,765.27 550,106.12 87,691.14 23,358.51 136,459.58 80,471.39 23,493.66 32,494.53 320,259.61 Qtr.IV 1,494,747.98 928,574.53 251,513.71 87,886.77 589,174.06 87,466.56 24,579.24 134,232.91 82,108.81 23,579.76 28,544.34 319,894.74
2020/21 Qtr.I 1,613,930.46 1,020,322.63 269,917.20 91,583.91 658,821.52 97,699.75 27,650.16 132,885.23 83,326.31 26,401.11 23,157.80 335,372.71
Qtr.II 1,685,119.93 1,069,388.57 282,154.65 89,154.94 698,078.98 109,414.14 30,184.61 133,129.90 86,224.23 27,173.26 19,732.41 343,002.71
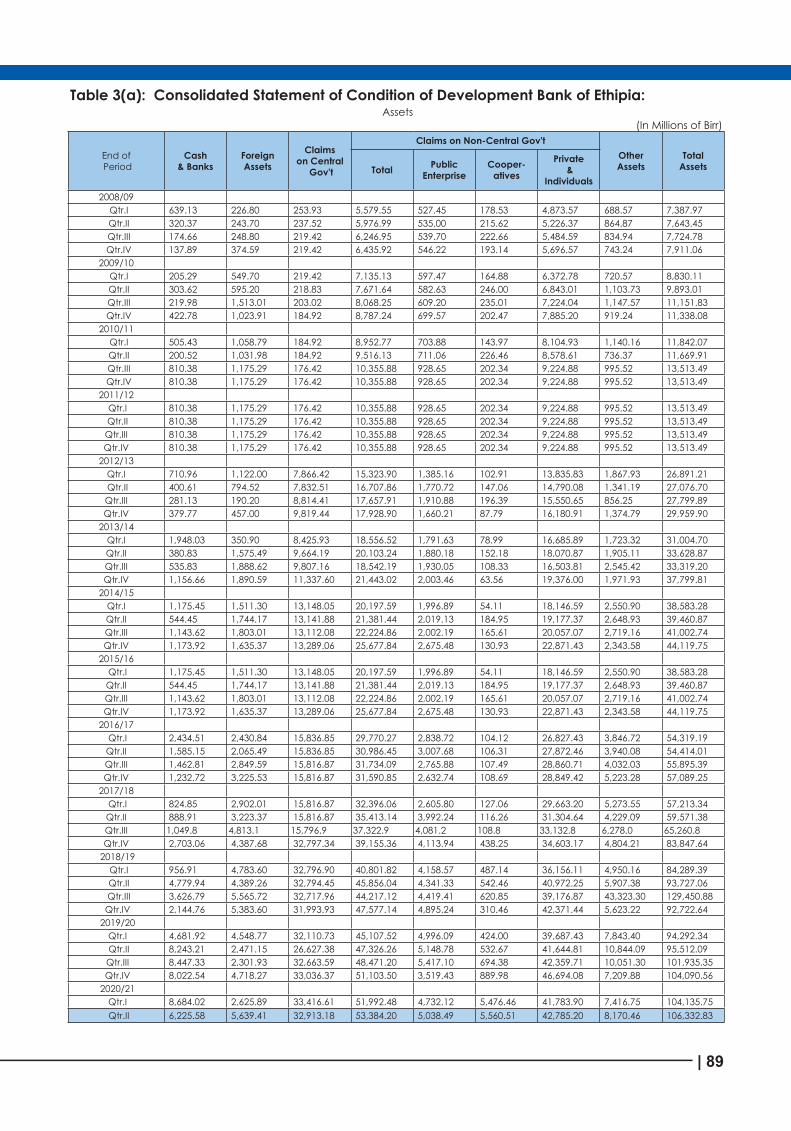
| 89
Table 3(a): Consolidated Statement of Condition of Development Bank of Ethipia: Assets
(In Millions of Birr)
End of Period
Cash & Banks
Foreign Assets
Claims on Central
Gov't
Claims on Non-Central Gov'tOther Assets
Total AssetsTotal Public
EnterpriseCooper-
atives
Private &
Individuals2008/09
Qtr.I 639.13 226.80 253.93 5,579.55 527.45 178.53 4,873.57 688.57 7,387.97 Qtr.II 320.37 243.70 237.52 5,976.99 535.00 215.62 5,226.37 864.87 7,643.45 Qtr.III 174.66 248.80 219.42 6,246.95 539.70 222.66 5,484.59 834.94 7,724.78 Qtr.IV 137.89 374.59 219.42 6,435.92 546.22 193.14 5,696.57 743.24 7,911.06 2009/10
Qtr.I 205.29 549.70 219.42 7,135.13 597.47 164.88 6,372.78 720.57 8,830.11 Qtr.II 303.62 595.20 218.83 7,671.64 582.63 246.00 6,843.01 1,103.73 9,893.01 Qtr.III 219.98 1,513.01 203.02 8,068.25 609.20 235.01 7,224.04 1,147.57 11,151.83 Qtr.IV 422.78 1,023.91 184.92 8,787.24 699.57 202.47 7,885.20 919.24 11,338.08 2010/11
Qtr.I 505.43 1,058.79 184.92 8,952.77 703.88 143.97 8,104.93 1,140.16 11,842.07 Qtr.II 200.52 1,031.98 184.92 9,516.13 711.06 226.46 8,578.61 736.37 11,669.91 Qtr.III 810.38 1,175.29 176.42 10,355.88 928.65 202.34 9,224.88 995.52 13,513.49 Qtr.IV 810.38 1,175.29 176.42 10,355.88 928.65 202.34 9,224.88 995.52 13,513.49 2011/12
Qtr.I 810.38 1,175.29 176.42 10,355.88 928.65 202.34 9,224.88 995.52 13,513.49 Qtr.II 810.38 1,175.29 176.42 10,355.88 928.65 202.34 9,224.88 995.52 13,513.49 Qtr.III 810.38 1,175.29 176.42 10,355.88 928.65 202.34 9,224.88 995.52 13,513.49 Qtr.IV 810.38 1,175.29 176.42 10,355.88 928.65 202.34 9,224.88 995.52 13,513.49
2012/13 Qtr.I 710.96 1,122.00 7,866.42 15,323.90 1,385.16 102.91 13,835.83 1,867.93 26,891.21 Qtr.II 400.61 794.52 7,832.51 16,707.86 1,770.72 147.06 14,790.08 1,341.19 27,076.70 Qtr.III 281.13 190.20 8,814.41 17,657.91 1,910.88 196.39 15,550.65 856.25 27,799.89 Qtr.IV 379.77 457.00 9,819.44 17,928.90 1,660.21 87.79 16,180.91 1,374.79 29,959.90
2013/14 Qtr.I 1,948.03 350.90 8,425.93 18,556.52 1,791.63 78.99 16,685.89 1,723.32 31,004.70 Qtr.II 380.83 1,575.49 9,664.19 20,103.24 1,880.18 152.18 18,070.87 1,905.11 33,628.87 Qtr.III 535.83 1,888.62 9,807.16 18,542.19 1,930.05 108.33 16,503.81 2,545.42 33,319.20 Qtr.IV 1,156.66 1,890.59 11,337.60 21,443.02 2,003.46 63.56 19,376.00 1,971.93 37,799.81
2014/15Qtr.I 1,175.45 1,511.30 13,148.05 20,197.59 1,996.89 54.11 18,146.59 2,550.90 38,583.28 Qtr.II 544.45 1,744.17 13,141.88 21,381.44 2,019.13 184.95 19,177.37 2,648.93 39,460.87 Qtr.III 1,143.62 1,803.01 13,112.08 22,224.86 2,002.19 165.61 20,057.07 2,719.16 41,002.74 Qtr.IV 1,173.92 1,635.37 13,289.06 25,677.84 2,675.48 130.93 22,871.43 2,343.58 44,119.75
2015/16 Qtr.I 1,175.45 1,511.30 13,148.05 20,197.59 1,996.89 54.11 18,146.59 2,550.90 38,583.28 Qtr.II 544.45 1,744.17 13,141.88 21,381.44 2,019.13 184.95 19,177.37 2,648.93 39,460.87 Qtr.III 1,143.62 1,803.01 13,112.08 22,224.86 2,002.19 165.61 20,057.07 2,719.16 41,002.74 Qtr.IV 1,173.92 1,635.37 13,289.06 25,677.84 2,675.48 130.93 22,871.43 2,343.58 44,119.75
2016/17 Qtr.I 2,434.51 2,430.84 15,836.85 29,770.27 2,838.72 104.12 26,827.43 3,846.72 54,319.19 Qtr.II 1,585.15 2,065.49 15,836.85 30,986.45 3,007.68 106.31 27,872.46 3,940.08 54,414.01 Qtr.III 1,462.81 2,849.59 15,816.87 31,734.09 2,765.88 107.49 28,860.71 4,032.03 55,895.39 Qtr.IV 1,232.72 3,225.53 15,816.87 31,590.85 2,632.74 108.69 28,849.42 5,223.28 57,089.25
2017/18 Qtr.I 824.85 2,902.01 15,816.87 32,396.06 2,605.80 127.06 29,663.20 5,273.55 57,213.34 Qtr.II 888.91 3,223.37 15,816.87 35,413.14 3,992.24 116.26 31,304.64 4,229.09 59,571.38 Qtr.III 1,049.8 4,813.1 15,796.9 37,322.9 4,081.2 108.8 33,132.8 6,278.0 65,260.8Qtr.IV 2,703.06 4,387.68 32,797.34 39,155.36 4,113.94 438.25 34,603.17 4,804.21 83,847.64
2018/19 Qtr.I 956.91 4,783.60 32,796.90 40,801.82 4,158.57 487.14 36,156.11 4,950.16 84,289.39 Qtr.II 4,779.94 4,389.26 32,794.45 45,856.04 4,341.33 542.46 40,972.25 5,907.38 93,727.06 Qtr.III 3,626.79 5,565.72 32,717.96 44,217.12 4,419.41 620.85 39,176.87 43,323.30 129,450.88 Qtr.IV 2,144.76 5,383.60 31,993.93 47,577.14 4,895.24 310.46 42,371.44 5,623.22 92,722.64
2019/20 Qtr.I 4,681.92 4,548.77 32,110.73 45,107.52 4,996.09 424.00 39,687.43 7,843.40 94,292.34 Qtr.II 8,243.21 2,471.15 26,627.38 47,326.26 5,148.78 532.67 41,644.81 10,844.09 95,512.09 Qtr.III 8,447.33 2,301.93 32,663.59 48,471.20 5,417.10 694.38 42,359.71 10,051.30 101,935.35 Qtr.IV 8,022.54 4,718.27 33,036.37 51,103.50 3,519.43 889.98 46,694.08 7,209.88 104,090.56
2020/21 Qtr.I 8,684.02 2,625.89 33,416.61 51,992.48 4,732.12 5,476.46 41,783.90 7,416.75 104,135.75 Qtr.II 6,225.58 5,639.41 32,913.18 53,384.20 5,038.49 5,560.51 42,785.20 8,170.46 106,332.83

National Bank of Ethiopia Quarterly Bulletin
90 | Second Quarter 2020/21
Table 3(b): Consolidated Statement of Condition of Development Bank of Ethiopia: Liablities
(In Millions of Birr)
End of Period
Total Assets =Liab.
Demand Deposits
Time & Savings Deposits
Capital Accounts
Credit from Banks Credit from Gov't
Foreign Advance
& Loan
Other Liability Items
Total N.B.E Others
2007/08 Qtr.I 6,464.22 16.49 477.48 1,867.24 1,888.28 381.38 1,506.91 0.73 434.30 1,779.70 Qtr.II 6,866.96 37.08 400.44 1,883.01 2,087.51 381.38 1,706.13 0.73 457.07 2,001.12 Qtr.III 6,855.30 46.45 369.30 1,916.16 2,091.11 381.38 1,709.73 0.73 505.37 1,926.19 Qtr.IV 6,969.97 126.04 374.55 1,910.00 2,102.17 381.38 1,720.80 - 506.10 1,951.11 2008/09
Qtr.I 7,387.97 186.97 379.06 1,915.86 2,338.59 381.38 1,957.21 - 522.99 2,044.51 Qtr.II 7,643.45 141.72 381.25 1,943.46 2,340.03 381.38 1,958.66 - 522.99 2,314.00 Qtr.III 7,724.78 101.98 385.09 1,948.81 2,341.20 381.38 1,959.83 - 647.27 2,300.42 Qtr.IV 7,911.06 124.71 369.44 1,934.17 2,341.61 381.38 1,960.23 - 647.27 2,493.87 2009/10
Qtr.I 8,830.11 123.42 372.51 2,014.71 2,571.28 424.28 2,147.00 - 887.86 2,860.32 Qtr.II 9,893.01 75.21 368.93 1,943.13 3,028.71 424.28 2,604.43 - 900.46 3,576.57 Qtr.III 11,151.83 85.62 369.09 2,084.50 4,228.26 424.28 3,803.98 884.48 3,499.86 Qtr.IV 11,338.08 178.96 376.24 2,124.68 4,618.87 381.38 4,237.49 - 978.67 3,060.66 2010/11
Qtr.I 11,842.07 141.50 382.37 2,357.45 4,799.25 381.38 4,417.87 - 984.95 3,176.56 Qtr.II 11,669.91 235.16 384.03 2,223.63 4,951.89 381.38 4,570.51 - 908.98 2,966.22 Qtr.III 13,513.49 414.91 373.25 2,224.88 6,403.06 381.38 6,021.69 - 997.65 3,099.73 Qtr.IV 13,513.49 414.91 373.25 2,224.88 6,403.06 381.38 6,021.69 - 997.65 3,099.73
2011/12 Qtr.I 13,513.49 414.91 373.25 2,224.88 6,403.06 381.38 6,021.69 - 997.65 3,099.73 Qtr.II 13,513.49 414.91 373.25 2,224.88 6,403.06 381.38 6,021.69 - 997.65 3,099.73 Qtr.III 13,513.49 414.91 373.25 2,224.88 6,403.06 381.38 6,021.69 - 997.65 3,099.73 Qtr.IV 13,513.49 414.91 373.25 2,224.88 6,403.06 381.38 6,021.69 - 997.65 3,099.73
2012/13 Qtr.I 26,891.21 374.79 384.09 2,738.96 17,154.13 642.47 16,511.66 - 1,209.71 5,029.53 Qtr.II 27,076.70 376.31 384.43 2,856.36 16,348.79 643.96 15,704.84 - 1,539.14 5,571.66 Qtr.III 27,799.89 355.69 375.75 3,157.21 18,741.44 739.97 18,001.47 - 1,771.24 4,360.49 Qtr.IV 29,959.90 347.35 380.85 3,150.26 20,889.93 610.14 20,279.79 - 2,301.22 2,677.78
2013/14 Qtr.I 31,004.70 298.98 390.46 3,390.94 21,434.53 17,667.54 3,766.99 - 2,371.60 2,922.88 Qtr.II 33,628.87 248.02 377.34 3,620.17 21,340.36 17,792.14 3,548.22 - 2,928.57 5,114.42 Qtr.III 33,319.20 348.34 378.01 3,763.50 21,746.54 18,101.57 3,644.98 - 3,105.66 3,977.49 Qtr.IV 37,799.81 634.91 376.94 3,567.64 27,234.63 20,851.57 6,383.06 - 3,409.38 2,576.31
2014/15 Qtr.I 38,583.28 656.73 380.48 3,895.22 25,430.93 22,551.57 2,879.37 - 3,621.73 4,598.20 Qtr.II 39,460.87 298.59 377.50 4,086.65 25,618.79 22,751.16 2,867.64 - 3,769.99 5,309.35 Qtr.III 41,002.74 300.40 376.13 4,082.93 26,599.74 23,451.57 3,148.17 - 3,880.62 5,762.93 Qtr.IV 44,119.75 427.25 376.39 4,255.64 27,411.00 23,951.57 3,459.43 - 4,030.99 7,618.49
2014/15 Qtr.I 47,977.82 445.92 375.43 7,688.46 27,369.19 23,857.00 3,512.19 - 4,018.53 8,080.30 Qtr.II 50,132.21 436.66 375.25 7,792.09 28,428.52 24,857.00 3,571.52 - 4,627.47 8,472.23 Qtr.III 51,587.15 1,006.51 376.27 7,858.82 28,464.89 24,935.93 3,528.96 - 4,727.40 9,153.27 Qtr.IV 52,696.45 1,040.13 376.63 7,968.72 29,328.36 29,251.50 76.86 - 4,726.81 9,255.80
2016/17Qtr.I 54,319.19 1,251.79 381.92 7,834.36 31,771.85 31,711.64 60.21 - 4,795.67 8,283.60 Qtr.II 54,414.01 903.62 380.51 7,876.92 33,091.64 33,033.92 57.72 - 4,816.88 7,344.45 Qtr.III 55,895.39 868.19 120.03 7,960.91 34,190.12 34,131.51 58.61 - 4,826.26 7,929.88 Qtr.IV 57,089.25 948.38 122.21 7,918.92 34,984.44 34,309.69 674.75 - 4,822.20 8,293.11
2017/18 Qrt.I 57,213.34 915.76 126.04 8,032.78 35,365.33 35,304.91 60.42 - 5,096.40 7,677.04 Qtr.II 59,571.38 1,130.53 125.90 7,999.87 37,888.62 37,832.63 55.99 - 5,226.40 7,200.05 Qtr.III 65,260.76 1,102.03 125.95 8,048.34 40,102.10 40,043.12 58.98 - 6,291.98 9,590.37 Qtr.IV 83,847.64 1,081.46 125.29 8,043.84 58,125.10 58,064.08 61.02 - 6,849.05 9,622.90
2018/19 Qtr.I 84,289.39 867.51 129.39 7,461.41 58,247.52 58,185.11 62.41 - 8,111.85 9,471.70 Qtr.II 93,727.06 818.33 128.26 2,718.41 63,592.57 63,529.89 62.69 - 8,195.19 18,274.31 Qtr.III 129,450.88 805.96 123.96 6,315.02 64,040.86 63,982.41 58.45 - 8,552.23 49,612.86 Qtr.IV 92,722.64 770.33 123.73 7,403.15 62,764.43 62,704.89 59.54 - 9,391.53 12,269.47
2019/20 Qrt.I 94,292.34 653.41 121.49 7,873.78 63,285.34 63,225.60 59.74 - 10,467.84 11,890.49 Qtr.II 95,512.09 581.89 121.27 7,023.65 61,046.46 60,986.28 60.18 - 10,476.70 16,262.12 Qrt.III 101,935.35 594.94 121.56 7,049.90 65,982.91 65,922.26 60.65 - 11,096.39 17,089.65 QIV 104,090.56 664.86 125.09 6,922.46 68,416.90 68,355.72 61.18 - 12,025.95 15,935.30
2020/21 - Qtr.I 104,135.75 630.13 126.34 6,731.18 68,456.86 68,395.75 61.10 - 12,071.50 16,119.76 Qtr.II 106,332.83 825.02 126.50 7,014.60 67,464.75 67,416.64 48.11 - 14,134.42 16,767.55

| 91
Table 4: Money Supply and its Determinants(In Millions of Birr)
End of Period
Money and Quasi-Money Domestic CreditNet Foreign Assets Other
Items Net 14
Currency Outside Banks
1
Net Demand Deposit
2
Money Supply (1+2)
3
Quasi- Money
4
Total Volume
(3+4) 5
Total Credit (7+10)
6
Net Claims on Gov't Claims on Non-Cen
Gov't 10
Total (8+9)
7
Nat. Bank
8
Comm. Banks
9
Total (13+12)
11
Nat. Bank
12
Comm. Banks
13
2008/09
Qtr.I 16,337.59 20,633.90 36,971.49 34,464.85 71,436.34 84,088.59 34,872.36 37,048.01 (2,175.65) 49,216.23 10,387.77 4,976.66 5,411.11 23,040.02
Qtr.II 17,432.87 22,949.25 40,382.11 35,521.62 75,903.73 85,327.66 31,944.38 36,733.14 (4,788.76) 53,383.28 10,233.46 6,137.41 4,096.05 19,657.39
Qtr.III 19,264.00 23,589.18 42,853.18 37,710.34 80,563.52 85,281.56 29,349.06 35,566.17 (6,217.11) 55,932.51 14,863.60 9,571.56 5,292.04 19,581.64
Qtr.IV 19,715.01 22,397.64 42,112.66 40,397.09 82,509.75 89,203.04 32,786.50 37,827.20 (5,040.70) 56,416.54 17,976.81 11,833.66 6,143.15 24,670.10
2009/10
Qtr.I 18,547.21 25,572.45 44,119.66 43,316.58 87,436.24 92,006.88 32,500.40 36,953.31 (4,452.91) 59,506.48 19,528.96 14,212.62 5,316.34 24,099.60
Qtr.II 21,755.84 24,372.26 46,128.10 45,312.93 91,441.03 92,946.17 28,555.82 35,824.91 (7,269.09) 64,390.35 20,793.03 14,752.59 6,040.45 22,298.18
Qtr.III 23,068.09 26,271.82 49,339.91 47,931.11 97,271.03 98,671.91 30,038.16 38,953.17 (8,915.01) 68,633.76 25,278.62 16,290.43 8,988.19 26,679.50
Qtr.IV 24,206.80 27,727.99 51,934.78 51,997.77 103,932.56 104,350.11 33,013.08 39,340.32 (6,327.24) 71,337.03 27,189.78 15,383.31 11,806.47 27,607.34
2010/11
Qtr.I 23,849.92 29,249.39 53,099.31 55,362.66 108,461.97 104,929.59 31,368.11 39,718.05 (8,349.93) 73,561.48 38,003.21 23,003.30 14,999.91 34,470.83
Qrt II 28,312.32 31,751.83 60,064.15 57,736.08 117,800.24 110,513.95 27,374.22 41,118.83 (13,744.61) 83,139.73 40,230.88 24,979.34 15,251.53 32,944.59
Qtr.III 30,534.69 35,171.96 65,706.66 64,603.11 130,309.77 121,221.73 23,583.78 40,653.91 (17,070.13) 97,637.96 45,638.10 30,084.47 15,553.63 36,550.06
Qtr.IV 32,574.88 43,596.12 76,171.00 69,205.97 145,376.97 142,320.42 28,651.65 45,323.71 (16,672.05) 113,668.76 55,534.68 32,856.00 22,678.68 52,478.12
2011/12
Qtr.I 32,073.62 46,068.57 78,142.18 72,667.68 150,809.86 143,503.46 20,343.12 36,433.18 (16,090.06) 123,160.34 55,479.84 39,355.70 16,124.13 48,173.44
Qtr.II 36,274.61 42,879.96 79,154.57 76,743.67 155,898.24 157,410.18 13,443.60 38,255.43 (24,811.83) 143,966.58 49,345.56 34,675.66 14,669.91 50,857.50
Qtr.III 37,727.68 47,246.43 84,974.11 86,530.15 171,504.25 182,607.91 15,673.90 43,600.37 (27,926.47) 166,934.01 45,771.85 24,524.05 21,247.79 56,875.50
Qtr.IV 38,537.14 56,312.74 94,849.88 94,548.90 189,398.78 202,148.96 21,557.41 45,344.08 (23,786.67) 180,591.55 39,787.69 21,254.33 18,533.36 52,537.88
2012/13
Qtr.I 37,917.53 54,544.75 92,462.28 99,614.21 192,076.50 198,914.63 16,480.84 37,529.91 (21,049.06) 182,433.79 39,304.60 24,995.84 14,308.76 46,142.73
Qtr.II 42,677.02 57,524.67 100,201.69 106,063.71 206,265.39 213,175.22 13,732.02 42,732.25 (29,000.23) 199,443.21 39,754.55 26,357.64 13,396.92 46,664.38
Qtr.III 45,142.40 66,203.30 111,345.70 114,242.15 225,587.85 233,163.88 12,792.18 41,557.83 (28,765.66) 220,371.71 46,981.49 29,607.54 17,373.94 54,557.52
Qtr.IV 45,681.67 69,052.38 114,734.05 120,509.51 235,243.56 252,247.88 21,965.52 55,377.34 (33,411.82) 230,282.36 45,639.62 24,645.62 20,994.00 62,643.94
2013/14
Qtr.I 40,872.49 67,625.20 108,497.69 128,673.13 237,170.82 257,924.26 21,574.78 47,833.32 (26,258.54) 236,349.48 38,325.10 23,406.69 14,918.40 59,078.54
Qtr.II 44,085.69 69,579.58 113,665.27 138,686.20 252,351.47 280,465.92 18,308.87 50,041.39 (31,732.52) 262,157.05 33,534.49 21,297.01 12,237.48 61,648.94
Qtr.III 49,975.27 71,046.94 121,022.21 152,446.74 273,468.95 302,986.96 20,844.63 60,573.97 (39,729.34) 282,142.33 36,763.33 23,444.00 13,319.32 66,281.33
Qtr.IV 53,176.03 80,887.76 134,063.78 163,682.78 297,746.56 326,066.87 26,929.74 64,510.91 (37,581.17) 299,137.13 45,972.30 26,713.89 19,258.41 74,292.61
2014/15
Qtr.I 50,782.73 79,355.45 130,138.19 174,315.87 304,454.06 336,541.23 25,470.01 58,767.36 (33,297.35) 311,071.22 39,063.23 27,065.83 11,997.40 71,150.40
Qtr.II 58,128.86 82,081.55 140,210.40 185,615.77 325,826.17 367,313.10 23,581.11 64,293.14 (40,712.03) 343,731.98 39,409.45 28,393.45 11,015.99 80,896.38
Qtr.III 60,465.03 87,943.76 148,408.79 200,755.69 349,164.48 397,130.29 21,241.99 59,866.59 (38,624.59) 375,888.30 35,516.90 27,640.58 7,876.32 83,482.71
Qtr.IV 60,460.92 94,245.42 154,706.34 216,622.57 371,328.91 430,840.39 30,735.25 77,076.80 (46,341.55) 400,105.14 37,570.95 29,973.37 7,597.57 97,082.42
2015/16
Qtr.I 59,407.73 94,503.33 153,911.06 226,766.04 380,677.10 436,496.83 24,072.01 67,917.15 (43,845.14) 412,424.83 36,192.52 29,081.21 7,111.31 92,012.25
Qtr.II 63,507.06 95,784.79 159,291.85 237,323.17 396,615.02 469,781.03 25,008.45 78,917.95 (53,909.50) 444,772.58 31,444.63 22,494.68 8,949.94 104,610.63
Qtr.III 65,623.75 97,666.63 163,290.39 248,834.10 412,124.48 498,840.49 29,582.00 84,580.08 (54,998.07) 469,258.48 25,157.52 13,862.23 11,295.29 111,873.52
Qtr.IV 66,686.17 111,923.49 178,609.66 266,656.59 445,266.25 531,957.89 47,548.36 95,038.07 (47,489.71) 484,409.53 21,524.19 10,506.42 11,017.77 108,215.83
2016/17
Qtr.I 68,485.09 114,563.29 183,048.38 280,720.66 463,769.04 547,900.98 49,852.85 97,420.62 (47,567.77) 498,048.14 14,357.85 3,466.44 10,891.41 98,489.79
Qtr.II 73,702.55 122,551.62 196,254.17 300,041.07 496,295.24 577,812.91 45,593.96 105,012.72 (59,418.76) 532,218.95 16,470.24 5,541.88 10,928.36 97,987.92
Qtr.III 75,177.93 134,885.28 210,063.21 324,150.56 534,213.77 618,691.36 51,572.27 110,556.05 (58,983.78) 567,119.09 25,495.21 14,294.70 11,200.51 109,972.80
Qtr.IV 73,917.75 142,883.04 216,800.79 356,614.44 573,415.22 690,668.59 85,441.85 120,891.04 (35,449.19) 605,226.75 38,034.79 23,977.03 14,057.76 155,288.16
2017/18
Qtr.I 73,927.01 155,587.95 229,514.96 372,790.02 602,304.98 712,905.00 96,221.26 131,295.09 (35,073.83) 616,683.74 30,984.60 17,651.86 13,332.74 141,584.62
Qtr.II 86,784.15 161,094.75 247,878.90 396,274.17 644,153.07 758,470.30 99,972.02 143,447.90 (43,475.88) 658,498.28 22,527.90 11,391.82 11,136.08 136,845.13
Qtr.III 90,594.76 178,222.22 268,816.98 427,102.45 695,919.43 793,412.62 96,602.32 141,253.91 (44,651.59) 696,810.30 35,993.32 25,765.59 10,227.72 133,486.51
Qtr.IV 86,417.30 194,737.37 281,154.67 459,418.22 740,572.89 855,028.77 102,002.83 140,206.86 (38,204.03) 753,025.94 39,376.20 28,759.38 10,616.82 153,832.08
2018/19
Qtr.I 83,380.01 182,882.17 266,262.18 485,869.24 752,131.42 870,272.56 103,205.53 147,083.49 (43,877.95) 767,067.02 37,942.27 21,270.71 16,671.56 156,083.41
Qtr.II 92,192.58 185,405.32 277,597.90 511,563.89 789,161.79 921,386.87 98,558.46 154,902.04 (56,343.57) 822,828.41 23,507.72 11,063.97 12,443.76 155,732.81
Qtr.III 97,075.11 186,067.65 283,142.75 548,867.19 832,009.94 972,583.62 83,539.21 145,023.53 (61,484.32) 889,044.41 27,415.57 17,786.07 9,629.50 167,989.25
Qtr.IV 92,017.0 216,920.17 308,937.14 577,815.41 886,752.54 1,052,684.55 109,799.21 172,171.40 (62,372.19) 942,885.35 14,505.19 3,967.75 10,537.44 180,437.20
2019/20
Qtr.I 91,522.75 225,668.94 317,191.69 592,745.22 909,936.90 1,093,887.22 122,330.84 178,804.28 (56,473.43) 971,556.37 (17,043.11) (24,418.74) 7,375.63 166,907.21
Qtr.II 98,665.25 233,018.82 331,684.07 618,868.54 950,552.61 1,135,630.34 111,154.23 173,298.24 (62,144.01) 1,024,476.11 (14,628.59) (17,544.83) 2,916.24 170,449.14
Qtr.III 109,335.29 246,556.75 355,892.04 630,871.38 986,763.42 1,201,791.53 130,342.97 195,106.33 (64,763.36) 1,071,448.56 (28,902.99) (30,150.76) 1,247.77 186,125.12
Qtr.IV 109,071.81 251,513.71 360,585.51 677,060.82 1,037,646.34 1,257,527.48 137,080.08 195,708.16 (58,628.07) 1,120,447.40 (4,683.72) (15,221.00) 10,537.27 215,197.43
2020/21
Qtr.I 64,666.05 269,917.20 334,583.25 750,405.43 1,084,988.68 1,318,617.97 148,399.05 209,592.74 (61,193.69) 1,170,218.92 (28,149.28) (33,703.26) 5,553.98 205,480.01
Qtr.II 108,326.05 282,154.64 390,480.69 787,233.92 1,177,714.61 1,382,906.89 139,723.41 216,439.24 (76,715.83) 1,243,183.48 (38,577.03) (51,759.47) 13,182.44 166,615.25

National Bank of Ethiopia Quarterly Bulletin
92 | Second Quarter 2020/21
Table 5: Seasonally adjusted data of Monetary Variables (1)(In Millions of Birr)
End of Period
Money and Quasi-Money Domestic Credit
Currency Outside Banks
Net Demand Deposit
Money Supply
Quasi Money
Total Volume
Central Gov't (Net)
Non-Cent. Gov't
Foreign Assets (Net)
2008/09 Qtr.I 17,236.16 20,076.78 37,312.94 35,567.72 72,880.66 80,977.31 52,956.66 10,003.42 Qtr.II 13,853.90 22,627.96 36,481.86 34,811.19 71,293.04 85,412.99 37,368.30 10,243.69 Qtr.III 19,013.57 24,296.85 43,310.42 37,031.56 80,341.98 89,119.23 42,508.70 15,532.46 Qtr.IV 22,934.47 22,938.32 45,872.80 40,397.09 86,269.89 90,455.45 78,306.15 18,229.20 2009/10
Qtr.I 19,567.31 24,881.99 44,449.30 44,486.13 88,935.43 88,602.63 64,028.97 18,806.39 Qtr.II 17,289.37 24,031.04 41,320.41 44,406.67 85,727.08 93,039.12 45,073.24 20,813.83 Qtr.III 21,937.76 26,455.72 48,393.48 47,835.25 96,228.73 98,671.91 52,161.65 25,278.62 Qtr.IV 28,159.77 28,397.34 56,557.11 51,997.77 108,554.88 105,815.19 99,015.79 27,571.53 2010/11
Qtr.I 25,161.66 28,459.66 53,621.32 57,134.27 110,755.59 101,047.20 79,152.15 36,597.10 Qrt.II 22,499.80 31,307.31 53,807.11 56,581.36 110,388.47 110,624.46 58,197.81 40,271.11
Qtr.III 30,137.74 36,227.12 66,364.87 63,440.25 129,805.12 126,676.71 74,204.85 47,691.82 Qtr.IV 37,894.35 44,648.53 82,542.89 69,205.97 151,748.85 144,318.59 157,772.24 56,314.38 2011/12 Qtr.I 33,837.67 44,824.71 78,662.38 74,993.04 153,655.42 138,193.83 132,520.53 53,427.08 Qtr.II 28,827.43 42,279.64 71,107.07 75,208.80 146,315.87 157,567.59 100,776.61 49,394.91 Qtr.III 37,237.22 48,663.82 85,901.04 84,972.60 170,873.64 190,825.26 126,869.85 47,831.58 Qtr.IV 44,830.25 57,672.13 102,502.38 94,548.90 197,051.28 204,987.13 250,661.08 40,346.31
2012/13 Qtr.I 40,003.00 53,072.04 93,075.04 102,801.87 195,876.91 191,554.79 196,298.76 37,850.33 Qtr.II 33,915.43 56,719.32 90,634.75 103,942.43 194,577.18 213,388.40 139,610.24 39,794.31 Qtr.III 44,555.55 68,189.40 112,744.94 112,185.79 224,930.74 243,656.26 167,482.50 49,095.65 Qtr.IV 53,141.49 70,719.31 123,860.79 120,509.51 244,370.30 255,789.44 319,631.91 46,280.40
2013/14 Qtr.I 43,120.48 65,799.32 108,919.80 132,790.67 241,710.46 248,381.06 254,312.04 36,907.07 Qtr.II 35,034.90 68,605.47 103,640.37 135,912.48 239,552.84 280,746.38 183,509.94 33,568.03 Qtr.III 49,325.59 73,178.35 122,503.94 149,702.70 272,206.64 316,621.37 214,428.17 38,417.68 Qtr.IV 61,859.67 82,840.39 144,700.06 163,682.78 308,382.84 330,644.85 415,202.34 46,617.75
2014/15 Qtr.I 53,575.78 77,212.86 130,788.64 179,893.98 310,682.62 324,089.21 334,712.63 37,617.89 Qtr.II 46,195.00 80,932.40 127,127.41 181,903.45 309,030.86 367,680.41 240,612.39 39,448.86 Qtr.III 59,678.99 90,582.08 150,261.06 197,142.09 347,403.15 415,001.15 285,675.10 37,115.16 Qtr.IV 70,334.19 96,520.51 166,854.69 216,622.57 383,477.26 436,889.39 555,345.93 38,098.44
2015/16 Qtr.I 62,675.16 91,951.74 154,626.90 234,022.56 388,649.45 420,346.45 443,769.11 34,853.39 Qtr.II 50,469.06 94,443.80 144,912.87 232,576.71 377,489.57 470,250.81 311,340.80 31,476.07 Qtr.III 64,770.64 100,596.63 165,367.28 244,355.08 409,722.36 521,288.31 356,636.45 26,289.61 Qtr.IV 77,576.03 114,625.32 192,201.35 266,656.59 458,857.94 539,426.58 672,360.42 21,826.39
2016/17 Qtr.I 72,251.77 111,470.08 183,721.85 289,703.72 473,425.57 527,628.65 535,899.79 13,826.61 Qtr.II 58,571.42 120,835.90 179,407.32 294,040.25 473,447.56 578,390.72 372,553.27 16,486.71 Qtr.III 74,200.62 138,931.83 213,132.45 318,315.85 531,448.30 646,532.47 431,010.51 26,642.49 Qtr.IV 85,988.51 146,332.24 232,320.75 356,614.44 588,935.19 700,365.58 840,054.73 38,568.80
2017/18 Qtr.I 77,993.00 151,387.08 229,380.07 384,719.30 614,099.37 686,527.51 663,551.70 29,838.17 Qtr.II 68,967.37 158,839.42 227,806.79 388,348.68 616,155.47 759,228.77 460,948.80 22,550.43 Qtr.III 89,417.03 183,568.88 272,985.92 419,414.60 692,400.52 829,116.19 37,613.02 Qtr.IV 100,529.24 199,438.33 299,967.57 459,418.22 759,385.79 867,033.37 1,045,200.01 39,929.04
2018/19 Qtr.I 87,965.91 177,944.35 265,910.26 501,417.05 767,327.31 838,072.47 825,364.12 36,538.41 Qtr.II 73,265.45 182,809.64 256,075.09 501,332.61 757,407.70 922,308.26 575,979.89 23,531.23 Qtr.III 95,813.13 191,649.68 287,462.80 538,987.58 826,450.38 1,016,349.89 675,673.75 28,649.27 Qtr.IV 107,043.34 222,156.62 329,199.96 577,815.41 907,015.37 1,067,464.25 1,308,724.86 14,708.85
2019/20 Qtr.I 96,556.50 219,575.88 316,132.37 611,713.06 927,845.44 1,053,413.39 1,045,394.66 (16,412.51) Qtr.II 78,409.27 229,756.55 308,165.83 606,491.17 914,657.00 1,136,765.97 717,133.28 (14,643.22) Qtr.III 107,913.93 253,953.45 361,867.38 619,515.70 981,383.08 1,255,872.15 814,300.90 (30,203.62) QIV 126,883.23 257,585.25 384,468.48 677,060.82 1,061,529.30 1,275,183.17 1,555,180.99 (4,749.48)
2020/21 Qtr.I 68,222.69 262,629.43 330,852.12 774,418.40 1,105,270.52 1,269,829.10 1,259,155.56 (27,107.75) Qtr.II 86,086.71 278,204.48 364,291.19 771,489.24 1,135,780.43 1,384,289.79 870,228.43 (38,615.60)
1/ Obtained by multiplying each original observation by appropriate index for the month

| 93
Table 6: International Reserves and Net Foreign Assets of National Bank & Commercial Banks(In Millions of Birr)
End of Period
Gross Reserve Foreign Liabilities Net Foreign Assets
National Bank of Ethiopia International Reserves Comm. Banks
Reserve 6
Gross Reserve 1=2+6
NBE Total
2=3 to 5
Gold 3
Foreign Exc.
4Others
Reserve Tranche
Posi. 5
Total Liab.
7=8+9
Comm. Banks
8
NBE 9
Total 10=11+12
NBE 11=2-9
Comm. Banks 12=6-8
2007/08 Qtr.I 20,016.34 13,021.85 375.82 12,080.02 463.88 102.13 6,994.50 4,787.11 2,113.06 2,674.04 15,229.24 10,347.81 4,881.43 Qtr.II 19,194.15 12,829.31 491.81 11,759.64 472.18 105.68 6,364.83 4,983.72 2,221.78 2,761.94 14,210.43 10,067.38 4,143.05 Qtr.III 19,005.66 10,875.89 502.52 9,772.72 486.96 113.69 8,129.78 6,005.59 2,384.41 3,621.19 13,000.07 7,254.70 5,745.37 Qtr.IV 16,735.51 8,708.66 5.47 8,093.97 495.26 113.96 8,026.85 5,069.87 2,301.87 2,768.01 11,665.63 5,940.65 5,724.98 2008/09
Qtr.I 16,363.33 8,636.72 15.01 8,010.33 500.60 110.78 7,726.62 5,975.57 2,315.51 3,660.06 10,387.77 4,976.66 5,411.11 Qtr.II 16,211.07 9,260.43 81.90 8,551.39 515.01 112.13 6,950.64 5,977.61 2,854.59 3,123.02 10,233.46 6,137.41 4,096.05 Qtr.III 21,378.52 13,284.94 8.60 12,580.96 574.93 120.45 8,093.58 6,514.92 2,801.54 3,713.38 14,863.60 9,571.56 5,292.04 Qtr.IV 26,434.27 17,214.61 18.17 16,488.13 580.86 127.45 9,219.66 8,457.46 3,076.51 5,380.94 17,976.81 11,833.66 6,143.15 2009/10
Qtr.I 31,435.10 22,262.14 120.26 21,002.66 995.32 143.91 9,172.96 11,906.14 3,856.62 8,049.53 19,528.96 14,212.62 5,316.34 Qtr.II 33,176.91 23,445.68 287.33 22,018.26 995.76 144.34 9,731.23 12,383.88 3,690.78 8,693.10 20,793.03 14,752.59 6,040.45 Qtr.III 40,235.07 27,285.95 267.70 24,480.32 2,389.76 148.18 12,949.12 14,956.45 3,960.93 10,995.53 25,278.62 16,290.43 8,988.19 Qtr.IV 42,350.09 27,289.34 443.30 23,490.22 3,210.12 145.70 15,060.75 15,160.31 3,254.28 11,906.03 27,189.78 15,383.31 11,806.47 2010/11
Qtr.I 55,098.19 35,852.22 490.52 31,229.17 3,948.22 184.31 19,245.97 17,094.98 4,246.06 12,848.92 38,003.21 23,003.30 14,999.91 Qrt.II 60,236.11 40,042.00 444.17 34,418.71 4,994.49 184.63 20,194.12 20,005.24 4,942.59 15,062.65 40,230.88 24,979.34 15,251.53
Qtr.III 66,516.18 45,367.31 1,636.24 38,413.88 5,124.86 192.33 21,148.87 20,878.08 5,595.24 15,282.84 45,638.10 30,084.47 15,553.63 Qtr.IV 79,945.54 51,551.39 1,395.23 44,738.80 5,221.68 195.67 28,394.16 24,410.87 5,715.48 18,695.39 55,534.68 32,856.00 22,678.68 2011/12 Qtr.I 82,289.50 59,724.20 1,037.56 53,248.95 5,242.45 195.24 22,565.30 26,809.66 6,441.17 20,368.49 55,479.84 39,355.70 16,124.13 Qtr.II 75,054.99 51,965.40 479.44 46,056.19 5,236.48 193.30 23,089.59 25,709.43 8,419.69 17,289.74 49,345.56 34,675.66 14,669.91
Qtr.III 68,989.93 40,349.89 669.26 34,192.43 5,292.44 195.77 28,640.04 23,218.08 7,392.24 15,825.84 45,771.85 24,524.05 21,247.79 Qtr.IV 64,119.02 40,101.45 2,038.08 32,528.76 5,339.29 195.32 24,017.57 24,331.33 5,484.21 18,847.12 39,787.69 21,254.33 18,533.36
2012/13 Qtr.I 64,490.48 44,307.75 (24.32) 38,671.89 5,458.67 201.51 20,182.74 25,185.88 5,873.98 19,311.91 39,304.60 24,995.84 14,308.76 Qtr.II 66,096.15 46,620.93 1,964.27 38,926.61 5,526.08 203.98 19,475.22 26,341.60 6,078.30 20,263.30 39,754.55 26,357.64 13,396.92 Qtr.III 73,770.07 50,358.05 1,310.29 43,334.32 5,512.02 201.42 23,412.02 26,788.59 6,038.08 20,750.51 46,981.49 29,607.54 17,373.94 Qtr.IV 72,649.20 44,140.03 2,253.17 36,078.39 5,606.69 201.78 28,509.18 27,009.59 7,515.18 19,494.41 45,639.62 24,645.62 20,994.00
2013/14 Qtr.I 69,177.60 46,471.52 2,656.15 37,900.27 5,705.18 209.91 22,706.08 30,852.50 7,787.68 23,064.82 38,325.10 23,406.69 14,918.40 Qtr.II 69,684.03 49,513.05 1,522.50 41,971.87 5,804.38 214.30 20,170.98 36,149.54 7,933.50 28,216.04 33,534.49 21,297.01 12,237.48 Qtr.III 67,001.19 45,838.73 1,333.55 38,439.61 5,848.52 217.05 21,162.46 30,237.86 7,843.13 22,394.73 36,763.33 23,444.00 13,319.32 Qtr.IV 77,877.97 50,624.47 1,217.59 43,237.44 5,951.02 218.41 27,253.50 31,905.67 7,995.09 23,910.57 45,972.30 26,713.89 19,258.41
2014/15 Qtr.I 72,152.41 52,555.40 1,217.59 45,256.47 5,866.25 215.08 19,597.01 33,089.18 7,599.61 25,489.57 39,063.23 27,065.83 11,997.40 Qtr.II 93,641.42 74,840.58 741.24 67,914.12 5,867.87 317.35 18,800.84 54,231.97 7,784.85 46,447.12 39,409.45 28,393.45 11,015.99 Qtr.III 80,014.15 64,152.02 206.89 57,837.68 5,800.34 307.11 15,862.13 44,497.25 7,985.81 36,511.44 35,516.90 27,640.58 7,876.32 Qtr.IV 82,741.82 66,817.67 79.30 60,856.52 5,566.59 315.26 15,924.15 45,170.87 8,326.57 36,844.30 37,570.95 29,973.37 7,597.57
2015/16 Qtr.I 80,548.64 65,085.59 (101.65) 59,349.29 5,519.27 318.69 15,463.04 44,356.12 8,351.74 36,004.39 36,192.52 29,081.21 7,111.31 Qtr.II 102,594.72 84,226.48 222.87 78,442.72 5,241.83 319.06 18,368.24 71,150.10 9,418.30 61,731.80 31,444.63 22,494.68 8,949.94 Qtr.III 94,205.95 72,889.54 1,136.99 66,362.68 5,064.22 325.65 21,316.42 69,048.43 10,021.13 59,027.31 25,157.52 13,862.23 11,295.29 Qtr.IV 95,054.99 74,156.73 1,113.92 67,851.69 4,859.62 331.50 20,898.27 73,530.80 9,880.50 63,650.30 21,524.19 10,506.42 11,017.77
2016/17 Qtr.I 96,065.61 74,949.60 8.43 69,963.93 4,641.20 336.04 21,116.01 81,707.76 10,224.60 71,483.16 14,357.85 3,466.44 10,891.41 Qtr.III 92,768.28 72,397.44 1,139.58 66,561.06 4,370.15 326.66 20,370.84 76,298.03 9,442.47 66,855.56 16,470.24 5,541.88 10,928.36 Qtr.III 91,850.16 70,874.56 1,135.37 61,851.06 7,550.46 337.66 20,975.60 66,354.95 9,775.09 56,579.86 25,495.21 14,294.70 11,200.51 Qtr.IV 98,750.85 73,874.32 741.33 68,851.84 3,931.73 349.42 24,876.54 60,716.07 10,818.77 49,897.29 38,034.79 23,977.03 14,057.76
2017/18 Qtr.I 93,889.81 68,636.42 0.01 64,643.51 3,633.38 359.52 25,253.39 62,905.21 11,920.65 50,984.56 30,984.60 17,651.86 13,332.74 Qtr.II 108,580.90 82,254.04 0.01 77,584.06 4,249.63 420.35 26,326.86 86,053.00 15,190.78 70,862.22 22,527.90 11,391.82 11,136.08 Qtr.III 109,952.13 85,287.93 81.43 80,464.52 4,309.30 432.67 24,664.20 73,958.81 14,436.48 59,522.34 35,993.32 25,765.59 10,227.72 Qtr.IV 102,738.94 77,617.37 750.54 72,217.34 4,231.09 418.41 25,121.57 63,362.74 14,504.75 48,857.99 39,376.20 28,759.38 10,616.82
2017/18 Qtr.I 134,142.53 103,307.08 750.99 97,678.76 4,455.23 422.10 30,835.45 96,200.25 14,163.89 82,036.37 37,942.27 21,270.71 16,671.56 Qtr.II 139,330.76 110,973.71 750.54 105,145.06 4,654.41 423.72 28,357.05 115,823.04 15,913.29 99,909.75 23,507.72 11,063.97 12,443.76 Qtr.III 138,532.05 111,651.22 198.87 106,132.87 4,887.60 431.88 26,880.84 111,116.48 17,251.34 93,865.15 27,415.57 17,786.07 9,629.50 Qtr.IV 127,270.46 98,726.63 804.88 92,853.80 4,630.17 437.79 28,543.82 112,765.27 18,006.38 94,758.88 14,505.19 3,967.75 10,537.44
2019/20 Qtr.I 95770.9 69790.0 15.3 64693.1 4646.3 435.4 25980.8 112814.0 18605.2 94208.8 -17043.1 -24418.7 7375.6 Qtr.II 118262.2 94289.2 19.4 88749.5 5042.0 478.3 23973.1 132890.8 21056.8 111834.0 -14628.6 -17544.8 2916.2 Qtr.III 105013.8 80407.5 316.7 74412.2 5190.3 488.3 24606.3 133916.8 23358.5 110558.3 -28903.0 -30150.8 1247.8Qtr.IV 147202.8 112086.3 3280.6 102412.1 5868.2 525.4 35116.5 151886.6 24579.2 127307.3 -4683.7 -15221.0 10537.3
2020/21 Qtr.I 153636.7 120432.6 5033.1 108717.2 6119.0 563.3 33204.1 181786.0 27650.2 154135.8 -28149.3 -33703.3 5554.0 Qtr.II 163630.6 120263.6 1868.9 111460.7 6319.0 615.0 43367.0 202207.6 30184.6 172023.0 -38577.0 -51759.5 13182.4

National Bank of Ethiopia Quarterly Bulletin
94 | Second Quarter 2020/21
Table 7: Domestic Credit by Sector(In Millions of Birr)
End of Period
Gross Domestic
Credit 1=2+5
Claims on Central Gov't Claims on Non-Central Gov't
Total 2=3+4
NBE 3
Comm. Banks
4
Total 5=6+7
Loans & Advances
6
Invest- ments
72007/08
Qtr.I 77,648.79 46,319.15 30,269.27 16,049.88 31,329.65 22,920.83 8,408.81 Qtr.II 83,224.02 48,069.23 31,995.27 16,073.96 35,154.79 25,761.00 9,393.79 Qtr.III 88,852.79 46,095.08 33,917.27 12,177.81 42,757.71 31,682.65 11,075.06 Qtr.IV 95,104.83 48,211.24 41,563.08 6,648.16 46,893.59 33,600.67 13,292.93 2008/09
Qtr.I 99,722.15 50,505.92 44,270.98 6,234.94 49,216.23 34,397.64 14,818.58 Qtr.II 101,879.50 48,496.21 42,948.98 5,547.24 53,383.28 35,946.71 17,436.57 Qtr.III 103,730.38 47,797.88 42,248.98 5,548.90 55,932.51 37,079.81 18,852.70 Qtr.IV 106,324.63 49,908.09 44,498.73 5,409.36 56,416.54 38,802.03 17,614.51 2009/10
Qtr.I 109,573.22 50,066.74 44,326.63 5,740.11 59,506.48 39,701.38 19,805.10 Qtr.II 113,178.74 48,788.40 43,610.83 5,177.56 64,390.35 44,092.84 20,297.50 Qtr.III 120,251.34 51,617.59 45,989.73 5,627.86 68,633.76 46,900.67 21,733.09 Qtr.IV 124,275.08 52,938.05 45,522.78 7,415.27 71,337.03 47,540.18 23,796.85 2010/11
Qtr.I 127,025.88 53,464.40 47,983.68 5,480.72 73,561.48 48,436.98 25,124.50 Qrt.II 137,731.17 54,591.45 50,488.58 4,102.86 83,139.73 55,653.80 27,485.93
Qtr.III 154,521.74 56,883.78 51,930.58 4,953.20 97,637.96 62,088.83 35,549.12 Qtr.IV 172,852.07 59,183.31 55,614.64 3,568.67 113,668.76 68,121.31 45,547.45 2011/12 Qtr.I 182,848.50 59,688.15 55,566.48 4,121.67 123,160.34 72,379.01 50,781.33 Qtr.II 202,386.30 58,419.72 55,562.48 2,857.24 143,966.58 85,795.45 58,171.12 Qrt.III 225,564.77 58,630.77 55,562.48 3,068.28 166,934.01 100,478.28 66,455.73 Qtr.IV 240,575.21 59,983.66 55,562.48 4,421.18 180,591.55 107,119.04 73,472.51
2012/13 Qtr.I 246,456.06 64,022.27 55,510.38 8,511.89 182,433.79 106,583.93 75,849.86 Qtr.II 261,646.62 62,203.41 55,510.38 6,693.03 199,443.21 115,716.08 83,727.13 Qtr.III 285,289.57 64,917.87 59,510.38 5,407.49 220,371.71 128,230.09 92,141.62 Qtr.IV 300,492.71 70,210.35 64,510.38 5,699.97 230,282.36 130,885.39 99,396.97
2013/14 Qtr.I 304,819.92 68,470.44 64,381.33 4,089.11 236,349.48 129,713.99 106,635.50 Qtr.II 330,002.44 67,845.38 64,381.33 3,464.05 262,157.05 144,359.46 117,797.59 Qtr.III 357,277.46 75,135.14 73,381.33 1,753.80 282,142.33 155,798.24 126,344.08 Qtr.IV 374,071.19 74,934.06 73,304.39 1,629.68 299,137.13 162,232.83 136,904.30
2014/15 Qtr.I 385,474.06 74,402.84 73,175.34 1,227.50 311,071.22 166,392.07 144,679.15 Qtr.II 423,153.67 79,421.69 78,175.34 1,246.35 343,731.98 184,727.66 159,004.32 Qtr.III 458,315.98 82,427.69 81,175.34 1,252.35 375,888.30 202,409.27 173,479.03 Qtr.IV 493,536.50 93,431.36 92,175.34 1,256.02 400,105.14 208,858.92 191,246.21
2015/16 Qtr.I 512,987.60 100,562.77 99,657.34 905.43 412,424.83 212,528.02 199,896.80 Qtr.II 550,335.35 105,562.77 104,657.34 905.43 444,772.58 231,803.76 212,968.82 Qtr.III 574,821.26 105,562.77 104,657.34 905.43 469,258.48 244,256.61 225,001.87 Qtr.IV 594,275.57 109,866.05 109,080.40 785.65 484,409.53 252,456.25 231,953.28
2016/17Qtr.I 614,243.26 116,195.13 115,640.85 554.28 498,048.14 257,176.06 240,872.08 Qtr.II 653,414.08 121,195.13 120,640.85 554.28 532,218.95 279,303.53 252,915.43 Qtr.III 697,290.22 130,171.13 129,640.85 530.28 567,119.09 299,213.06 267,906.04 Qtr.IV 762,842.31 157,615.56 135,632.85 21,982.71 605,226.75 311,137.51 294,089.24
2017/18 Qtr.I 789,525.40 172,841.67 150,632.85 22,208.82 616,683.74 316,104.52 300,579.22 Qtr.II 840,813.75 182,315.46 160,128.85 22,186.62 658,498.28 336,105.79 322,392.50 Qtr.III 879,125.76 182,315.46 160,128.85 22,186.62 696,810.30 357,928.56 338,881.74 Qtr.IV 935,341.40 182,315.46 160,128.85 22,186.62 753,025.94 393,607.01 359,418.93
2018/19 Qtr.I 956,319.44 189,252.41 166,685.30 22,567.12 767,067.02 402,964.12 364,102.91 Qtr.II 1,024,035.43 201,207.02 178,685.30 22,521.73 822,828.41 444,356.28 378,472.13 Qtr.III 1,094,682.64 205,638.22 182,685.30 22,952.93 889,044.41 471,569.71 417,474.71 Qtr.IV 1,161,190.85 218,305.50 194,685.30 23,620.21 942,885.35 495,504.92 447,380.43
2019/20 Qtr.I 1,193,721.90 222,165.52 199,237.75 22,927.78 971,556.37 515,294.45 456,261.93 Qtr.II 1,251,837.28 227,361.17 204,237.75 23,123.42 1,024,476.11 568,242.29 456,233.83 Qtr.III 1,315,614.08 244,165.52 221,237.75 22,927.78 1,071,448.56 583,681.60 487,766.96 QIV 1,379,523.63 259,076.23 230,237.75 28,838.49 1,120,447.40 629,954.69 490,492.71
2020/21 Qtr.I 1,449,866.28 279,647.36 243,141.31 36,506.06 1,170,218.92 669,626.18 500,592.74 Qtr.II 1,524,023.10 280,839.63 248,141.31 32,698.32 1,243,183.48 717,177.35 526,006.13

| 95
Table 8: Deposits by Type and Sector(In Millions of Birr)
End of Period
Total Deposits
1=2+6
Non-Central Gov't Deposits with CBs Central Gov't Dep. with
Total 2=3 to 5
Net Demand Deposit
3
Savings Deposit
4
Time Dep. (30 days & over)
5
Total 6=7+8
National Bank
7
Comm. Banks
8
2007/08 Qtr.I 61,683.06 45,481.93 16,968.54 24,994.43 3,518.97 16,201.13 8,032.28 8,168.85 Qtr.II 62,526.95 46,703.07 16,652.00 26,300.71 3,750.36 15,823.89 6,740.91 9,082.98 Qtr.III 64,318.55 48,941.84 17,462.77 27,829.80 3,649.27 15,376.71 5,966.52 9,410.19 Qtr.IV 65,663.61 50,528.03 17,696.26 29,477.65 3,354.13 15,135.58 6,157.32 8,978.26 2008/09
Qtr.I 70,732.30 55,098.74 20,633.90 31,463.68 3,001.17 15,633.56 7,222.97 8,410.60 Qtr.II 75,022.70 58,470.86 22,949.25 32,543.78 2,977.84 16,551.83 6,215.84 10,336.00 Qtr.III 79,748.34 61,299.52 23,589.18 34,659.04 3,051.31 18,448.82 6,682.81 11,766.01 Qtr.IV 79,916.41 62,794.83 22,397.64 37,148.81 3,248.37 17,121.59 6,671.53 10,450.06 2009/10
Qtr.I 86,455.99 68,889.65 25,572.45 39,815.15 3,502.06 17,566.34 7,373.32 10,193.02 Qtr.II 89,917.82 69,685.24 24,372.26 41,814.19 3,498.80 20,232.57 7,785.92 12,446.66 Qtr.III 95,782.45 74,203.02 26,271.82 44,362.54 3,568.66 21,579.43 7,036.56 14,542.87 Qtr.IV 99,652.87 79,727.91 27,727.99 48,043.71 3,956.21 19,924.97 6,182.46 13,742.50 2010/11
Qtr.I 107,047.07 84,950.78 29,584.52 51,464.97 3,901.29 22,096.29 8,265.64 13,830.65 Qrt.II 116,681.78 89,464.56 31,725.01 53,879.49 3,860.06 27,217.22 9,369.75 17,847.47
Qtr.III 132,852.12 99,552.12 34,948.61 60,140.80 4,462.70 33,300.00 11,276.68 22,023.33 Qtr.IV 143,339.26 112,807.61 43,596.12 64,545.08 4,666.41 30,531.65 10,290.93 20,240.72 2011/12 Qtr.I 158,086.94 118,741.91 46,068.57 67,993.43 4,679.92 39,345.03 19,133.30 20,211.73 Qtr.II 164,606.16 119,630.04 42,879.96 71,584.79 5,165.29 44,976.12 17,307.05 27,669.07 Qrt.III 176,742.06 133,785.19 47,246.43 76,402.38 10,136.38 42,956.87 11,962.11 30,994.76 Qtr.IV 189,288.75 150,862.50 56,312.74 82,488.70 12,061.06 38,426.25 10,218.40 28,207.85
2012/13 Qtr.I 201,701.35 154,159.92 54,544.75 87,502.71 12,112.46 47,541.43 17,980.48 29,560.96 Qtr.II 212,060.37 163,588.98 57,524.67 93,134.26 12,930.05 48,471.39 12,778.13 35,693.26 Qtr.III 232,572.14 180,446.45 66,203.30 100,727.49 13,515.66 52,125.69 17,952.55 34,173.15 Qtr.IV 237,807.95 189,563.12 69,052.38 106,232.04 14,278.69 48,244.83 9,133.04 39,111.79
2013/14 Qtr.I 243,194.15 196,298.49 67,625.20 113,061.71 15,611.58 46,895.66 16,548.01 30,347.65 Qtr.II 257,802.58 208,266.07 69,579.58 122,757.75 15,928.74 49,536.52 14,339.95 35,196.57 Qtr.III 277,784.24 223,493.74 71,046.94 135,254.21 17,192.59 54,290.51 12,807.36 41,483.14 Qtr.IV 292,574.89 244,570.57 80,887.76 145,810.54 17,872.27 48,004.32 8,793.48 39,210.84
2014/15 Qtr.I 302,604.19 253,671.36 79,355.45 155,437.52 18,878.38 48,932.83 14,407.98 34,524.85 Qtr.II 323,537.99 267,697.42 82,081.55 164,291.18 21,324.70 55,840.58 13,882.20 41,958.38 Qtr.III 349,885.26 288,699.57 87,943.76 163,024.68 37,731.13 61,185.70 21,308.75 39,876.94 Qtr.IV 373,564.10 310,867.99 94,245.42 174,631.98 41,990.59 62,696.11 15,098.54 47,597.57
2015/16 Qtr.I 397,760.17 321,269.40 94,503.33 181,919.24 44,846.83 76,490.77 31,740.19 44,750.57 Qtr.II 413,662.32 333,107.99 95,784.79 192,284.18 45,039.02 80,554.32 25,739.39 54,814.93 Qtr.III 422,481.50 346,500.73 97,666.63 201,515.25 47,318.84 75,980.77 20,077.26 55,903.51 Qtr.IV 440,897.76 378,580.08 111,923.49 217,034.28 49,622.31 62,317.68 14,042.32 48,275.36
2016/17 Qtr.I 461,626.23 395,283.95 114,563.29 228,607.10 52,113.56 66,342.28 18,220.23 48,122.05 Qtr.II 498,193.86 422,592.69 122,551.62 244,021.95 56,019.12 75,601.17 15,628.13 59,973.04 Qtr.III 537,634.69 459,035.83 134,885.28 264,819.66 59,330.90 78,598.86 19,084.80 59,514.06 Qtr.IV 571,671.19 499,497.48 142,883.04 293,431.70 63,182.74 72,173.71 14,741.81 57,431.90
2017/18 Qtr.I 605,014.07 528,393.66 155,587.95 306,915.08 65,890.63 76,620.40 19,337.75 57,282.65 Qtr.II 639,712.39 557,368.95 161,094.75 324,547.41 71,726.79 82,343.44 16,680.94 65,662.50 Qtr.III 691,047.39 605,334.25 178,222.22 352,633.66 74,478.38 85,713.14 18,874.93 66,838.21 Qtr.IV 734,482.46 654,169.83 194,737.37 382,563.67 76,868.79 80,312.63 19,921.99 60,390.64
2018/19 Qtr.I 754,813.22 668,766.34 182,882.17 407,185.70 78,698.46 86,046.88 19,601.81 66,445.07 Qtr.II 799,642.99 696,994.43 185,405.32 430,123.97 81,465.14 102,648.56 23,783.26 78,865.30 Qtr.III 857,091.15 734,992.14 186,067.65 462,852.96 86,071.53 122,099.01 37,661.76 84,437.25 Qtr.IV 903,483.68 794,977.38 216,920.17 487,543.93 90,513.29 108,506.29 22,513.90 85,992.40
2019/20 Qtr.I 918,495.03 818,660.35 225,668.94 502,444.51 90,546.90 99,834.68 20,433.47 79,401.21 Qtr.II 968,377.71 852,170.77 233,018.82 529,431.05 89,720.91 116,206.94 30,939.51 85,267.44 Qtr.III 991,737.27 877,914.72 246,556.75 550,592.71 80,765.27 113,822.55 26,131.42 87,691.14 Qtr.IV 1,050,842.01 928,845.86 251,513.71 589,445.39 87,886.77 121,996.15 34,529.59 87,466.56
2020/21 Qtr.I 1,151,766.44 1,020,518.13 269,917.20 659,017.03 91,583.91 131,248.31 33,548.57 97,699.75 Qtr.II 1,210,840.93 1,069,724.72 282,154.64 698,415.14 89,154.94 141,116.21 31,702.07 109,414.14
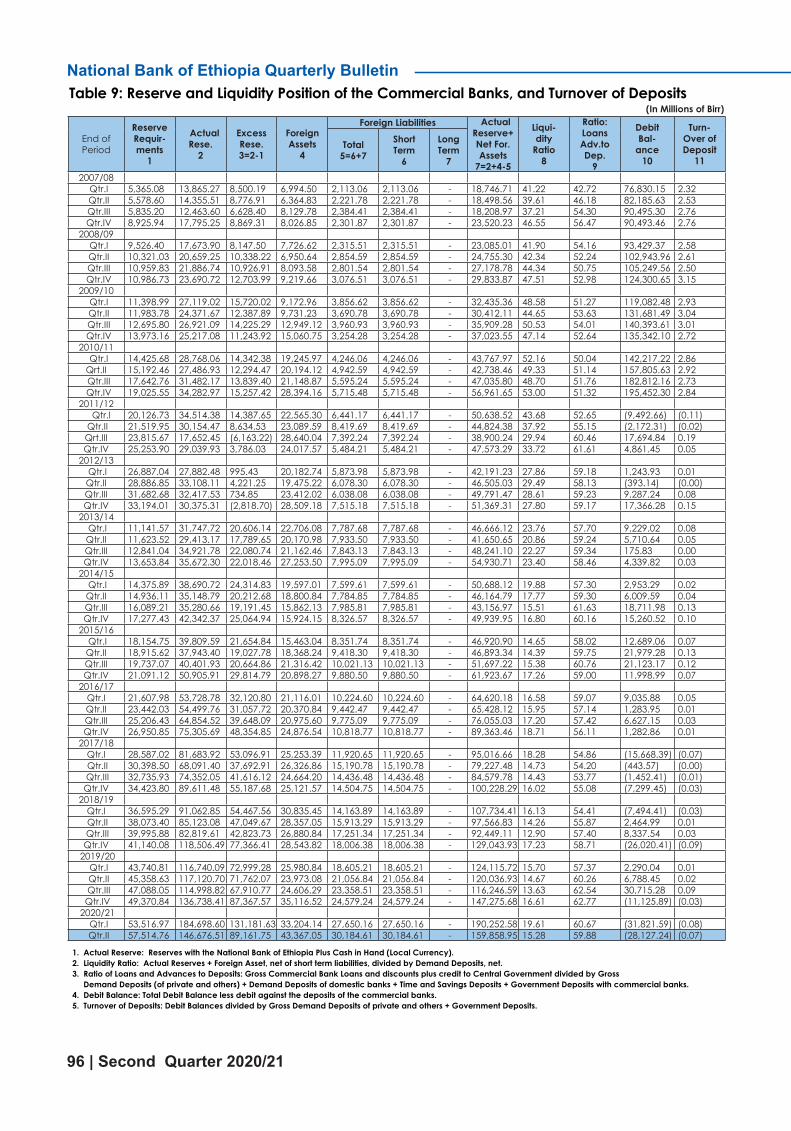
National Bank of Ethiopia Quarterly Bulletin
96 | Second Quarter 2020/21
Table 9: Reserve and Liquidity Position of the Commercial Banks, and Turnover of Deposits(In Millions of Birr)
End of Period
Reserve Requir- ments
1
Actual Rese.
2
Excess Rese. 3=2-1
Foreign Assets
4
Foreign Liabilities Actual Reserve+ Net For. Assets
7=2+4-5
Liqui- dity
Ratio 8
Ratio: Loans Adv.to Dep.
9
Debit Bal-
ance 10
Turn- Over of Deposit
11Total
5=6+7
Short Term
6
Long Term
72007/08
Qtr.I 5,365.08 13,865.27 8,500.19 6,994.50 2,113.06 2,113.06 - 18,746.71 41.22 42.72 76,830.15 2.32 Qtr.II 5,578.60 14,355.51 8,776.91 6,364.83 2,221.78 2,221.78 - 18,498.56 39.61 46.18 82,185.63 2.53 Qtr.III 5,835.20 12,463.60 6,628.40 8,129.78 2,384.41 2,384.41 - 18,208.97 37.21 54.30 90,495.30 2.76 Qtr.IV 8,925.94 17,795.25 8,869.31 8,026.85 2,301.87 2,301.87 - 23,520.23 46.55 56.47 90,493.46 2.76 2008/09
Qtr.I 9,526.40 17,673.90 8,147.50 7,726.62 2,315.51 2,315.51 - 23,085.01 41.90 54.16 93,429.37 2.58 Qtr.II 10,321.03 20,659.25 10,338.22 6,950.64 2,854.59 2,854.59 - 24,755.30 42.34 52.24 102,943.96 2.61 Qtr.III 10,959.83 21,886.74 10,926.91 8,093.58 2,801.54 2,801.54 - 27,178.78 44.34 50.75 105,249.56 2.50 Qtr.IV 10,986.73 23,690.72 12,703.99 9,219.66 3,076.51 3,076.51 - 29,833.87 47.51 52.98 124,300.65 3.15 2009/10
Qtr.I 11,398.99 27,119.02 15,720.02 9,172.96 3,856.62 3,856.62 - 32,435.36 48.58 51.27 119,082.48 2.93 Qtr.II 11,983.78 24,371.67 12,387.89 9,731.23 3,690.78 3,690.78 - 30,412.11 44.65 53.63 131,681.49 3.04 Qtr.III 12,695.80 26,921.09 14,225.29 12,949.12 3,960.93 3,960.93 - 35,909.28 50.53 54.01 140,393.61 3.01 Qtr.IV 13,973.16 25,217.08 11,243.92 15,060.75 3,254.28 3,254.28 - 37,023.55 47.14 52.64 135,342.10 2.72 2010/11
Qtr.I 14,425.68 28,768.06 14,342.38 19,245.97 4,246.06 4,246.06 - 43,767.97 52.16 50.04 142,217.22 2.86 Qrt.II 15,192.46 27,486.93 12,294.47 20,194.12 4,942.59 4,942.59 - 42,738.46 49.33 51.14 157,805.63 2.92
Qtr.III 17,642.76 31,482.17 13,839.40 21,148.87 5,595.24 5,595.24 - 47,035.80 48.70 51.76 182,812.16 2.73 Qtr.IV 19,025.55 34,282.97 15,257.42 28,394.16 5,715.48 5,715.48 - 56,961.65 53.00 51.32 195,452.30 2.84 2011/12 Qtr.I 20,126.73 34,514.38 14,387.65 22,565.30 6,441.17 6,441.17 - 50,638.52 43.68 52.65 (9,492.66) (0.11) Qtr.II 21,519.95 30,154.47 8,634.53 23,089.59 8,419.69 8,419.69 - 44,824.38 37.92 55.15 (2,172.31) (0.02)Qrt.III 23,815.67 17,652.45 (6,163.22) 28,640.04 7,392.24 7,392.24 - 38,900.24 29.94 60.46 17,694.84 0.19 Qtr.IV 25,253.90 29,039.93 3,786.03 24,017.57 5,484.21 5,484.21 - 47,573.29 33.72 61.61 4,861.45 0.05
2012/13 Qtr.I 26,887.04 27,882.48 995.43 20,182.74 5,873.98 5,873.98 - 42,191.23 27.86 59.18 1,243.93 0.01 Qtr.II 28,886.85 33,108.11 4,221.25 19,475.22 6,078.30 6,078.30 - 46,505.03 29.49 58.13 (393.14) (0.00)Qtr.III 31,682.68 32,417.53 734.85 23,412.02 6,038.08 6,038.08 - 49,791.47 28.61 59.23 9,287.24 0.08 Qtr.IV 33,194.01 30,375.31 (2,818.70) 28,509.18 7,515.18 7,515.18 - 51,369.31 27.80 59.17 17,366.28 0.15
2013/14 Qtr.I 11,141.57 31,747.72 20,606.14 22,706.08 7,787.68 7,787.68 - 46,666.12 23.76 57.70 9,229.02 0.08 Qtr.II 11,623.52 29,413.17 17,789.65 20,170.98 7,933.50 7,933.50 - 41,650.65 20.86 59.24 5,710.64 0.05 Qtr.III 12,841.04 34,921.78 22,080.74 21,162.46 7,843.13 7,843.13 - 48,241.10 22.27 59.34 175.83 0.00 Qtr.IV 13,653.84 35,672.30 22,018.46 27,253.50 7,995.09 7,995.09 - 54,930.71 23.40 58.46 4,339.82 0.03
2014/15 Qtr.I 14,375.89 38,690.72 24,314.83 19,597.01 7,599.61 7,599.61 - 50,688.12 19.88 57.30 2,953.29 0.02 Qtr.II 14,936.11 35,148.79 20,212.68 18,800.84 7,784.85 7,784.85 - 46,164.79 17.77 59.30 6,009.59 0.04 Qtr.III 16,089.21 35,280.66 19,191.45 15,862.13 7,985.81 7,985.81 - 43,156.97 15.51 61.63 18,711.98 0.13 Qtr.IV 17,277.43 42,342.37 25,064.94 15,924.15 8,326.57 8,326.57 - 49,939.95 16.80 60.16 15,260.52 0.10
2015/16 Qtr.I 18,154.75 39,809.59 21,654.84 15,463.04 8,351.74 8,351.74 - 46,920.90 14.65 58.02 12,689.06 0.07 Qtr.II 18,915.62 37,943.40 19,027.78 18,368.24 9,418.30 9,418.30 - 46,893.34 14.39 59.75 21,979.28 0.13 Qtr.III 19,737.07 40,401.93 20,664.86 21,316.42 10,021.13 10,021.13 - 51,697.22 15.38 60.76 21,123.17 0.12 Qtr.IV 21,091.12 50,905.91 29,814.79 20,898.27 9,880.50 9,880.50 - 61,923.67 17.26 59.00 11,998.99 0.07
2016/17 Qtr.I 21,607.98 53,728.78 32,120.80 21,116.01 10,224.60 10,224.60 - 64,620.18 16.58 59.07 9,035.88 0.05 Qtr.II 23,442.03 54,499.76 31,057.72 20,370.84 9,442.47 9,442.47 - 65,428.12 15.95 57.14 1,283.95 0.01 Qtr.III 25,206.43 64,854.52 39,648.09 20,975.60 9,775.09 9,775.09 - 76,055.03 17.20 57.42 6,627.15 0.03 Qtr.IV 26,950.85 75,305.69 48,354.85 24,876.54 10,818.77 10,818.77 - 89,363.46 18.71 56.11 1,282.86 0.01
2017/18 Qtr.I 28,587.02 81,683.92 53,096.91 25,253.39 11,920.65 11,920.65 - 95,016.66 18.28 54.86 (15,668.39) (0.07) Qtr.II 30,398.50 68,091.40 37,692.91 26,326.86 15,190.78 15,190.78 - 79,227.48 14.73 54.20 (443.57) (0.00) Qtr.III 32,735.93 74,352.05 41,616.12 24,664.20 14,436.48 14,436.48 - 84,579.78 14.43 53.77 (1,452.41) (0.01)Qtr.IV 34,423.80 89,611.48 55,187.68 25,121.57 14,504.75 14,504.75 - 100,228.29 16.02 55.08 (7,299.45) (0.03)
2018/19 Qtr.I 36,595.29 91,062.85 54,467.56 30,835.45 14,163.89 14,163.89 - 107,734.41 16.13 54.41 (7,494.41) (0.03) Qtr.II 38,073.40 85,123.08 47,049.67 28,357.05 15,913.29 15,913.29 - 97,566.83 14.26 55.87 2,464.99 0.01 Qtr.III 39,995.88 82,819.61 42,823.73 26,880.84 17,251.34 17,251.34 - 92,449.11 12.90 57.40 8,337.54 0.03 Qtr.IV 41,140.08 118,506.49 77,366.41 28,543.82 18,006.38 18,006.38 - 129,043.93 17.23 58.71 (26,020.41) (0.09)
2019/20 Qtr.I 43,740.81 116,740.09 72,999.28 25,980.84 18,605.21 18,605.21 - 124,115.72 15.70 57.37 2,290.04 0.01 Qtr.II 45,358.63 117,120.70 71,762.07 23,973.08 21,056.84 21,056.84 - 120,036.93 14.67 60.26 6,788.45 0.02 Qtr.III 47,088.05 114,998.82 67,910.77 24,606.29 23,358.51 23,358.51 - 116,246.59 13.63 62.54 30,715.28 0.09 Qtr.IV 49,370.84 136,738.41 87,367.57 35,116.52 24,579.24 24,579.24 - 147,275.68 16.61 62.77 (11,125.89) (0.03)
2020/21 Qtr.I 53,516.97 184,698.60 131,181.63 33,204.14 27,650.16 27,650.16 - 190,252.58 19.61 60.67 (31,821.59) (0.08) Qtr.II 57,514.76 146,676.51 89,161.75 43,367.05 30,184.61 30,184.61 - 159,858.95 15.28 59.88 (28,127.24) (0.07)
1. Actual Reserve: Reserves with the National Bank of Ethiopia Plus Cash in Hand (Local Currency). 2. Liquidity Ratio: Actual Reserves + Foreign Asset, net of short term liabilities, divided by Demand Deposits, net. 3. Ratio of Loans and Advances to Deposits: Gross Commercial Bank Loans and discounts plus credit to Central Government divided by Gross Demand Deposits (of private and others) + Demand Deposits of domestic banks + Time and Savings Deposits + Government Deposits with commercial banks. 4. Debit Balance: Total Debit Balance less debit against the deposits of the commercial banks. 5. Turnover of Deposits: Debit Balances divided by Gross Demand Deposits of private and others + Government Deposits.

| 97
Table 10: Circulating Notes and Coins by Denomination (In Millions of Birr)
End of Period
Value of Notes & Coins
Denomination of Notes: Birr Denominations of Coins: CentsTotal
Value (Notes)
1 5 10 50 100 200Total
Value (Coins)
1 5 10 25 50 100(coin)
2008/09 Qtr.I 6,788.5 6,591.0 417.0 162.8 2,456.7 3,554.5 13,600.0 197.5 0.8 30.4 69.6 37.8 58.9 Qtr.II 7,177.9 6,974.0 441.7 259.8 2,514.7 3,757.7 14,952.0 203.9 0.8 31.3 71.5 39.4 60.8 Qtr.III 7,452.4 7,242.4 459.8 268.9 2,581.7 3,931.9 16,576.4 210.1 0.8 32.2 73.0 41.3 62.8 Qtr.IV 7,034.6 6,818.9 449.0 245.7 2,227.0 3,897.3 17,099.3 215.7 0.8 33.2 74.3 42.8 64.72009/10
Qtr.I 6,424.3 6,203.5 426.3 231.8 2,023.7 3,521.7 16,612.0 220.7 0.9 33.9 75.6 44.1 66.2 Qtr.II 6,689.4 6,464.9 458.5 258.6 2,023.7 3,724.2 19,321.9 224.5 0.9 34.3 76.8 45.2 67.3 Qtr.III 7,727.5 7,497.9 466.2 364.7 2,943.1 3,723.9 20,605.6 229.6 0.9 34.8 78.9 45.9 69.2 Qtr.IV 7,282.1 7,046.3 462.6 356.9 2,842.9 3,383.9 21,530.6 235.8 0.9 35.4 80.6 46.6 72.32010/11
Qtr.I 7,303.7 6,960.8 482.3 366.6 2,618.5 3,493.4 23,316.4 342.9 1.0 36.2 83.5 52.0 127.7 42.5 Qtr.II 8,178.7 7,835.2 404.1 223.3 3,124.9 4,082.8 25,896.0 343.5 1.0 36.2 83.6 50.9 122.9 49.0 Qtr.III 9,673.9 9,396.0 471.9 310.0 4,012.5 4,601.5 27,803.9 278.0 1.0 36.3 83.9 26.1 73.1 57.6 Qtr.IV 8,781.1 8,485.1 482.9 293.4 3,425.0 4,283.8 30,363.2 296.0 0.8 37.0 86.0 30.1 76.3 65.9
2011/12 Qtr.I 9,219.4 8,912.8 486.5 287.1 3,526.7 4,612.6 29,562.4 306.6 0.8 37.2 86.8 31.0 77.6 73.2 Qtr.II 10,552.7 10,233.0 496.5 287.4 3,563.9 5,885.1 31,503.3 319.7 0.8 37.2 87.0 32.4 81.3 80.9Qtr.III 13,387.9 13,060.6 661.5 659.5 4,605.1 7,134.5 31,330.1 327.3 0.8 37.2 87.7 33.9 84.5 83.1Qtr.IV 5,100.8 4,767.1 626.3 514.8 1,144.0 2,482.0 40,701.3 333.7 0.8 37.3 88.4 35.2 86.4 85.6
2012/13 Qtr.I 6,211.5 5,963.9 677.6 626.9 1,545.6 3,113.7 40,027.1 247.6 0.8 27.3 69.6 6.9 55.8 87.3Qtr II 9,019.3 8,764.0 700.2 465.3 2,533.4 5,065.1 41,963.6 255.3 0.8 28.2 70.7 8.9 58.6 88.1Qtr II 11,257.6 10,985.5 614.7 513.6 3,368.2 6,488.9 43,080.0 272.2 0.8 28.5 73.8 14.2 66.9 88.0Qtr.IV 11,586.7 11,225.8 659.6 533.0 3,430.7 6,602.4 43,407.0 360.9 0.8 34.2 84.0 57.7 96.0 88.3
2013/14 Qtr.I 11,262.4 10,893.1 683.6 589.5 3,222.9 6,397.1 39,329.5 369.3 0.8 34.2 84.9 59.0 98.1 92.2Qtr.II 11,472.5 11,098.5 692.6 609.2 3,321.6 6,475.1 41,023.4 374.0 0.8 34.4 85.3 59.6 99.1 94.9Qtr.III 11,029.7 10,617.7 659.9 867.2 2,421.4 6,669.2 53,612.6 412.0 0.8 39.3 94.9 61.9 100.1 114.9Qtr.IV 11,108.5 10,683.8 634.9 906.9 2,368.8 6,773.2 53,364.4 424.8 0.8 39.5 95.4 62.8 101.4 124.8
2014/15 Qtr.I 10,917.9 10,477.9 618.3 964.8 2,339.5 6,555.3 52,928.7 440.1 0.8 39.7 95.9 63.9 102.9 136.8Qtr.II 12,314.8 11,858.1 602.5 1,097.3 2,550.7 7,607.6 58,526.7 456.6 0.8 39.9 96.2 64.5 104.0 151.2Qtr.III 12,693.4 12,212.3 589.0 1,161.0 2,695.0 7,767.3 61,776.9 481.1 0.8 40.0 96.7 65.6 105.9 172.1Qtr.IV 12,383.0 11,871.1 557.8 1,177.8 2,675.6 7,459.8 62,975.8 511.9 0.8 40.1 97.1 66.4 107.3 200.1
2015/16 Qtr.I 12,327.4 11,777.6 538.9 1,209.0 2,725.7 7,304.0 62,536.1 549.8 0.8 40.3 97.6 67.1 108.6 235.4Qtr.II 12,863.1 12,272.6 507.3 1,306.8 2,885.2 7,573.2 65,084.8 590.5 0.8 40.5 97.9 67.8 109.8 273.7Qtr.III 12,624.2 11,979.8 479.6 1,325.7 2,807.1 7,367.4 67,752.0 644.4 0.8 40.6 98.3 68.3 110.7 325.6QIV 13,164.0 12,466.9 455.8 1,337.4 2,766.9 7,906.8 69,600.9 697.1 0.8 40.7 98.4 68.7 111.5 376.9
2016/17 Qtr.I 14,241.1 13,500.0 439.3 1,355.6 2,793.4 8,911.7 71,743.1 741.0 0.8 40.9 98.7 69.4 112.5 418.7QII 15,014.6 14,224.9 425.9 1,456.3 2,925.0 9,417.7 75,404.3 789.6 0.8 41.0 98.9 69.9 113.5 465.6QIII 15,312.7 14,470.9 411.7 1,461.3 2,982.7 9,615.2 77,070.3 841.8 0.8 41.1 99.1 70.6 114.7 515.5QIV 15,442.8 14,554.8 403.8 1,418.7 3,010.1 9,722.2 78,972.8 888.0 0.8 41.2 99.4 71.4 115.8 559.3
2017/18 Qtr.I 15,423.3 14,497.0 396.4 1,396.7 3,025.7 9,678.2 79,709.5 926.3 0.8 41.3 99.6 72.0 116.8 595.8QII 16,995.0 16,025.5 393.8 1,506.7 3,423.5 10,701.5 89,111.8 969.5 0.8 41.3 99.7 72.4 117.7 637.6QIII 17,419.4 16,400.5 388.2 1,507.8 3,487.4 11,017.1 95,189.3 1,018.9 0.8 41.4 99.8 72.7 118.6 685.5QIV 17,568.5 16,508.1 384.1 1,467.8 3,512.8 11,143.4 95,512.5 1,060.4 0.8 41.4 99.8 73.0 118.9 726.5
2018/19 Qtr.I 17,125.8 16,038.5 380.4 1,464.1 3,497.5 10,696.4 93,919.9 1,087.3 0.8 41.4 99.8 73.2 119.9 752.2QII 18,732.9 17,612.0 378.1 1,525.6 3,764.1 11,944.2 101,784.7 1,120.9 0.8 41.5 99.7 73.5 120.5 784.9QIII 18,695.3 17,551.8 375.4 1,533.0 3,747.1 11,896.4 106,771.2 1,143.5 0.8 41.5 99.7 73.4 120.6 807.5QIV 18,185.2 17,022.6 374.5 1,535.7 3,724.9 11,387.5 103,782.4 1,162.5 0.8 41.4 99.6 73.4 120.7 826.5
2019/20 Qtr.I 18,032.3 16,859.3 374.8 1,551.8 3,766.4 11,166.3 106,111.5 1,173.0 0.8 41.5 99.5 73.3 121.0 836.9QII 18,740.4 17,559.4 374.2 1,628.5 4,030.4 11,526.2 109,497.7 1,181.0 0.8 41.5 99.5 73.4 121.2 844.6QIII 19,935.3 18,743.4 376.4 1,709.2 4,226.1 12,431.6 119,337.4 1,192.0 0.8 41.4 99.5 73.3 122.5 854.4QIV 19,859.4 18,664.8 375.8 1,674.6 4,389.0 12,225.4 120,817.5 1,194.6 0.8 41.5 99.5 73.2 123.1 856.5
2020/21 Qtr.I 18,165.6 16,968.7 375.8 1,520.3 4,430.4 10,642.3 106,393.0 0.0 1,196.9 0.8 41.4 99.4 73.1 123.3 858.7Qtr.II 82,325.3 81,125.6 373.0 1,538.1 6,611.0 15,844.8 56,691.9 56,758.8 1,199.7 0.8 41.4 99.4 73.1 123.2 861.7

National Bank of Ethiopia Quarterly Bulletin
98 | Second Quarter 2020/21
Table 11: Interest Rate StructuresA. Lending rates (by CBE and specialized banks)
SectorThrough September 30, 1992 Oct. 1,
1992- Aug 31,
1994
Sept.1,1994- Jan. 1, 1995Cooperatives State Private
Agriculture 5 6 7 11.0-12 Lending to all sectors 14-15 Industry, mining, power, and water resources 6 8 9 13.0-14 Domestic trade 6 8 9.5 14.0-15 Lending to the Central Gov't 12-13 Transport and communications 6 8 8 13.0-14 Export trade 6 6 6 13.0-14 NBE Lending to:
CBEs/ Discount Rate/10.5
Import trade (agricultural inputs) 5 6 7 14.0-15 Import trade (other) 6 8 9.5 14.0-15 Hotels and tourism 6 8 9 14.0-15 Other Financial Inst. 10.5 Construction 6 8 9 11.0-12 Housing (1) purchase 6 6 8 11.0-12 Interbank Rate 10(2) construction 4.5 4.5 7 11.0-12 Central Government -- 3.0-5.0 -- 12.0-13 Banks and financial institutions -- 2.5-4.5 -- 10.0 Personal loans -- -- 10 14.0-15
B. Deposit rates
Deposit rates Through Septem-ber 30, 1992
Oct. 1, 1992- Aug 31, 1994
Sept.1,1994- Jan. 1, 1995
1.Time deposits 30 days notice -- 10.5 10.5 3 months to less than 6 months -- 10.5 10.5 6 months to less than 12 months -- 11 11 1 year to less than 2 years Differed by 11.5 11.5
2 years and above ownership and maturity 12 12
Memorandum Items:Rate differentials for 1 year and over Financial institutions (1 year): 1.0 Gov'nt-owned under takings (1 year): 1.0 Individuals, savings and credit cooperatives;self-help organizations: 1 year 6.0 2 years 6.5 3 years 7.0 5 years 7.5Others:1 year 4.0 2 years 0.8 3 years 5.0 5 years 5.5
2.Savings depositsDiffered by ownership and maturity
10 10
Rate differentials:Individuals, savings and credit cooperatives;self-help organizations: Up to Br. 100,000 6.0 In excess of Br. 100,000 2.0
C. Minimum and Maximum Interest Rates
Minimum and Maximum Interest Rates
Jan. 2, 1995- Nov. 30,
1995
Dec. 1, 1995- May 30,
1996
June 1, 1996-
Sep. 15, 1996
Sep.16,1996-
Dec. 31,1997
Jan. 1,1998-
Mar. 3, 2002
Mar. 4,2002-
01/08/2002
Aug. 2002 to
07/02/200508/02/2005 04/07/2007
04/07/2007 30/11/2010
01/12/2010 to
10-Oct-201711/10/2017 to todate
Minimum interest rates on Timeand Savings Deposits 10 11 10 7 6 3 3 3 4 5 7Maximum lending rate by commercialbanks & other financial institutions, 15 16 15 10.5 Market Market Market Market Market Market Market
except for central government loan determined determined determined determined determined determined determined
Central Government loan 12 12 12 12 6 6 5 3 3 3 3

| 99
Table 12: Government Internal Debt by Holder(In Millions of Birr)
End of Period
Total Gov't
Indebt-ed-ness
1=2+6+9
National Bank of EthiopiaCommercial Banks Others
NBE Total
2=3 to 5
Direct Advance
3
Gov't Bonds
Non-inter-est
bearing 4
Interest bearing
5
Comm. Banks Total 6=7+8
Gov't Bonds
7
Treasury Bills 8
Others Total
9=10+11
Gov't Bonds
10
Treasury Bills 11
2009/10Qtr.I 56,667.53 44,326.63 34,771.00 9,193.63 362.00 5,740.11 3,469.42 2,270.69 6,600.79 370.61 6,230.18 Qtr.II 55,892.60 43,610.83 34,055.20 9,193.63 362.00 5,177.56 3,456.84 1,720.73 7,104.20 354.21 6,749.99 Qtr.III 58,879.96 45,989.73 36,434.10 9,193.63 362.00 5,627.86 3,456.84 2,171.02 7,262.37 310.91 6,951.46 Qtr.IV 59,921.16 45,522.78 36,044.10 9,124.68 354.00 7,415.27 3,319.45 4,095.82 6,983.11 310.91 6,672.20
2010/11Qtr.I 60,527.51 47,983.68 38,557.10 9,124.68 301.90 5,480.72 3,047.24 2,433.48 7,063.11 310.91 6,752.20 Qtr.II 61,613.17 50,488.58 41,062.00 9,124.68 301.90 4,102.86 2,784.66 1,318.20 7,021.72 269.31 6,752.41 Qtr.III 64,015.49 51,930.58 42,504.00 9,124.68 301.90 4,953.20 2,784.45 2,168.75 7,131.71 269.30 6,862.41 Qtr.IV 69,415.23 55,614.64 46,265.00 9,055.74 293.90 3,568.67 2,670.28 898.39 10,231.92 269.30 9,962.62
2011/12Qtr.I 71,051.95 55,566.48 46,264.95 9,055.74 245.80 4,121.67 2,424.58 1,697.09 11,363.80 251.20 11,112.60 Qrt.II 71,122.32 55,562.48 46,264.95 9,055.74 241.80 2,857.24 2,423.24 434.00 12,702.60 251.20 12,451.40 Qrt.III 75,502.17 55,562.48 46,264.95 9,055.74 241.80 3,068.28 2,419.19 649.10 16,871.40 200.00 16,671.40 Qtr.IV 77,812.02 55,562.48 46,264.95 9,055.74 241.80 4,421.18 2,419.19 2,001.99 17,828.36 200.00 17,628.36
2012/13Qtr.I 82,079.07 55,510.38 46,264.95 9,055.74 189.70 8,511.89 2,455.93 6,055.97 18,056.80 200.00 17,856.80 Qtr.II 81,380.81 55,510.38 46,264.95 9,055.74 189.70 6,693.03 2,397.57 4,295.46 19,177.40 200.00 18,977.40 Qtr.III 85,794.00 59,510.38 50,264.95 9,055.74 189.70 5,407.49 2,419.75 2,987.74 20,876.14 200.00 20,676.14 Qtr.IV 93,019.21 64,510.38 55,264.95 9,055.74 189.70 5,699.97 2,380.36 3,319.61 22,808.86 200.00 22,608.86
2013/14Qtr.I 91,279.30 64,381.33 55,264.95 8,986.79 129.60 4,089.11 1,753.86 2,335.24 22,808.86 200.00 22,608.86 Qtr.II 90,654.24 64,381.33 55,264.95 8,986.79 129.60 3,464.05 1,753.83 1,710.21 22,808.86 200.00 22,608.86 Qtr.III 97,944.00 73,381.33 64,264.95 8,986.79 129.60 1,753.80 1,753.80 - 22,808.86 200.00 22,608.86 Qtr.IV 107,318.52 73,304.39 64,264.95 8,917.84 121.60 1,629.68 1,629.68 - 32,384.46 97.60 32,286.86
2014/15Qtr.I 109,794.80 73,175.34 64,264.95 8,848.89 61.50 1,227.50 1,227.50 - 35,391.96 97.60 35,294.36 Qtr.II 116,383.35 78,175.34 69,264.95 8,848.89 61.50 1,246.35 1,246.35 - 36,961.66 54.30 36,907.36 Qtr.III 121,824.85 81,175.34 72,264.95 8,848.89 61.50 1,252.35 1,252.35 - 39,397.16 54.30 39,342.86 Qtr.IV 135,190.41 92,175.34 83,264.95 8,848.89 61.50 1,256.02 1,256.02 - 41,759.05 54.30 41,704.76
2015/16Qtr.I 144,937.83 99,657.34 91,264.95 8,344.40 48.00 905.43 905.43 - 44,375.06 54.30 44,320.76 Qtr.II 154,426.63 104,657.34 96,264.95 8,344.40 48.00 905.43 905.43 - 48,863.86 54.30 48,809.56 Qtr.III 159,157.73 104,657.34 96,264.95 8,344.40 48.00 905.43 905.43 - 53,594.96 72.40 53,522.56 Qtr.IV 163,461.01 109,080.40 100,764.95 8,275.45 40.00 785.65 785.65 - 53,594.96 72.40 53,522.56
2016/17 Qtr.I 161,914.19 107,764.95 107,764.95 - - 554.28 554.28 - 53,594.96 72.40 53,522.56 Qtr.II 171,344.89 120,640.85 112,764.95 7,839.90 36.00 554.28 554.28 - 50,149.76 36.20 50,113.56 Qtr.III 184,406.89 129,640.85 121,764.95 7,839.90 36.00 530.28 530.28 - 54,235.76 36.20 54,199.56 Qtr.IV 230,923.31 135,632.85 127,764.95 7,839.90 28.00 21,982.71 21,982.71 - 73,307.76 36.20 73,271.56
2017/18 Qtr.I 251,943.33 150,632.85 142,764.95 7,839.90 28.00 22,208.82 22,208.82 - 79,101.66 18.10 79,083.56 Qtr.II 264,416.12 160,128.85 152,264.95 7,839.90 24.00 22,186.62 22,186.62 - 82,100.66 18.10 82,082.56 Qtr.III 270,410.12 160,128.85 152,264.95 7,839.90 24.00 22,186.62 22,186.62 - 88,094.66 18.10 88,076.56 Qtr.IV 286,601.12 160,128.85 152,264.95 7,839.90 24.00 22,186.62 22,186.62 - 104,285.66 18.10 104,267.56
2018/19 Qtr.I 306,121.07 166,685.30 159,264.95 7,404.35 16.00 22,567.12 22,567.12 - 116,868.66 18.10 116,850.56 Qtr.II 324,319.68 178,685.30 171,264.95 7,404.35 16.00 22,521.73 22,521.73 - 123,112.66 18.10 123,094.56 Qtr.III 334,556.88 182,685.30 175,264.95 7,404.35 16.00 22,952.93 22,952.93 - 128,918.66 18.10 128,900.56 Qtr.IV 353,340.16 194,685.30 187,264.95 7,404.35 16.00 23,620.21 22,970.35 649.86 135,034.66 18.10 135,016.56
2019/20 Qtr.I 364,447.98 199,237.75 192,264.95 6,968.80 4.00 22,927.78 22,927.78 - 142,282.45 18.10 142,264.36 Qtr.II 377,411.83 204,237.75 197,264.95 6,968.80 4.00 23,123.42 22,927.78 195.65 150,050.66 18.10 150,032.56 Qtr.III 400,742.18 221,237.75 214,264.95 6,968.80 4.00 22,927.78 22,927.78 - 156,576.66 18.10 156,558.56 Qtr.IV 447,118.02 243,141.31 44,778.66 6,097.70 192,264.95 36,506.06 23,385.37 13,120.69 167,470.66 18.10 167,452.56
2020/21 Qtr.I 453,775.98 243,141.31 44,778.66 6,097.70 192,264.95 36,506.06 23,385.37 13,120.69 174,128.62 18.10 174,110.52 Qtr.II 469,642.92 248,141.31 49,778.66 6,097.70 192,264.95 32,698.32 23,341.82 9,356.50 188,803.30 18.10 188,785.20

National Bank of Ethiopia Quarterly Bulletin
100 | Second Quarter 2020/21
Table 13. General Government Revenue Quarterly and Annual(In million Birr)
Ethiopian fiscal year 2012 2013
Fiscal year ending July 7 2019/20 2020/21
Budget 3mon(Qrt.I) 6mon Qrt.II 9mon Qrt.III 12mon Qrt.IV Budget 3mon
(QI)6mon (QII)
Tax revenue 311,067.9 73,522.2 167,547.4 94,025.2 241,294.5 73,747.1 311,476.5 70,181.9 374,730.1 82,539.4 121,640.4Direct taxes 127,778.3 27,968.8 74,812.5 46,843.7 102,822.5 28,010.0 132,214.5 29,392.1 140,803.1 34,201.6 66,331.3 Income and profits tax 124,751.6 27,315.0 73,381.0 46,066.0 100,643.8 27,262.8 129,479.3 28,835.5 136,710.7 33,154.0 65,243.0 Personal income 44,392.5 9,169.6 22,964.8 13,795.2 35,965.2 13,000.4 49,869.6 13,904.3 55,133.8 13,232.5 20,060.1 Rental income tax 2,556.5 1,049.6 2,318.6 1,269.0 2,476.5 157.9 2,612.2 135.7 3,231.2 1,170.1 1,548.5 Business profits 65,411.5 14,246.5 42,088.1 27,841.6 52,963.0 10,875.0 64,664.1 11,701.1 57,750.9 16,148.3 40,288.9 Withholding income tax on imports 3,806.8 1,208.3 2,511.4 1,303.1 3,851.7 1,340.3 4,892.7 1,041.0 5,945.4 1,232.9 1,213.5 Agriculture income 565.0 10.7 59.5 48.8 252.6 193.1 365.3 112.7 660.3 10.5 133.8 Other income 5,388.2 984.2 2,152.0 1,167.8 2,947.5 795.5 4,347.0 1,399.4 10,928.8 689.3 1,113.8 Interest income tax 1,770.5 547.9 1,127.7 579.9 1,663.7 536.0 2,132.2 468.6 2,565.9 629.5 824.0 Capital gains tax 860.6 98.3 159.0 60.7 523.6 364.6 596.3 72.7 494.5 40.9 60.4 Rural land use fee 560.7 15.3 65.5 50.2 238.5 173.1 358.0 119.5 450.7 17.6 118.0 Urban land lease fee 2,465.9 638.6 1,366.0 727.4 1,940.1 574.1 2,377.3 437.2 3,641.7 1,030.0 970.3
0.0Domestic indirect taxes 91,956.4 20,490.4 41,054.6 20,564.1 59,807.0 18,752.4 78,886.5 19,079.5 112,547.5 22,028.8 28,755.8 Sales/TOT/excise taxes 45,973.6 9,425.5 18,017.1 8,591.6 26,377.7 8,360.6 35,454.8 9,077.1 60,840.0 11,458.3 14,755.9 Petroleum products 688.3 140.9 323.1 182.2 358.2 35.1 398.2 40.0 863.2 33.8 97.3 Alcohol and tobacco 8,826.5 1,988.8 4,661.9 2,673.0 6,485.8 1,824.0 9,657.7 3,171.8 12,055.8 2,601.5 4,456.8 Other goods 36,458.8 7,295.8 13,032.1 5,736.4 19,533.7 6,501.5 25,398.9 5,865.2 47,920.9 8,823.0 10,201.9 Services TOT/ sales tax 43,707.3 10,453.2 21,399.5 10,946.3 31,013.8 9,614.2 40,264.6 9,250.8 47,743.5 9,853.3 12,977.9 Stamp duties 2,275.4 611.7 1,637.9 1,026.2 2,415.5 777.6 3,167.1 751.5 3,964.1 717.1 1,021.9
0.0Import duties and taxes 91,333.3 25,062.9 51,680.4 26,617.4 78,665.1 26,984.7 100,375.4 21,710.3 121,379.5 26,309.0 26,553.3 Custom duties 31,303.5 8,632.5 17,603.9 8,971.4 26,846.9 9,243.0 34,060.5 7,213.6 44,995.9 9,078.3 9,322.5 Sales/excise taxes 42,430.6 11,583.8 24,042.2 12,458.4 36,383.1 12,340.9 46,560.0 10,176.8 51,611.1 12,084.0 12,111.4 Petroleum products 2,284.3 726.9 1,584.2 857.3 2,248.8 664.7 3,025.3 776.4 3,891.7 497.2 624.5 Alcohol and tobacco 445.9 124.1 217.8 93.6 309.7 91.9 356.0 46.4 825.0 128.2 90.3 Other imports 39,700.4 10,732.8 22,240.2 11,507.5 33,824.6 11,584.4 43,178.7 9,354.0 46,894.4 11,458.5 11,396.5 Surtax on imports 17,599.1 4,846.6 10,034.3 5,187.7 15,435.1 5,400.8 19,755.0 4,319.9 24,772.5 5,146.7 5,119.5Export taxes 0.0 0.0 0.0 0.0 Coffee duties 0.0 0.0 0.0 0.0 Coffee surtax 0.0 0.0 0.0 0.0 Other 0.0 0.0 0.0 0.0 0.0 Transaction tax 0.0 0.0 0.0 0.0 0.0 0.0 0.0 0.0 0.0Non-tax revenue 54,136.2 12,795.2 20,049.4 7,254.2 26,681.1 6,631.7 42,836.3 16,155.2 65,598.4 15,725.4 8,489.4 Charges and fees 3,492.5 1,085.0 2,222.8 1,137.7 3,400.7 1,177.9 4,095.2 694.5 3,800.2 507.4 1,212.6 Sales of goods & services 4,474.2 1,201.5 2,580.2 1,378.7 4,195.0 1,614.8 5,794.2 1,599.2 6,223.0 871.5 1,594.5 Residual surplus, capital charge, interest 0.0 payments and state dividend 19,454.4 7,152.5 8,018.9 866.4 8,443.9 425.0 17,488.90 9,045.0 23,055.6 11,486.7 441.1 Reimbursement & property sales 543.4 25.7 159.1 133.4 178.8 19.7 203.38 24.6 524.1 144.3 53.6 Miscellaneous 10,619.2 2,003.9 3,677.1 1,673.2 5,889.0 2,211.9 7,199.78 1,310.8 12,656.5 1,711.7 3,271.9 Other extraordinary 0.0 0.0 0.0 0.0 0.0 0.0 0.0 0.0 0.0 Privatization proceeds 0.0 0.0 0.0 0.0 0.0 0.0 0.0 0.0 0.0 0.0 Other revenue 15,552.5 1,326.5 3,391.3 2,064.8 4,573.7 1,182.3 8,054.9 3,481.2 19,339.0 1,003.9 1,915.7
Total revenue 365,204.1 86,317.4 187,596.8 101,279.5 267,975.7 80,378.8 354,312.8 86,337.1 440,328.5 98,264.8 130,129.9External grants 36,793.6 4,083.9 9,365.4 5,281.6 14,442.3 5,076.9 40,653.0 26,210.7 45,440.1 11,237.6 11,688.7 Grants in kind/earmarked 18,794.9 3,759.0 8,081.8 4,322.8 13,156.4 5,074.6 17,855.1 4,698.7 24,779.7 5,203.7 5,459.5 Untied cash & CPF/grants 17,998.8 324.9 1,283.6 958.7 1,285.9 2.3 22,797.9 21,512.0 20,660.4 6,033.8 6,229.2
0.0Total revenue and grants 401,997.7 90,401.2 196,962.3 106,561.1 282,418.0 85,455.7 394,965.8 112,547.8 485,768.6 109,502.4 141,818.6

| 101
Table 14. General Government Quarterly ExpenditureEthiopian fiscal year 2012 2013
Fiscal year ending July 7 2019/20 2020/21
Budget 3mon(Qrt.I) 6mon Qrt.II 9mon Qrt.III 12mon Qrt.IV Budget 3 Mon(QI) 6Mon(QII)
A. Capital ExpenditureEconomic development 145,030.4 22,862.7 51,179.8 28,317.1 78,260.3 27,080.5 132,629.1 54,368.8 168,099.0 23,577.2 38,993.6 Agriculture 20,861.6 3,888.9 8,652.0 4,763.1 13,675.0 5,023.0 22,383.73 8,708.8 22,672.1 6,421.7 9,749.2 Natural Resource 30,003.2 2,726.1 7,153.8 4,427.7 11,280.1 4,126.3 22,116.65 10,836.6 33,821.7 1,916.2 5,157.4 o/w: Water 29,957.3 2,724.0 7,071.8 4,347.8 11,273.4 4,201.6 21,921.86 10,648.5 30,066.6 1,839.9 3,548.1 Mines & Energy 49.8 2.5 15.6 13.1 23.6 8.0 34.64 11.1 59.4 402.3 361.7 Trade, Industry & Tourism 6,790.8 155.4 1,011.5 856.1 2,036.2 1,024.7 4,545.58 2,509.3 7,255.5 578.9 626.1 Urban dev't & housing 25,269.8 4,504.0 10,148.7 5,644.7 15,331.9 5,183.3 26,837.44 11,505.5 29,008.8 2,858.9 6,091.8 Road construction 57,637.5 11,311.1 21,974.5 10,663.4 32,503.1 10,528.6 51,429.14 18,926.0 70,137.9 11,164.4 16,113.3 Transport & communication 4,417.7 274.7 2,223.8 1,949.1 3,410.4 1,186.6 5,281.95 1,871.5 5,143.5 234.9 894.0
Social Development 51,314.6 10,759.9 22,661.2 11,901.3 31,965.7 9,304.5 51,316.1 19,350.4 61,251.9 8,312.4 14,964.8 Education 29,380.8 8,207.8 14,312.5 6,104.7 19,854.0 5,541.5 33,203.5 13,349.5 33,432.9 4,356.4 7,704.4 Health 15,626.4 2,116.4 6,882.8 4,766.3 10,354.1 3,471.3 15,019.3 4,665.2 21,848.3 3,523.8 6,028.3 Socail welfare 1,445.1 46.9 359.8 312.9 651.7 291.8 989.9 338.2 1,827.7 167.2 261.5 Culture & sport 4,862.3 388.7 1,106.1 717.4 1,105.9 2,103.4 997.5 4,143.0 265.1 970.6
General Development 22,926.5 1,887.6 5,061.0 3,173.4 8,448.4 3,387.4 20,231.0 11,782.5 28,972.1 1,422.2 6,171.3Compensation payments 0.0 0.0 0.0 0.0 0.0 0.0 0.0 0.0 0.0 0.0 0.0External assistance 18,794.9 3,759.0 8,081.8 4,322.8 13,156.4 5,074.6 17,855.1 4,698.7 24,779.7 5,203.7 5,459.5Sub Total Capital Expenditure 219,271.5 35,510.1 78,902.0 43,391.9 118,674.4 39,772.4 204,176.1 85,501.7 258,322.9 33,311.8 60,129.7
B. Current Expenditure General Services 77,008.6 15,035.1 37,075.7 22,040.7 59,840.1 22,764.4 89,920.2 30,080.1 89,164.4 18,506.7 41,117.5 Organ of the State 12,632.8 2,332.1 5,858.3 3,526.2 9,894.5 4,036.2 15,302.1 5,407.6 14,761.4 2,675.3 6,551.3 Justice 8,575.5 1,590.9 4,808.7 3,217.8 7,926.9 3,118.2 10,377.0 2,450.1 11,361.5 1,890.3 3,484.9 Defence 15,000.0 3,586.8 7,443.2 3,856.4 12,131.0 4,687.7 16,908.2 4,777.3 16,500.0 1,937.8 16,451.3 Public order & security 20,581.8 3,875.7 8,984.3 5,108.6 14,226.8 5,242.5 24,174.2 9,947.4 23,719.3 7,091.6 4,816.0 Other General services 20,218.5 3,649.5 9,981.2 6,331.6 15,661.0 5,679.9 23,158.7 7,497.7 22,822.3 4,911.6 9,814.1 Economic Services 37,281.8 5,523.7 15,131.6 9,607.9 23,563.2 8,431.6 36,323.1 12,759.9 42,675.5 7,824.3 13,120.9 Agriculture&natural resource 24,511.7 3,359.1 9,753.6 6,394.5 14,930.4 5,176.8 23,198.7 8,268.3 28,137.2 5,044.8 8,005.7Agriculture 19,298.3 2,967.6 7,360.7 4,393.2 11,453.5 4,092.8 17,895.3 6,441.7 23,283.2 4,536.5 6,406.3 Natural resource 5,213.4 391.5 2,392.8 2,001.3 3,476.9 1,084.1 5303.5 1,826.6 4,854.0 508.3 1,599.5 o/w: Water 5,128.5 349.8 1,760.0 1,410.2 2,577.4 817.4 4753.4 2,176.0 4,569.7 446.8 1,549.8 Trade, Industry & Tourism 6,595.2 1,199.7 3,173.0 1,973.3 5,127.0 1,954.0 7,795.5 2,668.6 6,370.0 1,381.6 2,487.1 Mines & Energy 192.4 48.2 102.0 53.8 148.3 46.2 188.8 40.5 233.7 73.4 96.0 Tourism 0.0 0.0 0.0 0.0 0.0 0.0 0.0 0.0 111.4 158.2 200.5 Transport & communication 1,497.1 146.9 355.6 208.7 585.6 230.0 927.3 341.7 2,411.5 186.3 865.6 Urban devt. & construction 3,387.4 615.3 1,527.1 911.8 2,348.3 821.2 3667.0 1,318.7 4,672.7 814.6 1,284.8 o/w: Road Construction 1,361.6 305.4 856.3 550.9 1,298.6 442.4 2029.5 730.8 2,008.7 459.0 457.5 Economic development studies 1,098.0 154.5 220.3 65.8 423.7 203.4 545.8 122.1 738.9 165.5 181.1 Social Services 114,933.3 22,659.6 54,534.3 31,874.7 84,026.8 29,492.5 130,356.0 46,329.2 158,327.1 29,828.8 47,393.5 Education & training 80,686.1 15,491.1 37,667.7 22,176.6 58,395.8 20,728.1 86,411.4 28,015.7 103,759.0 20,804.9 31,450.7 Culture & sports 3,539.6 563.1 1,251.7 688.6 2,006.2 754.4 2,817.6 811.4 3,199.3 603.0 755.1 Public health 29,071.1 4,138.9 11,735.4 7,596.5 19,227.6 7,492.2 33,464.7 14,237.1 37,521.0 6,428.1 11,570.5 Labour & social welfare 1,011.8 240.9 644.7 403.8 1,042.5 397.9 1,878.2 835.6 2,050.9 367.3 277.3 Rehabilitation 624.7 2,225.6 3,234.8 1,009.2 3,354.7 119.9 5,784.0 2,429.3 11,796.8 1,625.6 3,339.8 Interest & Charges 17,407.8 8,106.3 6,990.8 -1,115.5 11,341.6 4,350.8 13,481.1 2,139.5 19,765.1 1,819.1 9,090.5 Internal debt 9,351.2 6,746.2 3,658.4 -3,087.8 6,376.0 2,717.6 6,366.5 -9.5 10,012.5 988.5 6,586.0 External debt 8,056.6 1,360.0 3,332.3 1,972.3 4,965.6 1,633.2 7,114.6 2,149.0 9,752.6 830.6 2,504.5 O/w: defence commercial 0.0 0.0 0.0 0.0 Miscellaneous 24,422.6 826.2 2,414.4 1,588.2 3,934.1 1,519.6 5,886.6 1,952.5 14,002.8 1,163.1 2,387.4 External assistance * 0.0 0.0 0.0 0.0 0.0 0.0 0.0 0.0 0.0 0.0 0.0 Sub Total Current Expenditure 271,054.2 52,150.8 116,146.9 63,996.0 182,705.8 66,559.0 275,967.0 93,261.2 323,934.9 59,142.1 113,109.8Grand Total Expenditure 490,325.7 87,660.9 195,048.9 107,388.0 301,380.3 106,331.4 480,143.2 178,762.9 582,257.9 92,453.9 173,239.5* Estimated valueRe = First Quarter Capital part is reviesed
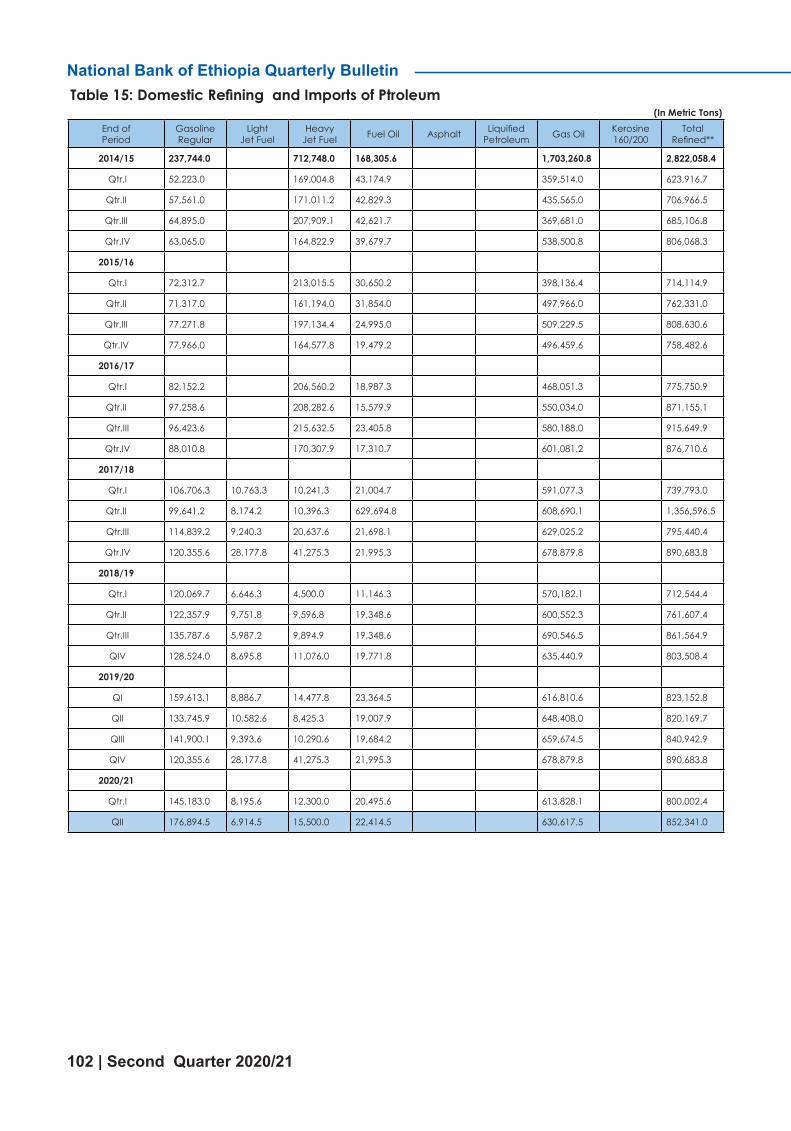
National Bank of Ethiopia Quarterly Bulletin
102 | Second Quarter 2020/21
Table 15: Domestic Refining and Imports of Ptroleum (In Metric Tons)
End of Period
Gasoline Regular
Light Jet Fuel
Heavy Jet Fuel Fuel Oil Asphalt Liquified
Petroleum Gas Oil Kerosine 160/200
Total Refined**
2014/15 237,744.0 712,748.0 168,305.6 1,703,260.8 2,822,058.4
Qtr.I 52,223.0 169,004.8 43,174.9 359,514.0 623,916.7
Qtr.II 57,561.0 171,011.2 42,829.3 435,565.0 706,966.5
Qtr.III 64,895.0 207,909.1 42,621.7 369,681.0 685,106.8
Qtr.IV 63,065.0 164,822.9 39,679.7 538,500.8 806,068.3
2015/16
Qtr.I 72,312.7 213,015.5 30,650.2 398,136.4 714,114.9
Qtr.II 71,317.0 161,194.0 31,854.0 497,966.0 762,331.0
Qtr.III 77,271.8 197,134.4 24,995.0 509,229.5 808,630.6
Qtr.IV 77,966.0 164,577.8 19,479.2 496,459.6 758,482.6
2016/17
Qtr.I 82,152.2 206,560.2 18,987.3 468,051.3 775,750.9
Qtr.II 97,258.6 208,282.6 15,579.9 550,034.0 871,155.1
Qtr.III 96,423.6 215,632.5 23,405.8 580,188.0 915,649.9
Qtr.IV 88,010.8 170,307.9 17,310.7 601,081.2 876,710.6
2017/18
Qtr.I 106,706.3 10,763.3 10,241.3 21,004.7 591,077.3 739,793.0
Qtr.II 99,641.2 8,174.2 10,396.3 629,694.8 608,690.1 1,356,596.5
Qtr.III 114,839.2 9,240.3 20,637.6 21,698.1 629,025.2 795,440.4
Qtr.IV 120,355.6 28,177.8 41,275.3 21,995.3 678,879.8 890,683.8
2018/19
Qtr.I 120,069.7 6,646.3 4,500.0 11,146.3 570,182.1 712,544.4
Qtr.II 122,357.9 9,751.8 9,596.8 19,348.6 600,552.3 761,607.4
Qtr.III 135,787.6 5,987.2 9,894.9 19,348.6 690,546.5 861,564.9
QIV 128,524.0 8,695.8 11,076.0 19,771.8 635,440.9 803,508.4
2019/20
QI 159,613.1 8,886.7 14,477.8 23,364.5 616,810.6 823,152.8
QII 133,745.9 10,582.6 8,425.3 19,007.9 648,408.0 820,169.7
QIII 141,900.1 9,393.6 10,290.6 19,684.2 659,674.5 840,942.9
QIV 120,355.6 28,177.8 41,275.3 21,995.3 678,879.8 890,683.8
2020/21
Qtr.I 145,183.0 8,195.6 12,300.0 20,495.6 613,828.1 800,002.4
QII 176,894.5 6,914.5 15,500.0 22,414.5 630,617.5 852,341.0

| 103
Table 16 : GDP By Economic Activity at Constant Prices (In millions of Birr)
Sectors/Year2004 2005 2006 2007 2008 2009 2010 2011 2012
2011/12 2012/13 2013/14 2014/15 2015/16 2016/17 2017/18 2018/19 2019/20
Agriculture, Hunting and Forestry 441,832.9 473,132.2 498,733.6 530,341.5 542,700.2 579,022.9 599,331.4 622,220.3 648,711.8
Crop 270,881.6 293,063.1 312,338.7 334,768.6 346,293.6 374,649.8 392,291.8 404,049.6 422,966.5
Animal Farming and Hunting 132,843.6 139,692.4 142,601.9 149,246.8 146,959.5 153,170.4 154,038.0 163,279.5 168,722.4
Forestry 43,440.5 44,867.9 46,751.8 48,368.2 49,447.1 51,202.7 53,001.7 54,891.1 57,022.9
Fishing 668.4 797.8 1,057.4 1,381.1 1,381.9 1,389.4 1,546.7 1,581.8 1,614.0
Mining and Quarrying 8,265.7 8,784.6 8,506.2 6,328.5 6,116.8 4,296.9 3,402.8 2,658.9 5,089.3
Manufacturing 46,752.0 54,668.7 63,764.0 75,383.5 89,246.7 111,249.6 117,410.7 127,986.7 137,601.5
Large and Medium Scale Manufacturing 26,985.0 33,516.2 40,743.0 50,174.6 61,687.4 73,528.2 77,966.5 87,691.9 96,268.6
Small Scale and Cottage Industries 24,366.4 24,838.1 25,895.4 26,874.8 27,559.2 37,721.5 39,444.2 40,294.7 41,332.9
Electricity and Water 7,802.9 8,585.3 9,165.6 9,577.4 11,015.5 11,552.5 11,929.0 14,115.4 15,136.4
Construction 84,041.1 116,588.0 144,420.0 190,028.6 237,545.0 286,749.6 331,691.4 381,443.8 419,078.0
Whole Sale and Retail Trade 128,411.1 141,360.7 166,337.5 186,850.2 202,241.5 215,351.0 241,936.3 268,037.0 285,293.1
Hotels and Restaurants 18,403.7 21,925.0 27,758.6 35,971.8 41,601.3 41,625.2 44,335.3 48,143.8 49,220.4
Transport and Communications 128,411.1 141,360.7 166,337.5 186,850.2 202,241.5 215,351.0 241,936.3 104,436.2 105,579.6
Financial Intermediation 18,403.7 21,925.0 27,758.6 35,971.8 41,601.3 41,625.2 44,335.3 57,368.6 65,290.3
Real Estate, Renting and Business Activities 57,543.4 59,781.2 62,114.2 64,690.9 67,062.9 70,005.2 74,364.3 79,942.0 87,510.2
Public Administration and Defense 45,760.0 49,253.6 54,681.3 57,979.5 62,259.2 70,488.5 76,754.1 83,662.0 85,612.2
Education 31,596.6 34,781.5 35,679.7 38,963.0 42,385.6 41,031.0 42,520.8 44,221.6 44,784.1
Health and Social Work 9,341.3 10,489.0 12,510.3 14,137.2 15,669.4 16,767.9 18,153.4 20,747.2 23,414.2
Other Community , Social & Personal Services 13,986.4 16,560.4 17,193.4 17,828.7 18,371.3 19,198.4 20,178.0 21,454.2 21,995.5
Private Households with Employed Persons 13,069.3 14,136.1 14,758.3 15,401.2 16,063.8 16,633.3 17,276.0 17,707.4 18,115.5
Total 1,011,606.3 1,111,987.7 1,227,058.7
1,355,280.4
1,463,883.2
1,613,519.9
1,739,254.9
1,895,726.7
2,014,046.2
Less : FISIM 8,274.0 8,803.4 10,512.8 12,393.0 14,485.8 17,038.3 19,763.6 21,037.4 24,527.2
Gross Value Added at Constant Basic Prices 1,002,766.9
1,102,467.8
1,216,015.3
1,342,555.9
1,449,397.5
1,596,481.6
1,719,491.3
1,874,689.3
1,989,519.0
Taxes on Products 80,410.1 95,162.9 104,547.5 115,169.8 118,700.0 120,645.6 114,575.2 112,468.2 119,603.2
GDP at Constant Market Prices 1,083,133.7
1,197,753.9
1,320,688.1
1,457,857.6
1,568,097.5
1,717,127.2
1,834,066.5
1,987,157.5
2,109,122.2
Source:MoFED

National Bank of Ethiopia Quarterly Bulletin
104 | Second Quarter 2020/21
Table 17 : Growth Rate Of GDP By Economic Activity at Constant Prices ( In percent)
Industry/Year2000 2001 2002 2003 2004 2005 2006 2007 2008 2009 2010 2011 2012
2007/08 2008/09 2009/10 2010/11 2011/12. 2012/13 2013/14 2014/15 2015/16 2016/17 2017/18 2018/19 2019/20
Agriculture, Hunting and Forestry 7.5 6.4 7.6 9.0 4.9 7.1 5.4 6.3 2.3 6.7 3.5 3.8 4.3
Crop 8.0 6.5 8.7 10.3 5.0 8.2 6.6 7.2 3.4 8.2 4.7 3 4.7
Animal Farming and Hunting 7.3 7.0 6.2 7.5 5.4 5.2 2.1 4.7 -1.5 4.2 0.6 6 3.3
Forestry 4.2 3.1 3.3 3.0 3.1 3.3 4.2 3.5 2.2 3.6 3.5 3.8 3.9
Fishing 34.0 26.5 1.7 5.9 21.3 19.4 32.5 30.6 0.1 0.5 11.3 2.3 2
Mining and Quarrying 21.4 12.8 44.2 57.7 12.7 6.3 -3.2 -25.6 -3.3 -29.8 -20.8 -21.9 91.4
Manufacturing 10.3 9.1 11.6 12.1 11.8 16.9 16.6 18.2 18.4 24.7 5.5 7.7 7.5
Large and Medium Scale Manu-facturing 12.6 10.3 13.6 14.1 15.9 24.2 21.6 23.1 22.9 19.2 6.0 10 9.8
Small Scale and Cottage Industries 5.6 6.4 7.0 7.2 4.2 1.9 4.3 3.8 2.5 36.9 4.6 3 2.6
Electricity and Water 4.8 5.0 2.5 19.1 13.5 10.0 6.8 4.5 15.0 4.9 3.3 4 7.2
Construction 11.3 11.7 10.9 12.8 31.5 38.7 23.9 31.6 25.0 20.7 15.7 15 9.9
Whole Sale and Retail Trade 15.8 11.7 9.3 5.9 12.5 10.1 17.7 12.3 8.2 6.5 12.3 11.7 6.4
Hotels and Restaurants 23.3 23.9 24.3 24.6 10.1 19.1 26.6 29.6 15.6 0.1 6.5 9 2.2
Transport and Communications 11.5 8.9 14.4 9.7 12.6 16.5 12.7 13.3 13.7 15.1 6.4 21 1.1
Financial Intermediation 28.1 16.5 -0.3 23.7 23.6 -12.2 14.3 7.5 9.6 18.3 10.7 10.1 10.2
Real Estate, Renting and Business Activities 17.3 15.9 20.0 22.1 3.8 3.9 3.9 4.1 3.7 4.4 6.2 7.5 9.5
Public Administration and Defense 12.5 18.4 8.9 9.4 3.1 7.6 11.0 6.0 7.4 13.2 8.9 9 2.3
Education 14.8 13.0 17.0 4.4 4.5 10.1 2.6 9.2 8.8 -3.2 3.6 4 1.8
Health and Social Work 15.5 20.4 14.0 6.2 9.4 12.3 19.3 13.0 10.8 7.0 8.3 14.3 12.9
Other Community , Social & Person-al Services 11.7 6.4 8.1 4.9 12.4 18.4 3.8 3.7 3.0 4.5 5.1 6.3 2.5
Private Households with Employed Persons 5.3 3.8 4.8 5.1 16.1 8.2 4.4 4.4 4.3 3.5 3.9 2.5 2.3
Total 11.4 10.1 10.5 11.4 8.6 9.9 10.3 10.4 8.0 10.2 7.8 8.9 6.2
Less : FISIM 30.0 12.5 7.6 11.1 -10.6 6.4 19.4 17.9 16.9 17.6 16.0 7 14.3
Gross Value Added at Constant Basic Prices 11.2 10.0 10.6 11.4 8.7 9.9 10.3 10.4 8.0 10.1 7.7 9 6.1
Taxes on Products 5.6 -8.3 45.4 8.6 8.0 18.3 9.9 10.2 3.1 1.6 -5.0 -1.8 6.3
GDP at Constant Market Prices 10.8 8.8 12.6 11.2 8.6 10.6 10.3 10.4 7.6 9.5 6.8 8.3 6.1
Source:MoFED

| 105
Tabl
e 18
: GDP
by
Econ
omic
Act
ivity
at C
urre
nt P
rices
(In
mill
ion
Birr)
Ind
ustry
/Yea
r20
0120
0220
0320
0420
0520
0620
0720
0820
0920
1020
1120
12
2008
/09
2009
/10
2010
/11
2001
1/12
2012
/13
2013
/14
2014
/15
2015
/16
2016
/17
2017
/18
2018
/19
2019
/20
Agr
icul
ture
, Hun
ting
and
For
estry
160
,639
1
65,6
42
220
,095
3
43,0
66
370
,012
4
22,9
02
484
,026
5
42,7
00
616
,843
6
84,6
44
910
,589
1
,196
,254
Cro
p 1
11,1
54
108
,553
1
43,1
54
234
,212
2
38,0
52
272
,201
3
09,3
49
346
,294
3
93,3
24
427
,193
5
87,2
16
797
,016
Ani
mal
Far
min
g an
d H
untin
g 3
4,42
5 4
0,53
9 5
6,58
4 8
2,07
0 1
01,7
28
113
,693
1
32,2
87
146
,960
1
64,7
30
191
,867
2
47,3
37
303
,074
Fore
stry
15,
416
16,
737
19,
713
24,
326
30,
470
36,
789
42,
608
49,
447
58,
788
65,
584
76,
036
96,
164
Fish
ing
151
1
98
217
4
55
685
7
96
1,2
25
1,3
82
2,2
59
2,3
51
3,0
21
3,7
20
Min
ing
and
Qua
rryin
g 1
,142
2
,226
7
,062
9
,645
1
0,04
5 8
,986
6
,259
6
,117
4
,840
4
,053
3
,368
9
,643
Man
ufac
turin
g 1
9,37
0 2
2,66
3 2
7,66
1 3
7,27
2 4
6,80
3 6
1,74
4 8
3,37
0 8
9,24
7 1
13,3
87
128
,200
1
50,5
31
178
,972
Larg
e an
d M
ediu
m S
cale
Man
ufac
turin
g 1
1,05
4 1
2,97
0 1
5,40
3 2
1,44
8 2
8,78
7 4
0,11
1 5
8,04
0 6
1,68
7 7
4,76
3 8
4,79
1 1
04,7
23
125
,758
Smal
l Sca
le a
nd C
otta
ge In
dus
tries
10,
344
12,
036
15,
460
19,
541
21,
088
23,
844
24,
972
27,
559
38,
624
43,
410
45,
807
53,
215
Elec
trici
ty a
nd W
ater
4,5
47
5,3
74
6,4
02
8,0
79
9,6
04
10,
752
10,
560
11,
015
13,
714
15,
026
18,
726
23,
827
Con
stru
ctio
n 1
6,18
0 1
5,98
8 2
0,18
3 3
1,45
9 4
8,33
8 8
8,41
0 1
48,1
98
237
,545
3
00,2
09
452
,978
4
95,2
83
567
,201
Who
le S
ale
and
Ret
ail T
rad
e 5
2,09
2 5
8,52
6 7
3,17
5 1
05,9
14
117
,028
1
51,4
50
187
,022
2
02,2
41
225
,076
2
75,5
13
360
,656
4
44,5
06
Hote
ls an
d R
esta
uran
ts 4
,546
6
,521
9
,558
1
3,35
5 1
8,00
4 2
4,95
4 3
3,84
1 4
1,60
1 4
4,92
2 5
3,44
1 6
6,59
7 7
9,30
4
Tran
spor
t and
Com
mun
icat
ions
11,
035
13,
815
21,
385
31,
954
41,
221
49,
215
57,
579
70,
453
77,
659
82,
947
99,
884
140
,237
Fina
ncia
l Int
erm
edia
tion
5,9
84
6,1
33
8,9
61
14,
214
19,
936
24,
206
32,
684
39,
769
51,
810
69,
359
85,
044
102
,426
Real
Est
ate,
Ren
ting
and
Bus
ines
s Act
iviti
es 1
9,49
4 2
9,06
3 4
0,75
5 4
7,77
6 5
4,74
6 6
0,28
3 6
3,82
5 6
7,06
3 7
0,79
3 7
9,55
3 1
06,1
57
154
,804
Publ
ic A
dm
inist
ratio
n an
d D
efen
se 1
7,11
1 2
0,22
6 2
6,34
6 2
9,96
7 3
5,40
1 4
1,30
9 5
1,52
1 6
2,25
9 8
0,81
7 9
4,61
4 1
03,2
62
120
,236
Educ
atio
n 1
0,31
1 1
2,33
6 1
3,86
2 1
7,09
2 2
1,63
7 2
8,73
9 3
5,38
8 4
2,38
6 6
1,12
3 7
5,77
6 8
5,73
9 9
4,19
9
Heal
th a
nd S
ocia
l Wor
k 3
,326
3
,942
4
,931
5
,966
7
,593
9
,881
1
2,91
7 1
5,66
9 1
8,77
0 2
4,10
0 2
7,32
8 3
4,92
8
Oth
er C
omm
unity
, So
cial
& P
erso
nal S
ervi
ces
4,7
54
5,2
81
6,5
40
9,6
18
13,
303
14,
779
16,
721
18,
371
20,
568
23,
634
28,
141
33,
306
Priv
ate
Hous
ehol
ds w
ith E
mpl
oyed
Per
sons
3,5
87
3,8
79
5,1
05
7,6
78
9,4
43
12,
024
15,
327
16,
064
19,
879
25,
428
31,
181
38,
264
Tot
al
327
,394
3
66,9
76
491
,051
7
11,9
75
824
,684
1
,009
,521
1
,238
,088
1
,463
,883
1
,722
,669
2
,091
,618
2
,575
,507
3
,221
,829
Less
: F
ISIM
1,7
75
1,9
62
2,5
76
3,0
91
6,3
35
7,7
96
11,
628
14,
486
18,
870
26,
829
31,
884
38,
830
Gro
ss V
alue
Ad
ded
at C
urre
nt B
asic
Pric
es 3
26,0
26
365
,483
4
89,1
27
710
,012
8
18,8
70
1,0
02,3
51
1,2
26,6
37
1,4
49,3
97
1,7
03,7
98
2,0
64,7
89
2,5
43,6
23
3,1
82,9
98
Taxe
s on
Prod
ucts
19,
139
28,
412
39,
431
56,
882
70,
618
86,
098
105
,129
1
18,7
00
128
,755
1
37,5
83
152
,600
1
91,3
51
GD
P at
Cur
rent
Mar
ket P
rices
346
,824
3
95,9
91
528
,580
7
66,9
15
889
,645
1
,088
,632
1
,331
,984
1
,568
,097
1
,832
,554
2
,202
,373
2
,696
,223
3
,374
,349
Sour
ce: M
oFED

National Bank of Ethiopia Quarterly Bulletin
106 | Second Quarter 2020/21
Tabl
e 19
: Gro
wth
Rat
es o
f GDP
by
Econ
omic
Act
ivity
at C
urre
nt P
rices
(%)
Sect
ors/
Year
2003
2004
2005
2006
2007
2008
2009
2010
2011
2012
2010
/11
2001
1/12
2012
/13
2013
/14
2014
/15
2015
/16
2016
/17
2017
/18
2018
/19
2019
/20
Agr
icul
ture
, Hun
ting
and
For
estry
32.9
55.9
7.9
14.3
14.5
12.1
13.7
11.0
33.0
32.6
Cro
p31
.963
.61.
614
.313
.611
.913
.68.
637
.535
.7
Ani
mal
Far
min
g an
d H
untin
g39
.645
.024
.011
.816
.411
.112
.116
.528
.927
.0
Fore
stry
17.8
23.4
25.3
20.7
15.8
16.1
18.9
11.6
16.2
26.5
Fish
ing
9.6
109.
550
.816
.253
.812
.863
.54.
128
.523
.2
Min
ing
and
Qua
rryin
g21
7.2
36.6
4.2
-10.
5-3
0.3
-2.3
-20.
9-1
6.3
-16.
918
6.3
Man
ufac
turin
g22
.134
.725
.631
.935
.07.
027
.013
.117
.418
.9
Larg
e an
d M
ediu
m S
cale
Man
ufac
turin
g18
.839
.334
.239
.344
.76.
321
.213
.420
.220
.1
Smal
l Sca
le a
nd C
otta
ge In
dus
tries
28.5
26.4
7.9
13.1
4.7
10.4
40.1
12.4
3.0
2.6
Elec
trici
ty a
nd W
ater
19.1
26.2
18.9
12.0
-1.8
4.3
24.5
9.6
20.7
27.2
Con
stru
ctio
n26
.255
.953
.782
.967
.660
.326
.450
.99.
39.
9
Who
le S
ale
and
Ret
ail T
rad
e25
.044
.710
.529
.423
.58.
111
.322
.432
.423
.2
Hote
ls an
d R
esta
uran
ts46
.639
.734
.838
.635
.622
.98.
019
.025
.12.
2
Tran
spor
t and
Com
mun
icat
ions
54.8
49.4
29.0
19.4
17.0
22.4
10.2
6.8
20.4
40.4
Fina
ncia
l Int
erm
edia
tion
46.1
58.6
40.3
21.4
35.0
21.7
30.3
33.9
22.6
10.2
Real
Est
ate,
Ren
ting
and
Bus
ines
s Act
iviti
es40
.217
.214
.610
.15.
95.
15.
612
.433
.445
.8
Publ
ic A
dm
inist
ratio
n an
d D
efen
se30
.313
.718
.116
.724
.720
.829
.817
.19.
116
.4
Educ
atio
n12
.423
.326
.632
.823
.119
.844
.224
.013
.111
.3
Heal
th a
nd S
ocia
l Wor
k25
.121
.027
.330
.130
.721
.319
.828
.413
.427
.8
Oth
er C
omm
unity
, So
cial
& P
erso
nal S
ervi
ces
23.8
47.1
38.3
11.1
13.1
9.9
12.0
14.9
19.1
18.4
Priv
ate
Hous
ehol
ds w
ith E
mpl
oyed
Per
sons
31.6
50.4
23.0
27.3
27.5
4.8
23.7
27.9
22.6
22.7
Tot
al
34
45.0
15.8
22.4
22.6
18.2
17.7
21.4
23.3
25.2
Less
: F
ISIM
31
20.0
104.
923
.149
.224
.630
.342
.222
.013
.0
Gro
ss V
alue
Ad
ded
at C
urre
nt B
asic
Pric
es 3
4 45
.215
.322
.422
.418
.217
.621
.223
.325
.4
Taxe
s on
Prod
ucts
39
44.3
24.1
21.9
22.1
12.8
12.9
6.9
10.9
25.4
GD
P at
Cur
rent
Mar
ket P
rices
33
45.1
16.0
22.4
22.4
17.7
16.9
20.2
22.4
25.2
Sour
ce: M
oFED

| 107
Tabl
e 20
: Va
lue
of A
ggre
gate
Out
put,
Con
sum
ptio
n, In
vest
men
t and
Sav
ings
at C
urre
nt P
rices
(I
n M
illion
s of B
irr)
Desc
riptio
n /
Year
2004
2005
2006
2007
2008
2009
2010
2011
2012
2011
/12
2012
/13
2013
/14
2014
/15
2015
/16
2016
/17
2017
/18
2018
/19
2019
/20
Gro
ss V
alue
Add
ed a
t Cur
rent
Bas
ic P
rices
710
,011
.5
818
,870
.1
1,0
02,3
50.9
1
,226
,637
.4
1,4
49,3
97.5
1
,703
,798
.2
2,0
64,7
89.2
2
,543
,623
.0
3,1
82,9
98.0
Taxe
s on
Pro
duct
s, n
et 5
6,88
2.0
70,
618.
0 8
6,09
8.0
105
,128
.7
118
,700
.0
128
,755
.5
137
,583
.5
152
,600
.0
191
,351
.0
GDP
at C
urre
nt M
arke
t Pric
es 7
66,9
15.5
8
89,6
44.9
1
,088
,631
.8
1,3
31,9
83.7
1
,568
,097
.5
1,8
32,5
53.7
2
,202
,372
.7
2,6
96,2
23.0
3
,374
,349
.0
Inco
mes
fro
m R
OW
, net
(1,6
59.8
) (1
,942
.8)
(2,9
14.6
) (5
,275
.1)
(5,1
22.4
) (1
0,88
4.1)
(14,
349.
1) (1
3,10
4.0)
(18,
270.
0)
Gro
ss N
atio
nal I
ncom
e at
Cur
rent
Bas
ic P
rices
708
,351
.7
816
,927
.4
999
,436
.3
1,2
21,3
62.3
1
,444
,275
.0
1,6
92,9
14.1
2
,050
,440
.2
2,5
30,5
19.0
3
,164
,728
.0
Gro
ss N
atio
nal I
ncom
e at
Cur
rent
Mar
ket P
rices
765
,255
.7
887
,702
.1
1,0
85,7
17.2
1
,326
,708
.6
1,5
62,9
75.0
1
,821
,669
.6
2,1
88,0
23.6
2
,683
,118
.6
3,3
56,0
79.5
Cur
rent
Tran
sfer
s fro
m R
OW
, net
86,
849.
9 9
3,35
5.1
106
,357
.3
128
,400
.8
155
,964
.2
154
,959
.4
188
,527
.3
240
,392
.0
218
,029
.0
Gro
ss N
atio
nal D
ispos
able
Inco
me
852
,105
.6
981
,057
.2
1,1
92,0
74.5
1
,455
,109
.4
1,7
18,9
39.2
1
,976
,628
.9
2,3
76,5
50.9
2
,923
,510
.0
3,5
74,1
09.0
Gov
ernm
ent F
inal
Con
sum
ptio
n Ex
pend
iture
72,
783.
5 9
1,07
4.7
115
,104
.0
137
,245
.8
174
,598
.8
203
,607
.9
225
,523
.2
247
,362
.0
307
,769
.0
Priv
ate
Fina
l Con
sum
ptio
n Ex
pend
iture
544
,140
.3
639
,963
.8
748
,560
.3
900
,516
.9
1,0
42,2
64.6
1
,219
,365
.9
1,4
41,5
81.1
1
,848
,070
.0
2,3
60,8
96.0
Gro
ss C
apita
l For
mat
ion
(Inve
stm
ent)
275
,811
.3
293
,930
.7
400
,841
.2
508
,975
.9
585
,665
.0
704
,596
.0
751
,626
.2
948
,866
.0
1,0
37,6
85.0
Expo
rts o
f Goo
ds a
nd S
ervi
ces
102
,886
.6
108
,227
.1
123
,496
.0
121
,532
.2
122
,500
.8
139
,830
.1
184
,282
.1
213
,437
.0
239
,229
.0
Impo
rts o
f Goo
ds a
nd S
ervi
ces
236
,383
.9
251
,300
.6
308
,691
.3
393
,188
.5
424
,749
.9
430
,233
.2
502
,112
.9
561
,512
.0
571
,230
.0
Reso
urce
Bal
ance
(133
,497
.3)
(143
,073
.5)
(185
,195
.3)
(271
,656
.3)
(302
,249
.2)
(290
,403
.1)
(317
,830
.8)
(348
,075
.0)
(332
,001
.0)
Gro
ss D
omes
tic S
avin
gs 1
49,9
91.7
1
58,6
06.3
2
24,9
67.5
2
94,2
21.0
3
51,2
34.0
4
09,5
79.8
5
35,2
68.5
6
00,7
91.0
70
5684
Gro
ss N
atio
nal S
avin
gs 2
35,1
81.8
2
50,0
18.7
3
28,4
10.1
4
17,3
46.8
5
02,0
75.8
5
53,6
55.1
7
09,4
46.7
8
28,0
78.0
9
05,4
44.0
Mid
-yea
r Pop
ulat
ion
(In M
illio
n) 8
2.7
84.
8 8
7.0
89.
1 9
1.2
93.
4 9
5.5
97.
6 9
9.7
Per C
apita
Nom
inal
GDP
(In
Birr)
9,2
68.6
1
0,48
6.5
12,
520.
2 1
4,95
3.4
17,
192.
4 1
9,63
0.4
23,
061.
5 2
7,62
5.0
33,
845.
0
Per C
apita
Rea
l GDP
(In
Birr)
13,
090.
3 1
4,11
8.3
15,
189.
1 1
6,36
6.5
17,
192.
4 1
8,39
3.9
19,
204.
9 2
0,31
2.5
21,
153.
1
Ave
rage
Exc
hang
e Ra
te (B
irr/U
SD)
17.
3 1
8.3
19.
1 2
0.1
21.
1 2
2.4
26.
1 2
8.1
31.
3
Rea
l GDP
(In
USD)
6
2,77
7.3
65,
528.
4 6
9,23
7.3
72,
546.
1 7
4,29
6.6
76,
610.
6 7
0,24
9.0
70,
666.
9 6
7,28
7.5
Nom
inal
GDP
(In
USD)
(Mill
ion)
4
4,44
9.6
48,
671.
9 5
7,07
1.7
66,
282.
4 7
4,29
6.6
81,
760.
4 8
4,35
6.0
96,
107.
0 1
07,6
60.0
Per C
apita
Nom
inal
GDP
(In
USD)
5
37.2
5
73.7
6
56.4
7
44.1
8
14.6
8
75.8
8
83.3
9
85.0
1
,080
.0
Per C
apita
Rea
l GDP
(In
USD)
7
58.7
7
72.4
7
96.3
8
14.4
8
14.6
8
20.7
7
35.6
7
24.3
6
75.0
GDP
Defl
ator
0.7
1 0
.74
0.8
2 0
.91
1.0
0 1
.07
1.2
0 1
.36
1.6
0
Sour
ce: P
lann
ing
com
miss
ion

National Bank of Ethiopia Quarterly Bulletin
108 | Second Quarter 2020/21
Tabl
e 2
1: G
row
th R
ates
of A
ggre
gate
Out
put,
Con
sum
ptio
n, In
vest
men
t and
Sav
ings
( I
nper
cent
)
Desc
riptio
n /
Year
2000
2001
2002
2003
2004
2005
2006
2007
2008
2009
2010
2011
2012
2007
/08
2008
/09
2009
/10
2010
/11
2011
/12
2012
/13
2013
/14
2014
/15
2015
/16
2016
/17
2017
/18
2018
/19
2019
/20
GD
P at
Cur
rent
Bas
ic P
rices
44.
9 3
6.6
12.
1 3
3.8
45.
2 1
5.3
22.
4 2
2.4
18.
2 1
7.6
21.
2 2
3.3
25.
4
Taxe
s on
Prod
ucts
, net
37.
7 1
4.0
48.
5 3
8.8
44.
3 2
4.1
21.
9 2
2.1
12.
9 8
.5
6.9
1
0.9
25.
4
GD
P at
Cur
rent
Mar
ket P
rices
44.
4 3
5.1
14.
2 3
3.5
45.
1 1
6.0
22.
4 2
2.4
17.
7 1
6.9
20.
2 2
2.5
25.
4
Inco
mes
fro
m R
OW
, net
19.
8 (2
04.1
) (1
16.5
) (5
7.1)
(48.
2) (1
7.0)
(50.
0) (8
1.0)
(2.9
) (1
12.5
) (3
1.8)
(33.
0) (1
0.5)
Gro
ss N
atio
nal I
ncom
e at
Cur
rent
Bas
ic P
rice
44.
8 3
6.3
12.
0 3
3.8
45.
2 1
5.3
22.
3 2
2.2
18.
3 1
7.2
21.
1 2
3.3
25.
5
Gro
ss N
atio
nal I
ncom
e at
Cur
rent
Mar
ket P
rice
44.
3 3
4.8
14.
1 3
3.4
45.
1 1
6.0
22.
3 2
2.2
17.
8 1
6.6
20.
1 2
2.5
25.
5
Cur
rent
Tra
nsfe
rs fr
om R
OW
, net
34.
4 2
9.2
34.
6 2
4.8
17.
0 7
.5
13.
9 2
0.7
21.
5 (0
.6)
21.
7 2
5.7
(3.6
)
Gro
ss N
atio
nal D
ispos
able
Inco
me
43.
1 3
4.1
16.
4 3
2.3
41.
6 1
5.1
21.
5 2
2.1
18.
1 1
5.0
20.
2 2
2.8
23.
2
Gov
ernm
ent F
inal
Con
sum
ptio
n Ex
pend
iture
34.
8 2
2.4
10.
3 2
5.4
16.
7 2
5.1
26.
4 1
9.2
27.
2 1
6.6
10.
8 9
.7
24.
4
Priv
ate
Fina
l Con
sum
ptio
n Ex
pend
iture
51.
8 3
5.7
15.
3 2
8.6
45.
1 1
7.6
17.
0 2
0.3
15.
7 1
7.0
18.
2 2
7.9
27.
7
Gro
ss C
apita
l For
mat
ion
(Inve
stm
ent)
45.
9 3
7.2
24.
0 3
8.1
67.
6 6
.6
36.
4 2
7.0
15.
1 2
0.3
6.7
2
6.2
9.4
Expo
rts o
f Goo
ds a
nd S
ervi
ces
29.
6 2
4.4
48.
1 6
4.8
19.
7 5
.2
14.
1 (1
.6)
0.8
1
4.1
31.
8 1
5.9
12.
0
Impo
rts o
f Goo
ds a
nd S
ervi
ces
39.
0 2
5.8
31.
2 2
8.6
45.
5 6
.3
22.
8 2
7.4
8.0
1
.3
16.
7 1
1.8
1.7
Reso
urce
Bal
ance
(45.
2) (2
6.5)
(21.
5) (3
.2)
(74.
4) (7
.2)
(29.
4) (4
6.7)
(11.
3) 3
.9
(9.4
) (9
.5)
4.6
Gro
ss D
omes
tic S
avin
gs 2
1.2
45.
4 1
1.7
66.
7 6
4.2
5.7
4
1.8
30.
8 1
9.4
16.
6 3
0.7
12.
2 1
7.5
Gro
ss N
atio
nal S
avin
gs 2
7.5
36.
1 2
2.2
44.
8 4
3.0
6.3
3
1.4
27.
1 2
0.3
10.
3 2
8.1
16.
4 1
2.5
Mid
-yea
r Pop
ulat
ion
(in M
illion
) 1
.2
2.7
2
.7
2.2
2
.6
2.5
2
.5
2.4
2
.4
2.4
2
.3
2.2
2
.2
Per C
apita
GD
P (B
irr) (
Nom
inal
) 4
2.6
31.
6 1
1.2
30.
6 4
1.5
13.
1 1
9.4
19.
4 1
5.0
14.
2 1
7.5
19.
8 2
2.5
Per C
apita
GD
P (B
irr) (
Real
) 9
.4
6.0
9
.7
8.7
5
.9
7.9
7
.6
7.8
5
.0
7.0
4
.4
5.8
4
.1
Ave
rage
Exc
hang
e Ra
te (B
irr/U
SD)
5.1
1
2.7
23.
7 2
5.0
7.0
5
.9
4.4
5
.4
5.0
6
.2
16.
5 7
.6
11.
5
Real
GD
P (U
SD)
5.4
(3
.5)
(9.0
) (1
1.2)
1.5
4
.4
5.7
4
.8
2.4
3
.1
(8.3
) 0
.6
(4.8
)
GD
P at
Cur
rent
Mar
ket P
rices
(USD
) 3
7.3
19.
8 (7
.7)
6.8
3
5.5
9.5
1
7.3
16.
1 1
2.1
10.
0 3
.2
13.
7 1
2.2
Per C
apita
GD
P (U
SD) (
Nom
inal
) 3
5.7
16.
7 (1
0.1)
4.4
3
2.2
6.8
1
4.4
13.
4 9
.5
7.5
0
.9
11.
5 9
.6
Per C
apita
GD
P (U
SD) (
Real
) 4
.1
(6.0
) (1
1.3)
(13.
1) (1
.0)
1.8
3
.1
2.3
0
.0
0.7
(1
0.4)
(1.5
) (6
.8)
Perc
enta
ge C
hang
e in
GD
P D
eflat
or 3
0.3
24.
1 1
.4
20.
2 3
3.5
4.9
1
1.0
10.
8 9
.5
6.7
1
2.5
13.
3 1
7.6
Sour
ce:P
lann
ing
com
miss
ion

| 109
Table 22(A): National Non-Food Consumer Price Index, December 2016=100
Perio
d
Gen
eral
Inde
x
Food
and
Non
-Alc
ohol
ic
Beve
rage
s
Alc
ohol
ic B
ever
ages
and
Toba
cco
Clo
thin
g &
Foot
-wea
r
Hous
ing,
Wat
er,
Elec
trici
ty,G
as a
nd
Oth
er F
uels
Furn
ishin
gs, H
ouse
hold
Eq
uipm
ent a
nd R
outin
e M
aint
enan
ce o
f the
Hou
se
Heal
th
Tran
spor
t
Com
mun
icat
ion
Recr
eatio
n an
d C
ultu
re
Educ
atio
n
Rest
aura
nts
and
Hote
ls
Misc
ella
neou
s G
oods
Non
-Foo
d In
dex
2007/08Q.I 26.3 28.0 24.5 21.8 27.6 24.0 32.6 42.7 104.6 29.1 40.0 24.0 32.3 27.1Q.II 27.4 28.6 24.7 22.6 28.2 25.2 33.0 42.5 107.7 29.4 41.5 24.1 32.7 27.7Q.III 29.7 30.4 26.8 23.6 29.9 27.7 34.1 46.2 108.1 30.1 42.7 25.4 34.2 29.4Q.IV 35.1 32.8 29.4 25.0 32.8 30.1 35.6 48.2 107.0 30.6 44.1 27.7 36.3 31.8
2008/09Q.I 42.5 35.3 35.7 26.9 35.1 32.2 37.1 48.2 107.4 31.6 47.5 30.5 38.6 34.1Q.II 40.6 36.8 36.8 28.9 36.3 33.5 38.0 52.1 106.4 33.5 49.0 31.7 39.1 35.5Q.III 38.9 37.4 38.6 30.8 36.2 34.6 38.8 46.5 105.3 35.3 49.6 32.8 40.3 36.1Q.IV 39.6 38.7 39.8 32.4 37.1 36.1 41.1 48.4 104.1 37.1 51.4 33.7 42.7 37.4
2009/10Q.I 40.9 40.9 40.7 34.4 39.3 37.9 42.5 55.0 103.4 39.4 53.9 35.2 45.2 39.6Q.II 41.1 43.0 41.3 36.3 41.6 39.5 43.9 60.2 104.8 39.9 55.6 36.9 47.4 41.6Q.III 41.8 44.9 42.8 38.8 43.1 41.9 46.4 62.4 103.0 40.8 57.3 37.8 49.3 43.4Q.IV 42.5 46.3 44.8 40.4 44.3 43.6 47.8 65.3 101.1 43.2 57.7 38.8 50.3 44.8
2010/11Q.I 43.4 47.8 45.4 42.3 45.7 45.2 47.9 65.7 100.4 44.6 61.3 39.6 51.7 46.1Q.II 45.9 51.4 50.1 45.7 48.8 49.0 50.2 72.5 100.7 49.5 72.3 42.4 56.5 49.7Q.III 50.0 55.4 52.0 50.4 52.9 51.4 51.5 83.8 100.3 52.8 72.3 43.9 60.3 53.4Q.IV 56.9 58.7 57.2 54.2 54.9 54.7 52.9 96.6 100.0 54.3 74.5 48.9 63.3 56.8
2011/12Q.I 60.7 60.6 61.4 56.7 55.5 58.1 54.2 97.2 99.5 58.9 77.8 53.1 67.8 58.9Q.II 63.5 63.3 62.2 61.7 56.7 61.2 55.6 94.7 99.2 61.9 82.7 56.3 72.8 61.3Q.III 67.5 67.6 66.1 67.3 60.6 65.5 56.8 96.9 99.1 66.2 82.6 59.6 76.7 65.3Q.IV 71.5 69.6 65.5 70.9 62.0 68.5 58.0 97.5 99.1 67.5 85.1 63.1 78.5 67.2
2012/13Q.I 73.7 72.0 64.9 73.1 65.7 69.9 59.4 97.1 99.1 69.5 84.1 66.2 80.9 69.6Q.II 74.3 74.7 68.0 73.7 68.4 73.6 70.3 98.5 99.2 72.4 84.1 68.9 82.6 72.2Q.III 74.5 75.7 70.8 75.9 68.5 74.7 71.1 95.6 99.1 73.4 85.3 70.6 85.0 73.2Q.IV 76.2 77.3 70.7 78.0 70.0 77.1 73.3 95.0 99.1 74.6 86.7 72.9 86.2 74.7
2013/14Q.I 79.2 79.8 71.9 80.9 73.3 78.4 72.0 94.6 99.1 77.1 86.7 76.1 88.0 77.1Q.II 80.3 81.8 76.9 82.9 74.4 79.9 77.7 96.7 99.1 79.3 86.7 78.1 89.0 79.0Q.III 80.6 84.4 81.9 84.7 77.6 82.4 80.2 98.5 99.1 77.9 86.7 78.8 89.1 81.5Q.IV 82.9 85.8 82.1 86.4 79.5 83.8 82.9 99.2 99.1 75.5 86.9 80.3 89.2 82.9
2014/15Q.I 84.5 86.7 85.0 88.2 79.5 84.8 82.5 99.0 99.3 76.5 87.7 81.3 90.0 83.7Q.II 85.3 88.2 86.2 91.2 81.1 86.1 83.8 99.3 99.1 79.0 87.0 81.7 91.5 85.2Q.III 87.2 90.6 92.9 93.6 83.4 87.8 86.7 96.3 99.6 78.0 87.1 83.3 92.7 87.5Q.IV 91.0 92.8 96.2 94.5 86.7 89.7 86.1 94.8 101.2 78.4 87.2 85.4 93.9 89.7
2015/16Q.I 94.4 93.9 93.6 96.3 87.7 91.2 87.6 96.5 103.9 83.7 91.4 88.0 94.7 90.8Q.II 94.3 94.8 94.6 96.8 87.7 92.8 92.0 98.2 101.3 88.2 99.8 90.8 95.6 91.8Q.III 94.9 95.2 101.3 97.9 91.1 95.9 93.8 97.2 100.3 91.1 99.8 92.6 96.5 94.6Q.IV 97.8 98.7 94.9 99.0 97.0 96.9 97.4 97.0 101.5 92.3 99.9 94.9 97.8 96.9
2016/17QI 100.4 102.5 92.4 99.2 100.1 97.7 95.1 98.1 99.7 93.5 100.0 97.6 98.5 98.2QII 100.4 101.3 97.3 99.5 100.1 99.2 98.8 99.3 99.9 98.4 100.0 99.1 99.0 99.4QIII 102.4 103.0 104.4 100.7 102.3 101.2 104.3 103.9 99.8 99.0 100.0 98.1 100.9 101.7QIV 106.5 109.5 98.3 102.1 102.8 107.9 113.4 104.7 102.1 111.6 99.4 101.6 101.9 103.0
2017/18QI 112.0 113.9 104.5 116.0 113.3 111.1 97.0 106.3 101.7 113.1 106.0 107.9 102.2 109.9QII 115.6 116.6 110.7 119.8 119.7 115.3 92.9 108.9 103.4 114.0 107.5 113.5 104.5 114.5QIII 118.8 118.7 117.3 126.3 123.4 122.4 99.9 111.4 105.9 117.9 109.2 114.0 109.5 118.9QIV 122.8 123.1 108.2 135.8 127.8 129.1 101.3 113.2 107.2 120.9 110.4 118.6 115.6 122.5
2018/19QI 127.4 128.2 112.3 141.1 131.3 133.9 107.2 115.5 106.7 122.6 117.5 123.7 119.6 126.5QII 127.9 128.3 112.3 144.7 130.0 136.3 110.6 119.7 101.1 124.9 125.8 128.1 119.8 127.4QIII 131.9 132.0 121.2 150.7 133.1 141.5 116.0 128.9 101.5 126.6 126.3 130.8 123.6 131.8QIV 141.0 145.6 125.1 151.6 137.0 147.4 114.8 132.3 105.5 127.7 129.5 135.7 131.4 135.7
2019/20QI 149.5 156.6 127.0 156.4 144.7 150.0 120.2 136.0 105.6 129.8 132.6 145.9 135.6 141.4QII 153.1 158.5 131.5 158.6 153.8 151.4 126.6 139.5 102.8 141.4 134.1 152.0 139.8 146.8QIII 159.6 164.5 137.4 159.7 167.2 153.6 130.3 146.6 101.0 143.2 134.3 156.7 145.5 153.9QIV 171.2 179.2 163.0 167.1 168.5 156.4 143.4 192.6 108.1 140.3 135.6 159.3 149.5 161.9
2020/21QI 179.9 192.1 158.5 170.3 172.2 158.7 147.4 218.3 106.1 140.2 130.3 165.2 155.3 165.8QII 181.9 193.7 168.8 177.3 174.8 159.8 155.9 171.1 104.3 153.9 145.6 176.7 161.3 168.3
Source: Central Statistical Agency(CSA) and NBE Staff Compilation

National Bank of Ethiopia Quarterly Bulletin
110 | Second Quarter 2020/21
Table 22 (B): National Food Consumer Price Index, December 2016=100
Perio
d
Food
&
Non
-alc
ohol
ic
Beve
rage
s
Brea
d an
d C
erea
ls
Mea
t
Fish
& S
ea
Food
Milk
, Che
ese
& Eg
g
Oils
& F
ats
Fru
its
Vege
tabl
es
Suga
r, ja
m,
hone
y,
choc
olat
e &
conf
ectio
nery
Food
pro
duct
s
Non
-Alc
ohol
ic
Beve
rage
s
2007/08Q.I 25.9 27.2 21.7 19.9 28.2 19.8 21.4 26.7 43.4 26.5Q.II 27.4 29.1 22.2 20.6 31.3 21.0 22.8 26.1 45.0 28.4Q.III 30.0 32.2 23.6 22.6 35.0 24.4 25.9 29.2 43.7 29.8Q.IV 37.5 42.9 26.1 25.6 39.6 25.7 30.2 32.6 50.5 32.1
2008/09Q.I 48.1 60.7 28.7 28.2 39.5 28.7 33.1 39.6 57.0 32.8Q.II 44.1 57.2 28.9 29.1 37.9 34.0 32.5 42.0 44.0 33.0Q.III 40.9 52.5 28.9 30.3 35.9 33.0 34.5 48.4 28.7 33.9Q.IV 41.3 52.1 30.3 32.5 36.5 31.7 36.7 50.3 22.7 34.9
2009/10Q.I 41.9 53.7 31.0 33.4 36.1 34.4 34.1 51.3 23.7 38.0Q.II 41.0 51.8 31.1 34.1 36.0 36.0 34.7 52.4 26.9 41.8QIII 40.9 50.9 31.9 35.4 36.5 37.4 35.6 55.1 30.7 42.6QIV 41.1 49.7 33.2 35.8 38.6 35.6 36.2 56.5 40.6 42.3
2010/11QI 41.7 48.9 34.4 37.3 41.0 36.4 38.3 56.1 46.1 47.3Q.II 43.7 48.3 34.8 40.0 49.5 42.3 43.1 59.0 41.6 57.6Q.III 48.0 50.7 31.9 43.6 54.4 37.9 48.8 57.3 43.3 77.3Q.IV 57.4 58.9 35.9 46.8 74.2 40.1 56.5 60.0 62.4 90.9
2011/12Q.I 62.4 65.4 44.9 48.8 74.4 47.4 56.9 61.2 71.1 91.8Q.II 65.4 69.7 48.8 50.3 71.0 57.7 61.1 64.1 71.3 97.1Q.III 69.5 74.0 54.6 56.1 73.4 62.2 68.6 66.1 62.4 97.9Q.IV 75.4 80.7 64.7 61.1 79.2 62.8 75.4 68.3 67.9 90.3
2012/13Q.I 77.6 85.8 69.5 61.6 76.6 70.2 75.8 69.0 69.7 88.2Q.II 76.3 84.2 70.0 64.3 74.2 79.3 73.8 70.3 67.7 84.7Q.III 75.7 82.5 72.1 67.1 74.6 76.9 73.8 72.9 66.1 80.2Q.IV 77.5 86.1 73.7 67.8 77.0 73.6 74.5 73.2 68.2 78.7
2013/14Q.I 81.2 92.5 76.4 69.4 76.2 72.5 78.4 74.4 69.7 79.3Q.II 81.4 95.1 77.7 70.5 75.8 74.6 75.7 73.8 70.2 78.9Q.III 79.7 85.1 78.6 73.1 78.0 76.4 80.1 73.1 69.1 79.1Q.IV 82.9 88.9 80.5 74.2 81.5 74.2 79.8 74.2 75.1 94.3
2014/15Q.I 85.2 92.7 81.5 76.7 87.0 77.5 78.2 73.9 81.8 99.3Q.II 85.3 89.4 81.5 77.7 89.3 79.9 82.1 75.5 78.7 101.7Q.III 86.9 86.2 83.4 82.1 94.2 85.9 88.7 75.1 82.6 95.9Q.IV 92.1 89.3 86.7 89.5 101.4 84.5 94.3 76.5 100.1 91.1
2015/16Q.I 97.9 94.3 90.9 90.1 102.9 88.7 96.6 76.3 131.6 87.8QII 96.6 94.0 92.1 92.2 99.5 95.7 96.5 77.0 120.8 85.1QIII 95.2 95.7 92.8 96.9 96.6 96.2 96.5 81.7 101.2 81.1QIV 98.7 98.2 96.4 100.2 99.7 96.1 103.0 83.9 101.8 84.1
2016/17Q.I 102.6 102.9 100.7 99.4 99.9 98.7 106.8 86.7 104.6 92.3Q.II 101.3 102.7 100.6 100.0 100.8 99.3 99.6 100.0 94.6 105.6 99.3Q.III 103.0 100.7 100.8 98.9 103.8 102.3 103.2 107.4 96.1 109.2 97.3Q.IV 109.5 110.9 106.9 100.4 108.3 101.7 106.6 114.7 93.9 117.9 97.0
2017/18QI 113.9 123.6 113.8 101.1 108.5 100.5 119.5 110.2 94.4 122.0 101.3QII 116.6 125.7 115.7 104.2 112.4 96.9 128.9 113.8 95.9 125.0 108.5QIII 118.7 123.6 123.0 101.1 115.7 95.1 134.4 120.4 97.2 133.5 105.2QIV 123.1 133.8 131.5 110.8 122.8 95.1 133.8 116.9 98.1 137.4 109.7
2018/19 QI 128.2 139.7 137.0 112.1 127.8 95.9 133.1 124.8 102.1 136.9 115.9QII 128.3 140.0 137.1 114.2 129.8 97.5 141.0 124.3 105.3 137.8 112.1QIII 132.0 142.1 142.0 115.3 135.3 98.0 147.9 133.6 106.7 143.2 106.5QIV 145.7 156.8 157.9 113.3 145.6 104.6 160.2 157.8 112.0 148.1 109.6
2019/20QI 156.6 175.6 170.3 114.5 149.8 107.8 168.7 167.2 115.3 153.1 116.0QII 158.5 182.5 174.5 116.7 149.1 106.5 183.1 163.4 112.7 153.8 119.3QIII 164.5 182.7 179.2 122.9 153.4 112.9 187.7 171.3 104.9 177.4 127.5QIV 179.2 201.5 189.6 139.2 158.9 118.5 187.0 189.1 107.1 195.5 137.9
2020/21QI 192.1 216.9 192.7 150.7 163.3 123.7 175.9 208.2 106.2 209.3 151.4QII 193.7 223.7 196.3 148.8 172.5 135.7 182.6 192.9 114.1 210.0 159.7
Source: CSA and NBE Staff Compilation.

| 111
Table 22 (C): Addis Ababa Non-Food Consumer Price Index , December 2016=100
Perio
d
Gen
eral
Inde
x
Food
& N
on-a
lcoh
olic
Be
vera
ges
Alc
ohol
ic b
ever
ages
& To
bacc
o
Clo
thin
g &
Foo-
twea
r
Hosin
g,W
ater
,El
ectri
city
,Gas
an
d O
ther
Fue
ls
Furn
ishin
gs, H
ouse
hold
Eq
uipm
ent a
nd R
outin
e M
aint
enan
ce o
f the
Hou
se
Heal
th
Tran
spor
t
Com
mun
icat
ion
Recr
eatio
n an
d C
ultu
re
Educ
atio
n
Rest
aura
nts
and
Hote
ls
Misc
ella
neou
s G
oods
Non
-Foo
d In
dex
2006/07Q.I 25.4 20.8 24.0 18.8 38.3 23.1 32.3 42.8 41.9 35.1 31.2 18.7 25.2 29.6Q.II 26.6 22.0 24.2 19.2 39.3 23.8 33.1 45.6 44.7 38.2 34.0 19.4 25.0 30.7Q.III 27.3 23.0 25.0 20.2 39.1 25.0 35.3 45.0 44.1 36.4 32.4 21.2 25.1 30.9Q.IV 28.5 24.8 25.6 20.7 39.6 26.6 37.5 45.0 44.1 36.7 32.6 21.0 25.5 31.6
2007/08Q.I 29.7 26.9 26.2 21.6 39.6 27.1 38.3 45.1 44.1 37.7 33.5 21.4 26.2 32.0Q.II 30.3 27.0 27.1 24.4 38.6 29.6 40.3 44.8 43.9 38.9 34.5 22.6 26.9 32.9Q.III 32.8 29.5 29.8 25.8 41.4 34.0 42.4 48.1 47.1 40.4 35.9 23.0 28.2 35.5Q.IV 37.5 36.3 31.9 27.0 45.7 36.7 43.9 49.7 48.7 42.0 37.3 26.4 30.5 38.0
2008/09Q.I 41.9 43.8 37.0 29.3 46.4 38.0 47.3 49.7 48.6 41.9 37.2 28.6 32.5 39.4Q.II 42.4 42.7 39.2 31.0 48.0 39.4 48.3 55.4 54.2 45.5 40.4 29.8 33.0 41.5Q.III 41.4 40.8 43.2 32.7 46.3 40.4 48.2 51.8 50.7 48.1 42.8 30.2 33.8 41.4Q.IV 42.8 42.2 43.4 34.1 47.2 41.7 49.8 53.8 52.7 49.7 44.2 32.1 36.5 42.8
2009/10Q.I 44.8 43.6 43.7 35.6 49.8 42.6 52.3 61.9 60.6 50.2 44.6 34.2 38.9 45.3Q.II 46.1 44.2 44.3 36.4 51.6 45.4 52.9 67.1 65.7 52.0 46.2 37.4 41.3 47.3Q.III 46.2 43.2 45.1 37.7 52.3 47.4 52.9 68.5 67.1 53.6 47.7 40.2 42.6 48.5Q.IV 48.3 45.5 47.6 39.1 54.1 49.7 55.0 72.3 70.8 53.8 47.8 42.5 43.3 50.4
2010/11Q.I 50.5 48.2 49.7 42.8 54.4 51.6 55.3 71.9 70.4 56.6 50.3 44.9 44.9 52.0Q.II 53.8 49.4 55.9 47.9 59.9 56.1 56.8 80.0 78.3 65.0 57.8 46.8 48.6 57.3Q.III 56.1 49.5 54.3 51.1 65.6 59.7 57.3 88.3 86.5 66.0 58.6 47.6 55.3 61.6Q.IV 61.1 55.4 57.9 55.3 68.2 64.2 60.2 98.7 96.6 65.8 58.5 50.7 59.2 65.7
2011/12Q.I 64.6 60.1 62.7 58.9 69.6 65.2 62.2 98.6 96.5 68.6 61.0 54.4 62.9 67.9Q.II 67.3 64.2 65.6 64.5 69.2 68.5 65.3 99.1 97.1 75.1 66.8 57.3 66.4 70.6Q.III 70.6 67.0 71.4 70.5 70.6 72.4 67.1 102.2 100.0 75.6 67.1 59.0 70.4 73.4Q.IV 74.0 73.3 71.7 72.1 71.8 73.8 69.6 102.2 100.0 76.7 72.2 59.0 72.4 74.6
2012/13Q.I 76.5 75.8 72.0 75.8 77.4 75.6 71.3 101.3 100.0 78.2 70.2 59.0 74.6 77.0Q.II 77.4 74.4 72.4 80.9 80.1 76.8 73.1 101.3 100.0 81.0 70.2 64.8 77.3 79.7Q.III 77.8 73.2 79.0 82.6 81.5 79.5 76.5 101.3 100.0 82.4 72.6 66.8 80.6 81.4Q.IV 79.6 75.7 81.1 84.8 81.5 81.8 80.9 101.2 100.0 84.0 75.0 68.8 82.0 82.5
2013/14Q.I 82.8 78.9 84.0 86.2 85.7 83.4 74.9 101.4 100.0 86.9 75.1 78.3 83.6 85.8Q.II 83.8 77.6 88.6 87.4 88.7 84.8 77.2 106.0 100.0 94.4 75.1 82.8 85.6 88.6Q.III 84.6 76.7 87.6 90.3 91.5 88.3 79.6 110.2 100.0 96.4 75.1 82.3 86.0 90.6Q.IV 86.7 79.6 92.4 93.3 91.9 90.8 85.5 110.4 100.0 98.3 75.1 85.8 85.6 92.1
2014/15Q.I 88.6 83.9 94.0 93.5 91.2 90.0 90.7 110.3 100.0 100.9 75.1 86.9 88.8 92.3Q.II 88.9 84.2 94.1 94.0 91.3 90.6 94.3 109.6 100.0 97.9 75.1 87.0 89.3 92.5Q.III 90.9 87.7 95.9 94.8 92.8 93.1 95.3 101.2 100.0 98.1 75.1 91.2 93.8 93.4Q.IV 95.1 95.4 94.8 97.4 95.2 95.5 96.0 98.8 100.0 97.4 75.1 92.8 96.3 94.8
2015/16Q.I 101.4 107.4 95.7 99.8 97.7 96.1 96.8 99.7 100.0 98.0 83.4 93.9 98.2 96.8QII 100.8 103.3 99.4 100.5 98.2 98.0 99.9 100.0 100.0 99.6 100.0 98.0 99.2 98.9QIII 98.2 97.0 98.4 101.4 96.5 103.8 102.3 98.3 100.0 101.3 100.0 99.4 101.6 99.2QIV 100.6 101.7 100.4 103.5 96.4 105.4 102.7 97.5 100.0 103.5 100.0 100.5 102.5 99.7
2016/17QI 103.9 107.3 109.8 105.0 97.9 107.8 103.6 97.5 100.0 105.0 100.0 103.3 102.1 101.3QII 101.5 102.2 104.7 104.0 98.6 105.1 102.5 98.3 100.0 104.4 100.0 102.5 101.2 100.9QIII 100.9 100.4 103.8 100.6 101.7 101.7 98.5 104.1 100.0 99.5 97.4 100.1 103.2 101.3QIV 104.1 104.4 100.9 94.8 103.0 107.5 107.6 107.9 114.4 105.4 96.9 99.9 102.5 103.8
2017/18QI 112.3 109.2 103.3 98.8 133.7 114.3 113.7 106.5 115.3 107.3 100.4 104.9 100.9 114.8QII 117.6 110.3 103.0 101.2 151.3 120.5 113.9 106.9 116.5 107.3 99.9 118.5 106.5 123.1QIII 121.1 113.1 112.7 104.8 158.3 126.6 117.3 107.7 116.8 109.7 99.7 120.2 111.3 127.2QIV 127.1 117.7 114.1 111.3 170.0 132.4 131.8 109.4 116.8 112.2 100.1 127.5 119.4 134.2
2018/19QI 132.1 125.2 115.1 113.8 171.4 136.5 130.1 113.6 116.8 112.4 113.3 136.1 122.4 137.4QII 133.0 123.7 116.1 115.5 172.8 142.5 135.8 116.1 120.4 112.6 122.3 137.7 123.1 140.0QIII 137.5 127.5 126.1 116.3 186.6 147.0 133.0 117.8 119.2 112.8 120.8 138.7 127.0 145.1QIV 145.3 141.4 127.1 121.1 188.3 153.5 139.6 121.5 118.0 115.7 121.9 142.9 130.7 148.2
2019/20QI 152.8 155.5 126.7 123.3 192.5 155.8 140.5 123.6 118.3 118.2 125.4 144.9 134.5 150.8QII 156.7 157.1 125.2 121.4 207.3 160.0 138.4 125.9 116.8 125.2 128.4 149.4 140.2 156.5QIII 163.1 160.9 149.7 131.6 225.7 163.9 150.4 124.3 114.6 124.4 132.1 154.1 143.7 164.9QIV 178.2 178.6 174.4 138.2 241.2 164.8 155.8 191.5 114.8 119.9 130.6 154.6 147.9 177.9
2020/21QI 186.4 197.7 179.4 149.4 236.5 165.7 162.7 181.7 115.0 122.1 118.1 158.2 154.1 177.7QII 186.4 197.7 179.4 149.4 236.5 165.7 162.7 181.7 115.0 122.1 118.1 158.2 154.1 177.7
Source: Central Statistical Agency(CSA) and NBE Staff Compilation.

National Bank of Ethiopia Quarterly Bulletin
112 | Second Quarter 2020/21
Table 22(D): Addis Ababa Food Consumer Price IndexDecember 2016=100
Perio
d
Food
&
Non
-alc
ohol
ic
Beve
rage
s
Brea
d an
d C
erea
ls
Mea
t
Fish
& S
ea F
ood
Milk
, Che
ese
& Eg
g
Oils
& F
ats
Fru
its
Vege
tabl
es
Suga
r, ja
m,
hone
y, c
hoc-
olat
e an
d co
nfec
tione
ry
Food
pro
duct
s
Non
-Alc
ohol
ic
Beve
rage
s
2006/07Q.I 20.7 22.4 19.9 16.7 19.3 17.5 16.3 38.6 20.5 19.2Q.II 21.9 23.9 20.5 17.2 21.3 18.4 17.2 36.7 21.6 19.4Q.III 22.9 24.5 20.9 17.8 23.8 21.5 20.0 36.7 28.9 20.7Q.IV 24.7 25.5 22.5 20.2 27.1 20.9 19.5 37.0 44.3 21.0
2007/08Q.I 26.7 26.3 23.0 20.9 29.2 23.4 21.9 36.1 71.8 22.3Q.II 26.9 26.9 23.3 21.2 31.4 26.5 24.8 34.5 62.7 24.8Q.III 29.3 29.6 23.9 22.1 34.9 36.1 33.7 39.8 63.0 26.3Q.IV 36.1 40.5 27.3 25.0 41.9 39.8 37.2 41.3 75.1 27.5
2008/09Q.I 43.5 52.1 31.4 29.8 40.9 42.0 39.2 50.6 80.2 27.4Q.II 42.4 52.8 31.7 31.3 39.1 39.9 37.3 50.2 61.1 26.9Q.III 40.6 50.5 30.7 31.5 37.2 43.7 40.8 61.7 41.2 26.7Q.IV 41.9 51.4 32.2 33.2 40.0 48.6 45.4 66.3 32.1 26.9
2009/10Q.I 43.3 53.8 33.7 36.6 39.6 42.3 39.5 67.7 33.5 32.7Q.II 43.9 53.5 33.7 36.2 39.4 40.9 38.2 74.2 45.3 37.4Q.III 42.9 50.4 34.3 35.9 39.9 41.3 38.6 72.8 45.2 37.0QIV 45.2 51.0 36.9 37.3 40.6 45.2 42.2 73.9 62.7 35.7
2010/11Q.I 47.9 50.7 38.6 38.5 42.9 53.9 50.4 78.7 70.3 39.7Q.II 49.1 50.6 39.2 39.5 50.8 56.8 53.0 82.2 55.6 50.7Q.III 49.2 49.4 38.9 40.9 54.3 60.3 56.3 72.5 60.5 65.4Q.IV 55.0 54.8 40.1 42.6 74.4 62.1 58.0 74.1 87.9 78.1
2011/12Q.I 59.7 58.2 47.5 46.9 77.1 54.1 50.5 74.4 102.7 81.1Q.II 63.8 61.2 52.4 52.0 74.1 57.3 53.5 75.6 95.7 88.4Q.III 66.6 64.1 57.0 55.8 75.5 63.3 63.3 76.7 91.6 89.7Q.IV 72.8 71.7 68.6 58.5 79.3 65.0 68.5 77.6 95.2 86.7
2012/13Q.I 75.4 77.3 70.9 63.4 77.9 71.8 71.8 77.6 88.6 84.6Q.II 74.0 79.7 69.1 67.3 77.6 73.1 66.8 77.6 76.6 82.7Q.III 72.7 78.5 73.3 69.4 79.0 80.4 59.7 77.6 73.0 79.7Q.IV 75.2 79.8 74.3 70.1 81.6 84.0 67.8 77.6 70.9 76.4
2013/14Q.I 78.5 82.3 75.7 71.8 81.6 83.5 75.6 77.6 76.3 78.0Q.II 77.1 84.0 75.4 71.5 81.1 79.1 67.2 77.8 79.4 78.7Q.III 76.2 78.1 77.6 71.6 81.2 86.3 70.4 78.0 73.4 80.3Q.IV 79.1 78.9 81.1 73.4 83.6 87.2 69.9 82.7 95.6 89.6
2014/15Q.I 83.3 82.2 81.4 75.8 89.0 84.3 72.1 82.6 127.8 91.1Q.II 83.7 82.4 78.6 79.3 94.0 84.1 78.0 82.7 104.0 95.0Q.III 87.2 79.8 81.3 80.8 99.9 103.1 86.5 81.2 120.9 94.7Q.IV 94.8 82.1 84.6 88.6 110.4 101.4 91.1 83.1 188.2 91.7
2015/16Q.I 106.7 84.4 93.8 94.3 110.6 101.9 99.0 83.5 317.2 88.5Q.II 102.7 86.1 96.9 95.8 108.1 101.0 100.3 83.6 229.0 87.6QIII 96.4 88.9 95.8 95.7 99.6 113.7 95.4 94.0 141.8 85.8QIV 101.1 93.3 98.4 96.7 101.7 113.7 108.3 99.8 130.6 88.6
2016/17QI 106.7 98.6 101.1 98.9 103.0 103.3 122.3 96.8 130.7 93.1QII 101.8 102.3 100.8 100.0 99.8 102.1 96.9 100.8 96.5 112.0 97.4QIII 100.4 98.6 97.6 91.6 101.8 105.0 108.8 105.5 100.0 93.8 97.7QIV 104.4 101.8 106.4 99.9 102.2 107.3 118.7 112.6 99.0 86.1 94.2
2017/18QI 109.2 109.9 114.6 101.9 105.6 109.5 134.3 111.4 100.0 86.6 100.4QII 110.3 112.8 114.8 98.4 105.5 109.1 132.5 106.9 100.0 104.0 105.8QIII 113.1 111.2 117.2 100.4 110.2 110.2 140.3 106.2 100.0 155.7 105.2QIV 117.7 117.4 126.0 112.3 121.4 114.8 139.3 105.6 100.0 160.3 105.7
2018/19QI 125.2 124.7 130.0 109.2 125.3 116.0 135.4 123.0 100.0 161.4 109.3QII 123.7 125.5 127.9 110.4 129.0 116.1 138.4 117.6 100.0 154.7 109.6QIII 127.5 129.6 135.4 119.4 128.7 117.3 151.8 121.0 100.0 154.9 109.6QIV 141.4 136.3 151.8 114.2 134.9 122.0 170.9 155.0 114.1 154.1 112.8
2019/20QI 155.5 155.6 164.5 133.0 142.5 131.2 176.5 171.6 114.1 162.7 116.0QII 157.1 159.2 171.8 129.1 147.0 133.8 184.5 162.4 114.1 171.0 118.7QIII 160.9 162.1 175.2 131.2 146.6 142.2 190.7 163.6 114.1 183.3 127.6QIV 178.6 181.4 182.7 138.1 153.6 150.4 175.8 185.0 114.1 256.7 138.8
2020/21QI 197.7 194.1 191.8 191.4 158.2 158.2 160.1 218.4 109.3 353.2 144.3QII 189.5 205.4 187.4 162.5 155.9 155.8 186.6 176.0 142.1 291.5 157.0
Source: Central Statistical Agency & NBE staff Compilation

| 113
Table 22 (E1): Regional States' Consumer Price Indices (Non-Food)December 2016 = 100
Perio
d
Gen
eral
Inde
x
Food
& N
on-a
lcoh
olic
Inde
x
Non
-Foo
d In
dex
Alc
ohol
ic b
ever
ages
& To
bacc
o
Clo
thin
g &
Foot
-wea
r
Hous
ing,
Wat
er,
Elec
trici
ty,G
as a
nd
Oth
er F
uels
Furn
ishin
gs, H
ouse
hold
Eq
uipm
ent
and
Rout
ine
Mai
nten
ance
of
the
Hous
e
Heal
th
Tran
spor
t
Com
mun
icat
ion
Recr
eatio
n an
d C
ultu
re
Educ
atio
n
Rest
aura
nts
and
Hote
ls
Misc
ella
neou
s G
oods
AFAR2007/08
Q.I 25.2 24.7 22.6 28.1 23.7 14.1 26.7 41.4 32.0 58.1 35.7 50.3 20.9 52.1Q.II 25.8 25.6 23.0 28.2 23.8 14.5 26.7 41.6 32.2 58.4 37.5 52.7 21.0 54.6Q.III 26.8 26.8 23.9 28.5 24.8 14.9 29.0 42.4 34.3 62.3 38.6 54.4 22.1 54.8Q.IV 30.4 32.4 24.8 29.7 25.6 15.1 32.4 43.3 35.1 63.7 38.6 54.3 25.8 55.6
2008/09Q.I 35.6 40.9 25.9 34.8 27.6 15.3 34.6 41.6 35.1 63.7 40.1 56.5 30.6 58.2Q.II 34.5 39.7 25.8 35.5 27.4 15.0 35.3 47.0 31.9 58.0 42.6 60.0 31.5 59.0Q.III 33.4 38.3 25.8 36.5 28.4 14.7 36.0 46.0 26.2 47.6 46.3 65.2 31.8 60.1Q.IV 34.3 39.7 26.5 38.0 28.4 15.0 38.7 49.4 27.7 50.2 46.6 65.7 32.5 61.4
2009/10Q.I 36.3 41.7 28.6 39.1 30.4 17.0 39.4 52.1 31.9 57.8 45.5 64.1 33.5 62.6Q.II 38.8 43.7 31.5 39.9 32.0 19.5 44.8 52.0 35.3 64.0 45.6 64.2 36.6 63.0Q.III 39.6 43.6 33.1 41.3 33.6 20.7 47.3 54.4 37.1 67.3 44.5 62.7 36.9 63.4Q.IV 40.6 43.9 34.1 44.0 33.5 21.9 47.8 54.4 38.2 69.4 47.1 66.3 37.7 64.8
2010/11Q.I 41.7 44.8 35.5 44.8 33.6 23.9 48.6 50.5 37.1 67.3 49.1 69.1 38.7 64.4Q.II 44.3 47.1 38.7 50.7 36.5 26.6 50.5 51.0 42.3 76.8 55.7 78.4 42.7 67.7Q.III 47.6 50.6 41.9 54.9 38.3 29.6 53.8 56.2 49.1 89.1 55.7 78.4 44.6 68.7Q.IV 52.1 54.4 45.8 55.9 40.9 34.0 52.8 61.8 59.0 107.0 57.1 80.4 48.4 70.1
2011/12Q.I 56.0 58.6 48.4 61.8 46.1 34.3 59.7 58.4 60.9 110.4 59.6 83.8 52.8 73.0Q.II 58.3 64.5 48.4 63.4 50.7 32.0 63.3 60.4 53.9 97.7 65.6 92.4 54.1 73.5Q.III 60.9 71.1 50.4 68.2 52.1 32.7 66.5 65.3 57.2 100.0 70.2 0.0 54.1 75.7Q.IV 64.5 75.6 53.2 70.1 54.4 36.8 63.6 69.9 60.3 100.0 69.8 0.0 59.7 79.4
2012/13Q.I 67.5 79.7 55.1 67.6 59.1 40.3 60.0 71.8 65.1 100.0 72.1 0.0 61.8 79.9Q.II 70.8 79.7 60.9 66.6 75.0 45.0 64.7 73.8 69.3 100.0 74.8 0.0 65.9 80.8Q.III 71.2 77.0 64.0 61.7 80.2 51.3 66.2 76.8 69.3 100.0 74.0 0.0 65.9 81.5Q.IV 75.1 78.4 69.7 57.0 83.4 64.2 68.9 81.3 69.3 100.0 74.7 0.0 68.6 83.9
2013/14Q.I 80.4 84.4 74.3 67.6 87.2 67.6 72.3 94.5 79.4 100.0 76.3 0.0 71.6 87.3Q.II 81.2 84.3 75.7 72.4 87.3 68.7 71.7 98.7 79.4 100.0 84.8 0.0 72.7 89.8Q.III 79.1 82.9 73.2 66.1 91.0 61.0 73.3 106.4 79.4 100.0 86.2 0.0 74.2 92.3Q.IV 76.2 85.8 65.7 59.1 91.3 42.0 74.8 105.8 83.2 100.0 85.5 0.0 78.3 95.0
2014/15Q.I 77.0 87.7 65.5 60.9 91.1 38.7 77.0 108.3 92.0 100.0 87.9 0.0 77.6 108.5Q.II 77.9 87.3 67.5 60.5 94.0 42.8 79.0 112.5 91.8 100.0 88.6 0.0 78.6 93.1Q.III 81.4 87.6 73.5 73.6 91.0 55.0 78.6 111.6 94.7 100.0 87.6 0.0 80.5 94.6Q.IV 87.8 94.0 79.5 87.3 91.4 63.0 87.9 114.7 95.8 100.0 87.1 0.0 83.4 93.7
2015/16Q.I 92.2 103.7 79.6 90.0 96.2 57.6 91.0 115.8 93.2 100.0 95.4 0.0 87.5 97.0Q.II 92.5 101.8 81.6 83.0 96.8 61.9 94.7 121.8 99.3 100.0 95.7 0.0 93.1 97.6Q.III 96.9 99.6 94.1 106.9 92.6 87.1 99.8 125.7 96.2 100.0 99.2 0.0 92.3 97.4Q.IV 101.2 101.6 100.7 99.9 98.6 103.0 100.7 122.6 96.9 100.0 100.5 0.0 94.4 95.2
2016/17QI 103.1 104.0 102.2 97.6 97.8 108.0 101.6 114.6 95.8 100.0 99.3 0.0 96.1 96.8QII 101.4 103.8 98.9 104.3 97.1 97.1 101.6 106.0 98.8 100.0 97.8 33.3 98.5 98.9QIII 101.4 102.3 100.6 94.3 100.0 104.3 99.3 110.1 95.6 100.7 97.4 100.0 99.8 99.2QIV 105.4 105.2 105.6 93.3 107.5 114.2 102.0 118.1 105.1 100.7 111.8 92.0 99.6 97.8
2017/18QI 108.5 109.8 107.2 101.1 105.3 117.3 100.5 120.4 112.9 99.9 110.5 101.3 97.1 98.2QII 112.8 115.8 109.9 101.1 114.6 117.7 103.4 107.2 123.3 99.8 119.5 98.5 103.5 103.4QIII 116.8 117.0 116.6 131.6 120.9 114.2 106.8 107.7 123.3 99.9 129.7 95.5 114.9 110.0QIV 116.7 116.2 117.2 120.4 121.4 120.2 110.8 108.6 123.3 100.5 130.5 93.5 111.4 118.4
2018/19QI 120.7 124.2 117.4 115.0 124.5 117.8 116.7 109.1 118.8 100.5 132.5 101.9 117.2 118.8QII 121.1 124.3 118.0 105.4 121.8 116.1 143.9 93.2 124.8 101.6 174.1 110.8 120.1 118.4QIII 124.2 126.1 122.4 93.6 123.1 134.9 152.0 91.8 123.3 104.0 176.0 115.0 117.5 123.0QIV 131.7 136.2 127.4 95.7 132.5 139.3 153.7 94.9 130.9 104.5 177.8 115.0 126.1 127.4
2019/20QI 140.5 151.7 129.6 95.3 134.9 130.6 153.0 102.9 170.3 103.4 164.8 114.8 145.6 141.0QII 134.9 142.0 128.1 97.7 131.2 135.2 154.0 96.9 149.2 103.6 172.8 114.5 134.2 132.6QIII 151.1 158.7 143.8 116.7 154.4 135.7 165.2 109.7 218.4 103.6 192.1 118.7 165.5 148.0QIV 158.7 174.6 143.2 134.0 156.7 125.6 169.5 101.2 222.3 104.6 192.7 127.2 153.7 150.3
2020/21QI 170.8 179.9 162.0 159.3 168.1 152.7 170.6 106.4 322.8 104.6 189.5 141.0 165.7 150.7QII 169.3 187.3 151.9 140.9 172.6 133.4 172.7 116.8 218.4 104.6 209.7 122.1 168.0 153.3
Source: Central Statistical Agency

National Bank of Ethiopia Quarterly Bulletin
114 | Second Quarter 2020/21
Table 22 (E2): Regional States' Consumer Price Indices (Non-Food)December 2016 = 100
Perio
d
Gen
eral
Inde
x
Food
& N
on-a
lcoh
olic
Inde
x
Non
-Foo
d In
dex
Alc
ohol
ic b
ever
ages
&
Toba
cco
Clo
thin
g &
Foot
-wea
r
Hous
ing,
Wat
er,E
lect
ricity
,Gas
an
d O
ther
Fue
ls
Furn
ishin
gs, H
ouse
hold
Equ
ip-
men
t and
Rou
tine
Mai
nte-
nanc
e of
the
Hous
e
Heal
th
Tran
spor
t
Com
mun
icat
ion
Recr
eatio
n an
d C
ultu
re
Educ
atio
n
Rest
aura
nts
and
Hote
ls
Misc
ella
neou
s G
oods
AMHARA2007/08
Q.I 28.0 28.7 27.2 26.0 28.3 26.8 22.1 36.2 49.6 52.1 35.9 46.8 23.8 34.0Q.II 28.9 30.5 27.3 25.8 27.9 26.6 23.4 37.1 50.0 52.5 36.7 47.9 25.0 35.3Q.III 30.1 31.7 28.5 28.2 29.1 27.5 25.4 39.9 55.4 58.2 38.0 49.6 26.5 37.4Q.IV 34.0 38.6 29.6 31.9 29.8 28.0 27.5 42.2 58.2 61.1 39.4 51.5 28.6 39.7
2008/09Q.I 41.2 50.7 32.2 41.9 31.4 30.0 29.6 41.3 58.2 61.1 41.0 53.5 32.2 41.3Q.II 40.4 48.2 32.9 42.9 33.8 30.3 30.6 40.8 59.0 62.0 42.6 55.6 33.8 40.9Q.III 38.2 43.1 33.5 43.1 35.7 30.3 32.8 43.3 54.0 56.7 44.6 58.3 34.7 42.0Q.IV 38.6 42.3 35.0 45.4 38.1 31.5 34.3 45.8 55.0 57.8 48.3 63.1 35.1 43.8
2009/10Q.I 40.5 43.8 37.3 45.4 40.3 34.3 35.7 47.2 58.1 61.1 50.4 65.8 36.7 46.5Q.II 41.3 42.9 39.7 45.3 42.9 37.0 37.1 51.2 58.3 61.3 52.1 68.1 38.3 48.9Q.III 41.7 42.2 41.2 46.0 46.3 38.1 38.5 54.2 60.9 64.0 52.6 68.7 39.4 50.5Q.IV 42.5 42.8 42.1 50.1 48.7 38.5 39.7 55.5 63.5 66.6 54.3 70.8 39.4 51.0
2010/11Q.I 43.8 43.6 43.9 51.1 50.7 40.6 40.8 56.2 62.2 65.3 58.4 76.3 40.3 52.5Q.II 46.7 44.8 48.4 54.9 56.0 45.4 43.7 57.6 65.6 68.9 66.7 87.1 42.7 57.7Q.III 49.7 47.0 52.2 55.9 61.5 49.3 46.2 57.8 81.7 85.8 67.1 87.6 44.2 61.0Q.IV 55.4 56.6 54.3 61.4 66.4 50.1 49.2 58.8 90.2 94.7 69.7 91.0 47.5 63.1
2011/12Q.I 59.8 63.0 56.6 66.9 70.8 51.2 52.3 59.3 90.6 95.2 73.0 95.3 51.7 70.3Q.II 62.6 66.7 58.6 62.5 76.1 52.2 54.4 58.0 82.9 87.1 75.9 99.1 54.9 73.8Q.III 65.1 68.6 61.5 64.7 79.7 55.1 56.4 58.8 84.0 87.0 79.4 100.0 57.8 74.9Q.IV 68.7 74.4 63.2 69.7 81.6 55.3 58.4 60.1 83.9 87.0 84.2 100.0 60.4 76.5
2012/13Q.I 71.9 79.1 64.9 73.1 82.7 56.4 59.4 61.6 85.2 87.0 84.2 100.0 63.4 77.5Q.II 73.2 78.5 68.0 74.9 83.9 59.1 68.8 63.4 88.5 87.0 81.1 100.0 65.3 84.5Q.III 73.6 78.1 69.3 76.1 84.6 59.0 72.2 68.8 86.6 87.0 82.3 100.0 68.4 85.8Q.IV 75.6 80.3 71.0 78.6 87.5 59.9 73.8 73.3 83.2 87.0 84.3 100.0 71.2 87.3
2013/14Q.I 77.7 83.6 72.0 81.1 88.7 60.2 74.3 76.0 78.7 87.0 84.1 100.0 73.4 88.1Q.II 79.1 83.0 75.172 86.8 88.8 64.1 76.3 82.5 81.7 87.0 86.5 100.0 76.6 89.9Q.III 79.5 81.5 77.366 89.6 91.3 67.2 78.5 85.6 83.8 87.0 87.7 100.0 77.3 90.6Q.IV 80.8 82.7 78.770 89.1 92.1 69.3 82.3 87.6 84.1 87.0 87.8 100.0 77.9 91.3
2014/15Q.I 81.6 83.8 79.4 90.7 93.9 68.9 82.8 89.0 84.3 88.4 88.1 108.3 79.3 91.6Q.II 82.4 84.0 80.7 91.7 99.1 69.7 83.6 92.6 85.9 87.0 88.0 100.0 80.2 91.9Q.III 83.7 84.7 82.6 92.7 101.9 72.4 85.4 93.5 86.0 90.0 89.2 100.0 81.3 92.6Q.IV 85.8 86.3 85.1 96.3 101.3 75.9 88.1 89.5 85.5 99.5 89.8 100.0 83.9 93.4
2015/16Q.I 89.7 91.5 87.8 95.8 103.5 79.6 90.1 90.0 94.4 108.7 86.6 100.0 86.5 92.7Q.II 90.9 92.7 89.0 95.9 101.8 80.6 92.4 89.1 101.4 97.7 94.9 100.0 89.7 93.1Q.III 92.4 93.0 91.7 99.3 102.2 84.5 94.9 97.3 96.3 98.3 96.2 100.0 92.1 94.1Q.IV 94.9 95.1 94.5 98.9 103.3 89.1 96.1 94.4 101.9 98.8 93.8 100.0 95.3 95.1
2016/17QI 99.8 101.3 98.1 97.1 101.4 96.9 97.8 88.7 103.5 98.3 97.6 100.0 99.2 96.4QIII 101.1 102.3 99.8 99.3 100.0 99.4 99.7 99.8 101.7 99.4 98.5 100.0 100.7 98.1QII 102.4 105.4 99.0 98.4 101.6 98.7 100.3 104.9 102.9 100.0 98.8 95.2 95.9 100.7QIV 108.7 110.1 107.2 124.7 103.6 108.4 101.9 133.6 104.0 99.1 123.5 95.5 102.1 99.9
2017/18QI 119.5 118.2 120.9 135.5 108.2 134.1 106.5 154.5 104.0 95.6 125.2 119.0 111.6 102.9QII 122.4 119.9 125.2 140.4 115.0 138.9 110.2 119.9 105.1 102.7 127.4 119.0 119.5 105.2QIII 125.5 122.0 129.4 144.8 119.5 145.7 121.2 150.8 105.4 112.8 133.4 119.0 111.1 112.4QIV 129.0 127.7 130.5 139.8 127.3 145.8 126.1 131.4 106.3 122.3 138.0 119.0 111.6 115.4
2018/19QI 134.1 133.9 134.2 141.6 132.6 148.5 127.8 155.4 106.9 128.9 140.9 119.0 114.4 124.2QII 134.4 132.9 136.2 141.1 138.1 149.2 129.9 171.6 116.1 115.3 142.3 120.6 118.7 119.1QIII 138.3 136.6 140.2 146.3 141.6 149.7 137.5 196.6 122.8 118.1 142.1 121.6 124.7 120.4QIV 148.6 149.3 147.8 150.3 148.2 161.8 143.7 175.3 125.5 139.3 141.5 136.5 130.1 125.7
2019/20QI 157.6 161.4 153.3 147.1 148.4 169.4 144.5 193.2 120.5 137.3 144.1 134.7 142.7 127.9QII 159.7 161.0 158.3 155.1 150.0 176.1 146.8 200.8 123.1 126.3 148.9 138.8 150.3 129.9QIII 169.7 174.2 164.8 181.6 152.4 180.5 149.5 207.8 148.4 120.4 161.7 126.0 155.8 133.3QIV 179.0 187.5 169.6 207.9 157.9 180.0 153.4 199.3 190.2 160.6 150.6 142.0 151.5 140.0
2020/21QI 185.8 200.0 169.8 193.7 159.8 177.8 155.2 222.7 215.2 149.4 140.2 132.7 153.3 150.5QII 185.9 197.9 172.5 207.2 165.1 182.6 158.3 206.7 143.9 138.8 159.4 138.3 163.6 150.5
Source: Central Statistical Agency

| 115
Table 22 (E3): Regional States' Consumer Price Indices (Non-Food)December 2016= 100
Perio
d
Gen
eral
Ind
ex
Food
& N
on-a
lcoh
olic
Ind
ex
Non
-Foo
d In
dex
Alc
ohol
ic b
ever
ages
&
Toba
cco
Clo
thin
g &
Foo
t-wea
r
Hous
ing,
Wat
er,E
lect
ricity
,G
as a
nd O
ther
Fue
ls
Furn
ishin
gs, H
ouse
hold
Eq
uipm
ent &
Rou
tine
Mai
nten
ance
of t
he H
ouse
Heal
th
Tran
spor
t
Com
mun
icat
ion
Recr
eatio
n an
d C
ultu
re
Educ
atio
n
Rest
aura
nts a
nd H
otel
s
Misc
ella
neou
s Goo
ds
BENISHANGUL GUMUZ2007/08
Q.I 28.9 27.1 32.3 22.7 18.7 49.8 23.6 45.8 64.7 68.5 39.2 47.4 28.4 35.0Q.II 31.0 29.9 33.6 23.3 19.8 51.9 24.1 49.0 64.0 67.8 39.8 48.2 30.2 36.1Q.III 33.6 33.8 34.8 24.8 21.7 51.6 25.5 51.0 63.6 67.4 43.0 52.0 32.3 38.6Q.IV 37.3 39.1 36.7 26.5 23.1 53.7 27.6 54.4 63.6 67.4 44.3 53.6 35.3 41.0
2008/09Q.I 48.7 57.2 40.3 31.3 24.1 56.8 32.7 61.0 63.6 67.4 56.0 67.7 38.4 43.2Q.II 46.0 51.0 41.7 31.1 26.4 57.3 34.5 63.0 67.7 71.7 58.7 71.0 39.1 44.2Q.III 42.8 44.4 42.6 32.5 27.4 58.2 35.8 67.8 61.7 65.4 59.1 71.6 41.4 45.3Q.IV 43.8 45.4 43.6 34.5 27.1 61.2 35.9 67.1 62.1 65.8 61.1 74.0 42.6 46.0
2009/10Q.I 46.8 49.5 45.4 34.8 27.7 62.6 40.4 68.3 66.6 70.6 61.5 74.5 45.3 48.3Q.II 45.6 45.1 48.0 34.5 31.3 66.5 42.1 68.0 71.5 75.8 63.3 76.7 47.6 50.0Q.III 43.6 40.8 48.9 37.0 35.1 63.4 43.8 71.6 74.5 78.9 64.4 77.9 50.9 52.0Q.IV 43.6 39.5 50.4 40.4 35.7 65.7 45.0 69.7 76.2 80.8 65.4 79.2 56.1 53.2
2010/11Q.I 43.3 38.1 51.6 40.4 39.4 62.8 49.0 68.5 75.4 79.9 67.5 81.7 58.1 53.1Q.II 46.2 39.2 56.6 43.8 45.1 67.3 56.1 71.7 80.5 85.3 72.8 88.1 59.4 59.8Q.III 49.4 44.0 58.0 44.7 49.4 64.0 57.9 73.0 86.8 91.9 73.4 88.9 53.8 64.0Q.IV 59.6 60.5 60.9 51.5 52.2 65.1 61.2 71.4 99.1 105.0 76.0 92.0 67.9 70.5
2011/12Q.I 66.0 70.9 62.6 50.4 55.1 60.8 66.7 62.4 99.1 105.0 79.1 95.7 73.9 77.3Q.II 70.8 76.5 65.6 49.6 63.0 60.3 69.1 65.7 92.8 98.3 82.1 99.3 72.5 81.2Q.III 74.2 76.1 71.8 53.3 68.7 70.2 74.9 66.0 98.4 100.0 83.7 0.0 73.8 84.2Q.IV 79.0 81.1 76.2 58.8 73.7 75.8 78.7 66.6 106.4 100.0 82.9 0.0 75.6 88.7
2012/13Q.I 82.1 84.6 78.8 62.1 73.5 82.2 78.9 67.3 106.5 100.0 85.0 0.0 77.6 89.2Q.II 82.2 83.4 80.6 69.9 79.9 81.2 80.2 71.0 99.5 100.0 86.9 0.0 78.6 90.9Q.III 81.4 79.9 83.3 71.5 80.6 89.6 78.7 72.6 96.4 100.0 88.6 0.0 79.6 91.3Q.IV 81.7 79.6 84.5 69.4 80.7 92.7 79.4 79.3 97.1 100.0 89.8 0.0 81.0 91.0
2013/14Q.I 86.6 87.2 85.9 69.5 82.0 93.4 81.5 81.7 97.8 100.0 90.4 0.0 84.4 93.4Q.II 91.3 92.7 89.4 80.0 82.8 97.0 83.8 91.0 100.7 100.0 90.5 0.0 86.3 94.7Q.III 89.2 85.0 94.7 87.4 89.1 108.4 83.7 92.3 102.9 100.0 90.9 0.0 86.4 95.4Q.IV 89.9 85.4 95.9 94.0 92.6 106.4 84.2 92.4 103.2 100.0 91.1 0.0 89.6 96.5
2014/15Q.I 88.0 83.9 93.6 89.4 93.4 99.1 87.5 91.6 101.9 100.0 91.0 0.0 88.3 95.8Q.II 88.4 84.9 93.2 83.9 94.8 98.5 87.9 83.4 100.5 100.0 92.0 0.0 91.8 94.9Q.III 89.1 88.1 90.5 85.5 97.6 85.7 91.0 83.9 100.3 100.0 92.4 0.0 92.0 95.7Q.IV 91.2 90.6 91.9 87.7 98.4 87.9 91.7 84.5 99.5 100.0 93.0 0.0 93.9 95.0
2015/16Q.I 97.2 99.9 93.7 84.1 100.0 93.6 94.9 85.9 99.8 100.0 93.8 0.0 92.2 95.8Q.II 98.4 99.9 96.4 88.6 101.5 97.6 97.0 94.3 100.1 100.0 94.0 0.0 92.1 98.3Q.III 96.1 94.6 98.0 92.5 101.5 98.0 99.7 96.8 103.3 100.0 96.1 0.0 95.2 98.7Q.IV 96.6 95.9 97.5 92.8 101.7 91.6 101.0 134.6 99.1 100.0 96.6 0.0 94.4 101.4
2016/17QI 99.6 100.1 99.0 85.7 100.0 98.9 98.5 149.8 99.6 100.0 98.7 0.0 96.0 100.9QII 99.8 100.4 99.0 92.2 100.2 99.0 99.6 102.4 106.9 100.0 100.0 33.3 97.6 102.1QIII 103.3 103.0 101.7 104.4 100.7 102.3 101.2 104.3 103.9 99.8 99.0 100.0 98.1 100.9QIV 106.5 109.5 103.0 98.3 102.1 102.8 107.9 113.4 104.7 102.1 111.6 99.4 101.6 101.9
2017/18QI 111.4 117.8 105.4 91.6 96.2 100.7 114.1 98.9 113.9 100.0 161.4 100.0 123.5 103.2QII 114.8 121.5 108.5 91.4 94.1 99.4 124.0 100.5 118.8 100.0 168.0 100.0 136.3 104.5QIII 117.6 119.9 115.5 109.9 99.8 102.2 126.8 132.8 122.7 100.0 167.3 100.0 140.8 112.3QIV 120.7 121.2 120.2 111.3 100.3 103.3 140.9 186.7 120.8 100.0 177.4 100.0 139.9 117.7
2018/19QI 125.8 129.2 122.6 106.2 102.9 103.6 147.2 189.5 117.7 100.0 174.9 100.0 152.2 119.1QII 130.0 130.2 129.9 110.3 114.7 101.7 147.5 191.0 119.0 97.8 177.6 100.0 187.4 117.8QIII 134.8 132.8 136.6 115.1 119.8 103.4 150.0 188.8 121.6 97.8 180.8 112.5 213.6 122.5QIV 143.4 142.9 143.9 127.9 119.7 110.8 165.9 189.9 127.5 100.0 184.4 104.2 218.8 132.1
2018/19QI 156.5 164.5 149.1 130.8 134.1 122.3 172.6 196.4 129.1 100.0 200.9 100.0 210.4 135.8QII 158.9 166.7 151.5 134.6 132.3 123.9 164.8 186.9 132.1 100.0 247.9 125.0 219.6 148.9QIII 167.2 173.0 161.9 161.4 136.3 131.0 175.2 192.6 132.1 100.0 238.5 125.0 234.1 158.7QIV 179.9 190.9 169.6 197.1 137.9 128.7 175.7 197.2 140.5 100.0 234.7 125.0 249.5 161.0
2020/21QI 201.1 222.6 180.8 201.3 147.0 141.5 177.9 195.9 177.9 100.0 236.1 114.6 271.0 169.6QII 203.4 220.5 187.2 210.7 149.5 153.1 183.1 198.8 132.7 100.0 268.6 125.0 288.0 170.6
Source: Central Statistical Agency

National Bank of Ethiopia Quarterly Bulletin
116 | Second Quarter 2020/21
Table 22 (E4): Regional States' Consumer Price Indices (Non-Food)December 2016 = 100
Perio
d
Gen
eral
Ind
ex
Food
& N
on-a
lcoh
olic
Ind
ex
Non
-Foo
d In
dex
Alc
ohol
ic b
ever
ages
&
Tob
acco
Clo
thin
g &
Foo
t-wea
r
Hous
ing,
Wat
er,E
lect
ricity
,G
as a
nd O
ther
Fue
ls
Furn
ishin
gs, H
ouse
hold
Eq
uipm
ent a
nd R
outin
e M
aint
enan
ce o
f the
Hou
se
Heal
th
Tran
spor
t
Com
mun
icat
ion
Recr
eatio
n an
d C
ultu
re
Educ
atio
n
Rest
aura
nts a
nd H
otel
s
Misc
ella
neou
s Goo
ds
DIRE DAWA2007/08
Q.I 27.3 28.0 28.8 17.8 24.9 29.3 30.2 35.9 62.6 76.7 44.9 60.1 16.0 39.8Q.II 28.1 28.7 30.0 18.1 26.0 29.8 33.6 40.5 62.6 76.7 45.8 61.3 18.1 40.2Q.III 30.5 32.3 31.1 18.7 27.0 30.1 36.3 42.9 65.3 80.0 48.2 64.5 18.0 41.3Q.IV 34.5 38.5 32.8 19.3 28.5 33.0 38.3 43.1 65.6 80.4 49.5 66.1 18.5 41.3
2008/09Q.I 39.6 47.2 34.4 22.8 28.6 35.6 40.0 47.4 64.0 78.4 51.8 69.3 22.7 42.7Q.II 40.2 47.4 35.4 23.1 30.9 35.5 42.7 48.4 62.2 76.2 54.5 72.9 28.5 43.2Q.III 40.0 46.6 35.9 23.3 32.1 35.0 44.7 49.5 60.5 74.2 56.5 75.6 29.3 43.6Q.IV 40.7 46.7 37.3 24.3 33.3 36.4 48.0 49.3 61.6 75.5 56.7 75.9 32.3 45.4
2009/10Q.I 41.5 47.5 38.3 25.3 34.1 38.1 48.0 50.7 62.8 77.0 57.4 76.8 31.8 47.4Q.II 41.8 46.6 40.0 26.4 36.2 38.7 51.2 52.3 64.5 79.0 63.5 85.0 31.3 48.0Q.III 42.6 47.5 40.9 26.5 36.9 38.9 54.2 53.6 65.5 80.3 64.1 85.8 33.2 49.5Q.IV 43.3 48.3 41.3 28.8 35.9 39.6 56.5 52.7 66.0 80.8 64.6 86.4 34.1 50.6
2010/11Q.I 43.9 48.3 42.8 31.0 37.1 41.2 60.5 55.1 66.2 81.1 61.3 82.0 33.0 51.9Q.II 46.9 50.9 46.4 33.1 39.6 45.8 65.1 55.4 69.4 85.0 70.3 94.1 37.4 52.5Q.III 49.0 53.5 48.2 37.6 42.9 49.4 61.6 57.6 73.0 89.4 68.7 91.9 39.8 53.3Q.IV 54.4 62.4 50.0 38.5 44.4 52.0 60.3 64.0 85.3 104.5 65.8 88.0 45.5 54.2
2011/12Q.I 57.7 68.0 51.0 43.5 46.0 52.7 62.4 61.1 82.3 100.8 66.0 88.3 50.7 56.0Q.II 59.1 69.6 52.2 44.4 47.3 51.9 64.0 70.6 81.8 100.2 74.4 99.5 49.1 58.7Q.III 61.4 71.4 55.2 43.5 53.8 53.6 65.7 79.8 84.8 100.0 74.4 100.0 56.2 62.4Q.IV 63.5 75.3 56.0 38.2 57.5 55.7 67.2 80.1 91.2 100.0 75.7 100.0 63.4 64.0
2012/13Q.I 64.8 77.8 56.7 33.4 59.0 60.8 69.7 79.7 91.2 100.0 75.7 100.0 65.8 64.1Q.II 67.5 77.7 61.1 45.5 65.0 61.1 70.0 81.7 93.2 100.0 77.7 100.0 66.3 64.2Q.III 68.2 76.0 63.4 48.8 65.8 63.0 73.0 87.7 99.0 100.0 76.8 100.0 68.2 65.1Q.IV 68.3 78.3 62.1 33.1 69.9 70.4 73.7 88.7 100.0 100.0 79.8 100.0 72.1 66.7
2013/14Q.I 73.5 84.6 66.6 34.9 70.5 85.2 74.6 91.0 98.4 100.0 80.5 100.0 69.9 68.9Q.II 79.9 84.4 77.1 53.6 76.8 97.2 76.3 93.3 100.0 100.0 84.7 100.0 76.6 71.2Q.III 80.2 81.4 79.5 62.4 78.0 92.6 83.7 93.7 97.4 100.0 86.5 100.0 78.8 75.9Q.IV 80.7 81.6 80.2 65.6 77.7 91.9 85.3 94.4 96.2 100.0 86.5 100.0 79.0 76.5
2014/15Q.I 84.6 88.0 82.4 67.7 78.9 93.8 86.6 100.0 99.5 100.0 92.1 100.0 82.6 79.3Q.II 83.8 89.7 80.2 61.9 79.6 93.9 87.4 100.2 103.0 100.0 92.1 100.0 75.9 80.6Q.III 87.7 89.7 86.4 80.5 83.1 94.3 88.6 96.3 98.9 100.0 92.4 100.0 78.0 84.7Q.IV 92.7 90.7 94.0 108.5 82.9 94.8 89.9 95.7 96.2 100.0 94.0 100.0 73.7 86.1
2015/16Q.I 90.6 90.4 90.7 84.8 89.3 97.4 95.0 96.5 95.7 100.0 97.9 100.0 85.8 87.6Q.II 90.4 91.2 89.9 79.0 93.6 95.6 94.6 96.1 94.3 100.0 97.9 100.0 93.2 87.1Q.III 97.0 92.4 99.8 111.4 94.0 95.7 95.2 97.9 96.2 100.0 97.8 100.0 94.0 93.3Q.IV 97.2 97.7 96.9 97.2 95.9 95.2 99.4 99.1 96.2 100.0 97.8 100.0 99.1 95.0
2016/17QI 95.9 100.8 92.8 80.4 95.4 96.8 97.2 98.7 100.0 100.0 97.8 100.0 100.6 97.8QII 99.8 101.5 98.7 95.2 100.8 98.3 99.9 98.6 100.0 100.0 98.6 100.0 103.0 100.6QIII 103.4 101.5 104.8 121.4 106.5 101.9 100.1 99.4 100.1 100.0 102.6 99.8 101.6 100.6QIV 102.8 103.3 102.4 98.5 106.9 106.3 99.4 93.8 95.1 100.0 106.0 101.6 104.0 103.6
2017/18QI 104.8 105.8 104.1 104.1 97.1 117.2 106.3 103.2 97.6 95.3 100.0 106.8 103.1 105.5QII 110.0 111.5 109.0 123.9 123.4 104.6 104.5 97.3 95.9 100.0 115.7 103.1 107.3 99.7QIII 111.0 112.3 110.1 116.3 124.4 105.4 112.9 99.1 98.4 100.0 122.7 103.1 108.0 105.2QIV 117.5 124.2 112.4 104.4 129.7 108.9 124.1 101.5 100.5 100.0 125.3 103.2 111.3 111.4
2018/19QI 123.7 133.8 116.2 111.1 130.2 112.1 126.9 104.4 119.4 86.7 124.2 115.8 120.1 114.7QII 120.0 129.1 113.2 106.5 128.3 114.5 125.2 108.0 107.2 60.2 115.8 112.7 120.2 115.1QIII 123.4 133.8 115.7 110.6 126.4 117.3 122.9 116.8 115.5 60.2 136.6 122.4 123.6 118.2QIV 132.9 150.3 120.0 111.0 133.0 123.2 132.0 118.4 111.1 60.2 133.3 124.5 128.4 125.1
2019/20 119.8QI 140.3 162.6 123.7 104.7 142.0 129.9 138.7 120.4 114.8 60.2 127.9 146.9 133.3 126.1QII 147.6 169.9 131.0 126.4 154.5 132.5 146.6 133.2 113.6 60.2 128.9 152.5 127.8 134.9QIII 150.6 167.3 138.2 153.1 164.7 140.3 148.4 139.1 108.5 60.2 129.5 148.7 125.4 135.2QIV 164.4 187.4 147.2 165.0 167.3 137.9 153.6 137.2 201.8 60.2 129.2 145.4 141.8 135.0
2020/21QI 181.8 216.5 155.9 166.4 166.0 143.3 157.7 147.1 295.0 60.2 131.9 149.7 151.8 136.4QII 172.5 204.1 149.0 157.8 154.7 143.2 153.4 168.9 211.2 60.2 142.4 166.0 160.2 135.6
Source: Central Statistical Agency

| 117
Table 22 (E5): Regional States' Consumer Price Indices (Non-Food)December 2016 = 100
Perio
d
Gen
eral
Ind
ex
Food
& N
on-a
lcoh
olic
In
dex
Non
-Foo
d In
dex
Alc
ohol
ic b
ever
ages
&
Toba
cco
Clo
thin
g &
Foo
t-wea
r
Hous
ing,
Wat
er,
Elec
trici
ty,G
as a
nd O
ther
Fu
els
Furn
ishin
gs, H
ouse
hold
Eq
uipm
ent a
nd R
outin
e M
aint
enan
ce o
f th
e Ho
use
Heal
th
Tran
spor
t
Com
mun
icat
ion
Recr
eatio
n an
d C
ultu
re
Educ
atio
n
Rest
aura
nts a
nd H
otel
s
Misc
ella
neou
s Goo
ds
GAMBELLA2007/08
Q.I 26.9 23.8 33.0 34.2 26.3 49.1 24.8 29.7 38.5 55.6 20.8 33.8 26.9 39.0Q.II 27.9 25.1 33.3 33.5 27.6 49.4 25.8 29.9 38.5 55.6 21.0 34.0 28.1 39.5Q.III 29.3 26.3 35.2 35.5 29.5 50.7 29.2 30.3 42.1 60.9 21.7 35.2 29.8 39.2Q.IV 33.6 31.4 37.8 36.4 31.0 56.1 34.4 31.6 43.9 63.5 22.2 36.0 31.3 39.7
2008/09Q.I 50.2 52.7 45.1 45.9 35.8 66.5 40.8 32.7 43.9 63.5 23.3 37.7 36.5 43.4Q.II 47.2 46.2 48.9 50.9 38.4 72.9 40.4 33.9 43.4 62.8 27.5 44.6 36.4 43.4Q.III 42.2 39.5 47.3 50.7 37.0 68.1 40.0 33.9 42.6 61.6 28.5 46.2 36.4 43.0Q.IV 44.3 42.1 48.3 52.5 37.3 70.0 39.6 36.1 43.1 62.3 30.4 49.2 36.5 43.6
2009/10Q.I 47.0 45.4 49.9 53.4 37.6 75.3 38.8 38.6 43.8 63.3 32.0 51.9 36.6 44.6Q.II 43.7 40.6 49.7 54.7 38.5 69.9 41.7 40.2 50.6 73.2 31.9 51.7 37.3 45.8Q.III 43.5 39.2 51.7 56.8 39.0 74.4 43.2 40.7 54.1 78.1 34.6 56.1 39.6 46.0Q.IV 43.7 38.4 53.9 59.7 38.7 79.5 44.8 42.3 54.4 78.7 37.5 60.8 39.7 46.5
2010/11Q.I 44.6 39.4 54.6 57.5 40.4 80.9 47.5 42.6 55.2 79.7 42.0 68.2 41.6 46.5Q.II 47.2 41.6 58.0 61.2 44.1 85.8 50.2 44.8 56.5 81.6 45.2 73.2 48.0 48.3Q.III 49.3 43.4 60.9 66.1 45.6 87.4 55.5 47.6 56.6 81.9 48.6 78.7 43.3 49.8Q.IV 56.8 52.9 64.3 72.5 48.6 88.5 60.8 48.6 61.6 89.1 51.6 83.7 48.6 51.5
2011/12Q.I 63.5 60.7 68.7 82.9 51.3 88.5 65.6 48.2 64.1 92.7 54.7 88.6 50.8 55.6Q.II 67.9 66.3 70.7 80.8 53.1 92.9 67.2 49.1 66.1 95.5 58.7 95.1 54.7 58.7Q.III 71.2 71.3 71.9 81.7 57.7 88.8 70.2 50.4 71.1 100.0 61.5 0.0 59.8 62.1Q.IV 75.5 76.9 74.6 83.1 64.0 90.3 72.2 50.3 75.5 100.0 62.6 0.0 64.7 64.9
2012/13Q.I 77.9 78.8 77.6 92.8 65.8 93.9 75.0 52.4 77.0 100.0 62.8 0.0 66.4 64.1Q.II 76.8 75.0 79.7 94.0 70.5 92.2 77.6 56.5 78.0 100.0 67.8 0.0 69.4 70.8Q.III 77.0 74.1 81.2 90.9 72.0 93.5 78.4 58.8 78.9 100.0 73.5 0.0 70.3 81.5Q.IV 80.0 78.1 83.1 86.3 73.5 93.0 85.9 64.1 79.8 100.0 78.4 0.0 71.0 85.7
2013/14Q.I 83.5 81.4 86.8 90.0 78.6 104.4 85.1 65.6 80.8 100.0 82.8 0.0 71.3 85.8Q.II 84.7 82.3 88.4 93.9 82.0 105.0 86.2 67.9 81.3 100.0 82.5 0.0 74.0 86.2Q.III 84.9 81.7 89.5 94.1 83.2 103.4 90.4 69.9 81.3 100.0 83.7 0.0 75.2 89.0Q.IV 87.9 85.9 91.2 95.6 82.9 110.0 88.9 74.0 79.3 100.0 82.5 0.0 78.3 89.3
2014/15Q.I 89.3 86.6 93.4 97.8 79.8 121.3 87.8 74.4 83.0 100.0 84.3 0.0 76.5 88.7Q.II 86.1 84.0 89.5 97.7 80.7 102.1 87.8 75.3 84.3 100.0 85.2 0.0 79.0 86.0Q.III 87.9 87.1 89.7 95.8 84.8 96.9 88.9 79.2 85.9 100.0 86.9 0.0 80.7 90.1Q.IV 90.0 88.8 92.4 102.8 87.6 103.3 90.5 78.5 86.1 100.0 82.2 0.0 79.6 91.2
2015/16Q.I 95.9 96.8 95.8 114.9 94.0 103.3 91.6 81.2 86.5 100.0 87.3 0.0 83.3 94.7QII 94.9 93.2 97.9 111.0 92.3 106.2 92.8 82.0 100.5 100.0 89.9 0.0 89.0 98.0QIII 94.7 93.1 97.6 105.4 92.0 105.6 95.9 84.4 100.7 100.0 90.0 0.0 92.3 90.4QIV 97.9 98.0 97.7 111.6 93.0 100.9 98.6 87.9 91.3 100.0 91.5 0.0 92.5 92.4
2016/17QI 99.9 101.1 97.8 108.9 96.9 98.9 97.4 90.1 95.5 100.0 92.6 0.0 94.3 92.3QII 99.7 99.5 100.1 110.9 98.1 101.0 98.8 94.4 99.8 100.0 97.6 33.3 97.3 95.5QIII 101.2 102.2 100.1 108.2 100.6 100.3 95.7 95.3 100.1 100.0 84.9 100.0 98.7 97.3QIV 103.8 106.5 100.8 114.7 99.8 100.7 99.3 85.0 100.4 100.0 111.9 100.0 98.3 94.2
2017/18QI 107.7 111.7 103.0 122.0 111.6 101.4 101.9 81.5 101.0 100.4 116.3 100.0 99.7 96.1QII 108.1 109.3 106.6 129.7 115.3 103.7 113.4 74.3 102.9 100.4 124.6 100.0 103.6 97.8QIII 108.7 110.1 107.0 132.4 124.4 95.3 120.8 86.4 125.1 100.3 126.0 100.0 115.9 98.6QIV 116.5 120.6 111.8 134.7 128.1 95.4 125.7 96.4 134.4 115.8 128.8 100.0 140.1 101.7
2018/19QI 122.5 127.8 116.3 129.2 131.2 104.9 127.9 95.9 134.5 115.2 130.1 100.0 142.6 103.1QII 119.6 125.0 113.4 134.0 133.5 96.9 131.8 90.1 134.4 109.8 127.0 103.6 143.5 104.8QIII 121.6 129.1 113.0 144.8 130.8 93.1 137.9 89.4 136.0 97.9 122.9 117.1 146.0 106.1QIV 129.0 137.3 119.6 151.8 134.2 102.8 138.6 110.2 136.1 95.8 125.9 107.0 148.7 110.3
2019/20QI 138.9 149.2 127.1 155.7 144.4 109.9 143.2 130.9 149.8 98.2 131.0 143.3 157.4 116.3QII 139.8 147.6 130.7 153.5 152.8 118.6 145.5 105.2 130.9 105.4 149.7 158.9 165.6 111.8QIII 149.0 159.3 137.2 190.5 153.0 124.0 140.0 89.3 151.3 121.7 152.2 163.0 160.4 116.6QIV 165.7 181.3 147.8 250.2 159.3 132.4 151.9 94.0 148.7 120.0 144.8 145.2 150.6 118.6
2020/21QI 173.7 192.1 152.5 269.9 157.7 135.2 150.2 111.3 175.6 115.2 146.0 146.1 152.9 112.0QII 173.6 190.6 154.1 265.4 164.6 134.5 151.6 117.9 180.2 118.8 191.2 160.9 161.5 116.6
Source: Central Statistical Agency

National Bank of Ethiopia Quarterly Bulletin
118 | Second Quarter 2020/21
Table 22 (E6): Regional States' Consumer Price Indices (Non-Food)December 2016 = 100
Perio
d
Gen
eral
Ind
ex
Food
& N
on-a
lcoh
olic
In
dex
Non
-Foo
d In
dex
Alc
ohol
ic b
ever
ages
&
Toba
cco
Clo
thin
g &
Foo
t-wea
r
Hous
ing,
Wat
er,E
lect
ricity
,-G
as a
nd O
ther
Fue
ls
Furn
ishin
gs, H
ouse
hold
Eq
uipm
ent a
nd R
outin
e M
aint
enan
ce o
f the
Hou
se
Heal
th
Tran
spor
t
Com
mun
icat
ion
Recr
eatio
n an
d C
ultu
re
Educ
atio
n
Rest
aura
nts a
nd H
otel
s
Misc
ella
neou
s Goo
ds
HARARI2007/08
Q.I 24.6 19.2 31.8 21.0 24.9 54.7 31.0 33.5 56.6 60.6 27.1 51.4 23.4 27.4Q.II 25.2 19.7 32.4 21.3 27.2 54.0 32.1 34.0 56.6 60.6 27.3 51.7 23.8 27.9Q.III 27.0 21.5 34.3 21.1 28.6 58.2 33.7 33.3 64.6 69.1 27.1 51.3 25.8 28.2Q.IV 32.9 28.4 38.1 22.4 31.3 67.6 36.8 31.9 68.6 73.4 28.5 54.0 29.9 30.2
2008/09Q.I 38.8 35.7 40.7 28.0 35.0 70.2 38.7 32.8 73.8 79.0 29.5 56.0 35.4 32.2Q.II 39.1 35.2 42.2 29.3 36.6 72.9 40.2 35.7 73.9 79.1 31.0 58.8 37.6 33.6Q.III 38.7 34.1 42.5 35.2 39.1 69.8 42.1 35.7 67.2 71.9 32.0 60.6 37.6 33.7Q.IV 39.6 34.7 43.6 37.4 40.8 69.6 44.4 35.2 67.6 72.3 33.8 64.0 37.9 34.0
2009/10Q.I 40.6 35.0 46.0 37.9 42.7 73.1 46.5 67.2 72.5 77.6 35.7 67.7 38.8 34.8Q.II 41.1 35.1 46.9 38.8 43.8 71.5 49.7 83.6 74.1 79.3 37.9 71.8 39.2 35.1Q.III 42.2 36.4 47.6 39.4 43.7 74.2 50.9 84.5 72.4 77.5 38.1 72.3 40.5 35.6Q.IV 43.0 36.8 49.0 39.3 44.6 77.9 51.4 84.1 72.6 77.7 40.6 77.0 42.1 35.4
2010/11Q.I 44.4 38.2 50.3 41.2 46.5 79.8 51.9 85.0 72.4 77.5 42.0 79.5 43.9 35.8Q.II 47.6 40.8 54.3 45.3 50.2 87.1 54.3 87.5 80.4 86.0 44.5 84.3 45.2 37.6Q.III 51.3 44.8 56.9 47.1 51.1 95.4 52.7 96.5 80.6 86.3 46.4 88.0 46.0 45.1Q.IV 55.7 48.8 61.3 49.3 53.6 104.1 58.3 92.8 85.2 91.3 49.3 93.4 50.5 56.7
2011/12Q.I 58.7 52.4 62.4 52.9 56.2 100.7 60.2 95.2 92.6 99.1 50.6 95.9 60.9 62.0Q.II 61.0 54.8 65.6 52.9 59.8 100.5 61.5 95.2 93.0 99.6 52.2 99.0 62.3 70.3Q.III 65.8 61.2 70.8 55.3 63.4 100.3 64.2 102.6 93.4 100.0 49.8 100.0 65.0 74.4Q.IV 69.4 67.9 71.1 54.4 64.9 100.7 65.6 96.9 96.2 100.0 48.7 100.0 70.3 74.7
2012/13Q.I 70.1 70.1 70.0 50.8 66.9 100.2 65.2 96.2 98.3 100.0 50.6 100.0 75.0 78.2Q.II 71.3 71.1 71.7 52.4 71.2 100.3 68.9 106.3 103.8 100.0 51.4 100.0 74.9 78.0Q.III 72.9 69.1 76.9 63.0 74.4 100.2 71.0 115.4 103.8 100.0 52.9 100.0 76.8 79.0Q.IV 71.3 73.2 69.3 43.5 77.2 99.9 74.3 138.5 100.0 100.0 55.6 100.0 77.8 80.3
2013/14Q.I 76.2 78.7 73.5 51.4 77.8 102.0 76.4 105.3 100.0 100.0 60.1 100.0 83.7 81.7Q.II 77.9 78.4 77.3 55.7 80.1 109.0 77.8 100.0 100.0 100.0 61.9 100.0 84.4 83.5Q.III 81.2 76.9 85.8 71.9 82.1 113.3 78.7 100.0 102.1 100.0 61.9 100.0 86.3 87.0Q.IV 80.7 79.2 82.4 61.8 83.9 115.1 82.9 93.3 98.8 100.0 61.6 100.0 88.5 87.2
2014/15Q.I 82.8 84.8 80.6 56.9 83.7 116.1 84.1 100.0 100.0 100.0 59.7 100.0 87.6 87.6Q.II 83.3 85.8 80.6 57.4 84.8 114.4 83.4 86.6 100.0 100.0 59.9 100.0 90.6 89.2Q.III 87.4 86.2 88.6 77.4 88.5 109.7 82.6 80.0 100.0 100.0 60.1 100.0 93.2 90.0Q.IV 87.9 90.0 85.6 70.7 89.2 107.9 85.3 80.0 100.0 100.0 61.2 100.0 92.8 91.8
2015/16Q.I 87.6 90.6 84.5 65.3 91.0 107.9 90.3 80.0 100.0 100.0 80.9 100.0 97.1 93.8Q.II 89.4 92.1 86.4 68.7 91.6 107.8 94.4 106.0 100.0 100.0 61.1 100.0 97.6 98.0QIII 105.6 92.7 119.4 145.9 93.2 102.6 96.8 120.2 100.0 100.0 97.8 100.0 95.3 104.1QIV 96.1 97.3 94.8 90.0 94.3 100.1 98.5 100.0 100.0 100.0 99.6 100.0 96.8 99.1
2016/17QI 97.8 102.3 93.1 84.4 99.0 100.0 97.5 116.5 100.0 100.0 99.7 100.0 99.2 99.2QIII 97.4 100.7 93.9 85.8 102.3 99.9 98.8 104.3 100.0 100.0 99.5 100.0 97.6 100.6QII 103.6 100.0 106.1 119.7 98.3 105.1 99.3 101.8 100.0 100.0 99.5 101.0 102.9 101.7QIV 102.5 107.5 99.0 94.7 104.3 95.5 103.4 99.7 100.0 100.0 107.5 101.2 101.5 99.9
2017/18QI 103.5 110.8 98.4 86.3 107.9 96.4 102.9 106.7 100.0 100.0 111.6 102.2 104.4 100.5QII 105.1 110.6 101.3 91.6 111.3 94.0 110.1 106.4 102.3 100.0 111.3 115.5 108.1 104.4QIII 112.7 110.1 114.4 131.7 115.5 99.6 116.0 111.7 111.7 100.0 113.5 119.2 113.2 106.5QIV 114.6 116.0 113.6 120.1 115.3 101.4 122.2 111.3 111.7 100.0 114.6 120.3 117.6 113.3
2018/19QI 116.0 123.5 110.8 93.8 121.4 107.3 128.6 110.9 111.6 100.0 110.4 135.6 121.7 116.9QII 117.4 123.7 113.1 96.1 123.5 108.5 127.4 112.5 117.9 100.0 112.6 151.8 125.0 120.2QIII 122.4 125.9 119.9 115.8 128.4 114.4 129.2 110.1 135.1 100.0 111.2 152.3 121.2 127.6QIV 129.8 138.8 123.6 117.8 127.9 113.1 136.4 118.7 139.8 100.0 118.8 151.5 133.6 135.0
2019/20QI 142.3 153.9 134.3 133.3 136.8 129.3 133.4 123.9 150.0 100.0 121.8 149.3 147.7 133.5QII 145.9 160.0 136.0 106.0 136.3 155.8 132.2 139.7 150.0 100.0 138.3 137.6 161.6 133.6QIII 151.8 159.2 146.6 128.9 140.7 166.1 134.0 144.9 156.0 100.0 143.8 139.8 170.7 139.8QIV 162.0 173.0 154.4 140.7 141.6 156.6 142.3 150.3 320.1 100.0 142.9 130.3 171.6 144.7
2020/21QI 178.4 189.7 170.5 175.1 143.0 172.2 151.8 156.8 423.3 100.0 129.9 129.3 170.4 157.7QII 179.7 192.4 170.8 176.1 138.0 190.2 154.7 160.5 258.7 100.0 136.2 155.4 178.9 167.9
Source: Central Statistical Agency
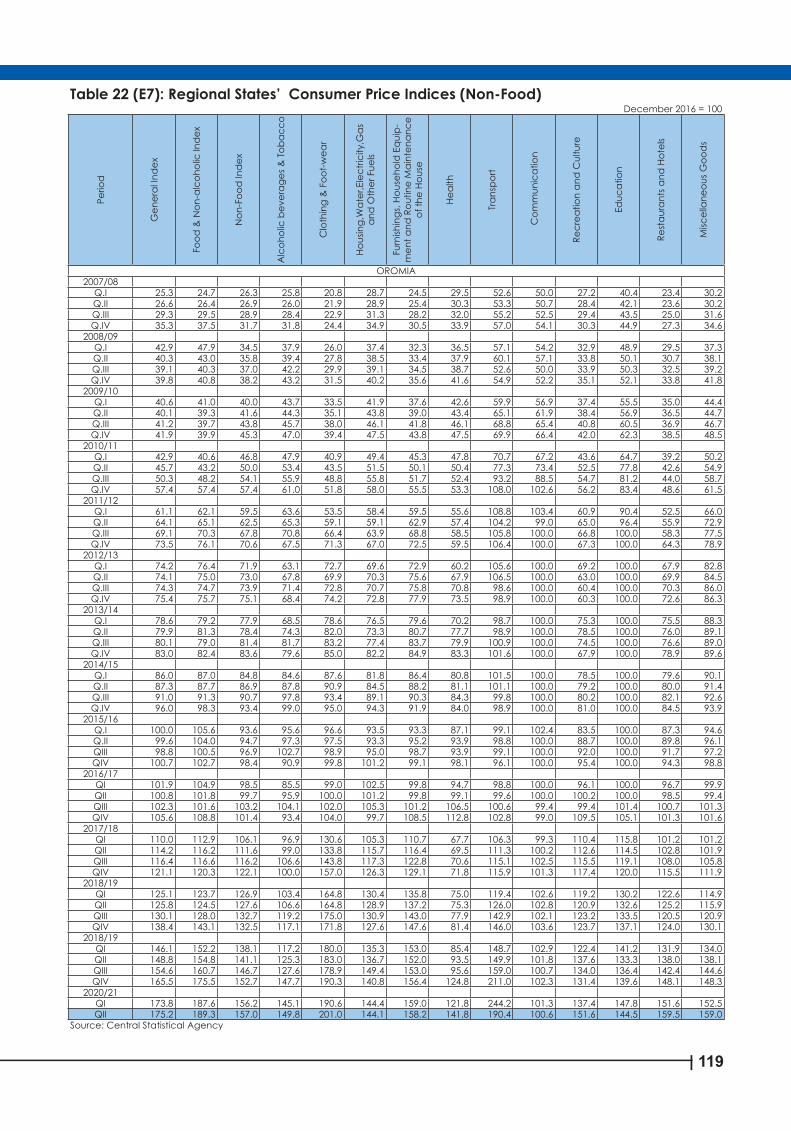
| 119
Table 22 (E7): Regional States’ Consumer Price Indices (Non-Food)December 2016 = 100
Perio
d
Gen
eral
Ind
ex
Food
& N
on-a
lcoh
olic
Ind
ex
Non
-Foo
d In
dex
Alc
ohol
ic b
ever
ages
& T
obac
co
Clo
thin
g &
Foo
t-wea
r
Hous
ing,
Wat
er,E
lect
ricity
,Gas
an
d O
ther
Fue
ls
Furn
ishin
gs, H
ouse
hold
Equ
ip-
men
t and
Rou
tine
Mai
nten
ance
of
the
Hous
e
Heal
th
Tran
spor
t
Com
mun
icat
ion
Recr
eatio
n an
d C
ultu
re
Educ
atio
n
Rest
aura
nts a
nd H
otel
s
Misc
ella
neou
s Goo
ds
OROMIA2007/08
Q.I 25.3 24.7 26.3 25.8 20.8 28.7 24.5 29.5 52.6 50.0 27.2 40.4 23.4 30.2Q.II 26.6 26.4 26.9 26.0 21.9 28.9 25.4 30.3 53.3 50.7 28.4 42.1 23.6 30.2Q.III 29.3 29.5 28.9 28.4 22.9 31.3 28.2 32.0 55.2 52.5 29.4 43.5 25.0 31.6Q.IV 35.3 37.5 31.7 31.8 24.4 34.9 30.5 33.9 57.0 54.1 30.3 44.9 27.3 34.6
2008/09Q.I 42.9 47.9 34.5 37.9 26.0 37.4 32.3 36.5 57.1 54.2 32.9 48.9 29.5 37.3Q.II 40.3 43.0 35.8 39.4 27.8 38.5 33.4 37.9 60.1 57.1 33.8 50.1 30.7 38.1Q.III 39.1 40.3 37.0 42.2 29.9 39.1 34.5 38.7 52.6 50.0 33.9 50.3 32.5 39.2Q.IV 39.8 40.8 38.2 43.2 31.5 40.2 35.6 41.6 54.9 52.2 35.1 52.1 33.8 41.8
2009/10Q.I 40.6 41.0 40.0 43.7 33.5 41.9 37.6 42.6 59.9 56.9 37.4 55.5 35.0 44.4Q.II 40.1 39.3 41.6 44.3 35.1 43.8 39.0 43.4 65.1 61.9 38.4 56.9 36.5 44.7Q.III 41.2 39.7 43.8 45.7 38.0 46.1 41.8 46.1 68.8 65.4 40.8 60.5 36.9 46.7Q.IV 41.9 39.9 45.3 47.0 39.4 47.5 43.8 47.5 69.9 66.4 42.0 62.3 38.5 48.5
2010/11Q.I 42.9 40.6 46.8 47.9 40.9 49.4 45.3 47.8 70.7 67.2 43.6 64.7 39.2 50.2Q.II 45.7 43.2 50.0 53.4 43.5 51.5 50.1 50.4 77.3 73.4 52.5 77.8 42.6 54.9Q.III 50.3 48.2 54.1 55.9 48.8 55.8 51.7 52.4 93.2 88.5 54.7 81.2 44.0 58.7Q.IV 57.4 57.4 57.4 61.0 51.8 58.0 55.5 53.3 108.0 102.6 56.2 83.4 48.6 61.5
2011/12Q.I 61.1 62.1 59.5 63.6 53.5 58.4 59.5 55.6 108.8 103.4 60.9 90.4 52.5 66.0Q.II 64.1 65.1 62.5 65.3 59.1 59.1 62.9 57.4 104.2 99.0 65.0 96.4 55.9 72.9Q.III 69.1 70.3 67.8 70.8 66.4 63.9 68.8 58.5 105.8 100.0 66.8 100.0 58.3 77.5Q.IV 73.5 76.1 70.6 67.5 71.3 67.0 72.5 59.5 106.4 100.0 67.3 100.0 64.3 78.9
2012/13Q.I 74.2 76.4 71.9 63.1 72.7 69.6 72.9 60.2 105.6 100.0 69.2 100.0 67.9 82.8Q.II 74.1 75.0 73.0 67.8 69.9 70.3 75.6 67.9 106.5 100.0 63.0 100.0 69.9 84.5Q.III 74.3 74.7 73.9 71.4 72.8 70.7 75.8 70.8 98.6 100.0 60.4 100.0 70.3 86.0Q.IV 75.4 75.7 75.1 68.4 74.2 72.8 77.9 73.5 98.9 100.0 60.3 100.0 72.6 86.3
2013/14Q.I 78.6 79.2 77.9 68.5 78.6 76.5 79.6 70.2 98.7 100.0 75.3 100.0 75.5 88.3Q.II 79.9 81.3 78.4 74.3 82.0 73.3 80.7 77.7 98.9 100.0 78.5 100.0 76.0 89.1Q.III 80.1 79.0 81.4 81.7 83.2 77.4 83.7 79.9 100.9 100.0 74.5 100.0 76.6 89.0Q.IV 83.0 82.4 83.6 79.6 85.0 82.2 84.9 83.3 101.6 100.0 67.9 100.0 78.9 89.6
2014/15Q.I 86.0 87.0 84.8 84.6 87.6 81.8 86.4 80.8 101.5 100.0 78.5 100.0 79.6 90.1Q.II 87.3 87.7 86.9 87.8 90.9 84.5 88.2 81.1 101.1 100.0 79.2 100.0 80.0 91.4Q.III 91.0 91.3 90.7 97.8 93.4 89.1 90.3 84.3 99.8 100.0 80.2 100.0 82.1 92.6Q.IV 96.0 98.3 93.4 99.0 95.0 94.3 91.9 84.0 98.9 100.0 81.0 100.0 84.5 93.9
2015/16Q.I 100.0 105.6 93.6 95.6 96.6 93.5 93.3 87.1 99.1 102.4 83.5 100.0 87.3 94.6Q.II 99.6 104.0 94.7 97.3 97.5 93.3 95.2 93.9 98.8 100.0 88.7 100.0 89.8 96.1QIII 98.8 100.5 96.9 102.7 98.9 95.0 98.7 93.9 99.1 100.0 92.0 100.0 91.7 97.2QIV 100.7 102.7 98.4 90.9 99.8 101.2 99.1 98.1 96.1 100.0 95.4 100.0 94.3 98.8
2016/17QI 101.9 104.9 98.5 85.5 99.0 102.5 99.8 94.7 98.8 100.0 96.1 100.0 96.7 99.9QII 100.8 101.8 99.7 95.9 100.0 101.2 99.8 99.1 99.6 100.0 100.2 100.0 98.5 99.4QIII 102.3 101.6 103.2 104.1 102.0 105.3 101.2 106.5 100.6 99.4 99.4 101.4 100.7 101.3QIV 105.6 108.8 101.4 93.4 104.0 99.7 108.5 112.8 102.8 99.0 109.5 105.1 101.3 101.6
2017/18QI 110.0 112.9 106.1 96.9 130.6 105.3 110.7 67.7 106.3 99.3 110.4 115.8 101.2 101.2QII 114.2 116.2 111.6 99.0 133.8 115.7 116.4 69.5 111.3 100.2 112.6 114.5 102.8 101.9QIII 116.4 116.6 116.2 106.6 143.8 117.3 122.8 70.6 115.1 102.5 115.5 119.1 108.0 105.8QIV 121.1 120.3 122.1 100.0 157.0 126.3 129.1 71.8 115.9 101.3 117.4 120.0 115.5 111.9
2018/19QI 125.1 123.7 126.9 103.4 164.8 130.4 135.8 75.0 119.4 102.6 119.2 130.2 122.6 114.9QII 125.8 124.5 127.6 106.6 164.8 128.9 137.2 75.3 126.0 102.8 120.9 132.6 125.2 115.9QIII 130.1 128.0 132.7 119.2 175.0 130.9 143.0 77.9 142.9 102.1 123.2 133.5 120.5 120.9QIV 138.4 143.1 132.5 117.1 171.8 127.6 147.6 81.4 146.0 103.6 123.7 137.1 124.0 130.1
2018/19QI 146.1 152.2 138.1 117.2 180.0 135.3 153.0 85.4 148.7 102.9 122.4 141.2 131.9 134.0QII 148.8 154.8 141.1 125.3 183.0 136.7 152.0 93.5 149.9 101.8 137.6 133.3 138.0 138.1QIII 154.6 160.7 146.7 127.6 178.9 149.4 153.0 95.6 159.0 100.7 134.0 136.4 142.4 144.6QIV 165.5 175.5 152.7 147.7 190.3 140.8 156.4 124.8 211.0 102.3 131.4 139.6 148.1 148.3
2020/21QI 173.8 187.6 156.2 145.1 190.6 144.4 159.0 121.8 244.2 101.3 137.4 147.8 151.6 152.5QII 175.2 189.3 157.0 149.8 201.0 144.1 158.2 141.8 190.4 100.6 151.6 144.5 159.5 159.0
Source: Central Statistical Agency
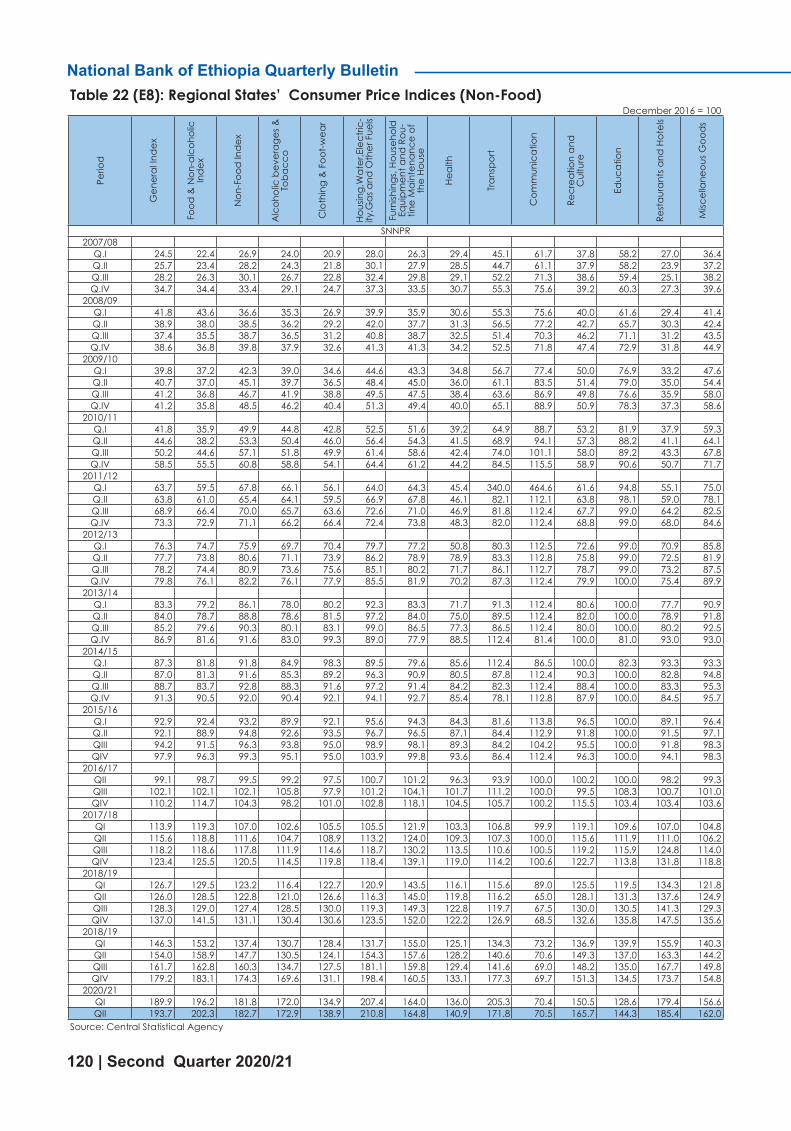
National Bank of Ethiopia Quarterly Bulletin
120 | Second Quarter 2020/21
Table 22 (E8): Regional States’ Consumer Price Indices (Non-Food)December 2016 = 100
Perio
d
Gen
eral
Ind
ex
Food
& N
on-a
lcoh
olic
In
dex
Non
-Foo
d In
dex
Alc
ohol
ic b
ever
ages
&
Toba
cco
Clo
thin
g &
Foo
t-wea
r
Hous
ing,
Wat
er,E
lect
ric-
ity,G
as a
nd O
ther
Fue
ls
Furn
ishin
gs, H
ouse
hold
Eq
uipm
ent a
nd R
ou-
tine
Mai
nten
ance
of
the
Hous
e
Heal
th
Tran
spor
t
Com
mun
icat
ion
Recr
eatio
n an
d
Cul
ture
Educ
atio
n
Rest
aura
nts a
nd H
otel
s
Misc
ella
neou
s Goo
ds
SNNPR2007/08
Q.I 24.5 22.4 26.9 24.0 20.9 28.0 26.3 29.4 45.1 61.7 37.8 58.2 27.0 36.4Q.II 25.7 23.4 28.2 24.3 21.8 30.1 27.9 28.5 44.7 61.1 37.9 58.2 23.9 37.2Q.III 28.2 26.3 30.1 26.7 22.8 32.4 29.8 29.1 52.2 71.3 38.6 59.4 25.1 38.2Q.IV 34.7 34.4 33.4 29.1 24.7 37.3 33.5 30.7 55.3 75.6 39.2 60.3 27.3 39.6
2008/09Q.I 41.8 43.6 36.6 35.3 26.9 39.9 35.9 30.6 55.3 75.6 40.0 61.6 29.4 41.4Q.II 38.9 38.0 38.5 36.2 29.2 42.0 37.7 31.3 56.5 77.2 42.7 65.7 30.3 42.4Q.III 37.4 35.5 38.7 36.5 31.2 40.8 38.7 32.5 51.4 70.3 46.2 71.1 31.2 43.5Q.IV 38.6 36.8 39.8 37.9 32.6 41.3 41.3 34.2 52.5 71.8 47.4 72.9 31.8 44.9
2009/10Q.I 39.8 37.2 42.3 39.0 34.6 44.6 43.3 34.8 56.7 77.4 50.0 76.9 33.2 47.6Q.II 40.7 37.0 45.1 39.7 36.5 48.4 45.0 36.0 61.1 83.5 51.4 79.0 35.0 54.4Q.III 41.2 36.8 46.7 41.9 38.8 49.5 47.5 38.4 63.6 86.9 49.8 76.6 35.9 58.0Q.IV 41.2 35.8 48.5 46.2 40.4 51.3 49.4 40.0 65.1 88.9 50.9 78.3 37.3 58.6
2010/11Q.I 41.8 35.9 49.9 44.8 42.8 52.5 51.6 39.2 64.9 88.7 53.2 81.9 37.9 59.3Q.II 44.6 38.2 53.3 50.4 46.0 56.4 54.3 41.5 68.9 94.1 57.3 88.2 41.1 64.1Q.III 50.2 44.6 57.1 51.8 49.9 61.4 58.6 42.4 74.0 101.1 58.0 89.2 43.3 67.8Q.IV 58.5 55.5 60.8 58.8 54.1 64.4 61.2 44.2 84.5 115.5 58.9 90.6 50.7 71.7
2011/12Q.I 63.7 59.5 67.8 66.1 56.1 64.0 64.3 45.4 340.0 464.6 61.6 94.8 55.1 75.0Q.II 63.8 61.0 65.4 64.1 59.5 66.9 67.8 46.1 82.1 112.1 63.8 98.1 59.0 78.1Q.III 68.9 66.4 70.0 65.7 63.6 72.6 71.0 46.9 81.8 112.4 67.7 99.0 64.2 82.5Q.IV 73.3 72.9 71.1 66.2 66.4 72.4 73.8 48.3 82.0 112.4 68.8 99.0 68.0 84.6
2012/13Q.I 76.3 74.7 75.9 69.7 70.4 79.7 77.2 50.8 80.3 112.5 72.6 99.0 70.9 85.8Q.II 77.7 73.8 80.6 71.1 73.9 86.2 78.9 78.9 83.3 112.8 75.8 99.0 72.5 81.9Q.III 78.2 74.4 80.9 73.6 75.6 85.1 80.2 71.7 86.1 112.7 78.7 99.0 73.2 87.5Q.IV 79.8 76.1 82.2 76.1 77.9 85.5 81.9 70.2 87.3 112.4 79.9 100.0 75.4 89.9
2013/14Q.I 83.3 79.2 86.1 78.0 80.2 92.3 83.3 71.7 91.3 112.4 80.6 100.0 77.7 90.9Q.II 84.0 78.7 88.8 78.6 81.5 97.2 84.0 75.0 89.5 112.4 82.0 100.0 78.9 91.8Q.III 85.2 79.6 90.3 80.1 83.1 99.0 86.5 77.3 86.5 112.4 80.0 100.0 80.2 92.5Q.IV 86.9 81.6 91.6 83.0 99.3 89.0 77.9 88.5 112.4 81.4 100.0 81.0 93.0 93.0
2014/15Q.I 87.3 81.8 91.8 84.9 98.3 89.5 79.6 85.6 112.4 86.5 100.0 82.3 93.3 93.3Q.II 87.0 81.3 91.6 85.3 89.2 96.3 90.9 80.5 87.8 112.4 90.3 100.0 82.8 94.8Q.III 88.7 83.7 92.8 88.3 91.6 97.2 91.4 84.2 82.3 112.4 88.4 100.0 83.3 95.3Q.IV 91.3 90.5 92.0 90.4 92.1 94.1 92.7 85.4 78.1 112.8 87.9 100.0 84.5 95.7
2015/16Q.I 92.9 92.4 93.2 89.9 92.1 95.6 94.3 84.3 81.6 113.8 96.5 100.0 89.1 96.4Q.II 92.1 88.9 94.8 92.6 93.5 96.7 96.5 87.1 84.4 112.9 91.8 100.0 91.5 97.1QIII 94.2 91.5 96.3 93.8 95.0 98.9 98.1 89.3 84.2 104.2 95.5 100.0 91.8 98.3QIV 97.9 96.3 99.3 95.1 95.0 103.9 99.8 93.6 86.4 112.4 96.3 100.0 94.1 98.3
2016/17QII 99.1 98.7 99.5 99.2 97.5 100.7 101.2 96.3 93.9 100.0 100.2 100.0 98.2 99.3QIII 102.1 102.1 102.1 105.8 97.9 101.2 104.1 101.7 111.2 100.0 99.5 108.3 100.7 101.0QIV 110.2 114.7 104.3 98.2 101.0 102.8 118.1 104.5 105.7 100.2 115.5 103.4 103.4 103.6
2017/18QI 113.9 119.3 107.0 102.6 105.5 105.5 121.9 103.3 106.8 99.9 119.1 109.6 107.0 104.8QII 115.6 118.8 111.6 104.7 108.9 113.2 124.0 109.3 107.3 100.0 115.6 111.9 111.0 106.2QIII 118.2 118.6 117.8 111.9 114.6 118.7 130.2 113.5 110.6 100.5 119.2 115.9 124.8 114.0QIV 123.4 125.5 120.5 114.5 119.8 118.4 139.1 119.0 114.2 100.6 122.7 113.8 131.8 118.8
2018/19QI 126.7 129.5 123.2 116.4 122.7 120.9 143.5 116.1 115.6 89.0 125.5 119.5 134.3 121.8QII 126.0 128.5 122.8 121.0 126.6 116.3 145.0 119.8 116.2 65.0 128.1 131.3 137.6 124.9QIII 128.3 129.0 127.4 128.5 130.0 119.3 149.3 122.8 119.7 67.5 130.0 130.5 141.3 129.3QIV 137.0 141.5 131.1 130.4 130.6 123.5 152.0 122.2 126.9 68.5 132.6 135.8 147.5 135.6
2018/19QI 146.3 153.2 137.4 130.7 128.4 131.7 155.0 125.1 134.3 73.2 136.9 139.9 155.9 140.3QII 154.0 158.9 147.7 130.5 124.1 154.3 157.6 128.2 140.6 70.6 149.3 137.0 163.3 144.2QIII 161.7 162.8 160.3 134.7 127.5 181.1 159.8 129.4 141.6 69.0 148.2 135.0 167.7 149.8QIV 179.2 183.1 174.3 169.6 131.1 198.4 160.5 133.1 177.3 69.7 151.3 134.5 173.7 154.8
2020/21QI 189.9 196.2 181.8 172.0 134.9 207.4 164.0 136.0 205.3 70.4 150.5 128.6 179.4 156.6QII 193.7 202.3 182.7 172.9 138.9 210.8 164.8 140.9 171.8 70.5 165.7 144.3 185.4 162.0
Source: Central Statistical Agency
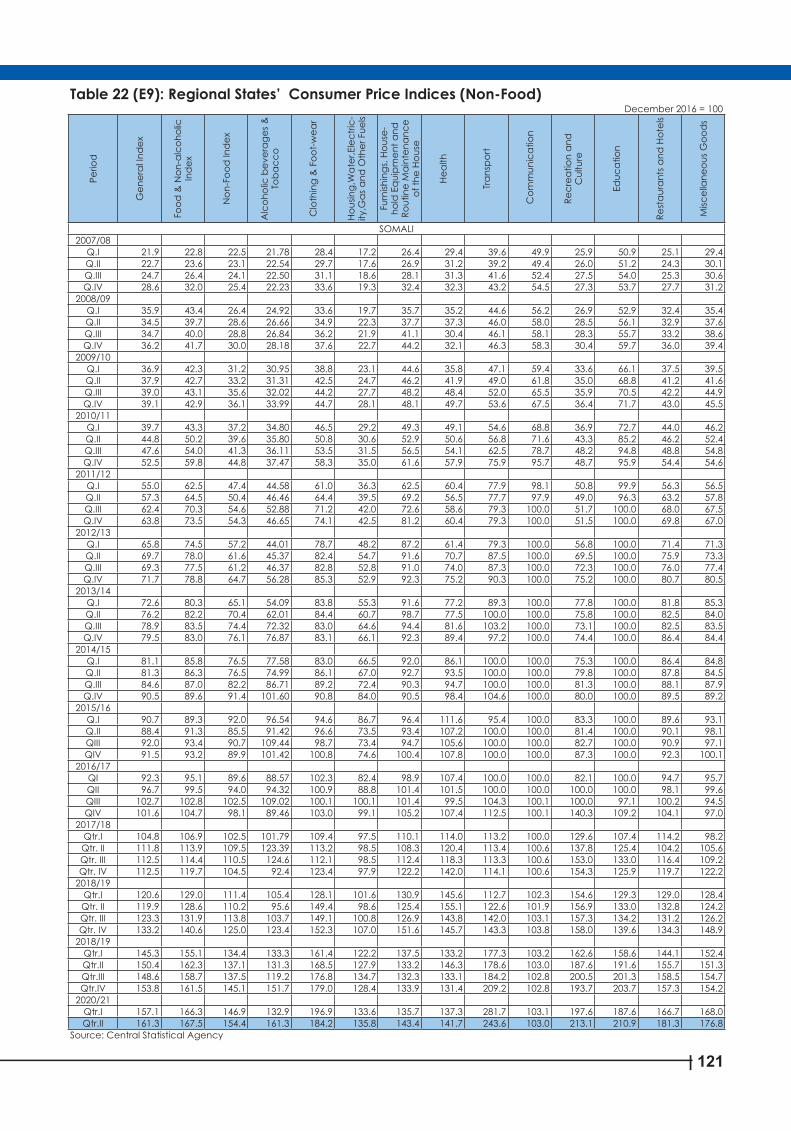
| 121
Table 22 (E9): Regional States’ Consumer Price Indices (Non-Food)December 2016 = 100
Perio
d
Gen
eral
Ind
ex
Food
& N
on-a
lcoh
olic
In
dex
Non
-Foo
d In
dex
Alc
ohol
ic b
ever
ages
&
Toba
cco
Clo
thin
g &
Foo
t-wea
r
Hous
ing,
Wat
er,E
lect
ric-
ity,G
as a
nd O
ther
Fue
ls
Furn
ishin
gs, H
ouse
-ho
ld E
quip
men
t and
Ro
utin
e M
aint
enan
ce
of th
e Ho
use
Heal
th
Tran
spor
t
Com
mun
icat
ion
Recr
eatio
n an
d
Cul
ture
Educ
atio
n
Rest
aura
nts a
nd H
otel
s
Misc
ella
neou
s Goo
ds
SOMALI2007/08
Q.I 21.9 22.8 22.5 21.78 28.4 17.2 26.4 29.4 39.6 49.9 25.9 50.9 25.1 29.4Q.II 22.7 23.6 23.1 22.54 29.7 17.6 26.9 31.2 39.2 49.4 26.0 51.2 24.3 30.1Q.III 24.7 26.4 24.1 22.50 31.1 18.6 28.1 31.3 41.6 52.4 27.5 54.0 25.3 30.6Q.IV 28.6 32.0 25.4 22.23 33.6 19.3 32.4 32.3 43.2 54.5 27.3 53.7 27.7 31.2
2008/09Q.I 35.9 43.4 26.4 24.92 33.6 19.7 35.7 35.2 44.6 56.2 26.9 52.9 32.4 35.4Q.II 34.5 39.7 28.6 26.66 34.9 22.3 37.7 37.3 46.0 58.0 28.5 56.1 32.9 37.6Q.III 34.7 40.0 28.8 26.84 36.2 21.9 41.1 30.4 46.1 58.1 28.3 55.7 33.2 38.6Q.IV 36.2 41.7 30.0 28.18 37.6 22.7 44.2 32.1 46.3 58.3 30.4 59.7 36.0 39.4
2009/10Q.I 36.9 42.3 31.2 30.95 38.8 23.1 44.6 35.8 47.1 59.4 33.6 66.1 37.5 39.5Q.II 37.9 42.7 33.2 31.31 42.5 24.7 46.2 41.9 49.0 61.8 35.0 68.8 41.2 41.6Q.III 39.0 43.1 35.6 32.02 44.2 27.7 48.2 48.4 52.0 65.5 35.9 70.5 42.2 44.9Q.IV 39.1 42.9 36.1 33.99 44.7 28.1 48.1 49.7 53.6 67.5 36.4 71.7 43.0 45.5
2010/11Q.I 39.7 43.3 37.2 34.80 46.5 29.2 49.3 49.1 54.6 68.8 36.9 72.7 44.0 46.2Q.II 44.8 50.2 39.6 35.80 50.8 30.6 52.9 50.6 56.8 71.6 43.3 85.2 46.2 52.4Q.III 47.6 54.0 41.3 36.11 53.5 31.5 56.5 54.1 62.5 78.7 48.2 94.8 48.8 54.8Q.IV 52.5 59.8 44.8 37.47 58.3 35.0 61.6 57.9 75.9 95.7 48.7 95.9 54.4 54.6
2011/12Q.I 55.0 62.5 47.4 44.58 61.0 36.3 62.5 60.4 77.9 98.1 50.8 99.9 56.3 56.5Q.II 57.3 64.5 50.4 46.46 64.4 39.5 69.2 56.5 77.7 97.9 49.0 96.3 63.2 57.8Q.III 62.4 70.3 54.6 52.88 71.2 42.0 72.6 58.6 79.3 100.0 51.7 100.0 68.0 67.5Q.IV 63.8 73.5 54.3 46.65 74.1 42.5 81.2 60.4 79.3 100.0 51.5 100.0 69.8 67.0
2012/13Q.I 65.8 74.5 57.2 44.01 78.7 48.2 87.2 61.4 79.3 100.0 56.8 100.0 71.4 71.3Q.II 69.7 78.0 61.6 45.37 82.4 54.7 91.6 70.7 87.5 100.0 69.5 100.0 75.9 73.3Q.III 69.3 77.5 61.2 46.37 82.8 52.8 91.0 74.0 87.3 100.0 72.3 100.0 76.0 77.4Q.IV 71.7 78.8 64.7 56.28 85.3 52.9 92.3 75.2 90.3 100.0 75.2 100.0 80.7 80.5
2013/14Q.I 72.6 80.3 65.1 54.09 83.8 55.3 91.6 77.2 89.3 100.0 77.8 100.0 81.8 85.3Q.II 76.2 82.2 70.4 62.01 84.4 60.7 98.7 77.5 100.0 100.0 75.8 100.0 82.5 84.0Q.III 78.9 83.5 74.4 72.32 83.0 64.6 94.4 81.6 103.2 100.0 73.1 100.0 82.5 83.5Q.IV 79.5 83.0 76.1 76.87 83.1 66.1 92.3 89.4 97.2 100.0 74.4 100.0 86.4 84.4
2014/15Q.I 81.1 85.8 76.5 77.58 83.0 66.5 92.0 86.1 100.0 100.0 75.3 100.0 86.4 84.8Q.II 81.3 86.3 76.5 74.99 86.1 67.0 92.7 93.5 100.0 100.0 79.8 100.0 87.8 84.5Q.III 84.6 87.0 82.2 86.71 89.2 72.4 90.3 94.7 100.0 100.0 81.3 100.0 88.1 87.9Q.IV 90.5 89.6 91.4 101.60 90.8 84.0 90.5 98.4 104.6 100.0 80.0 100.0 89.5 89.2
2015/16Q.I 90.7 89.3 92.0 96.54 94.6 86.7 96.4 111.6 95.4 100.0 83.3 100.0 89.6 93.1Q.II 88.4 91.3 85.5 91.42 96.6 73.5 93.4 107.2 100.0 100.0 81.4 100.0 90.1 98.1QIII 92.0 93.4 90.7 109.44 98.7 73.4 94.7 105.6 100.0 100.0 82.7 100.0 90.9 97.1QIV 91.5 93.2 89.9 101.42 100.8 74.6 100.4 107.8 100.0 100.0 87.3 100.0 92.3 100.1
2016/17QI 92.3 95.1 89.6 88.57 102.3 82.4 98.9 107.4 100.0 100.0 82.1 100.0 94.7 95.7QII 96.7 99.5 94.0 94.32 100.9 88.8 101.4 101.5 100.0 100.0 100.0 100.0 98.1 99.6QIII 102.7 102.8 102.5 109.02 100.1 100.1 101.4 99.5 104.3 100.1 100.0 97.1 100.2 94.5QIV 101.6 104.7 98.1 89.46 103.0 99.1 105.2 107.4 112.5 100.1 140.3 109.2 104.1 97.0
2017/18Qtr.I 104.8 106.9 102.5 101.79 109.4 97.5 110.1 114.0 113.2 100.0 129.6 107.4 114.2 98.2Qtr. II 111.8 113.9 109.5 123.39 113.2 98.5 108.3 120.4 113.4 100.6 137.8 125.4 104.2 105.6Qtr. III 112.5 114.4 110.5 124.6 112.1 98.5 112.4 118.3 113.3 100.6 153.0 133.0 116.4 109.2Qtr. IV 112.5 119.7 104.5 92.4 123.4 97.9 122.2 142.0 114.1 100.6 154.3 125.9 119.7 122.2
2018/19Qtr.I 120.6 129.0 111.4 105.4 128.1 101.6 130.9 145.6 112.7 102.3 154.6 129.3 129.0 128.4Qtr. II 119.9 128.6 110.2 95.6 149.4 98.6 125.4 155.1 122.6 101.9 156.9 133.0 132.8 124.2Qtr. III 123.3 131.9 113.8 103.7 149.1 100.8 126.9 143.8 142.0 103.1 157.3 134.2 131.2 126.2Qtr. IV 133.2 140.6 125.0 123.4 152.3 107.0 151.6 145.7 143.3 103.8 158.0 139.6 134.3 148.9
2018/19Qtr.I 145.3 155.1 134.4 133.3 161.4 122.2 137.5 133.2 177.3 103.2 162.6 158.6 144.1 152.4Qtr.II 150.4 162.3 137.1 131.3 168.5 127.9 133.2 146.3 178.6 103.0 187.6 191.6 155.7 151.3Qtr.III 148.6 158.7 137.5 119.2 176.8 134.7 132.3 133.1 184.2 102.8 200.5 201.3 158.5 154.7Qtr.IV 153.8 161.5 145.1 151.7 179.0 128.4 133.9 131.4 209.2 102.8 193.7 203.7 157.3 154.2
2020/21Qtr.I 157.1 166.3 146.9 132.9 196.9 133.6 135.7 137.3 281.7 103.1 197.6 187.6 166.7 168.0Qtr.II 161.3 167.5 154.4 161.3 184.2 135.8 143.4 141.7 243.6 103.0 213.1 210.9 181.3 176.8
Source: Central Statistical Agency

National Bank of Ethiopia Quarterly Bulletin
122 | Second Quarter 2020/21
Table 22 (E10): Regional States’ Consumer Price Indices (Non-Food)December 2016 = 100
Perio
d
Gen
eral
Ind
ex
Food
& N
on-a
lco-
holic
Ind
ex
Non
-Foo
d In
dex
Alc
ohol
ic b
ever
ages
&
Tob
acco
Clo
thin
g &
Foo
t-w
ear
Hous
ing,
Wat
er,E
lec-
trici
ty,G
as a
nd
Oth
er F
uels
Furn
ishin
gs, H
ouse
-ho
ld E
quip
men
t and
Ro
utin
e M
aint
e-na
nce
of th
e Ho
use
Heal
th
Tran
spor
t
Com
mun
icat
ion
Recr
eatio
n an
d
Cul
ture
Educ
atio
n
Rest
aura
nts a
nd
Hote
ls
Misc
ella
neou
s G
ood
s
TIGRAY2007/08
Q.I 25.7 30.5 21.7 24.2 17.6 19.2 21.3 44.4 51.1 50.5 24.7 45.5 24.4 32.5Q.II 27.1 32.7 22.4 23.4 17.9 20.4 22.6 42.8 49.8 49.3 25.3 46.7 26.6 31.9Q.III 28.7 35.3 22.8 25.4 18.1 20.4 23.9 42.5 54.4 53.8 25.3 46.7 27.8 33.2Q.IV 34.0 43.9 24.7 28.9 19.9 21.8 26.7 43.3 56.4 55.8 26.0 47.9 30.2 34.5
2008/09Q.I 42.9 58.9 27.1 35.8 22.3 24.0 28.4 43.1 56.5 55.8 26.8 49.3 34.0 36.4Q.II 41.8 55.5 28.5 35.0 24.3 25.2 29.6 43.0 58.7 58.0 27.3 50.4 34.9 37.3Q.III 39.0 50.0 28.6 35.5 25.5 24.7 29.7 44.2 51.0 50.4 26.8 49.5 35.8 38.4Q.IV 39.0 48.8 30.1 39.5 26.9 25.5 31.6 45.6 51.0 50.3 28.5 52.5 36.2 43.3
2009/10Q.I 40.3 49.3 32.3 44.5 29.2 26.8 33.5 46.4 59.9 59.1 30.7 56.5 39.4 47.6Q.II 41.0 49.6 33.6 44.8 30.9 27.5 35.4 48.6 65.9 65.1 29.5 54.3 40.6 49.3Q.III 40.8 48.4 34.5 47.7 32.0 27.7 37.9 52.1 69.2 68.4 30.7 56.6 41.6 49.8Q.IV 42.1 49.9 35.5 47.5 33.7 28.3 38.6 54.3 71.7 70.9 32.0 59.0 42.7 50.1
2010/11Q.I 42.2 49.9 35.8 49.1 35.3 27.4 38.9 52.9 71.2 70.4 34.1 62.8 43.2 51.1Q.II 42.9 48.9 38.3 50.1 38.9 28.4 40.7 56.2 77.0 76.1 37.8 69.6 45.0 58.1Q.III 44.7 50.5 40.6 50.0 41.9 29.9 43.0 56.9 84.6 83.6 38.4 70.9 46.5 60.1Q.IV 50.4 58.5 44.0 55.0 47.0 31.6 45.8 60.3 98.3 97.2 41.6 76.7 53.7 63.7
2011/12Q.I 54.7 64.6 46.5 65.1 49.9 33.0 48.8 58.4 98.6 97.4 43.0 79.2 59.2 67.7Q.II 57.5 67.0 49.8 69.5 55.0 34.1 53.3 63.2 94.8 93.7 45.7 84.3 62.2 74.5Q.III 60.2 69.8 52.8 70.8 59.3 34.9 57.4 69.0 95.9 94.7 47.3 84.0 69.3 79.0Q.IV 63.9 76.2 54.6 72.2 63.0 35.7 60.0 66.7 98.5 94.7 47.8 84.0 71.8 82.2
2012/13Q.I 68.1 81.0 58.4 73.8 66.1 40.0 63.1 70.6 99.2 94.7 50.6 84.0 78.8 83.3Q.II 68.6 78.9 60.8 75.6 69.3 41.9 63.3 70.2 99.1 94.7 64.3 84.0 85.3 83.9Q.III 68.6 77.9 61.5 81.2 72.2 41.9 62.3 68.5 99.1 94.7 64.2 84.0 86.0 86.3Q.IV 72.1 81.9 64.6 83.1 76.3 44.8 70.5 73.5 94.5 94.7 65.9 84.0 86.7 87.6
2013/14Q.I 76.0 89.7 65.6 86.0 78.5 44.9 70.8 71.3 90.7 94.7 67.8 84.0 90.8 90.8Q.II 75.4 86.9 66.6 87.0 80.7 45.2 72.2 74.0 101.4 94.7 66.6 84.0 90.1 90.8Q.III 74.6 82.0 69.0 86.7 82.5 48.9 76.2 78.0 100.5 94.7 67.4 84.0 91.5 89.9Q.IV 74.9 84.4 67.7 91.7 83.0 46.0 72.8 81.3 103.4 94.7 66.2 86.8 92.9 86.9
2014/15Q.I 76.5 85.9 69.3 95.9 84.9 50.7 72.5 80.2 104.7 94.7 66.2 89.1 82.1 91.2Q.II 79.9 86.5 74.9 98.0 86.8 58.9 74.3 86.5 105.8 94.7 68.1 90.3 91.7 94.2Q.III 78.3 83.8 74.1 99.6 88.8 55.1 76.8 94.5 104.7 94.7 69.2 91.8 92.6 94.3Q.IV 80.6 85.1 77.2 98.1 88.4 61.5 80.1 86.3 102.3 94.7 70.3 93.4 93.4 95.5
2015/16Q.I 83.6 92.0 77.2 93.8 92.5 60.5 78.6 84.9 102.3 97.5 71.5 94.5 94.2 97.8Q.II 86.9 96.4 78.0 98.8 93.3 60.9 79.4 89.0 101.9 98.9 74.2 95.9 95.0 96.3QIII 89.7 96.4 84.6 102.6 94.0 74.8 81.8 87.6 101.3 100.9 76.9 97.1 95.0 95.4QIV 94.8 98.9 91.7 99.1 95.6 90.4 81.3 100.3 101.4 100.1 76.0 98.5 94.9 98.1
2016/17QI 97.5 105.3 91.6 100.1 98.5 89.4 82.6 98.2 100.4 100.0 77.3 99.5 92.7 97.6QII 100.1 103.3 97.7 98.9 99.3 99.8 90.3 101.4 99.7 100.1 91.3 100.0 93.8 98.9QIII 100.2 101.1 99.4 103.4 97.7 102.7 97.2 101.6 102.0 100.0 95.8 100.0 93.5 101.1QIV 102.5 104.8 100.5 94.6 92.8 103.1 102.5 106.5 102.8 100.0 84.0 83.3 99.8 105.1
2017/18QI 110.9 111.5 110.3 103.7 100.6 119.1 101.0 107.8 106.1 100.0 83.3 61.6 115.6 104.3QII 110.6 115.0 106.9 108.0 101.7 103.8 104.3 106.6 108.9 100.0 82.2 87.6 119.7 107.4QIII 113.8 119.2 109.2 104.9 105.5 107.6 111.5 105.8 109.6 100.0 82.8 86.9 119.5 108.3QIV 120.6 126.2 115.8 111.7 114.7 113.7 117.3 111.8 113.2 100.0 87.1 120.9 126.8 116.7
2018/19QI 127.8 135.7 121.1 122.0 115.0 122.3 120.5 132.8 112.9 100.0 87.6 73.4 132.1 119.2QII 134.4 144.7 125.6 119.9 120.7 127.5 126.3 130.1 110.7 100.0 92.6 117.2 139.9 120.2QIII 137.4 145.5 130.5 122.3 127.8 131.3 128.1 137.5 115.3 100.0 96.2 132.1 149.4 123.7QIV 146.4 155.9 138.3 132.3 130.3 147.1 132.2 131.9 110.0 100.0 96.6 115.4 154.9 131.0
2019/20QI 157.7 171.6 145.9 143.5 138.1 152.9 137.7 132.1 106.6 100.0 103.5 103.6 172.5 136.8QII 164.1 175.1 154.8 145.6 150.5 165.6 145.3 155.2 120.3 100.0 117.1 133.0 172.9 145.4QIII 170.3 181.4 160.9 166.0 149.8 175.8 152.2 161.6 115.6 100.0 117.1 127.2 174.3 156.1QIV 186.3 205.5 170.2 194.2 156.7 182.7 156.0 169.4 137.0 100.0 121.5 119.9 189.7 158.5
2020/21QI 200.4 228.2 176.8 200.5 152.7 186.7 156.9 169.7 141.0 100.0 122.5 127.8 212.5 167.9QII 213.8 239.2 192.3 264.6 179.3 194.6 154.0 168.3 116.2 100.0 122.7 160.6 248.4 183.2
Source: Central Statistical Agency

| 123
Table 22 (F1): Regional States’ Consumer Price Index (Food)December 2016 = 100
Perio
d
Food
& N
on-a
lco-
holic
Bev
erag
es
Brea
d &
Cer
eals
Mea
t
Fish
& S
ea F
ood
Milk
, Che
ese
&
Egg
Oils
& F
ats
Fru
its
Veg
etab
les
Suga
r, ja
m,
hone
y, c
hoco
late
an
d c
onfe
ctio
n-er
y (N
D)
Food
pro
duc
ts
Non
-Alc
ohol
ic
Beve
rage
s
AFAR2007/08
Q.I 24.7 25.3 16.0 23.2 37.8 23.5 23.5 30.3 64.5 25.0Q.II 25.6 26.0 16.7 24.0 41.6 25.4 25.4 28.8 62.8 25.2Q.III 26.8 27.7 17.6 23.5 46.0 30.8 30.8 29.8 59.2 26.5Q.IV 32.4 38.6 19.6 28.7 52.4 31.5 31.5 33.9 67.4 29.1
2008/09Q.I 40.9 53.0 21.7 32.6 53.5 40.0 40.0 37.8 76.4 34.0Q.II 39.7 51.4 20.7 31.4 50.3 38.3 38.3 40.2 58.2 34.8Q.III 38.3 48.8 20.8 32.3 50.8 38.7 38.7 46.9 41.0 34.4Q.IV 39.7 50.3 25.7 31.6 49.6 46.1 46.2 52.7 29.6 39.9
2009/10Q.I 41.7 52.6 24.1 35.6 49.0 43.9 43.9 57.3 30.4 41.4Q.II 43.7 53.1 24.4 41.6 48.3 40.8 40.8 59.6 37.2 43.3Q.III 43.6 52.0 26.7 40.8 50.0 38.2 38.2 63.7 38.1 47.8Q.IV 43.9 50.9 28.1 40.8 54.4 44.1 44.2 65.4 53.6 47.5
2010/11Q.I 44.8 52.0 30.9 41.0 54.9 51.8 51.8 62.2 57.1 46.8Q.II 47.1 50.6 33.0 42.8 63.8 53.3 53.3 65.3 48.9 55.4Q.III 50.6 54.3 32.6 49.1 68.7 52.8 52.8 60.6 46.7 69.6Q.IV 54.4 62.6 36.3 44.8 70.5 57.3 57.3 63.5 76.2 74.5
2011/12Q.I 58.6 67.8 41.4 45.7 67.3 58.2 58.2 68.1 93.6 76.0Q.II 64.5 74.8 41.1 55.8 67.5 55.4 55.5 74.6 91.3 85.0Q.III 71.1 78.1 44.9 57.4 67.5 57.1 64.1 74.5 84.7 99.8Q.IV 75.6 81.4 56.7 61.4 68.6 56.9 76.6 80.0 95.2 93.5
2012/13Q.I 79.7 85.6 64.7 69.6 69.0 60.6 79.2 84.3 86.1 95.9Q.II 79.7 86.3 62.4 75.2 68.5 61.9 71.1 80.6 82.0 92.0Q.III 77.0 83.0 66.9 74.5 68.2 65.2 59.4 83.9 85.0 86.6Q.IV 78.4 85.2 75.9 74.8 71.1 72.4 66.1 85.4 72.9 83.7
2013/14Q.I 84.4 91.9 75.3 78.6 70.3 71.8 87.9 86.3 74.3 81.5Q.II 84.3 96.1 73.5 81.7 70.4 73.3 64.6 86.0 80.3 83.4Q.III 82.9 91.5 76.5 80.4 71.4 77.0 66.5 86.3 78.3 87.8Q.IV 85.8 90.5 79.7 81.2 75.7 78.1 76.0 84.4 96.6 97.4
2014/15Q.I 87.7 90.5 78.9 79.5 80.5 85.5 76.1 94.8 124.9 100.4Q.II 87.3 88.9 81.4 79.0 74.7 83.9 81.3 105.9 111.2 104.2Q.III 87.6 89.5 82.9 80.3 82.1 86.2 80.1 102.4 108.8 99.3Q.IV 94.0 88.0 83.6 87.2 92.1 88.6 87.6 95.9 185.9 98.8
2015/16Q.I 103.7 92.3 86.8 87.9 99.4 98.2 103.6 86.7 296.9 97.7Q.II 101.8 94.6 80.8 88.4 92.4 96.9 110.3 81.2 244.1 96.2Q.III 99.6 98.7 85.5 93.8 86.4 102.5 104.2 84.9 159.5 96.6Q.IV 101.6 95.6 96.3 101.0 88.9 100.9 118.8 86.3 142.8 96.3
2016/17QI 104.0 99.0 97.9 97.1 93.4 100.7 135.7 85.1 137.8 97.7QII 103.8 101.3 98.7 100.0 106.6 95.7 100.5 110.3 92.8 115.4 102.4QIII 102.3 100.4 99.6 102.6 102.5 103.3 101.6 105.5 100.8 112.0 103.0QIV 105.2 102.1 101.8 103.3 100.9 114.9 100.6 114.0 102.3 136.6 102.3
2017/18QI 109.8 111.3 103.7 109.6 101.4 115.8 102.8 120.5 102.9 137.9 104.6QII 115.8 119.6 118.4 116.3 103.4 107.1 105.8 126.4 115.2 139.3 112.7QIII 117.0 120.5 127.9 137.4 104.5 113.5 109.2 117.8 125.4 141.4 112.9QIV 116.2 121.3 139.0 157.3 105.5 98.1 113.8 116.3 97.3 141.0 116.5
2018/19QI 124.2 134.6 140.1 156.7 105.7 105.7 123.1 148.0 81.3 129.2 119.2QII 124.3 135.6 156.3 160.9 111.7 103.0 119.1 138.5 81.1 101.5 116.5QIII 126.1 138.6 163.2 163.4 114.0 101.6 116.4 137.8 92.0 92.5 112.5QIV 136.2 150.3 176.2 165.3 119.5 90.2 120.6 165.4 103.7 95.2 118.7
2019/20QI 151.7 167.5 192.0 171.2 121.3 164.1 128.5 188.5 117.4 101.4 123.6QII 159.8 179.7 197.0 183.7 129.1 168.3 128.4 199.1 113.3 100.3 127.6QIII 158.7 180.3 210.5 178.2 121.2 161.1 138.1 189.9 115.7 100.2 137.1QIV 174.6 200.4 209.9 188.5 127.9 172.6 140.5 214.7 144.4 140.6 146.7
2020/21QI 179.9 188.1 210.0 195.2 136.9 172.5 141.2 266.7 145.7 182.4 146.9QII 187.5 202.7 202.2 196.1 160.7 213.7 144.5 224.0 135.3 183.0 155.6
Source: Central Statistical Agency

National Bank of Ethiopia Quarterly Bulletin
124 | Second Quarter 2020/21
Table 22 (F2): Regional States’ Consumer Price Index (Food)December 2016 = 100
Perio
d
Food
&
Non
-alc
ohol
ic
Beve
rage
s
Brea
d a
nd
Cer
eals
Mea
t
Fish
and
Sea
fo
od
Milk
, Che
ese
& E
gg
Oils
& F
ats
Fru
its
Veg
etab
les
Suga
r, ja
m,
hone
y, c
hoc-
olat
e an
d
conf
ectio
nery
(N
D)
Food
pro
duc
ts
Non
-Alc
ohol
ic
Beve
rage
s
AMHARA2007/08
Q.I 28.7 30.4 20.9 20.6 29.9 17.4 28.6 36.6 36.6 23.4Q.II 30.5 32.7 22.2 21.4 33.2 20.0 32.8 35.2 37.0 27.6Q.III 31.7 34.7 23.5 21.6 36.5 21.7 35.6 38.7 34.2 30.4Q.IV 38.6 44.4 24.6 24.3 41.5 22.9 37.5 45.6 41.0 30.8
2008/09Q.I 50.7 62.3 26.2 29.8 41.4 26.9 44.2 57.1 46.3 30.6Q.II 48.2 61.5 27.3 30.4 40.2 25.0 41.0 63.4 36.6 31.7Q.III 43.1 56.9 28.0 31.7 38.9 28.8 47.3 74.1 23.5 31.4Q.IV 42.3 56.2 30.3 33.3 39.5 32.5 53.4 75.6 18.0 31.8
2009/10Q.I 43.8 57.6 29.9 34.8 39.1 31.1 51.1 76.2 20.1 34.3Q.II 42.9 56.3 30.9 36.1 36.8 29.2 47.9 77.9 22.4 42.2Q.III 42.2 53.4 32.7 36.7 37.5 31.4 51.6 78.5 24.7 45.0Q.IV 42.8 53.1 33.5 37.2 34.3 32.1 52.8 80.3 32.8 44.4
2010/11Q.I 43.6 52.5 33.9 37.8 42.8 35.5 58.2 79.3 37.3 45.3Q.II 44.8 51.5 34.5 41.2 51.3 40.2 66.0 80.6 35.9 50.9Q.III 47.0 53.2 32.4 42.1 55.7 42.8 70.2 78.0 36.9 67.4Q.IV 56.6 59.4 37.3 44.8 76.4 43.2 70.9 81.3 52.8 87.5
2011/12Q.I 63.0 65.1 45.2 47.3 78.8 42.4 69.5 80.5 61.9 90.2Q.II 66.7 70.6 49.9 50.1 72.9 44.0 72.2 81.6 62.6 95.6Q.III 68.6 74.9 54.8 53.1 71.8 49.7 80.5 82.0 50.4 99.1Q.IV 74.4 82.0 64.6 56.0 76.4 50.7 83.9 82.3 57.9 93.0
2012/13Q.I 79.1 87.7 70.1 57.5 76.1 53.3 87.0 81.8 66.4 87.7Q.II 78.5 88.4 70.6 66.5 74.3 63.0 81.8 81.7 67.8 84.5Q.III 78.1 87.2 72.0 70.1 74.0 64.6 80.3 81.6 68.3 81.3Q.IV 80.3 90.6 73.1 72.3 77.9 64.3 80.2 81.6 72.9 79.5
2013/14Q.I 83.6 96.6 75.2 73.0 77.6 67.3 83.8 81.5 75.0 79.6Q.II 83.0 98.4 75.0 74.5 77.2 70.9 79.0 81.5 74.1 80.7Q.III 81.5 88.3 76.4 74.9 77.0 70.7 86.0 82.1 73.4 80.5Q.IV 82.7 90.2 76.5 75.9 80.2 71.2 82.4 82.5 76.8 88.3
2014/15Q.I 83.8 93.9 77.9 78.6 84.6 74.7 80.9 81.8 74.6 95.7Q.II 84.0 92.2 77.4 79.0 86.2 71.1 84.2 82.0 73.5 99.3Q.III 84.7 88.9 79.8 82.1 93.4 76.7 88.5 82.5 73.1 99.6Q.IV 86.3 91.5 82.6 89.9 100.7 79.0 86.9 82.3 75.2 94.8
2015/16Q.I 91.5 96.3 84.7 88.7 107.6 84.6 99.5 82.3 77.6 92.5Q.II 92.7 99.0 85.7 88.9 104.3 89.1 101.6 82.2 77.9 89.6Q.III 93.0 99.6 87.4 94.0 98.0 92.5 100.7 95.8 79.2 88.2Q.IV 95.1 99.4 92.6 96.7 101.9 90.5 105.5 102.1 80.2 87.0
2016/17QI 101.3 104.5 98.7 100.3 100.6 99.0 111.2 98.9 91.2 92.0QII 102.3 102.3 99.6 100.6 98.9 98.5 102.6 97.0 105.6 99.5QIII 105.4 101.2 102.1 98.9 103.3 104.5 100.3 104.8 102.7 114.6 100.2QIV 110.1 108.2 108.9 100.4 112.1 103.0 107.6 102.0 102.6 125.6 98.8
2017/18QI 118.2 128.1 116.5 101.1 118.5 103.0 128.7 104.0 102.8 128.8 101.7QII 119.9 125.0 116.0 104.2 127.8 103.8 128.4 113.5 101.9 129.6 105.5QIII 122.0 133.3 132.0 72.2 128.4 106.1 134.9 103.2 102.7 130.1 106.0QIV 127.7 143.0 140.4 0.0 136.5 107.7 139.7 109.9 103.4 131.3 107.2
2018/19QI 133.9 150.4 145.6 0.0 139.5 107.9 135.1 129.0 103.3 128.4 109.2QII 132.9 149.6 144.4 0.0 143.8 143.8 107.0 135.7 121.2 103.9 132.6QIII 136.6 153.6 148.7 0.0 143.6 107.8 142.8 128.4 103.7 135.1 108.4QIV 149.3 169.1 170.1 0.0 152.7 111.3 155.2 144.0 115.3 144.6 108.8
2019/20 QI 161.4 190.2 178.9 0.0 164.5 115.1 179.7 159.9 120.5 149.0 110.4QII 161.0 199.0 179.9 0.0 166.1 115.2 187.3 142.1 120.8 151.5 110.3QIII 174.2 199.3 184.9 0.0 170.9 123.7 191.0 151.4 120.3 191.3 119.6QIV 187.5 213.7 194.7 0.0 181.3 136.8 188.7 158.9 121.2 210.7 133.3
2020/21QI 200.0 238.1 194.3 0.0 187.6 142.7 188.0 181.9 119.5 208.1 143.3QII 197.9 245.6 202.5 0.0 192.4 150.7 197.8 159.9 139.0 200.8 150.2
Source: Central Statistical Agency

| 125
Table 22 (F3): Regional States’ Consumer Price Index (Food)December 2016= 100
Perio
d
Food
&
Non
-alc
ohol
ic
Beve
rage
s
Brea
d a
nd
Cer
eals
Mea
t
Fish
and
sea
food
Milk
, Che
ese
& E
gg
Oils
& F
ats
Fru
its
Veg
etab
les
Suga
r, ja
m,
hone
y, c
hoc-
olat
e an
d
conf
ectio
nery
(N
D)
Food
pro
duc
ts
Non
-Alc
ohol
ic
Beve
rage
s
BENISHANGUL GUMUZ2007/08
Q.I 27.1 34.4 27.4 22.3 29.3 16.5 29.6 38.9 31.3 25.6Q.II 29.9 37.5 26.8 22.6 31.2 16.6 29.7 37.6 39.0 26.0Q.III 33.8 44.1 27.7 23.2 34.8 18.7 33.4 42.6 40.0 27.0Q.IV 39.1 53.4 31.3 25.0 38.8 19.2 34.3 44.6 39.7 28.3
2008/09Q.I 57.2 82.9 37.1 31.7 40.1 24.3 43.5 56.1 47.7 29.5Q.II 51.0 78.6 38.1 33.6 41.9 26.0 46.5 61.2 36.6 28.2Q.III 44.4 70.2 36.9 35.0 40.1 26.1 46.8 69.4 29.4 26.3Q.IV 45.4 71.4 36.6 35.9 44.6 25.4 45.4 72.4 22.6 27.8
2009/10Q.I 49.5 75.8 38.9 39.1 41.8 25.6 45.9 73.0 21.2 33.4Q.II 45.1 68.1 35.2 40.7 40.5 24.6 44.0 75.3 23.0 43.6Q.III 40.8 59.7 34.4 44.8 42.9 24.2 43.3 79.7 29.1 41.3Q.IV 39.5 53.6 37.7 43.3 45.7 25.8 46.2 81.7 39.0 41.0
2010/11Q.I 38.1 51.4 37.9 45.4 43.5 28.7 51.3 79.2 33.2 47.8Q.II 39.2 49.7 42.0 47.4 45.8 28.2 50.6 83.1 35.2 57.8Q.III 44.0 55.4 37.3 48.8 68.8 32.9 58.9 76.0 35.8 71.7Q.IV 60.5 72.3 42.3 51.7 86.9 37.5 67.2 86.8 51.6 100.7
2011/12Q.I 70.9 88.7 50.4 55.6 76.5 35.6 63.8 85.2 55.1 106.9Q.II 76.5 96.0 53.7 61.8 87.3 38.2 68.5 88.5 69.4 106.3Q.III 76.1 92.1 56.1 65.1 90.5 54.1 79.5 90.4 53.0 85.1Q.IV 81.1 98.9 65.2 68.0 90.1 70.7 80.6 95.7 61.8 80.6
2012/13Q.I 84.6 102.1 72.4 69.4 93.7 70.9 86.4 98.9 61.2 80.7Q.II 83.4 103.3 73.0 75.0 98.0 75.0 77.4 99.0 62.4 80.1Q.III 79.9 95.5 76.7 88.5 103.2 74.5 68.9 97.3 62.0 77.9Q.IV 79.6 96.7 73.6 93.8 96.9 70.8 69.5 94.9 61.9 77.1
2013/14Q.I 87.2 118.1 75.6 95.8 95.7 63.0 76.8 94.7 58.8 76.1Q.II 92.7 134.5 77.7 92.7 96.4 73.8 73.8 94.6 62.1 81.2Q.III 85.0 107.3 75.1 91.7 99.3 83.2 75.7 92.1 61.3 85.5Q.IV 85.4 103.0 77.4 96.1 97.3 68.8 77.9 95.8 63.9 94.8
2014/15Q.I 83.9 101.2 77.7 84.0 94.8 57.9 76.3 90.3 62.1 97.3Q.II 84.9 95.5 76.3 88.1 98.8 67.8 82.2 89.0 66.6 102.0Q.III 88.1 97.9 79.9 88.8 99.0 71.7 92.1 92.2 70.1 86.5Q.IV 90.6 92.3 85.5 91.9 104.6 70.5 94.0 89.9 85.4 84.0
2015/16Q.I 99.9 99.3 92.1 92.0 100.4 70.8 104.3 92.3 109.5 84.0Q.II 99.9 99.2 94.0 83.5 97.1 89.0 106.2 94.6 107.8 80.1Q.III 94.6 92.7 96.2 84.7 99.3 87.3 99.8 101.3 94.5 80.3Q.IV 95.9 87.6 99.2 99.6 102.3 83.6 104.8 108.3 98.9 80.1
2016/17QI 100.1 94.1 102.9 102.7 100.3 95.1 113.5 105.5 93.9 89.3QII 100.4 100.7 100.2 100.0 102.6 100.5 94.6 99.4 101.0 101.6 100.2QIII 103.0 100.7 100.8 98.9 103.8 102.3 103.2 107.4 96.1 109.2 97.3QIV 109.5 110.9 106.9 100.4 108.3 101.7 106.6 114.7 93.9 117.9 97.0
2017/18QI 117.8 142.8 119.5 106.7 107.4 106.6 90.1 117.7 109.2 87.4 92.1QII 121.5 148.1 118.9 120.8 106.1 106.9 101.7 116.7 110.6 112.8 95.9QIII 119.9 132.8 122.4 120.8 107.1 109.4 82.6 115.3 111.6 153.6 95.5QIV 121.2 139.7 132.8 120.8 108.8 111.8 115.9 105.5 109.5 148.9 98.8
2018/19QI 129.2 145.6 144.0 119.3 111.7 106.4 109.2 128.3 109.9 132.3 106.8QII 130.2 148.6 144.2 120.8 114.3 110.1 118.9 129.0 111.4 135.2 100.7QIII 132.8 150.3 148.0 120.8 115.4 117.4 168.2 126.9 109.4 154.2 99.3QIV 142.9 152.8 161.0 129.3 117.8 119.6 166.1 156.3 120.6 156.9 100.2
2019/20QI 164.5 186.6 179.5 138.0 120.3 124.8 126.0 194.2 125.8 160.1 101.3QII 166.7 201.4 179.2 135.0 123.1 122.9 129.7 183.9 126.2 161.4 104.1QIII 173.0 204.4 182.3 135.0 123.6 129.3 132.6 183.3 126.5 207.0 115.3QIV 190.9 216.0 187.0 149.5 127.3 144.7 161.1 208.5 123.0 271.6 127.6
2020/21QI 222.6 251.8 204.9 152.3 130.8 150.9 143.8 259.4 128.9 347.7 135.7QII 220.5 261.9 220.9 143.8 122.0 167.3 143.0 220.1 150.5 335.3 153.8
Source: Central Statistical Agency

National Bank of Ethiopia Quarterly Bulletin
126 | Second Quarter 2020/21
Table 22 (F4): Regional States’ Consumer Price Index (Food)December 2016 = 100
Perio
d
Food
&
Non
-alc
ohol
ic
Beve
rage
s
Brea
d a
nd
Cer
eals
Mea
t
Fish
and
sea
food
Milk
, Che
ese
& E
gg
Oils
& F
ats
Fru
its
Veg
etab
les
Suga
r, ja
m,
hone
y, c
hoc-
olat
e an
d
conf
ectio
nery
(N
D)
Food
pro
duc
ts
Non
-Alc
ohol
ic
Beve
rage
s
DIRE DAWA2007/08
Q.I 28.0 30.3 20.1 17.5 41.3 23.2 20.6 53.0 47.8 23.9Q.II 28.7 30.9 20.5 18.2 48.1 24.4 21.6 53.3 44.1 24.9Q.III 32.3 36.7 21.0 19.8 55.1 37.0 32.8 58.7 44.8 25.9Q.IV 38.5 47.2 23.6 25.0 61.9 42.6 37.8 64.2 55.4 26.9
2008/09Q.I 47.2 62.7 25.5 27.5 65.5 42.0 37.3 67.1 58.6 28.6Q.II 47.4 66.3 25.5 29.9 61.5 38.7 34.3 67.8 46.1 31.0Q.III 46.6 64.4 25.5 30.6 61.5 45.7 40.6 68.9 34.5 32.1Q.IV 46.7 64.2 26.3 32.9 61.2 44.9 39.9 70.0 23.1 31.1
2009/10Q.I 47.5 64.6 28.1 34.3 60.0 46.1 40.9 70.0 24.9 32.4Q.II 46.6 62.8 26.2 36.7 59.3 35.0 31.0 70.2 26.8 36.5Q.III 47.5 62.2 27.5 36.7 61.1 41.2 36.6 70.4 28.7 38.6Q.IV 48.3 60.9 31.0 33.0 63.4 48.0 42.6 70.4 42.9 38.5
2010/11Q.I 48.3 60.5 31.9 33.7 65.5 55.8 49.5 70.4 43.7 34.3Q.II 50.9 61.4 32.3 36.8 77.8 62.5 55.5 71.3 38.2 35.0Q.III 53.5 62.8 28.1 40.4 84.7 67.2 59.7 71.2 36.8 43.8Q.IV 62.4 70.0 31.6 44.0 103.0 66.7 59.2 73.1 62.3 56.6
2011/12Q.I 68.0 74.2 41.1 48.3 103.0 65.9 58.5 72.5 75.9 63.7Q.II 69.6 77.3 44.6 47.8 95.3 61.9 54.9 74.7 68.5 67.8Q.III 71.4 76.8 45.3 55.6 96.0 63.1 62.0 74.9 55.2 73.9Q.IV 75.3 80.1 57.0 59.5 88.2 63.4 70.0 75.5 58.6 83.7
2012/13Q.I 77.8 83.6 66.4 64.9 82.9 69.0 69.6 76.4 63.8 89.8Q.II 77.7 85.1 65.7 65.2 84.8 75.5 63.6 75.6 64.6 92.8Q.III 76.0 84.2 67.0 65.5 88.9 79.0 54.8 75.3 66.4 92.3Q.IV 78.3 84.3 66.8 60.8 89.0 82.6 66.1 77.0 72.2 90.9
2013/14Q.I 84.6 89.6 67.3 65.8 85.3 80.1 82.2 77.8 75.6 95.3Q.II 84.4 94.4 66.6 63.9 88.3 78.4 68.1 79.6 75.7 98.3Q.III 81.4 89.8 66.3 65.4 84.0 82.2 66.0 79.5 75.8 94.6Q.IV 81.6 89.0 68.4 68.7 85.3 83.1 66.7 79.7 76.8 94.5
2014/15Q.I 88.0 93.5 67.6 74.9 113.0 79.3 76.7 79.7 75.2 97.0Q.II 89.7 95.3 72.8 75.2 113.1 86.7 78.3 84.6 75.8 96.7Q.III 89.7 94.1 77.5 75.7 113.2 93.6 81.7 80.0 77.0 92.5Q.IV 90.7 94.7 82.6 87.0 90.1 91.3 88.9 80.0 76.3 91.7
2015/16Q.I 90.4 95.1 89.0 91.9 89.9 94.9 83.7 80.9 76.9 90.4Q.II 91.2 94.5 88.9 85.1 89.9 97.8 91.2 84.6 77.0 89.5Q.III 92.4 98.1 91.6 89.7 89.9 103.3 84.9 89.4 78.1 88.6Q.IV 97.7 98.0 95.5 96.2 90.1 105.0 103.9 100.0 79.0 99.0
2016/17QI 100.8 102.1 100.2 100.3 96.6 107.3 104.4 100.0 79.7 101.3QII 101.5 100.4 101.5 100.0 100.7 100.0 99.8 106.2 99.9 99.7 99.7QIII 101.5 99.8 101.4 101.2 101.9 100.1 106.8 103.9 105.3 103.4 101.6QIV 103.3 101.9 101.9 104.6 102.6 100.3 108.7 106.8 107.7 103.7 102.9
2017/18QI 105.8 105.4 106.3 101.0 111.7 102.5 124.6 103.6 109.2 111.0 109.7QII 111.5 111.4 110.3 125.9 112.1 103.1 128.7 113.4 110.8 114.0 114.0QIII 112.3 112.6 113.1 134.3 115.0 105.2 143.1 113.6 109.1 105.3 115.3QIV 124.2 122.4 129.5 130.8 122.6 108.1 133.8 124.1 94.4 187.4 117.2
2018/19QI 133.8 130.5 135.7 133.3 131.4 109.6 129.5 139.4 95.0 220.2 118.7QII 129.1 136.0 138.2 131.8 131.0 109.0 140.7 117.4 95.0 188.5 109.4QIII 133.8 141.6 140.1 134.6 131.5 110.7 158.2 122.5 95.0 192.9 119.5QIV 150.3 150.5 162.8 150.0 142.4 113.8 162.9 162.9 110.0 198.6 116.4
2019/20QI 162.6 166.7 177.7 155.1 155.9 112.0 157.5 176.1 108.9 215.4 120.6QII 169.9 175.6 178.9 148.1 162.2 115.5 176.9 184.3 110.0 220.9 133.6QIII 167.3 177.1 190.2 154.8 155.7 114.7 192.8 162.5 109.7 236.2 139.4QIV 173.0 179.9 190.2 159.0 155.4 121.4 191.7 173.2 110.8 261.0 145.2
2020/21QI 216.5 202.8 208.1 159.5 168.3 133.6 177.9 267.6 120.0 433.4 152.0QII 204.1 210.4 210.1 160.0 171.3 150.7 190.9 205.5 126.1 367.7 153.7
Source: Central Statistical Agency

| 127
Table 22 (F5): Regional States’ Consumer Price Index (Food)December 2016 = 100
Perio
d
Food
&
Non
-alc
ohol
ic
Beve
rage
s
Brea
d a
nd
Cer
eals
Mea
t
Fish
and
Sea
fo
od
Milk
, Che
ese
& E
gg
Oils
& F
ats
Fru
its
Veg
etab
les
Suga
r, ja
m,
hone
y, c
hoc-
olat
e an
d
conf
ectio
nery
(N
D)
Food
pro
duc
ts
Non
-Alc
ohol
ic
Beve
rage
s
GAMBELLA2007/08
Q.I 23.8 28.0 24.2 14.3 142.0 19.7 16.9 24.7 51.7 27.4Q.II 25.1 29.1 24.0 14.4 151.7 21.0 18.0 25.3 60.3 31.5Q.III 26.3 29.6 24.3 14.4 162.5 27.8 23.9 29.2 60.3 32.6Q.IV 31.4 47.6 26.2 13.9 175.2 29.1 25.0 32.8 60.6 33.6
2008/09Q.I 52.7 79.5 26.8 16.6 178.2 37.4 32.2 39.0 61.4 33.8Q.II 46.2 71.8 29.2 23.7 176.3 40.4 34.7 40.7 55.3 32.8Q.III 39.5 63.8 29.8 23.4 178.1 37.8 32.5 42.3 31.0 29.1Q.IV 42.1 67.1 29.1 23.5 173.9 38.6 33.2 43.1 29.8 28.2
2009/10Q.I 45.4 71.3 30.7 24.8 167.7 38.3 32.9 45.4 24.0 35.2Q.II 40.6 65.1 31.1 25.9 173.7 40.3 34.6 46.8 24.7 42.0Q.III 39.2 62.8 31.3 28.1 174.8 39.5 33.9 47.4 27.5 37.7Q.IV 38.4 60.4 35.3 29.4 182.5 41.5 35.6 49.2 40.2 38.6
2010/11Q.I 39.4 57.9 35.5 31.7 184.8 43.0 37.0 47.9 49.9 48.0Q.II 41.6 57.7 35.9 30.5 206.0 49.0 42.1 50.0 51.6 66.5Q.III 43.4 59.5 35.3 31.5 231.1 48.0 41.3 50.1 51.8 83.6Q.IV 52.9 69.2 35.7 32.4 280.0 51.0 43.8 54.6 71.0 99.9
2011/2012Q.I 60.7 78.4 40.0 35.0 295.6 54.3 46.6 61.3 75.9 103.7Q.II 66.3 83.4 49.6 38.5 319.9 65.0 55.8 59.4 78.4 111.9Q.III 71.3 88.5 57.4 45.5 107.9 68.6 68.1 62.3 61.7 96.5Q.IV 76.9 95.2 62.6 48.4 111.8 73.8 79.6 65.8 64.3 89.7
2012/13Q.I 78.8 99.9 64.6 48.4 109.4 82.9 78.4 65.5 73.1 81.8Q.II 75.0 83.3 69.0 47.9 109.8 86.1 75.0 65.3 79.2 79.6Q.III 74.1 77.3 72.8 50.4 109.4 90.7 71.2 64.9 81.1 80.0Q.IV 78.1 87.1 73.9 56.9 109.1 97.9 72.8 65.0 81.5 79.0
2013/14Q.I 81.4 98.2 74.7 58.5 108.9 71.0 75.1 66.3 81.6 76.8Q.II 82.3 99.7 74.9 60.0 109.0 52.1 77.1 67.2 82.2 79.8Q.III 81.7 89.6 78.8 60.3 109.5 75.0 81.8 67.9 82.9 78.0Q.IV 85.9 95.6 80.8 60.3 111.0 96.4 82.6 69.8 82.0 103.7
2014/15Q.I 86.6 104.2 78.9 59.0 109.6 86.9 77.7 66.8 85.4 102.1Q.II 84.0 88.8 80.4 58.8 106.7 93.8 80.5 70.0 85.9 114.7Q.III 87.1 85.7 81.9 74.3 100.8 90.7 98.3 71.7 84.7 105.3Q.IV 88.8 92.3 87.9 74.2 103.0 89.1 92.7 73.0 84.2 87.3
2015/16Q.I 96.8 99.9 96.5 79.6 105.2 98.5 106.2 75.0 89.4 91.5Q.II 93.2 90.5 94.5 82.4 106.1 99.2 105.8 74.2 84.7 85.4QIII 93.1 95.8 93.7 84.2 105.1 99.6 99.1 78.0 86.2 74.4QIV 98.0 102.6 95.5 86.7 109.3 99.7 107.3 91.6 90.9 78.2
2016/17QI 101.1 104.6 97.1 92.2 104.3 99.6 110.4 101.7 99.2 88.8QII 99.5 99.9 100.8 100.0 91.8 98.0 100.0 100.7 98.3 99.0 100.6QIII 102.2 99.5 103.4 100.0 90.2 97.5 128.9 107.8 91.8 129.2 100.2QIV 106.5 113.6 105.9 100.0 89.8 106.0 65.1 104.0 92.2 140.1 98.5
2017/18QI 111.7 134.7 107.9 100.0 93.1 102.1 71.1 96.7 92.7 131.4 98.7QII 109.3 118.1 114.2 102.3 93.9 106.5 82.9 101.1 109.0 133.8 103.5QIII 110.1 119.6 118.1 96.4 96.5 113.5 94.2 99.0 97.6 137.6 103.4QIV 120.6 138.5 131.7 106.9 104.8 118.3 108.7 103.0 96.7 138.9 110.1
2018/19QI 127.8 148.3 137.7 109.4 120.8 119.1 121.8 107.1 95.8 135.5 122.5QII 125.0 130.8 152.1 111.8 111.8 125.9 119.6 78.8 111.2 95.8 147.8QIII 129.1 135.1 162.3 111.3 140.5 124.2 109.8 113.6 97.4 141.2 117.8QIV 137.3 151.6 161.6 108.0 138.9 126.9 157.7 125.5 98.3 147.4 114.6
2019/20QI 149.2 175.0 170.2 104.6 138.6 132.8 170.5 140.6 109.4 152.3 110.5QII 147.6 164.7 174.6 108.5 144.7 127.7 177.0 140.1 112.9 163.4 113.9QIII 159.3 183.6 193.0 116.6 163.3 124.0 168.5 146.8 112.4 183.6 109.3QIV 181.3 205.5 206.9 135.7 204.7 158.0 144.6 167.5 117.0 222.9 114.7
2020/21QI 192.1 223.9 210.0 140.4 216.0 155.9 122.2 177.5 119.2 229.5 127.7QII 190.6 216.1 208.0 140.4 210.4 172.2 127.6 169.6 134.4 237.1 145.1
Source: Central Statistical Agency

National Bank of Ethiopia Quarterly Bulletin
128 | Second Quarter 2020/21
Table 22 (F6): Regional States’ Consumer Price Index (Food)December 2016 = 100
Perio
d
Food
&
Non
-alc
ohol
ic
Beve
rage
s
Brea
d a
nd
Cer
eals
Mea
t
Fish
& se
a fo
od
Milk
, Che
ese
& E
gg
Oils
& F
ats
Fru
its
Veg
etab
les
Suga
r, ja
m,
hone
y, c
hoc-
olat
e an
d
conf
ectio
nery
(N
D)
Food
pro
duc
ts
Non
-Alc
ohol
ic
Beve
rage
s
HARARI2007/08
Q.I 19.2 26.3 16.9 21.6 53.1 34.4 24.6 62.4 52.9 10.7Q.II 19.7 27.1 16.5 21.5 58.2 35.5 25.4 63.1 49.7 11.2Q.III 21.5 30.5 17.1 22.0 67.0 52.2 37.4 66.3 54.2 11.9Q.IV 28.4 42.8 19.6 26.8 76.5 44.5 31.8 72.2 62.7 21.6
2008/09Q.I 35.7 60.9 22.4 33.0 81.2 52.3 37.4 75.8 69.8 23.5Q.II 35.2 61.1 22.4 30.2 75.6 47.5 34.0 78.2 56.8 23.9Q.III 34.1 58.3 21.3 25.3 75.6 49.2 35.2 79.5 43.1 25.0Q.IV 34.7 56.9 21.9 29.3 71.6 48.0 34.4 79.9 30.6 27.8
2009/10Q.I 35.0 56.6 22.9 30.3 69.3 44.8 32.0 80.4 28.8 28.3Q.II 35.1 54.4 23.0 30.3 70.6 43.6 31.2 79.5 28.7 31.2Q.III 36.4 53.6 23.5 29.9 75.1 46.5 33.3 79.9 33.3 35.9Q.IV 36.8 51.8 24.3 30.5 78.8 50.9 36.4 80.4 41.3 36.7
2010/11Q.I 38.2 52.0 26.8 33.2 80.0 62.5 44.7 80.1 41.7 37.2Q.II 40.8 51.9 28.6 34.2 92.7 70.0 50.1 80.8 38.8 42.4Q.III 44.8 52.1 25.4 36.4 107.1 78.4 56.1 81.7 42.3 56.3Q.IV 48.8 60.1 33.3 44.9 135.3 72.4 51.8 83.6 63.0 56.2
2011/12Q.I 52.4 62.4 39.0 49.6 102.0 69.8 50.0 83.8 78.3 61.1Q.II 54.8 66.4 40.1 49.7 104.0 64.3 46.0 84.1 79.5 66.4Q.III 61.2 67.5 40.7 49.6 104.7 69.7 51.3 84.6 58.9 85.8Q.IV 67.9 71.3 52.3 50.9 135.2 67.8 60.4 85.3 67.6 89.4
2012/13Q.I 70.1 76.5 57.6 52.3 103.5 73.9 58.7 85.7 71.7 97.1Q.II 71.1 78.5 58.8 56.0 102.4 68.4 57.1 85.3 65.8 97.7Q.III 69.1 76.8 58.4 58.2 97.5 73.4 49.2 84.7 67.5 91.7Q.IV 73.2 78.4 67.2 59.0 97.6 74.1 63.5 85.7 67.0 84.8
2013/14Q.I 78.7 83.3 71.8 63.5 98.2 76.0 76.5 85.6 67.7 93.3Q.II 78.4 88.3 68.5 59.2 98.3 67.5 65.7 84.9 66.6 88.1Q.III 76.9 84.4 69.1 63.5 98.1 75.6 64.0 84.8 68.5 85.2Q.IV 79.2 85.0 73.1 66.4 98.5 87.4 71.6 85.1 66.8 84.7
2014/15Q.I 84.8 91.7 79.0 71.0 99.6 82.3 79.3 84.7 65.0 87.9Q.II 85.8 94.5 76.4 67.7 99.7 80.4 81.9 85.5 67.9 85.2Q.III 86.2 93.9 76.4 70.4 100.2 111.7 82.6 85.1 77.6 77.5Q.IV 90.0 96.8 83.5 72.1 101.3 107.2 85.6 84.2 97.0 74.7
2015/16Q.I 90.6 95.9 83.9 76.4 100.4 89.1 83.1 83.4 123.8 72.1Q.II 92.1 95.1 84.7 80.1 102.1 83.0 91.2 84.5 128.3 73.4QIII 92.7 95.5 84.1 81.2 102.1 94.9 93.3 98.3 122.4 70.8QIV 97.3 93.0 94.4 87.8 100.1 110.4 110.2 105.7 136.2 83.7
2016/17QI 102.3 99.1 101.3 92.6 100.1 98.1 120.1 106.4 113.7 87.9QII 100.7 99.6 99.3 98.6 100.1 96.2 108.2 104.5 96.5 100.3QIII 100.0 95.3 102.9 0.0 99.5 101.7 103.3 107.7 102.8 102.1 102.4QIV 107.5 106.3 108.5 0.0 102.2 125.2 121.2 108.3 109.7 106.2 97.2
2017/18QI 110.8 112.9 105.2 0.0 108.4 135.9 143.1 101.6 114.7 110.2 99.5QII 110.6 116.6 103.5 0.0 107.2 110.4 152.7 103.5 110.1 110.0 97.4QIII 110.1 114.3 101.9 0.0 112.2 109.7 150.4 105.3 106.6 114.9 96.0QIV 116.0 122.3 114.9 0.0 117.5 110.6 138.8 103.7 107.9 126.9 99.7
2018/19QI 123.5 129.1 121.5 0.0 130.1 113.0 124.3 118.6 106.9 129.7 102.5QII 123.7 135.0 122.5 0.0 132.2 112.6 129.0 103.9 108.2 127.7 98.2QIII 125.9 136.6 119.5 0.0 135.8 113.7 137.6 110.9 109.1 130.8 99.6QIV 138.8 140.5 146.3 0.0 146.3 116.5 170.2 147.5 116.8 141.6 100.7
2019/20QI 153.9 161.0 157.2 0.0 160.0 118.9 170.5 164.9 121.9 148.7 106.4QII 160.0 175.5 158.2 0.0 162.7 117.4 181.3 158.3 142.3 147.7 107.1QIII 159.2 176.1 162.5 0.0 161.0 117.7 183.1 143.0 145.9 157.1 119.2QIV 173.0 191.5 166.4 0.0 165.0 117.9 187.4 178.9 129.4 170.6 127.4
2020/21QI 189.7 207.7 179.8 0.0 165.7 118.2 166.3 225.9 120.5 199.6 125.3QII 192.4 219.6 180.5 0.0 180.0 118.6 185.7 192.7 159.1 201.6 126.2
Source: Central Statistical Agency

| 129
Table 22 (F7): Regional States’ Consumer Price Index (Food)December 2016 = 100
Perio
d
Food
&
Non
-alc
ohol
ic
Beve
rage
s
Brea
d a
nd
Cer
eals
Mea
t
Fish
and
sea
food
Milk
, Che
ese
& E
gg
Oils
& F
ats
Fru
its
Veg
etab
les
Suga
r, ja
m,
hone
y, c
hoc-
olat
e an
d
conf
ectio
nery
(N
D)
Food
pro
duc
ts
Non
-Alc
ohol
ic
Beve
rage
s
OROMIA2007/08
Q.I 24.7 26.3 21.1 19.5 24.4 22.0 22.3 23.2 62.8 26.9Q.II 26.4 28.3 21.1 20.0 27.5 24.7 24.9 22.8 64.4 28.2Q.III 29.5 32.3 22.9 22.7 30.0 31.1 31.4 25.4 65.9 29.0Q.IV 37.5 43.1 25.8 25.6 33.9 34.6 35.0 27.9 75.0 31.3
2008/09Q.I 47.9 60.7 28.5 27.6 33.9 34.1 34.5 34.3 83.7 31.7Q.II 43.0 56.1 28.6 28.4 32.0 33.5 33.9 35.8 62.9 32.6Q.III 40.3 51.6 28.6 29.3 29.7 40.2 40.6 41.9 41.6 34.6Q.IV 40.8 50.6 29.5 31.7 29.0 44.0 44.4 44.3 33.8 35.6
2009/10Q.I 41.0 52.2 30.1 32.1 29.8 37.5 37.9 45.3 34.8 37.4Q.II 39.3 50.0 29.8 32.2 30.0 37.1 37.5 45.4 39.1 41.0Q.III 39.7 50.0 30.6 33.6 30.2 40.5 41.0 49.6 45.8 42.0Q.IV 39.9 48.4 31.6 34.5 32.4 42.4 42.9 50.8 59.6 41.4
2010/11Q.I 40.6 47.9 33.1 36.4 35.3 44.1 44.6 49.4 67.4 47.3Q.II 43.2 47.5 33.0 38.4 43.3 52.5 53.0 51.5 60.1 58.4Q.III 48.2 49.8 29.8 42.6 47.2 62.1 62.8 49.6 62.3 76.6Q.IV 57.4 58.5 33.3 46.3 66.4 64.1 64.8 51.5 90.2 85.4
2011/12Q.I 62.1 64.9 42.0 48.2 69.0 56.8 57.4 52.6 100.3 84.6Q.II 65.1 69.7 45.0 48.7 65.7 59.7 60.3 56.3 99.6 93.5Q.III 70.3 74.2 51.7 55.5 68.5 65.2 71.5 58.2 89.8 92.4Q.IV 76.1 79.7 62.4 63.1 74.4 64.1 80.7 58.0 94.5 83.8
2012/13Q.I 76.4 84.0 66.6 62.2 72.0 75.8 79.3 60.0 85.1 84.3Q.II 75.0 83.8 67.6 62.9 68.8 87.2 72.9 62.7 79.0 80.9Q.III 74.7 81.5 70.2 66.3 68.8 81.4 73.0 67.9 73.4 77.1Q.IV 75.7 83.0 70.3 66.7 71.4 79.8 75.4 67.4 73.5 75.2
2013/14Q.I 79.2 90.0 73.7 68.5 70.6 83.7 77.5 72.2 74.5 74.7Q.II 81.3 95.3 75.1 68.8 69.9 82.3 75.3 71.5 76.1 75.6Q.III 79.0 83.1 76.2 72.0 73.1 86.1 79.0 70.4 73.3 76.7Q.IV 82.4 87.3 78.1 74.7 77.4 80.5 81.5 71.7 86.9 90.4
2014/15Q.I 87.0 92.2 80.5 76.4 85.8 86.5 80.6 70.9 111.2 93.1Q.II 87.7 90.6 81.1 77.5 87.8 85.1 85.6 73.8 102.3 95.0Q.III 91.3 86.9 83.2 82.9 91.7 88.4 96.4 71.9 111.6 87.7Q.IV 98.3 90.2 86.6 92.2 100.3 88.1 101.8 75.2 156.2 80.9
2015/16Q.I 105.6 95.4 91.7 92.8 101.0 94.2 101.6 73.4 238.9 78.3Q.II 104.0 95.0 94.0 94.8 96.5 99.1 105.0 74.7 202.7 78.8QIII 100.5 96.0 94.2 99.8 95.4 101.7 101.3 78.0 141.5 74.5QIV 102.7 97.8 96.4 104.9 98.5 102.4 112.3 77.4 134.9 78.8
2016/17QI 104.9 102.7 100.2 102.2 99.5 100.3 117.9 83.8 128.0 89.1QII 101.8 103.5 99.3 101.2 99.4 100.3 102.3 92.2 110.9 98.0QIII 101.6 99.1 98.9 0.0 104.6 100.8 104.5 107.8 89.1 107.1 95.3QIV 108.8 110.1 104.2 0.0 112.3 96.3 106.9 120.7 85.7 116.2 93.2
2017/18QI 112.9 123.9 108.0 0.0 112.6 94.5 124.6 113.4 86.7 124.1 97.7QII 116.2 129.8 112.0 0.0 113.7 88.7 135.5 114.4 82.9 128.8 106.3QIII 116.6 123.1 117.6 0.0 119.6 83.7 140.5 124.2 79.4 139.5 101.1QIV 120.3 132.4 124.6 0.0 130.7 80.8 142.7 119.4 80.0 143.5 105.9
2018/19QI 123.7 136.6 128.4 0.0 134.7 82.2 146.2 122.9 74.9 145.3 111.5QII 124.5 137.2 129.1 0.0 137.0 85.1 148.7 124.7 76.5 143.4 109.6QIII 128.0 138.6 135.0 0.0 143.0 83.8 153.0 136.0 79.6 152.7 102.3QIV 143.1 154.9 147.1 0.0 155.3 93.4 164.7 167.3 87.3 152.9 105.2
2019/20QI 152.2 173.8 158.5 0.0 152.9 92.6 181.5 172.9 92.3 159.1 111.5QII 154.5 181.7 162.7 0.0 151.7 87.9 188.7 172.0 83.8 159.8 115.0QIII 160.7 182.3 163.7 0.0 157.9 95.1 189.7 185.5 83.7 171.4 122.0QIV 175.5 203.1 172.6 0.0 164.9 97.5 187.0 209.9 86.7 178.9 128.5
2020/21QI 187.6 217.7 174.3 0.0 166.3 102.3 187.4 225.3 84.9 194.7 145.3QII 189.3 224.8 176.8 0.0 170.6 114.1 185.3 207.0 93.7 199.7 154.4
Source: Central Statistical Agency

National Bank of Ethiopia Quarterly Bulletin
130 | Second Quarter 2020/21
Table 22 (F8): Regional States’ Consumer Price Index (Food)December 2016 = 100
Perio
d
Food
&
Non
-alc
ohol
ic
Beve
rage
s
Brea
d a
nd
Cer
eals
Mea
t
Fish
and
sea
food
Milk
, Che
ese
& E
gg
Oils
& F
ats
Fru
its
Veg
etab
les
Suga
r, ja
m,
hone
y, c
hoc-
olat
e an
d
conf
ectio
nery
(N
D)
Food
pro
duc
ts
Non
-Alc
ohol
ic
Beve
rage
s
SNNPR2007/08
Q.I 22.4 25.1 21.1 19.9 34.3 20.3 17.8 36.3 24.7 30.4Q.II 23.4 26.2 21.7 21.0 37.7 22.3 19.6 35.9 28.7 31.9Q.III 26.3 28.6 22.8 22.0 44.4 28.2 24.8 40.9 28.5 33.8Q.IV 34.4 41.3 26.0 24.8 48.8 33.9 29.8 47.1 32.7 37.0
2008/09Q.I 43.6 59.9 29.7 26.8 47.6 30.1 26.4 55.5 36.7 39.5Q.II 38.0 53.7 29.3 28.2 47.6 30.6 26.9 59.9 27.7 36.9Q.III 35.5 47.9 27.4 30.3 46.4 33.7 29.6 66.9 19.2 34.2Q.IV 36.8 49.2 28.8 31.6 50.8 36.7 32.2 68.2 15.1 35.4
2009/10Q.I 37.2 50.8 30.6 33.4 48.0 33.5 29.4 69.1 14.8 43.6Q.II 37.0 48.2 30.8 35.4 48.8 37.1 32.6 71.5 18.4 43.3QIII 36.8 47.3 31.0 36.9 48.7 37.8 33.2 74.3 21.9 40.5Q.IV 35.8 46.3 32.6 36.8 49.5 35.3 31.0 75.6 28.8 41.7
2010/11Q.I 35.9 44.1 33.2 37.3 50.4 39.3 34.6 75.7 36.7 50.1Q.II 38.2 44.6 33.9 40.7 59.4 45.3 39.8 80.2 29.0 61.0Q.III 44.6 50.5 29.4 43.6 67.5 56.4 49.6 80.7 32.4 92.1Q.IV 55.5 60.7 33.1 46.4 89.5 62.6 55.0 85.1 45.5 115.0
2011/12Q.I 59.5 69.9 43.1 48.1 77.6 48.9 43.0 88.0 49.0 121.7Q.II 61.0 70.6 47.8 50.5 74.7 59.3 52.1 90.7 50.7 115.0Q.III 66.4 73.3 54.3 56.5 81.1 63.4 62.0 94.1 51.6 112.6Q.IV 72.9 82.7 63.9 58.1 91.8 62.8 68.6 95.1 54.1 103.0
2012/13Q.I 74.7 89.9 68.9 58.8 82.7 69.2 68.7 91.2 53.8 98.7Q.II 73.8 78.8 69.4 61.1 81.0 81.2 73.1 92.6 52.2 93.7Q.III 74.4 77.4 71.2 63.9 82.3 73.7 75.6 94.9 51.1 84.4Q.IV 76.1 85.6 75.5 66.7 83.7 67.2 73.6 95.6 51.8 84.9
2013/14Q.I 79.2 91.1 76.8 67.7 82.0 65.9 76.8 93.4 51.7 88.6Q.II 78.7 87.5 80.9 69.3 83.0 73.3 76.5 93.2 53.7 83.7Q.III 79.6 81.7 81.6 72.6 85.8 70.0 81.3 93.5 54.7 79.3Q.IV 82.5 89.3 83.7 72.4 89.3 66.2 79.7 93.9 55.8 110.0
2014/15Q.I 81.8 91.9 84.6 76.8 86.9 68.7 75.9 94.8 52.0 120.6Q.II 81.3 81.5 85.8 78.6 91.3 78.6 78.5 97.9 57.8 122.0Q.III 83.7 80.0 86.9 82.5 98.1 83.0 83.3 97.2 64.2 112.9Q.IV 90.5 85.9 90.5 85.5 103.6 75.9 92.2 96.2 77.0 111.4
2015/16Q.I 92.4 91.1 95.4 86.4 101.4 84.5 90.8 97.0 94.5 104.9Q.II 88.9 86.2 95.6 87.9 100.2 91.7 86.2 97.1 98.2 93.4QIII 91.5 90.4 96.3 93.1 98.0 92.6 90.6 97.6 93.1 87.2QIV 96.3 97.8 100.0 95.8 102.6 83.9 92.8 104.7 110.5 92.1
2016/17QI 97.6 100.9 102.1 97.1 100.6 93.8 92.9 105.2 108.4 101.0QII 98.7 99.8 102.2 98.9 98.2 100.8 96.5 104.4 101.1 103.1QIII 102.1 102.4 104.2 0.0 102.0 105.0 102.7 110.6 106.2 103.9 97.9QIV 114.7 121.8 109.1 0.0 106.4 114.4 104.5 117.4 107.3 107.7 103.7
2017/18QI 119.3 134.0 114.0 0.0 107.9 111.8 113.4 106.9 107.4 109.9 110.4QII 118.8 125.3 118.2 0.0 116.3 110.2 135.8 112.5 102.5 111.1 117.9QIII 118.6 120.5 120.7 0.0 122.2 112.4 144.5 130.4 100.9 123.4 114.2QIV 125.5 133.8 131.9 0.0 128.7 118.3 133.6 121.8 100.9 132.1 122.6
2018/19QI 129.5 137.8 138.3 0.0 127.4 118.1 130.0 125.2 100.9 132.1 134.3QII 128.5 133.3 137.9 0.0 132.5 118.3 147.8 126.7 101.0 132.1 122.4QIII 129.0 135.9 141.5 0.0 138.6 120.4 151.5 138.6 101.6 129.9 113.3QIV 141.5 154.3 157.2 0.0 148.4 124.5 161.3 157.3 108.7 133.5 119.2
2019/20QI 153.2 169.6 171.3 0.0 153.8 131.2 165.0 161.2 118.2 137.1 131.6QII 158.9 163.7 174.3 0.0 160.7 134.9 198.3 160.7 120.7 138.4 139.8QIII 162.8 165.5 182.8 0.0 165.0 136.8 207.9 165.4 122.0 143.6 144.1QIV 183.1 191.6 194.8 0.0 166.8 147.0 215.6 176.5 127.7 154.7 163.0
2020/21QI 196.2 205.9 197.5 0.0 171.0 153.7 188.5 188.9 123.3 187.5 177.8QII 202.3 210.3 202.2 0.0 182.9 157.2 195.9 187.0 139.2 211.3 186.7
Source: Central Statistical Agency

| 131
Table 22 (F9): Regional States’ Consumer Price Index (Food)December 2016 = 100
Perio
d
Food
&
Non
-alc
ohol
ic
Beve
rage
s
Brea
d a
nd
Cer
eals
Mea
t
Fish
and
sea
food
Milk
, Che
ese
& E
gg
Oils
& F
ats
Fru
its
Veg
etab
les
Suga
r, ja
m,
hone
y, c
hoc-
olat
e an
d
conf
ectio
nery
(N
D)
Food
pro
duc
ts
Non
-Alc
ohol
ic
Beve
rage
s
SOMALI2007/08
Q.I 22.8 26.5 17.4 16.9 32.6 18.9 24.2 19.0 40.6 17.8Q.II 23.6 27.9 19.8 17.3 39.5 18.9 24.2 18.2 37.2 17.3Q.III 26.4 30.8 20.1 20.0 43.3 26.2 33.6 20.5 31.8 20.4Q.IV 32.0 38.9 21.7 24.1 50.5 30.0 38.4 23.9 36.4 22.3
2008/09Q.I 43.4 59.9 25.3 29.2 55.1 33.3 42.7 27.3 44.3 20.4Q.II 39.7 54.4 24.7 29.9 52.5 31.1 39.9 31.1 33.5 21.3Q.III 40.0 52.7 26.2 33.5 51.1 32.8 42.0 31.1 30.0 27.8Q.IV 41.7 53.0 28.6 37.9 50.8 35.1 45.0 31.2 24.7 30.6
2009/10Q.I 42.3 53.9 29.2 37.1 49.3 33.6 43.1 31.3 20.3 29.7Q.II 42.7 54.8 31.4 37.1 50.6 31.8 40.8 31.2 22.3 29.9Q.III 43.1 56.1 31.4 39.8 51.9 29.7 38.0 31.4 22.7 33.9Q.IV 42.9 55.2 34.8 34.0 54.5 33.4 42.8 32.8 29.5 32.7
2010/11Q.I 43.3 51.5 38.7 36.6 56.6 39.0 50.0 37.6 39.9 33.0Q.II 50.2 52.6 41.9 44.6 66.7 46.0 59.0 45.2 32.6 50.7Q.III 54.0 57.0 36.3 48.6 77.8 46.3 59.4 48.6 34.0 53.3Q.IV 59.8 63.6 42.6 51.2 85.0 53.4 68.4 51.6 48.1 51.5
2011/12Q.I 62.5 71.4 53.2 51.2 91.4 49.8 63.9 58.9 63.9 38.6Q.II 64.5 74.3 53.8 52.2 85.1 47.4 60.8 61.5 61.2 43.1Q.III 70.3 79.0 62.8 60.6 87.4 59.3 67.5 63.9 61.4 56.6Q.IV 73.5 79.6 72.5 60.8 87.0 55.7 80.3 72.0 66.6 58.6
2012/13Q.I 74.5 79.9 78.0 62.0 88.3 59.6 81.7 71.5 66.5 76.8Q.II 78.0 84.8 77.5 69.3 87.0 65.2 75.5 71.7 70.5 87.3Q.III 77.5 83.8 82.5 70.8 87.7 68.2 63.3 71.9 71.1 86.3Q.IV 78.8 85.0 85.6 66.6 87.1 61.0 80.7 73.6 74.7 91.6
2013/14Q.I 80.3 87.3 89.9 67.5 83.6 72.5 94.7 70.5 77.8 95.4Q.II 82.2 92.9 86.0 71.9 84.8 75.0 79.0 69.5 81.1 91.1Q.III 83.5 93.5 80.6 76.1 84.6 83.4 83.4 68.6 86.7 97.1Q.IV 83.0 93.7 83.3 70.6 84.5 86.0 86.8 68.9 87.1 99.5
2014/15Q.I 85.8 97.1 86.5 75.0 90.8 105.1 91.8 68.9 86.0 97.1Q.II 86.3 98.7 86.7 73.6 92.2 85.7 91.0 68.9 88.0 99.7Q.III 87.0 96.5 89.2 77.3 91.8 98.8 95.0 71.2 87.5 102.2Q.IV 89.6 98.6 87.9 84.4 92.8 106.4 100.0 71.0 91.4 103.9
2015/16Q.I 89.3 98.2 94.1 81.1 94.8 94.8 91.9 73.2 91.9 106.5Q.II 91.3 100.8 86.1 89.7 92.8 118.0 93.6 73.1 86.5 101.7QIII 93.4 101.8 93.2 94.4 91.2 120.2 92.6 76.1 89.5 101.7QIV 93.2 100.2 99.7 88.5 87.7 114.6 117.2 78.3 85.6 99.7
2016/17QI 95.1 101.1 105.0 88.3 91.0 108.7 126.4 78.9 99.2 100.2QII 99.5 100.5 102.4 101.2 94.6 98.7 106.2 94.5 98.5 104.1QIII 102.8 104.2 94.7 0.0 105.3 100.3 99.2 102.8 99.3 103.2 101.9QIV 104.7 106.4 108.1 0.0 103.6 100.0 107.4 113.5 96.3 124.6 101.5
2017/18QI 106.9 106.5 112.9 0.0 98.2 100.1 113.2 159.1 95.5 126.6 100.4QII 113.9 119.4 117.9 0.0 103.6 99.9 117.9 139.6 103.2 132.0 102.9QIII 114.4 119.6 119.9 0.0 100.4 100.1 116.2 124.5 109.4 153.4 105.4QIV 119.7 131.9 121.6 0.0 96.8 101.0 126.1 122.6 113.3 145.2 104.3
2018/19QI 129.0 138.5 119.6 0.0 113.2 101.1 129.1 134.6 129.6 147.2 111.9QII 128.6 137.9 117.9 0.0 108.2 100.8 117.0 128.8 136.1 147.6 114.3QIII 131.9 137.5 132.7 0.0 116.5 112.6 121.6 131.3 136.1 175.8 108.7QIV 140.6 146.9 142.9 0.0 126.4 113.5 127.1 162.8 136.1 188.6 113.7
2019/20QI 155.1 166.0 159.1 0.0 141.5 125.8 148.2 185.2 136.1 199.5 124.8QII 162.3 185.6 156.0 0.0 129.0 122.6 144.3 196.7 136.1 200.8 128.4QIII 158.7 183.2 164.5 0.0 133.8 127.8 143.2 181.2 116.6 209.2 131.1QIV 155.7 172.9 160.9 0.0 133.0 122.4 141.6 189.6 128.3 202.0 126.1
2020/21QI 166.3 183.0 185.8 0.0 142.5 133.1 145.3 263.0 116.6 208.6 133.3QII 167.5 187.4 183.2 0.0 161.3 139.2 148.4 208.9 116.6 192.7 127.8
Source: Central Statistical Agency

National Bank of Ethiopia Quarterly Bulletin
132 | Second Quarter 2020/21
Table 22 (F10):: Regional States’ Consumer Price Index (Food)December 2016= 100
Perio
d
Food
&
Non
-alc
ohol
ic
Beve
rage
s
Brea
d a
nd
Cer
eals
Mea
t
Fish
and
sea
food
Milk
, Che
ese
& E
gg
Oils
& F
ats
Fru
its
Veg
etab
les
Suga
r, ja
m,
hone
y, c
hoc-
olat
e an
d
conf
ectio
nery
(N
D)
Food
pro
duc
ts
Non
-Alc
ohol
ic
Beve
rage
s
TIGRAY2007/08
Q.I 30.5 26.0 25.3 24.3 36.6 34.1 28.7 34.2 45.6 24.8Q.II 32.7 27.9 25.4 24.7 40.3 38.7 32.5 33.8 49.2 28.7Q.III 35.3 31.3 25.6 25.6 49.2 39.5 33.2 37.4 45.1 30.6Q.IV 43.9 40.4 27.7 28.3 55.2 44.4 37.3 41.0 50.0 33.4
2008/09Q.I 58.9 57.5 29.9 33.7 54.7 51.6 43.3 50.0 59.3 34.8Q.II 55.5 55.4 29.4 36.2 51.1 51.8 43.6 50.0 48.0 32.8Q.III 50.0 51.0 29.3 35.6 49.1 52.5 44.1 58.5 28.5 33.7Q.IV 48.8 51.9 30.5 36.8 48.1 58.3 49.1 61.3 22.2 34.9
2009/10QI 49.3 52.9 33.2 40.1 44.8 59.0 49.6 63.6 21.7 36.0QII 49.6 52.5 32.3 41.5 46.4 49.0 41.2 68.1 22.3 45.2QIII 48.4 51.7 31.9 39.8 48.5 50.4 42.4 70.8 25.8 46.9Q.IV 49.9 52.1 34.6 43.1 52.0 54.7 46.0 74.6 35.6 47.2
2010/11Q.I 49.9 52.2 36.7 44.6 54.3 62.1 52.2 70.1 37.0 46.8Q.II 48.9 49.5 37.6 49.9 67.0 66.0 55.5 72.0 34.5 52.9Q.III 50.5 49.9 37.5 49.3 71.5 65.8 55.3 69.7 34.4 75.3Q.IV 58.5 56.0 42.4 51.2 91.1 74.8 62.9 75.8 50.8 104.6
2011/12Q.I 64.6 60.1 54.2 60.0 86.3 82.4 69.3 71.3 61.4 105.8Q.II 67.0 65.0 58.3 62.8 84.5 79.6 66.9 73.0 58.8 110.6Q.III 69.8 72.9 61.5 64.5 90.0 74.9 71.6 75.4 48.2 117.2Q.IV 76.2 82.0 71.5 71.9 90.8 79.8 76.0 74.0 51.0 114.3
2012/13Q.I 81.0 87.6 77.9 77.2 93.1 89.9 79.6 75.0 60.5 97.4Q.II 78.9 90.4 79.0 83.4 89.3 96.3 65.6 74.5 55.8 90.3Q.III 77.9 91.2 79.0 81.9 90.5 96.3 58.5 76.9 54.9 88.3Q.IV 81.9 98.6 80.9 82.6 92.4 78.2 62.9 77.1 55.7 86.2
2013/14Q.I 89.7 107.0 87.9 88.8 92.0 54.1 82.3 74.4 57.5 87.4Q.II 86.9 106.1 87.6 90.2 90.2 59.0 69.1 74.9 56.7 84.1Q.III 82.0 94.5 87.1 86.5 94.4 59.0 68.3 74.5 55.8 85.9Q.IV 84.4 96.6 91.4 83.3 95.7 59.0 70.2 74.4 56.8 95.1
2014/15Q.I 85.9 97.8 88.0 92.3 98.4 66.5 73.4 75.1 58.5 103.0Q.II 86.5 94.5 87.2 97.2 96.0 76.4 84.8 73.7 58.4 106.8Q.III 83.8 88.0 87.7 89.8 99.2 81.7 82.5 74.7 60.0 104.8Q.IV 85.1 87.6 89.9 93.3 95.3 81.7 86.9 74.8 64.0 104.3
2015/16Q.I 92.0 95.1 90.0 100.4 101.8 74.3 98.2 74.8 75.6 99.3Q.II 96.4 98.7 89.3 101.5 102.1 100.0 104.8 77.5 88.7 95.6QIII 96.4 99.7 90.8 100.4 96.9 100.0 102.9 84.5 88.6 90.7QIV 98.9 102.0 94.8 95.3 97.8 100.0 110.6 92.8 86.0 89.6
2016/17QI 105.3 110.0 104.4 104.5 99.3 100.0 117.5 94.1 88.5 90.1QII 103.3 107.1 103.4 106.1 100.3 100.0 102.2 97.6 97.6 97.0QIII 101.1 102.8 100.9 0.0 104.2 101.9 99.1 97.0 94.3 100.0 105.0QIV 104.8 109.1 106.1 0.0 106.9 106.5 102.8 99.5 95.6 99.9 103.0
2017/18QI 111.5 116.7 123.7 0.0 111.9 108.0 108.6 107.2 102.4 95.7 101.7QII 115.0 122.9 120.7 0.0 117.7 100.3 107.6 115.6 95.2 98.4 106.5QIII 119.2 127.5 130.3 0.0 113.9 100.9 109.6 106.2 92.5 120.5 108.2QIV 126.2 138.3 137.6 0.0 132.7 105.3 109.8 102.0 93.5 137.5 109.3
2018/19QI 135.7 152.9 149.0 0.0 139.0 102.8 112.2 113.1 93.3 139.9 111.2QII 144.7 170.4 151.5 0.0 146.1 106.3 140.4 121.9 93.5 143.3 110.1QIII 145.5 170.1 152.1 0.0 144.6 106.7 145.7 118.6 93.9 153.6 111.6QIV 155.9 180.3 168.3 0.0 153.0 109.4 159.9 135.6 100.3 155.3 114.7
2019/20QI 169.6 196.7 183.7 0.0 179.9 109.7 161.5 160.4 104.0 157.3 114.5QII 175.1 204.4 197.7 0.0 189.0 121.8 158.6 164.4 104.3 146.4 117.4QIII 181.4 205.6 202.7 0.0 179.5 141.9 161.7 171.2 104.6 155.5 141.6QIV 205.5 232.0 219.6 0.0 184.2 150.5 156.5 196.6 106.2 208.8 149.8
2020/21QI 228.2 258.8 225.1 0.0 199.8 140.9 145.1 233.8 107.6 258.4 150.5QII 239.2 265.5 228.2 0.0 210.2 238.4 158.4 236.1 137.8 272.2 152.7
Source: Central Statistical Agency

| 133
Table 23 A: Ethiopia: Direction of External Trade: EXPORT(In Thousands of Birr)
Continents “Country of Destination” 2010 2011 2012 2013 2014 2015 2016 2017 2018 2019 2020
Africa Djibouti 849,144.8 1,172,260.1 2,313,228.9 1,380,433.1 3,747,193.9 1,941,788.5 2,350,936.7 3,014,309.0 3,735,439.1 3,502,027.2 3,422,940.0 Egypt 585,058.5 764,013.2 768,260.3 818,229.2 1,012,133.0 684,520.9 315,108.1 202,450.4 379,596.1 602,884.5 222,763.9 Ghana 2,094.8 1,117.1 9,582.3 4,292.2 136.8 6,863.1 832.1 696.9 57,554.1 18,798.4 19,029.4 Kenya 54,434.1 176,485.4 190,932.3 269,555.1 431,754.9 656,490.8 625,147.6 1,190,543.3 693,204.5 662,786.4 273,969.7 Libia 1,834.5 2,297.5 68,040.2 - 4,163.4 - - - - - - Morocco 10,976.1 28,363.6 11,632.6 15,895.1 3,746.1 2,040.4 6,841.3 10,061.0 14,271.4 7,627.7 60,459.5 Nigeria 2,215.0 2,990.0 10,297.6 2,735.2 47,617.8 63,719.5 90,565.5 328,428.3 267,894.4 302,908.0 338,173.7 Ruwanda 569.9 1,114.0 993.9 9,793.9 28,670.2 42,368.3 57,909.1 94,341.6 134,233.8 4,579.0 43,122.8 Somali Land - - - - - - - - - - - Somalia 3,139,271.5 4,061,406.4 5,989,640.7 5,798,201.3 6,371,904.9 6,240,561.4 5,827,108.7 5,964,650.4 6,745,127.6 7,180,188.1 5,963,824.1 South Africa 1,030,363.9 89,326.4 194,964.0 218,061.1 257,504.8 226,770.4 260,057.5 426,332.0 283,532.1 213,168.8 216,105.1 Sudan 2,053,243.9 2,983,061.3 2,008,904.2 1,707,190.9 1,629,734.3 1,595,427.4 993,600.1 1,896,197.0 2,560,191.8 1,732,344.2 2,893,902.1 Tanzania 5,959.6 3,084.1 969.4 1,045.6 15,211.2 255.9 401.9 363.6 10,846.1 28,426.6 99,256.8 Uganda 24,333.6 14,963.0 7,044.1 2,765.9 10,051.8 4,295.5 5,913.3 4,864.9 11,353.5 10,099.0 23,442.4 Zambia 369.2 20.4 119.4 503.8 110.0 2,398.8 10,974.8 14,555.0 83,656.4 11,008.3 149,686.8 Zembabwe 1,147.8 3,549.5 788.6 3,632.8 4,272.4 6,716.0 4,025.0 2,602.9 7,178.9 2,997.1 18,027.9 Others 146,791.5 171,537.0 289,802.8 514,287.0 792,557.5 341,524.6 477,440.0 1,351,269.1 1,221,482.3 1,330,556.9 6,723,137.4 Total 7,907,808.6 9,475,589.2 11,865,201.5 10,746,622.1 14,328,992.6 11,815,745.3 11,026,861.7 14,501,665.3 16,205,562.1 15,610,400.08 20,467,841.6 %Share Of Continent 23.0 18.8 21.1 19.4 22.1 20.0 18.4 21.4 21.9 19.7 18.0
Europe Austria 365.7 1,297.4 1,644.6 1,735.5 4,310.4 2,931.2 22,747.8 22,995.8 6,572.3 2,199.9 678.3 Belgium 766,865.8 1,129,952.5 1,206,977.6 1,025,131.4 1,087,850.9 1,182,982.5 1,436,499.1 1,965,237.5 1,815,142.9 1,885,848.0 2,803,691.9 Bulgaria 9,100.7 17,775.7 40,564.4 82,919.2 99,420.1 86,949.0 43,611.4 42,637.1 91,753.3 80,097.1 96,294.6 Cyprus 1,208.7 29.6 2,392.2 3,217.3 5,007.8 640.5 151.2 1,175.9 17,019.5 14,580.4 16,821.9 Czech Republic 5,564.4 3,925.4 7,320.4 5,569.1 13,779.0 21,577.7 22,939.8 18,599.1 4,910.2 4,466.6 2,337.2 Slovakia - - - 1,897.5 4,395.7 1,466.6 4,072.5 7,076.4 2,144.5 1,552.8 805.1 Denmark 18,362.4 14,816.2 35,758.1 32,455.9 17,723.0 20,802.4 30,025.0 28,201.3 25,631.4 32,806.9 32,645.8 Finland 38,401.9 157,776.1 87,678.9 51,661.1 80,304.0 90,939.5 90,178.8 123,908.3 110,724.0 91,036.7 118,222.5 France 505,675.0 823,513.2 812,971.3 530,534.4 877,613.3 682,717.6 807,422.0 827,504.6 717,334.7 751,487.7 789,673.0 Germany 3,676,129.0 5,412,655.7 5,190,387.9 3,730,991.2 3,754,508.5 4,271,155.2 3,486,254.3 3,943,246.8 4,217,307.3 4,135,208.4 4,523,931.9 Greece 104,335.8 161,358.8 136,034.9 260,072.5 235,797.7 214,131.5 209,499.8 235,931.1 186,258.5 230,314.9 146,873.3 Hungary 4,664.1 6,030.5 29,465.0 34,564.1 18,858.6 15,129.0 18,955.3 16,005.0 19,660.7 10,112.7 17,500.4 Ireland 225.2 4,981.1 1,335.4 4,968.8 4,393.8 11,865.0 10,363.8 15,763.6 13,537.1 17,485.0 4,780.1 Italy 767,672.2 1,830,342.8 1,265,069.2 1,127,453.5 1,244,816.9 1,071,373.1 1,101,650.8 1,347,709.3 1,442,089.8 1,359,779.2 1,494,410.9 Netherlands 2,325,158.7 3,589,200.5 3,513,356.8 3,160,616.3 3,899,530.0 3,910,613.0 3,911,035.2 4,177,990.4 5,256,676.3 7,828,660.8 11,179,122.0 Norway 83,421.5 114,266.4 152,810.3 141,325.7 202,256.0 193,648.3 190,592.2 184,970.7 162,162.0 312,830.2 374,409.1 Poland 20,903.7 10,005.3 2,097.0 17,660.3 23,192.2 18,930.3 9,048.4 13,435.8 18,237.2 23,765.7 24,019.7 Portugal 13,224.5 10,264.5 58,441.4 58,595.2 107,108.4 70,872.1 127,631.2 156,689.8 210,638.0 173,970.4 241,431.3 Rumania 26,297.6 64,555.6 79,944.9 62,136.7 63,661.9 35,255.4 12,665.6 23,638.2 20,038.6 11,055.3 19,221.3 Spain 82,768.8 202,110.6 278,937.8 188,107.6 157,484.0 312,381.6 266,256.9 262,739.3 406,304.2 513,868.4 521,805.4 Sweden 345,076.1 631,746.6 435,154.5 264,471.8 307,877.4 333,582.0 266,867.3 263,089.4 188,083.3 156,700.1 208,700.3 Switzerland 4,876,617.7 8,672,031.8 9,644,798.9 9,439,555.7 7,895,981.9 6,490,540.8 5,266,886.0 4,714,821.8 2,005,549.0 701,171.4 18,502,394.7 Turkey 448,459.6 793,508.0 918,743.3 1,460,875.2 1,267,997.9 854,569.2 463,675.1 659,682.4 1,163,249.4 1,066,064.8 1,163,636.0 Ukraine 1,647.3 549.2 3,605.7 1,288.6 1,569.6 9,366.3 14,853.7 24,420.6 27,800.3 42,717.8 56,395.9 United Kingdom 790,362.3 1,036,992.2 804,000.1 916,862.0 888,555.1 806,313.4 1,069,053.4 1,290,346.0 1,088,894.0 1,179,983.5 1,112,511.1 Russia 87,990.9 170,085.7 210,565.2 289,418.9 405,160.0 283,476.8 289,381.7 386,108.6 313,363.4 399,161.5 430,203.7 Yugoslavia - - - - - - - - - - - Others 32,888.7 129,769.9 228,751.3 106,316.3 121,332.5 270,792.0 639,646.5 1,181,451.6 466,267.8 1,105,005.9 1,255,152.2 Total 15,033,388.3 24,988,711.1 25,148,807.1 23,000,401.7 22,790,486.7 21,265,002.1 19,811,964.8 21,935,376.3 19,997,349.8 22,131,932.3 45,137,669.7 %Share Of Continent 43.8 49.7 44.7 41.4 35.2 36.0 33.1 32.4 27.0 28.0 39.8
America Brazil - - - 50.0 - 8,764.8 9,178.4 9,179.6 163.0 77.1 - Canada 115,069.8 173,658.6 167,388.9 166,782.8 214,767.3 216,338.4 268,404.1 270,038.6 477,155.3 382,747.5 556,491.0 Cuba - - - 325.5 15,043.2 - - - - - - Mexico 15,924.2 41,359.7 21,189.4 15,661.3 12,529.3 37,776.3 40,458.2 63,779.1 103,708.1 120,383.8 74,524.9 United States 1,387,899.5 1,571,684.8 1,741,318.4 2,223,193.5 2,413,259.7 3,913,895.0 3,733,304.1 4,317,231.5 6,565,250.9 6,071,240.4 7,994,968.3 Others 40,185.0 165,850.0 147,274.5 66,745.5 886,388.5 189,789.5 231,818.7 458,804.3 682,316.7 2,744,376.7 1,374,096.1 Total 1,559,078.4 1,952,553.1 2,076,859.0 2,472,758.7 3,541,988.1 4,366,563.9 4,283,163.5 5,119,033.1 7,828,594.0 9,318,825.6 10,000,080.3 %Share Of Continent 4.5 3.9 3.7 4.5 5.5 7.4 7.2 7.6 10.6 11.8 8.8
Asia China, Mainland 3,330,807.6 4,764,263.2 5,167,985.4 5,682,920.3 8,071,388.2 6,145,483.9 7,498,265.1 5,111,009.8 4,754,322.7 3,152,537.0 2,538,974.1 China, Taiwan 34,908.6 34,265.7 44,820.6 114,825.8 86,264.9 134,753.6 242,155.2 324,580.5 376,886.5 449,378.2 787,312.2 Hong Kong 98,715.7 378,664.7 523,566.5 655,428.0 342,188.3 434,907.0 390,835.7 419,795.4 394,923.7 254,788.1 552,168.0 India 401,662.3 553,031.3 667,923.1 659,101.4 947,722.2 1,323,550.6 1,440,185.8 1,168,606.9 1,743,919.5 2,978,534.4 1,511,613.3 Indonesia 131,343.7 219,306.2 260,365.2 442,638.8 579,643.5 419,364.5 581,396.8 575,381.8 990,066.8 750,329.4 931,170.3 Israel 752,915.3 1,079,551.0 1,112,383.2 1,822,061.3 2,016,939.4 1,697,745.0 1,366,387.4 1,487,480.1 2,801,566.2 3,184,293.1 2,919,321.9 Japan 535,178.4 596,903.3 1,260,749.0 1,423,109.6 1,884,123.0 1,388,756.3 1,541,929.9 2,233,317.5 2,711,869.3 3,564,930.5 3,350,803.2 N.Korea, Pdrk 16,724.9 54,732.0 24,451.6 40,602.6 223.3 10,146.1 31,494.6 17,897.9 12,521.0 2,846.0 464.9 S.Korea 132,137.3 235,899.3 336,747.5 428,910.5 660,360.4 902,688.1 1,114,526.1 1,224,971.5 1,242,317.8 1,440,765.2 2,190,959.0 Kuwait 9,424.2 45,894.4 38,566.8 53,491.8 54,954.6 59,591.3 28,418.5 36,687.4 94,016.2 123,712.4 141,617.2 Lebanon 10,467.2 79,992.5 41,232.7 104,309.0 90,398.2 15,787.8 16,460.4 30,659.0 61,491.5 65,805.5 37,592.1 Malaysia 9,871.6 5,929.0 12,398.4 57,837.7 45,580.5 5,556.5 107,335.2 78,417.2 29,316.4 64,445.6 230,619.0 Pakistan 333,743.0 192,626.5 768,074.1 896,279.3 678,817.2 855,052.2 1,441,769.4 1,084,808.0 304,739.1 61,784.5 688,547.0 Saudi Arabia 2,057,646.6 2,837,432.3 3,085,698.2 3,075,268.7 3,836,761.6 4,028,128.5 3,981,781.2 4,400,225.0 4,974,581.1 5,667,200.5 7,175,544.1 Singapore 90,801.2 46,255.1 27,476.5 14,236.7 22,061.2 204,215.6 128,152.6 93,295.4 227,603.6 955,530.0 1,608,022.8 Yemen 263,614.8 342,272.8 379,117.3 571,866.5 734,790.4 439,271.6 362,192.6 456,992.0 1,180,754.7 1,697,120.6 1,047,539.2 Thailand 35,140.8 155,088.6 140,299.9 147,971.0 111,444.1 105,215.7 94,324.3 87,940.9 152,740.6 121,436.1 28,623.0 UAE 1,119,157.4 1,284,684.7 1,340,649.8 1,395,130.2 1,931,357.2 1,791,062.6 1,982,406.3 2,694,755.9 3,093,574.6 3,695,524.5 5,430,018.1 Others 370,393.0 846,426.7 1,644,761.6 1,320,681.0 1,550,549.5 1,160,854.1 1,879,038.7 3,985,634.2 4,174,926.4 3,200,481.5 5,990,857.1 Total 9,737,177.2 13,654,330.2 16,785,231.9 18,906,670.1 23,645,567.4 21,122,130.8 24,229,055.8 25,512,456.4 29,322,137.8 31,431,443.1 37,161,766.5 %Share Of Continent 28.3 27.1 29.8 34.1 36.5 35.8 40.5 37.7 39.6 39.7 32.7
Oceania Australia 100,714.1 199,586.8 332,554.2 246,875.7 379,097.3 417,653.3 330,080.8 473,534.0 443,828.2 516,438.5 528,841.3 Others 15,655.1 55,913.1 67,670.3 127,756.1 77,090.7 84,325.8 157,422.4 112,992.7 181,580.2 122,034.7 197,213.0 Total 116,369.2 255,499.9 400,224.5 374,631.7 455,711.7 501,979.2 487,503.3 586,526.7 625,408.4 638,473.2 726,054.2 %Share Of Continent 0.3 0.5 0.7 0.7 0.7 0.8 0.8 0.9 0.8 0.8 0.6 Unspecified - - - - 0 0 0Grand Total 34,353,821.8 50,326,683.5 56,276,324.1 55,501,084.2 64,762,746.5 59,071,421.3 59,838,549.1 67,655,057.8 73,979,052.1 79,131,074.3 113,493,412.3
Source: Ethiopian Customs Authority. Note1: Data for the year 2013 and 2014 is based on updated data from Ethiopian Revenue and Customs Authority Note2: The data for Czechoslovakia before 2013 represents the sum of Czech republic and Slovakia

National Bank of Ethiopia Quarterly Bulletin
134 | Second Quarter 2020/21
Table 23 B: Direction of Trade**(in millions of USD)
Country of Origin2018/19 2019/20 2020/21 Percentage
ChangeQI QII QIII QIV QI QII QIII QIV QI QII
Export Import Export Import Export Import Export Import Export Import Export Import Export Import Export Import Export Import Export Import Export Import Y Z A B C D E F G H I J K L M N O P Q R S=Q/I T=R/J
Africa: Djibouti 36.9 0.2 34.0 0.1 31.4 2.0 26.2 7.1 35.2 7.7 26.3 5.3 27.5 4.7 29.4 20.5 21.0 22.8 20.8 16.0 (24.2) 237.3 Egypt 1.7 53.5 4.3 57.1 17.0 63.8 2.4 49.8 0.8 43.3 1.0 51.4 2.8 95.3 0.7 102.3 1.4 42.4 1.6 61.9 (44.6) (35.1)Ghana 1.2 0.0 0.3 0.1 0.1 0.1 0.0 0.0 0.4 0.1 0.1 0.0 0.1 0.3 0.0 0.1 0.4 0.1 0.1 25.5 (100.0)Kenya 6.2 10.8 2.2 10.3 4.3 9.3 7.7 10.3 6.0 13.0 4.8 41.3 2.3 17.4 1.4 13.7 1.9 12.0 2.2 11.6 (2.0) (33.4)Libia - - - - - - - - - - - - - - - - - - - - - - Morocco 0.0 0.7 0.4 0.8 0.1 130.2 0.0 182.0 0.0 0.0 0.1 0.4 - 284.7 0.3 140.1 0.5 1.4 0.9 0.3 - (99.9)Nigeria 2.5 1.4 3.8 0.1 3.3 0.0 2.2 0.0 3.3 0.1 1.7 0.1 5.4 0.1 0.9 0.0 3.2 0.0 0.5 0.0 (90.1) (60.4)Ruwanda 1.1 0.0 0.2 0.0 0.1 - 0.0 - 0.1 0.0 0.0 0.0 0.1 0.0 - 0.1 0.5 - 0.6 - 782.2 (100.0)Somali Land - 0.1 - 0.1 - 0.4 - 0.0 - 0.3 - 0.1 - 0.1 - 0.0 - 0.1 - 0.0 0.0 (98.6)Somalia 70.0 - 66.7 - 59.4 - 61.1 - 78.7 - 48.1 - 47.3 - 56.6 - 34.5 - 33.5 - (29.2) - South Africa 2.0 46.9 2.3 53.6 2.5 106.1 1.7 37.7 2.0 35.2 1.1 54.7 2.2 64.0 1.6 29.9 1.6 40.3 0.9 28.2 (58.6) (55.9)Sudan 14.6 9.9 22.2 16.6 21.0 30.6 10.4 24.8 9.8 26.3 17.9 5.8 20.4 19.1 20.0 22.2 23.2 19.4 19.3 6.6 (5.7) (65.3)Tanzania 0.2 0.8 0.1 0.9 0.2 1.0 0.5 1.0 0.3 1.0 0.0 1.8 1.1 0.9 1.0 2.3 0.9 0.4 0.0 0.4 (100.0) (50.6)Uganda 0.1 0.2 0.1 0.4 0.1 0.2 0.1 0.1 0.1 0.1 0.1 0.1 0.1 0.2 0.1 0.1 0.3 0.7 0.2 1.1 110.9 359.4 Zambia 0.9 0.0 0.3 0.3 0.1 - 0.0 0.5 0.3 0.0 - 0.0 1.8 0.0 0.0 0.0 2.2 0.2 0.4 - (78.8) (100.0)Zembabwe 0.1 0.0 0.1 0.0 0.0 0.0 0.1 - 0.0 0.0 0.0 - 0.0 0.2 0.0 0.3 0.0 - 0.4 0.1 1,511.2 (35.7)Others 5.4 3.2 7.3 6.7 5.7 1.8 9.9 4.7 10.5 1.2 30.2 1.3 43.8 19.7 17.8 1.0 61.8 3.1 66.6 1.2 52.1 (93.9)Total 142.9 127.7 144.3 147.0 145.2 345.5 122.4 318.1 147.5 128.2 131.4 162.4 154.8 506.9 129.7 332.8 153.2 143.0 148.0 127.7 (4.4) (74.8)%Share Of Continent 22.75 0.00 24.68 3.31 21.13 9.69 16.01 9.28 20.40 3.42 23.28 4.25 20.43 13.98 13.76 12.38 18.36 4.11 20.49 3.85 0.31 (72.49)
Europe: Austria 0.0 9.3 0.0 4.5 0.0 11.3 0.0 11.7 0.0 6.8 0.0 7.3 0.0 6.3 0.0 3.0 0.0 6.0 0.0 2.9 101.5 (54.1)Belgium 19.7 38.9 11.5 130.2 10.6 48.8 19.3 124.6 22.4 43.6 12.5 79.8 21.2 90.9 24.4 27.2 20.7 20.3 14.7 33.7 (30.8) (62.9)Bulgaria 0.9 16.2 0.5 1.4 1.2 14.0 0.8 13.2 0.5 7.0 0.3 8.9 1.3 0.3 0.5 0.5 0.6 10.2 0.5 0.7 (65.6) 123.9 Cyprus 0.2 1.1 - 1.0 0.1 1.9 0.2 1.2 0.1 1.5 - 3.1 0.3 1.4 0.3 0.7 - 1.6 - 1.1 (100.0) (21.0)Czech Republic 0.0 7.2 0.1 5.5 0.0 4.0 0.1 9.4 0.0 2.9 - 1.9 0.0 9.5 0.0 1.1 0.0 1.4 0.0 1.4 (70.9) (85.2)Slovakia 0.0 0.3 0.0 0.3 - 0.5 0.0 0.8 0.0 0.4 0.0 0.9 - 0.4 - 0.4 0.0 0.1 0.0 0.1 0.0 (63.7)Denmark 0.1 7.6 0.2 25.6 0.3 12.4 0.5 10.6 0.2 7.0 0.2 13.2 0.2 13.4 0.2 7.1 0.3 18.7 0.2 3.9 (20.7) (71.0)Finland 1.6 4.8 0.1 1.9 1.5 2.3 1.6 0.4 0.1 3.7 0.0 0.3 1.1 0.6 2.4 1.2 0.0 0.5 0.0 0.8 (96.2) 25.5 France 6.0 43.2 4.0 56.1 3.4 28.6 6.7 28.1 6.2 37.0 9.3 56.9 5.4 31.0 7.5 133.5 5.5 50.8 4.4 36.3 (19.3) 17.1 Germany 35.5 79.6 18.0 82.9 22.0 79.9 37.0 79.3 49.2 68.1 33.2 95.5 36.7 75.7 41.6 57.1 29.8 74.5 22.9 58.1 (37.7) (23.2)Greece 0.8 1.9 0.7 1.2 2.8 2.4 3.4 1.1 1.0 1.1 0.8 1.8 1.1 2.5 1.2 0.9 0.8 1.6 1.1 1.1 7.8 (57.8)Hungary 0.4 3.9 0.2 3.8 0.1 1.6 0.1 3.9 0.2 3.4 0.0 4.1 0.1 1.7 0.1 4.3 0.3 3.0 - 5.4 (100.0) 213.7 Ireland 0.2 14.9 0.2 8.5 0.2 12.6 0.2 10.5 0.1 11.0 0.1 12.9 0.1 8.4 0.0 6.6 0.0 10.2 0.0 6.6 (44.0) (21.2)Italy 12.6 91.8 5.0 99.0 8.0 85.5 17.5 66.1 11.1 71.9 9.2 63.5 7.2 76.9 16.7 50.9 10.8 83.3 8.1 94.0 12.9 22.1 Netherlands 45.1 30.3 43.0 27.6 53.2 20.7 69.3 105.2 81.2 95.4 65.5 22.3 82.5 23.7 79.2 13.5 78.7 31.8 79.9 23.8 (3.2) 0.4 Norway 1.5 0.7 1.4 1.3 1.7 0.8 2.6 0.2 3.6 1.3 2.9 0.7 2.8 3.0 3.0 0.3 2.2 1.9 2.8 0.4 0.0 (87.8)Poland 0.3 10.3 0.0 6.2 0.1 11.5 0.1 5.9 0.3 7.0 0.3 12.8 0.1 5.0 0.2 4.2 0.2 8.8 0.1 22.2 20.6 340.1 Portugal 1.2 2.6 1.9 1.7 2.0 3.0 2.3 7.4 0.6 2.0 1.2 0.8 1.7 2.6 1.0 1.1 1.2 2.7 2.9 0.7 63.3 (72.8)Rumania 0.0 73.3 0.4 15.0 0.0 9.9 - 33.1 0.1 38.6 0.3 12.2 0.3 0.5 0.1 0.2 0.0 30.9 0.2 0.3 (37.8) (49.8)Spain 5.2 15.8 2.9 22.4 4.8 21.7 4.6 15.9 4.2 17.8 3.7 28.6 3.7 17.5 3.4 17.1 4.6 15.7 3.2 13.9 (12.0) (20.6)Sweden 1.5 6.8 1.5 11.7 1.3 3.1 1.6 24.4 1.5 28.3 1.0 9.1 1.8 3.7 1.5 14.9 1.4 3.1 1.3 11.4 (24.0) 210.2 Switzerland 15.8 19.5 4.4 9.3 3.8 6.8 5.3 27.8 7.0 32.3 7.8 5.1 14.4 6.7 169.6 28.4 204.4 5.8 132.7 29.4 820.6 336.3 Turkey 2.6 160.9 13.7 166.4 19.6 137.7 4.7 142.1 3.8 151.0 8.2 176.0 13.5 158.0 8.5 126.6 4.9 375.5 7.0 147.2 (48.3) (6.8)Ukraine 0.3 38.3 0.1 71.3 0.4 36.7 0.5 32.1 0.4 140.6 0.2 106.0 0.3 40.0 0.3 52.0 0.4 29.1 0.6 146.9 91.5 267.5 United Kingdom 10.5 116.5 7.6 69.2 11.1 84.2 12.6 56.6 10.4 52.1 6.5 133.6 8.8 30.0 8.0 80.6 9.1 53.3 6.2 79.8 (29.8) 165.8 Russia 1.7 56.1 2.8 17.9 3.9 41.0 4.0 8.1 3.6 45.7 2.2 9.8 3.5 5.5 2.5 9.5 3.3 4.0 3.0 29.7 (15.8) 441.2 Yugoslavia - - - - - - - - - - - - - - - - - - - - - - Others 8.1 7.7 11.3 12.2 12.2 21.1 14.4 3.4 10.7 7.0 6.2 3.6 15.4 10.0 17.7 2.5 2.9 4.9 1.7 10.5 (88.7) 6.0 Total 171.4 859.3 131.6 854.1 164.5 704.0 209.4 823.2 218.3 884.6 171.5 870.8 223.5 625.4 389.7 645.5 382.2 849.5 293.4 762.2 31.3 21.9 %Share Of Continent 27.30 0.00 22.51 19.25 23.93 19.75 27.38 24.01 30.19 23.61 30.40 22.80 29.50 17.25 41.33 24.01 45.79 24.41 40.63 22.95 37.72 33.05
America: Brazil 0.0 41.8 0.0 11.2 0.0 7.7 0.0 9.4 - 3.8 - 3.9 - 5.1 - 4.2 - 21.2 - 7.7 - 50.7 Canada 4.4 12.1 2.9 21.3 2.4 5.6 4.4 11.2 2.8 4.8 3.3 37.8 4.2 26.6 4.2 7.6 3.6 4.3 3.9 28.1 (7.0) 5.7 Cuba - 0.0 - 0.0 - 0.0 - 0.1 - 0.0 - - - 0.1 - - - - - 0.0 - (80.3)Mexico 1.0 3.7 0.2 1.1 2.2 0.6 1.3 3.4 0.5 1.6 0.2 2.1 0.3 3.1 1.3 1.0 0.6 0.8 0.0 3.2 (94.1) 2.0 United States 50.6 166.1 25.5 949.8 47.7 180.9 69.5 73.0 42.6 307.3 39.1 316.7 46.3 299.8 84.5 147.2 59.0 157.5 40.6 211.6 (12.2) (29.4)Others 13.0 2.3 15.7 2.0 25.7 1.5 33.7 7.3 34.4 1.9 12.0 2.6 30.7 102.9 9.2 15.7 1.5 4.9 0.7 3.3 (97.6) (96.8)Total 69.0 226.0 44.2 985.4 78.0 196.3 109.0 104.4 80.3 319.4 54.5 363.1 81.4 437.6 99.2 175.6 64.7 188.7 45.3 253.9 (44.4) (42.0)%Share Of Continent 10.98 0.00 7.56 22.21 11.34 5.51 14.25 3.05 11.10 8.53 9.66 9.51 10.74 12.07 10.52 6.53 7.75 5.42 0.00 7.64 (100.00) (36.66)
Asia: China, Mainland 40.6 1,083.1 35.4 959.8 34.5 1,001.0 35.3 876.1 19.4 933.9 20.0 1,072.7 23.3 894.5 21.2 710.4 13.1 918.0 15.9 890.0 (31.8) (0.5)China, Taiwan 5.2 12.5 2.1 16.5 2.6 12.7 5.6 10.9 4.9 25.5 2.4 26.9 3.3 13.5 11.7 23.8 5.2 17.8 2.7 12.1 (18.3) (10.1)Hong Kong 3.1 2.8 3.0 2.4 2.9 2.7 2.8 1.8 1.5 1.2 1.6 0.7 5.2 1.4 3.7 0.6 3.7 18.2 3.4 12.4 (35.8) 811.1 India 7.5 266.2 14.0 367.8 25.2 335.3 39.4 260.3 22.3 329.1 16.3 341.2 11.1 286.6 6.7 131.9 9.6 569.7 15.1 457.9 36.0 59.8 Indonesia 7.9 71.5 11.4 84.6 5.9 69.0 3.8 55.8 10.5 72.0 5.6 59.4 7.4 80.9 6.1 70.6 6.6 111.0 6.5 85.4 (12.0) 5.6 Israel 18.6 7.3 29.5 7.7 31.6 8.3 26.1 2.3 27.2 5.2 24.8 8.6 36.3 6.0 13.6 3.4 18.0 3.1 16.9 4.4 (53.4) (26.6)Japan 26.6 80.5 24.6 99.7 29.9 93.2 40.9 101.5 32.8 80.7 19.6 45.4 25.2 32.4 35.7 21.8 20.9 32.2 15.6 27.8 (38.4) (14.2)N.Korea, Pdrk 0.2 0.3 0.1 0.5 0.0 0.7 0.1 15.9 0.0 0.5 - 1.4 0.0 0.0 0.0 0.9 0.0 0.3 0.0 1.9 521.7 4,655.1 S.Korea 12.5 46.2 8.5 50.7 10.9 40.5 14.4 43.0 16.7 39.5 7.8 43.6 15.9 44.3 23.7 58.9 15.2 41.0 8.8 44.1 (44.3) (0.6)Kuwait 0.6 514.6 0.6 381.3 0.8 202.6 1.5 560.9 1.2 421.1 0.8 417.3 0.8 141.0 0.8 107.5 1.4 116.0 1.0 0.3 34.2 (99.8)Lebanon 0.8 0.4 0.5 0.4 0.3 0.2 0.5 0.3 0.4 0.4 1.0 0.5 0.7 0.1 0.1 0.0 0.2 0.2 0.1 0.5 (91.3) 463.4 Malaysia 0.0 84.3 0.0 115.1 0.1 65.5 0.6 56.4 1.3 37.4 0.2 45.4 0.3 36.4 1.9 32.2 1.9 125.5 2.3 105.7 750.1 190.6 Pakistan 2.7 24.7 2.1 14.5 1.0 4.4 0.5 6.2 0.2 5.8 0.4 11.3 5.5 5.9 5.8 8.3 5.4 8.2 3.1 13.1 (43.3) 122.0 Saudi Arabia 42.2 41.4 45.5 89.8 47.8 85.2 47.5 28.2 55.3 56.5 44.7 181.7 55.5 121.7 51.5 97.6 53.3 60.2 45.9 72.2 (17.4) (40.7)Singapore 1.2 4.0 1.8 4.3 8.0 28.5 10.9 4.9 7.5 9.6 6.6 10.0 16.4 113.4 8.3 64.0 6.2 104.2 15.2 2.4 (7.6) (97.9)Yemen 11.3 0.6 10.3 0.7 17.5 0.7 16.4 0.6 18.5 0.7 6.3 0.4 6.7 0.6 6.8 0.7 9.5 1.3 6.9 0.7 2.9 9.2 Thailand 1.1 72.0 1.3 48.2 1.2 32.0 1.2 28.5 0.9 27.3 1.0 25.7 0.3 30.1 0.1 18.7 0.4 25.1 0.0 71.9 (96.4) 139.1 UAE 28.2 102.4 26.9 135.7 39.2 221.4 37.7 90.8 23.5 98.3 26.6 99.3 47.5 193.7 26.9 155.4 32.0 115.1 48.3 348.8 1.6 80.1 Others 25.0 51.5 43.7 63.7 37.2 113.4 30.2 35.4 25.7 265.6 18.2 30.3 33.3 50.4 93.7 22.4 24.5 25.9 24.1 24.1 (27.6) (52.2)Total 235.1 2,466.2 261.3 2,443.4 295.9 2,317.3 315.2 2,179.9 269.8 2,410.2 204.0 2,421.6 294.8 2,052.8 318.0 1,529.1 227.1 2,292.8 231.7 2,175.8 (21.4) 6.0 %Share Of Continent 37.44 0.00 44.69 55.08 43.04 65.00 41.21 63.58 37.32 64.33 36.15 63.39 38.91 56.61 33.72 56.87 27.21 65.88 32.08 65.50 (17.56) 15.71
Oceania: Australia 7.3 2.2 3.0 4.4 2.7 1.3 7.6 1.7 5.0 2.2 2.5 1.1 2.5 2.1 4.9 4.3 6.2 5.5 1.5 1.2 (37.4) (43.2)Others 2.4 0.7 0.2 2.0 0.6 0.7 1.2 1.3 2.1 1.7 0.3 0.9 0.7 1.5 1.3 1.3 1.2 0.9 2.3 0.9 236.6 (42.7)Total 9.7 2.9 3.3 6.4 3.9 2.0 8.8 3.0 7.1 4.0 2.9 2.0 3.2 3.6 6.3 5.7 7.5 6.3 3.8 2.0 22.0 (43.0)% Share Of Continent 1.54 0.00 0.56 0.14 0.56 0.06 1.15 0.09 0.99 0.11 0.51 0.05 0.42 0.10 0.66 0.21 0.89 0.18 0.53 0.06 27.92 (37.76)
Unspecified Unspecified - - - - - - - - - - - - - - - - - - - - Grand Total Grand Total 628.0 3,682.1 584.6 4,436.3 687.5 3,565.0 764.9 3,428.6 723.0 3,746.4 564.2 3,820.0 757.6 3,626.3 942.9 2,688.7 834.7 3,480.3 722.3 3,321.7 (4.7) (8.4)Source: Ethiopian Ministry of Revenues * Data on import of petroleum products are obtained from Ethiopian Petroleum Enterprise ** All import data are updated based on revised data from the Ethiopian Revenues and Customs Authority, while export data includes electricity export

| 135
Tabl
e 24
: Vo
lum
e of
Exp
orts
, by
Maj
or C
omm
odity
Gro
ups
( In
met
ric to
ne)
Perio
dPe
riod
Cof
fee
Oil S
eed
sLe
athe
r and
Le
athe
r pro
duc
tsa
Pulse
sM
eat &
Mea
t Pr
odts
.Fr
uits
&
Veg
et.
Suga
rG
old
Oil C
akes
Live
Ani
mal
sC
hat
Petro
l. &
Pet
. Pr
dts
Bees
Wax
Tant
alem
Cot
ton
Text
. & T
ext.
Prd
ts20
18/1
9Ja
nuar
y 1
1,18
1.3
26,
518.
6 3
21.3
4
7,16
4.1
1,6
27.9
1
3,77
6.4
2,5
03.3
0
.0
- 8
45.6
3
,929
.1
-
16.
0 8
.0
70.
9 1
,617
.8
Febr
uary
16,
218.
2 2
7,80
7.6
410
.7
54,
974.
1 1
,382
.1
13,
509.
9 5
,001
.7
0.0
-
2,3
36.5
4
,249
.3
-
36.
0 1
1.5
- 1
,621
.3
Mar
ch 2
0,74
0.3
32,
934.
5 4
34.0
4
8,20
7.6
1,4
07.6
1
4,13
4.7
2,5
01.2
0
.0
- 3
,884
.2
4,3
51.2
-
1
7.5
15.
6 -
1,9
19.0
Q
tr III
48,
139.
8 8
7,26
0.6
1,1
66.0
1
50,3
45.7
4
,417
.6
41,
420.
9 1
0,00
6.2
0.1
-
7,0
66.4
1
2,52
9.6
-
69.
5 3
5.1
70.
9 5
,158
.2
Apr
il 2
1,83
0.5
30,
188.
3 3
74.8
5
0,49
9.5
1,5
40.6
1
6,33
2.3
7,5
00.3
0
.0
- 2
,754
.2
4,4
22.8
-
4
0.4
10.
0 -
1,8
82.4
M
ay 2
8,46
5.5
22,
715.
4 3
54.2
4
3,99
6.0
1,6
59.8
1
7,21
1.1
2,5
00.0
0
.0
- 1
,785
.6
3,9
36.6
-
1
9.0
4.5
-
1,6
22.7
Ju
ne 2
9,32
1.4
16,
758.
4 4
30.0
3
9,31
1.0
1,0
63.6
1
6,62
6.7
7,5
00.0
0
.1
- 3
,240
.3
4,1
87.6
-
3
4.5
3.0
-
1,8
31.8
Q
tr IV
79,
617.
4 6
9,66
2.1
1,1
59.0
1
33,8
06.5
4
,264
.1
50,
170.
1 1
7,50
0.3
0.1
-
7,7
80.1
1
2,54
7.0
-
93.
9 1
7.5
- 5
,336
.9
2019
/20
July
26,
513.
4 1
2,31
3.3
332
.2
30,
173.
9 1
,329
.1
17,
681.
2 -
0.1
-
7,3
95.9
4
,985
.2
-
12.
0 2
.1
- 2
,333
.2
Aug
ust
30,
304.
2 1
3,75
0.8
429
.6
32,
588.
5 1
,420
.4
18,
119.
0 5
,000
.0
0.1
-
1,7
12.3
6
,583
.5
-
36.
0 7
.7
- 2
,562
.1
Sept
embe
r 2
3,71
3.3
8,9
62.0
3
60.9
2
4,84
1.6
904
.5
13,
005.
7 2
,500
.2
0.0
-
3,3
90.6
4
,713
.5
-
18.
0 6
.9
- 2
,038
.7
Qtr
I 8
0,53
0.9
35,
026.
1 1
,122
.7
87,
604.
0 3
,654
.0
48,
805.
8 7
,500
.2
0.2
-
12,
498.
8 1
6,28
2.2
-
66.
0 1
6.7
- 6
,934
.0
Oct
ober
19,
978.
8 6
,860
.2
486
.2
32,
704.
2 9
25.0
1
2,32
5.4
1.6
0
.0
- 1
,673
.1
4,7
07.5
-
4
4.0
8.5
-
1,7
83.5
N
ovem
ber
18,
336.
8 1
2,55
9.1
333
.8
26,
081.
7 1
,017
.7
15,
358.
6 3
.3
0.0
-
1,7
41.0
4
,730
.9
-
- 6
.7
- 2
,122
.9
Dec
embe
r 1
4,21
2.5
16,
150.
1 3
11.4
2
2,98
7.2
1,1
29.1
1
5,77
1.1
2,5
02.3
0
.1
- 1
,359
.7
4,7
32.7
-
-
2.0
-
1,8
83.5
Q
tr II
52,
528.
2 3
5,56
9.5
1,1
31.4
8
1,77
3.1
3,0
71.7
4
3,45
5.2
2,5
07.1
0
.2
- 4
,773
.8
14,
171.
1 -
4
4.0
17.
2 -
5,7
89.9
Ja
nuar
y 1
6,60
2.3
28,
869.
8 2
76.1
2
2,25
4.3
1,1
31.0
1
1,62
4.2
2,5
02.9
0
.1
- 1
,815
.4
4,7
77.9
-
2
3.0
2.3
-
1,9
83.9
Fe
brua
ry 1
7,47
0.5
24,
446.
4 2
27.2
3
4,31
3.8
1,1
70.3
1
6,40
1.1
2,5
02.3
0
.0
- 2
,035
.0
5,1
05.7
-
-
8.0
-
2,0
46.2
M
arch
27,
045.
7 3
5,19
8.2
282
.0
31,
067.
1 9
10.7
1
9,22
0.8
2.1
0
.2
- 9
30.7
4
,591
.1
-
17.
5 6
.1
- 1
,888
.6
Qtr
III 6
1,11
8.6
88,
514.
3 7
85.3
8
7,63
5.3
3,2
11.9
4
7,24
6.0
5,0
07.3
0
.3
- 4
,781
.0
14,
474.
7 -
4
0.5
16.
4 -
5,9
18.7
A
pril
25,
143.
3 3
5,31
3.1
123
.3
34,
542.
4 9
69.1
2
0,94
8.1
0.4
1
.0
- 2
,178
.1
3,1
95.1
-
1
8.0
10.
1 4
0.0
1,2
93.8
M
ay 2
5,98
2.6
27,
132.
5 1
72.9
3
8,09
8.8
1,0
42.9
2
1,64
8.9
2,5
00.0
0
.8
- 2
,540
.8
4,5
37.2
-
7
2.0
2.0
4
0.0
1,4
05.0
Ju
ne 2
5,80
8.0
14,
949.
0 2
15.7
2
4,35
6.9
870
.3
9,0
79.0
-
0.8
-
2,6
23.1
4
,475
.9
-
17.
5 1
3.7
- 1
,457
.0
Qtr
IV 7
6,93
3.9
77,
394.
6 5
11.9
9
6,99
8.1
2,8
82.3
5
1,67
6.1
2,5
00.4
2
.6
- 7
,342
.0
12,
208.
2 -
1
07.5
2
5.8
80.
0 4
,155
.8
2020
/21
July
19,
045.
3 1
0,72
3.8
233
.5
19,
346.
9 1
,222
.3
14,
729.
8 2
,500
.0
1.0
-
2,8
78.0
4
,216
.8
-
31.
5 5
.3
- 2
,265
.5
Aug
ust
20,
022.
6 1
7,14
2.7
164
.9
24,
890.
7 9
68.6
1
1,64
1.0
- 0
.9
- 2
,023
.0
6,3
53.7
-
1
8.0
3.6
-
2,1
99.9
Se
ptem
ber
39,
067.
8 2
7,86
6.4
398
.4
44,
237.
6 2
,190
.9
26,
370.
7 2
,500
.0
0.8
-
4,9
01.0
1
0,57
0.5
-
49.
5 9
.0
- 4
,465
.4
Qtr
I 7
8,13
5.6
55,
732.
8 7
96.8
8
8,47
5.2
4,3
81.9
5
2,74
1.5
5,0
00.0
2
.7
- 9
,802
.0
21,
141.
0 -
9
9.0
17.
9 -
8,9
30.8
O
ctob
er 1
3,83
9.0
15,
815.
6 1
72.1
1
6,11
8.0
1,0
36.4
1
4,56
1.5
1.7
0
.9
- 2
,222
.8
6,3
38.5
-
1
6.0
10.
0 -
1,8
46.6
N
ovem
ber
14,
346.
1 1
9,63
5.6
180
.8
15,
025.
8 1
,107
.9
19,
095.
2 1
.1
0.5
-
1,1
01.6
4
,934
.5
-
36.
0 1
.0
- 1
,999
.0
Dec
embe
r 1
0,26
6.9
32,
961.
9 1
69.1
1
9,31
5.0
1,0
30.3
1
2,64
7.5
2.4
0
.5
- 1
,744
.5
5,5
29.9
-
-
4.3
-
1,5
59.6
Q
tr II
38,
452.
0 6
8,41
3.0
522
.0
50,
458.
8 3
,174
.7
46,
304.
1 5
.3
1.9
-
5,0
68.9
1
6,80
2.9
-
52.
0 1
5.3
- 5
,405
.2
Tabl
e 24
con
tinue
d:Pe
riod
Perio
dC
erea
ls an
d F
lour
Nat
ural
G
umC
ivet
Hop
Ani
mal
Fo
dd
erN
atur
al
Hone
yM
arbl
eFl
ower
Beve
rage
Spic
esO
ther
sEl
ectri
city
(in
‘100
0’ k
wh)
Oth
ers*
Re-E
xpor
tsG
rand
Tot
al*
2018
/19
Janu
ary
286
.4
211
.0
- -
- 0
.2
- 4
,346
.8
381
.6
502
.7
22,
162.
1 1
37,4
71.3
8
5,22
7.5
193
,111
.2
Febr
uary
811
.2
18.
2 -
- -
25.
9 -
4,6
94.2
2
98.4
5
26.4
1
7,76
2.3
151
,695
.5
93,
748.
3 2
19,6
74.4
M
arch
595
.3
164
.8
- -
- 4
6.3
- 4
,744
.0
355
.7
987
.4
22,
330.
1 1
59,7
71.0
1
01,7
87.5
2
30,4
00.2
Q
tr III
1,6
92.9
3
93.9
-
- -
72.
5 -
13,
785.
0 1
,035
.8
2,0
16.5
6
2,25
4.4
448
,937
.7
280
,763
.3
-
643
,185
.9
Apr
il 3
28.3
1
13.2
-
- -
0.1
-
4,6
74.5
4
13.2
9
31.6
1
2,81
3.8
156
,650
.9
85,
227.
5 2
20,7
11.3
M
ay 4
43.8
1
29.3
-
- -
0.6
-
4,2
95.1
4
68.8
1
,205
.9
18,
832.
3 1
49,6
46.2
9
3,74
8.3
216
,391
.6
June
297
.0
169
.5
- -
- -
- 1
0,97
3.6
464
.9
1,6
73.0
1
3,72
1.4
147
,607
.8
101
,787
.5
220
,261
.1
Qtr
IV 1
,069
.0
411
.9
- -
- 0
.6
- 1
9,94
3.2
1,3
46.9
3
,810
.5
45,
367.
5 4
53,9
04.8
2
80,7
63.3
-
6
57,3
63.9
20
19/2
0Ju
ly 1
03.1
1
6.0
- -
- 2
.1
- 8
,075
.6
259
.7
1,4
07.2
9
,443
.3
54,
590.
0 2
1,64
2.3
122
,378
.5
Aug
ust
344
.8
174
.9
- -
- 1
0.1
- 9
,962
.4
274
.4
1,2
56.9
9
,925
.4
54,
535.
3 2
4,51
8.6
134
,462
.9
Sept
embe
r 2
22.0
5
18.7
-
- -
0.3
-
8,1
03.6
2
78.1
1
,697
.8
11,
099.
1 5
7,91
7.8
23,
965.
0 1
06,3
75.3
Q
tr I
669
.8
709
.6
- -
- 1
2.5
- 2
6,14
1.5
812
.2
4,3
61.9
3
0,46
7.7
167
,043
.2
70,
125.
9 -
3
63,2
16.7
O
ctob
er 5
7.6
140
.6
- -
- 2
5.5
- 8
,011
.1
350
.6
1,2
61.9
1
1,91
1.6
59,
546.
3 2
3,55
0.9
103
,257
.0
Nov
embe
r 7
2.3
112
.0
- -
- 6
.0
- 7
,706
.4
253
.8
1,2
16.3
1
2,77
1.6
99,
714.
5 2
4,26
7.9
104
,430
.9
Dec
embe
r 3
4.7
59.
0 -
- -
7.2
-
4,6
16.9
3
33.8
1
,127
.3
14,
874.
3 1
03,1
86.8
2
2,93
8.6
102
,094
.9
Qtr
II 1
64.6
3
11.6
-
- -
38.
7 -
20,
334.
4 9
38.2
3
,605
.5
39,
557.
4 2
62,4
47.5
7
0,75
7.5
-
309
,782
.8
Janu
ary
194
.8
150
.0
- -
- 7
.7
- 9
,881
.9
238
.4
500
.3
17,
005.
0 9
5,06
0.2
29,
964.
2 1
19,8
41.2
Fe
brua
ry 5
47.9
1
6.6
- -
- 6
4.5
- 8
,952
.0
294
.0
669
.2
12,
574.
5 1
00,6
00.7
2
5,17
3.0
128
,845
.2
Mar
ch 3
10.4
3
0.0
- -
- 2
2.7
- 5
,659
.8
281
.9
657
.6
17,
177.
1 1
12,0
81.9
2
6,03
4.2
145
,300
.3
Qtr
III 1
,053
.1
196
.6
- -
- 9
4.9
- 2
4,49
3.7
814
.3
1,8
27.1
4
6,75
6.6
307
,742
.7
81,
171.
5 -
3
93,9
86.7
A
pril
700
.3
64.
7 -
- -
- -
6,8
29.6
1
,204
.9
663
.5
6,7
20.1
1
12,9
13.8
1
7,52
7.0
139
,959
.0
May
1,0
49.1
8
6.1
- -
- -
- 8
,211
.8
314
.9
532
.7
7,2
45.4
1
23,6
74.9
1
8,88
7.0
142
,616
.4
June
1,0
33.2
1
6.1
- -
- 6
.1
- 8
,378
.9
345
.7
1,5
08.9
4
,298
.3
171
,431
.7
17,
057.
8 9
9,45
4.0
Qtr
IV 2
,782
.6
166
.8
- -
- 6
.1
- 2
3,42
0.3
1,8
65.6
2
,705
.1
18,
263.
8 4
08,0
20.5
5
3,47
1.9
-
382
,029
.4
2020
/21
July
1,0
88.0
4
3.5
- -
- 0
.6
- 7
,523
.7
271
.0
823
.9
3,8
62.7
1
8,35
1.5
15,
884.
2 9
0,81
2.9
Aug
ust
970
.2
81.
0 -
- -
0.2
-
7,4
21.2
3
24.7
1
,108
.7
7,3
59.0
1
6,60
5.3
19,
468.
4 1
02,6
94.4
Se
ptem
ber
2,0
58.1
1
24.5
-
- -
0.9
-
14,
944.
9 5
95.6
1
,932
.5
11,
221.
7 8
,054
.6
35,
352.
7 1
93,5
06.3
Q
tr I
4,1
16.3
2
49.0
-
- -
1.7
-
29,
889.
8 1
,191
.2
3,8
65.1
2
2,44
3.4
43,
011.
4 7
0,70
5.3
387
,013
.7
Oct
ober
1,6
30.5
7
7.8
- -
- 1
.2
- 7
,904
.2
331
.3
920
.2
11,
612.
5 1
11,6
69.7
1
,856
.6
71,
979.
2 N
ovem
ber
2,4
80.0
9
5.4
- -
- -
- 7
,677
.3
235
.4
940
.6
9,0
22.8
1
26,0
45.1
2
,000
.0
77,
465.
1 D
ecem
ber
505
.1
44.
1 -
- -
1.1
-
8,4
32.8
2
,050
.5
962
.1
11,
415.
5 1
04,5
64.2
1
,563
.9
85,
231.
8 Q
tr II
4,6
15.6
2
17.3
-
- -
2.3
-
24,
014.
4 2
,617
.1
2,8
22.9
3
2,05
0.7
342
,279
.0
5,4
20.5
2
34,6
76.1

National Bank of Ethiopia Quarterly Bulletin
136 | Second Quarter 2020/21
Tabl
e 25
: Val
ue o
f Exp
orts
, by
Maj
or C
omm
odity
Gro
ups
(In
Thou
sand
s o
f Birr
)Pe
riod
Cof
fee
Oil S
eed
sLe
athe
r and
Le
athe
r pro
duct
sPu
lses
Mea
t & M
eat
Prod
ts.
Frui
ts &
Veg
e-ta
bles
Suga
rG
old
Oil C
akes
Live
Ani
mal
sC
hat
Petro
l. &
Pet
. Pr
dts
Bees
Wax
Tant
alem
Cot
ton
Text
. & T
ext.
Prd
ts20
19/2
0Ju
ly 2
,335
,735
.5
556
,373
.9
231
,268
.1
454
,974
.7
193
,022
.0
187
,902
.6
- 7
6,26
9.0
444
,240
.5
823
,678
.8
- 2
,807
.9
2,9
26.3
-
474
,513
.6
Aug
ust
2,5
37,4
04.9
6
06,2
26.6
2
51,6
81.2
5
29,4
94.9
2
12,7
85.3
1
69,2
36.9
1
1,74
9.7
79,
223.
3 8
9,06
3.3
1,0
66,9
55.7
-
8,5
80.5
1
5,47
2.7
- 6
31,1
80.0
Se
ptem
ber
1,8
77,2
99.0
4
05,4
70.7
2
03,3
59.7
4
32,0
24.0
1
32,2
65.3
1
19,0
42.3
5
,865
.2
23,
106.
2 1
68,7
55.1
8
00,5
09.5
-
4,4
20.3
5
,309
.5
- 4
02,2
91.8
Q
tr I
6,7
50,4
39.4
1
,568
,071
.1
686
,309
.1
1,4
16,4
93.6
5
38,0
72.5
4
76,1
81.9
1
7,61
4.9
178
,598
.5
- 7
02,0
58.9
2
,691
,144
.0
- 1
5,80
8.7
23,
708.
4 -
1,5
07,9
85.5
O
ctob
er 1
,536
,881
.0
308
,421
.5
308
,898
.0
540
,447
.6
137
,064
.6
133
,643
.7
18.
7 2
0,35
2.1
82,
584.
1 7
99,6
30.7
-
11,
751.
1 1
8,92
0.6
- 4
39,1
85.5
N
oveb
er
1,4
00,9
17.9
5
30,1
30.2
2
24,7
87.2
4
49,7
56.1
1
57,9
64.5
1
55,1
29.6
3
7.6
47,
057.
7 9
6,47
6.7
792
,187
.3
- -
10,
781.
5 -
464
,877
.8
Dec
embe
r 1
,068
,276
.9
785
,180
.7
217
,454
.5
516
,776
.3
193
,409
.9
168
,821
.5
6,2
86.9
1
60,7
76.9
7
6,63
8.0
862
,699
.7
- -
1,1
35.6
-
468
,999
.1
Qtr
II 4
,006
,075
.8
1,6
23,7
32.5
7
51,1
39.6
1
,506
,980
.0
488
,439
.0
457
,594
.8
6,3
43.2
2
28,1
86.8
-
255
,698
.8
2,4
54,5
17.7
-
11,
751.
1 3
0,83
7.7
- 1
,373
,062
.4
Janu
ary
1,3
73,6
38.4
1
,357
,089
.8
174
,965
.1
561
,881
.1
198
,412
.1
137
,677
.5
6,9
14.0
1
03,5
54.6
9
9,35
1.2
885
,016
.0
- 5
,792
.1
4,4
11.0
-
479
,260
.2
Febr
uary
1,8
46,5
11.5
1
,135
,973
.5
142
,044
.5
789
,643
.7
211
,893
.2
158
,732
.6
6,9
45.9
2
7,58
7.6
121
,131
.8
937
,855
.4
- -
18,
005.
4 -
458
,032
.3
Mar
ch 3
,156
,164
.0
1,6
53,1
60.3
1
57,3
25.1
7
78,6
44.3
1
55,1
02.0
1
66,6
04.1
2
6.8
307
,354
.9
53,
521.
8 8
24,7
81.2
-
3,9
88.2
1
6,79
2.7
- 4
17,7
05.0
Q
tr III
6,3
76,3
13.9
4
,146
,223
.6
474
,334
.7
2,1
30,1
69.1
5
65,4
07.2
4
63,0
14.2
1
3,88
6.7
438
,497
.1
- 2
74,0
04.9
2
,647
,652
.6
- 9
,780
.3
39,
209.
0 -
1,3
54,9
97.5
A
pril
3,4
54,8
03.1
1
,713
,003
.3
65,
317.
2 8
48,3
81.1
1
80,6
12.4
1
60,0
79.2
6
.0
2,0
99,7
38.1
1
20,7
72.2
6
03,9
98.8
-
5,0
71.7
2
5,97
7.0
4,0
73.7
2
94,1
65.3
M
ay 3
,312
,947
.4
1,2
96,7
88.7
1
04,9
17.8
9
28,4
81.5
1
99,5
56.3
1
79,4
99.9
7
,238
.7
1,8
52,3
05.0
1
48,9
26.5
8
68,1
50.6
-
19,
050.
1 2
,184
.4
4,1
45.1
3
53,9
87.0
Ju
ne 3
,143
,730
.9
665
,163
.7
126
,372
.8
592
,390
.3
134
,946
.5
98,
425.
4 -
1,7
75,3
13.9
1
69,6
15.4
8
50,7
07.2
-
4,1
93.7
3
3,57
4.1
- 3
51,1
38.4
Q
tr IV
9,9
11,4
81.4
3
,674
,955
.8
296
,607
.9
2,3
69,2
53.0
5
15,1
15.2
4
38,0
04.5
7
,244
.7
5,7
27,3
57.0
-
439
,314
.1
2,3
22,8
56.6
-
28,
315.
5 6
1,73
5.4
8,2
18.7
9
99,2
90.6
20
20/2
1Ju
ly 2
,253
,111
.2
501
,603
.4
120
,006
.3
469
,340
.2
207
,566
.3
148
,956
.2
7,5
23.7
2
,512
,614
.9
189
,967
.1
860
,893
.1
- 8
,073
.1
16,
381.
1 -
539
,007
.9
Aug
ust
2,5
99,6
53.0
7
59,9
98.3
1
10,0
43.4
6
35,3
76.1
1
82,8
34.0
1
57,5
95.2
-
2,5
50,5
84.7
1
25,7
57.0
1
,280
,546
.4
- 5
,270
.0
3,0
46.7
-
561
,836
.8
Sept
embe
r 1
,765
,567
.8
819
,729
.3
101
,448
.2
567
,801
.2
180
,492
.7
167
,145
.6
23.
0 2
,201
,827
.9
126
,741
.1
1,2
52,6
66.5
-
- 1
8,44
0.6
- 3
78,4
30.7
Q
tr I
6,6
18,3
32.1
2
,081
,331
.0
331
,497
.9
1,6
72,5
17.6
5
70,8
93.0
4
73,6
97.0
7
,546
.7
7,2
65,0
27.5
-
442
,465
.2
3,3
94,1
06.0
-
13,
343.
0 3
7,86
8.3
- 1
,479
,275
.5
Oct
ober
1,7
06,3
48.8
7
33,0
48.4
1
04,2
87.7
4
32,9
39.3
1
98,1
24.9
1
76,1
26.6
2
5.1
2,3
01,3
88.5
1
39,8
58.7
1
,292
,886
.6
- 3
,856
.4
19,
159.
2 -
427
,966
.8
Nov
eber
1
,663
,102
.0
1,0
53,7
69.7
1
03,4
75.9
4
50,2
35.5
2
17,7
78.1
1
99,3
59.0
1
6.8
1,5
41,8
11.5
7
4,94
7.9
1,0
53,3
95.4
-
9,8
98.4
5
56.4
-
464
,750
.0
Dec
embe
r 1
,171
,927
.9
1,8
51,8
95.2
1
16,4
37.7
5
69,5
48.7
2
04,9
02.6
1
83,0
11.7
1
64.1
1
,147
,517
.8
111
,853
.4
1,1
72,5
24.7
-
- 1
0,99
2.7
- 3
91,8
96.4
Q
tr II
4,5
41,3
78.8
3
,638
,713
.3
324
,201
.3
1,4
52,7
23.6
6
20,8
05.6
5
58,4
97.3
2
06.0
4
,990
,717
.8
- 3
26,6
60.1
3
,518
,806
.6
- 1
3,75
4.8
30,
708.
3 -
1,2
84,6
13.2
So
urce
: Eth
iopi
an M
inist
ry o
f Rev
enue
s, Et
hiop
ian
Elec
tric
Pow
er (E
EP) a
nd E
thio
pian
Ele
ctric
Util
ity (E
EU)
Tabl
e 25
(con
tinue
d):
Perio
dC
erea
ls an
d
Flou
rN
atur
al G
umC
ivet
Hop
Ani
mal
Fod
der
Nat
ural
Hon
eyM
arbl
eFl
ower
Beve
rage
Spic
esO
ther
sEl
ectri
city
Oth
ers*
Re-E
xpor
tsG
rand
Tot
al20
19/2
0Ju
ly 3
,070
.9
2,5
36.5
-
- -
150
.4
- 1
,040
,559
.7
7,7
38.0
4
5,86
8.2
327
,599
.5
96,
778.
7 2
,001
,741
.7
7,3
08,0
14.8
A
ugus
t 8
,431
.1
25,
456.
6 -
- -
808
.6
- 1
,276
,629
.9
9,3
88.0
3
9,42
1.6
130
,777
.6
97,
122.
5 2
,234
,688
.6
7,7
97,0
90.8
Se
ptem
ber
7,8
73.3
3
7,29
8.2
- -
- 5
2.1
- 1
,040
,802
.3
3,1
56.2
4
0,96
6.6
111
,947
.3
103
,629
.0
1,7
53,3
26.5
5
,925
,443
.8
Qtr
I 1
9,37
5.3
65,
291.
3 -
- -
1,0
11.1
-
3,3
57,9
92.0
2
0,28
2.2
126
,256
.4
570
,324
.4
297
,530
.2
5,9
89,7
56.8
2
1,03
0,54
9.4
Oct
ober
2,9
22.7
1
5,95
9.5
- -
- 2
,748
.8
- 1
,058
,003
.6
11,
833.
9 3
3,45
2.2
103
,956
.4
104
,082
.7
1,7
91,0
65.8
5
,670
,758
.9
Nov
eber
3
,427
.1
12,
459.
4 -
- -
511
.9
- 1
,011
,305
.7
7,0
97.6
3
5,06
8.4
116
,024
.9
170
,847
.2
1,8
32,4
01.3
5
,686
,846
.2
Dec
embe
r 2
,626
.5
9,0
51.9
-
- -
496
.4
- 6
82,4
64.3
1
0,85
3.5
39,
668.
5 2
12,9
55.5
1
86,9
40.8
1
,615
,192
.2
5,6
71,5
13.4
Q
tr II
8,9
76.3
3
7,47
0.7
- -
- 3
,757
.1
- 2
,751
,773
.7
29,
785.
0 1
08,1
89.0
4
32,9
36.8
4
61,8
70.7
5
,238
,659
.3
17,
029,
118.
6 Ja
nuar
y 5
,208
.4
17,
942.
7 -
- -
580
.9
- 1
,503
,717
.8
5,4
44.7
2
4,52
0.9
536
,368
.6
175
,270
.2
2,7
52,7
25.4
7
,657
,017
.2
Febr
uary
16,
423.
6 3
,479
.8
- -
- 7
,717
.4
- 1
,330
,636
.5
10,
314.
4 2
6,98
5.2
199
,008
.0
182
,057
.2
2,2
52,6
59.7
7
,630
,979
.4
Mar
ch 7
,756
.2
4,8
25.3
-
- -
2,8
07.6
-
806
,762
.4
12,
089.
9 3
9,19
3.5
357
,947
.2
208
,286
.1
1,8
74,1
65.8
9
,130
,838
.5
Qtr
III 2
9,38
8.3
26,
247.
9 -
- -
11,
105.
9 -
3,6
41,1
16.6
2
7,84
8.9
90,
699.
6 1
,093
,323
.7
565
,613
.4
6,8
79,5
50.9
2
4,41
8,83
5.1
Apr
il 1
1,79
6.4
15,
541.
9 -
- -
- -
965
,333
.8
8,5
00.9
2
6,64
8.4
223
,045
.3
216
,680
.3
1,7
91,7
62.9
1
1,04
3,54
6.1
May
24,
347.
0 1
0,89
6.7
- -
- -
- 1
,207
,175
.9
12,
315.
8 2
3,70
6.3
164
,653
.2
247
,619
.8
2,0
51,0
31.2
1
0,96
8,89
3.8
June
23,
558.
3 2
,390
.2
- -
- 5
65.2
-
1,2
85,0
87.4
1
2,66
5.7
57,
208.
2 2
15,4
09.7
3
31,7
38.3
2
,313
,335
.4
9,8
74,1
95.2
Q
tr IV
59,
701.
8 2
8,82
8.8
- -
- 5
65.2
-
3,4
57,5
97.0
3
3,48
2.3
107
,563
.0
603
,108
.1
796
,038
.4
6,1
56,1
29.5
3
1,88
6,63
5.1
2020
/21
July
25,
453.
9 5
,442
.6
- -
- 2
84.3
-
1,1
73,3
01.1
1
1,70
7.5
37,
510.
4 2
30,6
21.6
3
43,4
93.4
2
,383
,203
.7
9,6
62,8
59.1
A
ugus
t 2
9,51
3.6
15,
560.
7 -
- -
13.
3 -
1,2
01,3
39.5
3
0,78
8.5
43,
301.
2 2
64,9
71.2
3
17,5
39.7
2
,467
,911
.2
10,
875,
569.
3 Se
ptem
ber
30,
898.
2 7
,326
.3
- -
- 2
16.6
-
1,2
92,5
27.3
1
0,91
7.4
35,
117.
1 1
83,4
06.1
1
67,7
96.9
2
,125
,077
.1
9,3
08,5
20.6
Q
tr I
85,
865.
7 2
8,32
9.5
- -
- 5
14.2
-
3,6
67,1
67.9
5
3,41
3.4
115
,928
.7
678
,998
.9
828
,830
.0
6,9
76,1
92.0
2
9,84
6,94
9.0
Oct
ober
50,
788.
7 1
7,42
3.7
- -
- 1
69.1
-
1,3
30,9
28.7
1
1,36
0.5
42,
073.
6 2
94,5
00.7
2
26,3
47.9
2
,420
,718
.8
9,5
09,6
09.9
N
oveb
er
62,
380.
9 1
8,89
7.7
- -
- -
- 1
,327
,112
.8
9,3
54.3
3
8,59
6.1
222
,305
.6
265
,542
.6
2,4
09,4
96.4
8
,777
,286
.6
Dec
embe
r 2
9,64
7.0
5,5
78.3
-
- -
255
.6
- 1
,545
,105
.6
37,
594.
3 4
9,84
0.4
217
,095
.9
230
,389
.9
2,5
18,3
96.1
9
,048
,179
.8
Qtr
II 1
42,8
16.5
4
1,89
9.7
- -
- 4
24.7
-
4,2
03,1
47.1
5
8,30
9.1
130
,510
.0
733
,902
.2
722
,280
.4
7,3
48,6
11.2
2
7,33
5,07
6.3
Sour
ce: E
thio
pian
Min
istry
of R
even
ues,
Ethi
opia
n El
ectri
c Po
wer
(EEP
) and
Eth
iopi
an E
lect
ric U
tility
(EEU
)

| 137
Tabl
e 26
: Val
ue o
f Im
ports
, by
Maj
or C
omm
odity
Gro
ups*
*(In
000
birr
)
Perio
dFo
od &
Liv
e A
nim
als
Beve
rage
sTo
bacc
oPe
trole
um C
rud
ePe
trole
um
Prod
.***
*C
hem
ical
sFe
rtiliz
ers
Med
ical
&
Phar
m. P
rod
Soap
& P
olish
Rubb
er P
rod
.Pa
per &
Pap
er
Man
fc.
2019
/20
July
597
,447
.96
86,
879.
22
13,
833.
57
- 6
,017
,918
.91
465
,806
.84
926
,244
.79
172
,887
.39
436
,159
.09
711
,181
.12
339
,264
.90
Aug
ust
3,5
84,4
64.5
1 5
4,79
2.82
8
,191
.86
- 5
,939
,930
.79
593
,011
.17
1,1
39,2
72.0
6 4
7,92
1.62
3
80,9
16.3
8 7
49,9
58.7
1 2
90,9
97.7
9 Se
ptem
ber
4,9
04,8
28.5
9 6
2,58
9.42
7
,017
.06
- 4
,742
,083
.72
420
,246
.83
1,5
16,6
37.0
4 4
6,96
2.64
4
57,2
79.4
5 5
77,3
48.9
6 4
12,5
87.8
5 Q
tr I
9,0
86,7
41
204
,261
2
9,04
2 -
16,
699,
933
1,4
79,0
65
3,5
82,1
54
267
,772
1
,274
,355
2
,038
,489
1
,042
,851
O
ctob
er 2
,843
,810
.90
73,
460.
34
12,
409.
34
193
.70
5,8
50,5
87.3
0 6
67,9
33.2
6 1
,533
,505
.12
527
,158
.80
341
,838
.96
748
,039
.48
465
,740
.94
Nov
embe
r 2
,663
,218
.36
72,
958.
16
5,4
24.4
8 6
3.53
5
,123
,894
.95
456
,005
.45
828
,753
.76
174
,181
.09
360
,461
.08
725
,607
.30
308
,070
.39
Dec
embe
r 1
,565
,174
.47
112
,907
.25
14,
286.
81
- 7
,641
,872
.02
667
,282
.42
1,4
04,0
11.4
5 2
72,1
26.0
9 5
81,6
64.7
4 7
11,7
46.3
7 5
05,0
02.1
5 Q
II 7
,072
,204
2
59,3
26
32,
121
257
1
8,61
6,35
4 1
,791
,221
3
,766
,270
9
73,4
66
1,2
83,9
65
2,1
85,3
93
1,2
78,8
13
Janu
ary
2,4
95,8
27.5
6 9
7,15
6.75
9
,277
.41
- 6
,487
,817
.69
597
,585
.70
876
,139
.59
659
,365
.67
521
,293
.15
1,2
07,4
54.7
4 4
04,5
70.1
9 Fe
brua
ry 2
,151
,699
.31
51,
331.
09
17,
902.
24
1,7
06.7
3 6
,337
,408
.03
408
,095
.30
690
,157
.41
397
,216
.12
357
,411
.36
999
,294
.49
375
,661
.68
Mar
ch 3
,881
,288
.55
84,
152.
51
9,5
05.1
9 -
3,9
26,3
97.8
4 3
97,7
63.4
1 1
,946
,567
.36
319
,672
.93
372
,854
.99
656
,003
.99
327
,587
.01
QIII
8,5
28,8
15
232
,640
3
6,68
5 1
,707
1
6,75
1,62
4 1
,403
,444
3
,512
,864
1
,376
,255
1
,251
,560
2
,862
,753
1
,107
,819
A
pril
1,2
46,2
12.8
1 3
9,30
2.92
4
,300
.72
- 3
,472
,574
.48
253
,222
.71
4,6
84,1
32.2
9 2
26,7
20.7
8 3
01,5
03.9
2 5
56,2
34.2
2 3
15,2
86.4
3 M
ay 3
,340
,209
.98
36,
915.
09
6,5
90.6
7 -
2,0
48,6
52.5
5 4
27,8
27.9
2 4
22,8
97.6
5 5
7,81
0.88
2
30,0
68.1
7 5
79,1
07.4
0 2
21,0
83.5
5 Ju
ne 1
,261
,172
.83
149
,476
.82
5,0
77.6
5 -
4,4
67,7
52.8
1 4
60,3
98.8
2 8
55,0
34.6
3 1
90,2
51.8
9 1
97,8
45.1
1 1
,213
,782
.63
297
,388
.27
QIV
5,8
47,5
96
225
,695
1
5,96
9 -
9,9
88,9
80
1,1
41,4
49
5,9
62,0
65
474
,784
7
29,4
17
2,3
49,1
24
833
,758
20
20/2
1Ju
ly 3
,802
,288
.04
84,
732.
80
17,
565.
38
- 4
,005
,416
.36
615
,364
.65
1,1
59,6
45.6
2 4
01,3
77.3
1 4
09,5
59.5
6 1
,104
,217
.48
242
,986
.67
Aug
ust
3,4
96,8
42.6
8 8
7,96
7.27
1
1,68
1.66
-
5,3
14,8
51.0
2 6
09,0
00.6
1 9
07,3
18.4
8 4
31,2
80.8
3 4
66,2
33.3
7 9
15,9
14.3
8 2
27,1
10.5
7 Se
ptem
ber
1,7
01,7
55.8
3 8
3,05
1.38
1
0,19
0.22
-
3,4
79,7
58.5
8 5
17,0
95.9
7 6
45,4
56.6
0 1
84,9
66.6
3 4
76,1
32.3
0 1
,000
,469
.93
268
,285
.98
Qtr
I 9
,000
,887
2
55,7
51
39,
437
- 1
2,80
0,02
6 1
,741
,461
2
,712
,421
1
,017
,625
1
,351
,925
3
,020
,602
7
38,3
83
Oct
ober
4,0
38,3
54
89,
829
22,
764
- 4
,905
,083
4
29,0
02
1,8
98,0
98
452
,818
3
04,8
69
854
,162
2
90,2
30
Nov
embe
r 3
,862
,857
5
6,61
1 7
,827
7
7 3
,972
,926
6
21,1
43
1,1
17,9
56
116
,597
4
06,8
64
721
,981
2
14,9
67
Dec
embe
r 6
,049
,917
1
23,5
41
34,
123
- 5
,857
,930
4
09,4
17
3,6
08,4
92
238
,817
4
76,8
62
867
,410
3
07,7
63
QII
13,
951,
128
269
,982
6
4,71
4 7
7 1
4,73
5,93
9 1
,459
,562
6
,624
,546
8
08,2
32
1,1
88,5
95
2,4
43,5
53
812
,960
Tabl
e 26
con
tinue
d:
Perio
dTe
xtile
sC
loth
ings
Gla
ss &
Gla
ss
War
eM
etal
& M
etal
M
anfc
.M
achi
nery
&
Airc
raft
Road
Mot
or
Veh
icle
sEl
ectri
cal M
a-te
rials
Gra
in*
Tele
com
m.
App
ara.
Oth
ers
GRA
ND
TO
TAL
2019
/20
July
749
,146
.32
545
,933
.94
404
,214
.30
4,0
49,3
20.5
3 4
,590
,863
.51
2,5
46,5
54.9
7 2
,587
,634
.20
359
,518
.64
57,
047.
88
9,1
97,0
75.8
4 3
4,49
5,41
5.29
A
ugus
t 8
11,2
43.0
9 4
69,4
54.7
3 2
61,0
35.6
1 3
,687
,181
.33
8,6
58,1
98.9
6 1
,021
,729
.13
1,8
71,6
47.9
7 1
29,4
01.8
9 1
60,3
73.9
3 1
0,94
5,79
4.43
4
0,67
6,11
6.89
Se
ptem
ber
725
,471
.32
447
,364
.19
215
,215
.58
3,0
13,1
02.9
0 3
,033
,913
.36
912
,460
.77
1,4
43,0
92.4
7 3
02,7
51.3
7 3
0,77
5.35
1
0,85
2,59
5.23
3
3,82
1,57
2.73
Q
tr I
2,2
85,8
61
1,4
62,7
53
880
,465
1
0,74
9,60
5 1
6,28
2,97
6 4
,480
,745
5
,902
,375
7
91,6
72
248
,197
3
0,99
5,46
5 1
08,9
93,1
05
Oct
ober
793
,202
.83
569
,209
.84
289
,656
.20
5,0
76,4
59.1
2 6
,811
,160
.21
921
,954
.23
2,3
50,8
18.5
1 2
04,7
36.9
7 2
8,33
4.97
8
,636
,876
.91
38,
542,
350.
95
Nov
embe
r 7
43,1
72.8
0 4
25,3
50.3
3 3
12,1
40.7
2 3
,955
,796
.60
8,3
62,0
20.2
0 1
,076
,547
.00
3,4
02,4
93.9
6 5
61,8
46.2
4 4
5,00
1.30
7
,055
,971
.32
36,
097,
132.
78
Dec
embe
r 9
87,5
51.1
3 8
09,3
39.9
7 3
25,0
69.2
7 5
,392
,178
.97
8,0
80,6
30.5
3 6
48,6
74.1
8 2
,631
,484
.76
333
,374
.66
96,
169.
56
8,3
36,6
41.1
1 4
0,78
3,81
3.26
Q
II 2
,523
,927
1
,803
,900
9
26,8
66
14,
424,
435
23,
253,
811
2,6
47,1
75
8,3
84,7
97
1,0
99,9
58
169
,506
2
4,02
9,48
9 1
15,4
23,2
97
Janu
ary
1,0
52,9
73.7
2 6
82,9
63.3
5 3
74,6
70.7
6 4
,198
,127
.88
5,9
01,7
86.0
2 6
29,1
39.0
5 2
,278
,111
.39
238
,443
.17
43,
030.
51
13,
349,
264.
45
41,
866,
555.
59
Febr
uary
829
,649
.68
348
,050
.02
227
,838
.04
6,0
33,8
33.6
9 5
,776
,514
.04
750
,667
.17
2,1
53,3
92.6
4 6
63,2
10.3
2 7
3,44
4.34
1
0,64
5,12
8.17
3
8,62
6,40
1.55
M
arch
787
,121
.46
202
,319
.34
273
,751
.58
4,8
72,3
49.5
3 6
,259
,672
.58
429
,865
.54
1,9
02,4
37.1
6 4
03,2
85.6
0 2
2,99
9.01
9
,598
,834
.16
36,
271,
144.
14
QIII
2,6
69,7
45
1,2
33,3
33
876
,260
1
5,10
4,31
1 1
7,93
7,97
3 1
,809
,672
6
,333
,941
1
,304
,939
1
39,4
74
33,
593,
227
116
,764
,101
A
pril
449
,416
.26
364
,131
.30
154
,464
.66
4,3
09,4
92.9
4 4
,815
,092
.76
135
,928
.90
1,2
15,9
49.4
5 5
24,5
06.9
1 1
8,49
6.08
9
,143
,391
.26
31,
705,
854.
89
May
607
,431
.40
526
,863
.46
212
,646
.49
3,0
56,1
03.3
7 3
,519
,036
.75
179
,510
.46
1,5
52,5
10.3
9 7
67,5
62.3
1 1
4,75
2.16
9
,418
,824
.28
26,
458,
842.
63
June
852
,672
.99
519
,212
.08
225
,669
.52
3,6
64,1
29.4
7 4
,123
,241
.52
244
,792
.15
1,6
12,5
55.5
7 1
85,8
61.9
7 2
0,16
7.63
1
2,48
3,52
8.96
3
2,84
4,15
1.35
Q
IV 1
,909
,521
1
,410
,207
5
92,7
81
11,
029,
726
12,
457,
371
560
,232
4
,381
,015
1
,477
,931
5
3,41
6 3
1,04
5,74
4 9
1,00
8,84
9 20
20/2
1Ju
ly 9
02,5
16
755
,276
2
79,1
86
4,1
08,2
77
3,5
26,8
70
371
,658
3
,041
,143
1
,454
,745
3
9,72
6 1
4,94
7,71
3 3
9,81
5,51
9 A
ugus
t 9
28,9
66
642
,861
2
46,4
72
5,3
38,0
83
4,8
59,4
79
950
,531
2
,048
,972
1
,818
,542
7
6,40
6 1
9,17
8,57
1 4
6,73
8,54
2 Se
ptem
ber
1,1
11,7
45
762
,188
3
32,1
90
4,8
90,6
23
7,8
28,9
73
741
,157
2
,239
,114
2
50,2
57
16,
005
11,
584,
901
37,
874,
060
Qtr
I 2
,943
,227
2
,160
,325
8
57,8
48
14,
336,
983
16,
215,
322
2,0
63,3
47
7,3
29,2
28
3,5
23,5
44
132
,138
4
5,71
1,18
4 1
24,4
28,1
21
Oct
ober
1,3
21,9
64
589
,154
1
73,3
26
4,5
54,6
25
6,4
49,0
41
398
,497
3
,367
,306
1
06,6
63
83,
874
10,
744,
643
40,
967,
641
Nov
embe
r 1
,494
,627
8
34,0
05
253
,584
4
,454
,309
4
,654
,116
2
89,9
03
2,3
91,4
31
663
,282
1
9,76
8 1
3,55
4,92
1 3
9,04
6,47
0 D
ecem
ber
1,2
54,2
36
1,0
12,0
17
245
,716
4
,501
,654
5
,678
,288
4
21,9
50
3,6
61,5
02
2,6
72,6
40
170
,981
1
0,91
4,80
4 4
5,83
5,42
0 Q
II 4
,070
,828
2
,435
,175
6
72,6
27
13,
510,
588
16,
781,
444
1,1
10,3
50
9,4
20,2
39
3,4
42,5
85
274
,624
3
5,21
4,36
8 1
25,8
49,5
31
Sour
ce: E
thio
pian
Rev
enue
s and
Cus
tom
s Aut
horit
y*
Dat
a on
impo
rt of
pet
role
um p
rod
ucts
are
obt
aine
d fr
om E
thio
pian
Pet
role
um E
nter
prise
**
All t
he d
ata
are
upd
ated
bas
ed o
n re
vise
d d
ata
from
the
Ethi
opia
n Re
venu
es a
nd C
usto
ms A
utho
rity

National Bank of Ethiopia Quarterly Bulletin
138 | Second Quarter 2020/21
Tabl
e 27
: Vol
ume
of Im
ports
, by
Maj
or C
omm
odity
Gro
ups*
*(In
Met
ric T
ons)
Perio
dFo
od &
Liv
e A
nim
als
Beve
rage
sTo
bacc
oPe
trole
um
Cru
de
Petro
leum
Pr
od.*
***
Che
mic
als
Ferti
lizer
sM
edic
al &
Ph
arm
. Pro
dSo
ap &
Pol
ishRu
bber
Pro
d.
2019
/20
July
68,
497.
0 2
,399
.8
204
.4
- 3
30,0
84.4
1
7,27
0.5
2,3
04.3
1
01.7
9
,759
.5
8,7
73.2
A
ugus
t 3
89,9
98.9
1
,278
.0
44.
6 -
416
,968
.0
25,
692.
6 2
,015
.7
128
.9
7,3
95.8
9
,562
.0
Sept
embe
r 4
69,1
70.9
1
,187
.1
45.
0 -
263
,239
.4
17,
795.
9 1
,934
.8
16.
0 1
2,14
1.7
7,8
26.4
Q
tr I
927
,666
.8
4,8
64.8
2
94.0
-
1,0
10,2
91.7
6
0,75
8.9
6,2
54.8
2
46.6
2
9,29
6.9
26,
161.
5 O
ctob
er 2
44,6
95.2
1
,360
.9
100
.0
16.
0 3
25,9
43.9
2
3,84
7.3
2,4
61.5
3
0,09
3.9
5,2
74.7
1
4,13
2.1
Nov
embe
r 2
81,4
55.5
1
,367
.6
67.
0 0
.2
286
,716
.0
16,
188.
4 2
,777
.8
359
.6
9,0
92.3
9
,239
.2
Dec
embe
r 1
34,2
17.0
2
,200
.0
133
.9
- 4
01,0
31.4
5
31,0
88.3
1
,356
.0
75.
6 9
,700
.6
8,2
95.5
Q
II 6
60,3
67.6
4
,928
.5
300
.9
16.
2 1
,013
,691
.3
571
,124
.0
6,5
95.3
3
0,52
9.1
24,
067.
6 3
1,66
6.9
Janu
ary
189
,833
.4
1,6
47.7
6
1.3
- 3
24,4
41.9
1
9,31
1.0
2,0
61.2
1
29.5
7
,958
.6
11,
605.
3 Fe
brua
ry 1
82,6
71.1
9
86.8
1
45.5
3
7.7
346
,615
.1
12,
449.
5 2
,043
.3
531
.5
6,2
94.7
1
0,52
4.9
Mar
ch 2
85,6
91.5
1
,228
.9
74.
2 -
284
,172
.4
14,
288.
7 1
,522
.6
125
.2
6,8
82.3
7
,622
.8
QIII
658
,195
.9
3,8
63.4
2
81.0
3
7.7
955
,229
.4
46,
049.
3 5
,627
.1
786
.2
21,
135.
6 2
9,75
3.0
Apr
il 1
94,5
86.6
7
44.6
2
8.2
- 3
34,9
35.9
1
1,25
1.3
2,9
86.2
1
08.9
3
,814
.3
5,6
71.3
M
ay 1
87,9
68.5
7
53.1
6
0.9
- 2
27,0
20.2
1
5,49
1.7
974
.1
32.
6 3
,727
.1
8,0
97.0
Ju
ne 1
44,7
67.8
1
,671
.5
45.
0 -
326
,027
.5
14,
257.
1 1
,634
.3
63.
0 3
,643
.2
10,
219.
8 Q
IV 5
27,3
22.9
3
,169
.1
134
.1
- 8
87,9
83.6
4
1,00
0.1
5,5
94.6
2
04.5
1
1,18
4.6
23,
988.
1 20
20/2
1Ju
ly 6
08,9
95.1
1
,409
.9
109
.1
- 2
72,6
66.7
2
0,11
7.3
1,1
84.6
7
7.4
6,7
35.6
1
4,09
0.3
Aug
ust
324
,306
.1
1,1
70.3
8
0.1
- 3
57,7
00.9
1
7,37
0.6
1,6
09.2
1
08.1
9
,710
.4
8,6
78.1
Se
ptem
ber
250
,296
.1
1,3
04.2
7
0.4
- 2
48,3
19.6
1
6,69
5.3
1,3
70.5
5
6.4
9,3
05.8
1
0,39
7.5
Qtr
I 1
,183
,597
.3
3,8
84.4
2
59.6
-
878
,687
.3
54,
183.
2 4
,164
.3
242
.0
25,
751.
8 3
3,16
6.0
Oct
ober
288
,296
.6
1,2
44.4
2
41.8
-
344
,425
.7
13,
681.
1 1
,409
.9
110
.6
5,1
77.9
8
,428
.9
Nov
embe
r 3
11,4
44.4
1
,413
.9
31.
1 0
.1
265
,051
.8
16,
107.
7 2
,792
.1
41.
6 6
,721
.3
6,5
94.1
D
ecem
ber
551
,310
.0
2,1
62.2
1
75.3
-
328
,418
.3
9,8
66.6
2
,278
.0
67.
2 7
,870
.3
7,6
48.6
Q
II 1
,151
,051
.0
4,8
20.5
4
48.2
0
.1
937
,895
.8
39,
655.
5 6
,480
.0
219
.4
19,
769.
5 2
2,67
1.6
Tabl
e 27
: con
tinue
d:(In
Met
ric T
ons)
Perio
dTe
xtile
sC
loth
ings
Gla
ss &
Gla
ss
War
eM
etal
& M
etal
M
anfc
.M
achi
nery
&
Airc
raft
Road
Mot
or
Veh
icle
sEl
ectri
cal
Mat
eria
lsG
rain
*Te
leco
mm
. A
ppar
a.O
ther
sG
RAN
D T
OTA
L
2019
/20
July
11,
062.
23
3,1
99.1
4 2
6,69
8.17
1
51,3
21.5
2 2
1,02
5.03
2
7,36
3.34
1
6,57
2.30
5
0,71
0.19
3
4.75
2
69,9
04.8
8 9
78,0
39.6
6 A
ugus
t 1
3,20
7.50
2
,269
.87
15,
207.
75
213
,442
.16
16,
060.
46
16,
439.
95
9,3
55.9
1 6
0,40
9.58
2
2.39
3
18,8
61.6
3 1
,468
,524
.51
Sept
embe
r 1
0,22
5.00
1
,940
.01
10,
541.
99
112
,342
.54
16,
130.
61
5,7
92.1
4 7
,541
.56
33,
083.
26
36.
96
302
,420
.53
1,2
55,7
17.9
9 Q
tr I
34,
495
7,4
09
52,
448
477
,106
5
3,21
6 4
9,59
5 3
3,47
0 1
44,2
03
94
891
,187
3
,702
,282
O
ctob
er 1
1,24
1.89
2
,720
.15
15,
573.
94
220
,258
.25
17,
851.
20
5,9
32.4
3 1
2,46
9.36
4
7,59
9.10
2
7.20
7
76,0
08.6
1 1
,725
,051
.03
Nov
embe
r 1
0,40
0.91
2
,728
.90
16,
106.
41
142
,440
.35
33,
539.
99
7,8
85.8
4 2
1,81
1.73
7
1,59
6.03
7
4.00
2
49,6
68.5
2 1
,103
,546
.12
Dec
embe
r 1
2,72
7.19
3
,109
.78
15,
719.
48
170
,321
.28
22,
448.
07
4,6
35.7
2 9
,538
.88
54,
787.
50
41.
09
230
,033
.13
1,5
72,7
40.3
1 Q
tr II
34,
370
8,5
59
47,
400
533
,020
7
3,83
9 1
8,45
4 4
3,82
0 1
73,9
83
142
1
,255
,710
4
,401
,337
Ja
nuar
y 1
1,66
8.71
2
,780
.06
16,
338.
11
121
,088
.00
17,
520.
49
3,8
90.4
9 1
1,30
0.35
3
0,57
6.85
5
6.62
6
02,6
80.2
9 1
,355
,863
.85
Febr
uary
11,
008.
83
2,1
79.7
9 1
2,69
9.29
1
39,1
01.9
7 2
3,62
1.36
5
,190
.46
10,
672.
37
65,
190.
98
99.
74
523
,073
.93
1,3
00,1
69.7
3 M
arch
8,8
14.0
4 1
,211
.40
12,
252.
41
145
,953
.00
18,
020.
56
2,8
59.7
6 7
,537
.74
43,
240.
33
10.
19
433
,045
.06
1,2
41,6
72.2
9 Q
III 3
1,49
2 6
,171
4
1,29
0 4
06,1
43
59,
162
11,
941
29,
510
139
,008
1
67
1,5
58,7
99
3,8
97,7
06
Apr
il 5
,716
.39
1,6
76.0
9 5
,573
.92
153
,176
.87
8,9
96.8
5 6
32.3
8 3
,992
.70
149
,414
.29
7.9
6 4
90,3
76.4
6 1
,234
,504
.06
May
7,0
80.0
6 1
,798
.89
8,0
64.9
0 8
2,76
7.45
1
2,19
3.91
1
,334
.31
6,1
48.4
6 7
1,72
7.01
1
2.64
3
26,6
40.7
3 8
97,5
57.0
9 Ju
ne 7
,102
.28
1,6
81.2
1 6
,917
.14
90,
911.
28
16,
518.
37
1,2
05.8
0 5
,747
.71
59,
701.
80
7.0
3 1
,283
,200
.87
1,9
23,9
79.9
5 Q
tr IV
19,
899
5,1
56
20,
556
326
,856
3
7,70
9 3
,172
1
5,88
9 2
80,8
43
28
2,1
00,2
18
4,0
56,0
41
2020
/21
July
10,
826.
37
2,6
21.7
5 9
,160
.80
118
,533
.01
14,
243.
50
2,2
60.4
9 1
0,53
3.13
4
95,3
49.8
9 2
4.76
9
97,4
04.3
8 2
,168
,673
.02
Aug
ust
10,
057.
25
2,3
71.7
7 1
0,82
3.69
1
42,6
60.3
7 1
5,88
8.10
7
,458
.31
7,8
12.3
0 1
81,3
65.3
9 2
1.46
9
19,4
17.6
0 1
,844
,270
.47
Sept
embe
r 1
0,99
8.02
2
,778
.36
10,
690.
63
142
,615
.18
20,
431.
99
4,3
36.0
0 7
,067
.45
153
,822
.78
2.9
5 3
96,7
48.5
8 1
,141
,252
.15
Qtr
I 3
1,88
2 7
,772
3
0,67
5 4
03,8
09
50,
564
14,
055
25,
413
830
,538
4
9 2
,313
,571
5
,154
,196
O
ctob
er
11,
179
2,5
23
6,9
05
130
,588
1
8,37
9 2
,711
8
,145
7
2,86
8 2
6 4
51,0
49
2,3
84,5
34
Nov
embe
r 1
1,73
1.59
2
,836
.50
8,0
04.5
5 9
9,65
8.88
1
5,72
4.06
1
,443
.43
6,3
84.3
9 1
49,4
72.4
2 1
5.45
3
07,5
93.5
0 1
,017
,746
.79
Dec
embe
r 1
1,65
1 2
,869
8
,674
9
9,29
4 1
7,13
8 2
,601
1
4,05
4 3
10,8
15
17
391
,283
9
99,0
97
Qtr
II 3
4,56
1.98
8
,228
.81
23,
582.
71
329
,540
.25
51,
241.
08
6,7
55.6
8 2
8,58
3.42
5
33,1
55.3
9 5
8.60
1
,149
,924
.92
4,4
01,3
78.4
7 **
All t
he d
ata
are
upd
ated
bas
ed o
n re
vise
d d
ata
from
the
Ethi
opia
n Re
venu
es a
nd C
usto
ms A
utho
rity

| 139
Tabl
e 28
: Val
ue o
f Im
ports
, bY
End-
Use*
*
(In
Milli
ons o
f Birr
)
Cat
egor
ies
2018
/19
2019
/20
2020
/21
Qtr
IVA
nnua
lQ
tr I
Qtr
IIQ
IIIQ
tr IV
Ann
ual
QI
Qtr
IIRa
w M
ater
ials
863
.31
4,2
33.3
2 1
,246
.52
1,3
28.6
0 1
,258
.09
1,2
37.6
7 5
,070
.88
1,2
47.8
7 1
,503
.14
Sem
i-fini
shed
Goo
ds
21,
454.
84
78,
116.
49
20,
576.
67
21,
285.
22
30,
481.
29
25,
452.
87
97,
796.
04
20,
476.
47
19,
419.
26
Che
mic
als
2,5
72.7
7 1
0,85
8.90
5
,879
.40
3,5
64.7
6 3
,304
.81
3,9
94.3
4 1
6,74
3.30
4
,749
.23
4,0
10.8
9 F
ertil
izers
6,3
77.1
8 1
4,21
9.85
6
57.4
8 2
69.5
7 1
0,78
7.89
7
,802
.05
19,
517.
00
342
.90
957
.89
Tex
tile
Mat
eria
ls 5
84.8
7 2
,276
.95
816
.41
755
.30
1,0
90.5
4 8
23.2
5 3
,485
.51
1,0
60.0
9 1
,420
.73
Oth
ers
11,
920.
01
50,
760.
78
13,
223.
37
16,
695.
59
15,
298.
05
12,
833.
23
58,
050.
24
14,
324.
26
13,
029.
75
Fuel
18,
125.
75
72,
941.
90
17,
268.
47
19,
365.
31
17,
590.
10
10,
461.
60
64,
685.
48
13,
503.
83
15,
332.
03
Cru
de
petro
leum
0.0
1 0
.88
- 0
.26
1.7
1 -
1.9
6 -
0.0
8 P
etro
leum
Pro
duc
ts 1
7,51
1.12
6
9,94
2.60
1
6,69
9.93
1
8,61
6.35
1
6,75
1.62
9
,988
.98
62,
056.
89
12,
800.
03
14,
735.
94
Oth
ers
614
.63
2,9
98.4
1 5
68.5
4 7
48.6
9 8
36.7
7 4
72.6
2 2
,626
.62
703
.80
596
.01
Cap
ital G
ood
s 2
5,49
2.20
1
40,5
70.4
1 2
9,66
8.84
3
9,59
2.26
3
3,22
0.65
2
5,74
8.05
1
28,2
29.8
0 3
4,62
7.81
3
6,50
5.93
T
rans
port
4,8
47.5
2 3
9,81
7.70
4
,017
.79
3,2
79.0
3 3
,169
.64
1,7
82.9
6 1
2,24
9.42
3
,818
.00
2,5
56.7
0
Tyre
s for
Hea
vy V
ehic
les
799
.85
3,1
72.7
3 8
33.1
8 9
39.2
9 1
,218
.87
1,2
00.0
0 4
,191
.33
1,4
86.7
8 1
,093
.71
He
avy
Road
Mot
or V
eh.
3,6
92.1
7 1
1,44
1.56
2
,632
.86
1,3
34.5
5 1
,278
.05
406
.69
5,6
52.1
4 9
98.7
0 8
71.0
5
Airc
raft
293
.68
24,
229.
19
460
.65
884
.88
537
.36
150
.83
2,0
33.7
2 5
28.7
0 4
65.7
0
Oth
ers
61.
82
974
.22
91.
10
120
.30
135
.37
25.
45
372
.22
803
.82
126
.25
Agr
icul
tura
l 3
61.5
0 1
,616
.02
484
.19
933
.41
645
.06
682
.99
2,7
45.6
5 7
48.3
4 1
,671
.41
Ind
ustri
al 2
0,28
3.18
9
9,13
6.69
2
5,16
6.87
3
5,37
9.83
2
9,40
5.95
2
3,28
2.09
1
13,2
34.7
4 3
0,06
1.47
3
2,27
7.81
C
onsu
mer
Goo
ds
30,
336.
96
119
,758
.04
33,
456.
83
31,
708.
67
32,
693.
08
26,
856.
10
124
,714
.69
53,
233.
28
51,
409.
44
Dur
able
s 8
,863
.90
33,
670.
41
8,1
85.5
0 7
,433
.48
7,9
44.0
2 4
,962
.80
28,
525.
81
7,4
29.5
7 7
,687
.61
Ra
dio
& T
.V.
1,1
87.1
6 3
,417
.15
682
.68
768
.96
309
.54
186
.31
1,9
47.4
8 3
36.8
4 5
75.6
3
Tyre
s for
car
s & O
ther
Veh
. 3
73.3
9 1
,511
.83
343
.29
438
.93
508
.47
306
.07
1,5
96.7
6 3
81.7
8 3
95.9
0
Car
s & O
ther
Veh
. 2
,581
.68
9,9
99.3
5 1
,931
.12
1,1
51.7
7 3
13.5
4 5
9.14
3
,455
.56
169
.43
224
.02
O
ther
s 4
,721
.66
18,
742.
09
5,2
28.4
2 5
,073
.83
6,8
12.4
8 4
,411
.28
21,
526.
01
6,5
41.5
3 6
,492
.06
Non
-dur
able
s 2
1,47
3.06
8
6,08
7.63
2
5,27
1.33
2
4,27
5.19
2
4,74
9.06
2
1,89
3.30
9
6,18
8.88
4
5,80
3.71
4
3,72
1.83
Cer
eals
2,8
73.8
5 1
6,73
4.20
8
,375
.00
6,0
79.6
4 7
,056
.97
4,5
43.4
1 2
6,05
5.01
6
,965
.06
12,
425.
55
O
ther
Foo
d 3
,146
.73
15,
642.
11
4,3
41.1
3 4
,872
.30
4,1
36.6
9 3
,388
.37
16,
738.
49
13,
375.
35
8,1
59.7
4
Med
ical
& P
harm
aceu
tical
s 8
,224
.78
21,
133.
74
4,3
63.8
4 4
,985
.29
5,3
15.4
3 6
,692
.12
21,
356.
68
3,9
33.5
8 7
,757
.37
Te
xtile
Fab
rics
3,1
63.3
5 1
1,08
9.57
3
,173
.08
3,4
06.1
8 2
,925
.20
2,7
95.9
8 1
2,30
0.45
4
,546
.57
6,0
22.6
3
Oth
ers
4,0
64.3
5 2
1,48
8.01
5
,018
.28
4,9
31.7
7 5
,314
.78
4,4
73.4
2 1
9,73
8.25
1
6,98
3.15
9
,356
.55
Misc
ella
neou
s 1
,971
.74
7,7
73.9
9 6
,775
.77
2,1
43.2
4 1
,520
.90
1,2
52.5
6 1
1,69
2.47
1
,338
.86
1,6
79.7
4 To
tal I
mpo
rts 9
8,24
4.79
4
23,3
94.1
5 1
08,9
93.1
0 1
15,4
23.3
0 1
16,7
64.1
0 9
1,00
8.85
4
32,1
89.3
5 1
24,4
28.1
2 1
25,8
49.5
3
Sour
ce: E
thio
pian
Rev
enue
s and
Cus
tom
s Aut
horit
y *
Dat
a on
impo
rt of
pet
role
um p
rod
ucts
are
obt
aine
d fr
om E
thio
pian
Pet
role
um E
nter
prise
**
All t
he d
ata
are
upd
ated
bas
ed o
n re
vise
d d
ata
from
the
Ethi
opia
n Re
venu
es a
nd C
usto
ms A
utho
rity

National Bank of Ethiopia Quarterly Bulletin
140 | Second Quarter 2020/21
Tabl
e 29
: N
umbe
r and
Inve
stm
ent C
apita
l of D
omet
ic a
nd F
orei
gn P
roje
cts
App
rove
d by
Sec
tor
(Cap
ital in
Milli
ons o
f Birr
)
Sect
or/S
ub-s
ecto
r
2012
(201
9/20
)20
13(2
020/
21)
QI
QII
QIII
QIV
QI
QII
“No
of
proj
ects
”In
vest
men
t C
apita
l“N
o of
pr
ojec
ts”
Inve
stm
ent
Cap
ital
“No
of
proj
ects
”“I
nves
t-m
ent
Cap
ital”
“No
of
proj
ects
”“I
nves
t-m
ent
Cap
ital”
“No
of
proj
ects
”“I
nves
t-m
ent
Cap
ital”
“No
of
proj
ects
”“I
nves
t-m
ent
Cap
ital”
Man
ufac
turin
g5.
040
.32
19.9
1117
3.9
14.
51
133
Agr
icul
ture
, hun
ting
and
fore
stry
110
.5
Real
est
ate,
rent
ing
and
bus
ines
s act
iviti
es2
162
23.9
233
.91
1.6
320
314
.904
Hote
ls an
d re
stau
rant
s
Educ
atio
n 1
2.5
Heal
th a
nd so
cial
wor
k2
302
318
Con
stru
ctio
n2
4.4
549
.91
3.6
513
.49
41.1
7
Who
lesa
le, r
etai
l tra
de
and
repa
ir se
rvic
e
Tran
spor
t, st
orag
e an
d c
omm
unic
atio
n 1
6.0
111
.92
20.7
6
Min
ing
and
Qua
rryin
g
Elec
trici
ty, g
as, s
team
and
wat
er su
pply
Con
stru
ctio
n m
achi
nery
leas
ing
Fish
ing
“Oth
er c
omm
unity
, soc
ial
and
per
sona
l ser
vice
act
iviti
es”
Oth
ers
19.
61
1759
.74
113
.615
Gra
nd T
otal
9.0
60.7
1099
.77
361.
022
219.
916
1846
.17
5.00
161.
52So
urce
: Eth
iopi
a In
vest
men
t Age
ncy
*Pr
ojec
ts w
ith In
itial
Inve
stm
ent C
apita
l bel
ow B
irr
250,
000
are
not i
nclu
ded
.

| 141
Tabl
e 31
: Ex
pect
ed E
mpl
oym
ent C
reat
ion
of A
ppro
ved
Dom
estic
$ F
orei
gn In
vest
men
t Pro
ject
s by
Sec
tor[P
ERM
AN
ENT &
TEM
PORA
RY]
Sect
or/S
ub-s
ecto
r
2012
(201
9/20
)20
13(2
020/
21)
QI
QII
QIII
QIV
QI
QII
“Per
m.
Em
p.”
“Tem
po.
Em
p.”
“Per
m.
Em
p.”
“Tem
po.
Em
p.”
“Per
m.
Em
p.”
“Tem
po.
Em
p.”
“Per
m.
Em
p.”
“Tem
po.
Em
p.”
“Per
m.
Em
p.”
“Tem
po.
Em
p.”
“Per
m.
Em
p.”
“Tem
po.
Em
p.”
Man
ufac
turin
g39
4135
950
025
2152
Agr
icul
ture
, hun
ting
and
fore
stry
35
Real
est
ate,
rent
ing
and
bus
ines
s act
iviti
es12
2012
200
470
Hote
ls an
d re
stau
rant
s
Educ
atio
n 2
2
Heal
th a
nd so
cial
wor
k6
6
Con
stru
ctio
n12
160
21
82
Who
lesa
le, r
etai
l tra
de
and
repa
ir se
rvic
e
Tran
spor
t, st
orag
e an
d c
omm
unic
atio
n 4
117
33
Min
ing
and
Qua
rryin
g
Elec
trici
ty, g
as, s
team
and
wat
er su
pply
Con
stru
ctio
n m
achi
nery
leas
ing
Fish
ing
“Oth
er c
omm
unity
, soc
ial
and
per
sona
l ser
vice
act
iviti
es”
Oth
ers
275
32
3
Gra
nd T
otal
5161
387
660
146
644
3636
225
547
0
Sour
ce: E
thio
pia
Inve
stm
ent A
genc
y
*
Proj
ects
with
Initi
al In
vest
men
t Cap
ital
b
elow
Birr
250
,000
are
not
incl
uded
.

Currency and Time
Currency Currency Unit: Birr (Br) Exchange Rate: Look at Page 60
Time
** There is a difference of about 73/4 Years between Gregorian and Ethiopian Calendar
Fisical Year: July 8th to July 7th
Coffee Year: October to SeptemberCalendar Year: September 11 to September 10
58

Currency and Time
Currency Currency Unit: Birr (Br) Exchange Rate: Look at Page 60
Time
** There is a difference of about 73/4 Years between Gregorian and Ethiopian Calendar
Fisical Year: July 8th to July 7th
Coffee Year: October to SeptemberCalendar Year: September 11 to September 10


![B C 7 - MLITÔ C C Ø ÷ 7 ÷ d\Ù\ « 7 d]A U]! >Ì >Ì >Ì >Ì >Ì >Ì >Ì >Ì >Ì >Ì >Ì >Ì >Ì >Ì >Ì >Ì >Ì >Ì >Ì >Ì Õ U U ¯ É ` \Ø Ò 7 d\Ø C Ø ÷ 7 ÷ d\Õ Ì\Ã\õ](https://static.documents.pub/doc/80x56/5e94700e9947b344802ace31/b-c-7-c-c-7-d-7-da-u-oe-oe-oe-oe-oe.jpg)

![2019 Study Schedule Workfile · 2018. 12. 23. · î W ì ì r î X ï ì u î W ï ì r ï W ì ì u ï W ì ì r ï W ï ì u ï W ï ì r ð W ì ì u W µ i D ] ] } v ] } µ ^](https://static.documents.pub/doc/80x56/60b29117a77734443e07c109/2019-study-schedule-workfile-2018-12-23-w-r-x-u-w-.jpg)

!['ZKD < U í õ o ] î ì î ì · î õ í ìdhD/BKt/ ^ Ç o Á ] < î ì Z > ò ð r^dK ð ò ì ñ ì ì õ ò ì X ì ì ï ñ í ì< D Z < t } v ] l < î ì](https://static.documents.pub/doc/80x56/5f67527405909476d76ae24d/zkd-u-o-dhdbkt-o-z-.jpg)


![VCE presentation bis [modalità compatibilità ]...ì ñ ì ì í ì ì ì í ñ ì ì î ì ì ì î ñ ì ì ï ì ì ì ï ñ ì ì ð ì ì ì ð ñ ì ì ñ ì ì ì ì ñ ì](https://static.documents.pub/doc/80x56/5e378739bcb7c064f14877d2/vce-presentation-bis-modalitf-compatibilitf-.jpg)
![2( q>0>+>6>&>/>' H Ì0Û oH >Ì ] ¦ >Ì >Ì Ì0Û o N L = i1 Â2( q>Ì >Ì2( q>0>+>6>&>/>' >Ì ] >Ì >Ì >Ì Ì0Û o N L = i1 Â2( q>Ì >Ì ³ 7 ]%$3 ] 5 >Ì >Ì >Ì ¹ BH H º Ø>Ì](https://static.documents.pub/doc/80x56/600feefac6099e3de479f008/2-q06-h-oe0-oh-oe-oe-oe-oe0.jpg)
![Commission Disclosure Complete List Final- July 2020 · < } l > ] µ ] & µ v ì X ì õ 9 ì X ì ì 9 < } l D } v Ç D l ^ Z u ì X ì ô 9 ì X ì ì 9](https://static.documents.pub/doc/80x56/5fa4adef733b164c8f7ffad5/commission-disclosure-complete-list-final-july-2020-l-.jpg)

