D.4.3 Implications of mitigation portfolios based on stakeholder preferences i TRANSITIONS PATHWAYS AND RISK ANALYSIS FOR CLIMATE CHANGE MITIGATION AND ADAPTATION STRATEGIES D4.3: Implications of different mitigation portfolios based on stakeholder preferences Project Coordinator: SPRU, Science Policy Research Unit, (UoS) University of Sussex Work Package 4; Leader Organization: BC3 Contributing authors: Cristina Pizarro-Irizar, Mikel González-Eguino, Iñaki Arto, Jon Sampedro, Dirk van de Ven. February 2017
Transcript
D.4.3 Implications of mitigation portfolios based on stakeholder preferences
i
TRANSITIONS PATHWAYS AND RISK ANALYSIS FOR CLIMATE
CHANGE MITIGATION AND ADAPTATION STRATEGIES
D4.3: Implications of different mitigation portfolios
based on stakeholder preferences
Project Coordinator: SPRU, Science Policy Research Unit, (UoS) University of Sussex
Work Package 4; Leader Organization: BC3
Contributing authors: Cristina Pizarro-Irizar, Mikel González-Eguino, Iñaki Arto, Jon Sampedro,
Dirk van de Ven.
February 2017
D.4.3 Implications of mitigation portfolios based on stakeholder preferences
ii
TRANSrisk
Transitions pathways and risk analysis for climate
change mitigation and adaptation strategies
GA#: 642260
Funding type: RIA
Deliverable number
(relative in WP) D4.3
Deliverable name: Implications of different mitigation portfolios based on stakeholder preferences
WP / WP number: WP4
Delivery due date: February 2017
Actual date of submission:
Dissemination level:
Lead beneficiary: BC3
Responsible scientist/administrator: Mikel González-Eguino
Estimated effort (PM): 16
Contributor(s): BC3 (Cristina Pizarro-Irizar, Mikel González-Eguino, Iñaki Arto, Jon Sampedro, Dirk van de Ven)
Figure 2: Energy mix [%] for different global temperature targets .................................... 21
Figure 3: Electricity mix [%] for different global temperature targets ................................ 23
Figure 4: Evolution of global CO2 emissions in the energy sector [MtC] for different global
temperature targets .......................................................................................... 25
Figure 5: Evolution of CO2 emissions in the energy sector [MtC] by region under a 2ºC global
temperature target ........................................................................................... 26
Figure 6: CO2 emissions evolution [MtC/yr] by sector for different global temperature targets .. 29
Figure 7: Mitigation costs for different global temperature targets ................................... 30
Figure 8: Mitigation costs [billion 1990USD] and cumulative CO2 emissions [GtC] for different
global temperature targets .................................................................................. 32
Figure 9: Evolution of CO2 emissions in the energy sector [MtC] under different socioeconomic
scenarios: GCAM reference vs. SSP2 ........................................................................ 63
Tables
Table 1. Scenario implementation in GCAM based on stakeholder preferences ..................... 17
Table 2. Definition of technology characteristics ........................................................ 18
Table 3. Share of global mitigation costs over GDP [%] ................................................. 31
D.4.3 Implications of mitigation portfolios based on stakeholder preferences
7
1 EC SUMMARY REQUIREMENTS
1.1 Changes with respect to the DoA
No fundamental changes to the DoA.
1.2 Dissemination and uptake
This document cannot be made public without the permission of the authors until some parts are
published or until the end of the project.
1.3 Short Summary of results (<250 words)
This report shows that the interaction between stakeholders and scientists/modellers can play
an important role in creating options and improving decision making in climate policy.
Stakeholders were asked about their preferences on technology options towards a low carbon
future and different scenarios. Their inputs were implemented using the Global Change
Assessment Model (GCAM), implemented by the Basque Centre for Climate Change (BC3).
Simulations showed that some of the preferred mitigation options towards a 1.5ºC temperature
stabilisation target are not feasible, i.e. renewable energy sources and CCS. Furthermore,
bioenergy proves to be an essential technology for both the 2ºC and the 1.5ºC targets. The
timing of emissions reductions is also related to the available technology portfolios. In
particular, if technologies able to capture carbon (CCS) are not available it will be very difficult
to achieve the 1.5ºC limit, whilst for a 2ºC target efforts to limit emissions would need to start
before 2020. Finally, a second stakeholder approach to validate their preferences has been
carried out.
1.4 Evidence of accomplishment
This Deliverable.
D.4.3 Implications of mitigation portfolios based on stakeholder preferences
8
2 INTRODUCTION
The Intergovernmental Panel on Climate Change (IPCC) has already stated that human influence
on the climate system is clear. Observed impacts of climate change are “widespread and
consequential”, but future effects still largely depend on current actions worldwide to reduce
emissions (IPCC, 2014). Defining feasible and cost-effective low-emission pathways therefore
becomes crucial, in order to avoid the most severe impacts of global warming. In this context,
scenario-based model projections play an important role in evaluating different mitigation
options.
Scenarios are commonly used to facilitate short and long-term decisions associated with climate
change, given the uncertainty in the underlying environmental, social, political, economic and
technological factors. According to the IPCC definition, “a scenario is a coherent, internally
consistent and plausible description of a possible future state of the world. It is not a forecast;
rather, each scenario is one alternative image of how the future can unfold” (IPCC, 2013a).
Scenarios can be defined with both quantitative and qualitative information; however, scenarios
alone do not provide enough information about future pathways, as climate analysis involves
pure quantitative methods requiring precise numerical data. Models (pure quantitative tools) are
then used as an instrument to develop the climate scenarios, in combination with qualitative
tools. Qualitative information is thus relevant for policy analysis, since human behaviour is
important for policy definition and implementation.
The purpose of this report is to use scenarios as a tool to assess options for decision making on
climate policy. However, considering that the development of scenarios involves rational
analysis (while considering bounded rationality) and subjective judgment, this process requires
the use of interactive and participatory methods with engagement of stakeholders (Mietzner and
Reger, 2005, Verdolini et al 2016). In fact, as already stated in the Work Package 2 (Deliverable
2.2 “Report on complementarity of participatory, stakeholder engagement tools with
quantitative tools”, p.26), “the results arising from model simulations could be attractive from a
theoretical standpoint (e.g. large-scale diffusion of wind turbines can contribute strongly to
achieving the 1.5-degree Celsius target), but unfeasible from a more practical angle (e.g. there
can be societal resistance against large-scale application of wind energy in the landscape)”. In
this sense, the role of stakeholders is to provide information to adjust the likely scenarios for
policy analysis and make them more realistic.
Therefore, the key feature of this approach is the involvement of stakeholders throughout the
scenario-based decision making process. Participants from public agencies, private and public
sector industries, scientists and researchers, international associations, NGOs and the finance
community took part in a two-round survey. In the first survey they were asked about their
preferences for shaping climate change mitigation in the 21st century. The objective of the
survey was to collect information on how they perceive and assess the risks related to a changing
D.4.3 Implications of mitigation portfolios based on stakeholder preferences
9
climate, and which low-emission pathways they prefer to mitigate these risks. The driving force
of the survey was technology1, i.e. the availability of different technology options for mitigation.
As a next step, those initial stated preferences were modelled using the Global Change
Assessment Model (GCAM). A summary of the simulation results concerning emission reductions,
energy system changes, mitigation costs and implications on land use consistent with keeping
the increase in global mean temperature below 2ºC and 1.5ºC above pre-industrial levels was
then provided to the same sub-set (based on their willingness) of stakeholders in the second
survey. This second approach to stakeholders was aimed at observing whether they changed
their initial preferences about mitigation technology options after they were provided with
additional information about costs and implications of their initial preferences. Finally, the
ultimate outputs of this report are the underlying policy implications for each scenario and the
interrelationships between them. To summarize, this approach has two clear advantages: first,
people’s preferences are considered in scenarios; second, scenarios provide insights on
consequences of these preferences.
One of the highlights related to the empirical part of this report is the focus on the 1.5ºC
temperature target. The 2ºC approach has been widely explored in the literature; however, the
relevance of the 1.5ºC target has received much less attention, although this is increasing after
the Paris Agreement.2 The 0.5ºC reduction in anticipated peak global mean temperature could
mark the boundary for decreasing climate impacts, including the prevention of extreme weather
events, changes in water availability, crop yield projections, sea-level rise and coral reef
degradation (Schleussner et al., 2016). Deeper analyses on mitigation pathways towards a 1.5ºC
stabilisation target are thus needed.
The remaining part of the document is structured as follows. Section 3 describes the methods
used to develop this analysis, including a qualitative approach based on stakeholder engagement
and a quantitative approach based on an integrated assessment model. Section 4 presents and
discusses the results of the model implementation based on stakeholder preferences. Finally,
conclusions and policy implications are presented in Section 5.
1 Behavioural changes have been explored in Deliverable 4.2: Implications of different “heterodox” mitigation policies: the role of behavioural changes. 2 The IPCC is currently preparing a Special Report on the impacts of global warming of 1.5ºC pre-industrial levels and related global greenhouse gas emission pathways (see https://www.ipcc.ch/report/sr15/).
D.4.3 Implications of mitigation portfolios based on stakeholder preferences
10
3 METHODS
3.1 Overview
The methodology used in this report combines the application of qualitative and quantitative
approaches. Figure 1 summarizes the workflow for integrating the stakeholder engagement tools
(qualitative) with modelling tools (quantitative). Step 1 and Step 3 concern stakeholder analysis,
whereas Step 2 focuses on the model implementation. Finally, Step 4 includes the synthesis of
the results and definition of the policy implications of the report.
Figure 1: Steps for integrating qualitative stakeholder engagement tools with quantitative modelling tools
D.4.3 Implications of mitigation portfolios based on stakeholder preferences
11
With support from TRANSrisk’s Work Package 2, two rounds of surveys with global stakeholders
were carried out, with the same stakeholders3 used in both rounds. In the first round of
interviews (Step 1), information was obtained about the global mitigation target to which they
would want to aim and also which mix of technologies (or portfolio) they thought was better to
achieve that target. Based on their stated preferences a set of mitigation scenarios was
prepared, and the GCAM model was implemented accordingly by BC3 (Step 2).4
Once the model results were collected, the second round of surveys was conducted (Step 3). To
this end, stakeholders (who agreed to take part in the second round) were provided with more
detailed information on the implications of the portfolios they had previously selected, placing
particular attention on their positive and negative side effects. Finally, stakeholder final
preferences were evaluated (Step 4); in particular, whether those preferences changed with the
new information provided; and if so, how and why.
3.2 Stakeholder engagement
Stakeholder engagement was carried out by means of two surveys. In the first one, stakeholders
were asked about their preferences for mitigation pathways. No additional information of any
kind was provided, so their initial opinion was captured. In the second survey, stakeholders were
asked the same questions again, but extra information related to their initial answers, such as
impacts of preferences, was provided alongside the questionnaire. These two surveys, as well as
the stakeholder engagement and scenario generation processes, are explained in detail in the
following subsections.
3.2.1 First online survey: stating initial preferences5
A first survey was used to analyse stakeholders’ initial mitigation preferences at a global level
(Step 1 of Figure 1). The stakeholder approach was carried out through an online questionnaire
aimed at experts in energy and climate change. It was answered by 28 stakeholders (161
representatives from 102 international institutions were invited to complete the survey) from
the following categories: policy makers, private and public sector industries, scientists and
researchers, international associations, NGOs and the finance community. While the invitation to
complete the survey was sent globally, 80% of the respondents were from Europe. From these,
71% were in the age range 30-49, 18% over 50 and 7% under 30 (1 stakeholder did not provide
3 Same set of stakeholder recruitment, but smaller number of participants in the second round. 4 A description of the model can be found in http://jgcri.github.io/gcam-doc/v4.2/toc.html. 5 Due to the interrelationship between the Work Packages 2 and 4 of TRANSrisk (in fact, the Work Package 2 feeds the Work Package 4), this section compiles part of the information presented in the Deliverable 2.2 of the Work Package 2 concerning the first survey aimed at stakeholders.
D.4.3 Implications of mitigation portfolios based on stakeholder preferences
12
this information). Concerning the gender of the stakeholders, 64% were males and 32% females
(1 stakeholder did not provide this information). Due to the large share of European stakeholders
in the survey, the views resulting from it may differ from non-European stakeholder views. While
this has been a limitation of the geographical scope of the analysis, the approach remains useful
to illustrate how stakeholder views on socioeconomic factors and climate change can be
incorporated in modelled scenarios. Further research could expand the set of stakeholders
outside Europe, in an attempt to capture wider viewpoints.
3.2.1.1 The survey
The survey consisted of 11 technical questions6 reflecting key themes in the international debate
on climate change. These were categorised in four content blocks: (i) target to limit global
temperature increase, (ii) mitigation and adaptation, (iii) socio-economic factors to consider for
mitigation and adaptation measures, and (iv) technology options and preferences. These four
categories are further explained below.
Temperature target (Q1): There are multiple mitigation pathways that could limit global
warming to below 2°C (RCP2.6)7 and avoid the worst consequences of climate change. These
pathways would require substantial emissions reductions over the next few decades and near
zero emissions of CO2 and other long-lived greenhouse gases by the end of the century.
Implementing such reductions poses substantial technological, economic, social and institutional
challenges, which increase with delays in additional mitigation and also if key technologies are
not available. Limiting warming to lower or higher levels involves similar challenges, but on
different timescales and with different intensities.
Mitigation and adaptation (Q2): Adaptation (i.e. coping with climatic change) can help protect
against climate change and thus reduce the risks of climate change impacts. There are,
however, limits to its effectiveness, especially with greater magnitudes and rates of climate
change (Adger et al., 2009). In the long term, there is an increasing likelihood that immediate
adaptation actions will support the realisation of sustainable development goals. However,
adaptation alone will be insufficient to overcome all climate change effects, which implies that
mitigation (i.e. reduction of greenhouse gas emissions to avoid climate change) remains
essential to avoid damages from climate change and achieve sustainable development goals.
Socio-economic factors (Q3): Socio-economic factors are important to consider when exploring
low-emission futures, as reaching a long-term climate goal may contradict with domestic socio-
economic preferences or affect economic behaviour, lifestyles, policies, etc. (Moss, et al.,
6 The questions –and answers- addressed in the survey are listed in Appendix 1 – Online survey for Stakeholders, 1st Round. 7 RCP stands for Representative Concentration Pathways, which are scenarios, described the development of greenhouse gas emissions under different policy ambition level assumptions (IPCC, 2013b).
D.4.3 Implications of mitigation portfolios based on stakeholder preferences
13
2010). For example, addressing climate change could take place at the expense of economic
growth, especially when no (or only a few) higher-cost, low-emission technology options are
available in a country context. If this were the case, it would raise the debate about whether
economic growth should prevail over climate change mitigation/adaptation measures or the
other way around.
Technology options and preferences (Q4-Q11): The IPCC has stressed in its reports that there
is no “magic bullet” or technology that can deliver all the mitigation that is needed. Instead,
portfolios of technologies and measures will need to be compiled and it is very likely that these
portfolios depend on the context of each country and sector (IPCC, 2007). The choice of these
technologies will be determined, for example, by their cost (which can be different for each
country), their public acceptability (which can also change due to its perceived negative or
positive side effects related to the socioeconomic factors in Q3), and how the technologies may
contribute to achieving socio-economic goals. In the survey, the focus was on the following wide
range of technologies: Carbon Capture and Storage (CCS), nuclear energy, intermittent
renewables (i.e. wind, solar), biomass, other renewables, energy efficiency, natural gas, coal
and oil.
3.2.1.2 Scenario design
After the survey was conducted, responses were aggregated, so that the stakeholder choices
were translated into suitable variables for the model.8 The scenarios were designed to cover the
two most important dimensions of mitigation pathways: climate policy and technologies.
Concerning climate policy, 93% of the stakeholders claimed that the temperature target to limit
global warming in the end of the 21st century should be below 2ºC; in particular, 54% answered
that it should be below 1.5ºC and 39% below 2ºC. According to these responses, both 2ºC and
1.5ºC temperature targets were implemented for the simulations. This also implies a clear
preference for mitigation actions.
Concerning the technology portfolio for the next 50 years, stakeholders agreed that the two
most important technology options in the energy sector, in their view, intermittent renewables
(i.e. wind and solar) and energy efficiency, should also receive the most public support. Next,
CCS was considered important but it ranked lower than renewables and energy efficiency as it
requires higher levels of support. The other preferred technology options were biomass and
nuclear energy, which were considered important from a mitigation perspective, while needing
relatively low public support. Therefore the following five technologies were selected for the
scenario design:
8 More information on the analysis of the first survey responses can be found in TRANSrisk deliverable D2.2: Complementarity of qualitative and quantitative analytical tools. Furthermore, detailed responses are presented in Appendix 1 – Online survey for Stakeholders, 1st Round.
D.4.3 Implications of mitigation portfolios based on stakeholder preferences
14
Biomass: 11% of the stakeholders considered that there will be limited biomass deployment
globally in the future, 33% that current global levels will remain and 56% that there will be a
biomass expansion. Given these results, in the reference scenario total biomass consumption is
assumed to be developed without any specific constraint, whereas in the restrictive scenario a
limit of 100 EJ is set for the whole period (which is, in any case, four times higher than total
global biomass consumption in 2015).
Intermittent renewables: The highest consensus among stakeholders was reached for
intermittent renewables (i.e. solar and wind power). In this case, 96% of the respondents agreed
that the share of these sources will increase in the future global energy mix and none of them
foresaw a decrease. For this reason, a scenario which assumes a significant cost reduction for
renewables was considered as reference (i.e. it considers lower costs for wind and solar
compared to the business as usual case). However, stakeholders thought that development of
renewables would not be possible without strong levels of public support. Furthermore, the
potential for renewable deployment varies across countries, which could have an important
impact at a global scale. Therefore, a restrictive scenario with a limited participation of wind
and solar has also been simulated, including a maximum of 20% global electricity generation in
any year from 2020 to 2100.
CCS: There was no agreement among stakeholders on the future for CCS. Half of the respondents
expected a global CCS expansion in the future, but 88% of them agreed that it will not occur
within the next two or three decades. The other half thought that CCS will not be deployed
globally for different reasons: 45% of them expected that this will be due to limited public
acceptance and safety concerns; 36% of them based their opinion on economic reasons and the
remaining 18% argued technological reasons. Given that there is consensus on the delayed
introduction of CCS, two scenarios were considered: a reference scenario with CCS available
from 2030 onwards and a restrictive scenario with CCS not available in the whole century.
Nuclear power: Only 12% of the stakeholders foresaw a global expansion of nuclear energy
production, which supports the consensus of low acceptability for nuclear energy, even among
experts. On the contrary, 24% claimed that there will be a nuclear phase-out and 64% argued
that nuclear energy levels would remain constant at most. Therefore, two scenarios were
considered: a reference scenario with GCAM default levels of nuclear power and a restrictive
scenario with a nuclear phase-out.
All in all, the scenarios simulated where as follows:
- no climate policy,
- climate policy and all technologies available,
- climate policy with all technologies but with limited biomass,
- climate policy with all technologies but with limited solar/wind,
- climate policy with all technologies except for CCS and
- climate policy with all technologies but assuming a nuclear energy phase out.
D.4.3 Implications of mitigation portfolios based on stakeholder preferences
15
These scenarios were modelled under two situations: where climate policies aimed for
temperature stabilisation targets of below 1.5ºC, and below 2ºC. These scenarios are described
in detail in Section 3.3.2.
3.2.2 Second online survey: observing changes in preferences
Out of the 28 stakeholders taking part in the first survey, 20 of them (71%) agreed to take part in
the second questionnaire (Step 3 of Figure 1). The technical questions included in the second
survey are the same as those in the first approach. The second survey also included some extra
questions to evaluate the effect of the information provided (if any) on the new stated
preferences. Additionally, extra information resulting from the simulations has been
incorporated in the survey via three statements, which are further explained below.9
Statement 1 (Q1-Q5): This statement is related to the global temperature target that should be
aimed at according to the stakeholders. Therefore, data on emissions, primary energy
consumption and mitigation costs (with respect to the GDP) are presented, comparing the below
1.5ºC, below 2ºC and below 3ºC temperature targets.
Statement 2 (Q6-Q12): This statement refers to the results of the simulations for the
technology options towards a low-emissions future that were informed by the stakeholders in the
first round of surveys (more detail in Section 3.2.2). The focus here lies on the description of the
trade-offs between the different technology portfolios that have been explored. For instance, if
technologies are able to achieve negative emissions (e.g. carbon capture) are not available or
economically deployable, emissions reductions in order to reach the below 2ºC target should
start no later than 2020. Similarly, without carbon capture technology option a below 1.5ºC
scenario would be unfeasible.
Statement 3 (Q13): This statement informs about the distribution of the emissions by sector,
including industry, transport, electricity and AFOLU (Agriculture, Forestry and other Land Uses).
The results of this second survey are presented in Section 4.6.
3.3 The GCAM model
This section describes the model that has been used in the empirical part of this report, as well
as the specifications for each scenario.
9 The whole set of statements, questions and answers related to the second survey are listed in Appendix 2 – Online survey for Stakeholders, 2st Round.
D.4.3 Implications of mitigation portfolios based on stakeholder preferences
16
3.3.1 Model description
The model used in this report is the Global Change Assessment Model (GCAM)10, developed by
the University of Maryland and the Pacific Northwest National Laboratory (PNNL)11 and
implemented by the Basque Centre of Climate Change (BC3). GCAM is an integrated assessment
model that links economic, energy, land use and climate systems which has the advantage of
being able to explore connections of climate measures on different systems and impacts of
measures and developments within these systems on climate systems. It was one of the four
models chosen to develop the Representative Concentration Pathways (RCPs) of the IPCC’s 5th
Assessment Report (IPCC, 2014a). The model is available under the terms of the ECL open source
license version 2.0. In this study, the standard release of GCAM 4.2 is used.
GCAM is a global dynamic-recursive partial equilibrium disaggregated in 32 geopolitical regions
and operating in 5-year time steps from 1990 to 2100. The GCAM energy system includes primary
energy resource production, energy transformation to final fuels, and the use of final energy
forms to deliver energy services. The model distinguishes between two different types of
resources: depletable and renewable. Depletable resources include fossil fuels and uranium;
renewable resources include biomass, wind, geothermal energy, municipal and industrial waste
(for waste-to-energy), and rooftop areas for solar photovoltaic equipment. All resources are
characterised by supply curves and the competition between technologies is modelled in a way
that allows for a smooth transition of technologies in the energy system (logit probabilistic
model). Complete documentation on all the technologies in the energy system is provided in
Clarke et al. (2009).
GCAM tracks all greenhouse gas (GHG) emissions from the energy and the land-use systems.
GCAM provides the mitigation cost of different energy and climate policies for each specific
region. The mitigation costs are calculated by the model as the area below the marginal
abatement cost curve for a technology, assuming implementation at a certain scale (Kyle, 2015).
GCAM also reports the emissions of main air pollutants (including NOx, VOCs, CO or SO2) and can
be used to analyse the co-benefits / trade-offs of mitigation in terms of air pollution emissions
reduction or increase. Emissions of air pollutants depend on activity levels in each region, such
as fuel consumption, and the level of pollution controls, which are assumed to increase over
time (Smith et al., 2005; Smith and Wigley, 2006).
Another important feature of the GCAM architecture is that the GCAM terrestrial carbon cycle
model is embedded within the agriculture-land-use system model. Thus, all land uses and land
covers, including the non-commercial lands, are fully integrated into the economic modelling in
GCAM. This coverage gives GCAM the capability to model policies that jointly sequester or
reduce carbon across all activities in the energy, agriculture, forest, and other land uses.
D.4.3 Implications of mitigation portfolios based on stakeholder preferences
17
The model allows calibration and can be run with any combination of climate and non-climate
policies. As output, simulations provide an energy mix, carbon price and mitigation costs, among
other relevant variables for this report.
3.3.2 Model implementation
The GCAM model is used to simulate the scenarios based on the stakeholder preferences stated
in the first survey (Step 2 of Figure 1). A summary of the six scenarios developed is presented in
Table 1.
Table 1. Scenario implementation in GCAM based on stakeholder preferences
Technology options Temperature target
2ºC 1.5ºC
0. No climate policy N/A N/A
1. All technologies available
2. No CCS
3. Nuclear phase-out
4. Limited solar/wind
5. Limited biomass
Note: Options marked with indicate feasible scenarios with GCAM.
Scenario 0 is modelled with all the technologies available and no climate policy; in this case,
global average temperature increase reaches 3.81ºC by 2100, according to the GCAM model. This
scenario is used as an upper bound of temperature and emissions, when no mitigation measures
beyond those currently in place are adopted. Concerning scenarios with climate policy, Scenario
1 represents the reference scenario with all low-emission technologies available, whereas
Scenarios 2-5 are the restrictive scenarios including the limited technology options resulting
from the interaction with stakeholders. The ‘all technologies available’ scenario is the most
cost-effective scenario, since the least costly technology portfolio is selected by the model in
order to achieve the climate target.12 It is used as a benchmark for emissions and costs. In the
restrictive scenarios, however, the mitigation-optimal share of technologies is limited and thus
costs increase.
12 According to the GCAM documentation (GCAM, 2017), “At each time step, GCAM searches for a vector of prices that cause all markets to be cleared and all consistency conditions to be satisfied”.
D.4.3 Implications of mitigation portfolios based on stakeholder preferences
18
The detailed characteristics of each scenario are described in Table 2. The scenario where no
climate policy is implemented is not realistic, since most countries have already implemented
policy measures or will implement them in the future, following the Nationally Determined
Contributions (NDCs) already submitted. Similarly, the scenario with all technologies available
could also pose some doubts, since there is uncertainty about the commercial readiness of some
technologies (e.g. CCS). The most likely scenarios are therefore those with limited technology
options. In any case, the most pessimistic and optimistic scenarios set the boundaries to allow
comparison.
Table 2. Definition of technology characteristics
Technology options Characteristics
0. No climate policy All technologies available in GCAM are included.
1. All technologies available All technologies available in GCAM are included. CCS is available from 2030 onwards.
2. No CCS All technologies available except for CCS, which is unavailable in the whole century.
3. Nuclear phase-out
All technologies available but assuming a nuclear energy phase out consisting of no addition of new nuclear plants beyond those under construction and existing plants operating until the end of their lifetime.
4. Limited solar/wind All technologies available except for solar/wind, which are limited to a maximum of 20% annual global electricity generation.
5. Limited biomass All technologies available except for biomass, which is limited to a maximum of 100 EJ per year.
Note: For Scenario 0 no climate policy is modelled. For Scenarios 1 to 5, two climate policies are modelled for: 2ºC and 1.5ºC temperature targets.
Additional assumptions for the all technologies available scenarios (with and without climate
policy) include high renewable energy participation (particularly for wind, solar and geothermal)
and restrict the commercial availability of CCS to the year 2030 (i.e. CCS is available from 2030
onwards). The rest of the technologies keep the original GCAM specifications.13
This scenario selection is in line with the scenario reporting from IPCC (2014b, p. 60) and the
selection of scenarios used in other papers (e.g. Edenhofer et al., 2010, Kriegler et al., 2014).
The main difference is that in this report the focus is not set on a model inter-comparison, but
in the trade-offs of the different climate policy and technology options for a single model.
Additionally, the fact that the scenario selection has been informed by stakeholders adds
robustness to the analysis.
13 For a detailed description of the energy system in GCAM see http://jgcri.github.io/gcam-doc/v4.2/energy.html.
D.4.3 Implications of mitigation portfolios based on stakeholder preferences
19
Another highlight of this scenario selection is the level of detail for the 1.5ºC temperature target
analysis. Stakeholders stressed the relevance of a climate policy towards a 1.5ºC temperature
limit; however, this more ambitious goal has been less explored in the scientific literature than
the 2°C goal. In particular, Ranger et al. (2012) analysed different global emissions paths and
suggested that emissions should peak by around 2015 to limit global warming below 1.5ºC at the
end of the century. However, they did not explore the technological feasibility, an issue that
was further developed in Rogelj et al. (2015). They suggested that the global energy system
should be decarbonised by 2050 in order to achieve the 1.5ºC target and highlighted the role of
the technologies able to achieve negative emissions in the second half of the century (e.g. CCS
and biomass with CCS).14 Nevertheless, they assumed a default mitigation portfolio and did not
explore the trade-offs between the different technology options. Therefore, further analysis is
needed of different technology portfolios towards a 1.5ºC target and the comparison with the
2ºC target.
Finally, socioeconomic variables have not been changed with respect to the model baseline
assumptions.15 The default scenario of the GCAM model assumes a global population peak in 2065
at roughly 9 billion people and a long-term labour productivity growth of approximately 1.5
percent per year in the developed world. Moreover, it is assumed that economic growth rates
are generally higher in developing countries, with countries undergoing initially rapid growth,
which then gradually slows towards the growth levels of developed countries (Calvin et al.,
2015).16
14 According to the literature, there is controversy on reliance on negative emissions. For instance, Anderson and Peters (2016) consider that integrated assessment models assume large-scale use of negative-emissions technologies, which would reduce the chances of controlling global temperatures if they are not deployed. This increases the motivation towards a no CCS scenario. 15 Socioeconomic variables in GCAM are based on Edmonds and Reilly (1983). For a detailed description see http://jgcri.github.io/gcam-doc/v4.2/macro-econ.html. 16 A SSP2 scenario (Shared Socioeconomic Pathways (SSPs) are storylines to analyse the interactions between socioeconomic factors (related to population, economy and technology) and climate change. SSP2 is a pathway which assumes that recent trends will continue and is also called ‘middle of the road’ or ‘current trends continue’ (O'Neill et al., 2012)) was also simulated following the GCAM specifications (a detailed description on SSP implementation in GCAM can be found in Calvin et al. (2016)), but results for the 1.5ºC target were unfeasible for all the scenarios with limited technology options. This limits the possibility to analyse the trade-offs of the different climate policies, and therefore, results with SSP2 have not been included in the main scenario comparison (only in Appendix 3).
D.4.3 Implications of mitigation portfolios based on stakeholder preferences
20
4 RESULTS AND DISCUSSION
4.1 Overview
This section explores the trade-offs in the different mitigation portfolios described in Section 3,
as ‘consequences’ of stakeholders’ responses. According to the stakeholder-stated preferences,
climate policy has been modelled in this report by means of different temperature targets, i.e.
below 1.5ºC versus below 2ºC, and considering diverse technology portfolios (see Table 1). The
focus of this section lies on the implications of those temperature targets on the energy mix, CO2
emissions and mitigation costs. The following subsections provide a detailed discussion of these
issues.
4.2 Energy Mix
Figure 1 compares the share of each technology in global energy consumption in 2050 and in
2100 for both the 2ºC and 1.5ºC temperature targets. In the absence of climate policies, coal
and natural gas remain the main components of the mix, representing more than 60% of total
energy consumption. In all the mitigation portfolios, those with assumed climate policies,
however, their share in the global mix is considerably reduced. This is especially apparent in the
future use of coal, since the model shows that the share of coal reduces over time and at the
end of the century it is only present in combination with CCS. Moreover, without CCS, fossil-fuel-
based technologies are completely eliminated (i.e. oil and coal) or marginalised (i.e. natural
gas) by the end of the century, although they still play an important role in 2050. In this no-CCS
scenario, biomass becomes the most relevant mitigation technology in 2100, with roughly 40%
share of the global energy mix.
The special relevance of biomass is due to the bioenergy with carbon capture and storage
(BECCS), since it has an enormous potential to achieve negative emissions, since the CO2 capture
from biomass can effectively remove CO2 from the atmosphere, avoiding the fossil fuel
technological lock-in of conventional CCS (Vergragt et al., 2011).
Finally, renewable energy and nuclear power increase their share in the mix when technologies
with negative emissions potential are limited or not available (i.e. scenarios with no CCS and
limited bioenergy). If emissions cannot be captured, the low emitting technologies become
particularly important in early stages.
D.4.3 Implications of mitigation portfolios based on stakeholder preferences
21
(a) 2ºC temperature stabilization target
(b) 1.5ºC temperature stabilization target
Note: Renewable energy includes intermittent renewables (solar/wind/geothermal) and hydro-power. In the Limited biomass scenario, biomass is constrained to a maximum of 100EJ/yr. In the Limited
solar/wind scenario, solar and wind technologies are constrained to a maximum electricity share of 20% for any year. In the No CCS scenario, there is no CCS. In the Nuclear phase out scenario, existing plants
operate until the end of their lifetime and no new nuclear plants are added. Limited solar/wind and No CCS are not feasible under a 1.5ºC global temperature increase target.
Figure 2: Energy mix [%] for different global temperature targets
0%
10%
20%
30%
40%
50%
60%
70%
80%
90%
100%
2050
0%
10%
20%
30%
40%
50%
60%
70%
80%
90%
100%
2100
0%
10%
20%
30%
40%
50%
60%
70%
80%
90%
100%
2050
0%
10%
20%
30%
40%
50%
60%
70%
80%
90%
100%
2100
01
2100Biomass CCS Biomass Renewable Energy Nuclear Coal CCS Coal Natural Gas CCS Natural Gas Oil CCS Oil
D.4.3 Implications of mitigation portfolios based on stakeholder preferences
22
4.2.1 Electricity mix
Figure 3 presents the global electricity mix picture for 2050 and 2100 under the 2ºC and 1.5ºC
temperature targets. As observed in the global energy mix in Figure 2, fossil technologies are
only present if CCS is available. Additionally, renewable energy becomes a critical technology in
2100, overtaking the 40% in the nuclear phase out scenario for both stabilization targets (41% for
a 2ºC target and 45% for a 1.5ºC target). Concerning the global electricity mix, renewable energy
and CCS are the key technologies to limit global warming, both in the 1.5ºC and 2ºC scenarios.
(a) 2ºC temperature stabilization target
0%
10%
20%
30%
40%
50%
60%
70%
80%
90%
100%2050
0%
10%
20%
30%
40%
50%
60%
70%
80%
90%
100%2100
D.4.3 Implications of mitigation portfolios based on stakeholder preferences
23
(b) 1.5ºC temperature stabilization target
Note: Storage includes CSP storage, PV storage and wind power storage. In the Limited biomass scenario,
biomass is constrained to a maximum of 100EJ/yr. In the Limited solar/wind scenario, solar and wind technologies are constrained to a maximum electricity share of 20% for any year. In the No CCS scenario, there is no CCS. In the Nuclear phase out scenario, existing plants operate until the end of their lifetime
and no new nuclear plants are added. Limited solar/wind and No CCS are not feasible under a 1.5ºC global temperature increase target.
Figure 3: Electricity mix [%] for different global temperature targets
4.3 CO2 Emissions
The two climate policies evaluated in this report (1.5 and 2oC targets) are aimed at reducing
GHG emissions. According to the IPCC, anthropogenic GHG emissions are extremely likely to
have been the dominant cause of the global warming observed since the mid-20th century.
Among them, CO2 emissions from fossil fuel combustion and industrial processes contributed
about 78% of the total GHG emissions over 1970 to 2010 (IPCC, 2014a). Therefore, CO2 emissions
became a key indicator for comparing the different mitigation portfolios (although there are
additional sources of emissions that have not been considered in this report).
0%
10%
20%
30%
40%
50%
60%
70%
80%
90%
100%
2050
0%
10%
20%
30%
40%
50%
60%
70%
80%
90%
100%
2100
D.4.3 Implications of mitigation portfolios based on stakeholder preferences
24
4.3.1 CO2 emissions in the energy system
Figure 4 represents the evolution of CO2 emissions for a below 2ºC temperature increase target
(Figure 4a) and a below 1.5ºC temperature increase target (Figure 4b) for the energy-use sectors
(i.e. AFOLU emissions are not considered). As the figure shows, without a climate policy target
(dashed black line), annual emissions are above 10 GtC/yr from 2015 onwards, surpassing the 20
GtC/yr in 2065 and peaking at 25 GtC/yr by the end of the century. Taking into account that,
according to the IPCC, the remainder of the carbon budget likely to keep global mean
temperatures below 2ºC is estimated to be 275 GtC in 2011 (IPCC, 2013c), the absence of
climate policies would increase the likelihood of missing the 2ºC temperature limit (i.e. within
15 to 20 years). Achieving a temperature target below 1.5ºC would depend even more on climate
policies, given that there is a very tight budget for remaining carbon emissions.17
In this context, negative emissions are a key element to achieving these challenging climate
policy targets. The concept of “negative emissions”, which is widely used in this report, implies
carbon removal from the atmosphere. One important technology able to achieve these negative
emissions is CCS18, either combined with fossil fuels (e.g. coal with CCS, natural gas with CCS, oil
with CCS) or with biomass (i.e. BECCS). Figure 4 shows that producing negative emissions is
optimal in all the scenarios to achieve both the 2ºC and the 1.5ºC scenarios, but the optimal
level varies depending on the technology that is limited.
In particular, when CCS and biomass are the restricted technologies, the emissions reduction
path must necessarily begin earlier, because there are fewer possibilities for negative emissions
at the end of the century. However, when the limited technologies are solar/wind and nuclear
(and also when all technologies are available), emissions are higher until 2060 in both
temperature targets, but reductions are faster from then onwards. For the 2ºC temperature
target, negative emissions begin in 2080 for the scenarios where all technologies are available,
when solar/wind is limited and also when biomass is restricted.
When there is no CCS, negative emissions are needed from 2095, and when biomass is limited
from 2100. Emissions are much more restrictive for the 1.5ºC scenario, for which negative values
are required from 2065 for the nuclear phase out scenario and from 2070 for the all technologies
available scenario and for the limited biomass scenario. As is shown in Figure 7, the fact that
17 The carbon budget available for limiting temperature increases to less than 1.5°C (with a
likelihood of 66%) is estimated to be 109 GtC from 2011 onwards. Emissions from 2011 to 2015
totalled 175 GtC and, therefore, the carbon budget currently available is 61 GtC for the goal of
1.5°C.
18 Other ways to achieve negative emissions include afforestation, Carbon Dioxide Removal (CDR) technologies or other geo-engineering options.
D.4.3 Implications of mitigation portfolios based on stakeholder preferences
25
some scenarios required additional efforts to start mitigation earlier imposes extra costs in the
mitigation process, since higher cost technologies need to be employed to fulfill the climate
policy target. This effect is particularly important when biomass is limited (because in that case
BECCS is limited), especially in the 1.5ºC scenario.
A caveat is needed. The limited intermittent renewables scenario and the no CCS scenario are
not feasible under a 1.5ºC temperature stabilisation target. This means that the model cannot
find a solution, because of technical or economic constraints. This proves that renewable energy
and CCS are crucial technologies for achieving demanding mitigation targets.
Note: In the Limited biomass scenario, biomass is constrained to a maximum of 100EJ/yr. In the Limited solar/wind scenario, solar and wind technologies are constrained to a maximum electricity share of 20% for any year. In the No CCS scenario, there is no CCS. In the Nuclear phase out scenario, existing plants
operate until the end of their lifetime and no new nuclear plants are added. Limited solar/wind and No CCS are not feasible under a 1.5ºC global temperature increase target. Emissions only include the energy
sector.
Figure 4: Evolution of global CO2 emissions in the energy sector [MtC] for different global temperature targets
4.3.2 CO2 emissions by region
Figure 5 details the evolution of CO2 emissions towards a 2ºC temperature target by region,
where USA, EU27, Canada, Japan and the BRICS countries are considered. The model seeks the
global minimum cost at a global CO2 price, which determines the reduction by country. The main
message of this figure is that, in the optimal case, only the BRICS countries are allowed to
continue increasing their emissions until 2035 (if all technologies are available, with limited
technology options reductions should start earlier), given that they need energy to meet their
growing demand. However, the rest of the regions analysed should start before 2020. Concerning
the effect of each technology, there are no differences among regions: a situation with limited
biomass requires higher efforts in the first half of the century, in order to compensate for the
No Climate Policy All technologies available Limited biomass
Limited solar/wind No CCS Nuclear phase out
D.4.3 Implications of mitigation portfolios based on stakeholder preferences
26
Note: In the Limited biomass scenario, biomass is constrained to a maximum of 100EJ/yr. In the Limited solar/wind scenario, solar and wind technologies are constrained to a maximum electricity share of 20% for any year. In the No CCS scenario, there is no CCS. In the Nuclear phase out scenario, existing plants operate until the end of their lifetime and no new nuclear plants are added. Emissions only include the
energy sector.
Figure 5: Evolution of CO2 emissions in the energy sector [MtC] by region under a 2ºC global temperature target
No Climate Policy All technologies available Limited biomass
Limited solar/wind No CCS Nuclear phase out
D.4.3 Implications of mitigation portfolios based on stakeholder preferences
27
4.3.3 CO2 emissions by sector
In terms of CO2 emissions by sector, Figure 6 shows the relevance of the transport and land use
sector at the end of the century, both for the 2ºC and the 1.5ºC temperature targets, depending
on which technology is limited. Without climate policies, most of the emissions come from the
electricity sector. However, with climate policy, but limited biomass and no CCS, most of the
remaining emissions in the second half of the century will come from the transport sector. Land
use emissions are the highest at the end of the century when all the technologies are available,
solar/wind limited and nuclear phased out. At a global level, land use emissions are very low
compared to other sectors, but this picture changes if emissions are reported by region (i.e. in
Indonesia land use emissions represent an important share, whereas in EU27 they are less
relevant).
(a) 2ºC temperature stabilization target
-1000
4000
9000
No Climate Policy
-1000
4000
9000
All technologies available
0%200%
No Climate PolicyAFOLU Buildings Electricity Transport Industry
D.4.3 Implications of mitigation portfolios based on stakeholder preferences
28
-1000
4000
9000
Limited biomass
-1000
4000
9000
Limited solar/wind
-1000
4000
9000
No CCS
-1000
4000
9000
Nuclear phase out
0%200%
No Climate PolicyAFOLU Buildings Electricity Transport Industry
D.4.3 Implications of mitigation portfolios based on stakeholder preferences
29
(b) 1.5ºC temperature stabilization target
Note: In the Limited biomass scenario, biomass is constrained to a maximum of 100EJ/yr. In the Limited solar/wind scenario, solar and wind technologies are constrained to a maximum electricity share of 20% for any year. In the No CCS scenario, there is no CCS. In the Nuclear phase out scenario, existing plants
operate until the end of their lifetime and no new nuclear plants are added. Limited solar/wind and No CCS are not feasible under a 1.5ºC global temperature increase target. Emissions include both energy and
land use sectors. AFOLU includes Agriculture, Forestry and other Land Use.
Figure 6: CO2 emissions evolution [MtC/yr] by sector for different global temperature targets
-1000
4000
9000
No Climate Policy
-1000
4000
9000
All technologies available
-1000
4000
9000
Limited biomass
-1000
4000
9000
Nuclear phase out
0%200%
No Climate PolicyAFOLU Buildings Electricity Transport Industry
D.4.3 Implications of mitigation portfolios based on stakeholder preferences
30
4.4 Mitigation costs
This section presents an analysis of the mitigation costs of the different technology options
explored in this report. Mitigation costs refer to the policy costs necessary to achieve the
climate targets, i.e. below 2ºC and below 1.5ºC. This calculation strongly depends on the model
that is used. In the case of GCAM, mitigation costs are computed in terms of the area under the
marginal abatement cost (MAC) curve and are expressed as the net present value (NPV) over the
course of the full century, discounted at a 5% rate.
Figure 7 compares the mitigation costs increase for the limited technologies scenarios to the
situation where all the technology options are available. Results are presented for the 2ºC
(Figure 7a) and 1.5º (Figure 7b) temperature stabilisation targets. In a 2ºC temperature
stabilisation scenario by the end of the century, the scenarios with the highest mitigation costs
are the limited biomass (by 73%) and the no-CCS scenario (by 53%). Moreover, these costs
increase considerably if the temperature limit is 1.5ºC, particularly when biomass is restricted
(by 130%). This is caused by the fact that a bioenergy limitation scenario reduces the amount of
available BECCS in latter periods (remember Figure 2), which would lead to the use of more
expensive mitigation technologies in order to reduce emissions to the desired level (recall Figure
4).
Figure 7: Mitigation costs for different global temperature targets
73%
8%
53%
15%
0%
10%
20%
30%
40%
50%
60%
70%
80%
Limited biomass Limited solar/wind No CCS Nuclear phase out
(a) 2ºC
130%
X X
24%
0%
20%
40%
60%
80%
100%
120%
140%
Limited biomass Limited solar/wind No CCS Nuclear phase out
(b) 1.5ºC
D.4.3 Implications of mitigation portfolios based on stakeholder preferences
31
Note: In the Limited biomass scenario, biomass is constrained to a maximum of 100EJ/yr. In the Limited
solar/wind scenario, solar and wind technologies are constrained to a maximum electricity share of 20%
for any year. In the No CCS scenario, there is no CCS. In the Nuclear phase out scenario, existing plants
operate until the end of their lifetime and no new nuclear plants are added. Limited solar/wind and No
CCS are not feasible under a 1.5ºC global temperature increase target. Mitigation costs for the period
2020-2100, discounted at 5% per year.
An indicator that reports the relative magnitude of mitigation costs in the economy are the
global mitigation costs in 2100 expressed as percentage of GDP, presented in Table 3. If all the
technologies are available, mitigation costs account for the 3% of GDP when the temperature
target is 2ºC and 6% for a 1.5ºC target. Under the assumptions of limited technology options,
however, results tell a different story, especially for the 1.5ºC target. Limited solar/wind for the
2ºC target does not increase the ratio, a nuclear phase-out raises it up to a 4% and the limited
biomass and the no CCS scenarios achieve a 5%. The most expensive scenario is the one with
restricted biomass under a 1.5ºC target: global mitigation costs can reach a 14% of GDP.
Table 3. Share of global mitigation costs over GDP [%]
Technology options GDP share
2ºC 1.5ºC
All technologies available 3% 6%
Limited biomass 5% 14%
Limited solar/wind 3% -
No CCS 5% -
Nuclear phase-out 4% 7%
Note: In the Limited biomass scenario, biomass is constrained to a maximum of 100EJ/yr. In the Limited
solar/wind scenario, solar and wind technologies are constrained to a maximum electricity share of 20%
for any year. In the No CCS scenario, there is no CCS. In the Nuclear phase out scenario, existing plants
operate until the end of their lifetime and no new nuclear plants are added. Limited solar/wind and No
CCS are not feasible under a 1.5ºC global temperature increase target. Mitigation costs for the period
2020-2100, discounted at 5% per year.
The relationship between mitigation costs and cumulative emissions for the period 2020-2100 is
presented in Figure 8. Red symbols represent feasible scenarios for a 1.5ºC temperature target,
whereas blue marks stand for the 2ºC temperature target. The main conclusion of this figure is
that it is possible to achieve the climate targets even if some technologies are absent or limited,
but this increases the mitigation costs considerably. However, the highest costs do not
necessarily lead to the lowest emissions.
D.4.3 Implications of mitigation portfolios based on stakeholder preferences
32
According to Figure 8, compared to a 2ºC target, mitigation costs are always higher for the 1.5ºC
climate policy, given that the entailed emissions reduction is also much higher. In particular, the
highest cost corresponds to the limited biomass scenario towards a 1.5ºC limit. This almost
double the cost of the second highest cost layout - the nuclear phase out scenario for a 1.5ºC.
This can be explained by the steeper emission reductions needed to compensate for the
reduction of negative emissions, since in this scenario the potential for carbon capture is
reduced. It is also remarkable that despite the costs, the limited biomass scenario is not the
lowest emissions scenario, which once again highlights the relevance of biomass in mitigation,
particularly biomass with CCS. In fact, the lowest emissions are achieved in the nuclear phase
out scenario towards a 1.5ºC, but mitigation costs increase. Finally, the lowest mitigation costs
in Figure 8 are associated to a situation with all technologies available and a 2ºC target.
Note: In the Limited biomass scenario, biomass is constrained to a maximum of 100EJ/yr. In the Limited
solar/wind scenario, solar and wind technologies are constrained to a maximum electricity share of 20%
for any year. In the No CCS scenario, there is no CCS. In the Nuclear phase out scenario, existing plants
operate until the end of their lifetime and no new nuclear plants are added. Limited solar/wind and No
CCS are not feasible under a 1.5ºC global temperature increase target. Mitigation costs for the period
2020-2100, discounted at 5% per year. Cumulative emissions for the period 2020-2100.
Figure 8: Mitigation costs [billion 1990USD] and cumulative CO2 emissions [GtC] for different global temperature targets
All technologies available
Limited biomass
Limited solar/wind
No CCS
Nuclear phase out
All technologies available
Limited biomass
Nuclear phase out
0
5
10
15
20
25
30
35
40
0 20 40 60 80 100
Mit
igat
ion
co
sts
(bill
ion
19
90
USD
)
Cumulative emissions (GtC)
2C 1.5C
D.4.3 Implications of mitigation portfolios based on stakeholder preferences
33
4.5 Summary of results
A summary of the main results of the simulations is presented in this subsection, simulations that
were conducted with a set of scenarios based on stakeholder preferences. According to the
information presented to the stakeholders in the surveys, results and the corresponding policy
implications have been classified in three categories: temperature target, technology options
and sectors for climate change mitigation.
4.5.1 Temperature target
Under a scenario of a 2ºC global temperature increase target by the end of the century, global
emissions will be 65% higher than in a 1.5ºC scenario. Additionally, compared to a 2ºC target,
global primary energy consumption is 3% lower than under a 1.5ºC target. Finally, global
mitigation costs account for 6% of the GDP by 2100 when the temperature target is 1.5ºC, and 3%
for a 2ºC target. This represent a percentage point (pp) reduction of less than 0.05 pp in annual
economic growth rate for every target.
4.5.2 Technology options
In a 2ºC temperature stabilisation scenario by the end of the century, the scenarios with highest
mitigation costs (compared to a situation where all the technology options are available) are the
scenarios with no CCS and limited biomass availability (increase by 53% and 73%, respectively).
The CO2 emissions reduction in 2100 for these scenarios is the lowest of all mitigation portfolios,
which means that the costs per avoided ton of CO2 are very high, and thus requires additional
efforts to meet the climate target. On the other hand, the increase in the mitigation costs is
lower in the scenarios with intermittent renewables restricted (increase by 8%) and nuclear
energy phased out (increase by 15%).
Furthermore, according to the model results, producing negative emissions is optimal for
reaching the 2ºC temperature target under all scenarios. For the scenarios with all technologies
available, limited solar/wind availability and nuclear phase out, negative emissions are optimal
from 2080 onwards, whilst for the scenarios with no CCS and limited biomass; negative emissions
are only optimal from 2095 and 2100 onwards, respectively. However, policy costs increase when
emission reductions are lower and negative emissions delayed, since other more expensive
options need to be used to reach the climate goals. In fact, if negative emission options are not
readily available, emission reductions should start earlier. In particular, if the technology
options for achieving negative emissions are limited, global emissions need to peak by 2020
(otherwise a peak is needed by 2030).
Concerning the global energy mix, in the absence of a climate policy (‘No climate policy’
scenario), coal and natural gas remain the main components of the mix with more than 60% of
the total energy consumption. In all the other mitigation portfolios, however, their share of the
global mix is considerably reduced. This is especially apparent in the future use of coal, because
D.4.3 Implications of mitigation portfolios based on stakeholder preferences
34
the model shows that the share of coal reduces over time and at the end of the century it is only
present in combination with CCS. Moreover, in the absence of CCS, fossil-fuel-based technologies
are completely eliminated (i.e. oil and coal) or marginalized (i.e. natural gas) by the end of the
century, although they still play an important role in 2050. In this no-CCS scenario, biomass
becomes the most relevant mitigation technology in 2100, with roughly 40% share of the global
energy mix. Renewable energy and nuclear power increase their share of the mix when
technologies with negative emissions potential are limited or not available (i.e. scenarios with
no CCS and limited bioenergy).
Concerning the global electricity mix, renewable energy and CCS are the key technologies to
limit global warming, both in the 1.5ºC and 2ºC scenarios.
Finally, the limited intermittent renewables scenario and the no-CCS scenario are not feasible
under a 1.5ºC temperature stabilisation target. That is, because the model was not able to find
a suitable technology mix to achieve the necessary emissions reduction for limiting the global
temperature to 1.5ºC in 2100 if CCS is not an available technology option, or if the development
of solar and wind technologies at a global scale is limited. However, the model shows that the
1.5 target is feasible without using nuclear energy.
4.5.3 Sectors for climate change mitigation
In terms of CO2 emissions by sector, without any climate policy, most emissions come from the
electricity sector both in 2050 and in 2100. Assuming a 2ºC mitigation target, this still holds in
some scenarios (e.g. limited biomass and no CCS) until the middle of the century.
4.6 The second survey
Out of the 20 stakeholders that agreed to take part in the second round, to date 9 of them have
responded the questionnaire and 7 provided enough information to match their two sets of
answers (i.e. first and second surveys). Despite being a small sample, results are promising,
since there is evidence of a change in the stakeholder preferences and the stakeholders
themselves confirmed that the statements provided (prepared using the model results) had an
influence on their opinions. In the next paragraphs we summarize the main findings of the
second survey and the changes with respect to the initial responses.
Temperature target: 29% of the stakeholders did not change their opinion, whereas 71%
switched from 2ºC to 1.5ºC in the second round. After this round only 14% still believes that the
target that should be aimed is 1.5ºC.
Mitigation and adaptation: 59% of the stakeholders did not change their opinion, 14% increased
the role of mitigation (compared to the first survey) and 14% decreased the role of mitigation
(and increase the adaptation). Furthermore, 43% reported that they had lower expectations for
the estimated share of mitigation per GDP than the results provided in the survey, whereas 57%
D.4.3 Implications of mitigation portfolios based on stakeholder preferences
35
had higher expectations. Finally, none of them changed their opinion about the acceptability of
actions for mitigation.
Socio-economic factors: There are no changes in the answer to this question.
Technology options and preferences: Related to the technology preference for the future, 57%
did not change and RE and energy efficiency still remained the most preferred technologies. It is
also remarkable that in the second round no one reported fossil technologies among the first two
preferred options. In fact, 71% consider in the second round that fossil fuels will be marginalized
by 2050 (20% of them had reported in the first survey that natural gas would still remain
important as back up technology).
Concerning the level of support that technologies should receive, renewable energy and energy
efficiency continue to be the preferred technologies for investment, but the role of biomass and
CCS increases in the second round. In particular, 71% hold their opinion on CCS development
(29% believe that it will be developed in the second half of the century and 43% do not think
that it will be ready). The remaining 29% changed their opinion in favour of CCS deployment
from 2050 onwards.
The preferences for nuclear remain the same in 71% of the respondents and the 100% of them
reported in the second round that the role of renewable energy will increase. Bioenergy also
experiences more favourable opinions in the second survey, where 71% of the stakeholders
agreed that the most likely future for bioenergy involves the expansion of this technology.
When asking about the sectors, in the second round all the stakeholders mentioned industry as
one of the most important (in the first round only 57% of them reported it) and 86% transport (in
the first round only 71%).
Control responses: Stakeholders were also asked about the underlying factors affecting their
responses in the second questionnaire (multiple answers were possible). 57% answered that the
info provided in the survey had been one of the main drivers, 14% considered that the fossil fuels
price change had been the most relevant event, 14% mentioned the COP22 in Marrakech and 29%
considered the change in US administration relevant.
Concerning their opinion regarding the utility of the information provided in the survey
(resulting from the model simulations based on their initial preferences), 71% found the results
provided useful (29% results not new, but useful and 43% results new). 14% reported that results
were useful but the gap between research and policy making is still too big (this person changed
his/her opinion for nuclear -from constant to phase-out- and increased the role of bioenergy for
policy support). 14% do not rely on models for decision making (this person changed his/her
opinion in favour of CCS and bioenergy and reduced the temperature target from 1.5 to 2ºC).
Finally, concerning the two responses that could not be matched, they report that results were
useful for both of the stakeholders (and new for one of them). Additionally, they had lower
D.4.3 Implications of mitigation portfolios based on stakeholder preferences
36
expectations for the estimated share of mitigation per GDP and they changed the opinion about
the acceptability of actions for mitigation.
D.4.3 Implications of mitigation portfolios based on stakeholder preferences
37
5 CONCLUSIONS AND POLICY IMPLICATIONS
In this report different mitigation portfolios selected by stakeholders have been analysed with
a threefold aim. First, to explore how stakeholder engagement can support scenario
development and pathway design for a low-emission and climate resilient future. Second, to
quantify the trade-offs of these mitigation portfolios informed by the stakeholders. Third, to
observe if initial preferences change when stakeholders are provided with more information
on the trade-offs of the different scenarios. Stakeholder input is crucial in this process,
since their domain knowledge offers more detailed insights on aspects which may have an
impact on mitigation costs.
Stakeholders stated their preferences towards below 1.5ºC and below 2ºC global temperature
stabilisation targets, but claimed that technologies are currently under a different stage of
development and, thus, require different levels of support. Taking into consideration these
considerations, scenarios for limited technology options were designed (i.e. limited bioenergy,
limited solar/wind, no CCS and nuclear phase-out) and simulations using the GCAM model
(implemented by BC3) were conducted. The benchmark scenario was a situation where all the
technologies were available.
The main message deduced from the simulations is that it is possible to achieve the below 2ºC
temperature target even if some technologies are limited or not available, but this has an
important effect on mitigation costs. The dilemma for policy makers lies between promoting
investment in technology development in the short term or facing more costly mitigation options
in the long run. Likewise, the 1.5ºC temperature target can also be reached if bioenergy is
limited or nuclear power phased-out; however, other technologies such as solar/wind and CCS
are essential to limit global temperature to 1.5ºC.
Another important conclusion of this report is that the technology portfolio determines the
timing and speed of the emissions reductions. That is, abatement should start earlier if
technologies able to achieve negative emissions (i.e. CCS and biomass) are not available or are
limited. Furthermore, the later the mitigation efforts start, the faster the emissions reductions
should be. All in all, there is no “magic bullet” when dealing with mitigation options but policy
makers should consider the risks incurred if certain technology options are not developed in the
medium term. Additionally, a single approach will not work for all countries, since, for example,
the resources, technologies or public acceptability of different options vary by geographical
scales and will change with time.
The simulations conducted also prove that socioeconomic projections are another key factor to
achieve climate policy targets. When the scenarios with limited technology options were
implemented under a SSP2 storyline, results for the 1.5ºC target were unfeasible for all the
scenarios. Therefore, not only is the energy system important to achieve a low-carbon future,
but also demand-side factors, as it has been explored in TRANSrisk deliverable D4.2: Implications
of different “heterodox” mitigation policies: the role of behavioural changes.
D.4.3 Implications of mitigation portfolios based on stakeholder preferences
38
Concerning the second round of stakeholder engagement, most stakeholders confirmed that the
information provided in the second survey was useful for them (in some cases even new to them)
and claimed that it had influenced their responses. Additionally, stakeholders reacted to the
simulation results by increasing the temperature target they had favoured in the first survey,
which was 1.5ºC for more than the half of the respondents in the first questionnaire but held
only for one stakeholder in the second round. The iterative process with stakeholders also
resulted in improved opinions towards the future development of bioenergy and CCS. However,
due to time constraints, the stakeholder sample was too small to drive general conclusions and
further research is still required in this regard.
Finally, according to the terminology used in this report, an infeasible scenario means that the
model could not find a solution given the particular conditions of a certain scenario (i.e. the
1.5ºC temperature target when CCS is not available or renewable energy is limited). This could
be due to technical (the remaining technology options could not meet the demand and keep
emissions at the necessary level) or economic concerns (prices of certain markets would be
disproportionate to ensure the required emissions cap). However, the fact that the model can
solve a scenario does not necessarily mean that it could be easily transposed into the real world.
Political and social concerns could complicate the implementation of theoretically feasible
scenarios and this is precisely what triggers the relevance of stakeholder participation in the
decision making process.
D.4.3 Implications of mitigation portfolios based on stakeholder preferences
39
6 REFERENCES
Adger, W. N., Dessai, S., Goulden, M., Hulme, M., Lorenzoni, I., Nelson, D. R., ... and Wreford,
A. (2009). Are there social limits to adaptation to climate change?. Climatic change, 93(3), 335-
354.
Anderson, K. and Peters, G. (2016). The trouble with negative emissions. Science, 354(6309),
182-183.
Calvin, K., Clarke, L., Kyle, P., Wise, M., Hartin, C., and Patel, P. (2015). Introduction to the
Global Change Assessment Model (GCAM). Joint GCAM Community Modelling Meeting and GTSP
Technical Workshop.
Calvin, K., Bond-Lamberty, B., Clarke, L., Edmonds, J., Eom, J., Hartin, C., … and McJeon, H.
(2016). The SSP4: A world of deepening inequality. Global Environmental Change. Article in
press.
Clarke, L., Kyle, P., Wise, M., Calvin, K., Edmons, J., Kim, S., Placet M. and Smith, S. (2009).
CO2 Emissions Mitigation and Technological Advance: An Updated Analysis of Advanced
Technology Scenarios. (Scenarios Updated January 2009). Prepared for the U.S. Department of
Energy. PNNL-18075.
Edenhofer, O., Knopf, B., Barker, T., Baumstark, L., Bellevrat, E., Chateau, B., … and Leimbach,
M. (2010). The economics of low stabilization: model comparison of mitigation strategies and
costs. The Energy Journal, 31(1): 11-48.
Edmonds, J. and Reilly, J. 1983. A Long-Term, Global, Energy-Economic Model of Carbon Dioxide
Release From Fossil Fuel Use. Energy Economics, 5(2):74-88.
IPCC (2014a). Synthesis Report. In: Climate Change 2014: Contribution of Working Groups I, II
and III to the Fifth Assessment Report of the Intergovernmental Panel on Climate Change [Core
Writing Team, R.K. Pachauri and L.A. Meyer (eds.)]. IPCC, Geneva, Switzerland, 151 pp.
D.4.3 Implications of mitigation portfolios based on stakeholder preferences
40
IPCC. (2014b). Technical Summary. In O. R.-M. Edenhofer. Cambridge, UK and USA: Cambridge
University Press.
Kriegler, E., Weyant, J. P., Blanford, G. J., Krey, V., Clarke, L., Edmonds, J., … Rose, S. K.
(2014). The role of technology for achieving climate policy objectives: overview of the EMF 27
study on global technology and climate policy strategies. Climatic Change, 123(3-4): 353-367.
Kyle, 2015. Global Change Assessment Model (GCAM) Tutorial.
Mietzner, D. and Reger, G. (2005). Advantages and disadvantages of scenario approaches for
strategic foresight. International Journal of Technology Intelligence and Planning, 1(2): 220-239.
Moss, R., Edmonds, J., Hibbard, K., Rose, M., van Vuuren, D., Carter, T., … Wilbanks, T. (2010).
The next generation of scenarios for climate change research and assessment. Nature,
463(7282):747-56.
O'Neill, B., Carter, T., Ebi, K., Edmonds, J., Hallegatte, S., Kemp-Benedict, E., …Van Vuuren, D.
(2012). Meeting Report of the Workshop on The Nature and Use of New Socioeconomic Pathways
for Climate Change Workshop on The Nature and Use of New Socioeconomic Pathways for
Climate Change. Boulder, CO, USA.
Ranger, N., Gohar, L. K., Lowe, J.A., Raper, S.C.B., Bowen, A. and Ward, R.E. (2012). Is it
possible to limit global warming to no more than 1.5 °C? Climatic Change, 111: 973–981
Rogelj, J., Luderer, G., Pietzcker, R. C., Kriegler, E., Schaeffer, M., Krey, V., & Riahi, K. (2015).
Energy system transformations for limiting end-of-century warming to below 1.5 [deg] C. Nature
Climate Change, 5(6): 519-527.
Schleussner CF, Lissner TK, Fischer EM et al (2016) Differential climate impacts for policy-
relevant limits to global warming: the case of 1.5 °C and 2°C. Earth System Dynamics, 7: 327–
351.
Smith, S.J., Pitcher, H. and Wigley, T.M.L. (2005). Future sulfur dioxide emissions. Climate
Change, 73(3): 267–318.
Smith, S.J. and T.M.L. Wigley (2006). Multi-gas forcing stabilization with the MiniCAM. Energy J
SI, 27: 373–391.
Verdolini, Elena and Diaz Anadon, Laura, Baker, Erin and Bosetti, Valentina and Reis, Lara
Aleluia, The Future Prospects of Energy Technologies: Insights from Expert Elicitations. FEEM
Working Paper No. 47.2016.
Vergragt, P. J., Markusson, N. and Karlsson, H. (2011). Carbon capture and storage, bio-energy
with carbon capture and storage, and the escape from the fossil-fuel lock-in. Global
Environmental Change, 21(2): 282-292.
D.4.3 Implications of mitigation portfolios based on stakeholder preferences
41
7 APPENDIX 1 – ONLINE SURVEY FOR
STAKEHOLDERS, 1ST ROUND
Q1. In your opinion, what is the optimal temperature target that we should aim for to limit global warming? Please select one of the following options:
Answer Options Response Percent Response Count
Below 1.5 ºC 53.6% 15
Below 2 ºC 39.3% 11
Below 3 ºC 7.1% 2
answered question 28
skipped question 0
Q2. From a global perspective, if you had to allocate funds for climate change (e.g. via the Green Climate Fund), which combination of mitigation and adaptation measures would you choose? Please select one of the following options:
Answer Options Response Percent Response Count
100% Mitigation 0.0% 0
75% Mitigation and 25% Adaptation 42.9% 12
50% Mitigation and 50% Adaptation 50.0% 14
25% Mitigation and 75% Adaptation 3.6% 1
100% Adaptation 3.6% 1
answered question 28
skipped question 0
D.4.3 Implications of mitigation portfolios based on stakeholder preferences
42
Q3. Addressing climate change could go at the expense of economic growth, especially when no or only a few low-emission (technology) options are available in a country context. What is your view on the debate about whether economic growth should prevail over climate change mitigation/adaptation measures or the other way around? Please select one of the following statements:
Answer Options Response Percent Response Count
Economic growth should prevail over climate change mitigation investments - economic growth is needed to accelerate low-emission technology development.
0.0% 0
Economic growth should prevail over climate change mitigation investments – climate change is not the only problem to solve.
3.6% 1
Climate change mitigation investments should prevail over economic growth - we cannot afford further delay of climate change mitigation.
17.9% 5
Climate change investments should prevail over economic growth – Economic growth is the main reason why we face climate change.
14.3% 4
There is no need to prevail one over the other – the Green Growth concept enables us to decouple economic growth from increased greenhouse gas emissions.
64.3% 18
answered question 28
skipped question 0
D.4.3 Implications of mitigation portfolios based on stakeholder preferences
43
Q4. With a view to climate change mitigation investments in the global energy sector, which technologies, do you think, will be most important during the next 50 years? Please rank the following options from 1 (most preferred) to 9 (least preferred); (Or from 1 to 10, in case you wish to provide other options in the section ´other´):
D.4.3 Implications of mitigation portfolios based on stakeholder preferences
44
Q5. The technologies listed in Question 4 are in different stages of development in terms of market readiness. Considering development support, technologies that are still in a research, development and demonstration phase, require more public (governmental) support than technologies that are close to commercial applications in the market. Which of the following options, do you think, should receive more public support in the next 50 years in the global energy sector? Please select the two most preferred options, indicating their importance with using number 1 (most preferred) and number 2 (second preferred):
D.4.3 Implications of mitigation portfolios based on stakeholder preferences
45
Q6. In a transition to a low-emission future, there could still be considerable scope for fossil fuels in the global energy mix. With which of the following statements do you agree most?
Answer Options Response Percent Response Count
Fossil fuels will remain the most important energy sources because of their widespread availability, relatively low costs and energy reliability.
3.7% 1
The share of fossil fuels in global energy mixes will decrease during the next two decades, except for natural gas, which will remain important as back up for intermittent renewables.
51.9% 14
Globally, energy systems will increasingly become decentralized, which implies that fossil fuels will be marginalized by 2050.
44.4% 12
There is no urgent need to reduce fossil fuel use, as technologies are or will be available to capture and store emitted greenhouse gases.
0.0% 0
answered question 27
skipped question 1
Q7. Many energy-economic models assume a worldwide exploitation of CCS during the first half of this century. Considering a global perspective, how would you respond to this assumption? Multiple answers are possible.
Answer Options Response Percent Response Count
Yes, there will be a global CCS expansion soon 7.1% 2
Yes, there will be a global CCS expansion but not within the next 2 or 3 decades
50.0% 14
No, CCS will not be deployed globally for technological reasons 14.3% 4
No, CCS will not be deployed globally for economic reasons 28.6% 8
No, CCS will not be deployed globally due to limited public acceptance and safety concerns
35.7% 10
answered question 28
skipped question 0
Q8. From your personal/professional perspective, what is the most likely (feasible) future of nuclear power at a global scale?
Answer Options Response Percent Response Count
D.4.3 Implications of mitigation portfolios based on stakeholder preferences
46
Nuclear energy phase-out: there will be no additional nuclear power plants in the future.
24.0% 6
Nuclear energy remains constant: current levels of nuclear power production in the world remain the same in the future.
64.0% 16
Global expansion of nuclear energy production: nuclear power becomes increasingly important in future energy mixes in the world.
12.0% 3
answered question 25
skipped question 3
Q9. From your personal/professional perspective, what is the most likely (feasible) future of solar, hydro and wind based renewable energy from a global perspective?
Answer Options Response Percent Response Count
The share of solar, hydro and wind power technologies in the global energy mix will decrease.
0.0% 0
The share of solar, hydro and wind power technologies in the global energy mix will remain constant at current levels.
3.7% 1
The share of solar, hydro and wind power technologies in the global energy mix will increase.
96.3% 26
answered question 27
skipped question 1
Q10. From your personal/professional perspective, what is the most likely (feasible) future of biomass in the global energy mix?
Answer Options Response Percent Response Count
Limited biomass: limited biomass deployment globally in the future
11.1% 3
Biomass constant: current global levels of biomass applications remain the same in the future
33.3% 9
Biomass expansion: biomass deployment in the world will utilize its maximum potential in the future
55.6% 15
answered question 27
skipped question 1
D.4.3 Implications of mitigation portfolios based on stakeholder preferences
47
Q11. Next to low-emission options and measures in the energy sector, which other sectors do you consider important, from a global perspective, for climate change mitigation? Multiple answers are possible.
Answer Options Response Percent Response Count
Industry 53.6% 15
Transport 85.7% 24
Agriculture 82.1% 23
Waste 39.3% 11
Forestry 53.6% 15
Other (Please specify this at the end of the survey in the provided comment box.)
7.1% 2
answered question 28
skipped question 0
D.4.3 Implications of mitigation portfolios based on stakeholder preferences
48
8 APPENDIX 2 – ONLINE SURVEY FOR
STAKEHOLDERS, 2ND ROUND
Statement 1 (for Q1-Q5): Temperature target
In a scenario of a maximum 2ºC global temperature increase target by the end of the century,
global emissions would be 65% higher than in a 1.5ºC scenario (see Figure 1 and Figure 2 below)
but less than half of the emissions in a 3ºC scenario. Additionally, compared to a 2ºC target,
global primary energy consumption is 3% lower under a 1.5ºC target and 9% higher under a 3ºC
target. Finally, global mitigation costs by 2100 account for 6% of the GDP when the temperature
target is 1.5ºC, 3% for a 2ºC target and 0.3% for a 3ºC target. For each target, this represents a
reduction in annual economic growth of less than 0.05 percentage point.
Figure 1. CO2 emissions by 2100; 2ºC target
D.4.3 Implications of mitigation portfolios based on stakeholder preferences
49
Figure 2. CO2 emissions by 2100; 1.5ºC target
Note: In the Limited biomass scenario, biomass is constrained to a maximum of 100EJ/yr. In the
Limited solar/wind scenario, solar and wind technologies are constrained to a maximum
electricity share of 20% for any year. In the No CCS scenario, there is no CCS. In the Nuclear
phase out scenario, existing plants operate until the end of their lifetime and no new nuclear
plants are added. Limited solar/wind and No CCS are not feasible for a 1.5ºC temperature
target.
Q1. Considering the relationship between CO2 emissions, energy consumption and mitigation costs presented in Statement 1 for different long-term global temperature limitation targets, which target would you prefer? Please select one of the following options:
Answer Options Response Percent Response Count
Below 1.5 ºC 33.3% 3
Below 2 ºC 55.6% 5
Below 3 ºC 11.1% 1
answered question 9
skipped question 0
D.4.3 Implications of mitigation portfolios based on stakeholder preferences
50
Q2. Consider the information provided in Statement 1 and your answer to Q1 (preferred temperature target). From a global perspective, if you had to allocate funds for climate change (e.g. via the Green Climate Fund), how would you divide funds between measures for mitigation and for adaptation? Please select one of the following options:
Answer Options Response Percent Response Count
100% Mitigation 0.0% 0
75% Mitigation and 25% Adaptation 55.6% 5
50% Mitigation and 50% Adaptation 44.4% 4
25% Mitigation and 75% Adaptation 0.0% 0
100% Adaptation 0.0% 0
answered question 9
skipped question 0
D.4.3 Implications of mitigation portfolios based on stakeholder preferences
51
Q3. Considering the trade-offs between mitigation costs and GDP growth rates presented in Statement 1 and your answer to Q1 (preferred temperature limitation target). What is your view on the debate about whether economic growth should prevail over climate change mitigation/adaptation measures or the other way round? Please select one of the following statements:
Answer Options Response Percent Response Count
Economic growth should prevail over climate change mitigation investments - economic growth is needed to accelerate low-emission technology development.
0.0% 0
Economic growth should prevail over climate change mitigation investments – climate change is not the only problem to solve.
0.0% 0
Climate change mitigation investments should prevail over economic growth - we cannot afford further delay of climate change mitigation.
22.2% 2
Climate change investments should prevail over economic growth – Economic growth is the main reason why we face climate change.
11.1% 1
There is no need to prevail one over the other – the Green Growth concept enables us to decouple economic growth from increased greenhouse gas emissions.
66.7% 6
answered question 9
skipped question 0
D.4.3 Implications of mitigation portfolios based on stakeholder preferences
52
Q4. Statement 1 contains estimates of mitigation costs expressed as percentage of GDP for each of the three temperature limitation targets explored. For your preferred target (your answer to Q1), is the estimated share of mitigation per GDP lower or higher than you expected?
Answer Options Response Percent Response Count
Lower 55.6% 5
Higher 44.4% 4
answered question 9
skipped question 0
Q5. Have you changed your opinion about the acceptability of actions for mitigation on the basis of the information provided in Statement 1 about the trade-offs between mitigation costs and GDP growth rates for different temperature limitation targets?
Answer Options Response Percent Response Count
Yes 22.2% 2
No 77.8% 7
answered question 9
skipped question 0
Statement 2 (for Q6-Q11): Technology options
Based on the stakeholder preferences expressed in the first survey, we have modelled (using the
GCAM model) the following set of scenarios:
- no climate policy
- climate policy and all technologies available
- climate policy with all technologies available, but with limited use of biomass
- climate policy with all technologies available, but with limited use of solar/wind
- climate policy with all technologies available except CCS
- climate policy with all technologies available but assuming a nuclear energy phase out
In a 2ºC temperature stabilization scenario by the end of the century, the scenarios with highest
mitigation costs (compared to a situation where all the technology options are available) are
those with no CCS and limited biomass availability (increase of mitigation costs by 53% and 73%,
respectively; see Figure 3). In these scenarios, CO2 emission reduction in 2100 will be the lowest
of all mitigation portfolios (see Figure 1 above) which requires additional efforts to meet the
climate target. On the other hand, the increase in the mitigation costs is lower in scenarios
D.4.3 Implications of mitigation portfolios based on stakeholder preferences
53
which assume restricted use of intermittent renewables (increase by 8%) and nuclear energy
phase out (cost increase by 15% compared to a no-climate policy scenario).
Figure 3. Mitigation cost increment compared to no climate policy scenario; 2ºC target
Note: In the Limited biomass scenario, biomass is constrained to a maximum of 100EJ/yr. In the
Limited solar/wind scenario, solar and wind technologies are constrained to a maximum
electricity share of 20% for any year. In the No CCS scenario, there is no CCS. In the Nuclear
phase out scenario, existing plants operate until the end of their lifetime and no new nuclear
plants are added. Limited solar/wind and No CCS are not feasible for a 1.5ºC temperature
target. Mitigation costs for the period 2020-2100, discounted at 5% per year.
Furthermore, according to the model results, all scenarios require negative emissions (carbon
removal from the atmosphere) for reaching the 2ºC temperature target. The scenarios "all
emissions from 2080 onwards while the scenarios "no CCS" and "limited biomass" require negative
emissions only from 2095 and 2100 onwards, respectively (see Figure 1 above). However, policy
costs increase when emission reductions are lower than expected and negative emissions
delayed, since other more expensive options need to be used to fulfill the climate goals. In fact,
if negative emission options are not readily available, emission reductions should start earlier. In
particular, if the technology options achieving negative emissions are limited, emission
reductions should start in 2020 (otherwise in 2030).
Concerning the global energy mix, in the absence of a climate policy ("No climate policy"
scenario), coal and natural gas remain the main component of the mix with more than 60% of
the total energy consumption. In all the other mitigation portfolios, however, their share in the
global mix is considerably reduced. This is especially apparent in the future use of coal, because
the model shows that the share of coal reduces over time and at the end of the century it is only
present in combination with CCS (both for the 2ºC and the 1.5ºC targets; see Figure 4). We
assumed that CCS is available from 2030 onwards for all the scenarios (except of course for the
"no CCS" scenario).
D.4.3 Implications of mitigation portfolios based on stakeholder preferences
54
Figure 4. Energy mix in 2050 and 2100 for both target scenarios
Note: In the Limited biomass scenario, biomass is constrained to a maximum of 100EJ/yr. In the
Limited solar/wind scenario, solar and wind technologies are constrained to a maximum
electricity share of 20% for any year. In the No CCS scenario, there is no CCS. In the Nuclear
phase out scenario, existing plants operate until the end of their lifetime and no new nuclear
plants are added. Limited solar/wind and No CCS are not feasible for a 1.5ºC temperature
target.
Moreover, in the absence of CCS ("no CCS"), fossil-fuel-based technologies are completely
eliminated (i.e. oil and coal) or marginalized (i.e. natural gas) by the end of the century,
although they still play an important role in 2050. In this "no CCS" scenario, biomass becomes the
most relevant mitigation technology in 2100, with roughly 40% share of the global energy mix
(since it is an emission-neutral technology and in absence of CCS it acts as a substitute for fossil
technologies). Renewable energy and nuclear power increase their share in the mix when
D.4.3 Implications of mitigation portfolios based on stakeholder preferences
55
technologies with negative emissions potential are limited or not available (i.e. scenarios with
no CCS and limited bioenergy).
Concerning the global electricity mix, renewable energy and CCS are the key technologies to
limit global warming, both in the 1.5 and 2oC scenarios (see Figure 5).
Figure 5. Mitigation technology options for electricity generation
Note: In the Limited biomass scenario, biomass is constrained to a maximum of 100EJ/yr. In the
Limited solar/wind scenario, solar and wind technologies are constrained to a maximum
electricity share of 20% for any year. In the No CCS scenario, there is no CCS. In the Nuclear
phase out scenario, existing plants operate until the end of their lifetime and no new nuclear
D.4.3 Implications of mitigation portfolios based on stakeholder preferences
56
plants are added. Limited solar/wind and No CCS are not feasible for a 1.5ºC temperature
target.
Finally, we can conclude that the "limited intermittent renewables" scenario and the "no CCS"
scenario are not feasible under a 1.5ºC temperature stabilization target. That is: without CCS
and limited availability of solar and wind technologies on a global scale, the model was not able
to find a suitable technology mix to achieve the necessary emissions reduction for limiting the
global temperature to 1.5ºC in 2100. However, the model shows that the 1.5º target is feasible
without using nuclear energy.
Q6. Consider the information provided in Statement 2 and your answers to Q1-5. With a view to climate change mitigation investments in the global energy sector, which technologies, do you think, will be most important in this century? Please rank the following options from 1 (most preferred) to 9 (least preferred); (Or from 1 to 10, in case you wish to provide other options in the section ´other´):
D.4.3 Implications of mitigation portfolios based on stakeholder preferences
57
Q7. Consider the information provided in Statement 2. The technologies listed in Question 6 are in different stages of development in terms of market readiness. Technologies that are still in a research, development and demonstration phase require more public (governmental) support than those that are close to commercial application in the market. Which of the following technology options should, in your view, receive most public support in this century in the global energy sector? Please select the two most preferred options, indicating their importance with using number 1 (most preferred) and number 2 (second preferred):
D.4.3 Implications of mitigation portfolios based on stakeholder preferences
58
Q8. Consider the information provided in Statement 2. In a transition to a low-emission future (either 1.5 or 2oC target), there could still be considerable scope for fossil fuels in the global energy mix by 2050. With which of the following statements do you agree most?
Answer Options Response Percent Response Count
Fossil fuels will remain the most important energy sources because of their widespread availability, relatively low costs and energy reliability.
0.0% 0
The share of fossil fuels in global energy mixes will decrease during the next two decades, except for natural gas, which will remain important as back up for intermittent renewables.
33.3% 3
Globally, energy systems will increasingly become decentralized, which implies that fossil fuels will be marginalized by 2050.
66.7% 6
There is no urgent need to reduce fossil fuel use, as technologies are or will be available to capture and store emitted greenhouse gases.
0.0% 0
answered question 9
skipped question 0
Q9. Consider the information provided in Statement 2 about the potential roles of CCS in global climate policies. Currently, CCS had not yet been applied to a large, commercial fossil-fire power generation facility (Source: IPCC). Yet, many energy-economic models assume a worldwide exploitation of CCS during the first half of this century. How would you respond to this assumption? Multiple answers are possible.
Answer Options Response Percent Response Count
Yes, there will be a global CCS expansion soon 0.0% 0
Yes, there will be a global CCS expansion but not within the next 2 or 3 decades
50.0% 4
No, CCS will not be deployed globally for technological reasons 25.0% 2
No, CCS will not be deployed globally for economic reasons 37.5% 3
No, CCS will not be deployed globally due to limited public acceptance and safety concerns
37.5% 3
answered question 8
skipped question 1
D.4.3 Implications of mitigation portfolios based on stakeholder preferences
59
Q10. Considering the information provided in Statement 2 about the possible roles of nuclear power in global climate policies, what is, in your view, the most likely (feasible) future of nuclear power at a global scale?
Answer Options Response Percent Response Count
Nuclear energy phase-out: there will be no additional nuclear power plants in the future.
33.3% 3
Nuclear energy remains constant: current levels of nuclear power production in the world remain the same in the future.
44.4% 4
Global expansion of nuclear energy production: nuclear power becomes increasingly important in future energy mixes in the world.
22.2% 2
answered question 9
skipped question 0
Q11. Considering the information provided in Statement 2 about the potential roles of renewable energy technologies in global climate policies, what is, in your view, the most likely (feasible) future of solar, hydro and wind based renewable energy from a global perspective?
Answer Options Response Percent Response Count
The share of solar, hydro and wind power technologies in the global energy mix will decrease.
0.0% 0
The share of solar, hydro and wind power technologies in the global energy mix will remain constant at current levels.
0.0% 0
The share of solar, hydro and wind power technologies in the global energy mix will increase.
100.0% 9
answered question 9
skipped question 0
Statement 3 (for Q12-13): Sectors for climate change mitigation
In terms of CO2 emissions by sector (see Figure 6), without any climate policy, most of the
emissions come from the electricity sector, both in 2050 and in 2100. Assuming a 2oC mitigation
target, this will continue to be the case in some of the climate policy scenarios explored (e.g.
"limited biomass" and "no CCS") until halfway this century. However, after 2050, most of global
CO2 emissions will take place in the transport sector. If we assume a temperature target of
1.5oC, emissions in the energy sector would be reduced relatively quickly, while transport would
D.4.3 Implications of mitigation portfolios based on stakeholder preferences
60
present the highest emissions both in 2050 and 2100, given the difficulties in this sector for a full
decarbonisation.
Figure 6. CO2 emissions share by sector
Note: In the Limited biomass scenario, biomass is constrained to a maximum of 100EJ/yr. In the
Limited solar/wind scenario, solar and wind technologies are constrained to a maximum
electricity share of 20% for any year. In the No CCS scenario, there is no CCS. In the Nuclear
phase out scenario, existing plants operate until the end of their lifetime and no new nuclear
plants are added. AFOLU includes Agriculture, Forestry and other Land Use.
D.4.3 Implications of mitigation portfolios based on stakeholder preferences
61
Q12. Consider the information provided in Statement 3. From your personal/professional perspective, what is the most likely (feasible) future of bioenergy in the global energy mix?
Answer Options Response Percent Response Count
Limited biomass: limited biomass deployment globally in the future
11.1% 1
Biomass constant: current global levels of biomass applications remain the same in the future
22.2% 2
Biomass expansion: biomass deployment in the world will utilize its maximum potential in the future
66.6% 6
answered question 9
skipped question 0
Q13. Consider the information provided in Statement 3. Next to low-emission options and measures in the energy sector, which other sectors do you consider important, from a global perspective, for climate change mitigation? Multiple answers are possible.
Answer Options Response Percent Response Count
Industry 77.8% 7
Transport 88.9% 8
Agriculture 66.7% 6
Waste 55.6% 5
Forestry 44.4% 4
Other (Please specify this at the end of the survey in the provided comment box.)
11.1% 1
answered question 9
skipped question 0
D.4.3 Implications of mitigation portfolios based on stakeholder preferences
62
Additional questions
Q14. Compared to your participation in the first round of this survey, which of the following factors had an influence on your opinion in this second questionnaire? Multiple answers are possible.
Answer Options Response Percent Response Count
Fossil fuels price change 12.5% 1
COP22 in Marrakesh 12.5% 1
Change in the US administration 25.0% 2
Information provided in Statements 1,2 and 3 of this survey 62.5% 5
Other (Please specify this at the end of the survey in the provided comment box.)
25.0% 2
answered question 8
skipped question 1
Q15. Do you think that the results provided in the statements are insightful? Multiple answers are possible. (Additional comments are possible at the end of the survey in the provided comment box.)
Answer Options Response Percent Response Count
Yes, the results provided were useful and new for me 44.4% 4
Yes, the results provided were not new for me, but I find them useful
33.3% 3
No, my expectations of the results where different 25.0% 0
No, although results from models could be useful, the gap between developers/scientists and policy makers is still too big
11.1% 1
No, I do not rely much on the results from models for decision making
11.1% 1
answered question 9
skipped question 0
D.4.3 Implications of mitigation portfolios based on stakeholder preferences
63
9 APPENDIX 3 – SIMULATIONS UNDER A SSP2 STORYLINE
Figure 9 shows the evolution of CO2 emissions with SSP2 and with the GCAM configuration for the
2ºC and 1.5ºC temperature targets with all the technologies available. The difference in the
emissions path is small, but under the SSP2 storyline more emissions are allowed during the first
part of the century, which leads to higher negative emissions in the last decades of the century.
Simulations for the 1.5ºC target with limited technology options were not feasible; hence, no
trade-offs between the two temperature targets can be presented.
Note: In the Limited biomass scenario, biomass is constrained to a maximum of 100EJ/yr. In the Limited solar/wind scenario, solar and wind technologies are constrained to a maximum electricity share of 20% for any year. In the No CCS scenario, there is no CCS. In the Nuclear phase out scenario, existing plants operate until the end of their lifetime and no new nuclear plants are added. Emissions only include the
energy sector.
Figure 9: Evolution of CO2 emissions in the energy sector [MtC] under different socioeconomic scenarios: GCAM reference vs. SSP2


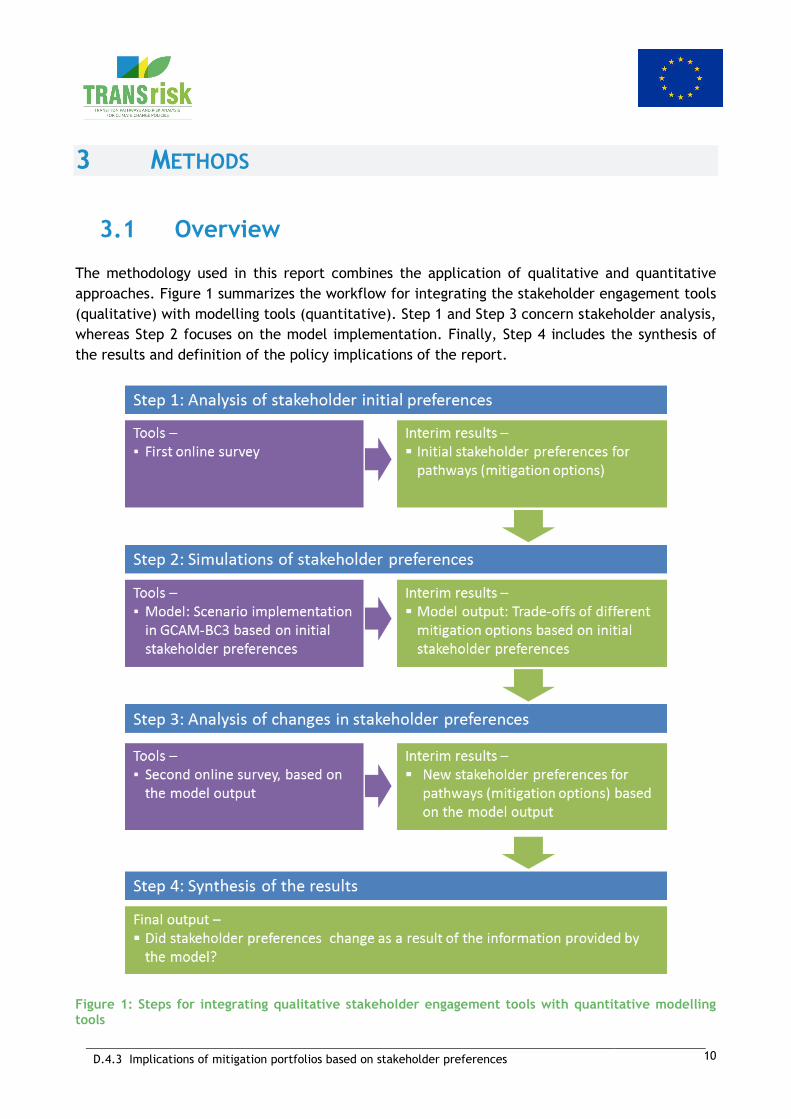


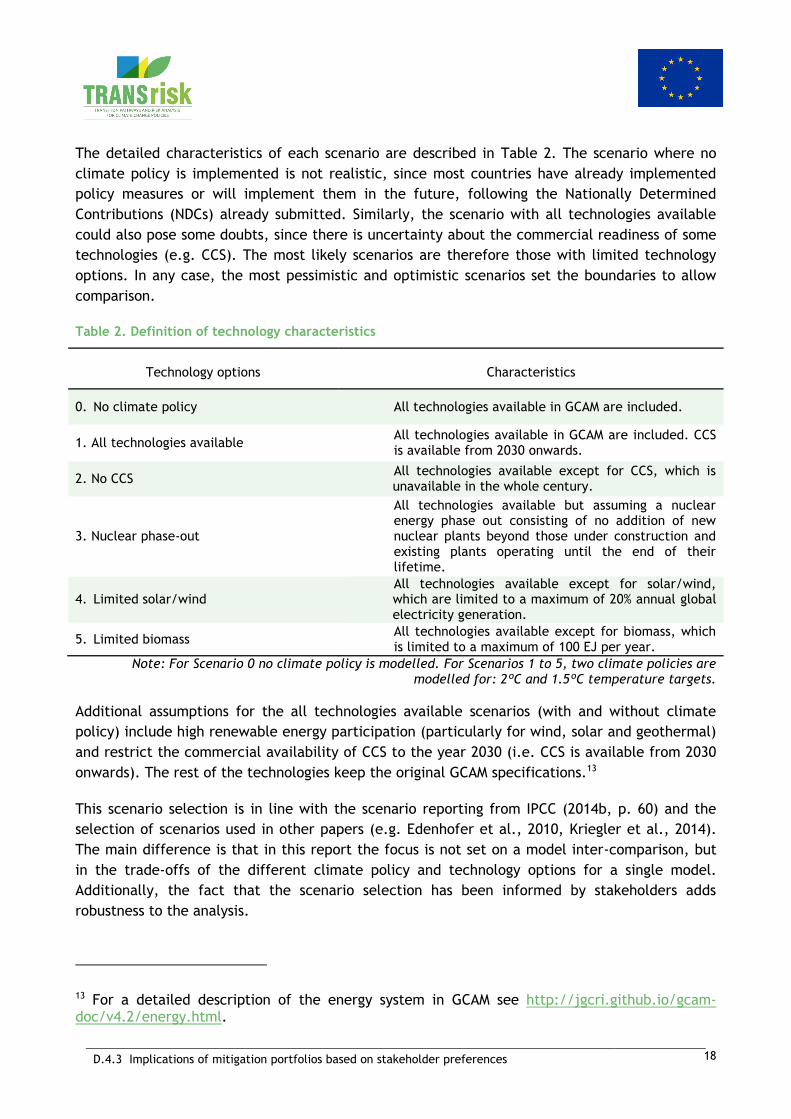


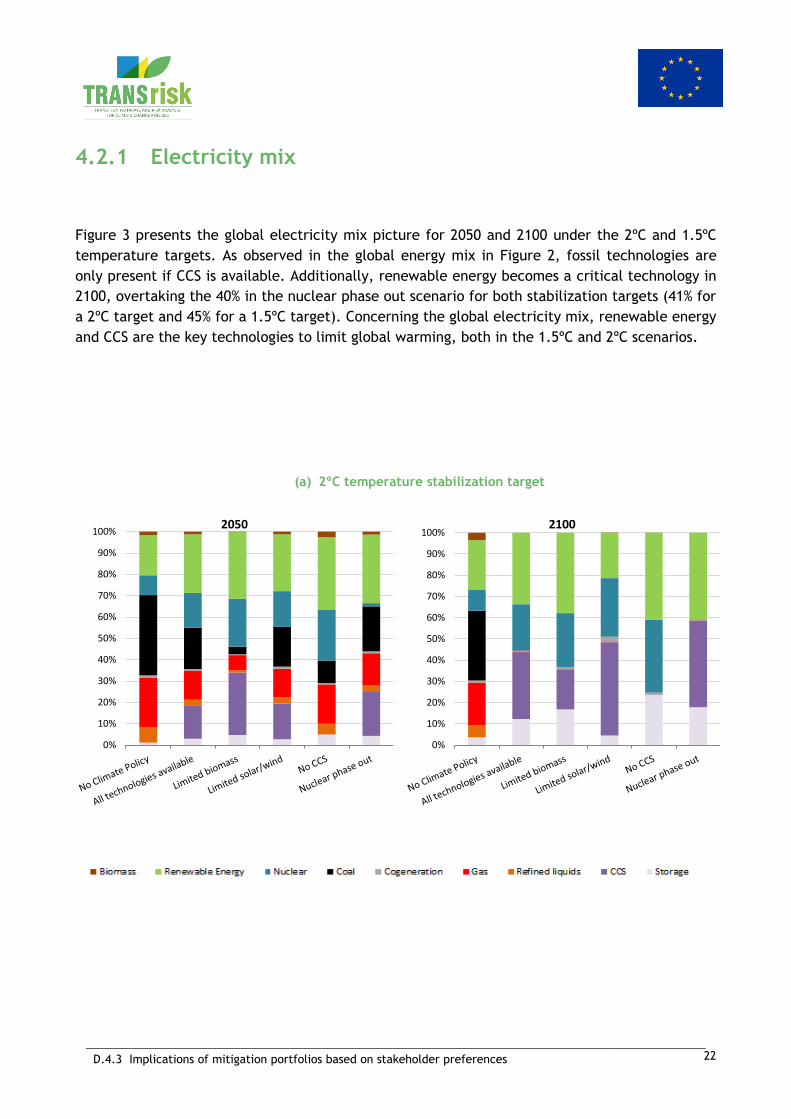


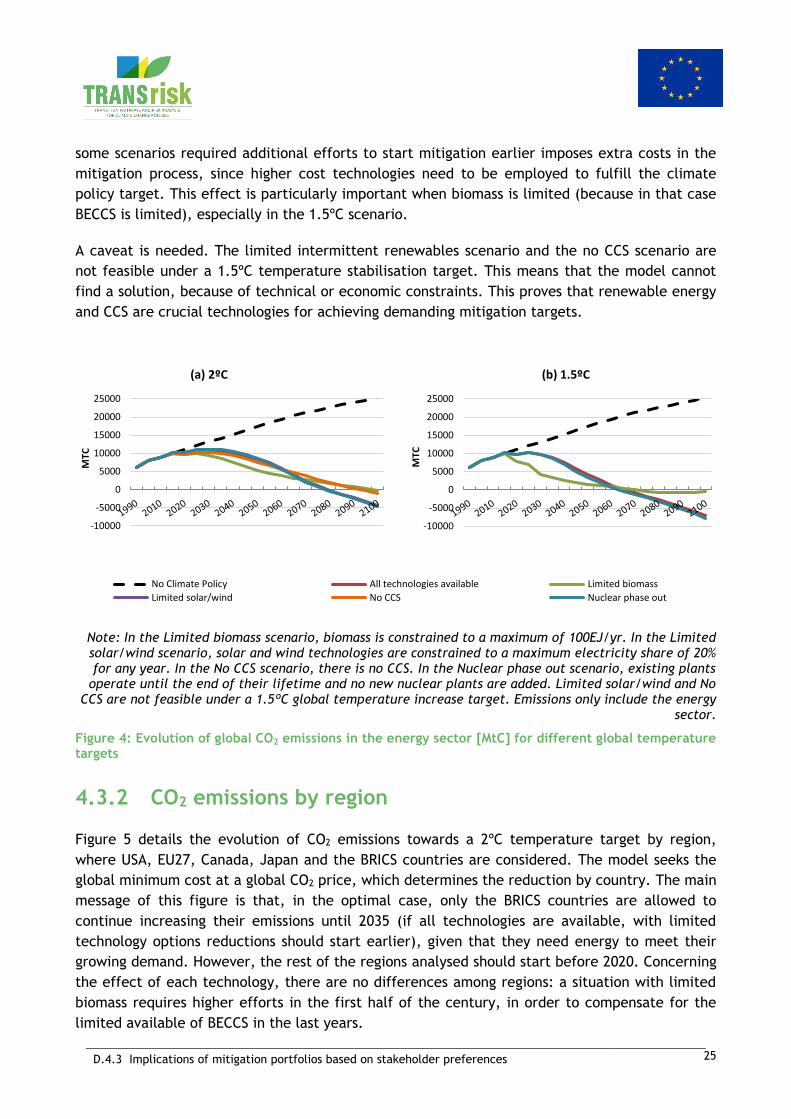


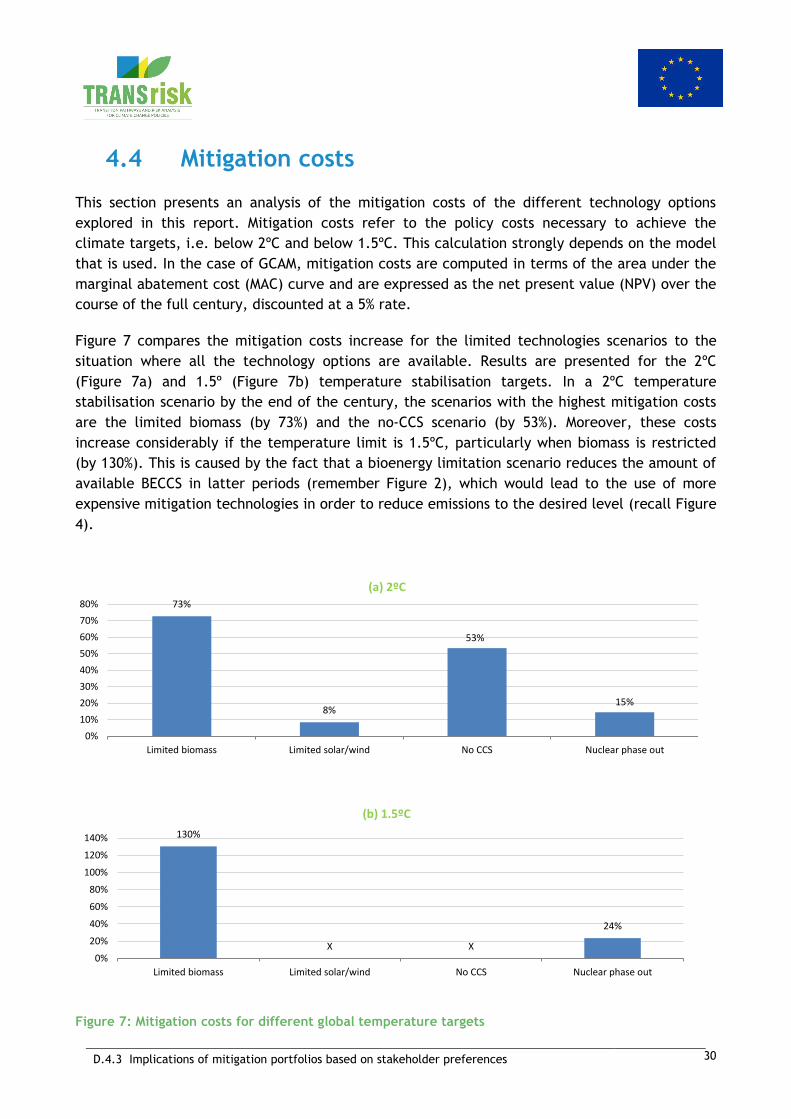

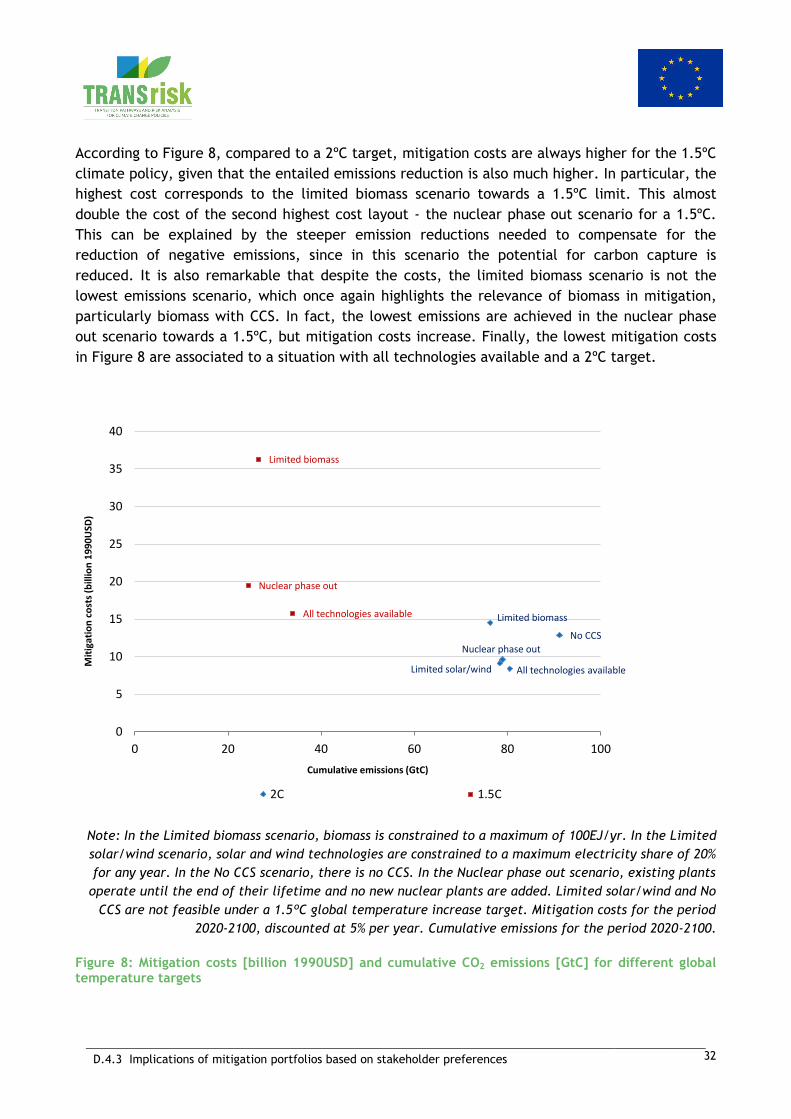
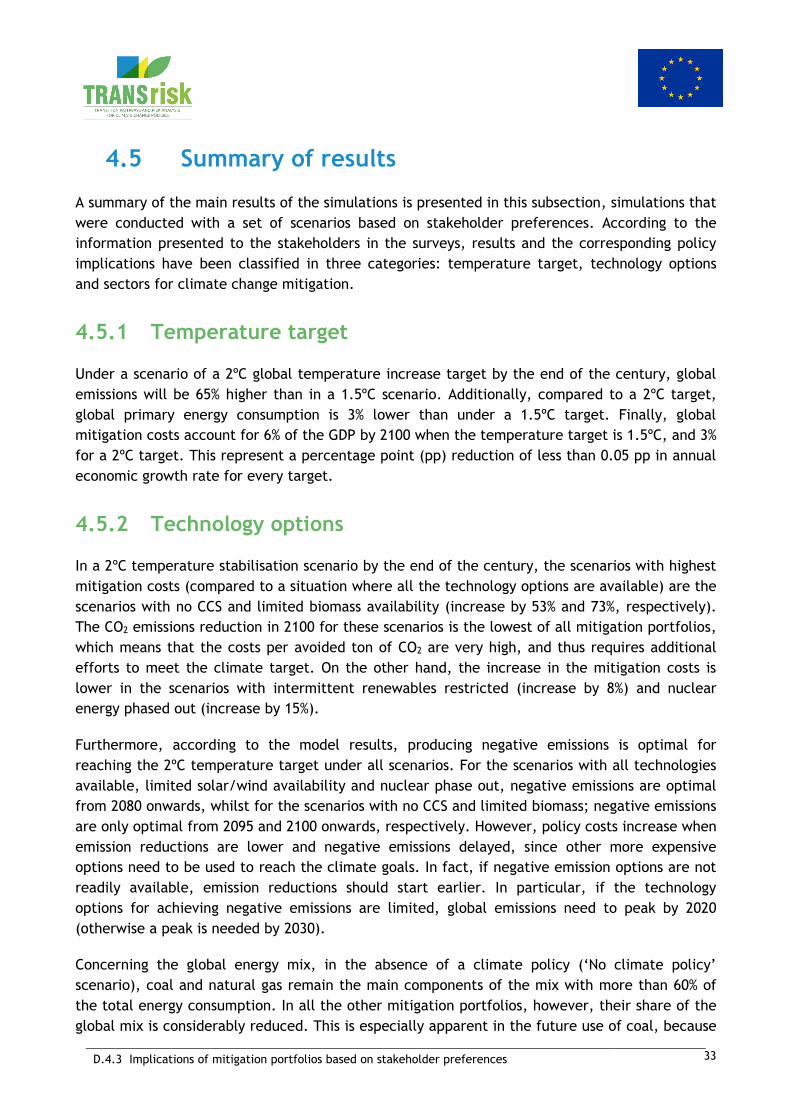


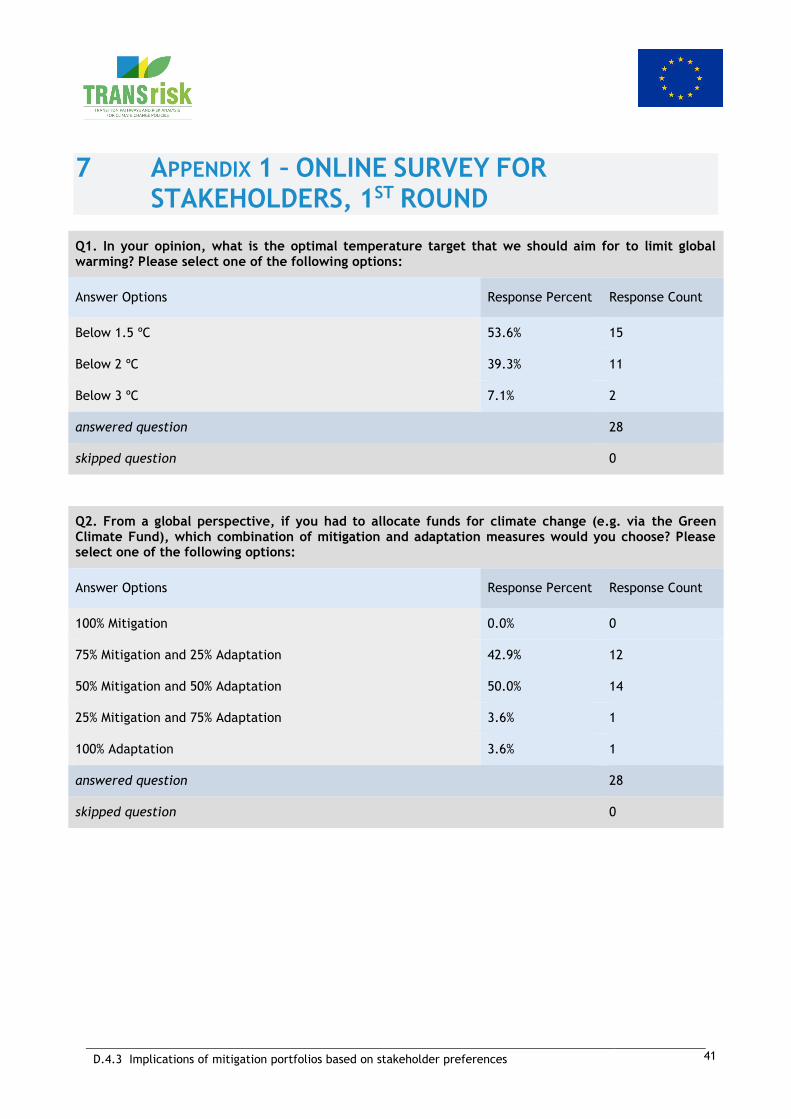
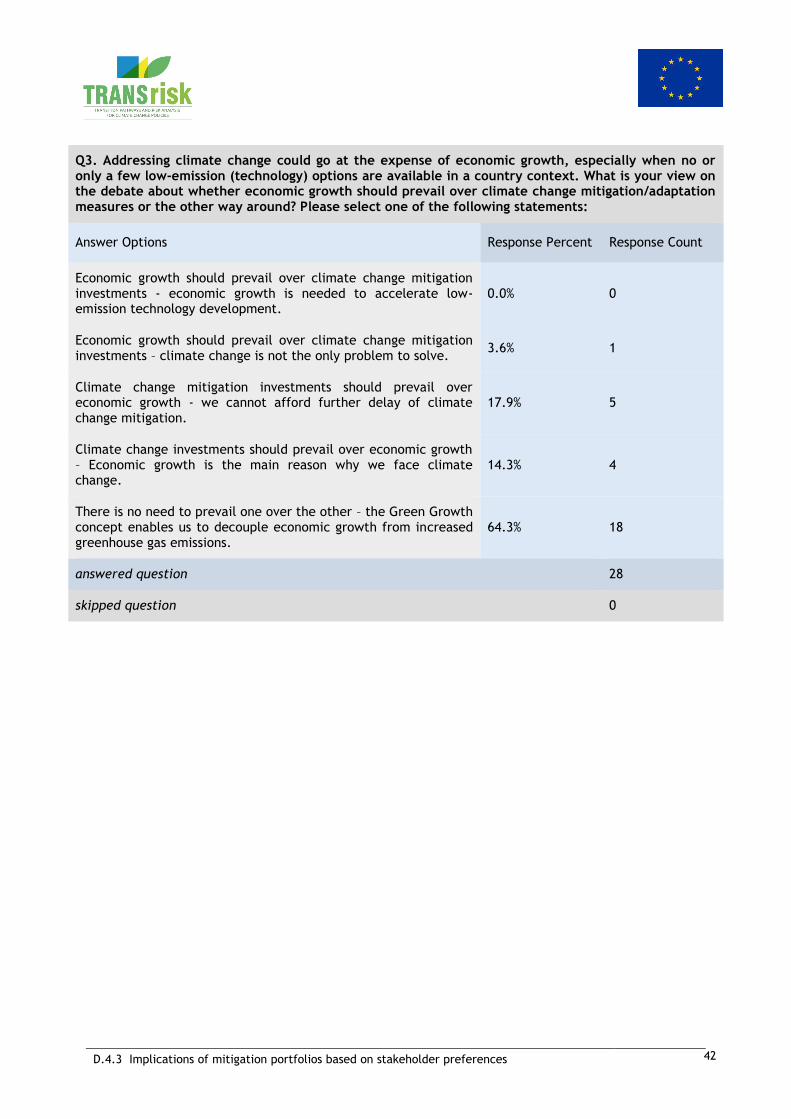
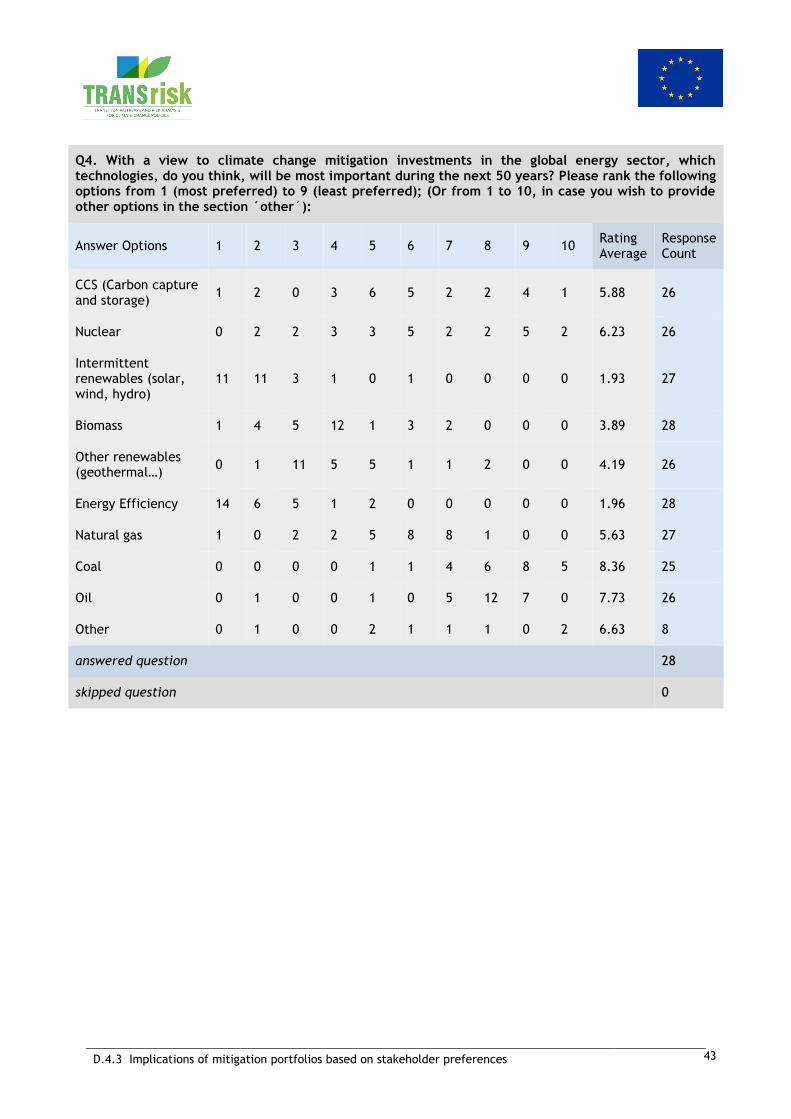
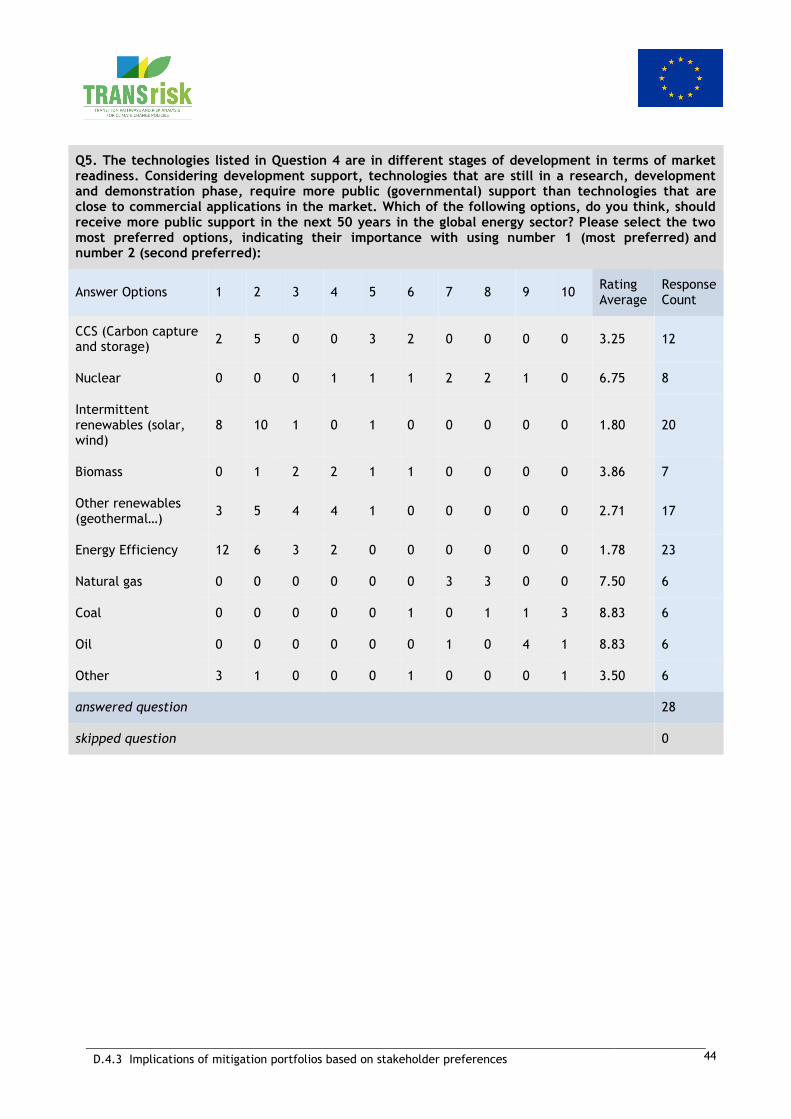


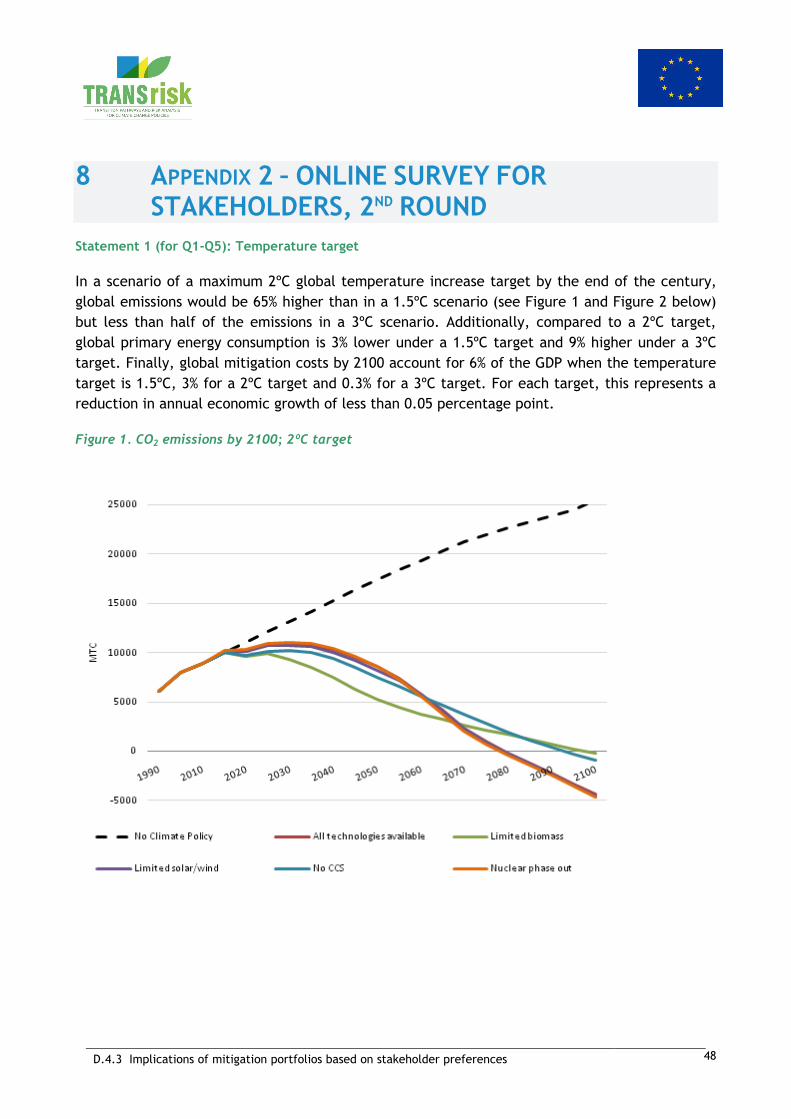


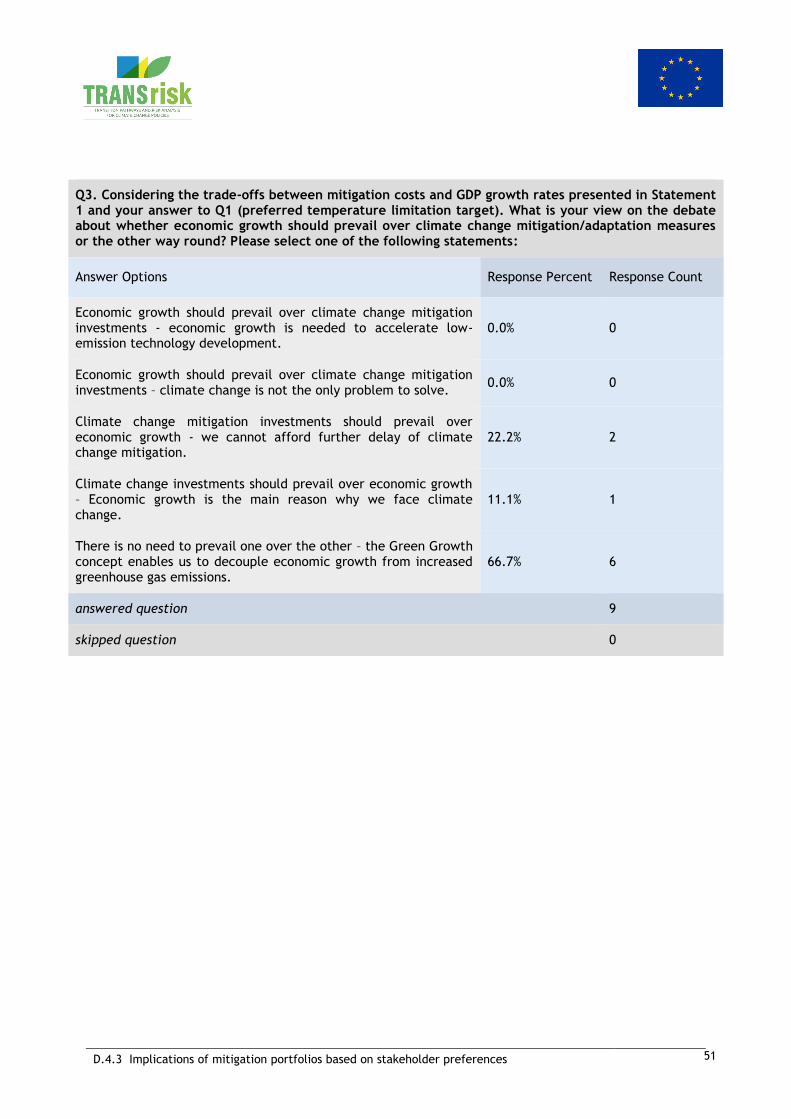

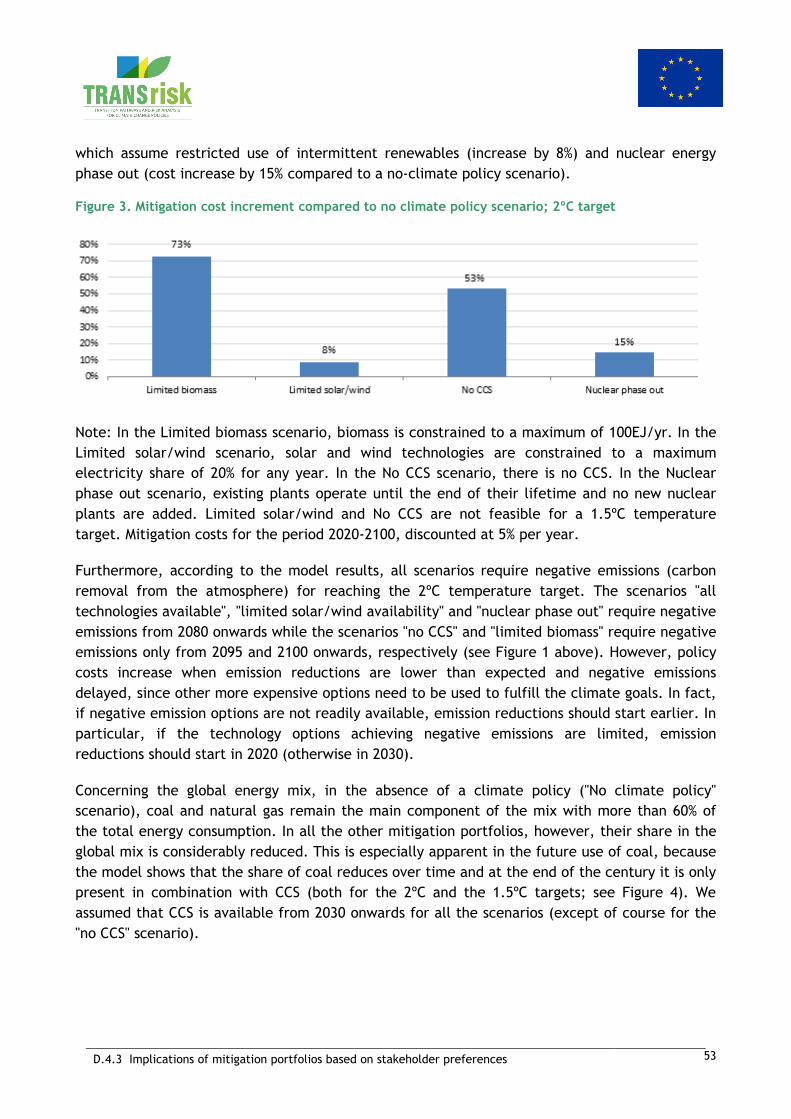
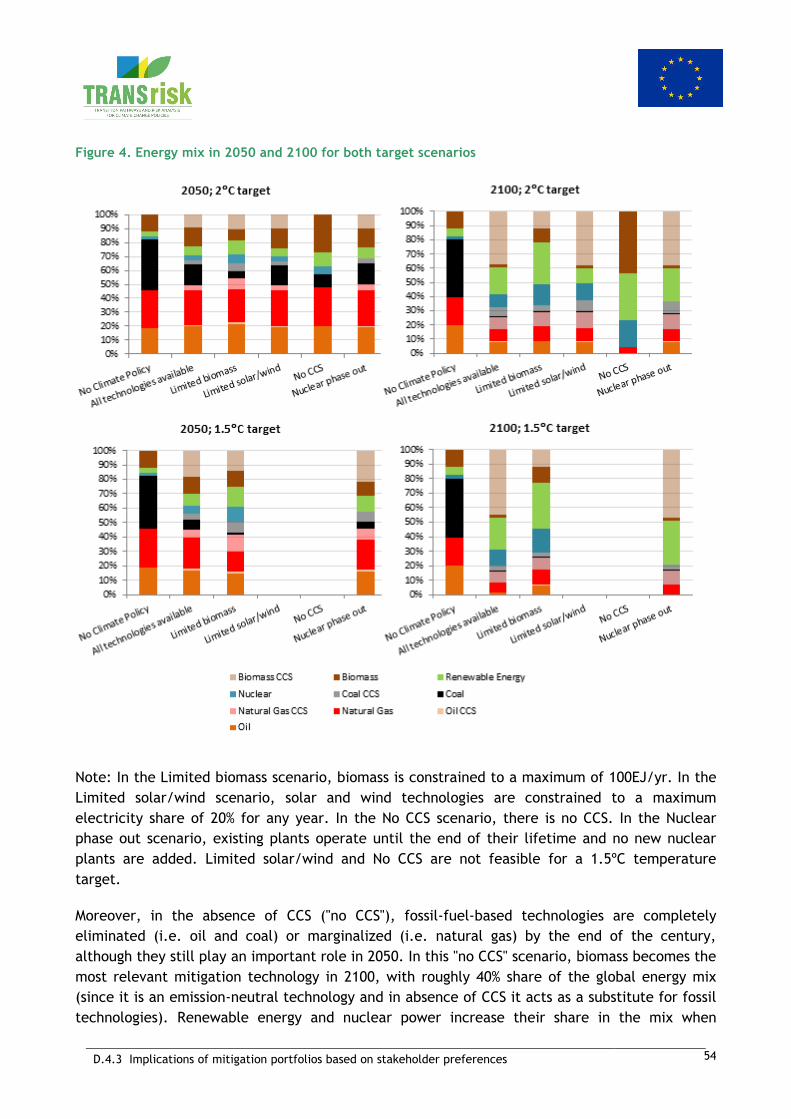

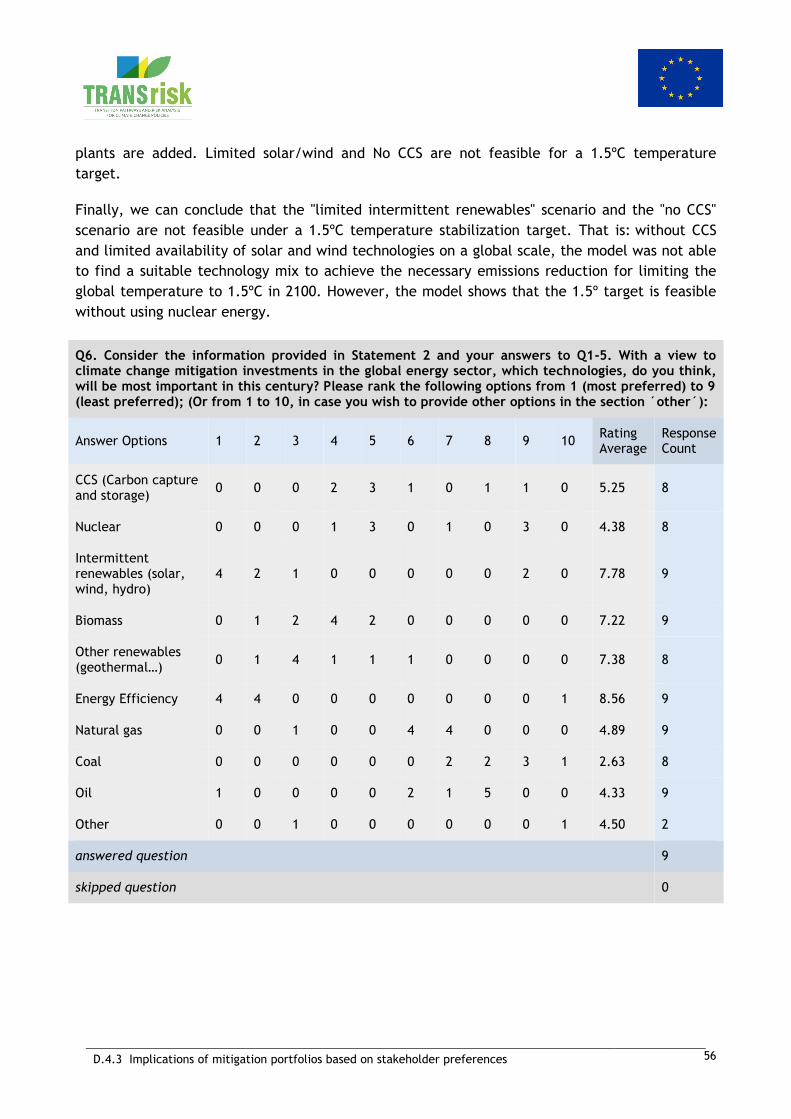
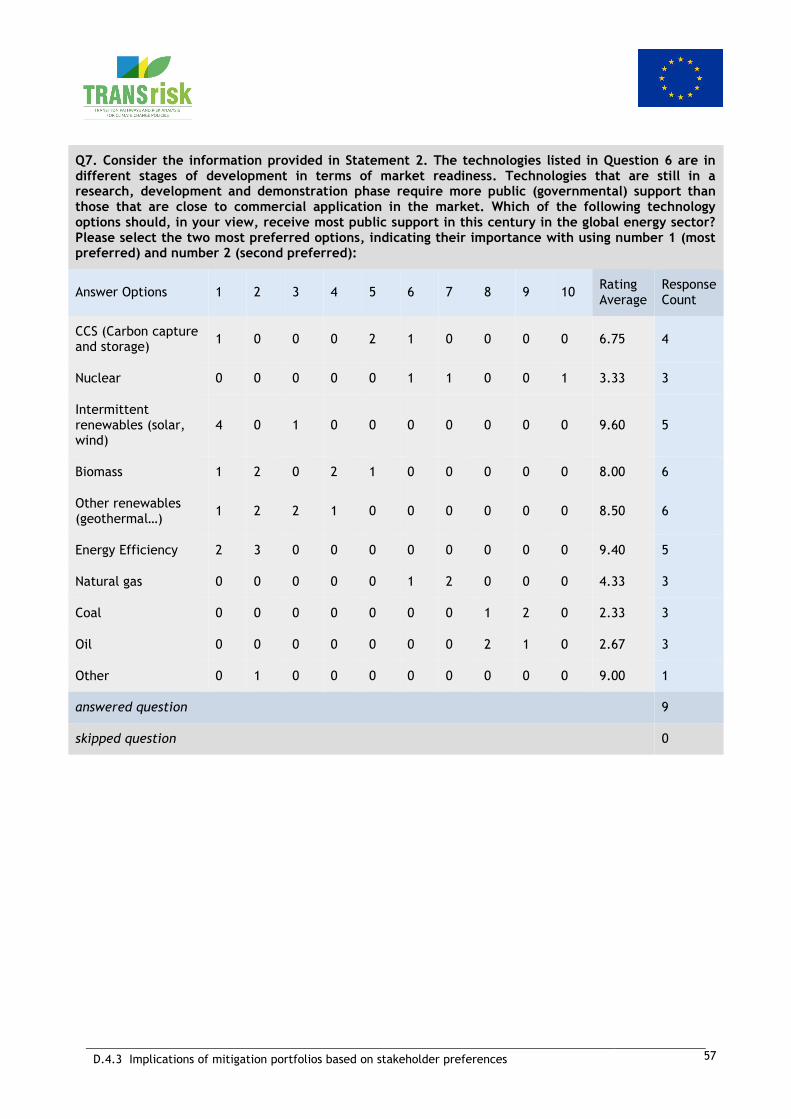


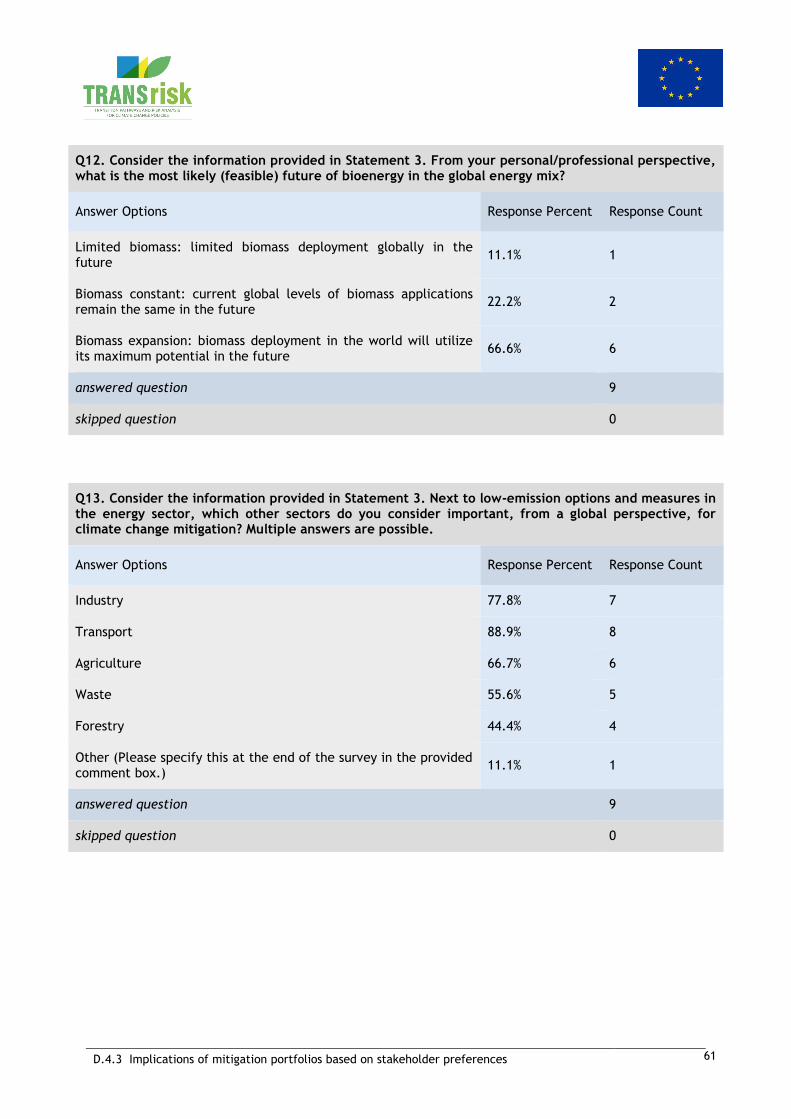
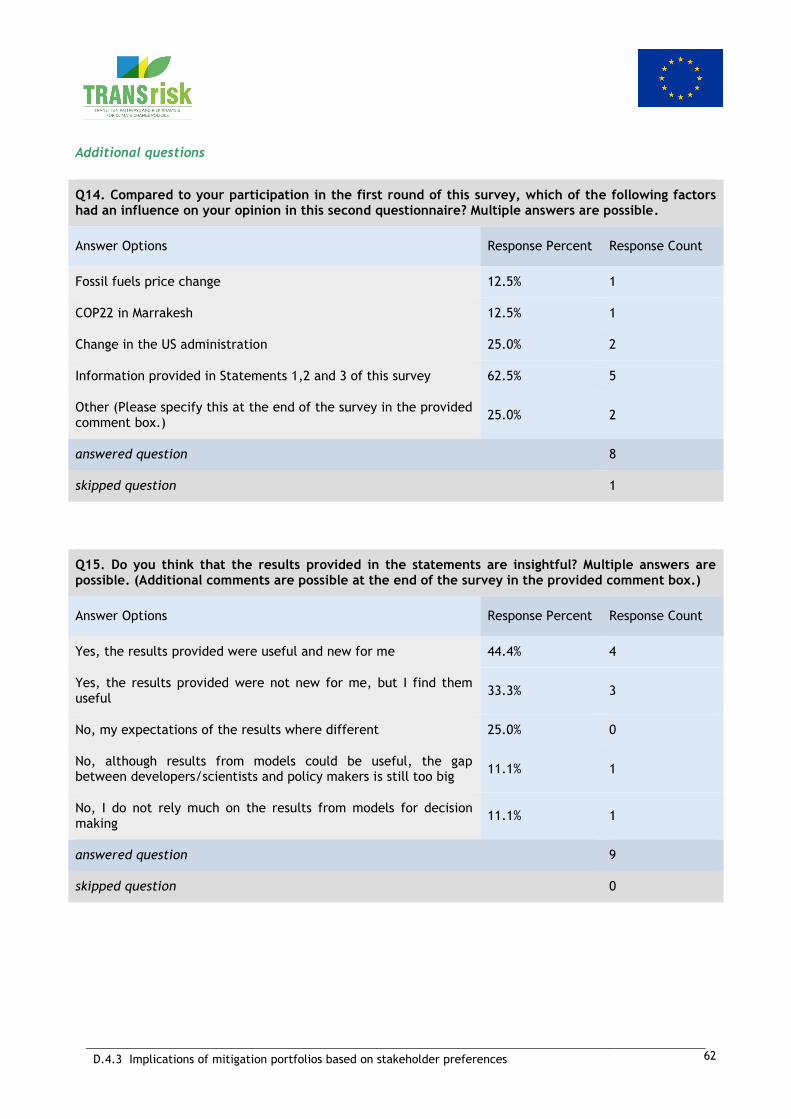


![Report on Deliverable D4.3 [Human-Robot Interaction] Audition for RobotS (EARS) Deliverable D4.3 Human-Robot Interaction Grant Agreement No. 609465 Revision Draft, [November 11, 2016]](https://static.documents.pub/doc/80x56/5aa870347f8b9a86188b8993/report-on-deliverable-d43-human-robot-interaction-audition-for-robots-ears.jpg)


