28
STN 8-1: Software Reliability Engineering2
���������������������������������
�����������������������������������������
������������
������������
����������������������������������������������������������������������
���������������������������������������������
ACM Software Engineering Notes: “…an introductory book, a reference, andan application book all compressed in a single volume…The author’sexperience in reliability engineering is apparent and his expertise is infused inthe text.”
IEEE Computer: “Toward software you can depend on…This book illustrates the entire SRE process…An aid to systems engineers, systems architects, developers, and managers.”
��� thoroughly rewritten for the latest SRE practice, enlarged 50%, and polished by thousands ofpractitioners, with:
- Methods to develop and test software more efficiently, making you more competitive in a worldof globalization and outsourcing and giving you more time for your personal life
- Workshops for applying what you learn to your project (NEW FEATURE)- Frequently asked questions (DOUBLED TO MORE THAN 700)- Step-by-step process summary- Simple user manual for CASRE software reliability software, downloadable from the internet- List of articles on user experiences (you can find how others practiced SRE in various settings)- Glossary- Basic practice separated from special situations and math background for faster learning- Exercises to reinforce what you just learned- A casual, readable style that works well for self learning- Everything you need to implement SRE in your organization, even showing you how to persuade
other people to adopt the practiceAll updated, enhanced, and exhaustively indexed to make the perfect deskside companion for thesoftware professional, engineer, or manager
If you liked the First Edition, you’ll love the Second and want to update.
������ ���� �� ����� A founder of SRE, IEEE Fellow, Engineer of the Year 2004, Who’s Who in
America since 1990, prolific researcher, international consultant and teacher, experienced and practicalsoftware developer and manager.
�����������������������������������������
To browse in detail like you would in a bookstore, visit http://members.aol.com/JohnDMusa. Order oneor more copies of this Print on Demand (POD) book directly (with more than 21% discount) fromAuthorHouse by using the hyperlink there or call 1-888-280-7715 toll free. Your order will be customprinted and shipped to you as fast as you can obtain a traditionally published professional book. This630 page book comes in two editions:
ISBN Retail AH price*Hardbound: blue cover, gold-stamped spine, jacket above. 1-4184-9388-0 $79.95 $62.95Paperback: cover as shown above. 1-4184-9387-2 $69.95 $54.95
* plus shipping and handling
��������
�����������
������������
�������������
��������
����������
�������
����������������
����������������

Data & Analysis Center for Software (DACS) 3
Software reliability engineering (SRE) focuses on making practitioners more competitive without working longer. This is valuable in a world of globalization and outsourcing where professionals want more time for their personal lives. Customers demand that software-based products be more reliable, built faster, and built cheaper (in general order of importance). Suc-cess in meeting these demands affects the market share and profitability of a product for a company and hence indi-viduals in the company. The demands conflict, causing risk and overwhelming pressure, and hence a strong need for this practice that can help balance them.
SRE is now standard, proven, widespread, and widely applicable. It is very effective and low in cost, and its implementation has virtually no schedule impact. We will describe it and how it works. We will then outline the SRE process to give you a feel for the practice.
What’s SRE Like?SRE, backed with science and
technology, quantitatively plans and guides software development and test, always keeping in mind a sound business perspective. You add and integrate it with other good processes and practices; you do not replace them. You choose the most cost-effec-tive software reliability strategies for your situation.
We deliberately define software reli-ability in the same way as hardware reli-ability, so that we can determine system reliability from hardware and software component reliabilities, even though the mechanisms of failure are different.
Why SRE WorksSRE works by quantitatively char-
acterizing two things about the prod-uct: the expected relative use of its functions and its required major qual-ity characteristics. The major quality characteristics are reliability, availabil-ity, delivery date, and life-cycle cost. You then apply these characteristics in managing development and test.
When you have characterized use, you can substantially increase development efficiency by focusing resources on functions in proportion to use and criticality. You can also maxi-mize test effectiveness by making tests highly representative of use in the field. Increased efficiency increases the effective resource pool available to add customer value.
When you have determined the precise balance of major quality char-acteristics that meets user needs, you spend your increased resource pool to carefully match them. You choose software reliability strategies to meet the objectives, based on data collected from previous projects. You also track reliability in system test against its objective to adjust your test process and to determine when you can end test. The result is greater efficiency in converting resources to customer value.
A Proven, Standard, Wide-spread Best Practice
SRE is a proven, standard, widespread best practice. As one example of its proven benefits, AT&T applied SRE to two different releases of a switching system, International Definity PBX. Customer-reported
problems decreased by a factor of 10, the system test interval decreased by a factor of 2, and total develop-ment time decreased 30%. No serious service outages occurred in 2 years of deployment of thousands of systems in the field.
SRE became an AT&T Best Current Practice in May 1991 after undergoing rigorous scrutiny as to its cost-effectiveness by a large number of managers. McGraw-Hill recognized SRE as a standard practice by publish-ing an SRE handbook in 1996. The IEEE and the American Institute of Aeronautics and Astronautics, among others, have developed standards.
Users have published almost 70 articles about their successful applica-tion of SRE, and the number contin-ues to grow [1,2]. Since practitioners generally publish infrequently, the total number of successful applica-tions is probably many times greater. We have picked examples of major users for this special issue.
SRE is widely applicable. Tech-nically, you can apply SRE to any software-based product, starting at the beginning of any release cycle. Economically, you can apply SRE to any software-based product, except for very small components (perhaps those involving a total effort of less than 2 staff months). However, if you use a very small component for several products, then it probably will be feasible to use SRE. If not, it still may be worthwhile to implement SRE in abbreviated form.
SRE is independent of develop-ment technology and platform. It
Software Reliability Engineering-An Overview
More Reliable Software Faster and CheaperBy John D. Musa, Software Reliability Engineering and Testing Courses
continues on page 4
STN 8-1: Software Reliability Engineering4
requires no changes in architecture, design, or code, but it may suggest changes that would be useful. You can deploy it in one step or in stages.
SRE is very customer-oriented: it involves frequent direct close interac-tion with customers. This enhances a supplierʼs image and improves cus-tomer satisfaction. SRE is highly cor-related with attaining Levels 3 through 5 of the Software Engineering Institute Capability Maturity Model.
Despite the word “software,” SRE deals with the entire product, although it focuses on the software part. It takes a full-life-cycle view, involving system engineers, system architects, developers, users, and managers in a collaborative relationship.
The cost of implementing SRE is small. There is an investment cost of not more than 3 equivalent staff days per person in an organization, which in-cludes a 2-day course for everyone and planning with a much smaller number. The operating cost over the project life cycle typically varies from 0.1 to 3 percent of total project cost, dropping rapidly as project size increases. The largest cost component is the cost of developing the operational profile.
The schedule impact of SRE is minimal. Most SRE activities involve only a small effort that can parallel other software development work. The only significant critical path activity is 2 days of training.
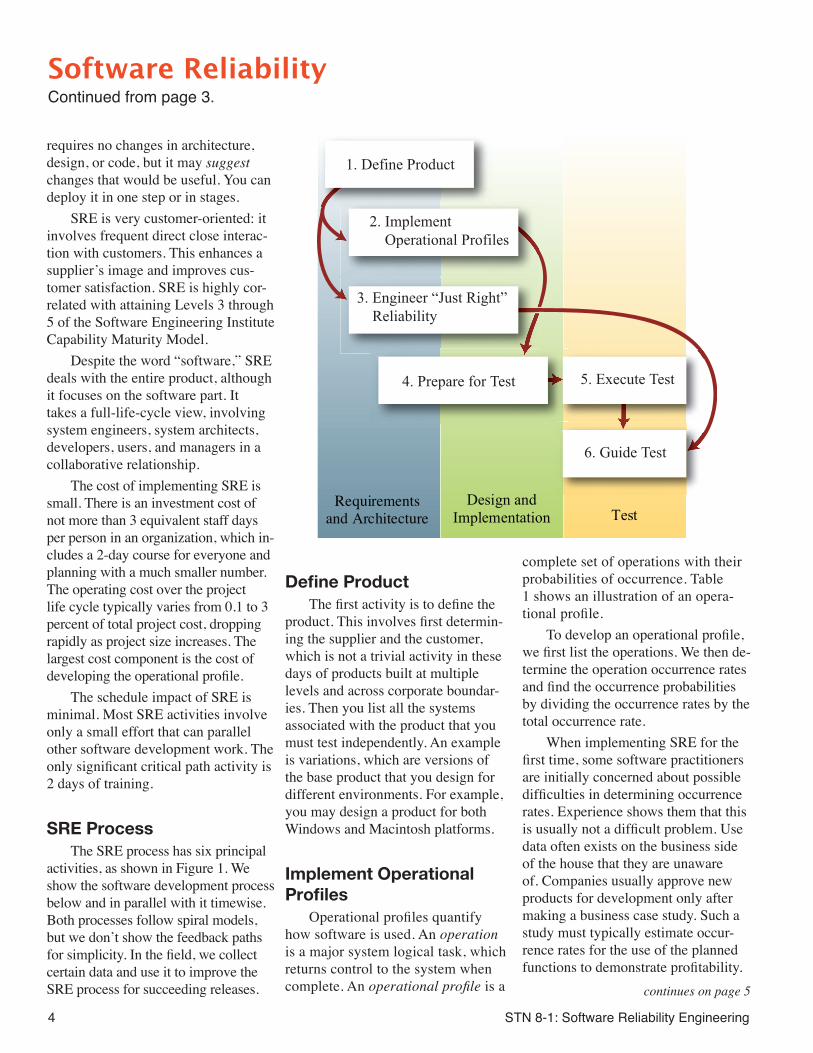
SRE ProcessThe SRE process has six principal
activities, as shown in Figure 1. We show the software development process below and in parallel with it timewise. Both processes follow spiral models, but we donʼt show the feedback paths for simplicity. In the field, we collect certain data and use it to improve the SRE process for succeeding releases.
Define ProductThe first activity is to define the
product. This involves first determin-ing the supplier and the customer, which is not a trivial activity in these days of products built at multiple levels and across corporate boundar-ies. Then you list all the systems associated with the product that you must test independently. An example is variations, which are versions of the base product that you design for different environments. For example, you may design a product for both Windows and Macintosh platforms.
Implement Operational Profiles
Operational profiles quantify how software is used. An operation is a major system logical task, which returns control to the system when complete. An operational profile is a
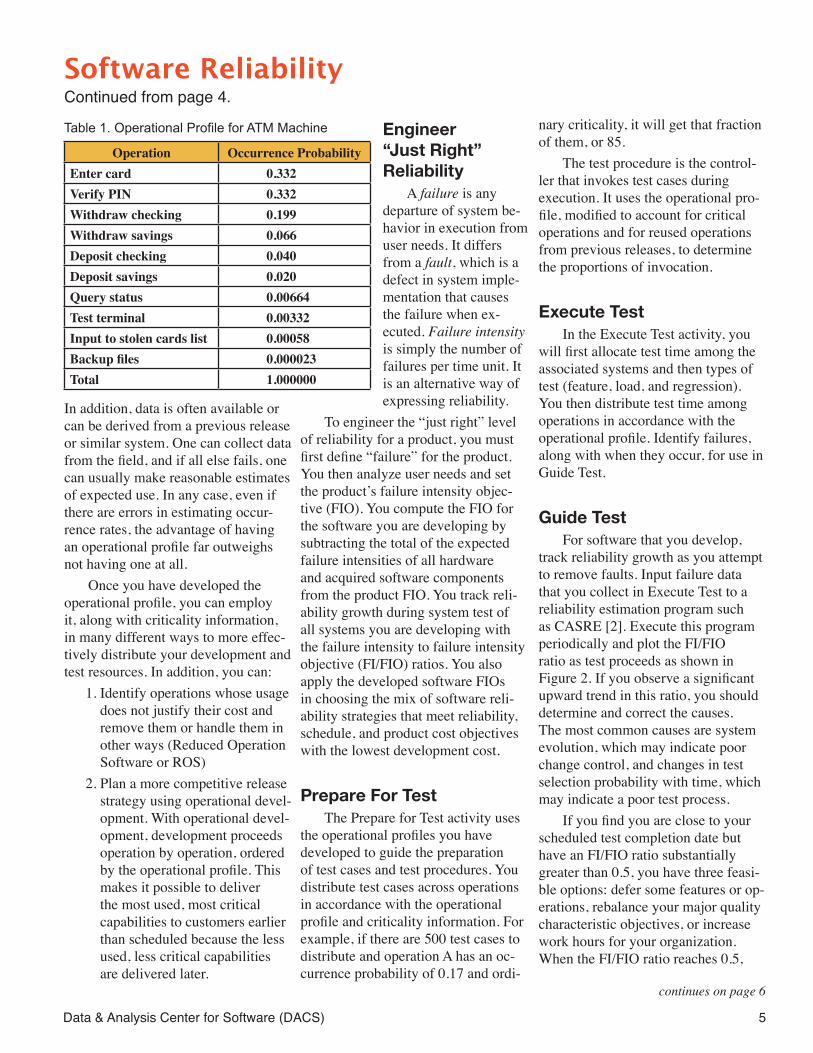
complete set of operations with their probabilities of occurrence. Table 1 shows an illustration of an opera-tional profile.
To develop an operational profile, we first list the operations. We then de-termine the operation occurrence rates and find the occurrence probabilities by dividing the occurrence rates by the total occurrence rate.
When implementing SRE for the first time, some software practitioners are initially concerned about possible difficulties in determining occurrence rates. Experience shows them that this is usually not a difficult problem. Use data often exists on the business side of the house that they are unaware of. Companies usually approve new products for development only after making a business case study. Such a study must typically estimate occur-rence rates for the use of the planned functions to demonstrate profitability.
Requirementsand Architecture
Design andImplementation Test
1. Define Product
2. Implement Operational Profiles
3. Engineer “Just Right” Reliability
4. Prepare for Test 5. Execute Test
6. Guide Test
continues on page 5
Software ReliabilityContinued from page 3.
Data & Analysis Center for Software (DACS) 5
In addition, data is often available or can be derived from a previous release or similar system. One can collect data from the field, and if all else fails, one can usually make reasonable estimates of expected use. In any case, even if there are errors in estimating occur-rence rates, the advantage of having an operational profile far outweighs not having one at all.
Once you have developed the operational profile, you can employ it, along with criticality information, in many different ways to more effec-tively distribute your development and test resources. In addition, you can:
1. Identify operations whose usage does not justify their cost and remove them or handle them in other ways (Reduced Operation Software or ROS)
2. Plan a more competitive release strategy using operational devel-opment. With operational devel-opment, development proceeds operation by operation, ordered by the operational profile. This makes it possible to deliver the most used, most critical capabilities to customers earlier than scheduled because the less used, less critical capabilities are delivered later.
Engineer “Just Right” Reliability
A failure is any departure of system be-havior in execution from user needs. It differs from a fault, which is a defect in system imple-mentation that causes the failure when ex-ecuted. Failure intensity is simply the number of failures per time unit. It is an alternative way of expressing reliability.
To engineer the “just right” level of reliability for a product, you must first define “failure” for the product. You then analyze user needs and set the productʼs failure intensity objec-tive (FIO). You compute the FIO for the software you are developing by subtracting the total of the expected failure intensities of all hardware and acquired software components from the product FIO. You track reli-ability growth during system test of all systems you are developing with the failure intensity to failure intensity objective (FI/FIO) ratios. You also apply the developed software FIOs in choosing the mix of software reli-ability strategies that meet reliability, schedule, and product cost objectives with the lowest development cost.
Prepare For TestThe Prepare for Test activity uses
the operational profiles you have developed to guide the preparation of test cases and test procedures. You distribute test cases across operations in accordance with the operational profile and criticality information. For example, if there are 500 test cases to distribute and operation A has an oc-currence probability of 0.17 and ordi-
nary criticality, it will get that fraction of them, or 85.
The test procedure is the control-ler that invokes test cases during execution. It uses the operational pro-file, modified to account for critical operations and for reused operations from previous releases, to determine the proportions of invocation.
Execute TestIn the Execute Test activity, you
will first allocate test time among the associated systems and then types of test (feature, load, and regression). You then distribute test time among operations in accordance with the operational profile. Identify failures, along with when they occur, for use in Guide Test.
Guide TestFor software that you develop,
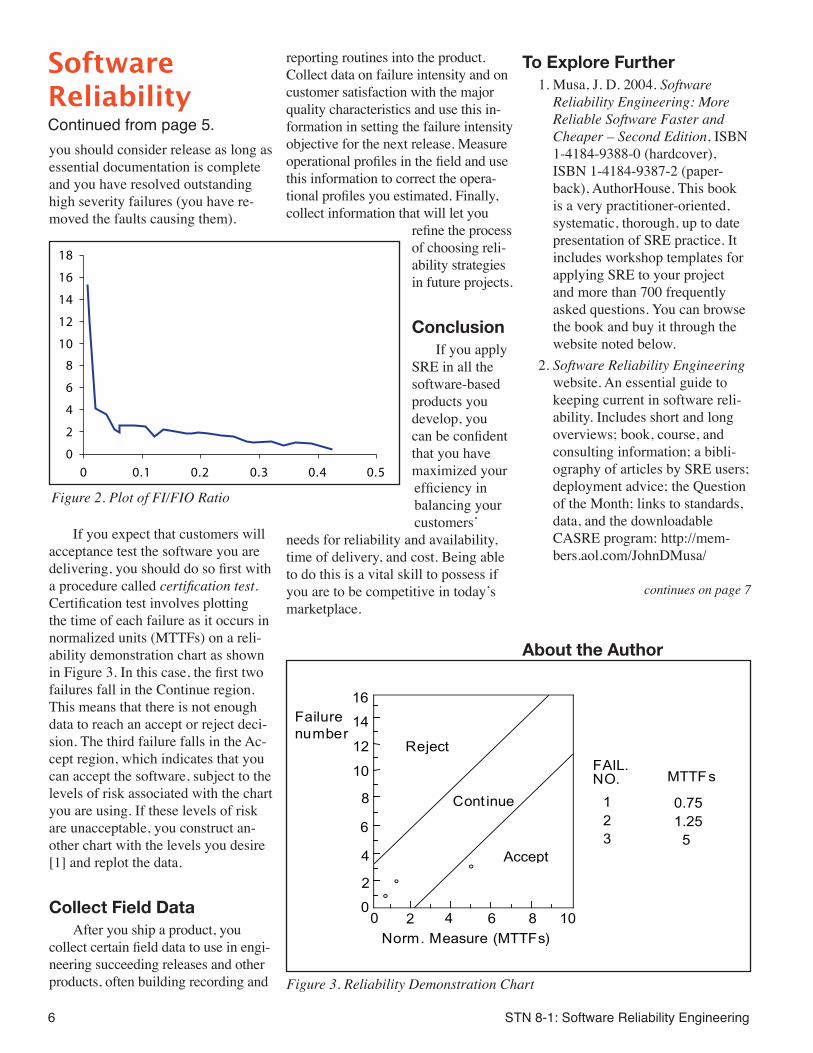
track reliability growth as you attempt to remove faults. Input failure data that you collect in Execute Test to a reliability estimation program such as CASRE [2]. Execute this program periodically and plot the FI/FIO ratio as test proceeds as shown in Figure 2. If you observe a significant upward trend in this ratio, you should determine and correct the causes. The most common causes are system evolution, which may indicate poor change control, and changes in test selection probability with time, which may indicate a poor test process.
If you find you are close to your scheduled test completion date but have an FI/FIO ratio substantially greater than 0.5, you have three feasi-ble options: defer some features or op-erations, rebalance your major quality characteristic objectives, or increase work hours for your organization. When the FI/FIO ratio reaches 0.5,
continues on page 6
Software ReliabilityContinued from page 4.
Operation Occurrence Probability Enter card 0.332Verify PIN 0.332Withdraw checking 0.199Withdraw savings 0.066Deposit checking 0.040Deposit savings 0.020Query status 0.00664Test terminal 0.00332Input to stolen cards list 0.00058Backup files 0.000023Total 1.000000
Table 1. Operational Profile for ATM Machine
STN 8-1: Software Reliability Engineering6
you should consider release as long as essential documentation is complete and you have resolved outstanding high severity failures (you have re-moved the faults causing them).
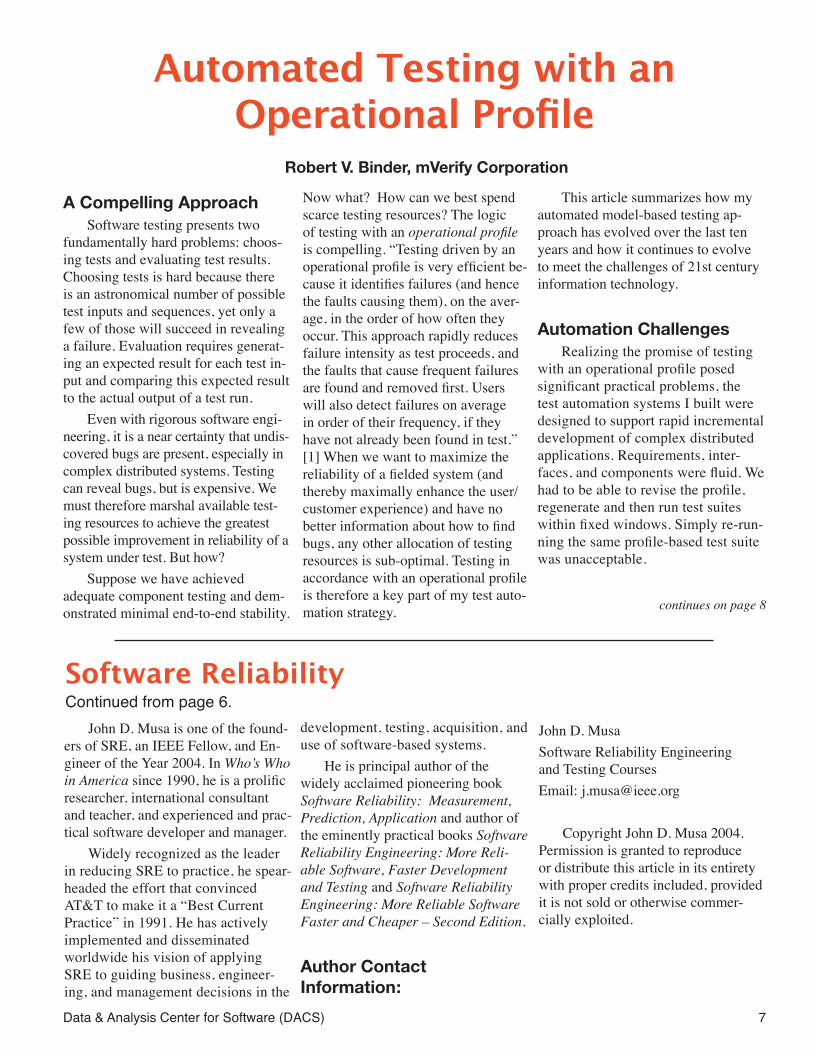
If you expect that customers will acceptance test the software you are delivering, you should do so first with a procedure called certification test. Certification test involves plotting the time of each failure as it occurs in normalized units (MTTFs) on a reli-ability demonstration chart as shown in Figure 3. In this case, the first two failures fall in the Continue region. This means that there is not enough data to reach an accept or reject deci-sion. The third failure falls in the Ac-cept region, which indicates that you can accept the software, subject to the levels of risk associated with the chart you are using. If these levels of risk are unacceptable, you construct an-other chart with the levels you desire [1] and replot the data.
Collect Field DataAfter you ship a product, you
collect certain field data to use in engi-neering succeeding releases and other products, often building recording and
reporting routines into the product. Collect data on failure intensity and on customer satisfaction with the major quality characteristics and use this in-formation in setting the failure intensity objective for the next release. Measure operational profiles in the field and use this information to correct the opera-tional profiles you estimated. Finally, collect information that will let you
refine the process of choosing reli-ability strategies in future projects.
ConclusionIf you apply
SRE in all the software-based products you develop, you can be confident that you have maximized your efficiency in balancing your customers ̓
needs for reliability and availability, time of delivery, and cost. Being able to do this is a vital skill to possess if you are to be competitive in todayʼs marketplace.
To Explore Further1. Musa, J. D. 2004. Software
Reliability Engineering: More Reliable Software Faster and Cheaper – Second Edition, ISBN 1-4184-9388-0 (hardcover), ISBN 1-4184-9387-2 (paper-back), AuthorHouse. This book is a very practitioner-oriented, systematic, thorough, up to date presentation of SRE practice. It includes workshop templates for applying SRE to your project and more than 700 frequently asked questions. You can browse the book and buy it through the website noted below.
2. Software Reliability Engineering website. An essential guide to keeping current in software reli-ability. Includes short and long overviews; book, course, and consulting information; a bibli-ography of articles by SRE users; deployment advice; the Question of the Month; links to standards, data, and the downloadable CASRE program: http://mem-bers.aol.com/JohnDMusa/
About the Author
16Failurenumber
Reject
Cont inue
Accept
Norm. Measure (MTTFs)
14
12
1086200
2
4
4
6
8
10 FAIL. NO. MTTFs
1 2 3
0.75 1.25 5
Figure 3. Reliability Demonstration Chart
Software ReliabilityContinued from page 5.
continues on page 7
0
2
4
6
8
01
21
41
61
81
5.04.03.02.01.00
Figure 2. Plot of FI/FIO Ratio
Data & Analysis Center for Software (DACS) 7
continues on page 8
John D. Musa is one of the found-ers of SRE, an IEEE Fellow, and En-gineer of the Year 2004. In Who s̓ Who in America since 1990, he is a prolific researcher, international consultant and teacher, and experienced and prac-tical software developer and manager.
Widely recognized as the leader in reducing SRE to practice, he spear-headed the effort that convinced AT&T to make it a “Best Current Practice” in 1991. He has actively implemented and disseminated worldwide his vision of applying SRE to guiding business, engineer-ing, and management decisions in the
development, testing, acquisition, and use of software-based systems.
He is principal author of the widely acclaimed pioneering book Software Reliability: Measurement, Prediction, Application and author of the eminently practical books Software Reliability Engineering: More Reli-able Software, Faster Development and Testing and Software Reliability Engineering: More Reliable Software Faster and Cheaper – Second Edition.
Author Contact Information:
John D. MusaSoftware Reliability Engineering and Testing CoursesEmail: [email protected]
Copyright John D. Musa 2004. Permission is granted to reproduce or distribute this article in its entirety with proper credits included, provided it is not sold or otherwise commer-cially exploited.
Software ReliabilityContinued from page 6.
Automated Testing with an Operational Profile
Robert V. Binder, mVerify Corporation
A Compelling ApproachSoftware testing presents two
fundamentally hard problems: choos-ing tests and evaluating test results. Choosing tests is hard because there is an astronomical number of possible test inputs and sequences, yet only a few of those will succeed in revealing a failure. Evaluation requires generat-ing an expected result for each test in-put and comparing this expected result to the actual output of a test run.
Even with rigorous software engi-neering, it is a near certainty that undis-covered bugs are present, especially in complex distributed systems. Testing can reveal bugs, but is expensive. We must therefore marshal available test-ing resources to achieve the greatest possible improvement in reliability of a system under test. But how?
Suppose we have achieved adequate component testing and dem-onstrated minimal end-to-end stability.
Now what? How can we best spend scarce testing resources? The logic of testing with an operational profile is compelling. “Testing driven by an operational profile is very efficient be-cause it identifies failures (and hence the faults causing them), on the aver-age, in the order of how often they occur. This approach rapidly reduces failure intensity as test proceeds, and the faults that cause frequent failures are found and removed first. Users will also detect failures on average in order of their frequency, if they have not already been found in test.” [1] When we want to maximize the reliability of a fielded system (and thereby maximally enhance the user/customer experience) and have no better information about how to find bugs, any other allocation of testing resources is sub-optimal. Testing in accordance with an operational profile is therefore a key part of my test auto-mation strategy.
This article summarizes how my automated model-based testing ap-proach has evolved over the last ten years and how it continues to evolve to meet the challenges of 21st century information technology.
Automation ChallengesRealizing the promise of testing
with an operational profile posed significant practical problems, the test automation systems I built were designed to support rapid incremental development of complex distributed applications. Requirements, inter-faces, and components were fluid. We had to be able to revise the profile, regenerate and then run test suites within fixed windows. Simply re-run-ning the same profile-based test suite was unacceptable.

STN 8-1: Software Reliability Engineering8
Unless a test configuration is unstable or otherwise dependent on external sources of variation, repeating a test suite will only drive the system under test through the same states and execution sequence. Even if the sys-tem under test has been changed and a test suite is an accurate sample from an operational profile, the bug-reveal-ing ability of an unchanged test suite diminishes as it is repeated. Although test suite repetition is useful for re-gression testing, re-running a test suite on the same code and configuration will not reveal new failures. Worse, this can lead to false confidence.
Fresh Test SuitesIdeally, weʼd like a fresh test suite
every time weʼre ready to exercise the system under test. A fresh test suite is a unique, but statistically accurate sample from an operational profile. Hand-crafted production of fresh test suites for rapid test cycles (for example, hourly) is impractical for even a system with tens of operations. The complex distributed systems I worked on re-quired tens of thousands of tests cases to achieve a minimal approximation of actual usage and were constantly being debugged, extended, and revised.
Although it isnʼt hard to write software that automatically generates “random” test inputs, this is not the same as generating a test suite that is an accurate sample from an operational profile. To generate truly fresh test data values, we also found it was necessary to sample from the domains of the system state space and input variables. Established techniques from discrete event simulation and AI-based meta-programming were adapted for this requirement. The end result (of two years of development) was that it took only seconds to set model param-eters for a test run, which then drove automatic generation of hundreds of thousands of fresh test cases in hours.
Each generated test suite was unique, but still conformed to the statistical distribution specified by our opera-tional profile model.
But then, our fresh test suites posed a new problem. High volume automated testing is not very mean-ingful if the output of the system under test is not checked. Output checking requires development and evaluation of expected results. In testing jargon, an oracle produces the expected result for any test input. A perfect oracle is therefore an error-free realization of the same requirements as the system under test. Develop-ing a perfect oracle is nearly always impractical or infeasible. However, we extended our models to generate some expected results along with inputs, and developed an executable model of the core system logic. So, along with fresh test inputs, we either produced fresh expected results or were able to automatically evaluate test run output. We achieved enough of an automated oracle to use high-volume input gen-eration with confidence.
Including a Load ProfileThe traditional approach to
“system” and “stress” testing is to first develop test suites to evaluate functionality, then repeat the same test inputs in greater quantity and/or speed to reveal capacity-related problems. However, critical failures are often a result of high load in combination with unusual input sequences. The more-of-the-same approach wastes an opportunity to test under high stress with realistic variation. This is often effective in revealing failures that occur when a system is under heavy utilization. Heavy utilization often oc-curs when a failure can have the worst possible effect: for example, peak traffic in transaction processing or dur-ing a rapid high-stress maneuver that relies on automated motion control.
We designed our test generation technology to dial-in the total quantity of input and input rate as a function of time. Thus, generating 100,000 total test cases to be submitted at the same average rate was no harder than gen-erating 1,000,000 test cases to be sub-mitted at varying rates corresponding to typical peak loading patterns. Both generated fresh and realistic samples drawn from the same operational pro-file. (Technically, this had the effect of creating a different operational profile for each combination of the load and behavioral models). This improved test effectiveness. We found many bugs with this strategy and eliminated the excess time and cost of separate stress testing.
ResultsOur most extensive application of
this strategy supported development of a system for real time quote and order processing at a leading financial exchange, which was designed for a peak of several million transactions in a six hour trading session. Every daily test run (about 200) used a fresh test suite which covered the entire daily trading cycle.
Daily use of the test process and automated environment revealed some limitations with our approach. We dis-covered that our AI-based meta pro-gramming architecture did not scale well, imposed a high maintenance cost, and was subsequently an obstacle to technology transfer. We relied on off-the-shelf GUI test agents to ap-ply inputs to some system interfaces. These agents were designed to support interactive testing with hard-coded scripting. Although serviceable, they did not support coordination of distrib-uted test suites and lacked features to achieve full control and monitoring of the interface. These problems were not corrected due to time and budget
continues on page 9
Automated TestingContinued from page 7.

Data & Analysis Center for Software (DACS) 9
functionality to ever-more complex architectures for distributed systems. Along with new high-value capabili-ties, mobile technology also presents new failure modes. Mobility-specific factors must be included in the opera-tional profile to generate realistic test suites for mobile application systems. I believe that at least ten times more testing will be needed to achieve reliability comparable to what can be obtained for wired, static systems. Mo-bile application developers will face many new design and implementation challenges. With the increased scope and inherent variation of mobile infor-mation technology, I see that realistic profile-based testing holds the only hope of achieving high reliability.
Expanding and automating the profile to generate time-varying load as well as functionality allowed us to achieve high reliability for complex distributed applications. In a similar manner, expanding and automating the operational profile to include the key dimensions of mobility will achieve high reliability in complex, distributed, and mobile applications. For the same reasons that merging functionality and stress testing improved both efficiency and effectiveness, we expect to be able to do a lot more for much less, despite the new challenges of mobility.
Sampling the Operational Profile
An operational profile is the estimated relative frequency (i.e., probability) for each “operation” that a system under test supports. Opera-tions map easily to use cases, hence operational profiles and object-orient-ed development work well together. However, the Unified Modeling Lan-guage (UML) standard for Use Cases does not provide sufficient informa-tion for automated testing. Extended Use Cases [2] are consistent with the UML, and include domain and
Automated TestingContinued from page 8.
constraints. We augmented automated test-generation with manually coded scripts for special cases, and did man-ual testing for some GUI interfaces that were too complex or unstable.
Despite these limitations, our automated operational profile test-ing approach was highly effective in revealing bugs and in evaluating pre-release system stability. The test process revealed about 1,500 bugs over two years. Project management and developers decided that all but a few of these bugs were worth fixing and verifiying the fix. About 5% of the bugs were showstoppers. We used the same test generation approach to verify the bug fixes. Our five person team was very productive, in terms of number of tests run per total effort and reliability improvement per total cost. The last pre-release test run ap-plied 500,000 fresh test cases in two hours, with no failures detected. Post-release, no failures were reported in the first six months of operation.
21st Century ChallengesI believe that information technol-
ogy will undergo radical change in the next five to ten years. This is an inevitable result of steady improve-ment in mobile computing platforms, innovation in human-computer interfaces, and increasing wireless network capacity. These advances will have far-reaching social consequences. Soon, most everyday things will have built-in mobile information technol-ogy, including clothing, jewelry, vehicles, structures, and open spaces. With ubiquity, high reliability is more important than ever.
Four years ago, I began work to adapt automated profile-based testing to the unique challenges of testing mo-bile and wireless applications. Mobile applications add unstable wireless data channels and real-time, location-based
probability information necessary for automated testing.
A code sketch follows that shows how test cases can be gener-ated for an operational profile for some Extended Use Cases. Weʼll use the ATM example presented in Soft-ware Reliability Engineering - An Overview, page 4 of this issue. Each operation corresponds to an Extend-ed Use Case. The following model, shown in Figure 1 is simplified, as it does not represent sequential and conditional constraints. Weʼd need to further subdivide each Extended Use Case (operation) into variants to allow realistic sampling from the input data domains and to generate the expected results.
Many deterministic algorithms have been developed to choose operation sequences with constraints. However, even a simple system of constraints can require a very large number of sequences to achieve a coverage goal of interest. Discrete Event Simulation strategies (some-times called “Monte Carlo simula-tion”) have been long used to provide statistically adequate samples from very large state spaces. Given the as-tronomical number of input combina-tions for most software systems, this strategy is well-suited to choosing test sequences from an operational profile. The following Tcl [3] script illustrates the principle using the ATM operational profile example.
To facilitate selection with a pseudo-random number genera-tor, the original probabilities have been transformed into a cumulative distribution. This script will generate a sequence of operations with two properties. First, each operation will occur roughly in proportion to its original probability. For example, out of 1,000 generated test cases, “Withdraw savings” would appear
continues on page 10

STN 8-1: Software Reliability Engineering10
about 66 times. Second, for any given generated test case, the operation of the next test case occurs in propor-tion to its assigned probability. For example, “Withdraw savings” would be followed by “Deposit Savings” for about 2% of the Withdraw Savings test cases.
Of course, developing a complete model-based testing system which respects all constraints and samples variable domains is considerably more complex. For example, the applica-tion-specific system discussed in this article comprises about 60,000 lines of Prolog, Java, SQL, Perl, NT command scripts, and 4Test (Segueʼs proprietary test scripting language.)
References[1] John D. Musa. Software Reliability
Engineering: More Reliable Software Faster and Cheaper. AuthorHouse. 2004.
[2] Robert V. Binder. Testing Object-Ori-ented Systems: Models, Patterns, and Tools. Addison-Wesley, 1999.
Automated TestingContinued from page 9.
[3] Tcl (Tool Control Language) is a widely used open source scripting language which is a defacto standard for test automation. To download a Tcl interpreter and more about Tcl, go to http://www.activestate.com/Products/ActiveTcl/.
Copyright © 2004, Robert V. Binder. All rights reserved.
About the AuthorMr. Binder is founder and CEO of
mVerify Corporation (www.mverify.com), a startup developing the next generation of testing software for mobile applications: “A Million Us-ers in a Box”® He has over 29 years of software and systems engineering experience and is an internationally recognized expert in software testing. Binder holds an MS in Electrical En-gineering and Computer Science from the University of Illinois at Chicago and a MBA from the University of Chicago. He is an IEEE Senior Mem-ber and serves on Agitarʼs Technical Advisory Board. He can be reached at [email protected]
puts -nonewline “How many test cases? “ gets stdin n
for {set ix 1} {$ix <= $n} {incr ix} { set p [expr {rand()}]
if {$p <= 0.33200} {puts “Enter Card” } elseif {$p <= 0.66400} {puts “Verify PIN” } elseif {$p <= 0.86300} {puts “Withdraw checking” } elseif {$p <= 0.92900} {puts “Withdraw savings” } elseif {$p <= 0.96900} {puts “Deposit checking” } elseif {$p <= 0.98900} {puts “Deposit savings” } elseif {$p <= 0.99564} {puts “Query status” } elseif {$p <= 0.99896} {puts “Test terminal” } elseif {$p <= 0.99954} {puts “Input to stolen cards list” } elseif {$p <= 1.00000} {puts “Backup files” } else {puts “Error in $p”}}
Figure 1. ATM Example
Data & Analysis Center for Software (DACS) 11
Introduction There has been interest at the
National Security Agency (NSA) in applying Software Reliability Engineering (SRE) practices in the security domain. Nine years ago, the second author spent a sabbatical with John Musa in developing methods for Software Reliability Engineer-ing Testing (Musa&Widmaier1996) which he took back to NSA. This ar-ticle describes some of the initiatives that both authors have been involved with in applying and extending these methods at NSA.
Using Reliability as a Yardstick in Comparing Software Engineering Methodologies
The first initiative taken by NSA was to use reliability as a yardstick to compare two different Soft-ware Engineering methodologies (Widmaier1999). The initiative was aimed at answering the question: “Where should a software manager invest time and resources in building higher quality products?” Reliability provides a quantified measure of cus-tomer perception of product quality. Two independent software develop-ment organizations (contractors) were given identical functional and reli-ability requirements for a Personnel Access Control System (PACS) and the same resources to build a pilot PACS application. One organization had a mature software development process verified at SEI/CMM level 4. The second organization used formal methods to develop the pilot application. A third organization was engaged to do Reliability Demonstra-tion testing of the completed pilot
applications to certify the functional and reliability requirements were met. Interestingly, neither applica-tion met the reliability requirements although the application developed using formal methods came closest. This approach in using SRE provided a quantitative way of comparing two different approaches to building a software application.
Automating SRET With the success in applying
SRE in the first initiative, NSA was interested in seeing how SRE could be applied in-house. The need was recognized for tools to automate and standardize SRET. The next initiative was to build an Automated Reliability Testing (ART) toolset to support SRET and to apply it to an in-house built product.
Some of the needs identified for such a tool were: (1) ability to model sophisticated operational profiles1, (2) generate test cases from the operational profile, (3) automatically schedule and dispatch test cases, (4) collect failure and execution time data from test runs, (5) format such data so they could be input to and analyzed by software reliability anal-ysis tools (e.g., CASRE, SRE Toolkit, Reliability Demonstration Charts). In addition, a process was needed to define how to use ART in managing the reliability of software.
ART used Teradyne Cor-porationʼs TestMaster® tool to model operational profiles (Everett&Widmaier1999). ART was used in managing the reliability of ART itself. Reliability requirements including failure rate objectives and an operational profile were
established for ART. ART was then used to generate test cases from the operational profile, to run the test cases, collect failure data and analyze it. Using ART, we showed that the completed ART toolset satisfied its reliability requirements.
In addition to using ART on itself, we also used ART on an in-house developed application (Widmaier&Everett 2002). The application analyzed C-code files, summarizing size and complexity of the C-code. The application had been in use for several years so a lot of information was available to char-acterize its usage. Again, reliability requirements were established for the application. Developing an op-erational profile was a challenge. The profile consisted of a characterization of the C-code files that the applica-tion would process. ART was used to generate random test cases from the operational profile which consisted of syntactically correct C-code files with known size and complexity measures. ART was then used to run the test cases. The known values of these measures were compared with values produced by the application within ART to identify failures. In this case, we were able to show the application did not meet the reliability require-ments we set for it. More important, we uncovered a number of failure types for the application that were not spotted during the years that the ap-plication was in operational use.
Applying SRE to Security-Based Applications
With the success in appling SRET to an in-house developed prod-
continues on page 12
Applications of SRE in the Security Domain
William W. Everett, James C. Widmaier
STN 8-1: Software Reliability Engineering12
uct, the next initiative was to apply it to security-based applications. The applications selected were firewall products (Everett&Widmaier2002).
We developed a set of reliability requirements around a potential use of a firewall product within an in-house organization. We interviewed the organization with regard to their reliability needs. We established quantified reliability objectives and an operational profile under which the objectives were to be met. The opera-tional profile not only characterized the packet traffic and network topol-ogy but also included Operations, Administration, Maintenance and Provisioning (OAM&P) activities. In addition to normal packet traffic, we did mimic some covert attack activ-ity. We acquired two, off-the-shelf commercial firewall products2 to test. We setup a test bed and simulated a yearʼs worth of operational activity.
Although we encountered no packet traffic failures, we did encoun-ter OAM&P failures. Applying Reli-ability Demonstration methods, we able to reject that one of the prod-ucts met our reliability requirements and accept that the other product did.
Existing SRE Across the Life-Cycle
In the next initiative, we were in-terested in seeing how SRE methods could be applied across the life-cycle. In this initiative, we applied SRE methods to an in-house developed se-curity-based application (Tokeneer). The application used smart cards and biometrics to authenticate individu-als before allowing them to enter a secure facility. In addition to defining Reliability Requirements for the ap-plication and then using Reliability Demonstration Testing to validate the requirements were met, we also investigated how SRE could be used
during design. We reviewed the design of the application and made recommendations for design changes that would enhance the reliability of the application. One recommenda-tion was to isolate the critical secu-rity functions to a kernel and focus enhanced development methods in implementing the kernel. Drawing on our experience in working with this application, we developed a Protection Profile3 (PP) for a family of Token ID Station (TIS) products. Our “reliability perspective” was particularly helpful in developing the “vulnerability” and “security policy” parts of the PP. It also helped in iden-tifying security functions needed to mitigate security failures.
Applying SRE Earlier in the Life-Cycle
Most of our previous initia-tives were “after the fact” in that the product was already implemented when we did our work. In our next initiative, we wanted to do the reli-ability work “up front”. The next initiative was to establish reliability requirements for a high-assurance version of an ASN.14 compiler before it was implemented and then do Reliability Demonstration testing after it was implemented to validate the requirements were met. Again, we interviewed perspective users to characterize failures that they would be concerned about and characterize an operational profile. We defined reliability requirements that included quantified objectives and a cor-responding operational profile under which the objectives were to be met. The reliability requirements were established before the application was built. We were not involved in build-ing the product but were brought in to do Reliability Testing of the com-pleted application. As with the C-code analyzer, part of the operational
profile included a characterization of ASN.1 specifications. We extended parts of ART to randomly generate ASN.1 data specifications based on our operational profile. We acquired a commercial version of an ASN.1 compiler to test against the in-house developed compiler. We setup a test bed that enabled us to (1) generate random ASN.1 data specifications, (2) compile the specifications using the in-house and commercial compilers into C-code, (3) incorporate the C-code for the data specifications into a dummy application thus creating two versions of the dummy application5, (4) compile and run the dummy ap-plication to encode values for the data specifications, (5) use each version to decode values encoded by the other version. With this approach, we were able to detect when failures occurred and on further investigation attribute the failure to either the in-house or commercial compiler.
Again, we developed an op-erational profile based on some potential use of the compiler by interviewing potential customers/us-ers. The reliability objectives were a bit harder to establish.
The results were that a number of shortcomings in meeting explicit and implied functional requirements were uncovered. The success in find-ing such shortcomings was attributed to the independent perspective that the reliability engineer contributed from the perspective of those in-volved in designing and implement-ing the application.
Applying SRE to High Integrity Security Applications
In our latest initiative, we wanted to extend SRE methods to building high integrity security based applica-
Applications of SREContinued from page 11.
continues on page 13
Data & Analysis Center for Software (DACS) 13
tions. An organization was contracted to build an EAL6 5+ TIS Kernel product based on the architecture and PP we defined in the th initiative. The reliability requirements were to be the same as those we had established for Tokeneer in the 4th initiative. Care was taken to explicitly define the behavior expected of the critical functions. A formal functional and design specifica-tion for the product were written in Z7. The code was written in SPARK©8 from the Z design specification. This allowed the expected behavior of the kernel to be formally (mathematically) verified to be correct.
We conducted reliability demon-stration testing of the implemented product. Although we encountered operational failures (again, mostly OAM&P related), none of the failures were deemed “in scope” of what was explicitly specified for the TIS Kernel.
The result of this work demon-strated the effectiveness of using for-mal methods to manage the reliability of the explicitly defined behavior of critical functions. However, SRE con-tinued to add value in managing the reliability due to unexpected behavior of the product, i.e., behavior outside of what was explicitly defined.
Conclusion Based on the results of the vari-
ous initiatives on applying SRE in the security domain at NSA, we strongly feel that SRE does indeed add value to the software development process. In addition, the approach we took in the technology transfer of SRE within the security domain is an effective one. We were able to achieve some immediate benefits in applying SRET in the PACS project. We then focused on developing support tools for SRET (ART). Using ART, we extended SRET first to an in-house developed application, then to
commercial security-based products. Then we extended the application of SRET to in-house developed, se-curity-based products. In addition, we moved from a strictly “testing” focus to applying SRE to earlier phases of the software lifecycle. 1 Specifically, the tool should be able to
represent operational profiles in terms of extended finite state machines.
2 There was a third product which we eliminated right off as it could not be provisioned within our operational profile environment.
3 Protection Profiles define the security and assurance requirements for a family of products. They form an integral part of the Common Criteria for assessing and certifying security-based applications. The Common Criteria is an international standard (ISO International Standard 15408) adopted and followed by the interna-tional security community.
4 ASN.1 (Abstract Syntax Notation One) is used to specify the structure of data that is transmitted between applica-tions. An ASN.1 compiler generates code for a particular language (e.g., C, Java) that enables specified data struc-tures to be encoded and decoded in a platform-independent manner so they can be passed between applications.
5 A version incorporating code created from the in-house ASN.1 compiler and the other from the commercial compiler.
6 EAL (Evaluation Assurance Level) specifies the level of assurance that should be met in implementing a security-based application. It is part of the Common Criteria (ISO Interna-tional Standard 15408). Higher EAL levels require more rigorous assurance methods be applied in implementing the application and outlines what assur-ance methods should be applied for a particular level.
7 Z (pronounce Zed) is a formal notation with a sound mathematical basis used
in developing computer systems. 8 SPARK toolset is a product of Praxis
Critical Systems. It is a constrained ver-sion of Ada. Software written in SPARK can be formally analyzed as to its cor-rectness using a static analyzer and proof checker that is part of the SPARK toolset.
AcknowledgementsWe wish to acknowledge other
NSA engineers and Harold Wilson (SPRE, Inc.) for the roles they played in the projects described in this article.
References (Musa&Widmaier1996)
Musa, John D. and James Widmaier, Software Reliability Engineered Test-ing, CrossTalk volume 9 number 6, published by the Software Technology Support Center, June 1996.
(Widmaier&Everett2002) Widmaier, J. C. and W. W. Everett, Automated Reliabiilty Testing, ISSRE2002, 13 November 2002.
(Everett&Widmaier2002) W. W. Everett , J. C. Widmaier, H. M. Wilson, Reliability Testing of COTS Security-Based Software Applications, 3rd International Common Criteria Conference, 14 May 2002.
(Everett&Widmaier1999) W. W. Everett and J. C. Widmaier, Modeling Operational Profiles, ISSRE99, 3 November 1999.
(Widmaier1999) Widmaier, J. C., Building More Reli-able Software: Traditional Software Engineering or Formal Methods?, ISSRE99, 3 November 1999.
(Everett2004) Everett, W. W. et al., Managing Reliability of High Integrity Systems, presented at ISSRE2004, 3 November 2004.
Applications of SREContinued from page 12.
continues on page 14
STN 8-1: Software Reliability Engineering14
requires a focus on producing reliable products, but also developing the ability to quickly produce fixes that can be delivered to those customers.
Historically the computer indus-try used reliability modeling to pre-dict future behaviour. Hardware fail-ure rates dominated the overall sys-tem reliability and the systems were run and managed in very controlled environments. Through capturing failures occurring during system test and feeding them into these models it was possible to accurately predict (to some degree) a productʼs future reli-ability. As the complexity of the sys-tems and software increased then the causes of system failures altered. The operating system started to have an increasing impact on overall system reliability, as did other factors relating to the complexity of the system, such
About the AuthorsWilliam W. Everett: Bill has
been involved in the field of Soft-ware Reliability Engineering (SRE) for 17 years. He is chair of the IEEE CS SRE Committee and chair of the Steering Committee for the Interna-tional Symposium on SRE (ISSRE). For the past 8 years, he has been Principal Consultant and owner of SPRE, Inc., a firm providing consulting/training support in SRE. Prior to that, he was a Distinguished Member of Technical Staff at AT&T Bell Labs. Bill holds a PhD degree
Applications of SREContinued from page 13.
Microsoft has found the ap-proach presented in this article to be effective in assessing the reliability of mass market software products such as Windows, both before and after product release. In addition our approach speeds the failure detection and resolution process to assure that quick fixes are developed and then deployed to the user base resulting in an ever increasing level of reliability.
In todayʼs environment the reliability of software systems is fundamental not just for corporations running large mission critical servers but also for the knowledge worker at the office and even the consumer who stores their family photos and does their banking on their personal computer. Customers have an ever increasing expectation of the reli-ability of their products that not only
Software Reliability Engineering for Mass Market Products
Brendan Murphy and Mario R. Garzia Microsoft Corporation
as Human Computer Interface (HCI) failures [2]. While companies contin-ued to rely on software modeling they also started to measure the system behaviour on the customer sites to gain a wider perspective of the actual failure rate of computers [3]. Over time the customer feedback indicated that measuring reliability in terms of system crashes did not fully match their perception of reliability.
Mass market products, such as the Windows operating system, have a number of unique characteristics. Firstly it is no longer possible to test all possible combinations of user configurations. For Windows XP there are currently 35,000+ avail-able drivers, with each driver having over three different versions in the
in Applied Mathematics from the California Institute of Technology and an Engineerʼs Degree from the Colorado School of Mines. He can be reached via email at [email protected].
James C. Widmaier: Jim is re-cently retired from the National Se-curity Agency where he has worked since 1974. He was employed as a physicist from 1968 to 1974 with the Electro-Physics Labs. He has a B.S. degree in Physics from Lafay-ette College and an M.S. in Physics from Pennsylvania State University where he has also completed work
for a PhD. Jim is a member of IEEE and ACM and has published several articles related to software quality assurance. He can be reached via email at [email protected].
continues on page 15
Data & Analysis Center for Software (DACS) 15
field, making the number of possible combinations of hardware and driv-ers, for all practical purposes, infinite. Additionally it is virtually impossible to capture the usage profile of the product. For instance the system management procedures for Windows vary from zero management in the home all the way to servers in corpo-rate datacenters with strict policies.
Therefore the question that Microsoft faced, in developing new products, is whether to persist with reliability models as a reliability pre-dictor or to move towards a measure-ment based approach.
Product Reliability - Pre-diction and Measurements
System reliability is a measure of its ability to provide a failure-free operation. For many practical situa-tions this is represented as the failure rate. If the total number of failures for N installations in a time period T is F, then a good estimate for the failure rate of the software is [4] λ = F / (N * T) . This approach for measuring failure rates has been widely used [1].
Reliability growth models, using data collected during testing, predict the future reliability of the product assuming:
• Configuration of the test systems are representative of the user environment
• Product usage and management does not impact reliability
• Failures captured during system test are representative of customer failures
• Failures occur once and are then correctedWe can test these assumptions
against the two usage extremes of a mass market product such as Windows. Corporate IT departments typically have a standardized server
environment, high quality administra-tors and experienced users. The oppo-site is a home user running Windows on a machine bought from a white box manufacturer.
Corporate customers tradition-ally pre-stage their systems. The computers will only use a standard set of components, such as signed driv-ers. The systems usage profile and management will still affect product reliability [2, 3], but a local call desk will assist users thereby limiting the impact of any failures.
The home PC is increasingly becoming more complex than those found in corporate environments. These systems often consist of state of the art CPUʼs, graphical proces-sors, sound cards, modems and net-working. Within the home they will be connected to a number of products, of different ages, such as cable mo-dems, printers, cameras, MP3 players and other computers in the house. The home userʼs configuration is less likely to have been well tested, as the possible number of configura-tions is infinite. The quality of some of the drivers may be questionable and these will not have been digitally signed by Microsoft. A signed driver indicates that it has been designed for Microsoft operating systems and has been tested for compatibility with Windows. Users are informed that they are running unsigned drivers but may have no option but to install the driver (for instance if their cable modem driver, provided by the ISP, is unsigned). The user may have little to no computer experience but may still be performing system management tasks, such as creating a network of computers in the home; this will inevitably increase the likelihood of HCI induced failures (e.g. due to us-ers attempting to configure systems in ways they were never designed for).
For systems in controlled cor-
Software Reliability Continued from page 14.
continues on page 16
porate environments it is possible to build reliability models that are representative of their usage profiles but this is much more difficult for systems in the home environment. For home systems a measurement based approach is applied.
Problems in areas normally not addressed by reliability models, such as HCI, can be effectively addressed through measurement (identifying areas of complexity which results in incorrect system settings). HCI problems that are identified can be addressed using traditional HCI techniques [6]. To address faults in released products Microsoft has developed Windows Error Reporting (WER). This collects and provides fault resolution to all users. The effectiveness of these processes in ad-dressing overall product reliability is continually measured and improved.
Both modeling and measurements have advantages and disadvantages. Modeling provides a means of pre-diction, but without complete usage characterization it only addresses a subset of failures. For home users in particular there is a decreasing relationship between actual and predictive failure rates. Applying measurement techniques allows companies to capture a complete picture of reliability, albeit later in the development cycle. In choosing to use a measurement approach the next issue to address is how to interpret the data collected through the measure-ment programs.
Characterizing Reliability of Software Systems
To measure the reliability of a software product it is essential to determine what constitutes a failure. Reliability is defined as the prob-ability of encountering a failure in a
STN 8-1: Software Reliability Engineering16
specified amount of time t, where a failure can be defined as a departure from requirements. A failure is tradi-tionally viewed as having occurred when a system stops responding/working, e.g., the system crashed or hung. However, as already men-tioned, there are many types of fail-ures (departures from requirements) beyond hard failures. Customers may view service disruption, not resulting from a system failure, as a systems reliability event.
Based on extensive customer feedback, Microsoft takes a broad view of customer reliability require-ments, whereby systems and software should operate without disruption. As such, system and software reliability also takes into account other types of disruptions including planned events, e.g., system shutdowns required to install an application. Microsoft cat-egorizes disruptions into six different classes of events
• Resilience: The system will con-tinue to provide the user service in the face of internal or external disruptions.
• Recoverable: Following disrup-tion the system can be easily re-stored, through instrumentation and diagnosis, to a previously known state with no data loss.
• Undisruptable: System changes and upgrades do not impact the ser-vice being provided by the system.
• Performing: Provides accurate and timely service whenever needed.
• Production Ready: On release the system contains a minimum number of bugs, requiring a limited number of predictable patches/fixes.
• Predictable: It works as adver-tised, and is backward compatible.
As mentioned, a key aspect of mass market software products is the
extensive variety of possible usage scenarios. For example, home users want their drivers (all 100,000+ possible versions!) to work with their specific systems but are not overly bothered if any configuration changes require a shutdown as these are frequently occurring events (e.g., turning it off at night). For the data center IT system manager, dependent upon a limited set of well tested drivers running across thousands of servers, any configuration changes requiring a shutdown is very costly. The disruption classification above provides a framework for assigning weights based on specific user needs. Using the proper weights for each class of disruption we can arrive at a meaningful assessment of reliability for specific customer scenario. With these scenario specific weights, the reliability of a software system can then be defined as the 6-tuple
R = (RResilient, RRecoverable, RUndisruptable, RPerforming, RProductionReady, RPredictable)
Where we use common reliability metrics to define each member of the 6-tuple, for example, for the Resilient class of disruptions we define the reli-ability RResilient as
Mean Time To Resilience Disruption (MTTRD) = (∑ system uptimes) / (#
of resilience disruptions)
Similar definitions can be devel-oped for corresponding Availability and Downtime metrics. Any improve-ment in individual metrics will result in a corresponding improvement in the reliability experienced by the user. These six measures of reliability can be aggregated into a single over-all reliability number using the spe-cific scenario weights. Keeping the measurements separate allows us to
identify where improvement might be needed. For instance, if we conclude that Resilient systems should function without crashes or hangs irrespective of hardware and software errors, then the subset of events {Ii} for the Resilient class of disruption would be {crashes, hangs} and RResilient is a measure of the time to a crash or hang.
This approach recognizes that a mass market software product like Windows does not have a single reliability figure; product reliability is a function of the customer usage scenario and the level of reliability will likely vary from scenario to scenario. Additionally with hundreds of millions of users it is necessary to develop multiple measurement approaches, dependent upon whether you want to collect usage profiles from a target set of users or failures occurring on all user systems.
Breadth and Depth Mea-surement Approach
Once reliability goals for spe-cific customer scenarios have been defined it is necessary to implement an effective reliability measure-ment approach. In the past, failures reported by users to a product support organization have been used [1] to evaluate the productʼs reliability. But it is well known that customers do not report all the problems they encounter especially when they solve it them-selves. This non-reporting is far more pronounced in mass-market products, compared to software products with on-site service contracts. Reports received are likely to be limited to hard failures (as these may require a support call to resolve).
The best approach for collecting failure data is through automated system reporting based on product
Software Reliability Continued from page 15.
continues on page 17
Data & Analysis Center for Software (DACS) 17
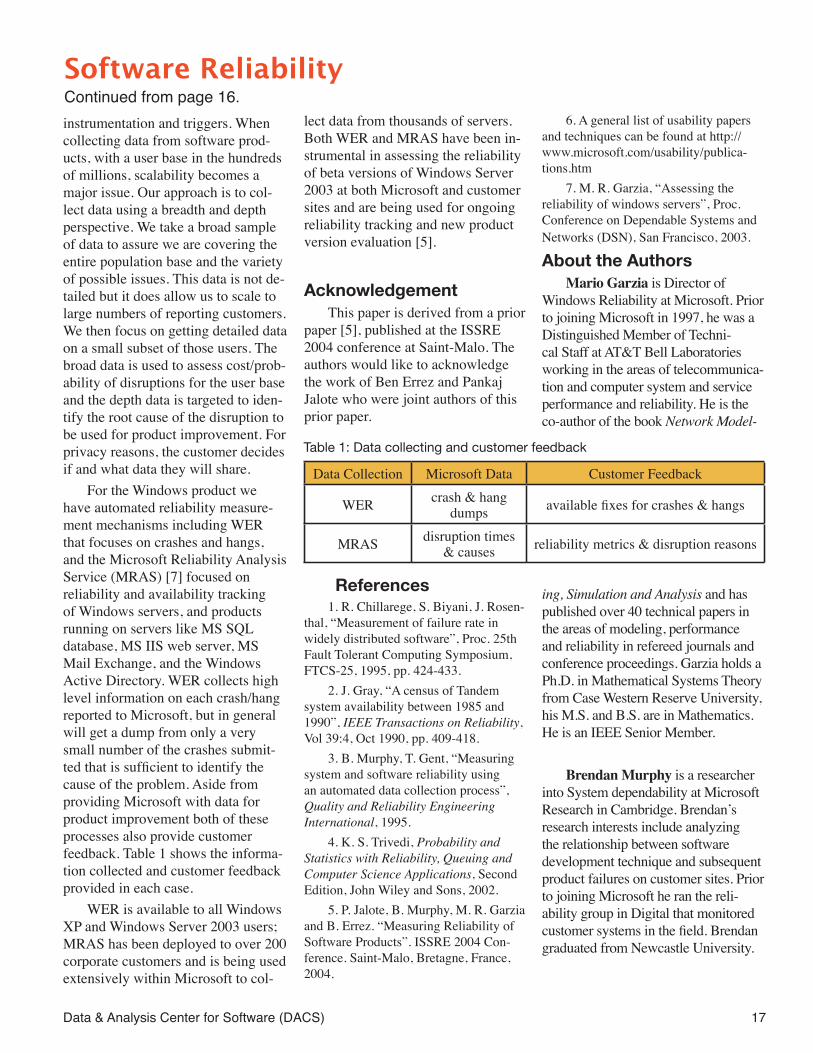
instrumentation and triggers. When collecting data from software prod-ucts, with a user base in the hundreds of millions, scalability becomes a major issue. Our approach is to col-lect data using a breadth and depth perspective. We take a broad sample of data to assure we are covering the entire population base and the variety of possible issues. This data is not de-tailed but it does allow us to scale to large numbers of reporting customers. We then focus on getting detailed data on a small subset of those users. The broad data is used to assess cost/prob-ability of disruptions for the user base and the depth data is targeted to iden-tify the root cause of the disruption to be used for product improvement. For privacy reasons, the customer decides if and what data they will share.
For the Windows product we have automated reliability measure-ment mechanisms including WER that focuses on crashes and hangs, and the Microsoft Reliability Analysis Service (MRAS) [7] focused on reliability and availability tracking of Windows servers, and products running on servers like MS SQL database, MS IIS web server, MS Mail Exchange, and the Windows Active Directory. WER collects high level information on each crash/hang reported to Microsoft, but in general will get a dump from only a very small number of the crashes submit-ted that is sufficient to identify the cause of the problem. Aside from providing Microsoft with data for product improvement both of these processes also provide customer feedback. Table 1 shows the informa-tion collected and customer feedback provided in each case.
WER is available to all Windows XP and Windows Server 2003 users; MRAS has been deployed to over 200 corporate customers and is being used extensively within Microsoft to col-
lect data from thousands of servers. Both WER and MRAS have been in-strumental in assessing the reliability of beta versions of Windows Server 2003 at both Microsoft and customer sites and are being used for ongoing reliability tracking and new product version evaluation [5].
AcknowledgementThis paper is derived from a prior
paper [5], published at the ISSRE 2004 conference at Saint-Malo. The authors would like to acknowledge the work of Ben Errez and Pankaj Jalote who were joint authors of this prior paper.
References1. R. Chillarege, S. Biyani, J. Rosen-
thal, “Measurement of failure rate in widely distributed software”, Proc. 25th Fault Tolerant Computing Symposium, FTCS-25, 1995, pp. 424-433.
2. J. Gray, “A census of Tandem system availability between 1985 and 1990”, IEEE Transactions on Reliability, Vol 39:4, Oct 1990, pp. 409-418.
3. B. Murphy, T. Gent, “Measuring system and software reliability using an automated data collection process”, Quality and Reliability Engineering International, 1995.
4. K. S. Trivedi, Probability and Statistics with Reliability, Queuing and Computer Science Applications, Second Edition, John Wiley and Sons, 2002.
5. P. Jalote, B. Murphy, M. R. Garzia and B. Errez. “Measuring Reliability of Software Products”. ISSRE 2004 Con-ference. Saint-Malo, Bretagne, France, 2004.
Software Reliability Continued from page 16.
6. A general list of usability papers and techniques can be found at http://www.microsoft.com/usability/publica-tions.htm
7. M. R. Garzia, “Assessing the reliability of windows servers”, Proc. Conference on Dependable Systems and Networks (DSN), San Francisco, 2003.
About the AuthorsMario Garzia is Director of
Windows Reliability at Microsoft. Prior to joining Microsoft in 1997, he was a Distinguished Member of Techni-cal Staff at AT&T Bell Laboratories working in the areas of telecommunica-tion and computer system and service performance and reliability. He is the co-author of the book Network Model-
ing, Simulation and Analysis and has published over 40 technical papers in the areas of modeling, performance and reliability in refereed journals and conference proceedings. Garzia holds a Ph.D. in Mathematical Systems Theory from Case Western Reserve University, his M.S. and B.S. are in Mathematics. He is an IEEE Senior Member.
Brendan Murphy is a researcher into System dependability at Microsoft Research in Cambridge. Brendan s̓ research interests include analyzing the relationship between software development technique and subsequent product failures on customer sites. Prior to joining Microsoft he ran the reli-ability group in Digital that monitored customer systems in the field. Brendan graduated from Newcastle University.
Data Collection Microsoft Data Customer Feedback
WER crash & hang dumps available fixes for crashes & hangs
MRAS disruption times & causes reliability metrics & disruption reasons
Table 1: Data collecting and customer feedback
STN 8-1: Software Reliability Engineering18

Data & Analysis Center for Software (DACS) 19
IntroductionThe Space Shuttle avionics
software represents a successful integration of many of the computer industry s̓ most advanced software engineering practices and approaches. Beginning in the late 1970 s̓ this soft-ware development and maintenance project has evolved one of the world s̓ most mature software processes apply-ing the principles of the level 5 of the Carnegie Mellon University Software Engineering Institute s̓ Capability Ma-turity Model. This article explores the successful use of extremely detailed fault and failure history, throughout the software life cycle, in the applica-tion of software reliability engineer-ing techniques to gain insight into the flight-worthiness of the software.
Using the Shuttle application, we show how Software Reliability Engineering (SRE) can be applied to: interpret software reliability predic-tions, support verification and valida-tion of the software, assess the risk of deploying the software, and predict the reliability of the software. Predictions are currently used by the software developer to add confidence to the reliability assessments of the Primary Avionics Shuttle Software (PASS) achieved through formal software certification processes.
Interpretation of Software Reliability Predictions
Successful use of statistical mod-eling in predicting the reliability of a software system requires a thorough understanding of precisely how the resulting predictions are to be inter-preted and applied [6]. The PASS (430 KLOC) is frequently modified, at the request of NASA, to add or change ca-
pabilities, using a constantly improv-ing process. Each of these successive PASS versions constitutes an upgrade to the preceding software version. Each new version of the PASS (des-ignated as an Operational Increment, OI) contains software code which has been carried forward from each of the previous versions (“previous-version subset”) as well as new code generated for that new version (“new-version subset”).We have found that by apply-ing a reliability model independently to the code subsets according to the following rules, we can obtain satis-factory composite predictions for the total version:
(1) all new code developed for a particular version uses the same development process.
(2) all code introduced for the first time for a particular version is considered to have the same life and operational execution history
(3) once new code is added to reflect new functionality in the PASS, this code is only changed thereafter to correct faults.
Estimating Execution TimeWe estimate execution time of
segments of the PASS software by analyzing records of test cases in digital simulations of operational flight scenarios as well as records of actual use in Shuttle operations. Test case executions are only counted as “opera-tional execution time” for previous-version subsets of the version being tested if the simulation fidelity very closely matches actual operational conditions. Pre-release test execution time for the new code actually being tested in a version is never counted as
operational execution time. We use the failure history and operational ex-ecution time history for the new-code subset of each version to generate an individual reliability prediction for that new code in each version by separate applications of the reliability model. This approach places every line of code in the total PASS into one of the subsets of “newly” developed code, whether “new” for the original version or any subsequent version. We then represent the total reliability of the entire software system as that of a composite system of separate com-ponents (“new-code subsets”), each having an individual execution history and reliability, connected in series. The developer uses this approach to apply the Schneidewind Model [5, 6] as a means of predicting a “conser-vative lower bound” for the PASS reliability. This prediction is important because the user can be confident that it is highly likely that the software reliability would be no worse than this bound in operation.
Verification and ValidationSoftware reliability measurement
and prediction are useful approaches to verify and validate software. Measure-ment refers to collecting and analyzing data about the observed reliability of software, for example, the occurrence of failures during test. Prediction refers to using a model to forecast future software reliability, for example, failure rate during operation. Measurement also provides the failure data that is used to estimate the parameters of reliability models (i.e., make the best fit of the model to the observed failure data). Once the parameters have been estimated, the model is used to predict
Application of SRE to Ultrareliable Systems - The Space Shuttle
Norman F. Schneidewind Naval Postgraduate School
continues on page 20

STN 8-1: Software Reliability Engineering20
the future reliability of the software. Verification ensures that the software product, as it exists in a given project phase, satisfies the conditions imposed in the preceding phase (e.g., reliability measurements of ultrareliable systems software components obtained during test conform to reliability specifications made during design) [2]. Validation ensures that the software product, as it exists in a given project phase, which could be the end of the project, satisfies requirements (e.g., software reliability predictions obtained during test corre-spond to the reliability specified in the requirements) [2]. Another way to inter-pret verification and validation is that it builds confidence that software is ready to be released for operational use. The release decision is crucial for systems in which software failures could endan-ger the safety of the mission and crew (i.e., ultrareliable systems software). To assist in making an informed decision, we integrate software risk analysis and reliability prediction.
Risk Assessment Safety risk pertains to executing
the software of an ultrareliable sys-tems system where there is the chance of injury (e.g., astronaut injury or fatality), damage (e.g., destruction of the Shuttle), or loss (e.g., loss of the mission) if a serious software failure occurs during a mission. In the case of the PASS, where the occurrence of even trivial failures is extremely rare, the fraction of those failures that pose any safety or mission risk is too small to be statistically significant. As a result, for risk assessment to be feasible, all failures (of any sever-ity) over the entire 20-year life of the project have been included in the failure history database for this analysis. Therefore, the risk criterion metrics to be discussed for the Shuttle quantify the degree of risk associated
with the occurrence of any software failure, no matter how insignificant it may be. This approach can be applied to assessing safety risk where suf-ficient data exist.
The prediction methodology [3] provides bounds on total test time, remaining failures, and time to next failure that are necessary to perform the risk assessment. Two criteria for software reliability levels are defined. Then these criteria are applied to the risk analysis of ultrareliable systems software, using the PASS as an example. In the case of the Shuttle example, the “risk” represents the de-gree to which the occurrence of fail-ures does not meet required reliability levels, regardless of how insignificant the failures may be. Next, selected prediction equations that are used in reliability prediction and risk analysis are defined and derived.
Criteria for ReliabilityIf the reliability goal is the reduc-
tion of failures of a specified severity to an acceptable level of risk [4], then for software to be ready to deploy, af-ter having been tested for total time tt, it must satisfy the following criteria:
1) predicted remaining failures r (tt) < rc, (1) where rc is a specified critical value, and
2) predicted time to next failure TF (tt) > tm, (2) where tm is mission duration.
For systems that are tested and operated continuously like the Shut-tle, tt, TF (tt), and tm are measured in execution time. Note that, as with any methodology for assuring software reliability, there is no guarantee that the expected level will be achieved. Rather, with these criteria, the objec-tive is to reduce the risk of deploying the software to a “desired” level.
Remaining Failures CriterionUsing the assumption that the
faults that cause failures are removed (this is the case for the Shuttle), criterion 1 specifies that the residual failures and faults must be reduced to a level where the risk of operating the software is acceptable. As a practical matter, rc=1 is suggested. That is, the goal is to reduce the expected remain-ing failures of a specified severity to less than one before deploying the software. The assumption for this choice is that one or more remaining failures would constitute an undesir-able risk of failures of the specified severity. Thus, one way to specify rc is by failure severity level, as classified by the developer, (e.g., include only life threatening failures). Another way, which imposes a more demanding criterion, is to specify that rc represents all severity level, as in the Shuttle example. For example, r (tt) <1 would mean that r (tt) must be less than one failure, independent of severity level.
If r (tt) ≥ rc is predicted, testing would continue for a total time tt´ > tt that is predicted to achieve r (tt´) < rc, using the assumption that more failures will be experienced and more faults will be corrected so that the remaining failures will be reduced by the quantity r (tt) –r (tt´). If the developer does not have the resources to satisfy the criterion or is unable to satisfy the criterion through additional testing, the risk of deploying the soft-ware prematurely should be assessed (see the next section). It is known that it is impossible to demonstrate the ab-sence of faults [1]; however, the risk of failures occurring can be reduced to an acceptable level, as represented by rc. This scenario is shown in Fig-ure 1. In case A, r (tt) < rc is predicted and the mission begins at tt. In case B, r (tt) ≥ rc is predicted and the mission would be postponed until the software
Ultrareliable SystemsContinued from page 19.
continues on page 21

Data & Analysis Center for Software (DACS) 21
is tested for total time tt´, when r (tt´) < rc is predicted. In both cases, criterion 2) must also be satisfied for the mission to begin.
Time to Next Failure Criterion
Criterion 2 specifies that the soft-ware must survive for a time greater than the duration of the mission. If TF (tt) ≤ tm, is predicted, the software is tested for a total time tt˝ > tt that is predicted to achieve TF (tt˝) > tm, us-ing the assumption that more failures will be experienced and faults cor-rected so that the time to next failure will be increased by the quantity TF (tt˝) -TF (tt). Again, if it is infeasible for the developer to satisfy the crite-rion for lack of resources or failure to achieve test objectives, the risk of deploying the software prematurely should be assessed. This scenario is shown in Figure 2. In case A TF (tt) > tm is predicted and the mission begins at tt. In case B, TF (tt)≤ tm is predicted and in this case the mission would be postponed until the software is tested for total time tt˝, when TF (tt˝) > tm
is predicted. In both cases, criterion 1) must also be satisfied for the mis-sion to begin. If neither criterion is satisfied, the software is tested for a time which is the greater of tt´ or tt˝.
Remaining Failures MetricThe mean value of the risk crite-
rion metric (RCM) for criterion 1 is formulated as follows:
RCM r (tt) = (r (tt) -rc) /rc = (r (tt) /rc) - 1 (3)
Equation (3) is plotted in Figure 3 as a function of tt for rc = 1, where positive, zero, and negative values correspond to r (tt) >rc, r (tt) = rc, and r (tt) < rc, respectively. In Figure 3, these values correspond to the follow-ing regions: CRITICAL (i.e., above the X-axis predicted remaining failures are greater than the specified value); NEUTRAL (i.e., on the X-axis predict-ed remaining failures are equal to the specified value); and DESIRED (i.e., below the X-axis predicted remaining failures are less than the specified value, which could represent a “safe” threshold or in the Shuttle example, an “error-free” condition boundary). This graph is for the Shuttle Operational Increment OID (with many years of operation): a software system comprised of modules and configured from a series of builds to meet Shuttle mission functional requirements. In this example, it can be seen that at approximately tt = 57 the risk transi-tions from the CRITICAL region to the DESIRED region.
Ultrareliable SystemsContinued from page 20.
Start Test End Test, Begin MissionEnd Mission
tt
A
Start TestEnd MissionContinue Test
B
End Test
Begin Mission
tt
tt
''
Figure 2. Time to Failure Scenario
tm
TF (t
t)
tm
TF (t
t) T F (t
t
'' )
Figure 2. Time to Failure Scenario
Start Test End Test, Begin MissionEnd Mission
r (tt) < r
c
tt
A
Start TestEnd MissionContinue Test
B
End Test
Begin Mission
tt
tt
'
r (tt) >=
rc
r (tt) < r
c
Figure 1. Remaining Failures ScenarioFigure 1. Remaining Failures Scennario
continues on page 22

STN 8-1: Software Reliability Engineering22
Time to Next Failure MetricSimilarly, the mean value of the
risk criterion metric (RCM) for crite-rion 2 is formulated as follows:
RCM TF (tt) = (tm - TF (tt)) / tm=1-(TF (tt)) / tm (4)
Equation (4) is plotted in Figure 4 as a function of tt for tm = 8 days (a typical mission duration time for this OI), where positive, zero, and negative risk corresponds to TF (tt) < tm, TF (tt) = tm, and TF (tt) > tm, respectively. In Figure 4, these values correspond to the following regions: CRITICAL (i.e., above the X-axis predicted time to next failure is less than the specified value); NEUTRAL (i.e., on the X-axis predicted time to next failure is equal to the specified value); and DESIRED (i.e., below the X-axis predicted time to next failure is greater than the specified value). This graph is for the Shuttle operational increment OIC. In this example, the RCM is in the DESIRED region at all values of tt.
Lessons LearnedSeveral important lessons have
been learned from our experience of twenty years in developing and maintaining the PASS, which you could consider for adoption in your SRE process:
1) No one SRE process method is the “silver bullet” for achieving high reliability. Various methods, including formal inspections, failure modes analysis, verifica-tion and validation, testing, sta-tistical process management, risk analysis, and reliability modeling and prediction must be integrated and applied.
2) The process must be continu-ally improved and upgraded. For example, experiments with soft-ware metrics have demonstrated the potential of using metrics as early indicators of future reli-ability problems. This approach, combined with inspections, al-lows many reliability problems to be identified and resolved prior to testing.
3) The process must have feedback loops so that information about reliability problems discovered during inspection and testing is fed back not only to requirements analysis and design for the purpose of improving the reliability of future products, but also to the
Ultrareliable SystemsContinued from page 21.
-2
-1
0
1
2
3
4
5
6
7
0 10 20 30 40 50 60 70 80 90
Total Test Time (months)
Critical: r (t t) > r c
Desired: r (tt ) < rc
r (tt ) = r c
Figure 3. Risk Criterion Metric (Remaining Failures) vs. Total Test Time (T1, OID)
-80
-70
-60
-50
-40
-30
-20
-10
0
10
0 5 10 15 20 25 30 35 40 45 50
Total Test Time (months)
Critical: TF (t t ) = t m
Desired: TF (t t ) > t m
t m = 8 days
Figure 4. Risk Criterion Metric (Time to Next Failure) vs. Total Test Timecontinues on page 23
Data & Analysis Center for Software (DACS) 23
requirements analysis, design, inspection and testing processes themselves. In other words, the feedback is designed to improve not only the product but also the processes that produce the product.
4) Given the current state-of-the-practice in software reliability modeling and prediction, practi-tioners should not view reliability models as having the ability to make highly accurate predic-tions of future software reliability. Rather, software managers should interpret these predictions in two significant ways: a) providing in-creased confidence, when used as part of an integrated SRE process, that the software is safe to deploy; and 2) providing bounds on the reliability of the deployed software (e.g., high confidence that in op-eration the time to next failure will exceed the predicted value and the predicted value will safely exceed the mission duration).
References1. E. W. Dijkstra, “Structured Pro-
gramming”, Software Engineering Techniques, eds. J. N. Buxton and B. Randell, NATO Scientific Affairs Division, Brussels 39, Belgium, April 1970 pp. 84-88.
2. IEEE Standard Glossary of Software Engineering Terminology, IEEE Std 610.12.1990, The Institute of Electri-cal and Electronics Engineers, New York, New York, March 30, 1990.
3. Ted Keller, Norman F. Schneidewind, and Patti A. Thornton “Predictions for Increasing Confidence in the Reliability of the Space Shuttle Flight Software”, Proceedings of the AIAA Computing in Aerospace 10, San An-tonio, TX, March 28, 1995, pp. 1-8.
4. Norman F. Schneidewind, “Reli-ability Modeling for Safety Systems Software”, IEEE Transactions on
Reliability, Vol. 46, No.1, March 1997, pp.88-98.
5. Norman F. Schneidewind, “Software Reliability Model with Optimal Selection of Failure Data”, IEEE Transactions on Software Engineer-ing, Vol. 19, No. 11, November 1993, pp. 1095-1104.
6. Norman F. Schneidewind and T. W. Keller, “Application of Reliability Models to the Space Shuttle”, IEEE Software, Vol. 9, No. 4, July 1992 pp. 28-33.
About the Author: Norman F. Schneidewind is
Professor of Information Sciences at the Naval Postgraduate School. Dr. Schneidewind was selected for an IEEE USA Congressional Fellowship for 2005 and will work on the Com-mittee on Governmental Affairs in the U.S. Senate.
Dr. Schneidewind is a Fellow of the IEEE, elected in 1992 for “con-tributions to software measurement models in reliability and metrics, and for leadership in advancing the field of software maintenance”. In 2001, he received the IEEE “Reliability Engineer of the Year” award from the IEEE Reliability Society.
In 1993 and 1999, he received awards for Outstanding Research Achievement by the Naval Postgradu-ate School. He is the developer of the Schneidewind software reliability model that is used by NASA to assist in the prediction of software reliabil-ity of the Space Shuttle. This model is one of the models recommended by the American Institute of Aeronautics and Astronautics Recommended Prac-tice for Software Reliability. Norman F. [email protected]
Ultrareliable SystemsContinued from page 22.
STN 8-1: Software Reliability Engineering24
Data & Analysis Center for Software (DACS) 25
The first 50 people to send in a completed survey will receive a FREE DoD/IT Acronym CD from the DACS. This valuable CD-ROM contains over 9,000 Department of
Defense and Information Technology acronyms. There are hun-dreds of acronym lists available but none are as well done as this CD AND specifically targeted towards DoD and Information Tech-nology. This unique-shaped CD-ROM plays in your computer’s regular, hub-mounted, CD drive. You’ll use this great resource over and over again. It’s FREE, just for filling out our brief survey on the next page!
▼ Fold Here ▼
▼ Fold Here ▼
http://iac.dtic.mil/dacs/
Data & Analysis Center for Software (DACS)
STN 8-1: Software Reliability Engineering26
Software Tech News Subscriber Survey1. Which volume of the Software Tech News did you receive? _______________________________
2. When did you receive the newsletter? (month/year) __________________________
3. How satisfied were you with the CONTENT of the newsletter? (Article Quality) ❏ Very Satisfied ❏ Satisfied ❏ Neither Satisfied nor Dissatisfied ❏ Dissatisfied ❏ Very Dissatisfied
4. How satisfied were you with the APPEARANCE of the newsletter?❏ Very Satisfied ❏ Satisfied ❏ Neither Satisfied nor Dissatisfied ❏ Dissatisfied ❏ Very Dissatisfied
5. How satisfied were you with the OVERALL QUALITY of the newsletter?❏ Very Satisfied ❏ Satisfied ❏ Neither Satisfied nor Dissatisfied ❏ Dissatisfied ❏ Very Dissatisfied
6. How satisfied were you with the ACCURACY of the address on the newsletter?❏ Very Satisfied ❏ Satisfied ❏ Neither Satisfied nor Dissatisfied ❏ Dissatisfied ❏ Very Dissatisfied
7. Approximately how much of the newsletter do you read?❏ The entire issue ❏ Most of the content ❏ About half the content ❏ Briefly Skimmed ❏ Didnʼt Read
8. Would you read this newsletter in an E-mail newsletter format? ❏ Definitely ❏ Probably ❏ Not Sure ❏ Probably Not ❏ Definitely Not
9. How did you request the product or service?❏ Phone Call ❏ E-mail ❏ DACS Website ❏ Subscription Form Other ____________________________
10. Would you recommend the DoD Software Tech News to a colleague? ❏ Definitely ❏ Probably ❏ Not Sure ❏ Probably Not ❏ Definitely Not
11. What topics would you like to see this newsletter devoted to?
Comments (Optional)
Contact Information (Optional*)Name: Position/Title:
Organization: Office Symbol:
Address:
City: State: Zip Code:
Country: E-mail:
Telephone: Fax:
STN 8:1 Software Reliability Engineering
Data & Analysis Center for Software (DACS) 27
About the DoD Software Tech News
Article ReproductionImages and information presented in these articles may be repro-duced as long as the following message is noted:
“This article was originally printed in the DoD Software Tech News, Vol. 8, No. 1. Requests for copies of the referenced newsletter may be submitted to the following address:
Philip King, Editor Data & Analysis Center for Soft-ware P.O. Box 1400 Rome, NY 13442-1400
Phone: 800-214-7921 Fax: 315-334-4964 E-mail: [email protected]
An archive of past newsletters is available at: www.SoftwareTechNews.com.
In addition to this print message, we ask that you send us three copies of any document that references any article appearing in the DoD Software Tech News.
About This Publication:
The DoD Software Tech News is published quarterly by the Data & Analysis Center for Software (DACS). The DACS is a DoD sponsored Information Analysis Center (IAC), administratively managed by the Defense Technical Information Center (DTIC). The DACS is technically managed by Air Force Research Laboratory, Rome, NY and operated by ITT Industries, Advanced Engineering and Sciences Division.
To Subscribe to this Publication Contact:
Phone: 800-214-7921 Fax: 315-334-4964
E-mail: [email protected] Web: www.dacs.dtic.mil/forms/ userform.shtml
DACS P.O. Box 1400
Rome, NY 13442-1400
Phone: 800-214-7921 Fax: 315-334-4964 E-mail: [email protected] URL: http://iac.dtic.mil/dacs/
Philip King Editor
ITT Industries, DACS
Paul Engelhart DACS COTR
Air Force Research Lab (IFEA)
Morton A. Hirschberg Editorial Board Chairman
Army Research Lab (retired)
Ellen Walker ITT Industries, DACS
Thomas McGibbon DACS Director
ITT Industries, DACS
David Nicholls DACS Deputy Director
ITT Industries, DACS
Marshall Potter Federal Aviation Administration
Richard Turner OUSD (AT&L)
Distribution Statement:
Unclassified and Unlimited
Cover Design by Joe Barbaccia, ITT Industries
STN Editorial Board
STN 8-1: Software Reliability Engineering28
Software Reliability Engineering- An Overview .......................................... 3
Automated Testing with an Operational Profile ................................. 7
Applications of SRE in the Security Domain ...................................11
Software Reliability Engineering for Mass Market Products ................... 14
Application of SRE to Ultrareliable Systems - The Space Shuttle ............. 19
About the DoD Software Tech News .......... 27
Data & Analysis Center for SoftwareP.O. Box 1400Rome, NY 13442-1400
PRSRT STDU.S. Postage
P A I DPermit #566 UTICA, NY
Return Service Requested
AdvertisementThe DoD Software Tech News is now ac-
cepting advertisements for future newsletters. In addition to being seen by the thousands of people who subscribe to the DoD Software Tech News in paper copy, the Tech News will also be placed on the Data & Analysis Center for Software’s website (http://iac.dtic.mil/dacs/), exposing your prod-uct, organization, or service to hundreds of thousands of additional eyes.
Interested in learning more? For rates, lay-out information, and requirements contact:
Philip King, STN Editor Data & Analysis Center for Software P.O. Box 1400 Rome, NY 13442-1400
Phone: (800) 214-7921 Fax: (315) 334-4964 E-mail: [email protected]
STN Vol. 8, No. 1
In This Issue


