Table of contents Introduction ...................................................................................................................................... 1 Updating the circulation data ........................................................................................................... 1 Canada .............................................................................................................................................. 2 U.S.A. ................................................................................................................................................ 7 United Kingdom ............................................................................................................................... 9 Case Study: The impact of format changes on the circulation of U.K. national dailies ............... 12 Assessing the trends ........................................................................................................................ 15 Responding to change: The challenge of unbundling ................................................................... 15 One impact of unbundling: The collapse of the classifieds ........................................................... 17 Is there a new business model? ....................................................................................................... 21
ORIGINALLY PUBLISHED: 28 OCTOBER 2013 LAST MODIFIED: 31 MARCH 2014
ii
List of figures 1. Total daily newspaper paid circulation, and total households, Canada, 2000-2012 ............... 3 2. Total daily newspaper paid circulation as % of households, Canada, 2000-2012 ................... 3 3. English-language daily newspaper paid circulation, and English/Allophone households, Canada, 2000-2012 ......................................................................................................................... 4 4. English-language daily newspaper paid circulation as % of households, Canada, 2000-2012 ......................................................................................................................... 4 5. French-language daily newspaper paid circulation, and French households, Canada, 2000-2012 ......................................................................................................................... 5 6. French-language daily newspaper paid circulation as % of households, Canada, 2000-2012 ......................................................................................................................... 5 7. Comparison of English-language and French-language paid daily newspaper circulation as % of households, Canada, 2000-2012 ........................................................................................ 6 8. Total daily / Sunday newspaper paid circulation, and total households, USA, 2000-2012 .............................................................................................................................. 8 9. Total daily / Sunday newspaper paid circulation as % of households, USA, 2000-2012 .............................................................................................................................. 8 10. Total national daily / national Sunday newspaper paid circulation, and total households, Great Britain, 2000-2013 .................................................................................. 10 11. Total national daily / national Sunday newspaper paid circulation as % of households, Great Britain, 2000-2013 .......................................................................................... 10 12. Total regional daily / regional Sunday newspaper paid circulation, Great Britain, 2000-2013 ................................................................................................................ 11 13. Comparison of paid circulation trends, national daily newspapers and regional daily newspapers, Great Britain, 2000-2013, Index basis (2000=100) ................................................. 11 14. Circulation of The Daily Telegraph, The Times, and The Guardian, First Quarter 2000 to Third Quarter 2013 ..................................................................................... 13 15. Circulation of The Daily Telegraph, The Times, and The Guardian, First Quarter 2000 to Third Quarter 2013, Index basis (2000=100) ...........................................14 16. Total daily newspaper paid circulation as % of households, Canada, USA, and Great Britain’s national dailies, 2000-2012 .................................................................................. 16 17. Total Sunday newspaper paid circulation as % of households, USA, and Great Britain’s national Sunday newspapers, 2000-2012 ............................................................ 16 18. Total classified advertising revenue, Canadian daily newspapers, 2000-2012 ..................... 18 19. Comparison of paid circulation trends and classified advertising revenue trends, Canadian daily newspapers, 2000-2012, Index basis (2000=100) .............................................. 18 20. Total classified advertising revenue, American daily newspapers, 2000-2012 .................... 19 21. Comparison of paid circulation trends and classified advertising revenue trends, American daily newspapers, 2000-2012, Index basis (2000=100) ............................................. 19 22. Estimated total classified advertising revenue, British national and regional daily newspapers (combined), 2000-2012 .................................................................................... 20 23. Comparison of paid circulation trends and classified advertising revenue trends, British national and regional daily newspapers (combined), 2000-2012, Index basis (2000=100) ............................................................................................. 20
1
Introduction In May 2011, we published a discussion paper titled “Sixty Years of Daily Newspaper Circulation Trends”, which included data for Canada, the United States, and the United Kingdom, and which covered the period from 1950 to 2010. In that paper, we demonstrated that, in relation to the number of households in each country, there has been a long-term decline in the paid circulation of print daily newspapers.1 Now, in the Fall of 2013, we are updating that discussion paper, to provide data for the period since the previous discussion paper was published, and to focus on a number of issues related to the survival of the printed newspaper and the ability of legacy newspaper companies to make the transition to an online environment. Our focus continues to be on paid circulation dailies, because of the availability of data over a long period of time, and because of the historical role of paid circulation in the daily newspaper business model. We also believe that the physical presence of the printed newspaper may still be a factor in helping newspaper companies make the transition to online, although that has likely declined over time. This is not intended to diminish the role of free dailies, or of online editions, but our focus here is on the timeline of circulation trends, and on how those trends – and, of course, technology – may impact on the question of whether journalism in the future will be provided by successfully “transitioned” legacy newspaper companies, or will be provided by new companies not rooted in the legacy print product. Updating the circulation data The first sets of data in this discussion paper focus on paid daily newspaper circulation trends from 2000 to 2012 (or 2013) in Canada, the U.S.A., and the United Kingdom. In the case of Canada and the U.S.A., significant changes in reporting circulation have taken place since our previous discussion paper on circulation trends was published. The Audit Bureau of Circulations (ABC) has been rebranded as the Alliance for Audited Media (AAM). In the U.S., digital editions and “branded editions” have been added to print circulation. In Canada, Newspapers Canada2 no longer publishes circulation breakdowns that indicate how much of a paid daily newspaper’s circulation is, in fact, paid, and how much is “sponsored/free”. In the U.K., however, the ABC reporting methodology for daily newspaper circulation has remained more consistent than in Canada or the U.S.
1 The 2011 discussion paper may be accessed at: http://media-cmi.com/downloads/Sixty_Years_Daily_Newspaper_Circulation_Trends_050611.pdf 2 Newspapers Canada is a joint initiative of the Canadian Newspaper Association and the Canadian Community Newspapers Association.
2
Canada3 There have been two important changes in the reporting of Canadian daily newspaper circulation data in the last five years. The first change took effect with the 2008 data. As explained by the Canadian Newspaper Association:
The Canadian Newspaper Association’s 2008 circulation data report calculates paid circulation levels based on ABC and CCAB audit statements. Due to the change in the data collection periods in 2008, any comparisons over the previous year’s data should be used with caution. Papers audited by CCAB now provide 12-month averages ending December 31. For those dailies measured by ABC, the paid averages of two six-month ABC Fas Fax reports were utilized for the periods ending March 31 and September 30 to provide a 12-month picture. (Previous ABC and CCAB circulation data only reflected the six-month periods ending March 31)4
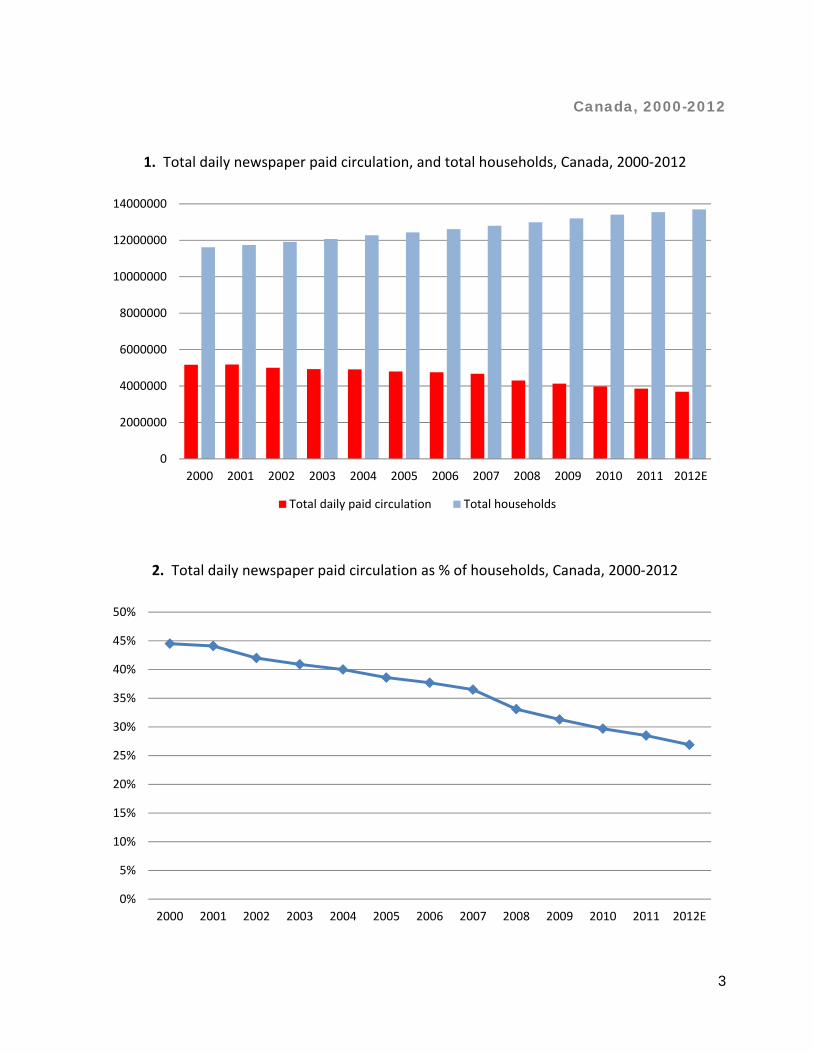
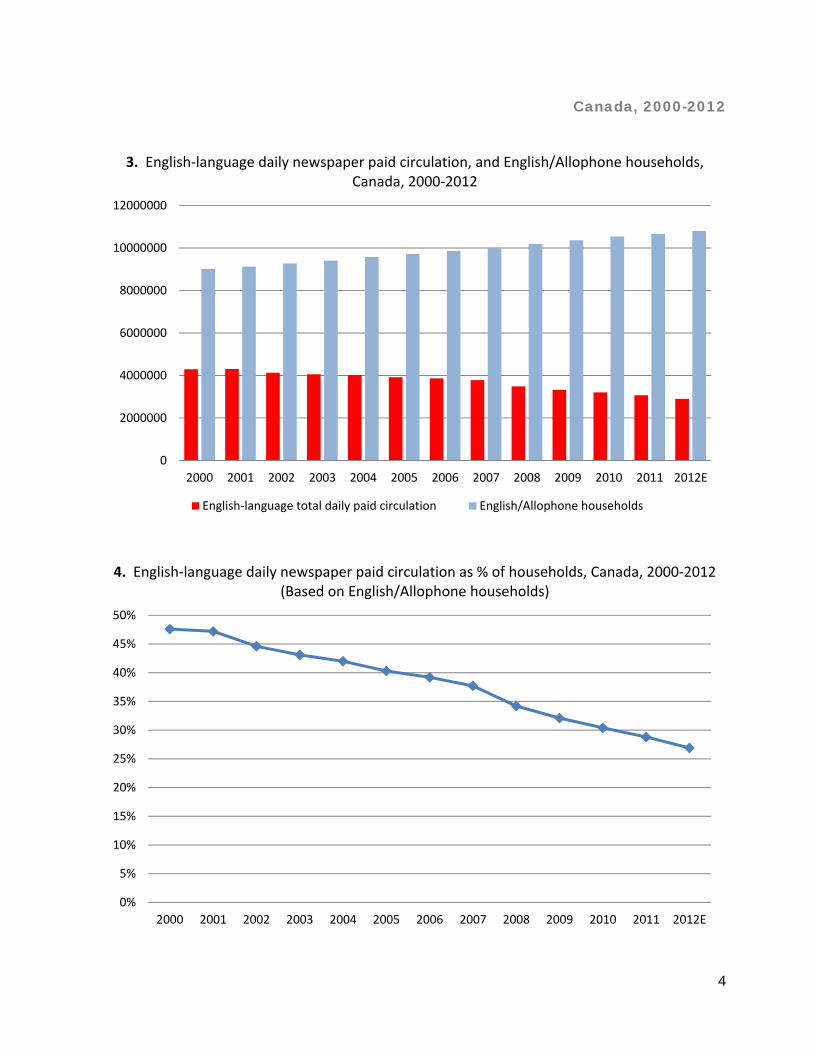
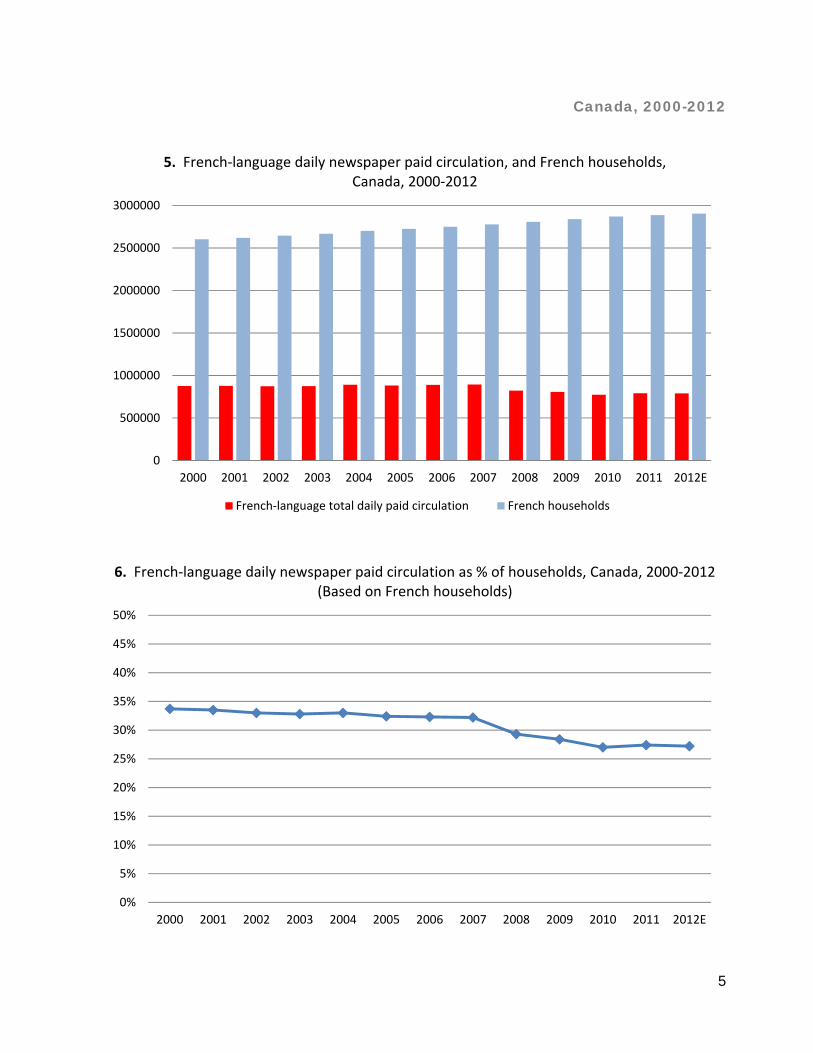
Then, starting with the 2012 data, Newspapers Canada stopped publishing the details that would indicate how much of the circulation of a “paid” daily newspaper was, in fact, paid, and how much was sponsored or free. For example, according to the data published by Newspapers Canada, the Toronto Star’s average weekday circulation in 2012 was about 346,000. However, reference to the underlying report from CCAB indicates that, of that total, only two thirds was paid circulation, and one third was “sponsored/free”. Fortunately, the change only affects data for 2012, and there are sufficient additional current and historical sources to develop a reasonable estimate for the paid circulation totals for Canadian daily newspapers for 2012, in a manner consistent with previous years. Figures 1 and 2 deal with all Canadian dailies, from 2000 to 2012. As we can see from Figures 1 and 2, circulation declined, both in absolute terms, and in relation to households. In 2000, total daily newspaper paid circulation in Canada was equivalent to 44.5 per cent of households; by 2012, it was about 27 per cent. (The corresponding figure in 1950 was more than 100 per cent of households.) Figures 3 and 4 provide similar data for English-language daily newspapers in Canada; Figures 5 and 6 provide data for French-language daily newspapers in Canada.5
Text continues on page 6 …
3 Sources and methodology: Circulation data come from the Canadian Newspaper Association, Newspapers Canada, ABC, AAM, CCAB, and, for 2012, estimates by Communications Management Inc.; household estimates are based on data from Statistics Canada. 4 Canadian Newspaper Association, Circulation Data Report 2008, p. 2. (In our 2011 discussion paper, we attempted to indicate what the 2008 and later circulation totals might have been had the methodology not changed; given the additional changes in reporting circulation, this kind of adjustment will be increasingly difficult to do over time.) 5 Please note that “Allophone” refers to persons whose language is neither English nor French.
3
Canada, 2000-2012
1. Total daily newspaper paid circulation, and total households, Canada, 2000‐2012
2. Total daily newspaper paid circulation as % of households, Canada, 2000‐2012
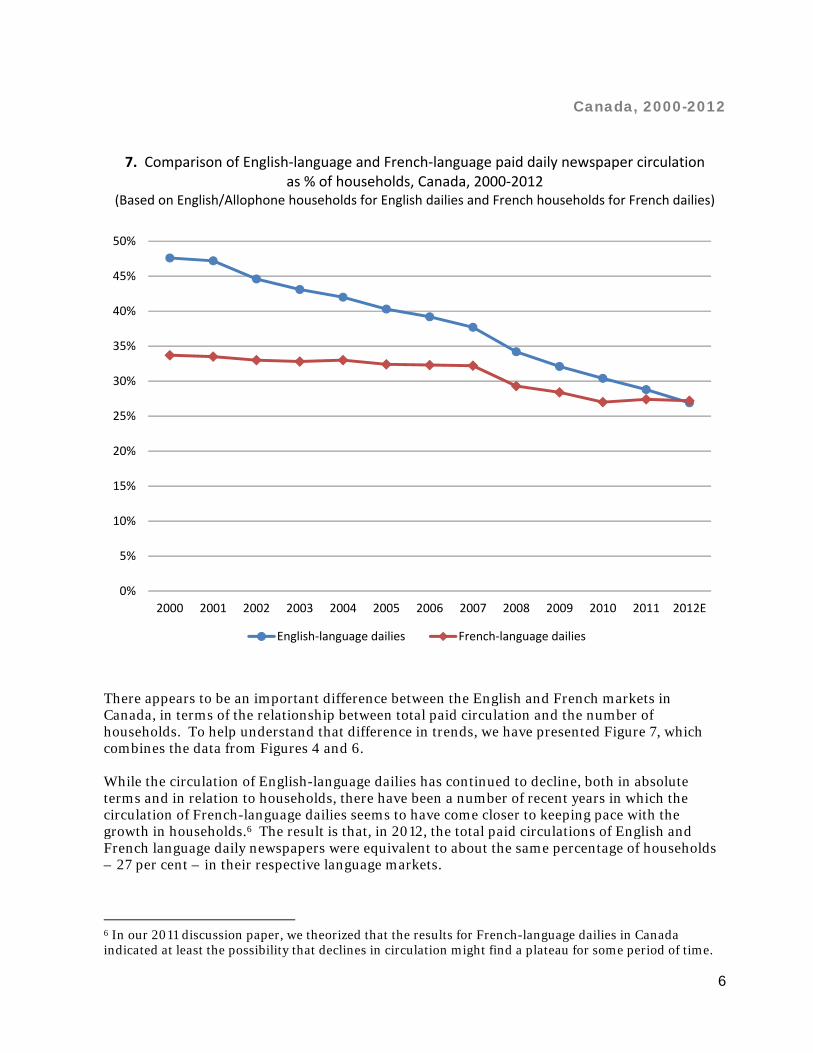
7. Comparison of English‐language and French‐language paid daily newspaper circulation as % of households, Canada, 2000‐2012
(Based on English/Allophone households for English dailies and French households for French dailies)
There appears to be an important difference between the English and French markets in Canada, in terms of the relationship between total paid circulation and the number of households. To help understand that difference in trends, we have presented Figure 7, which combines the data from Figures 4 and 6. While the circulation of English-language dailies has continued to decline, both in absolute terms and in relation to households, there have been a number of recent years in which the circulation of French-language dailies seems to have come closer to keeping pace with the growth in households.6 The result is that, in 2012, the total paid circulations of English and French language daily newspapers were equivalent to about the same percentage of households – 27 per cent – in their respective language markets.
6 In our 2011 discussion paper, we theorized that the results for French-language dailies in Canada indicated at least the possibility that declines in circulation might find a plateau for some period of time.
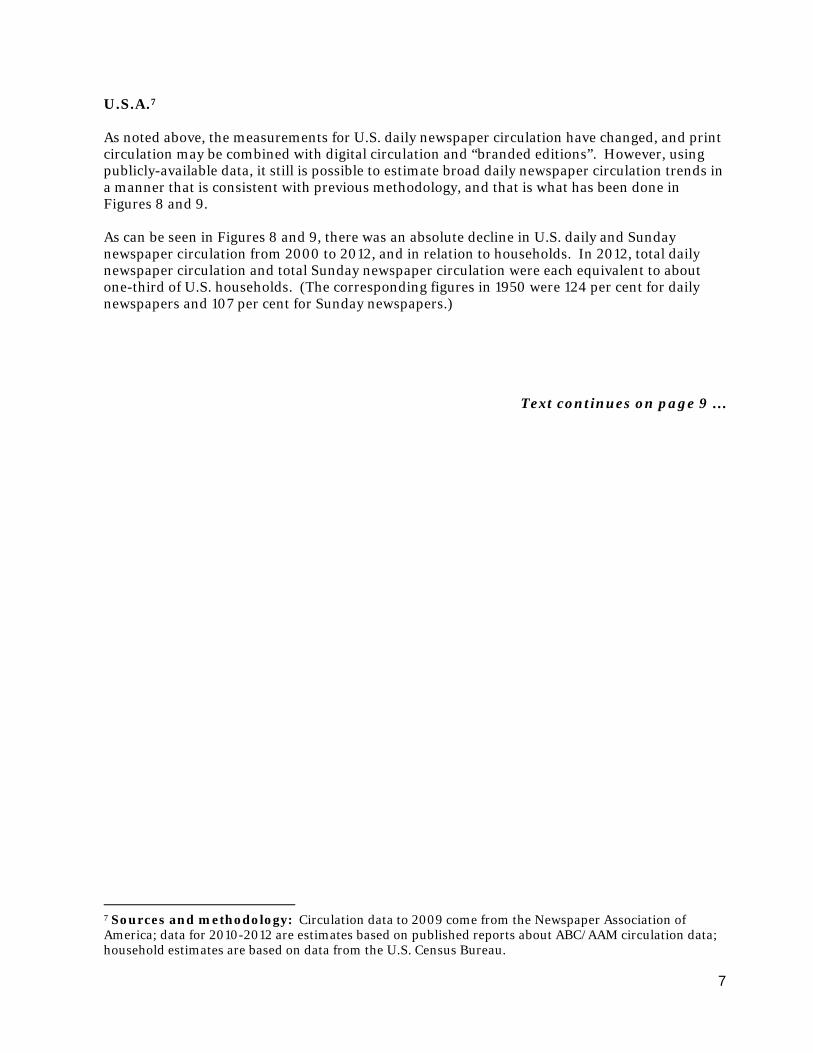
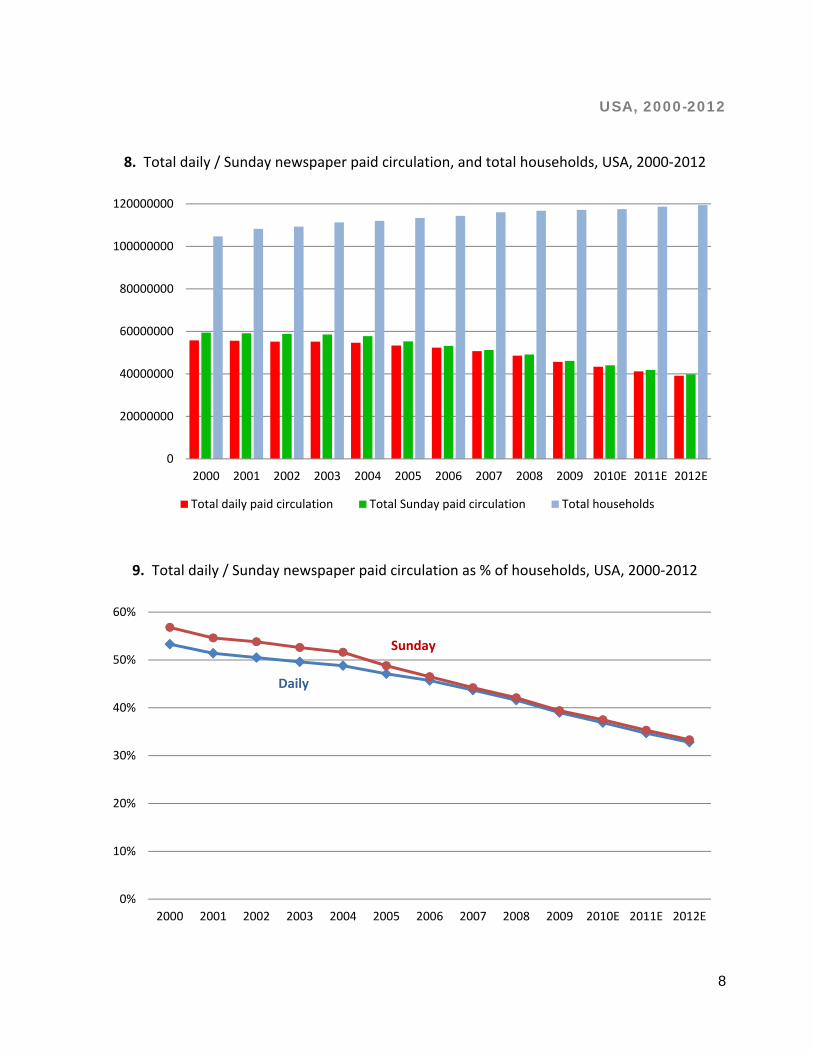
U.S.A.7 As noted above, the measurements for U.S. daily newspaper circulation have changed, and print circulation may be combined with digital circulation and “branded editions”. However, using publicly-available data, it still is possible to estimate broad daily newspaper circulation trends in a manner that is consistent with previous methodology, and that is what has been done in Figures 8 and 9. As can be seen in Figures 8 and 9, there was an absolute decline in U.S. daily and Sunday newspaper circulation from 2000 to 2012, and in relation to households. In 2012, total daily newspaper circulation and total Sunday newspaper circulation were each equivalent to about one-third of U.S. households. (The corresponding figures in 1950 were 124 per cent for daily newspapers and 107 per cent for Sunday newspapers.)
Text continues on page 9 …
7 Sources and methodology: Circulation data to 2009 come from the Newspaper Association of America; data for 2010-2012 are estimates based on published reports about ABC/AAM circulation data; household estimates are based on data from the U.S. Census Bureau.
8
USA, 2000-2012
8. Total daily / Sunday newspaper paid circulation, and total households, USA, 2000‐2012
9. Total daily / Sunday newspaper paid circulation as % of households, USA, 2000‐2012
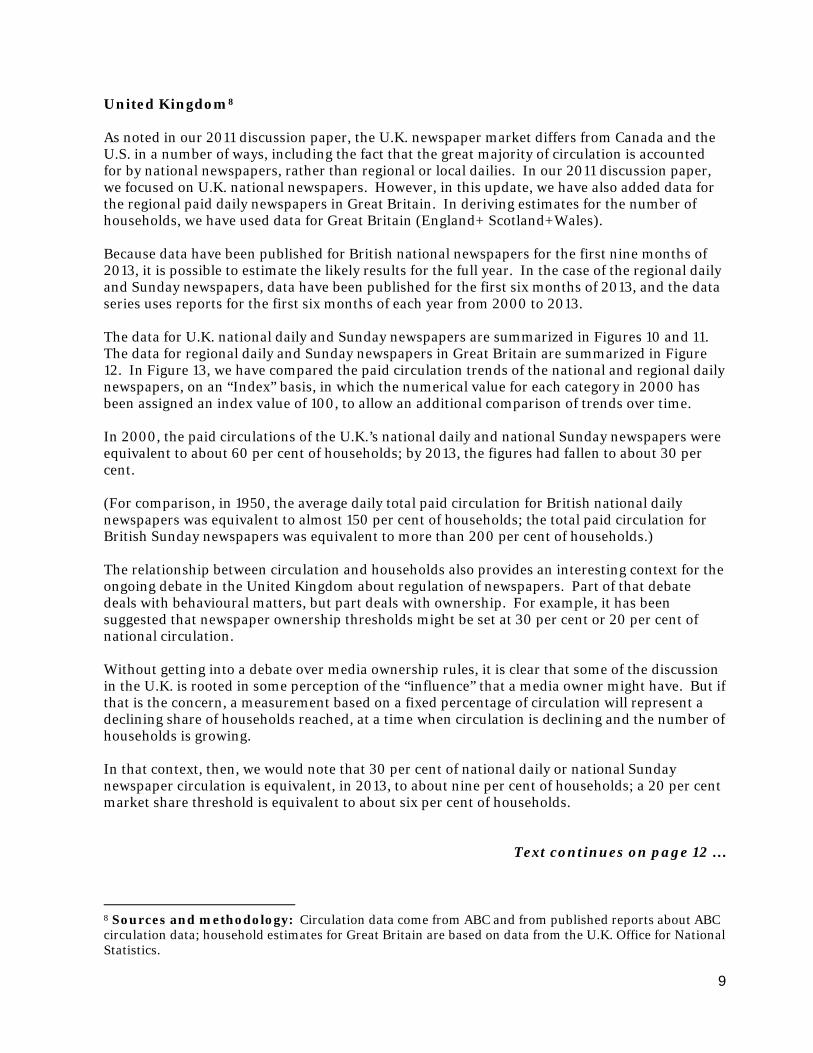
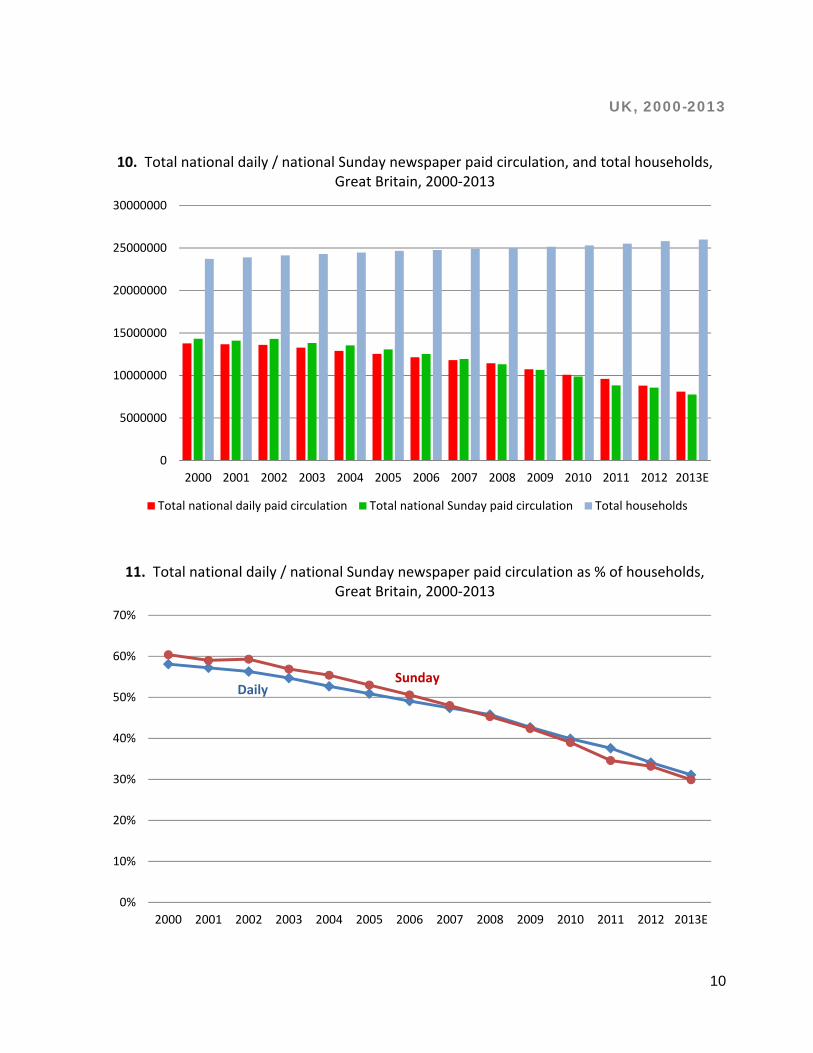
United Kingdom8 As noted in our 2011 discussion paper, the U.K. newspaper market differs from Canada and the U.S. in a number of ways, including the fact that the great majority of circulation is accounted for by national newspapers, rather than regional or local dailies. In our 2011 discussion paper, we focused on U.K. national newspapers. However, in this update, we have also added data for the regional paid daily newspapers in Great Britain. In deriving estimates for the number of households, we have used data for Great Britain (England+ Scotland+Wales). Because data have been published for British national newspapers for the first nine months of 2013, it is possible to estimate the likely results for the full year. In the case of the regional daily and Sunday newspapers, data have been published for the first six months of 2013, and the data series uses reports for the first six months of each year from 2000 to 2013. The data for U.K. national daily and Sunday newspapers are summarized in Figures 10 and 11. The data for regional daily and Sunday newspapers in Great Britain are summarized in Figure 12. In Figure 13, we have compared the paid circulation trends of the national and regional daily newspapers, on an “Index” basis, in which the numerical value for each category in 2000 has been assigned an index value of 100, to allow an additional comparison of trends over time. In 2000, the paid circulations of the U.K.’s national daily and national Sunday newspapers were equivalent to about 60 per cent of households; by 2013, the figures had fallen to about 30 per cent. (For comparison, in 1950, the average daily total paid circulation for British national daily newspapers was equivalent to almost 150 per cent of households; the total paid circulation for British Sunday newspapers was equivalent to more than 200 per cent of households.) The relationship between circulation and households also provides an interesting context for the ongoing debate in the United Kingdom about regulation of newspapers. Part of that debate deals with behavioural matters, but part deals with ownership. For example, it has been suggested that newspaper ownership thresholds might be set at 30 per cent or 20 per cent of national circulation. Without getting into a debate over media ownership rules, it is clear that some of the discussion in the U.K. is rooted in some perception of the “influence” that a media owner might have. But if that is the concern, a measurement based on a fixed percentage of circulation will represent a declining share of households reached, at a time when circulation is declining and the number of households is growing. In that context, then, we would note that 30 per cent of national daily or national Sunday newspaper circulation is equivalent, in 2013, to about nine per cent of households; a 20 per cent market share threshold is equivalent to about six per cent of households.
Text continues on page 12 …
8 Sources and methodology: Circulation data come from ABC and from published reports about ABC circulation data; household estimates for Great Britain are based on data from the U.K. Office for National Statistics.
10
UK, 2000-2013
10. Total national daily / national Sunday newspaper paid circulation, and total households, Great Britain, 2000‐2013
11. Total national daily / national Sunday newspaper paid circulation as % of households, Great Britain, 2000‐2013
Total national daily paid circulation Total regional daily paid circulation
National dailies
Regional dailies
12
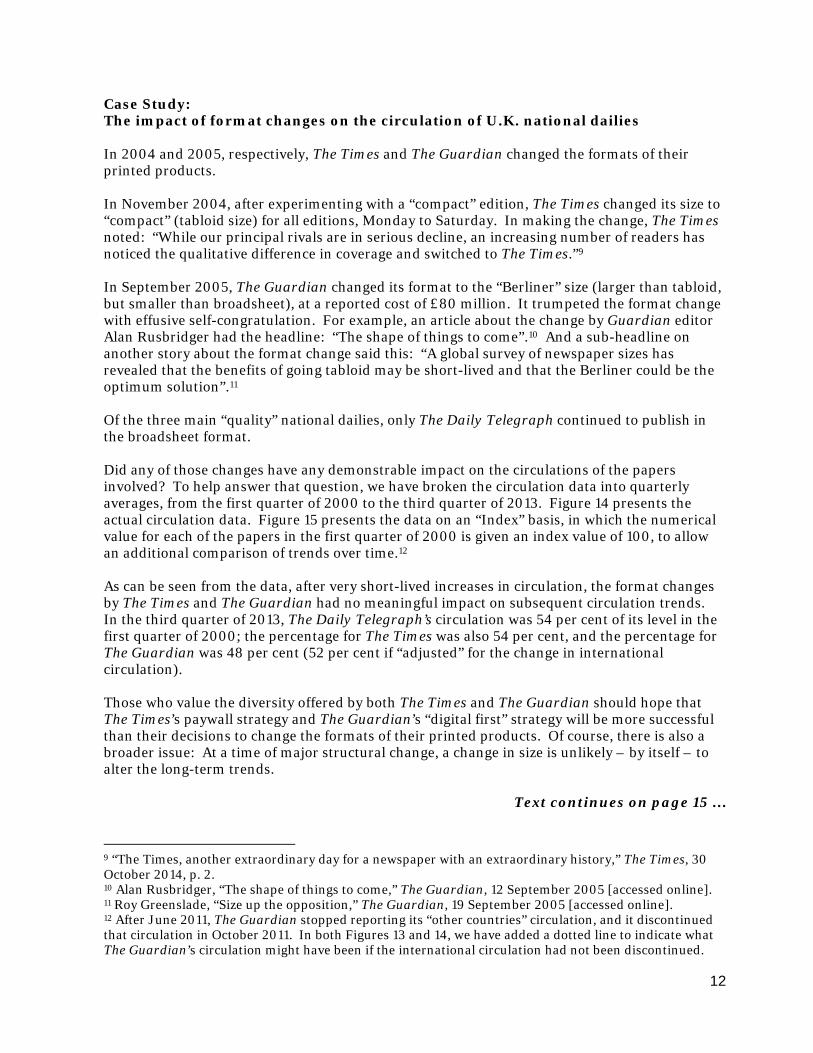
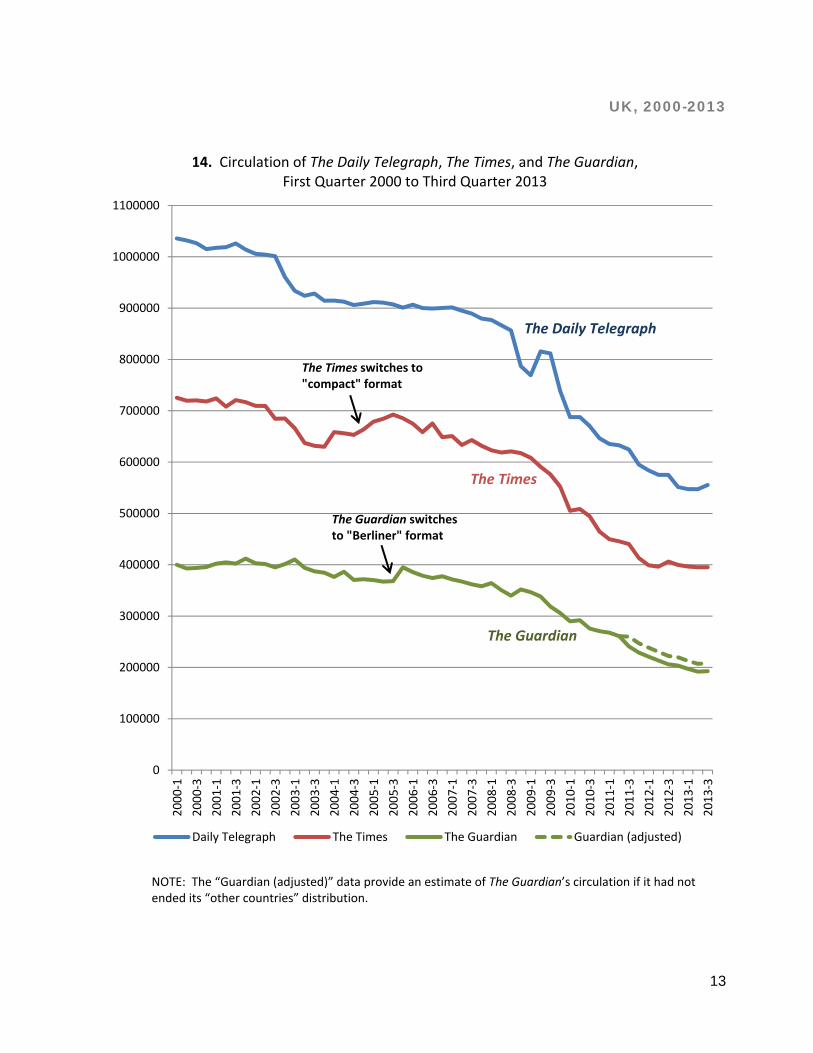
Case Study: The impact of format changes on the circulation of U.K. national dailies In 2004 and 2005, respectively, The Times and The Guardian changed the formats of their printed products. In November 2004, after experimenting with a “compact” edition, The Times changed its size to “compact” (tabloid size) for all editions, Monday to Saturday. In making the change, The Times noted: “While our principal rivals are in serious decline, an increasing number of readers has noticed the qualitative difference in coverage and switched to The Times.”9 In September 2005, The Guardian changed its format to the “Berliner” size (larger than tabloid, but smaller than broadsheet), at a reported cost of £80 million. It trumpeted the format change with effusive self-congratulation. For example, an article about the change by Guardian editor Alan Rusbridger had the headline: “The shape of things to come”.10 And a sub-headline on another story about the format change said this: “A global survey of newspaper sizes has revealed that the benefits of going tabloid may be short-lived and that the Berliner could be the optimum solution”.11 Of the three main “quality” national dailies, only The Daily Telegraph continued to publish in the broadsheet format. Did any of those changes have any demonstrable impact on the circulations of the papers involved? To help answer that question, we have broken the circulation data into quarterly averages, from the first quarter of 2000 to the third quarter of 2013. Figure 14 presents the actual circulation data. Figure 15 presents the data on an “Index” basis, in which the numerical value for each of the papers in the first quarter of 2000 is given an index value of 100, to allow an additional comparison of trends over time.12 As can be seen from the data, after very short-lived increases in circulation, the format changes by The Times and The Guardian had no meaningful impact on subsequent circulation trends. In the third quarter of 2013, The Daily Telegraph’s circulation was 54 per cent of its level in the first quarter of 2000; the percentage for The Times was also 54 per cent, and the percentage for The Guardian was 48 per cent (52 per cent if “adjusted” for the change in international circulation). Those who value the diversity offered by both The Times and The Guardian should hope that The Times’s paywall strategy and The Guardian’s “digital first” strategy will be more successful than their decisions to change the formats of their printed products. Of course, there is also a broader issue: At a time of major structural change, a change in size is unlikely – by itself – to alter the long-term trends.
Text continues on page 15 …
9 “The Times, another extraordinary day for a newspaper with an extraordinary history,” The Times, 30 October 2014, p. 2. 10 Alan Rusbridger, “The shape of things to come,” The Guardian, 12 September 2005 [accessed online]. 11 Roy Greenslade, “Size up the opposition,” The Guardian, 19 September 2005 [accessed online]. 12 After June 2011, The Guardian stopped reporting its “other countries” circulation, and it discontinued that circulation in October 2011. In both Figures 13 and 14, we have added a dotted line to indicate what The Guardian’s circulation might have been if the international circulation had not been discontinued.
13
UK, 2000-2013
14. Circulation of The Daily Telegraph, The Times, and The Guardian, First Quarter 2000 to Third Quarter 2013
NOTE: The “Guardian (adjusted)” data provide an estimate of The Guardian’s circulation if it had not ended its “other countries” distribution.
0
100000
200000
300000
400000
500000
600000
700000
800000
900000
1000000
1100000
2000‐1
2000‐3
2001‐1
2001‐3
2002‐1
2002‐3
2003‐1
2003‐3
2004‐1
2004‐3
2005‐1
2005‐3
2006‐1
2006‐3
2007‐1
2007‐3
2008‐1
2008‐3
2009‐1
2009‐3
2010‐1
2010‐3
2011‐1
2011‐3
2012‐1
2012‐3
2013‐1
2013‐3
Daily Telegraph The Times The Guardian Guardian (adjusted)
The Times switches to "compact" format
The Guardian switches to "Berliner" format
The Guardian
The Times
The Daily Telegraph
14
UK, 2000-2013
15. Circulation of The Daily Telegraph, The Times, and The Guardian, First Quarter 2000 to Third Quarter 2013, Index basis (First Quarter 2000=100)
NOTE: The “Guardian (adjusted)” data provide an estimate of The Guardian’s circulation if it had not ended its “other countries” distribution.
40
50
60
70
80
90
100
110
2000‐1
2000‐3
2001‐1
2001‐3
2002‐1
2002‐3
2003‐1
2003‐3
2004‐1
2004‐3
2005‐1
2005‐3
2006‐1
2006‐3
2007‐1
2007‐3
2008‐1
2008‐3
2009‐1
2009‐3
2010‐1
2010‐3
2011‐1
2011‐3
2012‐1
2012‐3
2013‐1
2013‐3
Daily Telegraph The Times The Guardian Guardian (adjusted)
The Times switches to "compact" format
The Guardian switches to "Berliner" format
15
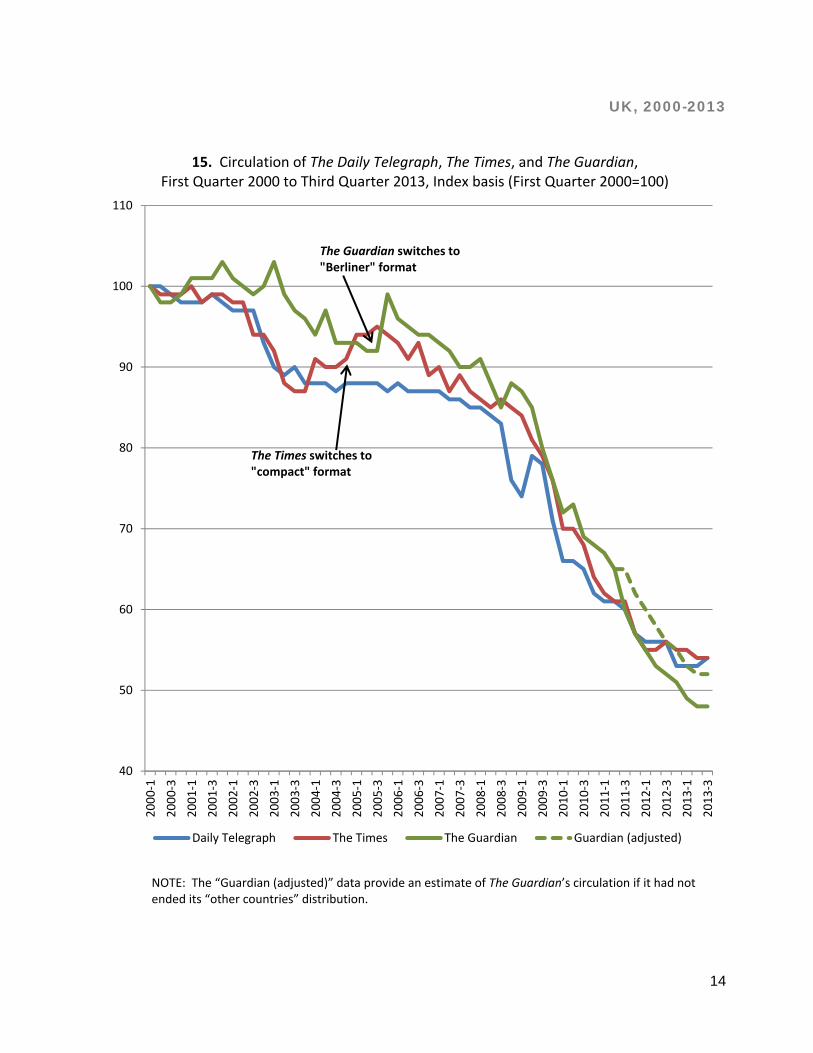
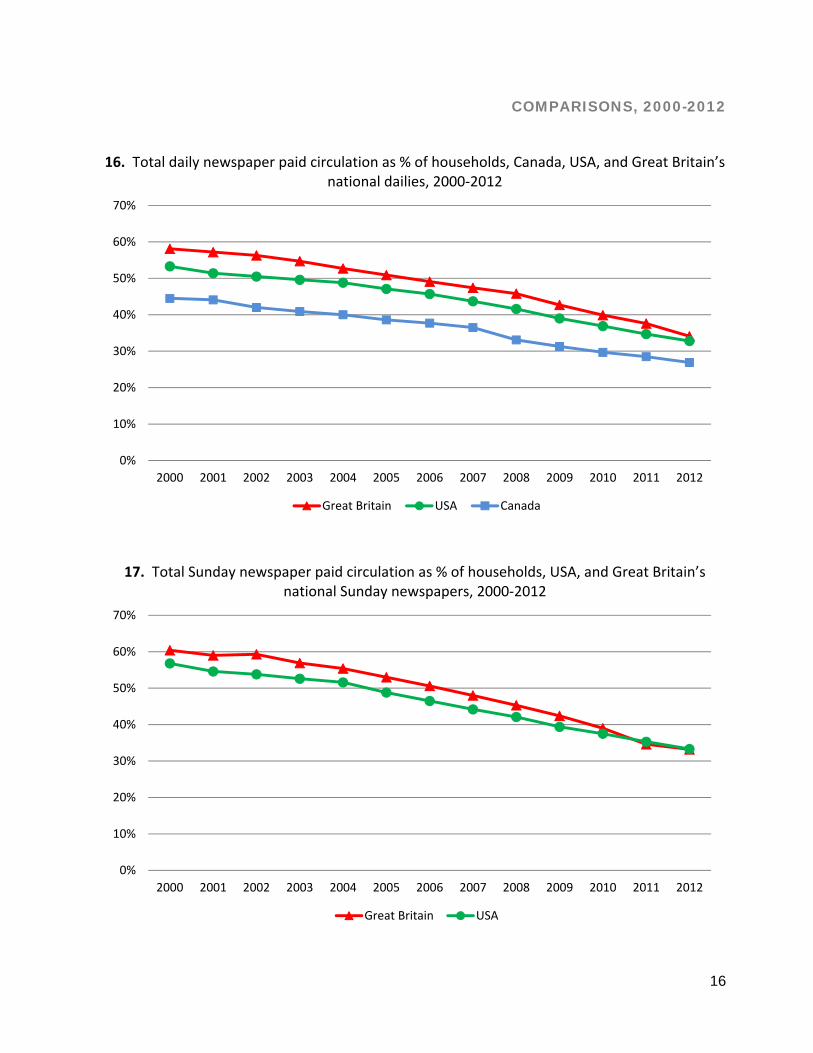
Assessing the trends In Figure 16, we have combined the data for Canada, the U.S. and Britain’s national daily newspaper circulation as a percentage of households, from 2000 to 2012. In Figure 17, we have combined the data for U.S. and Britain’s national Sunday newspapers, from 2000 to 2012. As can be seen clearly from Figures 16 and 17, long-term structural declines in circulations are continuing in all three countries, with paid circulations in 2012 equivalent to about one-third of households in the U.S.A. and Great Britain, and less than 30 per cent in Canada. Responding to change: The challenge of unbundling Most legacy newspaper publishers were slow to respond effectively to the changes described above. In recent years, however, many “solutions” have been advanced, including “paywalls” or “digital first” strategies, or attempts by some newspapers to become “world news brands” in the online environment. Some of these strategies may work for some newspaper companies some of the time. But these strategies do not deal in a broad way with the fundamental dilemma facing traditional newspapers in Canada, the U.S., or the U.K.:
Daily newspapers were once a bundled product with limited competition
Daily newspapers are becoming an unbundled product with unlimited competition
As we noted in our 2011 discussion paper, for most of the 20th Century, media’s role as an intermediary based on scarcity led to its development as a “bundled” or “packaged” product – a product that bundled news, opinion, entertainment, advice, guides, display advertising, and classified advertising – and a product that was able to use profitable parts of the bundle to subsidize unprofitable parts of the bundle. And we noted this comment from Marshall McLuhan, from 1964, in his book, Understanding Media: The Extensions of Man:
The classified ads (and stock-market quotations) are the bedrock of the press. Should an alternative source of easy access to such diverse daily information be found, the press will fold.13
Text continues on page 17 …
13 Marshall McLuhan, Understanding Media: The Extensions of Man, McGraw-Hill, 1965, p. 207 (originally published in 1964). (One is tempted to speculate on how much of McLuhan’s prediction was based on theory, and how much was based on the fact that he grew up in Winnipeg reading the Free Press, which dominated the classified advertising market in Winnipeg at that time.)
16
COMPARISONS, 2000-2012
16. Total daily newspaper paid circulation as % of households, Canada, USA, and Great Britain’s national dailies, 2000‐2012
17. Total Sunday newspaper paid circulation as % of households, USA, and Great Britain’s national Sunday newspapers, 2000‐2012
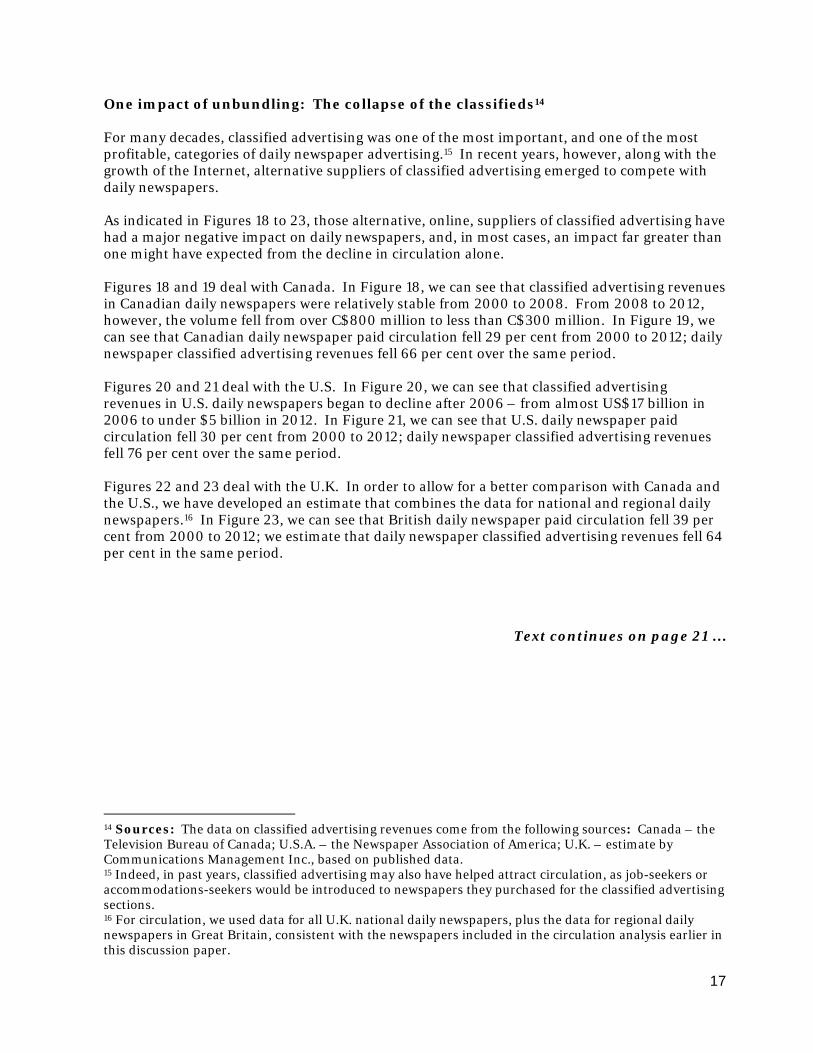
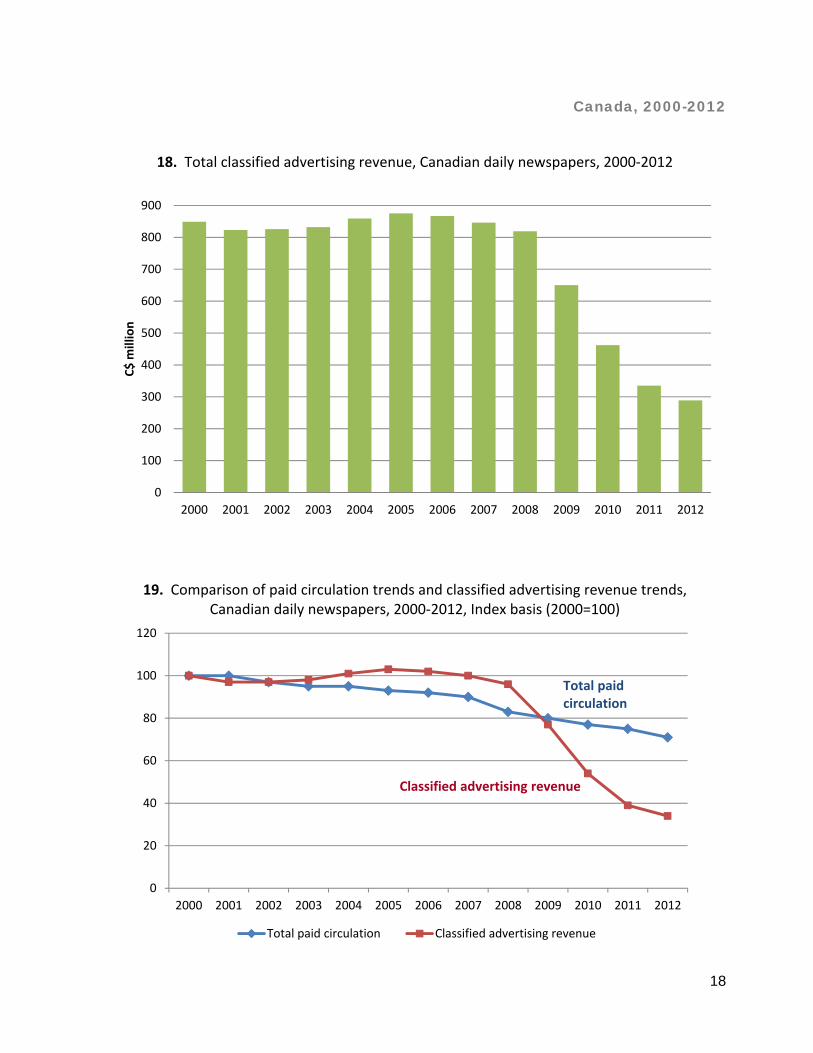
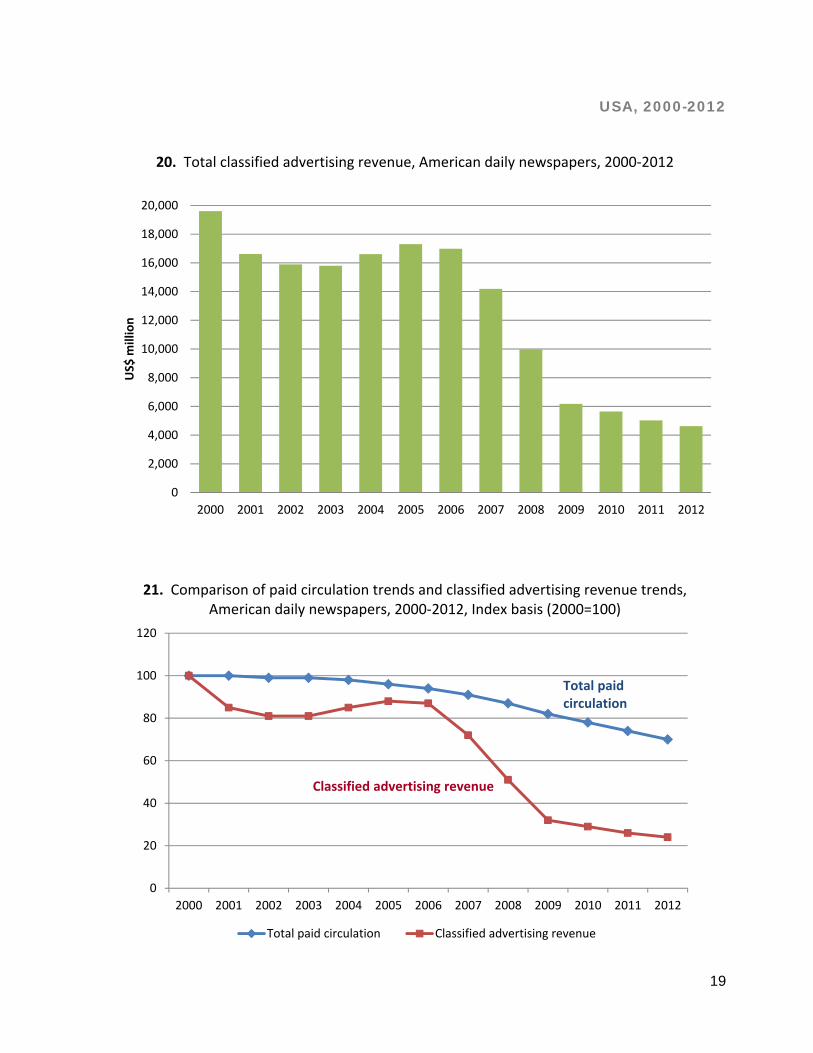
One impact of unbundling: The collapse of the classifieds14 For many decades, classified advertising was one of the most important, and one of the most profitable, categories of daily newspaper advertising.15 In recent years, however, along with the growth of the Internet, alternative suppliers of classified advertising emerged to compete with daily newspapers. As indicated in Figures 18 to 23, those alternative, online, suppliers of classified advertising have had a major negative impact on daily newspapers, and, in most cases, an impact far greater than one might have expected from the decline in circulation alone. Figures 18 and 19 deal with Canada. In Figure 18, we can see that classified advertising revenues in Canadian daily newspapers were relatively stable from 2000 to 2008. From 2008 to 2012, however, the volume fell from over C$800 million to less than C$300 million. In Figure 19, we can see that Canadian daily newspaper paid circulation fell 29 per cent from 2000 to 2012; daily newspaper classified advertising revenues fell 66 per cent over the same period. Figures 20 and 21 deal with the U.S. In Figure 20, we can see that classified advertising revenues in U.S. daily newspapers began to decline after 2006 – from almost US$17 billion in 2006 to under $5 billion in 2012. In Figure 21, we can see that U.S. daily newspaper paid circulation fell 30 per cent from 2000 to 2012; daily newspaper classified advertising revenues fell 76 per cent over the same period. Figures 22 and 23 deal with the U.K. In order to allow for a better comparison with Canada and the U.S., we have developed an estimate that combines the data for national and regional daily newspapers.16 In Figure 23, we can see that British daily newspaper paid circulation fell 39 per cent from 2000 to 2012; we estimate that daily newspaper classified advertising revenues fell 64 per cent in the same period.
Text continues on page 21 …
14 Sources: The data on classified advertising revenues come from the following sources: Canada – the Television Bureau of Canada; U.S.A. – the Newspaper Association of America; U.K. – estimate by Communications Management Inc., based on published data. 15 Indeed, in past years, classified advertising may also have helped attract circulation, as job-seekers or accommodations-seekers would be introduced to newspapers they purchased for the classified advertising sections. 16 For circulation, we used data for all U.K. national daily newspapers, plus the data for regional daily newspapers in Great Britain, consistent with the newspapers included in the circulation analysis earlier in this discussion paper.
18
Canada, 2000-2012
18. Total classified advertising revenue, Canadian daily newspapers, 2000‐2012
19. Comparison of paid circulation trends and classified advertising revenue trends, Canadian daily newspapers, 2000‐2012, Index basis (2000=100)
Total paid circulation Classified advertising revenue
Total paid circulation
Classified advertising revenue
20
UK, 2000-2012
22. Estimated total classified advertising revenue, British national and regional daily newspapers (combined), 2000‐2012
23. Comparison of paid circulation trends and classified advertising revenue trends, British national and regional daily newspapers (combined), 2000‐2012, Index basis (2000=100)
Total paid circulation Classified advertising revenue
Total paid circulation
Classified advertising revenue
21
Is there a new business model? In our 2011 discussion paper, we noted that we are coming to the end of a 100-year-old economic model for the media industry. In fact, what is happening now is nothing less than a fundamental restructuring of business models for the media. It is systemic. It is structural. And it is not likely to go back to the way it was before. We also noted that we now are in an era in which new and old media are competing for our attention, in which we have the luxury of both the “mainstream” and the “alternative”. But that may be transitory, and we have to consider what the “alternatives” might look like if, or when, the “mainstream” is gone or much diminished. And we reluctantly concluded that “… ultimately, someday, the print product will be gone. And its replacement will not necessarily be the same number of local newspapers simply re-purposed into electronic formats. Because of the unbundling effect, it is at least possible that only a few major national or international newspaper ‘brands’ will survive in electronic form, and that local news will come to be delivered by, and attached to, a variety of other online services.” To the extent that the continued presence of the print product may be an advantage to legacy publications during the transition, then the circulation and revenue data documented in this discussion paper indicate an urgency to confront the broad structural questions posed by unbundling and the elimination of competitive borders, in addition to the specific techniques currently being adopted.