A TRANSLATIONAL STUDY OF THE CORRELATION BETWEEN LOW BIRTH WEIGHT, HYPERTENSION, AND KIDNEY FUNCTON USING A RAT MODEL by Marcus Daniels A thesis submitted to the faculty of The University of Mississippi in partial fulfillment of the requirements of the Sally McDonnell Barksdale Honors College. Oxford May 2015
Transcript
A TRANSLATIONAL STUDY OF THE CORRELATION BETWEEN LOW BIRTH
WEIGHT, HYPERTENSION, AND KIDNEY FUNCTON USING A RAT MODEL
by
Marcus Daniels
A thesis submitted to the faculty of The University of Mississippi in partial fulfillment of
the requirements of the Sally McDonnell Barksdale Honors College.
Figure 1. Summary of maternal conditions that may influence fetal development and risk for developing pathophysiological conditions………………………..1
Figure 2. Correlation between LBW, Hypertension, and CKD in Southeastern USA……………………………………………………………………….3
Figure 3. The incidence of reported end-stage renal disease (ESRD) in the United States in 2001, by race and ethnicity adjusted for age and gender……….4
Figure 5. Diagram of the Renin-Angiotensin-Aldosterone System………………..7
Figure 6. Overview of Renal Disease Development in Low Birth Weight condition…………………………………………………………………8
Figure 7. Body mass of newborn rats from control and uterine blood flow-restricted mothers………………………………………………………………….14
Figure 8. Weekly body mass gained of control (NBW) and uterine restricted (LBW) rats either treated or not treated with anti-hypertensive medication…….15
Figure 9. Final body mass of control (NBW) and uterine-restricted (LBW) rats either treated or not treated with anti-hypertensive medication for six weeks…………………………………………………………………….16
Figure 10. Mean arterial pressure of control (NBW) and uterine-restricted (LBW) conscious rats treated for six weeks with anti-hypertensive medication………………...17
Figure 11. Kidney mass of control (NBW) and uterine-restricted (LBW) rats subjected to anti-hypertensive medication for six weeks and/or acute ischemia-reperfusion (IR)………………………………………………..18
Figure 12. Glomerular filtration rate of control (NBW) and uterine-restricted (LBW) rats subjected to anti-hypertensive medication for six weeks and/or acute ischemia-reperfusion (IR)………………………………………………..20
v
Introduction
Fetal programming can significantly influence the physiology of adults. Maternal
factors such as pre-eclampsia, malnutrition, smoking, alcohol consumption, certain drugs,
and disease can affect the offspring’s birth weight and health (1). These maternal factors
can affect the epigenetics (changes in gene transcription due to environment) of the
offspring, which can lead to medical problems over time. Low birth weight (LBW) is an
important epigenetic phenomenon that commonly results from a poor fetal environment
and has been linked with chronic detrimental effects in adults (Fig 1).
Figure 1. Summary of maternal conditions that may influence fetal
development and risk for developing pathophysiological conditions.
This is from N. Koleganova1, K. Benz, G. Piecha1, E. Ritz and K. Amann.
From Renal, cardiovascular and metabolic effects of fetal programming
Nephrol Dial Transplant (2012) 27: 3003–3007
For humans, LBW is defined as being born under 5 pounds, 8 ounces. About 1 in
every 12 births in the United States meets this criterion (2). Many LBW offspring
develop hypertension as adults which can lead to chronic kidney disease (CKD).
Hypertension is defined as having systolic pressure at or above 140 mmHg and diastolic
pressure at or above 90 mmHg (3). Chronic kidney disease is present when a patient’s
glomerular filtration rate (GFR) remains below 60 milliliters per minute for more than 3
months or when a patient’s urine albumin-to-creatinine ratio is over 30 milligrams of
albumin for each gram of creatinine (30 mg/g) (4). It is a condition that damages the
kidneys in a circular mechanism. Development of CKD can initiate a pathological
positive feedback loop that further contributes to hypertension which further promotes
CKD. End stage renal disease (ESRD) is total loss of kidney function. This disease
occurs as a result of CKD. Research shows that these phenomena are related.
Understanding the correlation between LBW, hypertension, and CKD is very
important for a number of reasons. Estimates show that one in nine Americans, around
20 million, suffer from CKD but are unaware of the condition (5). These individuals can
easily develop ESRD which costs $76,515 per patient per year. There is a strong
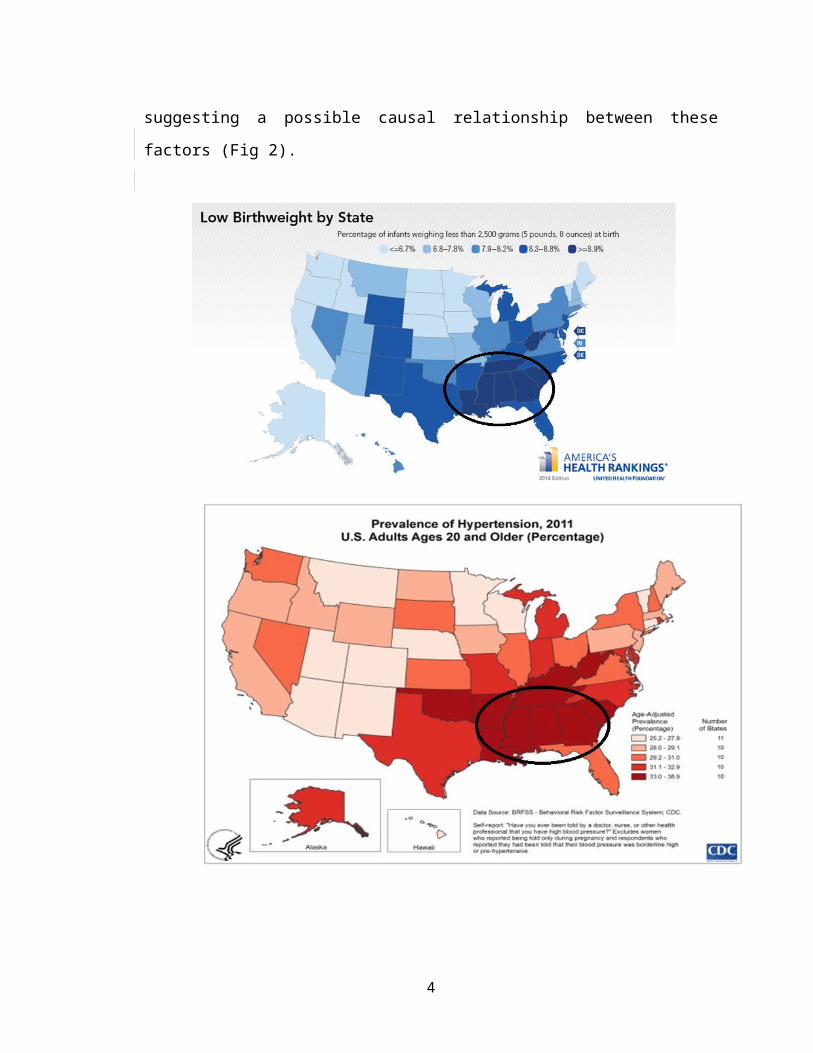
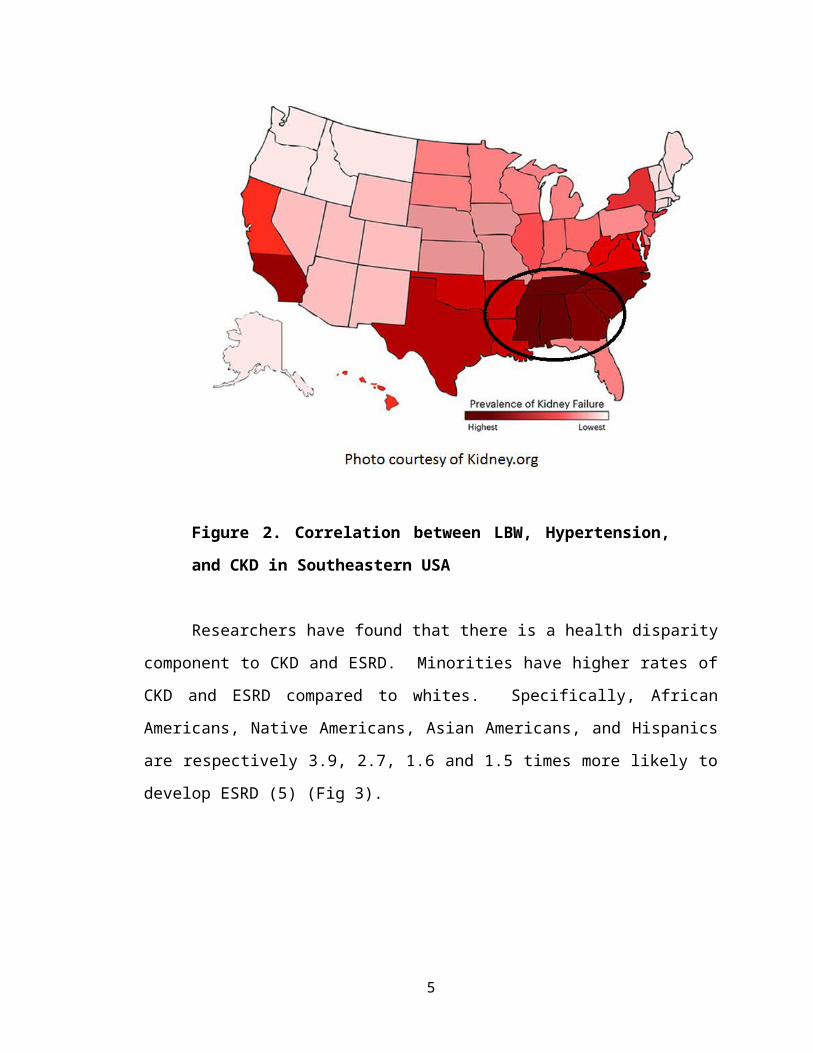
correlation between regional incidences of LBW, hypertension, and CKD, suggesting a
possible causal relationship between these factors (Fig 2).
Figure 2. Correlation between LBW, Hypertension, and CKD in
Southeastern USA
3
Researchers have found that there is a health disparity component to CKD and
ESRD. Minorities have higher rates of CKD and ESRD compared to whites.
Specifically, African Americans, Native Americans, Asian Americans, and Hispanics are
respectively 3.9, 2.7, 1.6 and 1.5 times more likely to develop ESRD (5) (Fig 3).
Figure 3. The incidence of reported end-stage renal disease (ESRD) in the United States in 2001, by race and ethnicity adjusted for age and gender 4. Data from the United States Renal Data System 2003.
African Americans in the Southeastern United States, and especially Mississippi,
are estimated to be five times more likely to develop ESRD associated with hypertension
as compared to whites (6).
In 2003, Dr. Alexander’s lab at UMMC developed a LBW rat model with
increased incidence of adult onset hypertension. For this model, silver clips are placed
around the abdominal aorta and uterine arteries in the last third of gestation (Fig. 4).
These clips lead to a 35%-45% reduction in uterine perfusion (7) and thus restricted
nutrient supply to the developing fetus. It is not known how exactly these LBW rats
become hypertensive, but many speculate that low nephron number and the ensuing
hyper-filtration of the remaining nephrons and/or altered renal renin-angiotensin-
4
aldosterone system (RAAS) are contributing factors in this induced uterine growth
restriction (IUGR) model (8).
Figure 4. Reduced Uterine Perfusion Pressure surgery. Silver clips are
placed on the abdominal aorta and uterine arteries approximately two
weeks after fertilization in order to restrict blood flow to the developing
fetus. The reduced nutrient availability results in slower fetal development
and low birth weight offspring.
Nephrons (functional unit of the kidney) start to form from day 30 of gestation in
humans and their development ends at week 36. In essence, humans are born with a full
complement of nephrons (9). In rats, the majority of nephrons are established prior to
birth, which makes these animals a reasonably good model to study the maternal
environment-renal function-hypertension relationship. Prior to placing the clips at the 3 rd
trimester, approximately 40% of the full nephron complement has been established (10).
Restricted nutrient availability and other factors that contribute to low birth weight result
5
in kidneys that are not completely developed approximately 25-40% fewer number of
nephrons (11-13) than normal weight newborns. The deficit in nephron number may lead
to glomerular hyperfiltration within the existing nephrons to compensate (14-15). Single
nephron hyperfiltration may cause the proximal and/or distal tubule hypertrophy leading
to a greater proportion of Na+ reabsorption, which will increase osmotically driven H2O
reabsorption. The excess H2O reabsorption can ultimately contribute to increased blood
volume and thus cause hypertension to develop. This process is known as the
hyperfiltration theory, and many think this leads to a reduction in arteriolar resistance and
increased glomerular blood flow.
The RAAS plays a pivotal role in arteriole resistance and the composition, and
volume, of the extracellular fluid and is thus one of the candidate mechanisms which
might be dysregulated in LBW animals (16). Extracellular fluid sodium concentration is
regulated by the RAAS. The process begins by release of renin by the granular cells in
the juxtaglomerular apparatus in nephrons of the kidney. Renin is a proteolytic enzyme
that cleaves angiotensinogen into angiotensin I. Angiotensinogen is the inactive form of
angiotensin I. Angiotensinogen is always present in the plasma of the blood in high
concentrations. Angiotensin I passes through the lungs and is converted into angiotensin
II by angiotensin-converting enzyme (ACE). ACE is present in the pulmonary
capillaries. Angiotensin II is the primary stimulus for secretion of aldosterone from the
adrenal cortex. Aldosterone increases sodium reabsorption in the distal and collecting
tubules of the nephron (17). Angiotensin II also constricts systemic arterioles which
directly increases blood pressure by increasing total peripheral resistance (TPR). The
RAAS activity increases salt and water retention and a rise in arterial blood pressure
occur (Fig. 5). Despite RAAS being implicated in hypertension of LBW animals and
humans, there are conflicting reports indicating it is either up-regulated or down-
regulated (8).
6
Figure 5. Diagram of the Renin-Angiotensin-Aldosterone System
Once hypertension develops in the IUGR model, they begin to develop CKD.
The reduced nephron endowment leads to hyperfiltration in the remaining glomeruli as a
compensatory response. Hyperfiltration ultimately leads to fibrosis of the kidneys.
Fibrosis of the kidney further damages the kidney and leads to renal disease, further
fibrosis, and un-regulation of blood pressure (Fig. 6).
7
Figure 6. Overview of Renal Disease Development in Low Birth
Weight condition. IUGR results in reduced nephron endowment. Having
a lower nephron count increases your propensity to hyperfiltrate and
develop hypertension. Hypertension contributes to renal disease and renal
disease contributes to increased hypertension leading to a positive
feedback loop.
My research was focused on determining if anti-hypertensive medication prevents
the characteristic decline in renal function that precedes end stage renal disease common
to low birth weight animals. Renal function assessed by glomerular filtration rate was
evaluated under both basal and acutely stressed conditions. The stressor consisted of
transient renal ischemia, a condition from which healthy kidneys can typically recover.
We hypothesized that the anti-hypertensive drugs Reserpine and Hydralazine would
prevent hypertension and improve renal function in low birth weight rats.
8
9
Methods
All experimental procedures proposed in this study were performed in accordance with
National Institutes of Health guidelines for use and care of animals with approval of all
protocols by the Animal Care and Use Committee at the University of Mississippi
Medical Center, as described previously [1]. Briefly, rats were housed in a temperature-
controlled room (23°C) with a 12:12-hour light/dark cycle with food and water available
ad libitum. Timed pregnant Sprague Dawley rats were purchased from Harlan Inc
(Indianapolis, IN). At day 14 of gestation, rats destined for reduced uterine perfusion
were clipped as described below and also in Figure 4. All dams were allowed to deliver
at term (21-23 days of gestation) with offspring’s birth weight recorded within 12 hours
of delivery. In total, there were 32 control offspring and 32 LBW offspring; however,
only males are reported so n=16 for control offspring and n=16 for LBW offspring. At
this time, the number of pups in the control and reduced uterine perfusion litter were
culled to 8 pups per dam to ensure equal nutrient access for all offspring. Animals were
weighed weekly until the end of experiments at 12 weeks of age. Pups were weaned at 3
weeks of age. Adult male rats from 8 control pregnant dams and 8 reduced uterine
perfusion pregnant dams were randomly assigned into eight groups with n= 4 for each
group. Male Control Untreated-Sham (MCUTS); Male Control Treated-Sham (MCTS);
Male Control Untreated-Ischemia Reperfusion (MCUTIR); and Male Control Treated-
Ischemia Reperfusion (MCTIR) from control dams, and Male Restricted Untreated-Sham
(MRUTS); Male Restricted Treated-Sham (MRTS); Male Restricted Untreated-Ischemia
Reperfusion (MRUTIR); and Male Restricted Treated-Ischemia Reperfusion (MCRTIR)
from dams exposed to reduced uterine perfusion.
Reduced uterine perfusion in the pregnant rat. Using the method previously
described, reduced placental perfusion was used to induce low birth weight offspring [1].
Briefly, all
11
rats undergoing surgical procedures were anesthetized with 2% isoflurane (W.A. Butler
Co., Memphis, TN) delivered by an anesthesia apparatus. At day 14 of gestation, a silver
clip (0.203-mm ID) was placed around the abdominal aorta above the iliac bifurcation.
To avoid compensation of blood flow from the ovarian arteries, silver clips (0.100mm
ID) were placed on both branches of the ovarian arteries. Pregnant rats not exposed to
surgical procedure were used as the control pregnant counterpart group and designated as
the sham operated group.
Drug administration: Two drugs with effects on cardiovascular function were used to
lower blood pressure. Hydralazine: was administered via drinking water at a dose of
80mg/L initiated at 6 weeks of age until the end experiment at 12 weeks of age.
Reserpine: was administered via drinking water at a dose of 5mg/L initiated at 6 weeks of
age until the end of experiments at 12 weeks of age. Administration of this medication
constituted the “treated” rats.
Ischemia/Reperfusion (I/R) renal Injury. Adult male rats at age of 12 weeks were
exposed to bilateral mild I/R as previously described [1]. Briefly, with animals under
isoflurane anesthesia, bilateral mild I/R were induced by occluding both renal pedicles
with micro vascular clamps for 15 minutes (mild ischemia). Completeness of ischemia
was verified by blanching of the kidneys, which is an indication of the stoppage of blood
flow. The blood flow to the kidneys was reestablished by removal of both clamps
(reperfusion) with visual verification of blood return by changing in the kidney’s color to
a homogeneous dark pink. The sham animals were subjected to the same procedure
except the renal pedicles were not clamped. After the I/R procedure, animals were
instrumented for renal hemodynamic measurements as described below. The abdominal
cavity was closed in two layers (muscles and skin) and the animals were placed in
separate cages for recovery. The body temperature of the animals was monitored and
maintained stable during the whole procedure using a rectal thermometer in sync with a
heating pad.
Measurement of systemic and renal hemodynamics. As previously described [1], rats
under isoflurane anesthesia were surgically instrumented with flexible catheters (PE 50
tubing) in the right jugular vein for infusion and in the right carotid artery for
measurement of arterial pressure and collection of blood. All catheters were tunneled to
the nape of the neck and exteriorized. Renal function and arterial pressure measurements
were performed in the conscious state after a 2hs recovery phase from the ischemic event.
Mean arterial pressure (MAP) was monitored in conscious, chronically instrumented rats
via connection of the arterial catheter to a pressure transducer and a data set (PowerLab
16/30) using the software Lab Chart Pro V7 both from ADInstruments, Pty. Ltd. The data
acquisition set was connected to a PC for continuous recording.
Glomerular filtration rate (GFR) was calculated from serial measurement of the
concentration of fluorescein isothiocyanate (FITC)-inulin (from Sigma Aldrich, San
Louis MO Cat# F3272) in plasma, collected every 15 minutes at 4 time points following
60 minutes of continuous infusion to allow FITC-inulin to reach a steady state plasma
concentration. Plasma (FITC) -inulin was measured using a mini-plate fluorescence
spectrophotometer reader (Fluorospectrometer Thermo Fisher). Since FITC-inulin is
freely filtered at the glomerular capillaries but is not reabsorbed by the nephron tubules,
the rate of FITC-inulin filtration is equal to its rate of excretion in the urine, which is the
product of urine formation rate (UFR) and the urine concentration of FITC-inulin
(Equation 1).
GFR x [FITC-inulin]plasma = UFR x [FITC-inulin]urine, (1)
Under conditions where the plasma concentration of FITC-inulin has reached a steady-
state during constant infusion of a stock solution into the circulation (CIR), then the rate
of infusion is equal to the rate of excretion (Equation 2).
UFR x [FITC-inulin]urine = CIR x [FITC-inulin]stock (2)
13
FITC-inulin was prepared as a stock solution at a concentration of 6 mg/mL and was
infused into the circulation at 0.05 mL/min. Hence, GFR was calculated from Equation 3.
GFR= 0.3 mg /min[FITC−inulin ]plasma
(3)
The value of GFR obtained with this calculation was adjusted by total kidney weight for
each animal.
Statistics. Microsoft Excel was used for all statistical analysis. A value of P<0.05 was
considered statistically significant.
14
Results
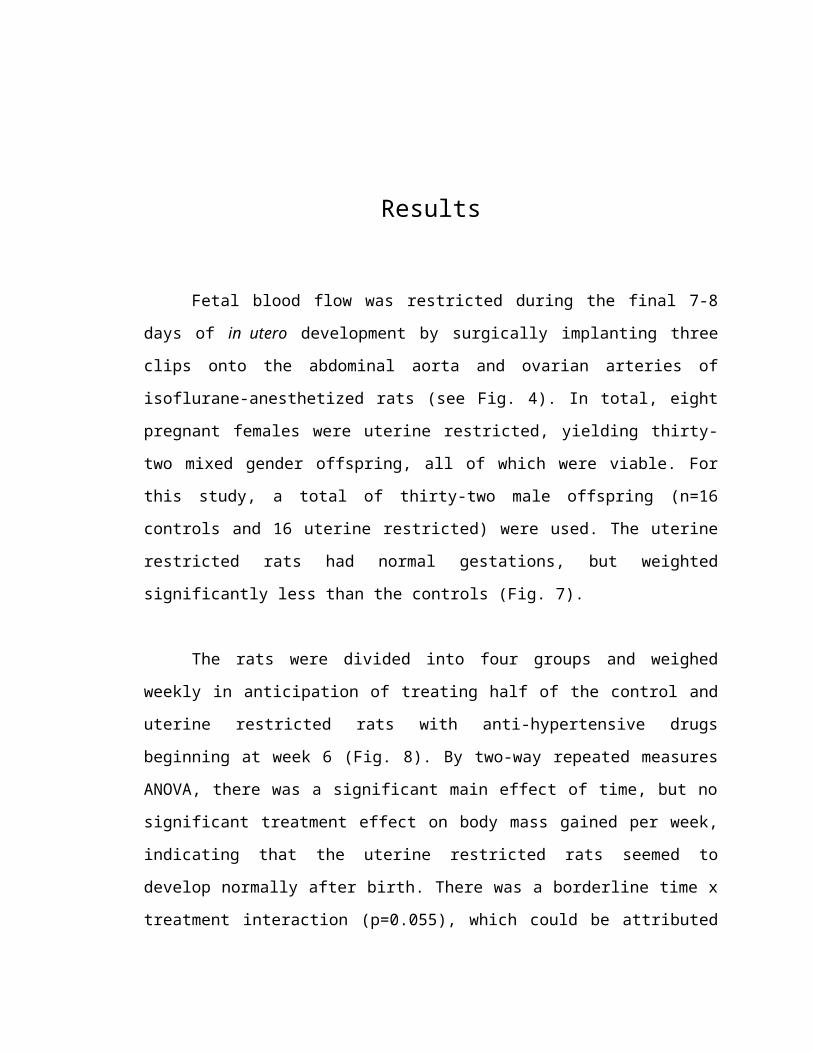
Fetal blood flow was restricted during the final 7-8 days of in utero development
by surgically implanting three clips onto the abdominal aorta and ovarian arteries of
isoflurane-anesthetized rats (see Fig. 4). In total, eight pregnant females were uterine
restricted, yielding thirty-two mixed gender offspring, all of which were viable. For this
study, a total of thirty-two male offspring (n=16 controls and 16 uterine restricted) were
used. The uterine restricted rats had normal gestations, but weighted significantly less
than the controls (Fig. 7).
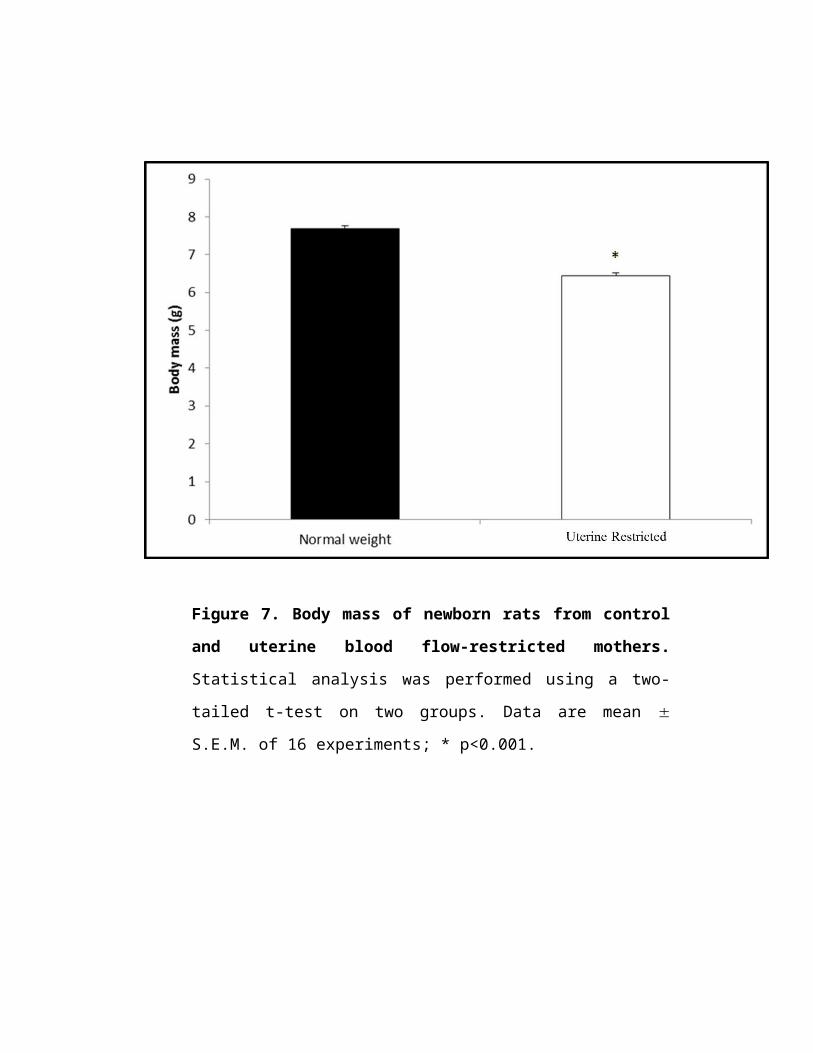
The rats were divided into four groups and weighed weekly in anticipation of
treating half of the control and uterine restricted rats with anti-hypertensive drugs
beginning at week 6 (Fig. 8). By two-way repeated measures ANOVA, there was a
significant main effect of time, but no significant treatment effect on body mass gained
per week, indicating that the uterine restricted rats seemed to develop normally after
birth. There was a borderline time x treatment interaction (p=0.055), which could be
attributed to small differences between the groups in body mass gained before vs. during
administration of the anti-hypertensive drugs. Most notably, from weeks 1-4 before
administration of the drugs, both groups of uterine restricted rats gained mass at nearly
the same rate as the controls, but from weeks 9-12 the uterine-restricted rats given anti-
hypertensive medication gained slightly more weight (about 0.2 g/week) than the treated
controls while the uterine-restricted rats not given the medication gained slightly less
weight (about 2 g/week) than the corresponding untreated controls. Thus, the anti-
hypertensive medication Reserpine and Hydralazine appeared to have a small positive
effect on weekly weight gain in the uterine restricted animals.
Figure 7. Body mass of newborn rats from control and uterine blood
flow-restricted mothers. Statistical analysis was performed using a two-
tailed t-test on two groups. Data are mean S.E.M. of 16 experiments; *
p<0.001.
Figure 8. : Weekly body mass gained of control (NBW) and uterine
restricted (LBW) rats either treated or not treated with anti-
hypertensive medication. The rats were weighed weekly to assess post-
natal development. The anti-hypertensive drugs Reserpine and
Hydralazine were added to the drinking water (5 mg/L and 80 mg/L,
respectively) of the treated animals beginning at week 6. Analysis was
performed using a two way repeated measures ANOVA (time and
treatment as the factors); n=8 per group. There was a significant main
effect of time (p<0.001) but not treatment (p=0.248), but there was a
borderline significant time x treatment interaction (p=0.055).
17
Figure 9. Final body mass of control (NBW) and uterine-restricted
(LBW) rats either treated or not treated with anti-hypertensive
medication for six weeks. The data were analyzed by 1 way ANOVA.
There were no significant differences between the groups. Data are mean
S.E.M. of eight experiments.
Final week 12 body masses were analyzed by two way ANOVA, with uterine clip
(birth weight) and anti-hypertensive medication as the main factors (Fig. 9). There was
no significant main effect of birth weight on body mass (p=0.352). There was also no
significant effect of the medication on body mass (p=0.140). There was also no birth
weight x drug interaction (p=0.291), so the effect of the medication did not depend on
whether the animals had been uterine-restricted. One-way ANOVA confirmed that the
final body masses did not differ significantly between the groups (p=0.248)
After the final body masses were taken, the animals were surgically implanted
with a catheter into the right carotid artery for measurement of mean arterial pressure
following 2h recovery from the anesthesia (Fig. 10). From two-way ANOVA, there were
18
highly significant main effects of uterine restriction (p<0.001) and anti-hypertensive
medication (p<0.001), as well as a highly significant (p<0.001) uterine clip x medication
interaction.
Figure 10. Mean arterial pressure of control (NBW) and uterine-
restricted (LBW) conscious rats treated for six weeks with anti-
hypertensive medication. The data were analyzed by two-way ANOVA,
followed by one-way ANOVA and Tukey’s post-hoc test. Means sharing
a common symbol did not significantly differ. Data are mean S.E.M of
eight experiments.
To determine which groups differed, a one way ANOVA was performed using the
4 groups (n=8 per group). This also yielded a highly significant p value (p<0.001), and
Tukey’s post-hoc test indicated that the uterine restricted rats not treated with
hypertensive medication had significantly higher MAP than the other groups, confirming
that low birth weight animals develop hypertension as adults.
19
Next, the animals were divided into two additional groups to assess kidney
function under both unstressed and stressed conditions. The rationale for this was that
twelve week old uterine restricted rats may have subtly altered or weakened kidney
function that may be difficult to detect under normal conditions, as they are still relatively
young. However, subtle defects might be amplified, and thus more likely to identify, after
a physiological stressor. For this study, the kidneys were subjected to a 15 min transient
ischemia followed by 2 h recovery. Glomerular filtration rate (Fig. 12) and combined
kidney mass (Fig. 11) were then measured.
Figure 11. Kidney mass of control (NBW) and uterine-restricted
(LBW) rats subjected to anti-hypertensive medication for six weeks
and/or acute ischemia-reperfusion (IR). The data were analyzed by
two-way ANOVA, followed by one-way ANOVA and Tukey’s post-hoc
test. There was a significant effect of the treatments (p=0.001). Means
sharing common symbols do not significantly differ. Data are mean
S.E.M. of 4 experiments.
20
A two way ANOVA (n=8 per group) was performed using uterine restriction and
acute stressor (IR) as the two factors. There was a significant main effect of IR
(p=0.004), with this stressor increasing kidney mass. There was a nearly significant main
effect of birth weight (p=0.061), where low birth weight animals tended to have lower
kidney mass. There was no significant IR x birth weight interaction (p=0.090), but this
was close, as the effect of ischemia reperfusion on kidney mass tended to be greater in
the NBW rats than in the LBW rats. When analyzed in this way, the mean kidney masses
were: NBW sham 2.620.09 g; NBW IR 3.180.13 g; LBW sham 2.590.12 g; and
LBW IR 2.750.12 g.
When the 2 way ANOVA was run using uterine restriction and anti-hypertensive
medication as main effects: there were significant effects of both the drugs (p=0.002) and
uterine restriction (p=0.010), but no significant drug x birth weight interaction (p=0.414).
From this analysis, the mean kidney masses were: NBW no drug: 3.080.16 g; NBW
plus drugs: 2.720.11; LBW no drug: 2.840.12 g; LBW plus drugs: 2.510.09 g. So
BP drug treatment significantly lowered kidney mass, and this effect did not depend on
birth weight.
A one-way ANOVA was used to determine which means differed significantly
(Fig. 11). None of the unstressed groups exhibited differences in kidney mass. It was
somewhat surprising that the uterine-restricted, sham operated rats did not have
significantly lower kidney mass, as these animals have been shown to have a reduced
number of nephrons (insert reference). There was a tendency for the unstressed animals
treated with anti-hypertensive medication to have lower kidney mass, but with only four
animals per group, the differences were not sufficiently robust to be significant.
Subjecting the kidneys to acute IR significantly increased kidney mass in both
groups not treated with Reserpine and Hydralazine. Control untreated rats showed the
greatest response, while the uterine restricted untreated rats showed a somewhat
attenuated response that did not significantly differ from the stressed controls. Chronic
21
treatment with the anti-hypertensive medications attenuated the increased mass for both
control and uterine-restricted groups but neither effect was significantly different from
the corresponding untreated groups. An analysis using kidney mass normalized to body
mass was also performed, and this yielded the same results, so the outcome did not matter
if the absolute kidney mass or kidney mass normalized to body mass was used.
Glomerular filtration rate is an important measure of kidney function, as it reflects
the rate at which waste products are excreted from the body via the urine. This rate
depends on a few key variables, including mean arterial pressure, plasma colloid osmotic
pressure, glomerular capillary integrity, and the total number of functional nephrons.
Since low birth weight animals have been shown to have 25-40% fewer nephrons, total
GFR was predicted to be lower in uterine restricted, low birth weight rats, but this was
not the case (2.570.18 mL/min vs. 2.540.28 mL/min for control vs. uterine-restricted
untreated, unstressed rats; n=4). The higher MAP, which tends to increase GFR, in the
uterine-restricted rats may partly explain the lack of difference. Mass-normalized GFR
can provide additional insight into nephron function under conditions where differences
in nephron number might occur. For this reason, GFR per mass kidney was analyzed
(Fig. 12).
22
Figure 12. Glomerular filtration rate of control (NBW) and uterine-
restricted (LBW) rats subjected to anti-hypertensive medication for
six weeks and/or acute ischemia-reperfusion (IR). The data were
analyzed by two-way ANOVA, followed by one-way ANOVA and
Tukey’s post-hoc test. Means sharing common symbols do not
significantly differ. Data are mean S.E.M. of 4 experiments.
A 2-way ANOVA using uterine restriction and IR as main factors yielded a
significant main effect of IR (p<0.001) and of uterine restriction (p<0.001). There was
also a significant interaction (p<0.001), so the effect of ischemia-reperfusion depended
on whether the animals were low or normal birth weight. This is readily apparent, as
GFR/g was substantially impaired in the uterine restricted animals but not the controls:
If the two factors used are uterine restriction and anti-hypertensive drugs, then
there was a significant main effect of drugs (p=0.002) and of uterine restriction
(p<0.001), and a significant drug x uterine restriction interaction (p=0.013), so the effect
of the BP drugs on GFR/g kidney depended on whether the animals were low or normal
birth weight. Reserpine and Hydralazine had more pronounced effects on enhancing
GFR/g in the uterine-restricted than control animals: NBW no BP drugs: 0.9140.040
mL/min/g kidney (n=8), NBW plus BP drugs: 0.9860.024 mL/min/g kidney (n=8),
LBW no BP drugs: 0.6750.111 mL/min/g kidney (n=8), LBW plus BP drugs:
0.8530.052 mL/min/g kidney (n=8). It is apparent that addition of the BP drugs
increased GFR/g kidney more in the LBW rats than in the NBW rats, and thus the
significant interaction.
23
To determine which groups significantly differed, a one-way ANOVA with
Tukey’s post hoc test was performed. Surprisingly, GFR/g in the uterine-restricted,
unstressed, untreated animals was not significantly higher, as predicted from both the
higher MAP and presumably lower nephron number in these rats. Thus, there was no
evidence of significant hyperfiltration occurring, and so this seemingly cannot explain the
hypertension which developed. It was also surprising that Reserpine and Hydralazine
significantly lowered MAP in the uterine restricted rats without affecting GFR/g, given
that MAP is a primary driver of GFR. Stressing the kidneys with transient ischemia,
however, did result in evidence for subtle changes in kidney physiology, as IR resulted in
a significant fall in GFR/g in the uterine restricted but not the control animals. Prior
treatment of the animals for six weeks with anti-hypertensive medication significantly
attenuated the stress-induced decline in GFR, much more so in the uterine-restricted
animals than the controls. Thus, uterine-restriction and the resulting low birth weight had
long-term adverse effects on kidney function that seemed to be further exacerbated by the
developing hypertension. The kidney dysfunction could not readily be detected under
unstressed conditions by measurement of GFR, but was readily apparent after transient
IR. This adverse effect may contribute to the hypertension and ensuing pathologies that
develop in these animals.
24
Discussion
Rats born in the IUGR model had a statistically significant lower birth weight
compared to rats born in the normal environment (Fig. 7). The low birth weight rats
gained weight normally and so weighed the same as control rats at twelve weeks of age
(Fig 8 and 9). This observation is seen in humans as well. Although not measured, the
nephron number in the LBW rats should be lower compared to the NBW rats.
The weight gained in any given week may significantly depend on how the
animals were treated. So, despite the fact that there was no significant effect of the
treatments on weight gain (which does not take into account weekly differences), there
might be differences between the groups for some weeks but not others. This became
apparent when comparing low birth weight to normal birth weight untreated rats- the
difference in weekly weight gain increased as the animals get older. For the LBW rats,
for weeks 1-4 their average weekly weight gain was about 0.8-0.9 grams less than the
NBW rats, but for weeks 9-12 the average weekly weight gain for LBW rats was a bit
more- about 1.5 to 2.2 grams less than the NBW rats. Contrast this to the NBW and LBW
drug treated rats- here during weeks 1-4 the LBW rats gained virtually identical weight to
the NBW rats, but for weeks 9-12, the drug treated LBW rats gained slightly more weight
(just about 0.2 g per week) than the treated NBW rats. So, the anti-hypertensive
medication appeared to positively influence weight gain in the LBW rats once the rats got
older (without the drug treatment weeks 9-12 weight gain was 1.5-2.2 g less than NBW
but with drug weight gain was 0.2 g per week more than drug treated NBW). This makes
sense given how the experiment was run: the animals were not given the BP drugs until
week 6, so if there was to be any effect of the drug, it would not be until after week 6, and
that’s what the nearly significant interaction is indicating. The effect of the anti-
hypertensive medication was too small to yield any significant main effect between the
treatment groups (not considering the
26
differences each week), and this can also be partly explained by the fact that the animals
were not treated with the drugs through weeks 1-5. Overall, Reserpine and Hydralazine
treatment for 6 weeks appeared to have a small, although not significant, positive effect
on increasing weight gain in low birth weight rats.
Mean Arterial Pressure (MAP) is an important regulated physiological variable
that partly determines the rate of blood flow into each systemic tissue. It is the average
pressure driving blood forward into the tissues throughout the cardiac cycle and is
defined as the addition of two thirds of diastolic pressure and one third of systolic
pressure. Diastolic pressure is the pressure at the end of ventricular diastole and systolic
pressure is the peak pressure that occurs during ventricular systole. Short term changes
in MAP are typically due to changes in sympathetic tone to the arterioles and/or heart, or
to changes in the availability of metabolically-produced paracrine factors that influence
the arterioles. Long term regulation of MAP depends primarily on hormonal control of
Na+ reabsorption and distal tubule water permeability within the nephrons of the kidneys.
Variable Na+ and water reabsorption in the kidneys is an importantly affects total blood
volume, which is one determinant of MAP.
The juxtaglomerular apparatus in nephrons of the kidneys allows for regulation of
long term MAP. The juxtaglomerular apparatus is a specialized combination of thick
ascending tubular cells (the macula densa cells) and vascular cells (the granular cells) that
connects the afferent arterioles, efferent arterioles, glomerulus, and ascending limb of the
Loop of Henle. The afferent arteriole granular cells of the juxtaglomerular apparatus
secrete renin into the blood in response to a decrease in the filtrate concentration of NaCl,
the extra-cellular fluid volume, or arterial blood pressure. When renin is secreted into the
blood stream it catalyzes proteolysis of the peptide prohormone angiotensinogen into
angiotensin 1, which is then further digested by the lung-localized angiotensin converting
enzyme into angiotensin II (AII) (Fig. 5). Angiotensin II induces aldosterone synthesis
and secretion by the adrenal cortex endocrine cells, which promotes Na+ reabsorption in
the distal tubule of the nephron. Increased Na+ reabsorption enhances the osmotic
gradient across the distal tubule, thereby stimulating greater water reabsorption.
Mika Jekabsons, 04/15/15,
I deleted this paragraph because it is not directly relevant to your study (and some of the physiology is not quite right). This would only serve to confuse the reader as they would think “how is this information relevant to the experimental objectives and the data?”
In low birth weight animals, there has been speculation that the juxtaglomerular
apparatus develops abnormally, resulting in dysfunctional regulation of renin release
from the granular cells. Macula densa cells of the ascending Loop of Henle stimulate
renin exocytosis in the afferent arteriole by releasing at least two important paracrine
factors: prostaglandin E2 (PGE2) and nitric oxide (NO). Both factors increase granular
cell cAMP levels (through activation of prostaglandin E4 receptors and guanylyl cyclase,
respectively), which induce exocytosis of renin through activation of protein kinase A.
Increased release of these paracrine factors occurs when the tubular filtrate concentration
of NaCl (Cl- is thought to be more important) to which the macula densa cells are
exposed is abnormally low. Conversely, the cells release adenosine when the filtrate
concentration of NaCl is abnormally high, and this appears to inhibit renin release
through A1 adenosine receptors (18, 19). The macula densa cells in low birth weight rats
have been suggested to have altered responses to tubular NaCl, causing them to release
abnormally high amounts of renin under normal concentrations of NaCl. However, the
results from multiple studies have shown conflicting results on whether the renin-
angiotensin system is overly active in low birth weight animals (8).
We cannot fully make the claim that LBW rats have lower kidney mass than
NBW rats from the data presented in figure 11. Low birth weight animals tended to have
lower kidney mass; however, the results were not significant. Kidney mass may directly
correlate with the number of nephrons, so the uterine-restricted rats in this study may not
have a significantly lower nephron number compared to the normal birth weight rats. The
GFR measurements tended to agree with this, as total GFR in LBW rats was not
significantly different from the control rats, as might be expected with a lower number of
nephrons. However, the increase in MAP observed in the LBW rats promotes increased
GFR since glomerular pressure is a major driving force for glomerular capillary filtration,
so a possible loss in nephron number could be offset by hyperfiltration at the remaining
nephrons. Hyperfiltration was assessed by calculating mass-specific GFR, which could be
taken as an index of single-nephron GFR assuming that kidney mass directly correlates
28
with nephron number. Mass-specific GFR was not increased in the LBW rats, suggesting
that hyperfiltration was not occurring.
Glomerular filtration is created via four physical factors- glomerular capillary