26
CMPE 283 Virtualization Team 3 Under the Guidance of Prof. Saurabh Agarwal The DASHBOARD Project
| Date post: | 09-Jan-2017 |
| Category: |
Education |
| Upload: | ratankadam |
| View: | 1,269 times |
| Download: | 0 times |

CMPE 283 Virtualization
Team 3
Under the Guidance of
Prof. Saurabh Agarwal
The DASHBOARD Project

KNOW OUR TEAM
RATAN KADAM API SPECIALIST
Observium connection and monitoring. Host
configuration at all levels.
SJSU ID: 009984559
APURVA DIXIT NETWORK
CONFIGURATION EXPERT PROXMOX VE and Nagios
CORE monitoring tools
SJSU ID:009278958
VIGHNESH NAIKNETWORK ANALYST
Setup the Infrastructure for the project. Installation and
configuration of Vmware vSphere and Observium.
SJSU ID: 010024391
ANANTHCHRISTY
INFRASTRUCTURE GURUDesigning of Customized
API’s and execution of complex tasks on VM’s
SJSU ID:
010011677

INDEX

PROBLEM STATEMENTIn industries such as banking, applications are complex because of multiple
layers of systems. When an application tends to scale out, analytical tracking of the data becomes a primary concern. Hence there is a need for multiple monitoring tools, which proves to be a burden on the network administrator. This makes the job of a network admin difficult in terms of tracking individual tools and executing appropriate tasks to make sure the system uptime is at the max.Unfortunately, there is not a single solution to extract data from multiple layers of system resources to provide a graphical and statistical data representation. A solution that is anAdministrative tool that incorporates multiple layers of systems like ESXi and KVM (Opensource and Proprietary). There is also a lack of options to perform operations on a group of machines.

• All in one solution to vSphere family
Network Monitor Varieties of API’s
for Virtual machines
• Effective management of the virtual environment.
THE SOLUTION
A Dashboard that could have seemless integration of everything you need to monitor on a Virtual
Environment.

INFRASTRUCTURE SETUPvSphere and Observium
Ananth Christy George

TECHNOLOGY STACK1. VMware Workstation 112. VMware vSphere ESXi bare-metal Hypervisor3. vSphere Client (Desktop based .exe)4. vCenter Server Appliance (.ovf template)5. vCenter Web Client (.php – hostname:9443)6. Observium7. Turnkey Linux Server Appliance8. VM Tools9. SNMP and MySQL configuration10.NTP servers
REQUIREMENTS
Listed below are the software’s that were used for this project.REQUIREMENTSWindows 8.1 and above(preferred)RAM: 6 gb (suggested 8 gb )Processor Cores: 4Datastore Storage = 60 gb (minimum)VM’s storage = 5 to 15 gbVM OSes/iso’s = Ubuntu
Ananth Christy George
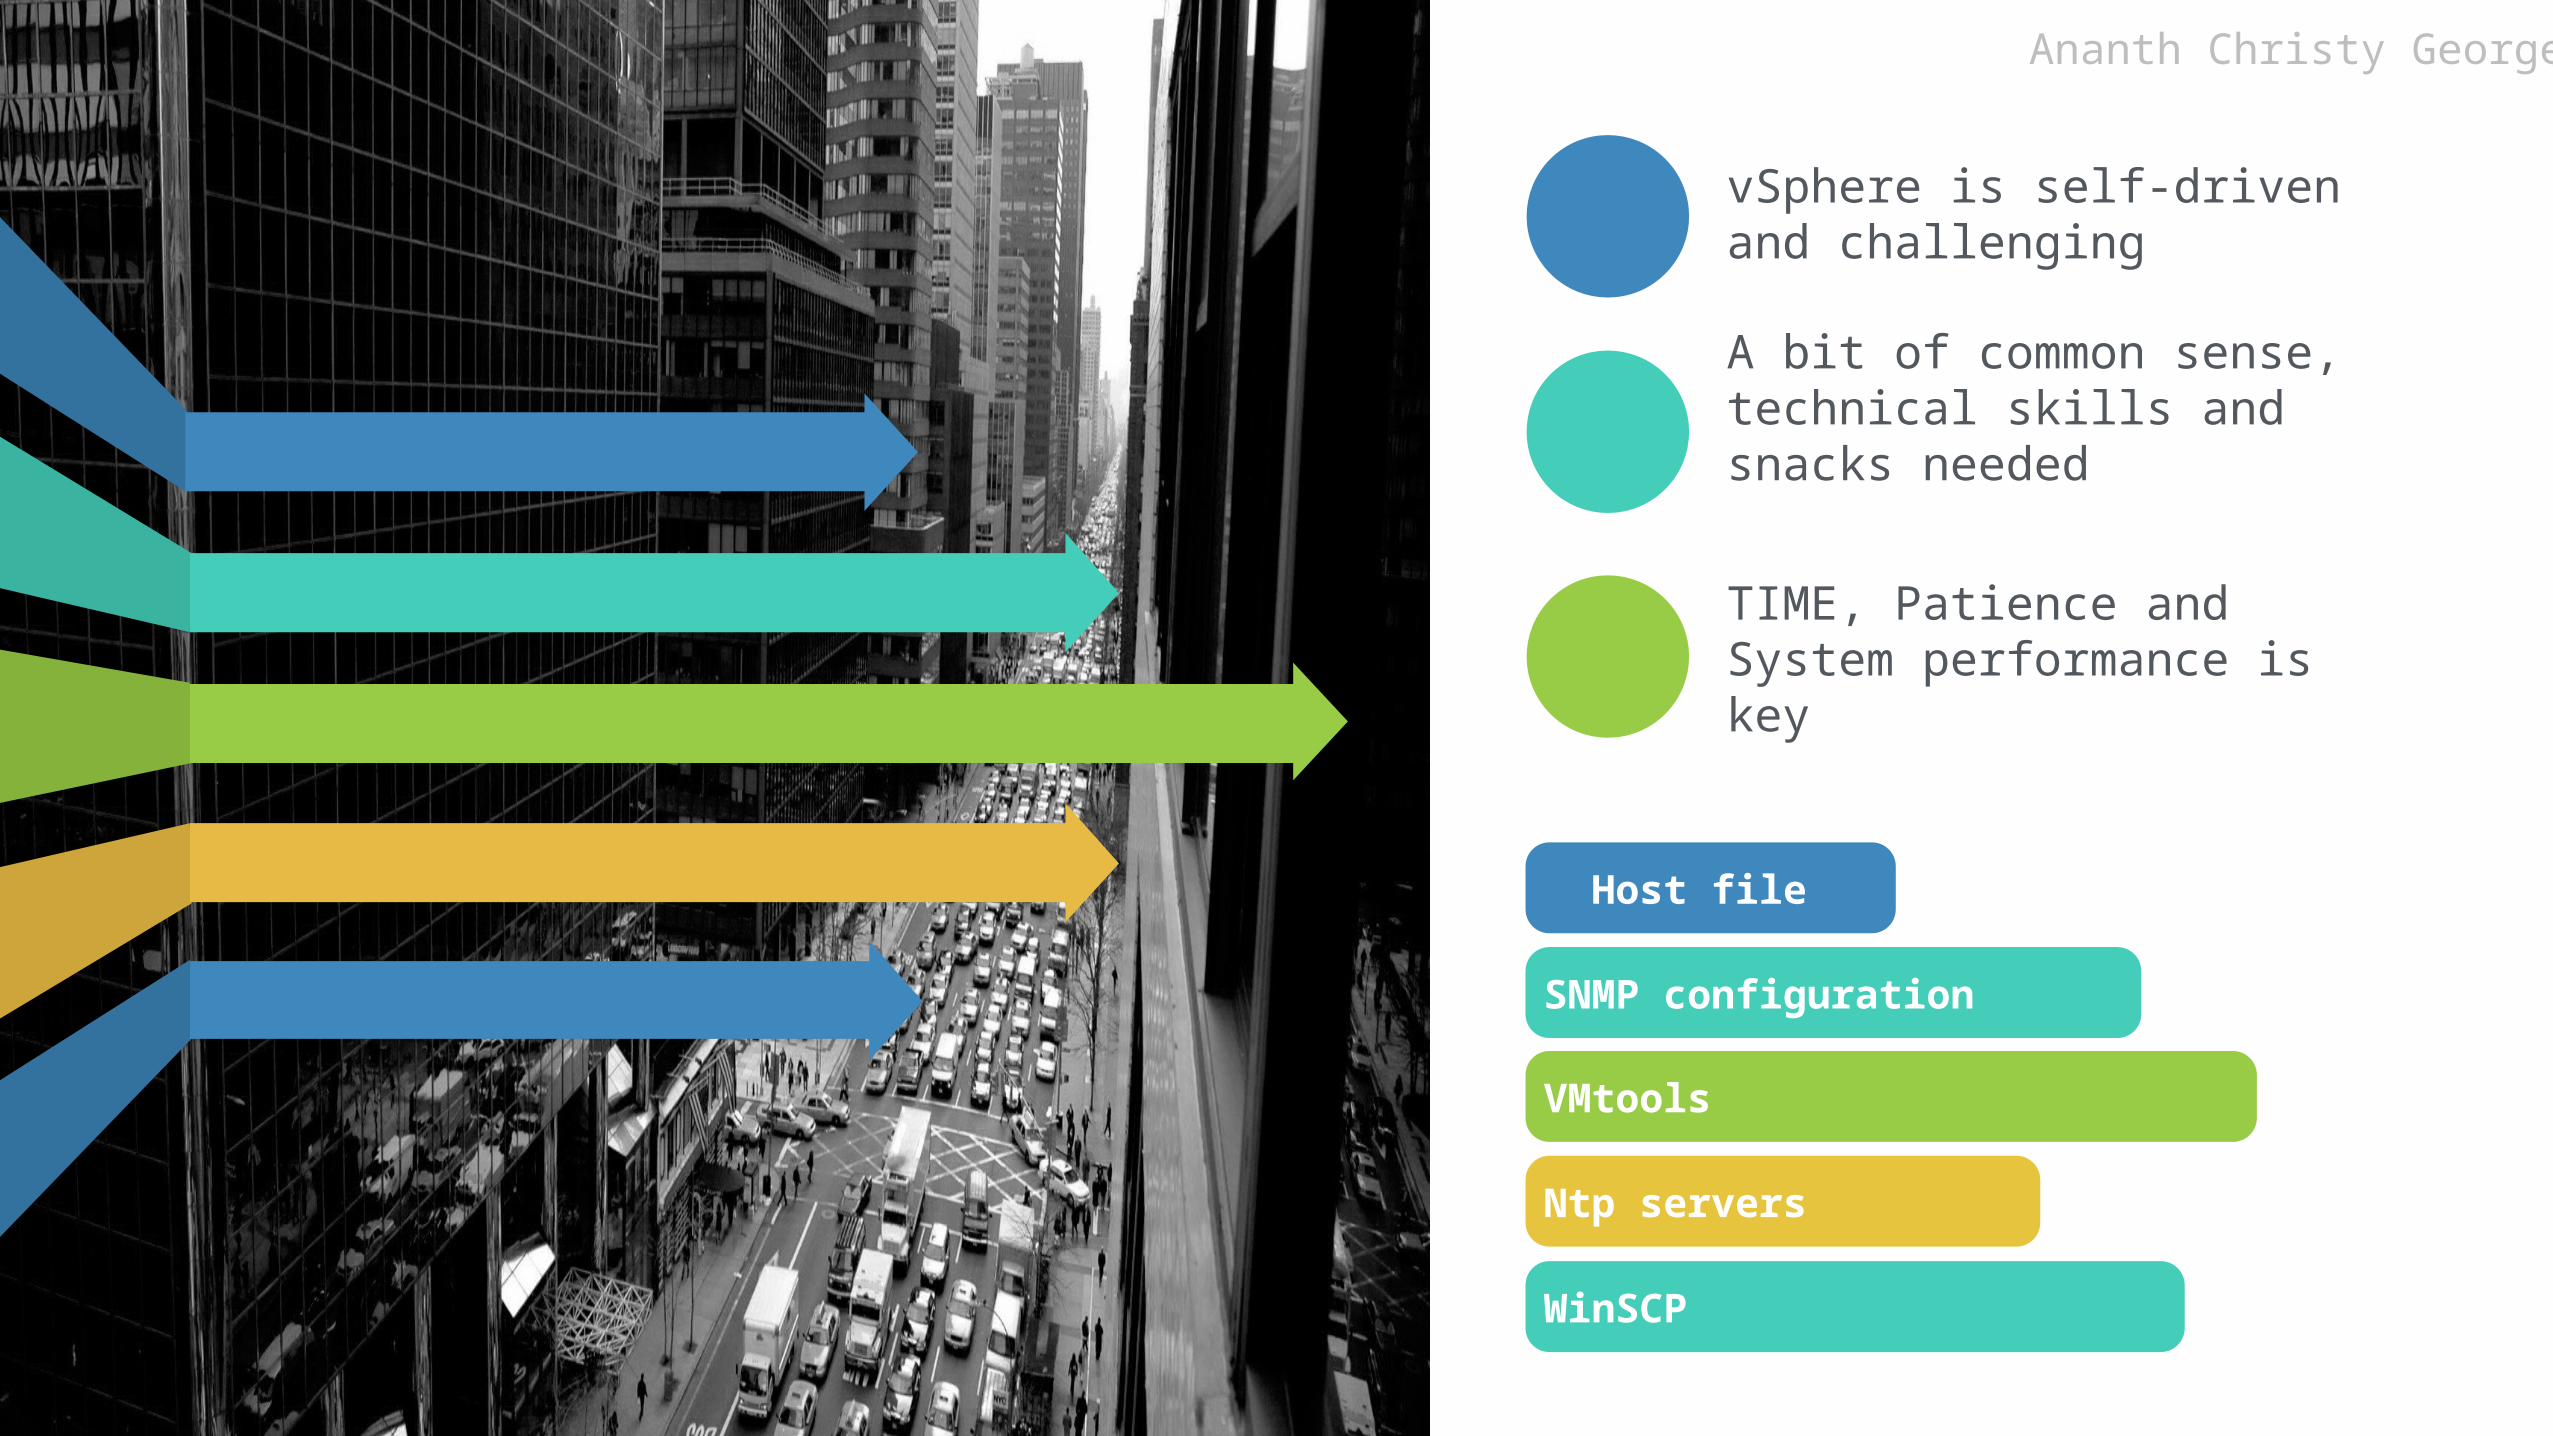
Host file
SNMP configuration
VMtools
Ntp servers
WinSCP
vSphere is self-driven and challenging
A bit of common sense, technical skills and snacks needed
TIME, Patience and System performance is key
Ananth Christy George

The ProcessESXi
HypervisorvSphere/vCenter
TurnKey Linux Observium Orchestratio
n
1. Install an ESXi Hypervisor as the base VM on VMware workstation
2. Assign static IP which is to be accessed over the browser
3. Install vSphere client over the desktop and choose to install vCenter server appliance using the ovf template.
4. Observium has a simlar counterpart called Turnkey Linux server appliance.
5. Installation also prompts us to install mysql, php and most importantly snmp.
6. Configure the SNMP file to ‘public’ which makes it ready to use.
7. Once setup is done. You are good to go!

APIIMPLEMENTATION21 Different API’s
Ratan Kadam
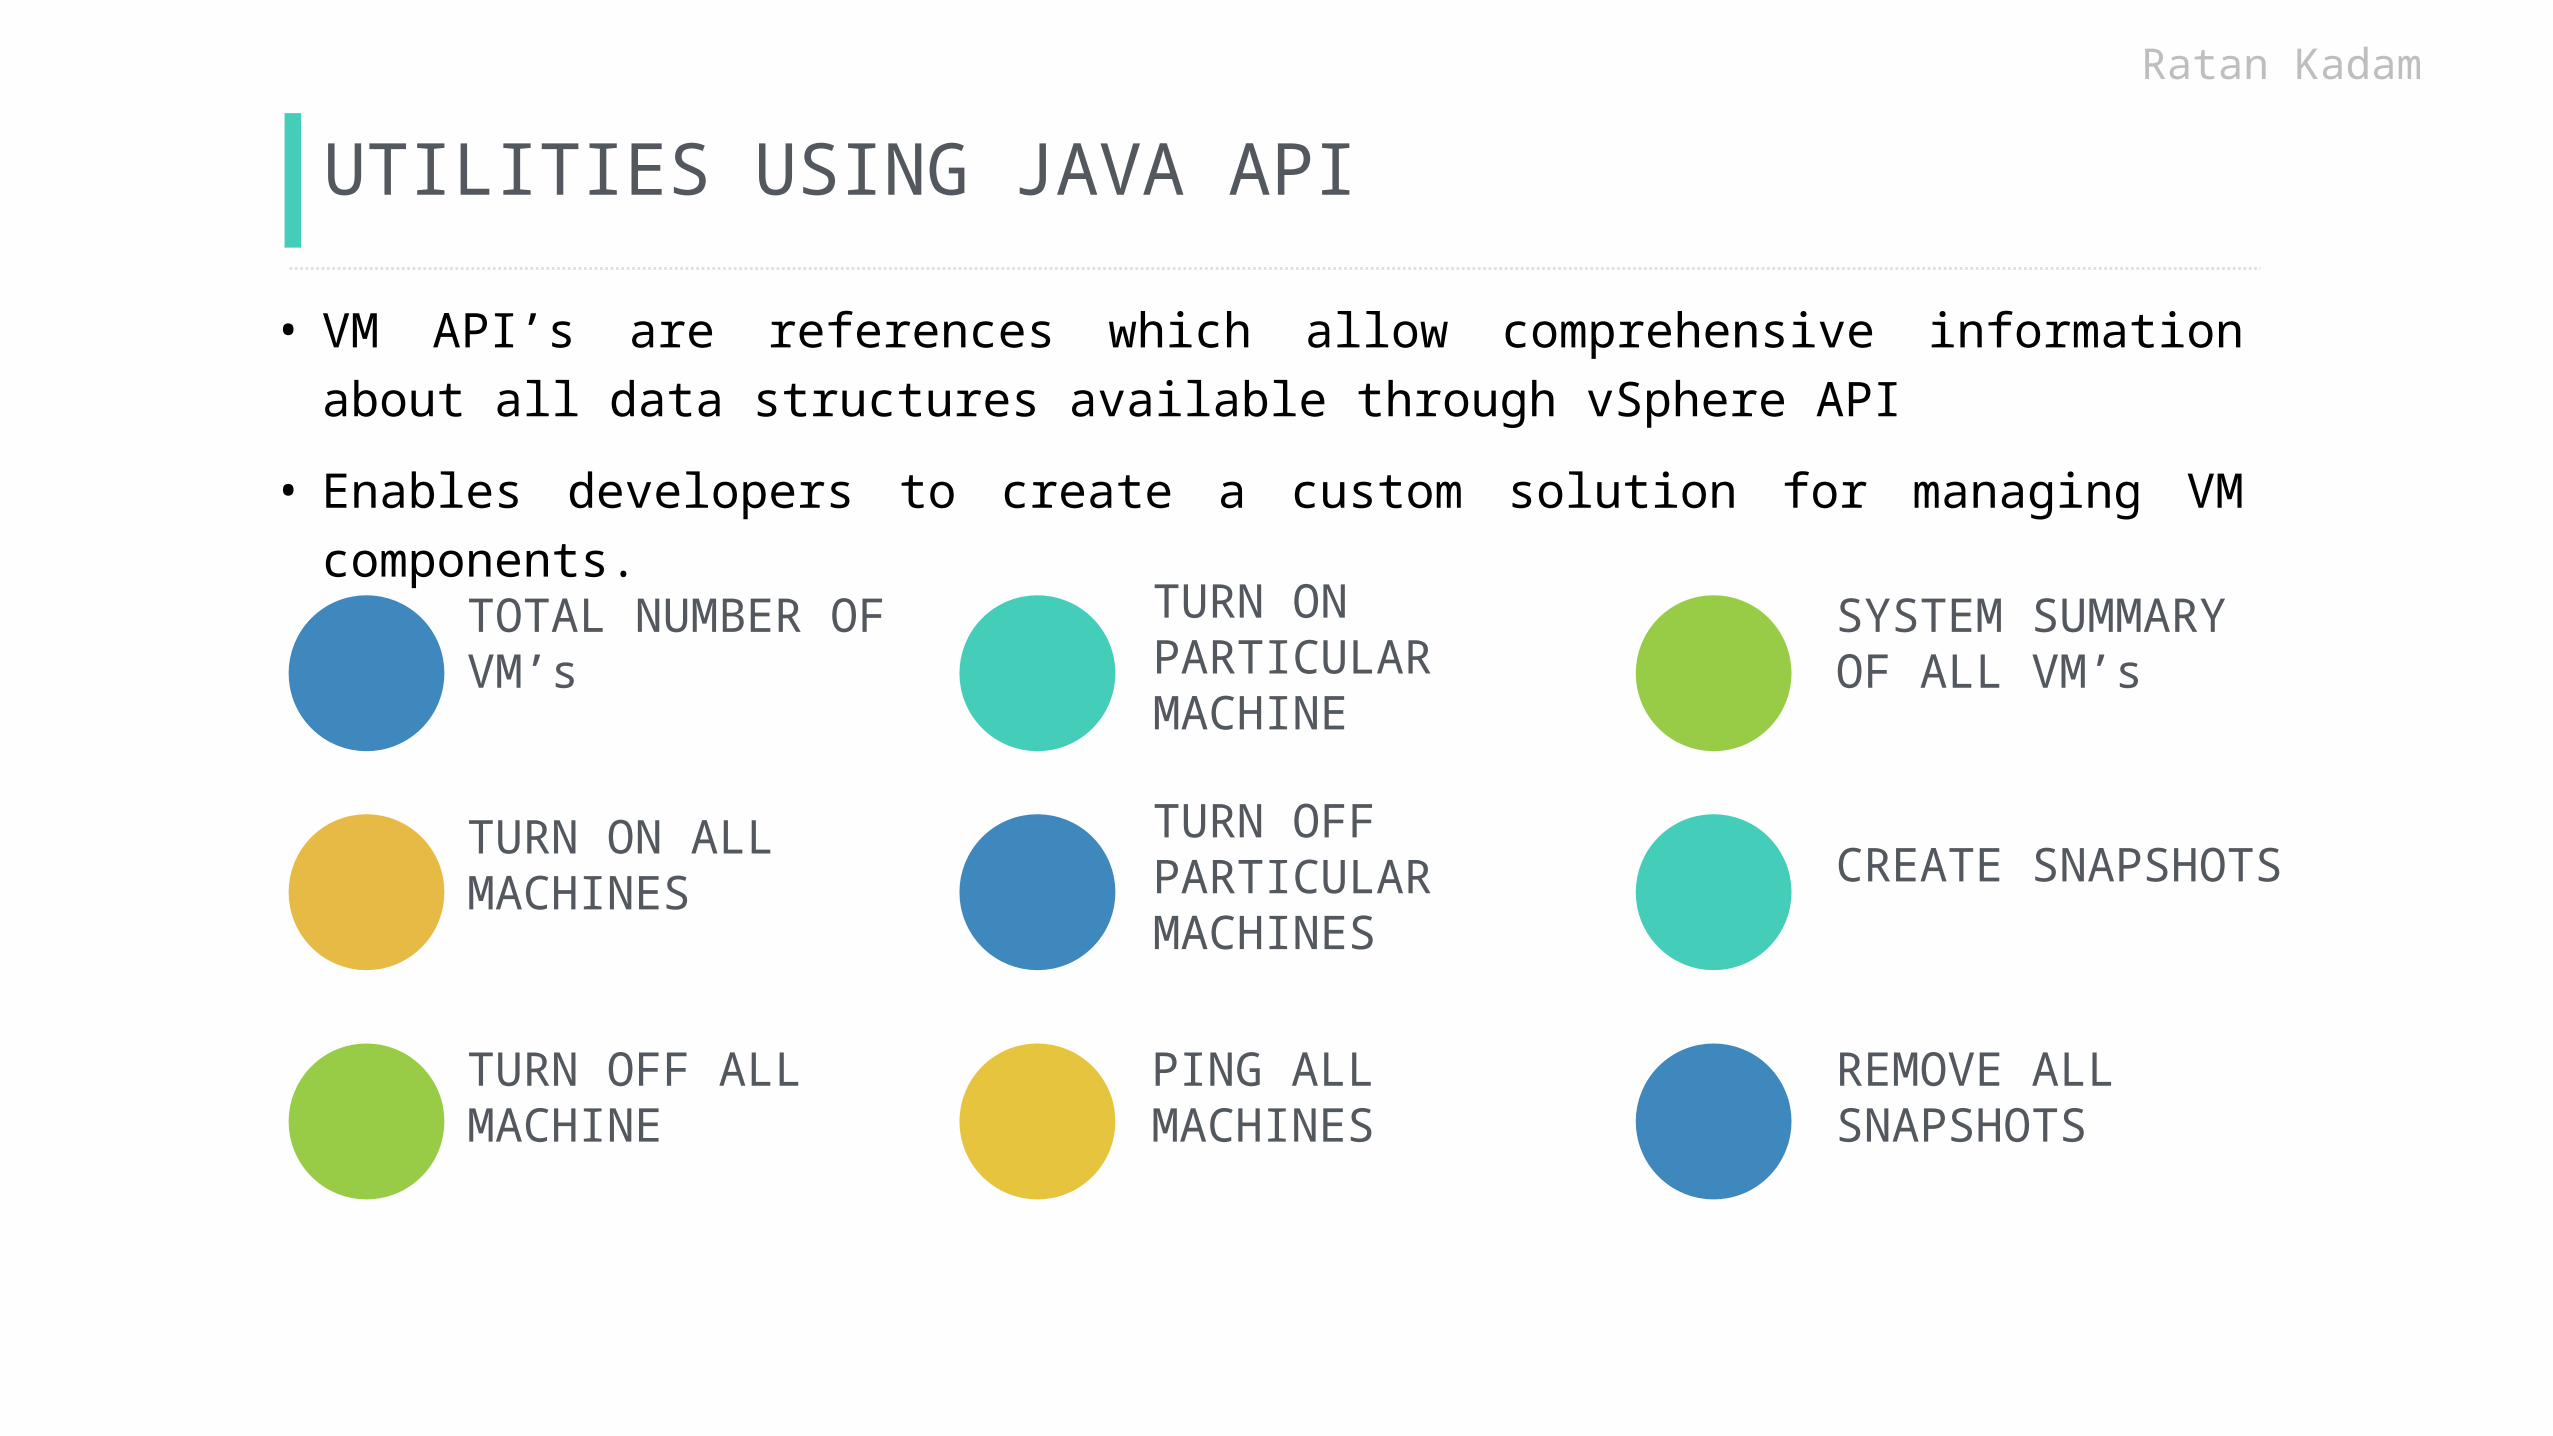
UTILITIES USING JAVA API• VM API’s are references which allow comprehensive information about all data
structures available through vSphere API• Enables developers to create a custom solution for managing VM components.
TOTAL NUMBER OF VM’s
TURN ON PARTICULAR MACHINE
SYSTEM SUMMARY OF ALL VM’s
TURN ON ALL MACHINES
TURN OFF PARTICULAR MACHINES
CREATE SNAPSHOTS
TURN OFF ALL MACHINE
PING ALL MACHINES
REMOVE ALL SNAPSHOTS
Ratan Kadam
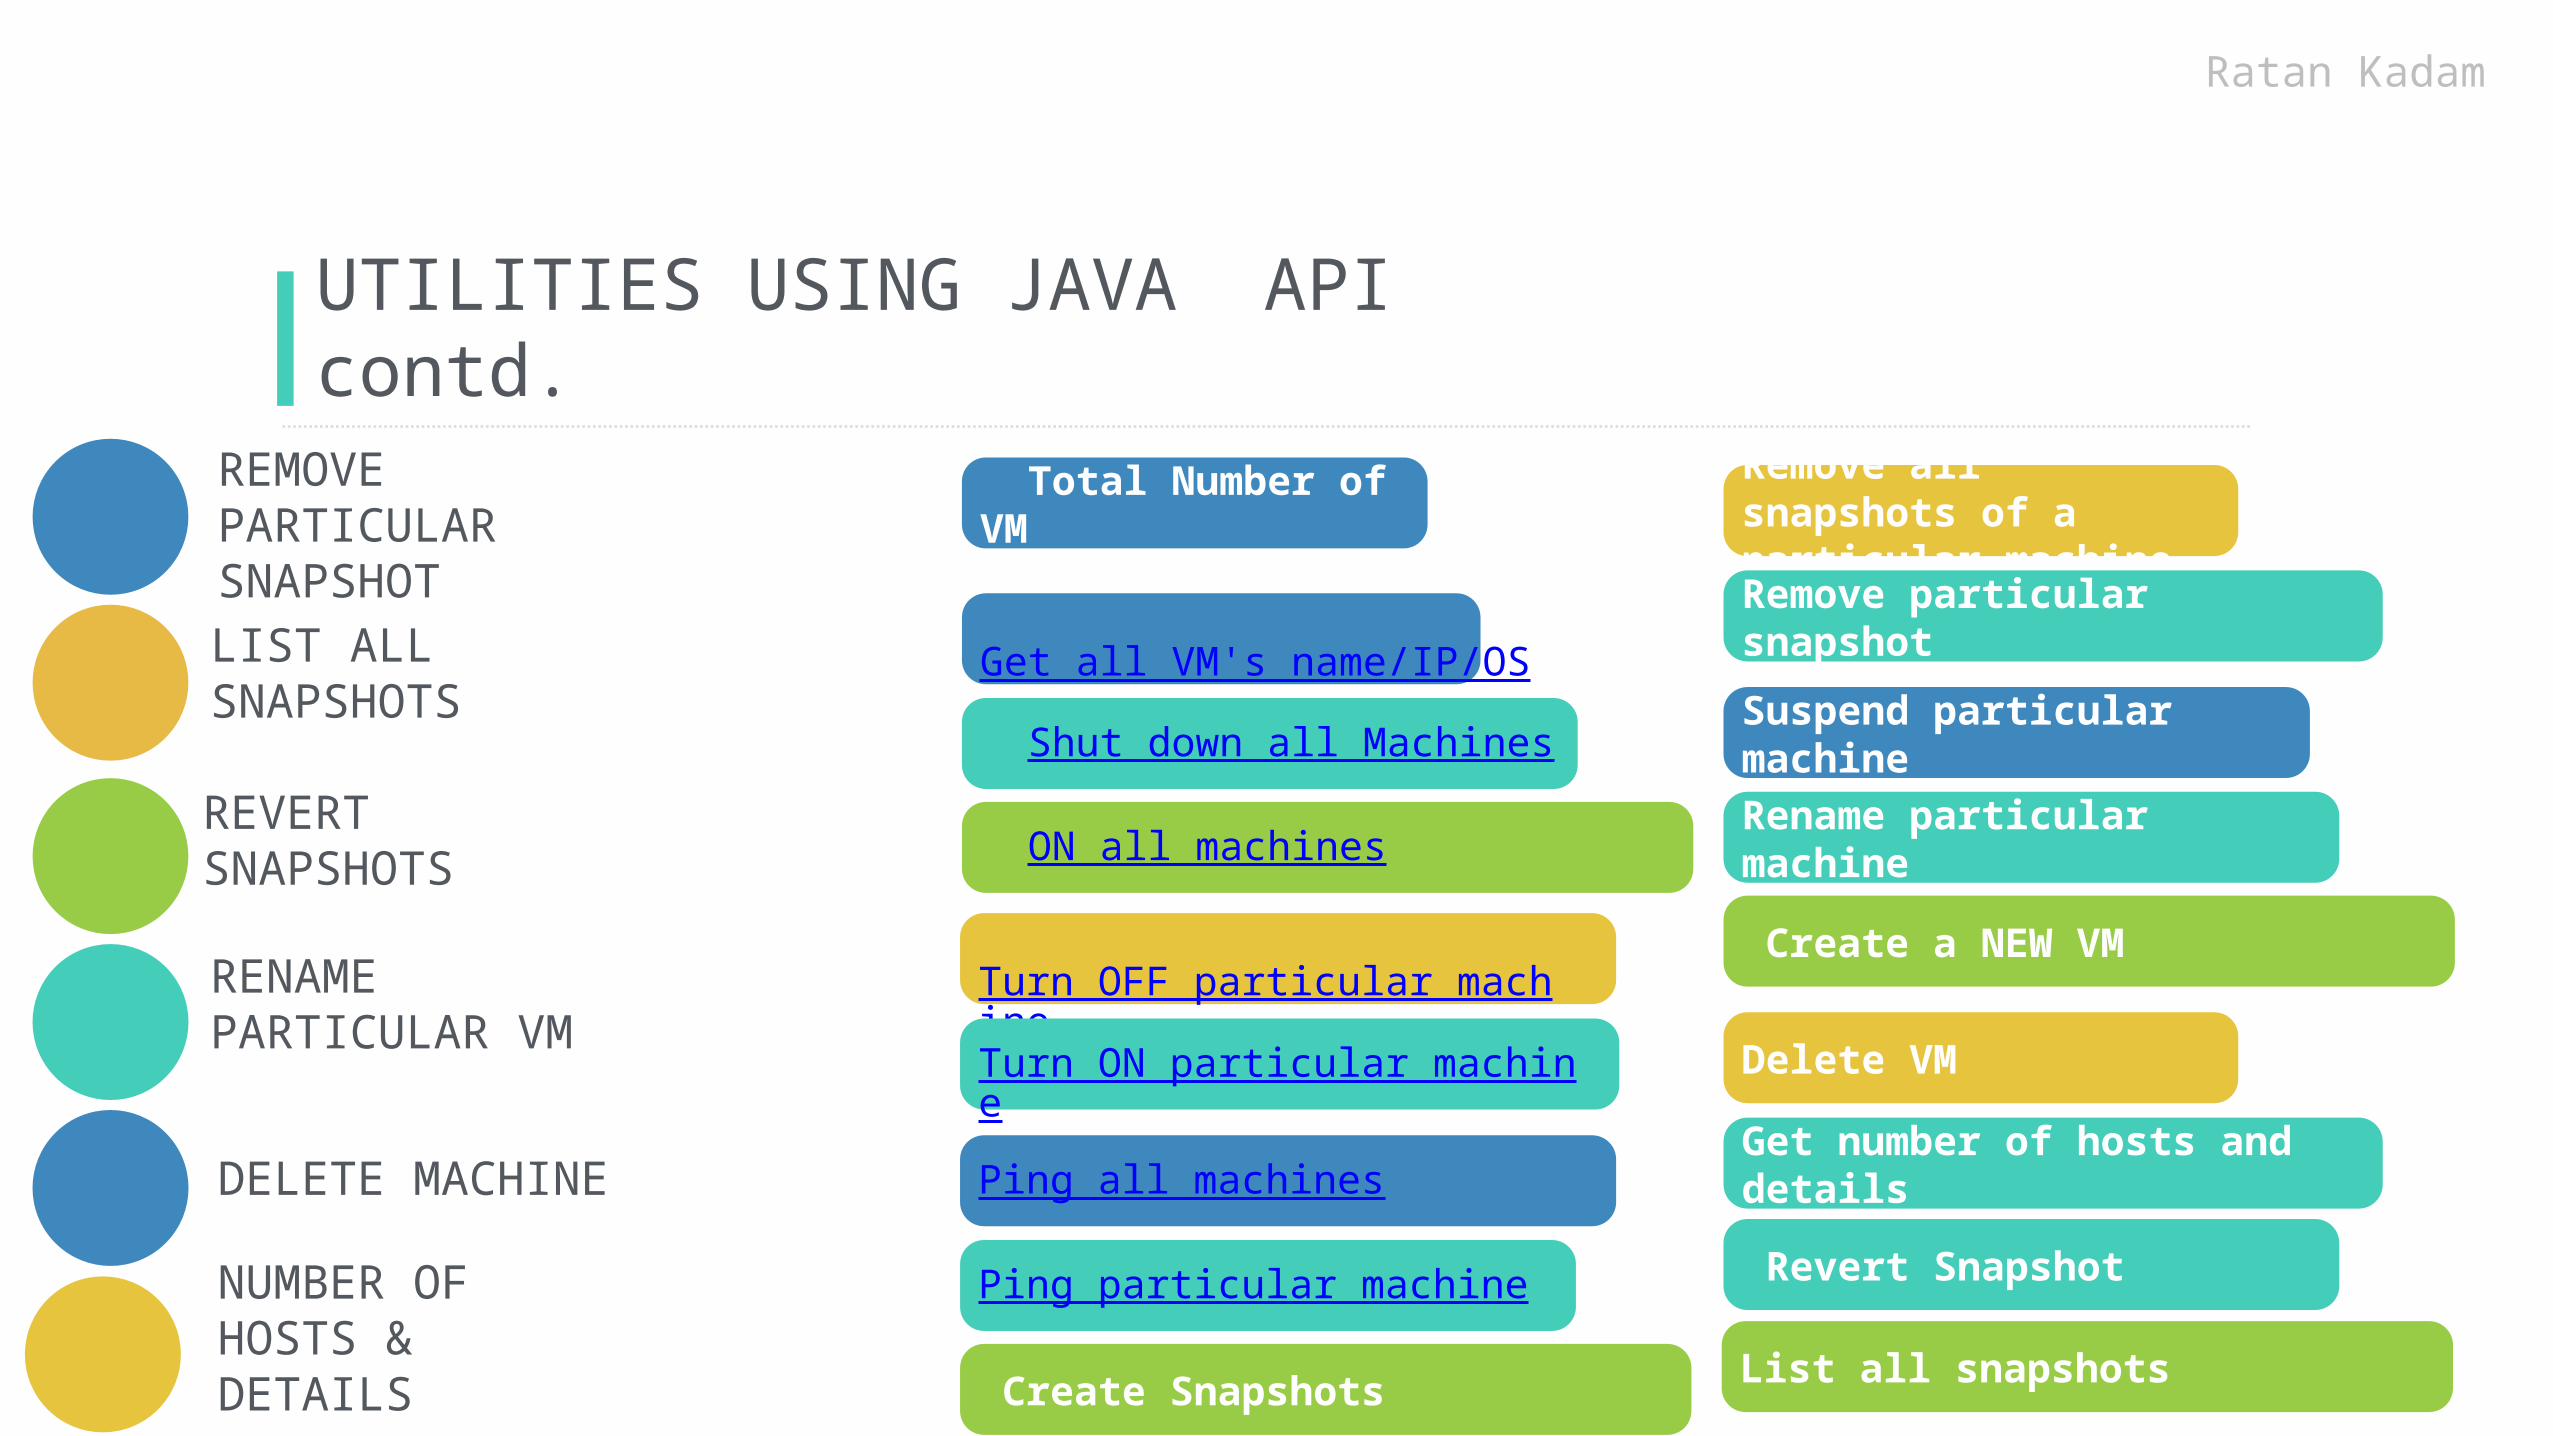
UTILITIES USING JAVA API contd.REMOVE PARTICULAR SNAPSHOT
RENAME PARTICULAR VM
LIST ALL SNAPSHOTS
DELETE MACHINE
REVERT SNAPSHOTS
NUMBER OF HOSTS & DETAILS
Ratan Kadam
Get all VM's name/IP/OS
Shut down all Machines
ON all machines
Turn OFF particular machineTurn ON particular machine
Ping all machines
Ping particular machine
Create Snapshots
Delete VM
Get number of hosts and details
Total Number of VM
Revert Snapshot
List all snapshots
Remove all snapshots of a particular machineRemove particular snapshotSuspend particular machineRename particular machine
Create a NEW VM
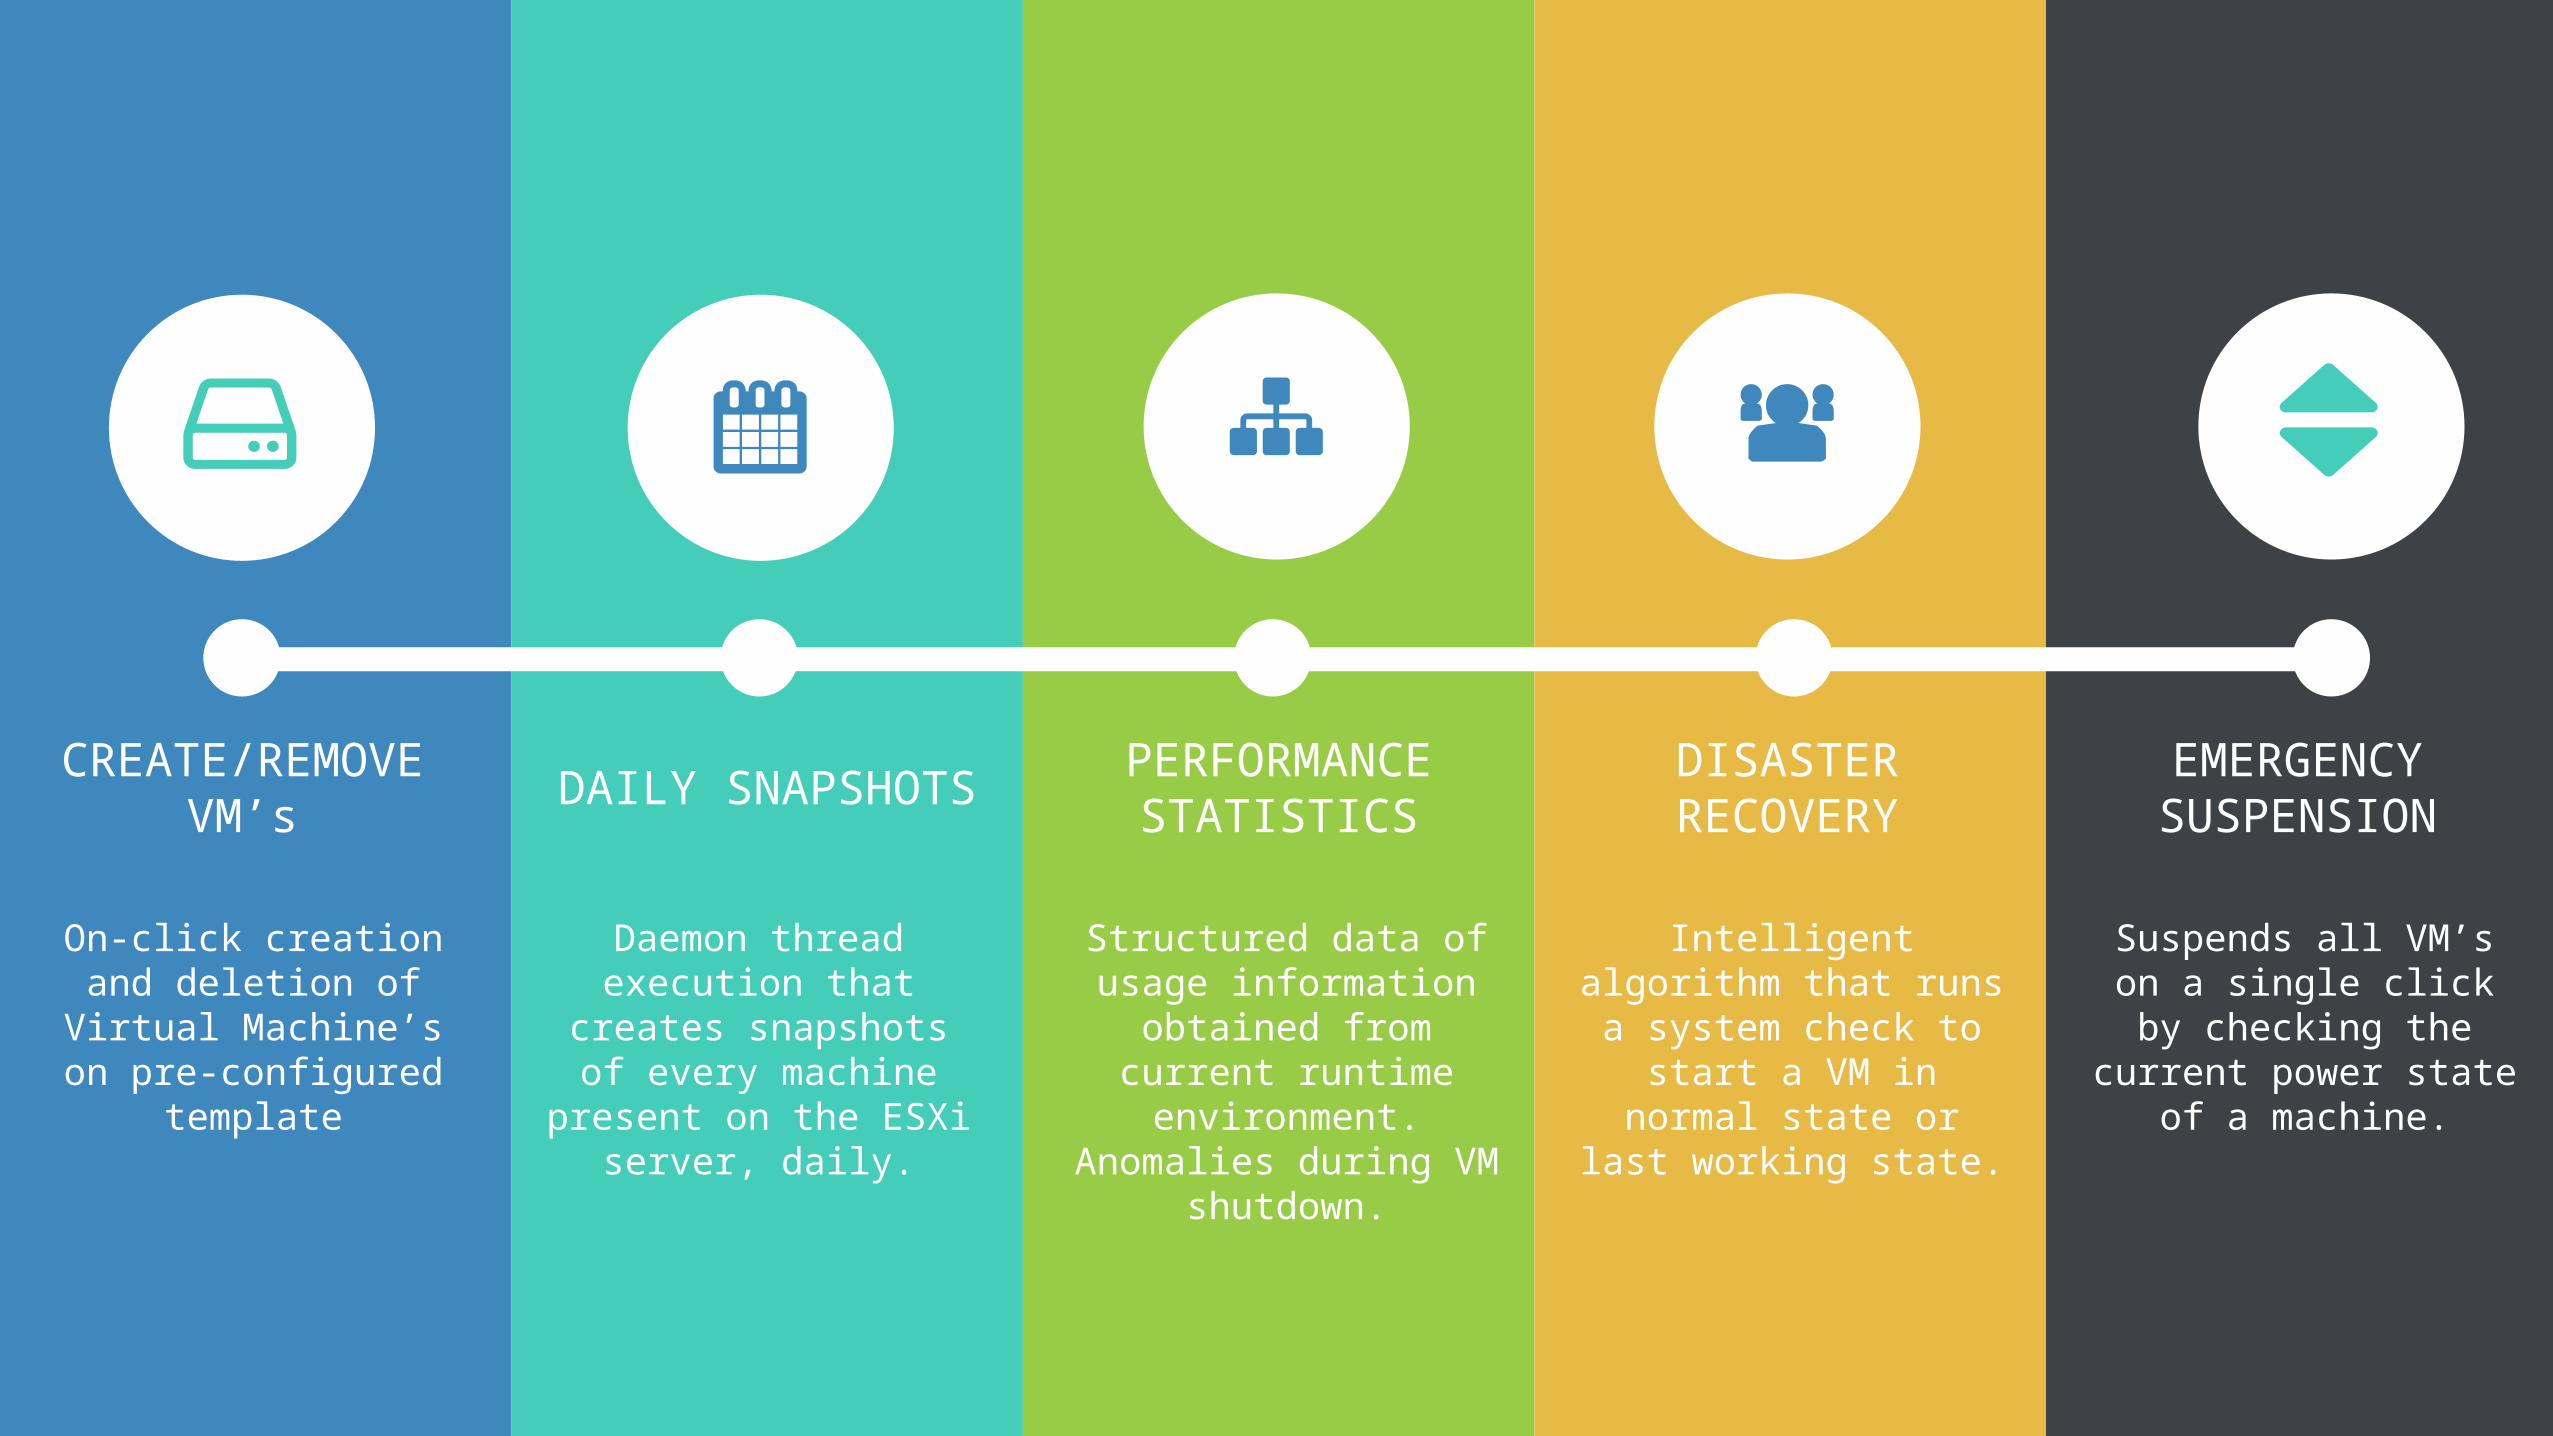
On-click creation and deletion of Virtual Machine’s on pre-
configured template
Daemon thread execution that creates
snapshots of every machine present on
the ESXi server, daily.
Structured data of usage information
obtained from current runtime environment. Anomalies during VM
shutdown.
Intelligent algorithm that runs a system
check to start a VM in normal state or last
working state.
Suspends all VM’s on a single click by
checking the current power state of a
machine.
CREATE/REMOVE VM’s DAILY SNAPSHOTS PERFORMANCE
STATISTICSDISASTER RECOVERY
EMERGENCY SUSPENSION

OBSERVIUMOrchestrationNETWORK MONITORING
Apurva Dixit
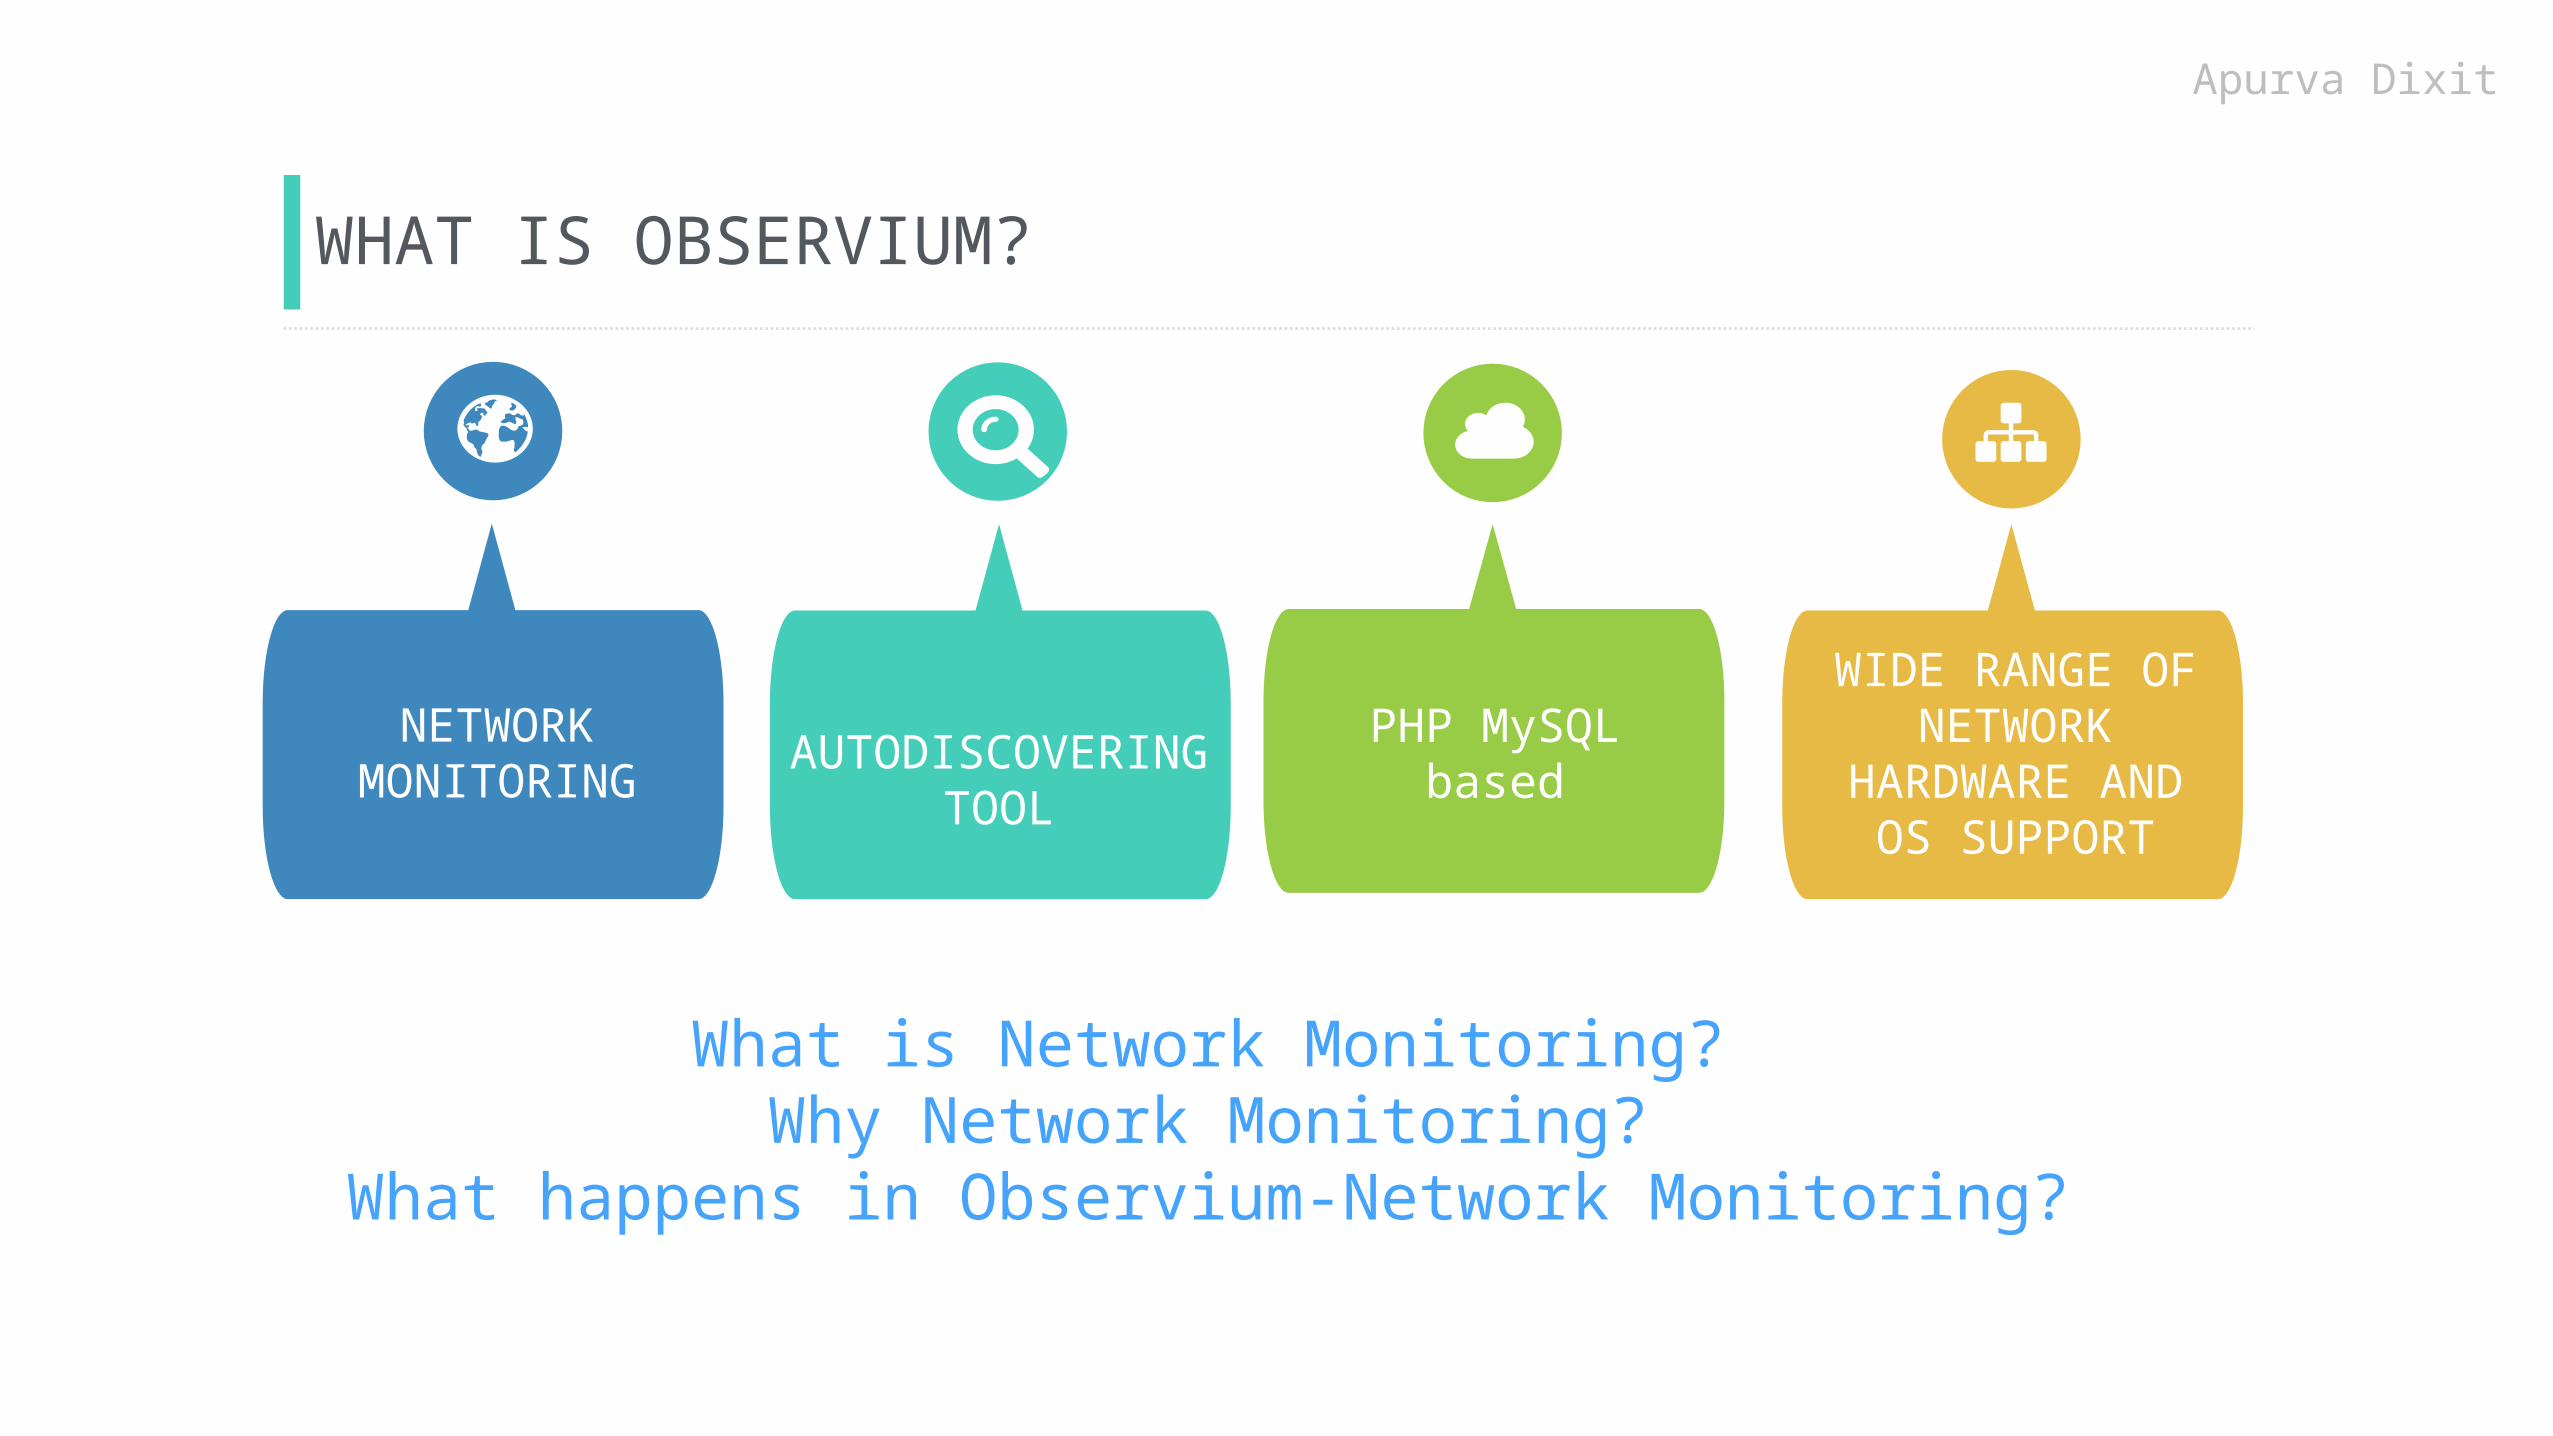
WHAT IS OBSERVIUM?
NETWORK MONITORING AUTODISCOVERING
TOOLPHP MySQL
based
WIDE RANGE OF NETWORK
HARDWARE AND OS SUPPORT
Apurva Dixit
What is Network Monitoring?Why Network Monitoring?
What happens in Observium-Network Monitoring?

ROLE OF OBSERVIUM•VISUALIZATION THROUGH GRAPHS
•MATRIX COLLECTION FOR GRAPHS•TRACK SYSTEM FAILURE•NETWORK PERFORMANCE
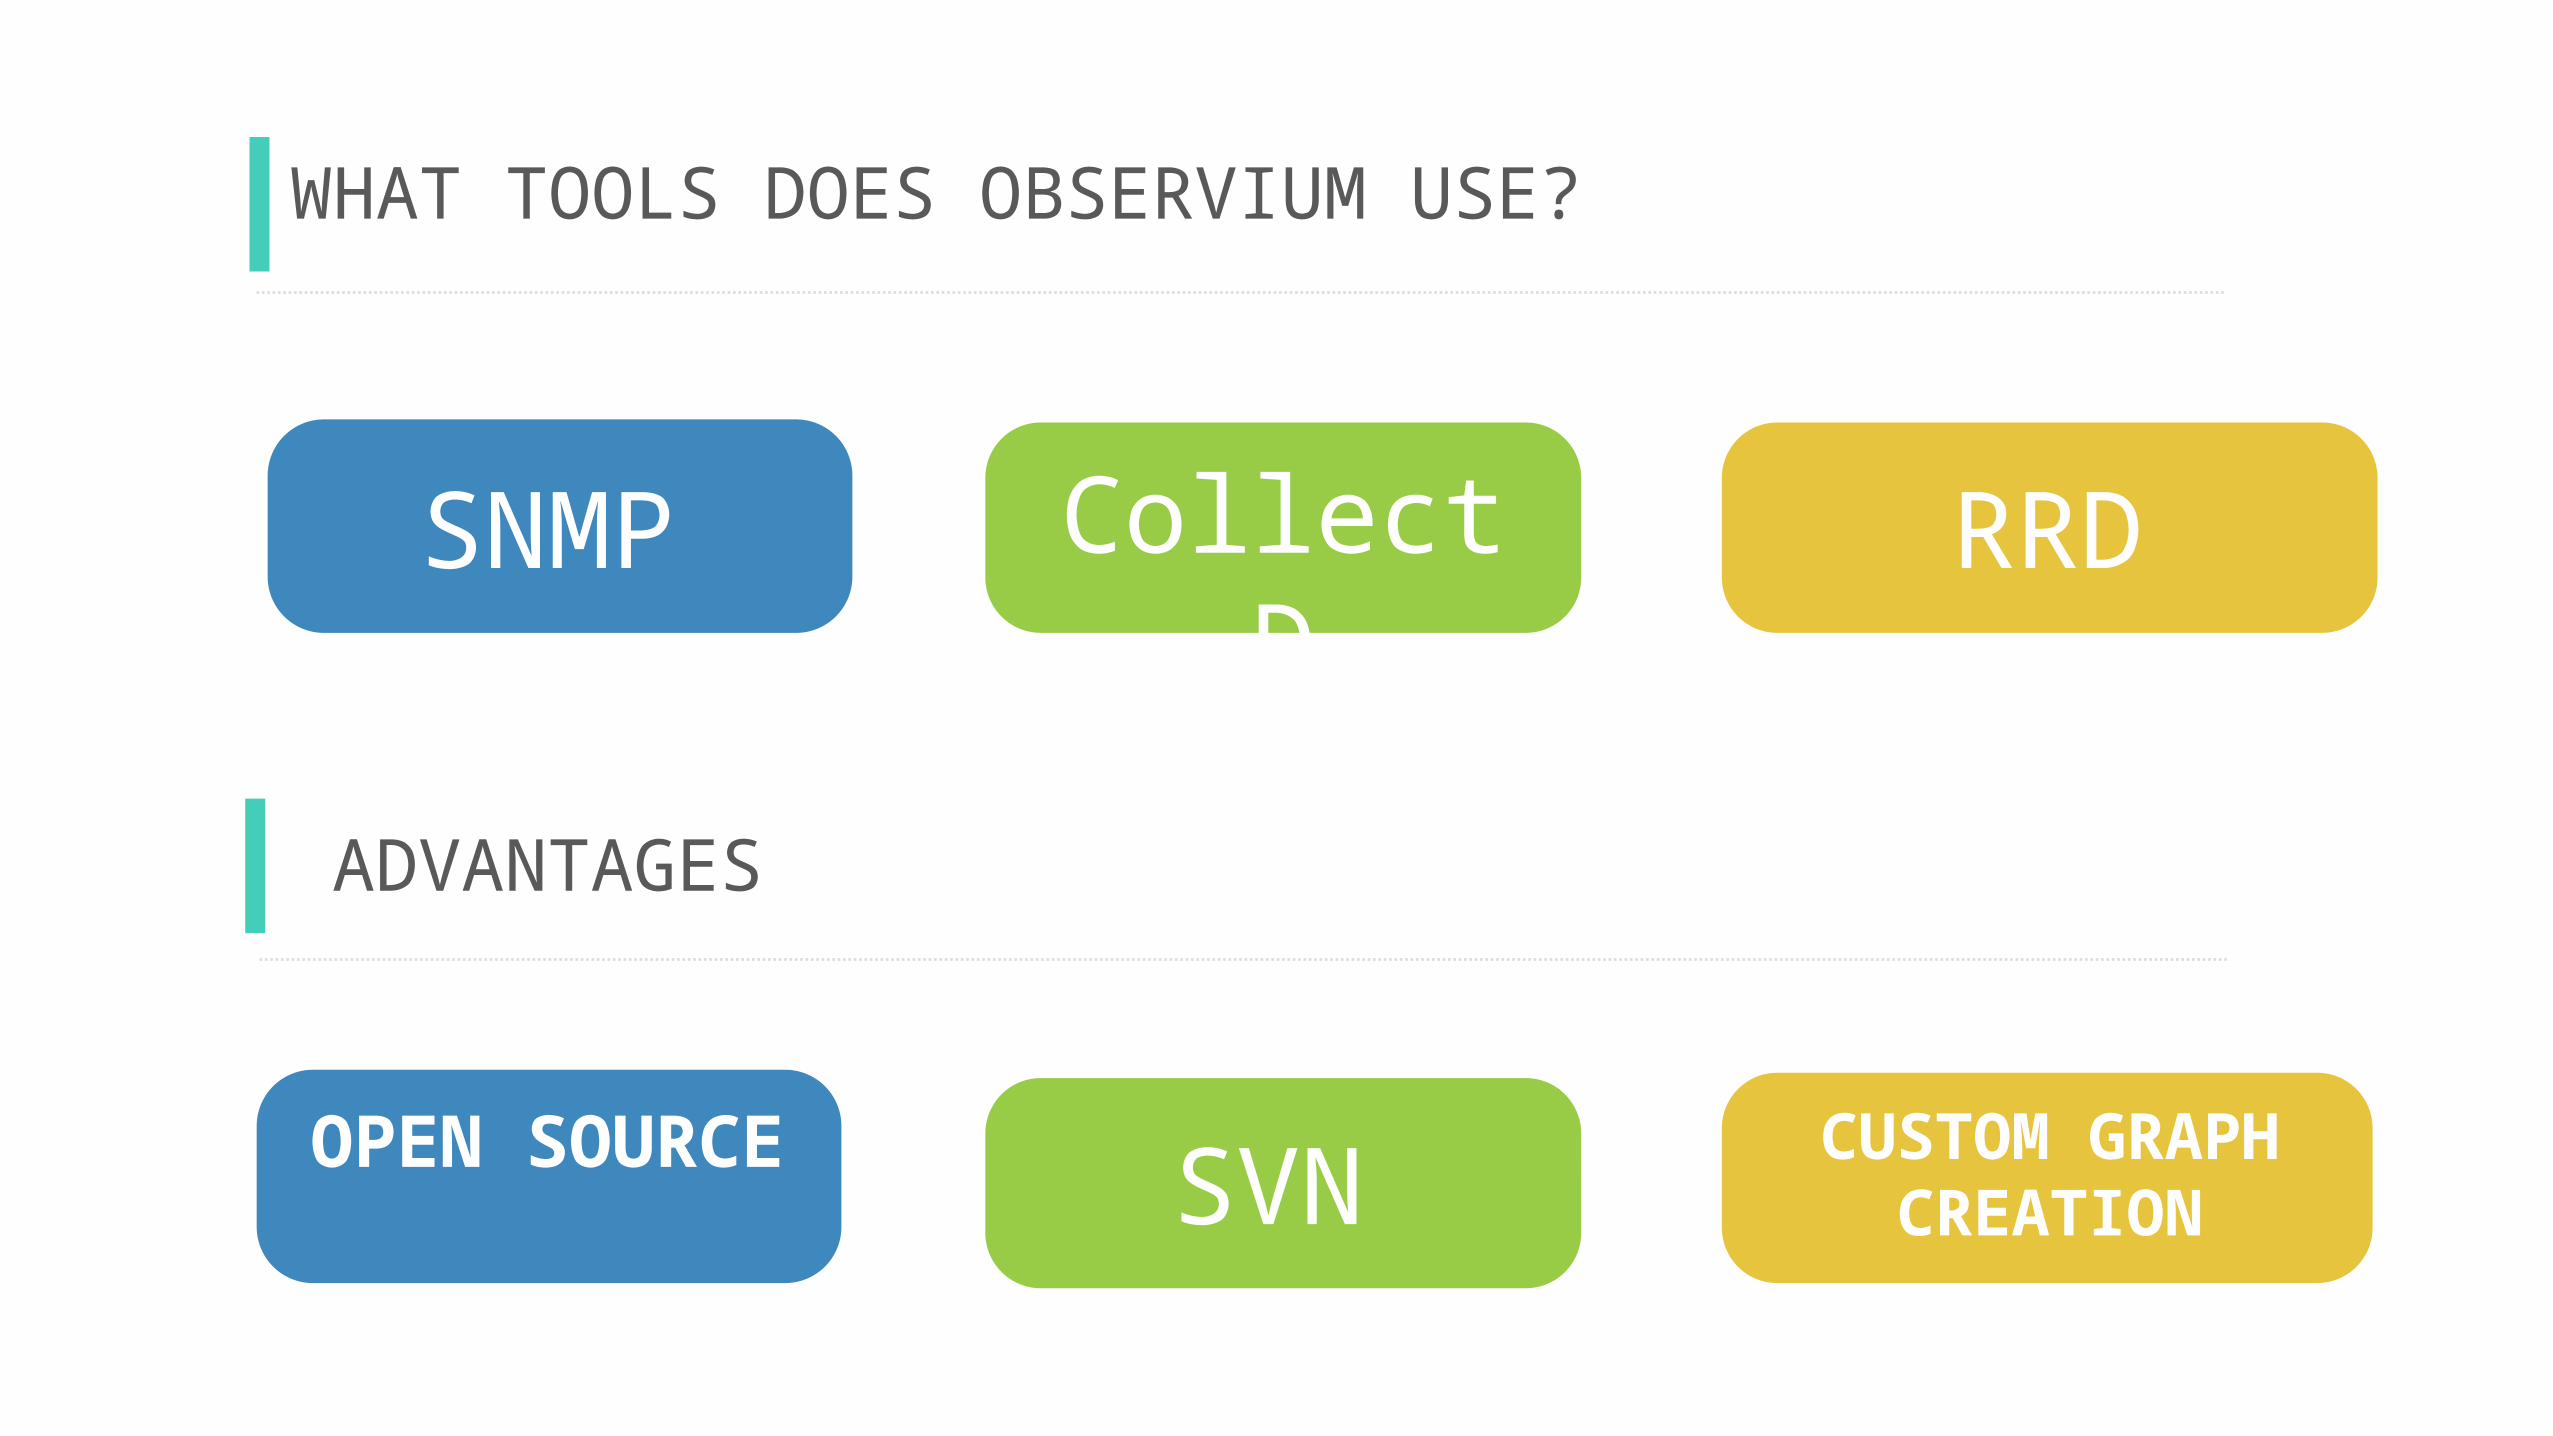
WHAT TOOLS DOES OBSERVIUM USE?
SNMP CollectD RRD
ADVANTAGES
OPEN SOURCE SVN CUSTOM
GRAPH CREATION
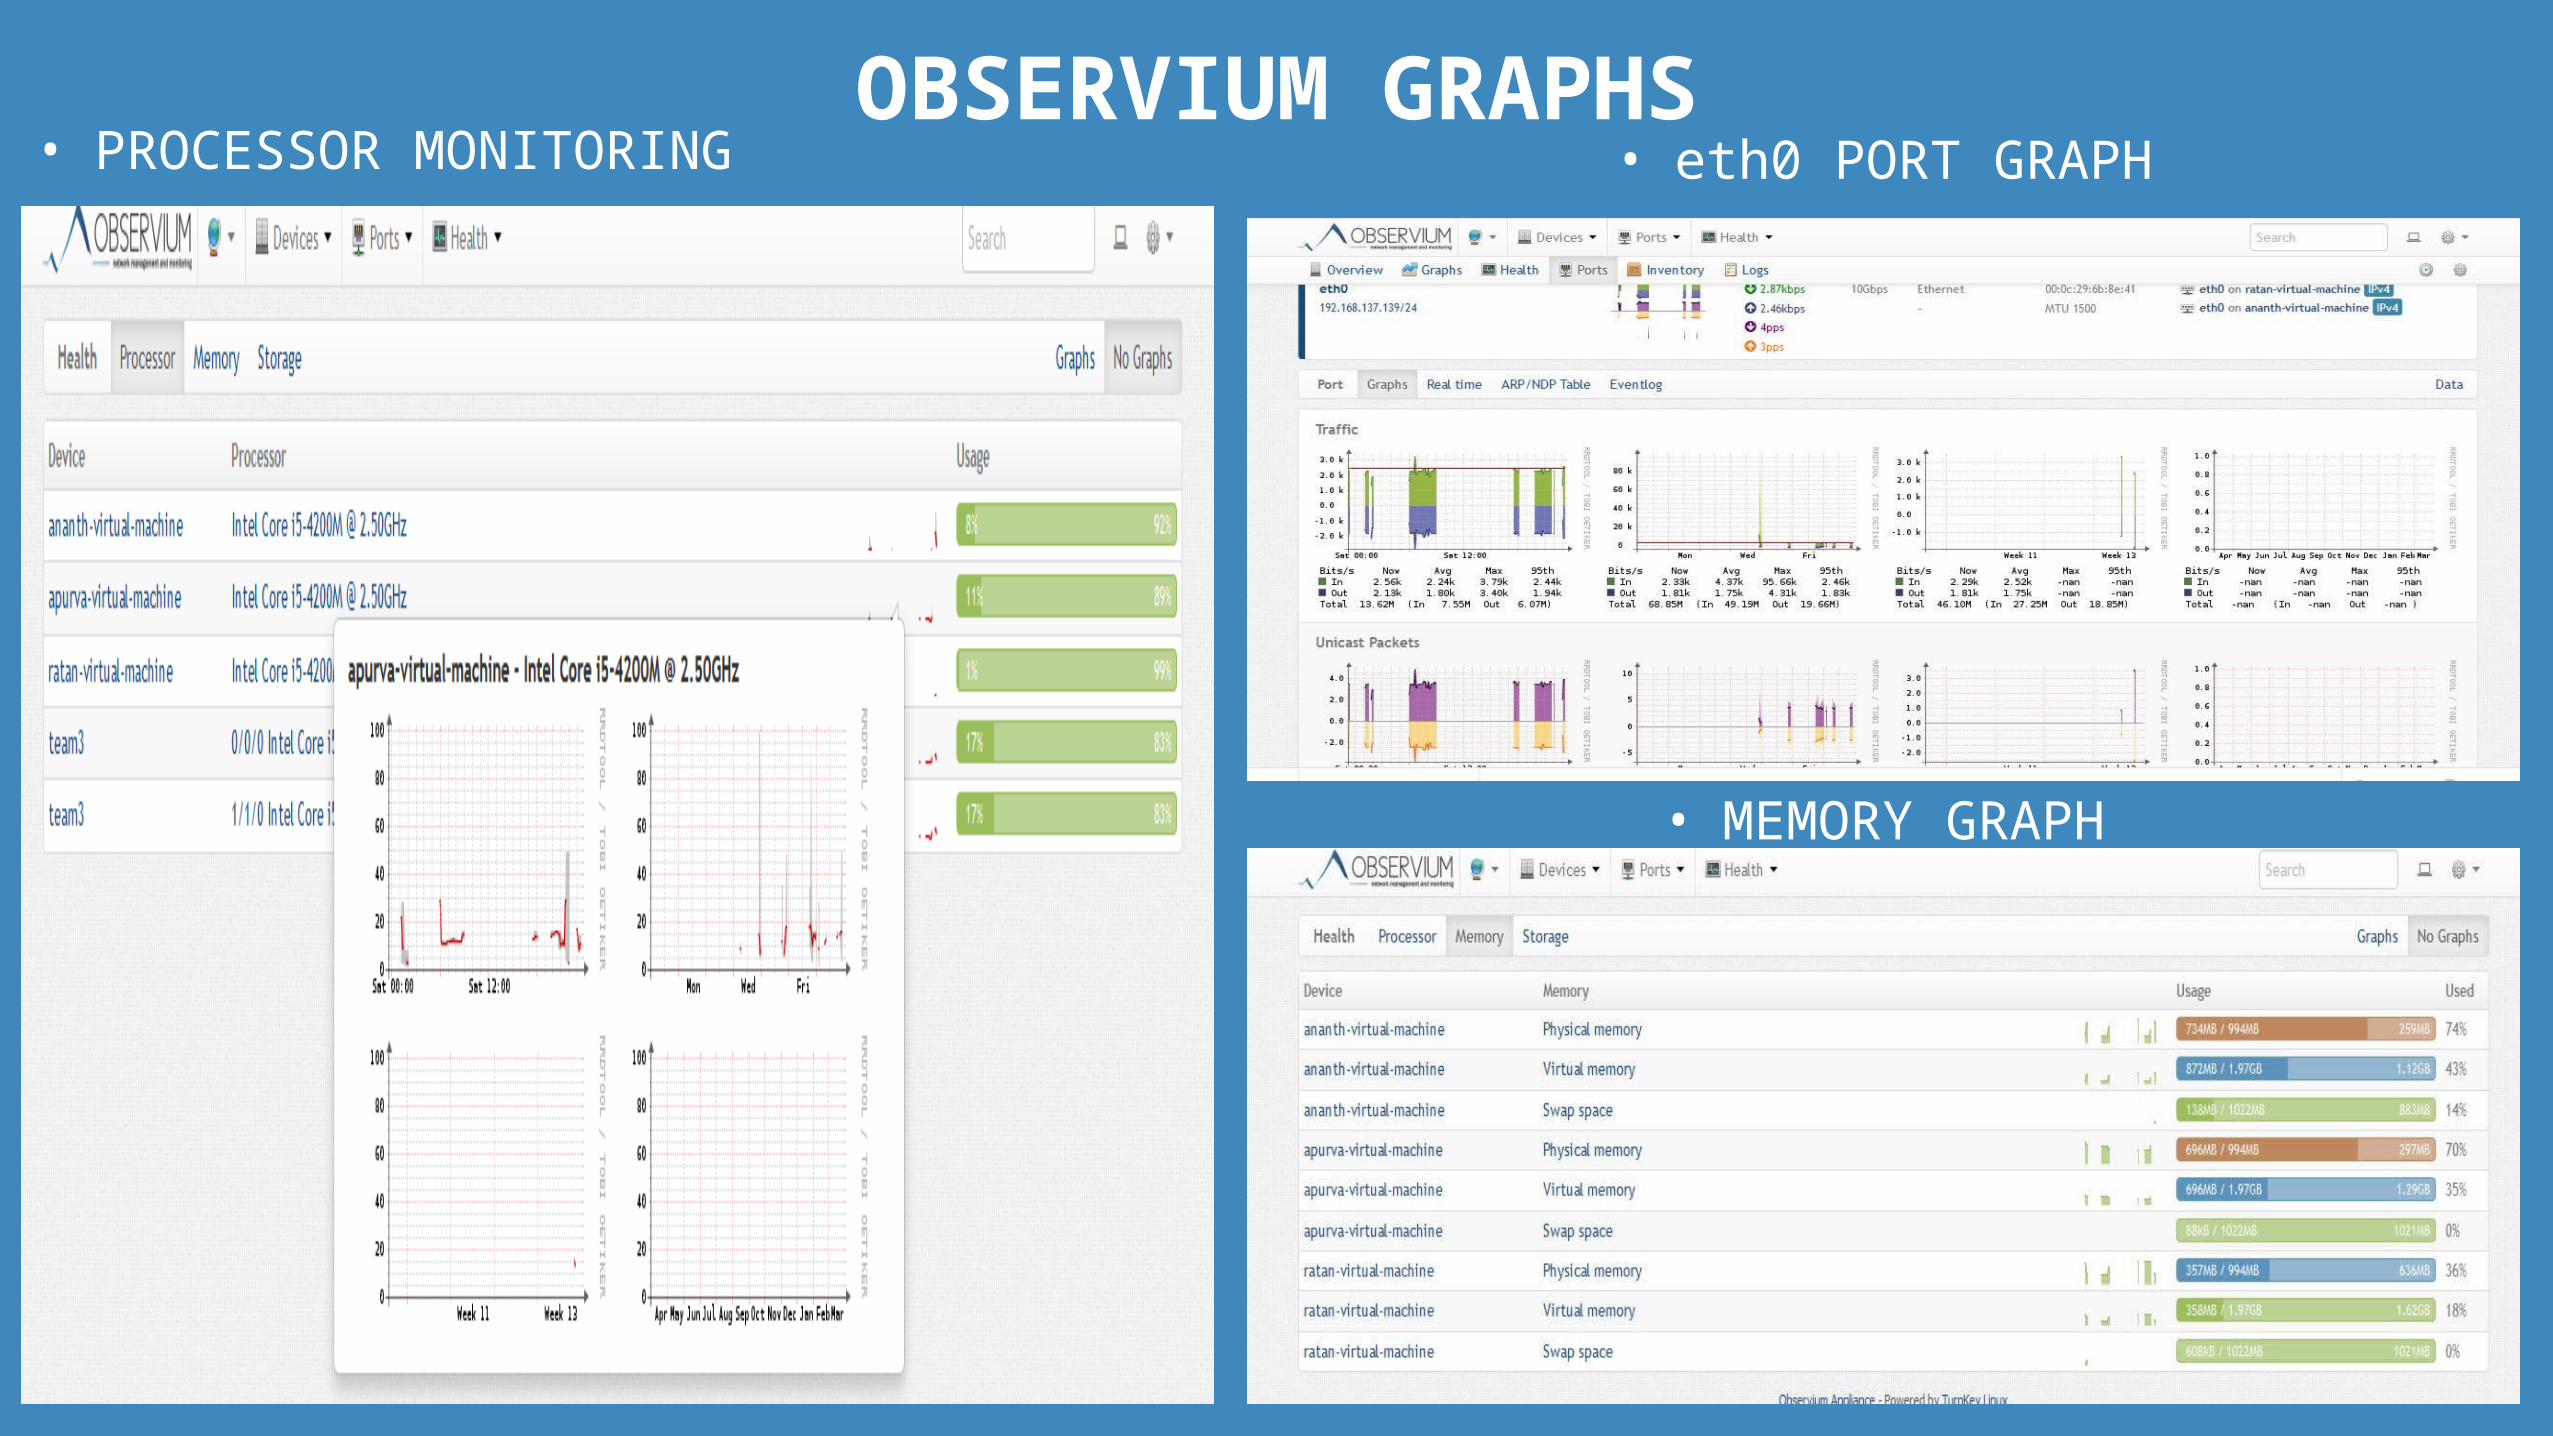
OBSERVIUM GRAPHS• PROCESSOR MONITORING • eth0 PORT GRAPH
• MEMORY GRAPH
LINUX KVM andNagios MonitoringOpensource Virtualization management and monitoring solutions
Vighnesh Naik
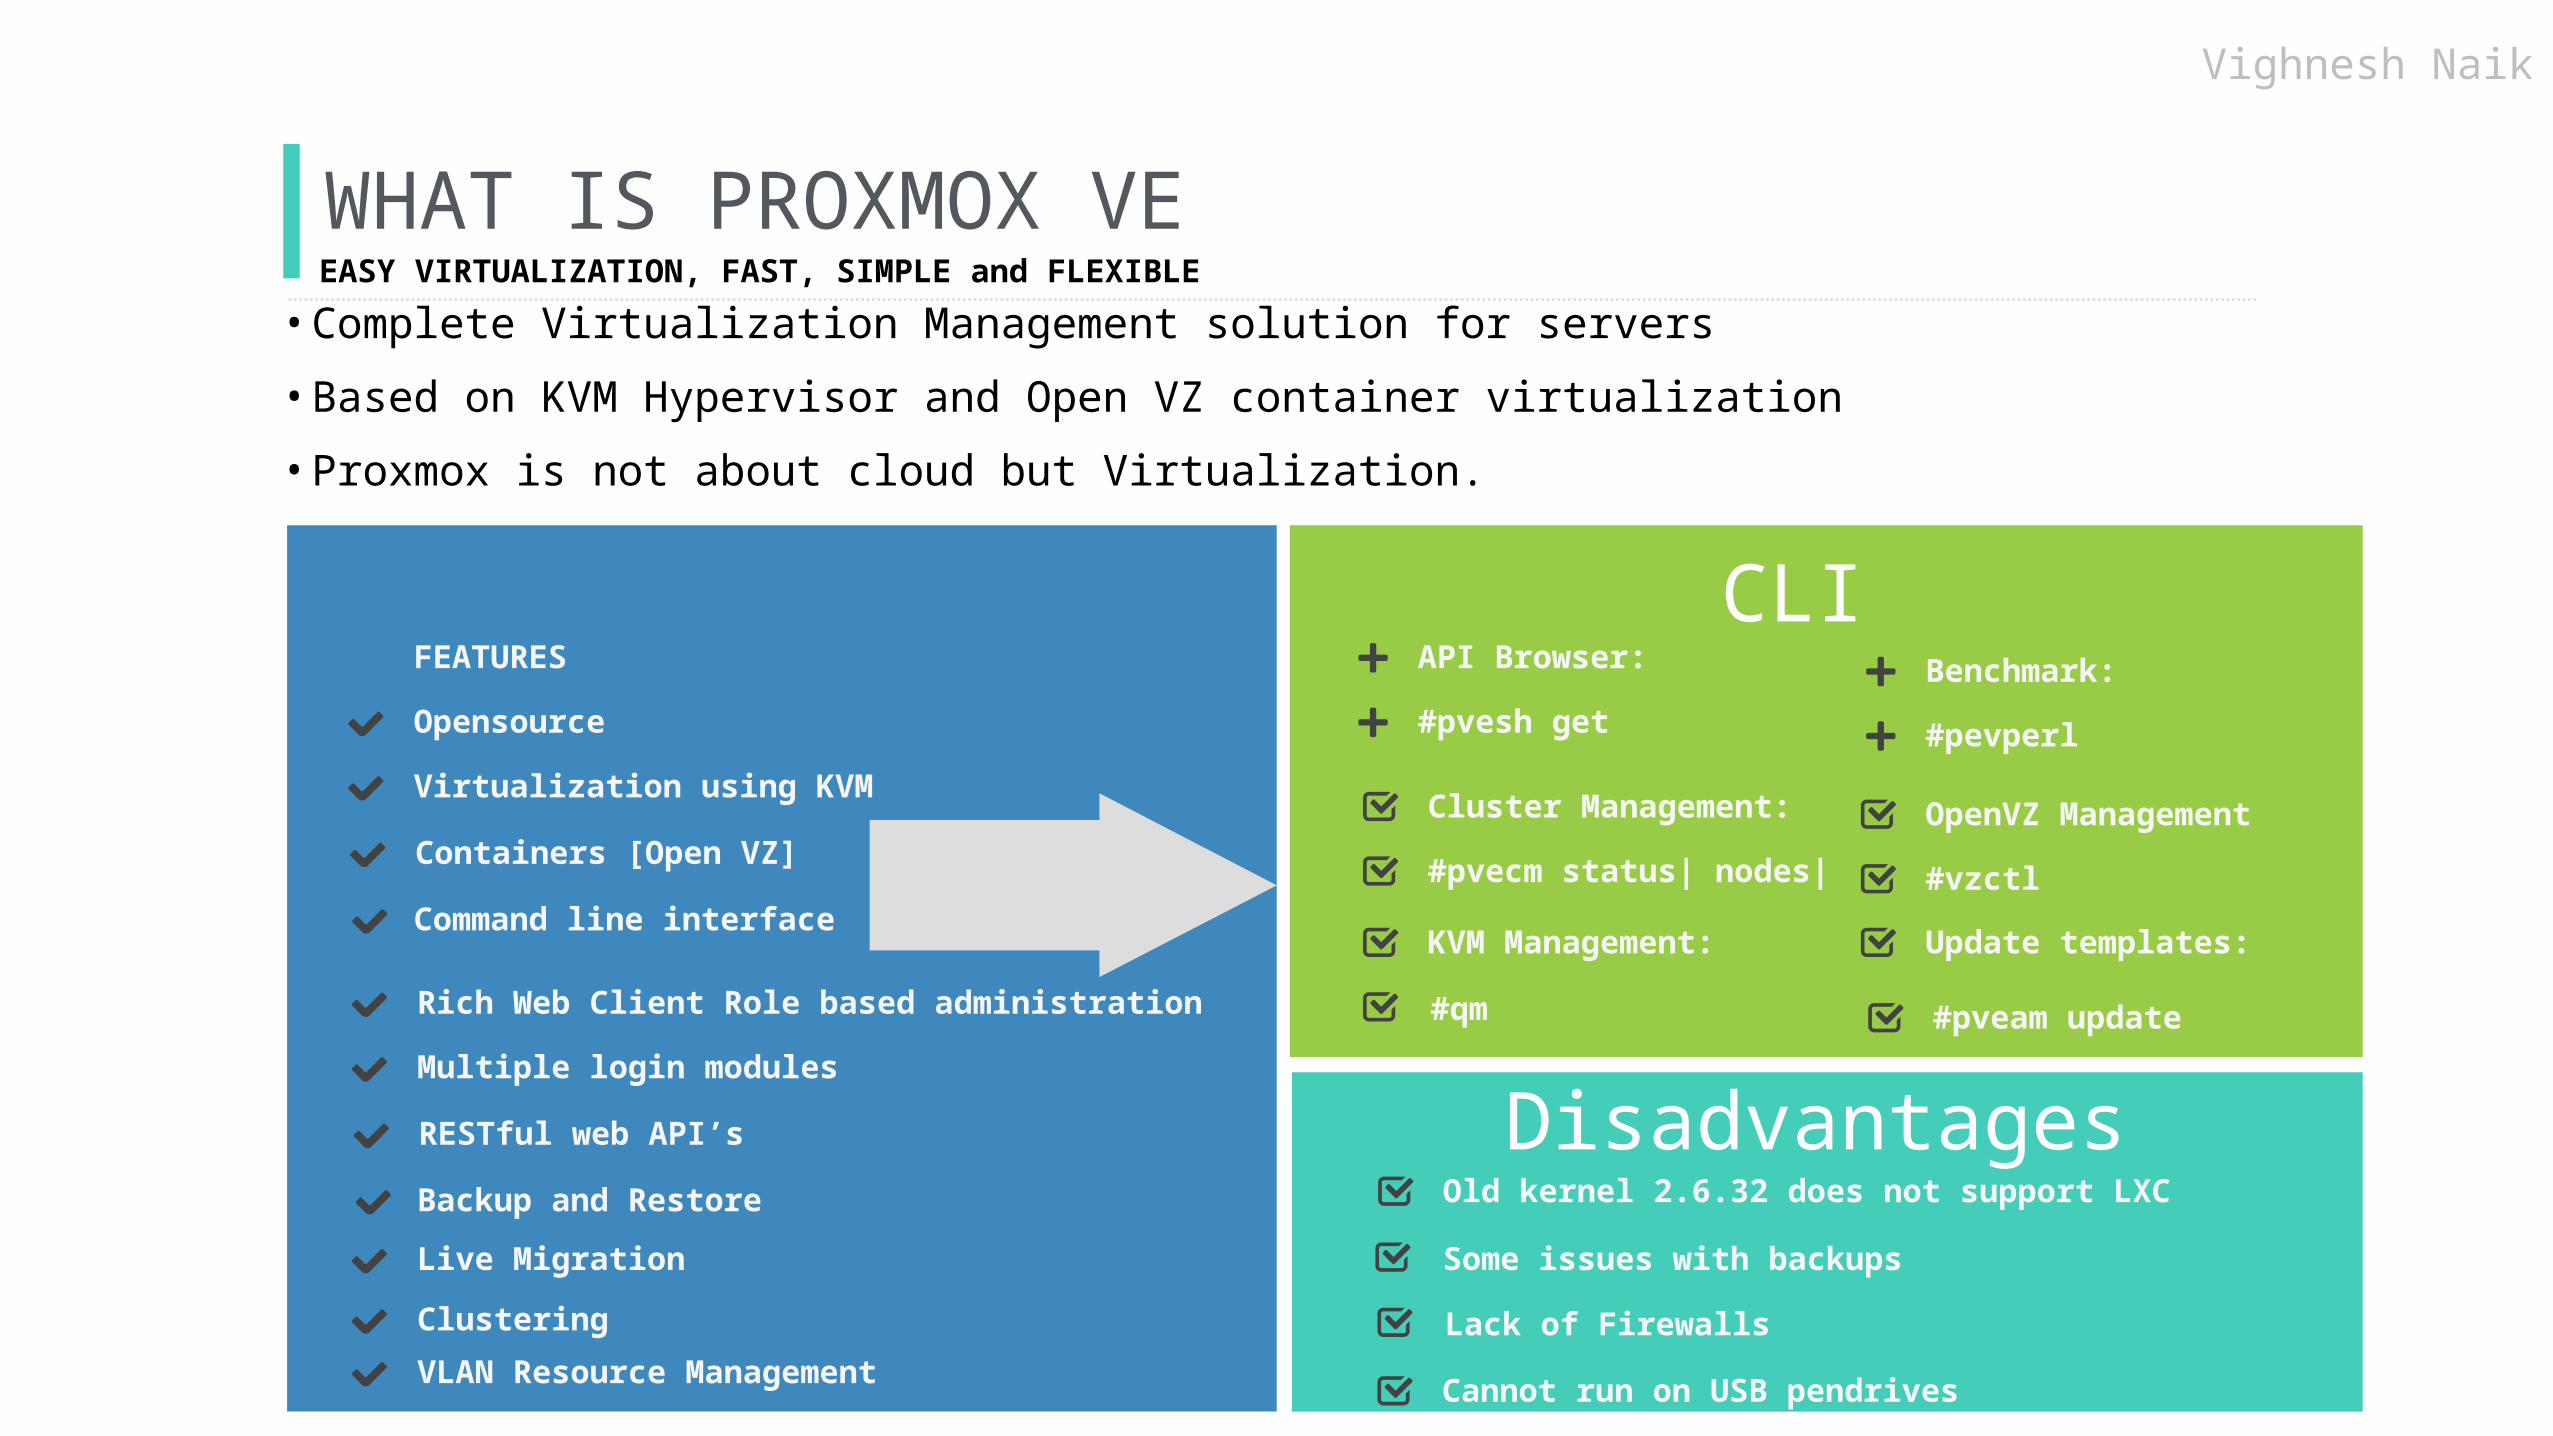
WHAT IS PROXMOX VEEASY VIRTUALIZATION, FAST, SIMPLE and FLEXIBLE
• Complete Virtualization Management solution for servers• Based on KVM Hypervisor and Open VZ container virtualization• Proxmox is not about cloud but Virtualization.
FEATURES
Opensource
Virtualization using KVM
Containers [Open VZ]
Command line interface
API Browser:
#pvesh get
Cluster Management:
#pvecm status| nodes|
Old kernel 2.6.32 does not support LXC
Lack of Firewalls
Cannot run on USB pendrives
Rich Web Client Role based administration
Multiple login modules
RESTful web API’s
Backup and RestoreLive MigrationClusteringVLAN Resource Management
Benchmark:
#pevperl
OpenVZ Management
#vzctl
Update templates:KVM Management:#qm #pveam update
CLI
DisadvantagesSome issues with backups
Vighnesh Naik

PROXMOX VE

WHAT IS NAGIOS CORE
Opensource sytem and network monitoring application
• Monitoring of Network services and host resources• Users can develop their own plug-ins for service checks• Ability to define network host heirarchy or groups• Alert notificationis via e-mail or user defined methods• Web interface for weaving
• Monitor your entire IT infrastructure• Spot problems before they occur• Detect scurity breaches• Plan and budget for IT upgrades• Reduce downtime and business losses• Historical reporting
FEATURES ADVANTAGES
Vighnesh Naik

Nagios

Nagios Walkthrough

THANK YOU
QUESTIONS?

QUESTIONS?


