38
Dashboards & Visualizations: What’s New Nicholas Filippi | Product Management, Splunk Patrick Ogdin | Product Management, Splunk September 2017 | Washington, DC
Dashboards & Visualizations: What’s NewNicholas Filippi | Product Management, SplunkPatrick Ogdin | Product Management, Splunk
September 2017 | Washington, DC
Nicholas Filippi▶︎ Product Management, Splunk▶︎ Responsible for Dashboards & Info
Delivery
Patrick Ogdin▶︎ Product Management, Splunk▶︎ Responsible for Splunk Management
& Deployment
Welcome

During the course of this presentation, we may make forward-looking statements regarding future events or the expected performance of the company. We caution you that such statements reflect our current expectations and estimates based on factors currently known to us and that actual events or results could differ materially. For important factors that may cause actual results to differ from those contained in our forward-looking statements, please review our filings with the SEC.
The forward-looking statements made in this presentation are being made as of the time and date of its live presentation. If reviewed after its live presentation, this presentation may not contain current or accurate information. We do not assume any obligation to update any forward looking statements we may make. In addition, any information about our roadmap outlines our general product direction and is subject to change at any time without notice. It is for informational purposes only and shall not be incorporated into any contract or other commitment. Splunk undertakes no obligation either to develop the features or functionality described or to include any such feature or functionality in a future release.
Splunk, Splunk>, Listen to Your Data, The Engine for Machine Data, Splunk Cloud, Splunk Light and SPL are trademarks and registered trademarks of Splunk Inc. in the United States and other countries. All other brand names, product names, or trademarks belong to their respective owners. © 2017 Splunk Inc. All rights reserved.
Forward-Looking Statements
THIS SLIDE IS REQUIRED FOR ALL 3 PARTY PRESENTATIONS.
DashboardsDrilldown Editor
Event AnnotationsSearchBar Integration

Dashboard Drilldown (Default Behavior)
Default drilldown to search uses the “intentions parser” to construct a best-effort search query
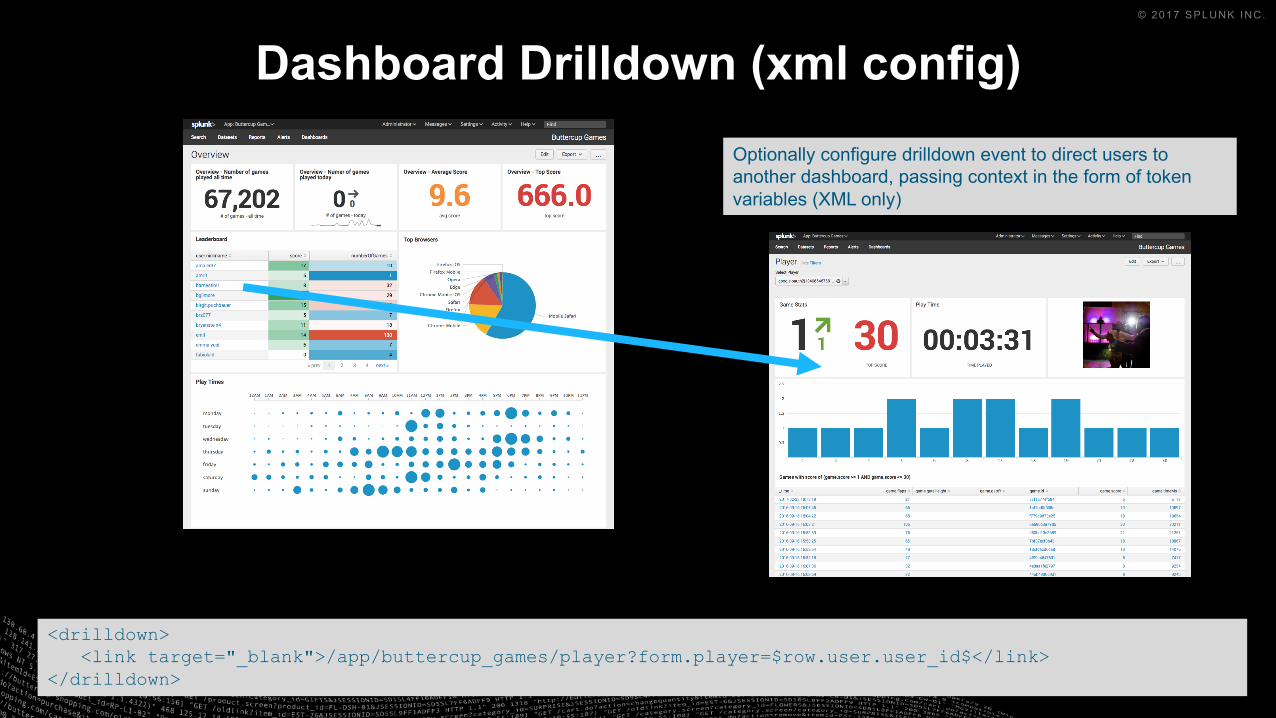
Dashboard Drilldown (xml config)Optionally configure drilldown event to direct users to another dashboard, passing context in the form of token variables (XML only)
<drilldown> <link target="_blank">/app/buttercup_games/player?form.player=$row.user.user_id$</link>
</drilldown>
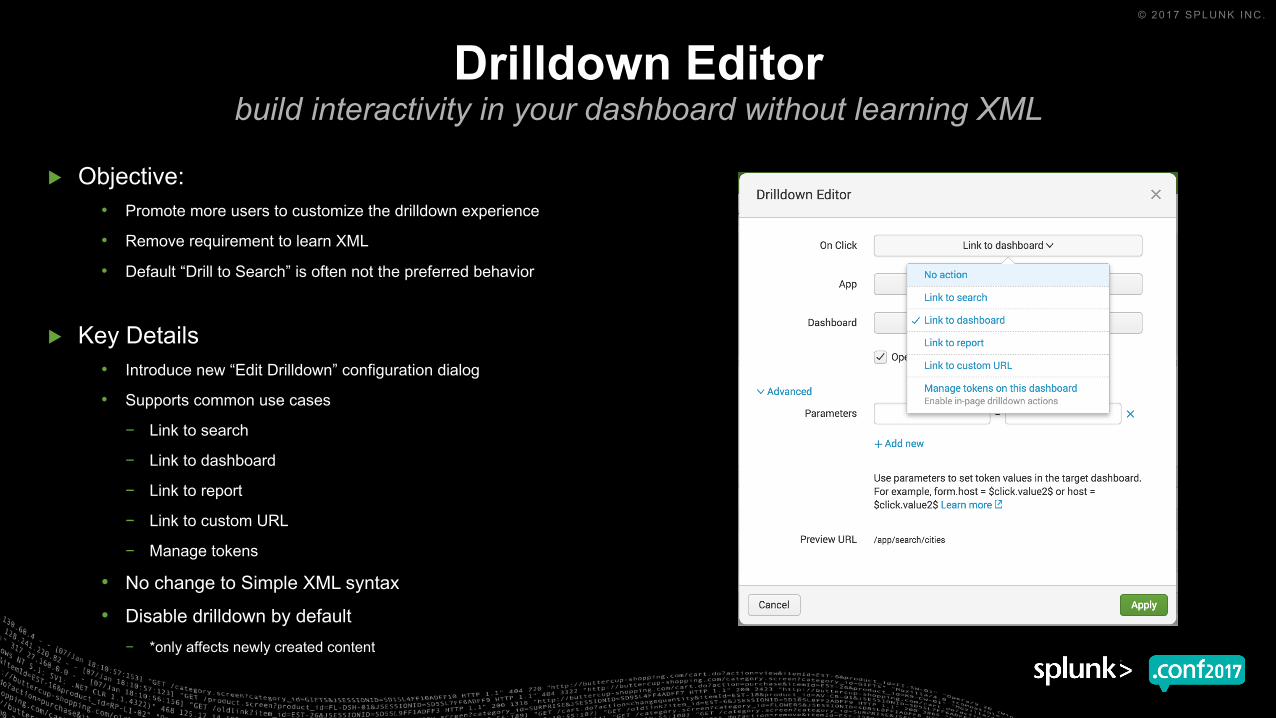
▶ Objective:• Promote more users to customize the drilldown experience
• Remove requirement to learn XML
• Default “Drill to Search” is often not the preferred behavior
▶ Key Details• Introduce new “Edit Drilldown” configuration dialog
• Supports common use cases
− Link to search
− Link to dashboard
− Link to report
− Link to custom URL
− Manage tokens
• No change to Simple XML syntax
• Disable drilldown by default− *only affects newly created content
Drilldown Editorbuild interactivity in your dashboard without learning XML
DemoDrilldown Editor

Drilldown UI Editor – Surface AreaUse Case
1 No action
2 Link to search• Both default (uses intentions parser) and custom search string
3 Link to dashboard• Same/different app context; pass tokens to target dashboard
4 Link to report• Same/different app context
5 Link to custom URL• Pass tokens to target URL
6 In-page interactivity (via token management)• Set/Unset/Eval tokens on the page
7 Conditional field drilldown
8 Multiple Actions
Supp
orte
d vi
a U
I Edi
tor

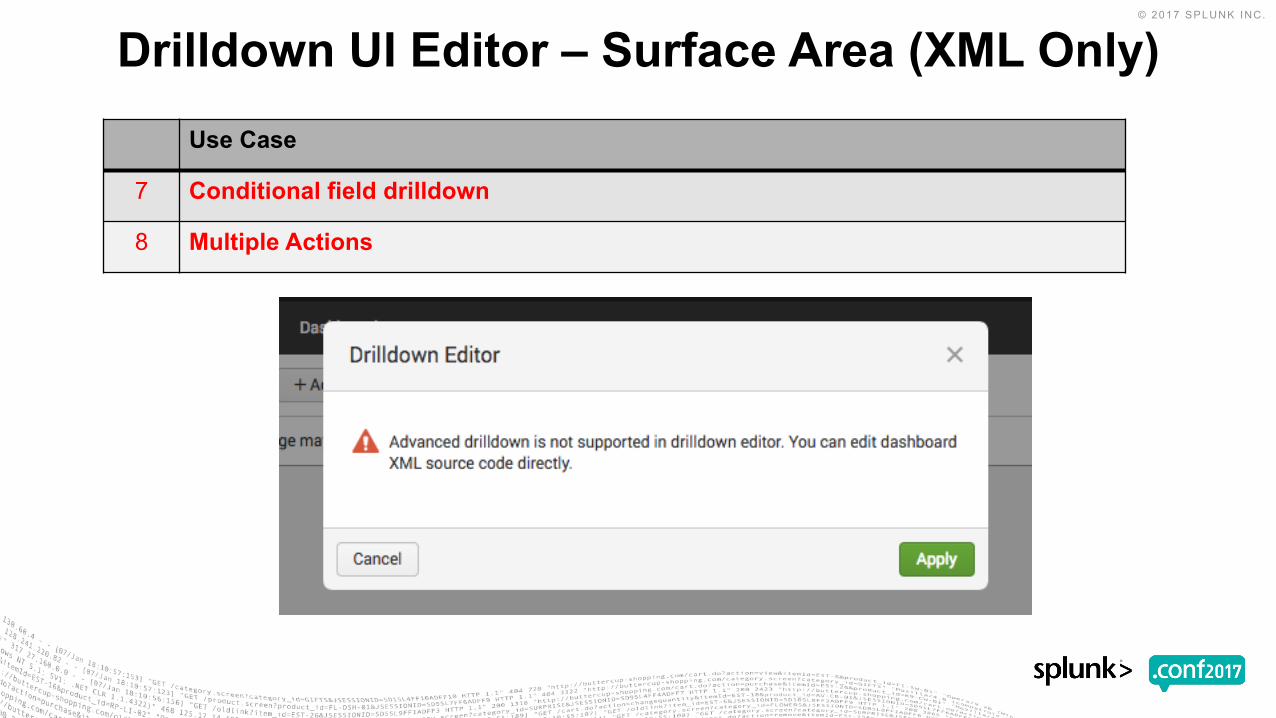
Drilldown UI Editor – Surface Area (XML Only)Use Case
7 Conditional field drilldown
8 Multiple Actions
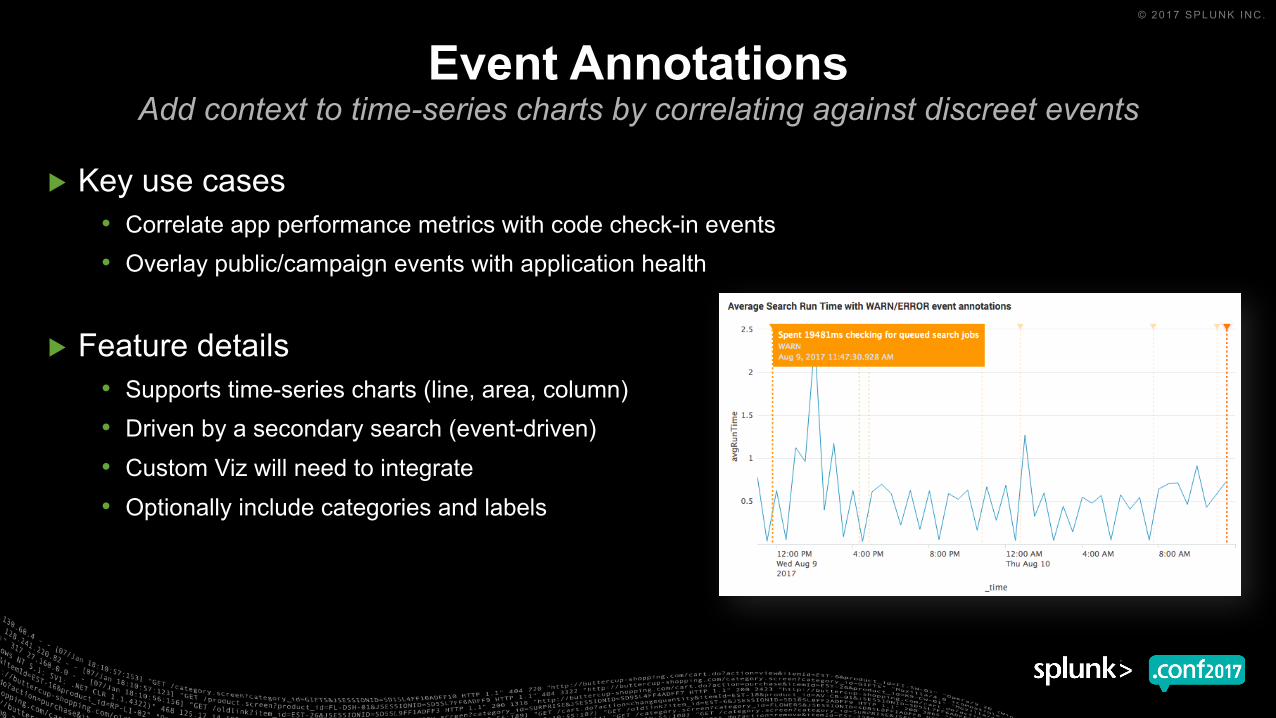
▶ Key use cases• Correlate app performance metrics with code check-in events• Overlay public/campaign events with application health
▶ Feature details• Supports time-series charts (line, area, column)• Driven by a secondary search (event-driven)• Custom Viz will need to integrate• Optionally include categories and labels
Event AnnotationsAdd context to time-series charts by correlating against discreet events

▶ Dashboard XML only▶ Driven by a secondary search
• <search type=“annotation”>
• If <earliest> and <latest> are not specified, then it will use the primary search
▶ Supported fields in search results• _time – required field to overlay on a time-series chart
• annotation_label – optional field for display in the tooltip
• annotation_category – optional field to differentiate types of annotations, by color
• annotation_color – optional field to override color *(recommended to use charting categoryColors instead)
▶ XML charting options• charting.annotation.categoryColors – Override color palette for
annotation categories
Event AnnotationsAdd context to data by correlating discreet events against time-series charts

▶ Integrated SearchBar Component within Dashboards• Add Panel & Edit Search Workflows
▶ Improved Productivity & Consistency
▶ Leverage Functionality• Syntax Highlighting• Keyboard Shortcuts• Compact Search Assistant
Dashboard Search BarImproved search editing experience on dashboards
VisualizationsTrellis Layout
Result TruncationActions for Reports
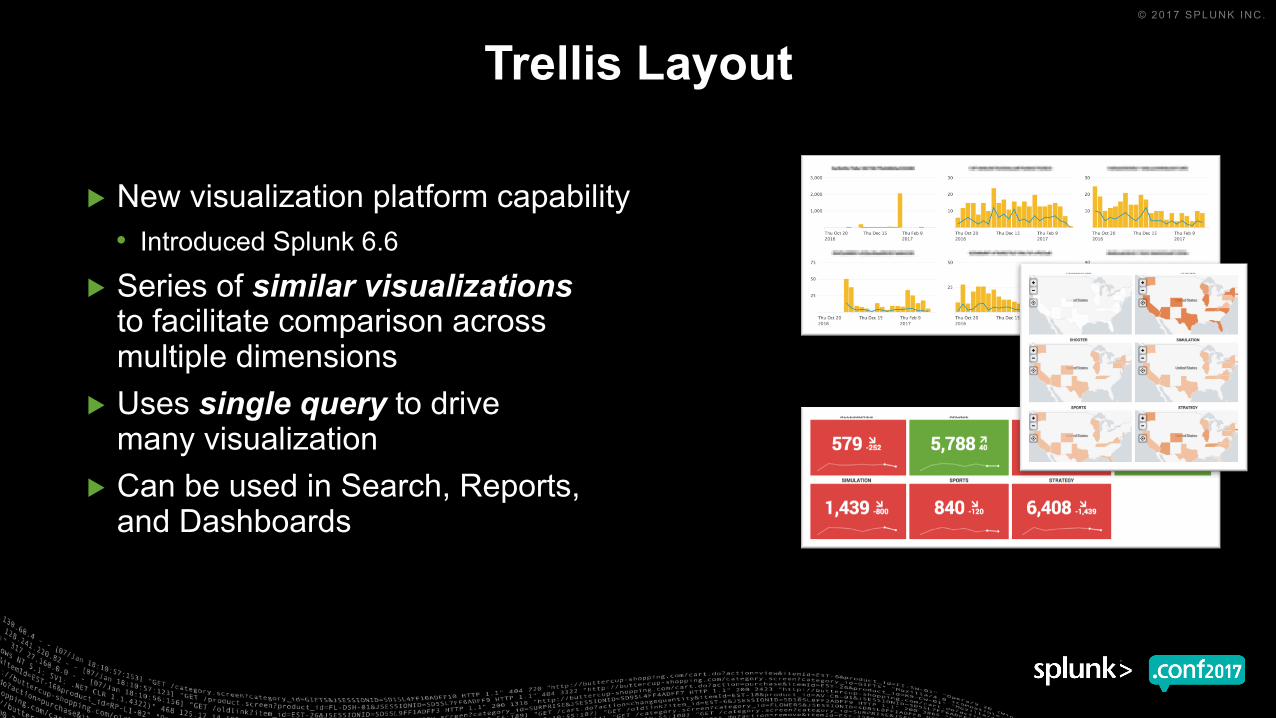
Trellis Layout
▶ New visualization platform capability• Introduced Splunk 6.6
▶ Series of similar visualizations to facilitate comparison across multiple dimensions
▶ Uses single query to drive many visualization
▶ Can be used in Search, Reports, and Dashboards

Before & After
▶ Benefits• Alternative is to use series of similar queries,
which causes unnecessary load on the system• Single visualization might hide relevant outliers
by over-aggregating values• Since values often change over time, Trellis
Layout can dynamically show all values that are present in the selected time range
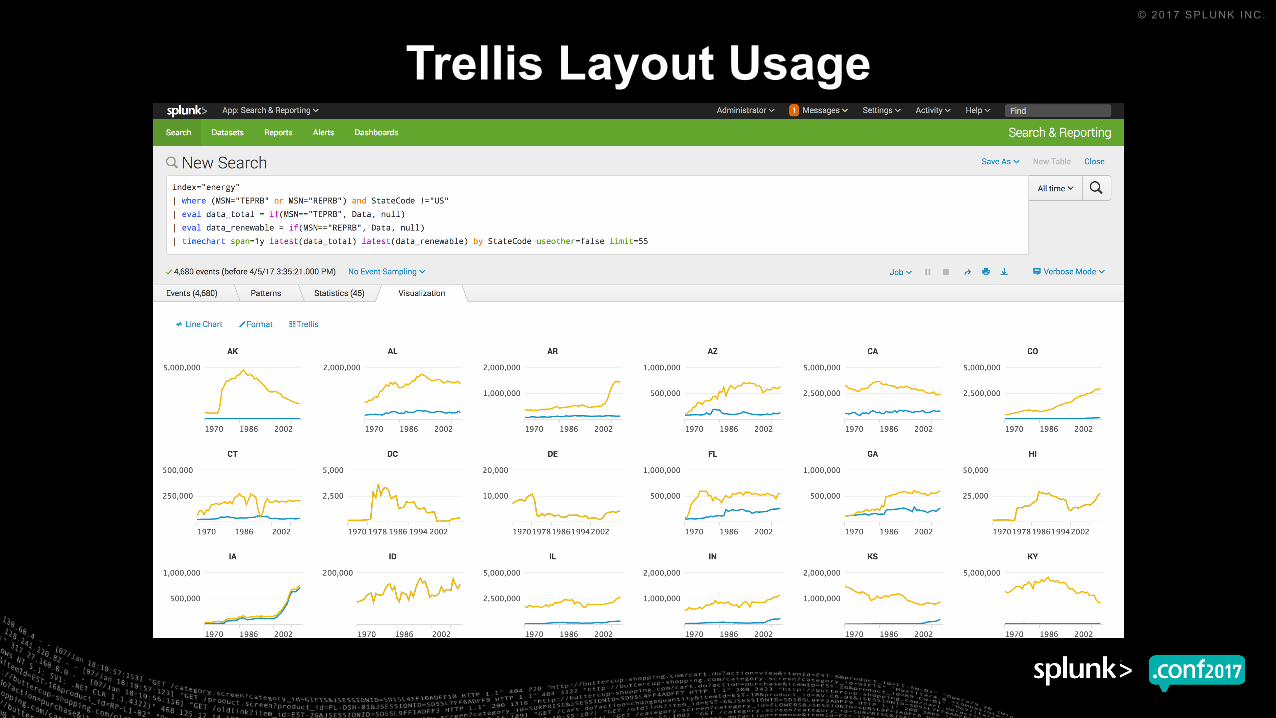
Trellis Layout Usage
DemoTrellis Layout

Result Truncation
▶ Problem• jschart limits set low to avoid performance
problems in browsers due to large result sets in charts
• Limits were not configurable
▶ Solution• Using combination of settings in web.conf
• jschart_truncation_limit• jschart_series_limit• jschart_results_limit
• Customer/browser defined limits• CAUTION: Browser Crashing Ahead
▶ Bonus: Updated Charting Libraries

Actions For Reports
▶ Follow-on to Custom Alert Actions from Splunk 6.3
▶ Installed and enabled Alert Actions are now available to users for Alerts AND Reports
▶ Solves the “always alert” problem

© 2017 SPLUNK INC.
Don't forget to rate this session in the .conf2017 mobile app
Thank You

Appendix A: Drilldown Editor

Drilldown UI Editor – Surface AreaUse Case
1 No action
2 Link to search• Both default (uses intentions parser) and custom search string
3 Link to dashboard• Same/different app context; pass tokens to target dashboard
4 Link to report• Same/different app context
5 Link to custom URL• Pass tokens to target URL
6 In-page interactivity (via token management)• Set/Unset/Eval tokens on the page
7 Conditional field drilldown
8 Multiple Actions
Supp
orte
d vi
a U
I Ed
itor
Drilldown UI Editor – Surface Area (XML Only)Use Case
7 Conditional field drilldown
8 Multiple Actions
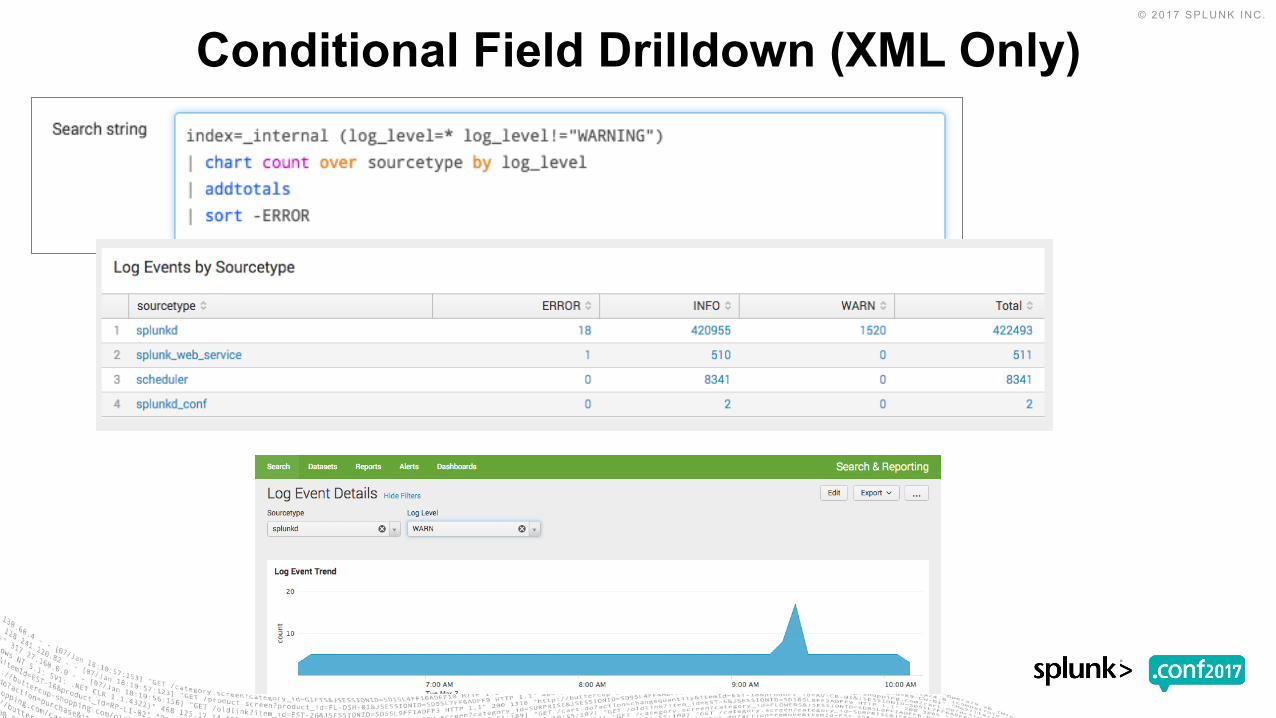
Conditional Field Drilldown (XML Only)

Conditional Field Drilldown (XML Only)
<drilldown> <link target="_blank">/app/search/log_event_details?form.sourcetype=$row.sourcetype$&form.log_level=$click.name2$</link>
</drilldown>
Happy Case!
If user clicks on “18”,then direct user to “Log Events Details”
dashboard and pass sourcetype=‘splunkd’ & log_level=“ERROR”

Conditional Field Drilldown (XML Only)Edge Case!
If user clicks on “splunkd”,then direct to “Log Event Details” and pass sourcetype=‘splunkd’ &
log_level=‘sourcetype’If user clicks on “422493”,
then direct to “Log Event Details” and pass sourcetype=’splunkd’ & log_level=‘Total’
Current Behavior
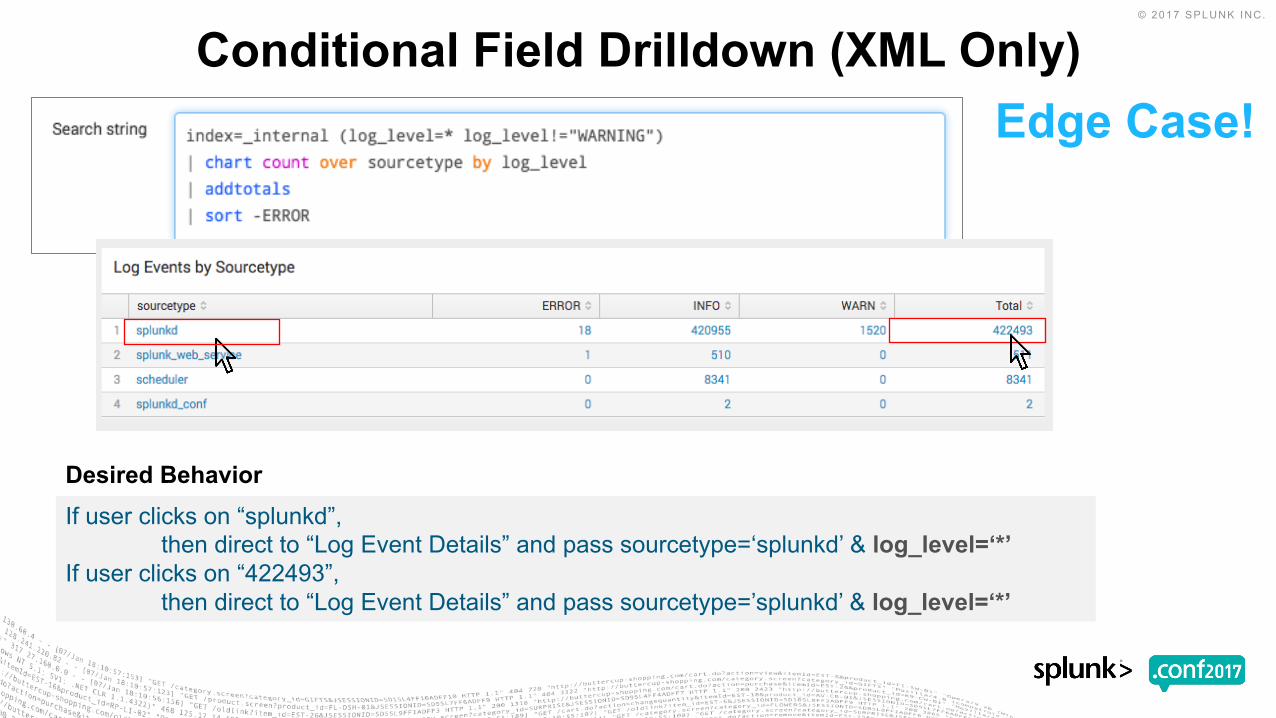
Conditional Field Drilldown (XML Only)Edge Case!
If user clicks on “splunkd”,then direct to “Log Event Details” and pass sourcetype=‘splunkd’ & log_level=‘*’
If user clicks on “422493”,then direct to “Log Event Details” and pass sourcetype=’splunkd’ & log_level=‘*’
Desired Behavior
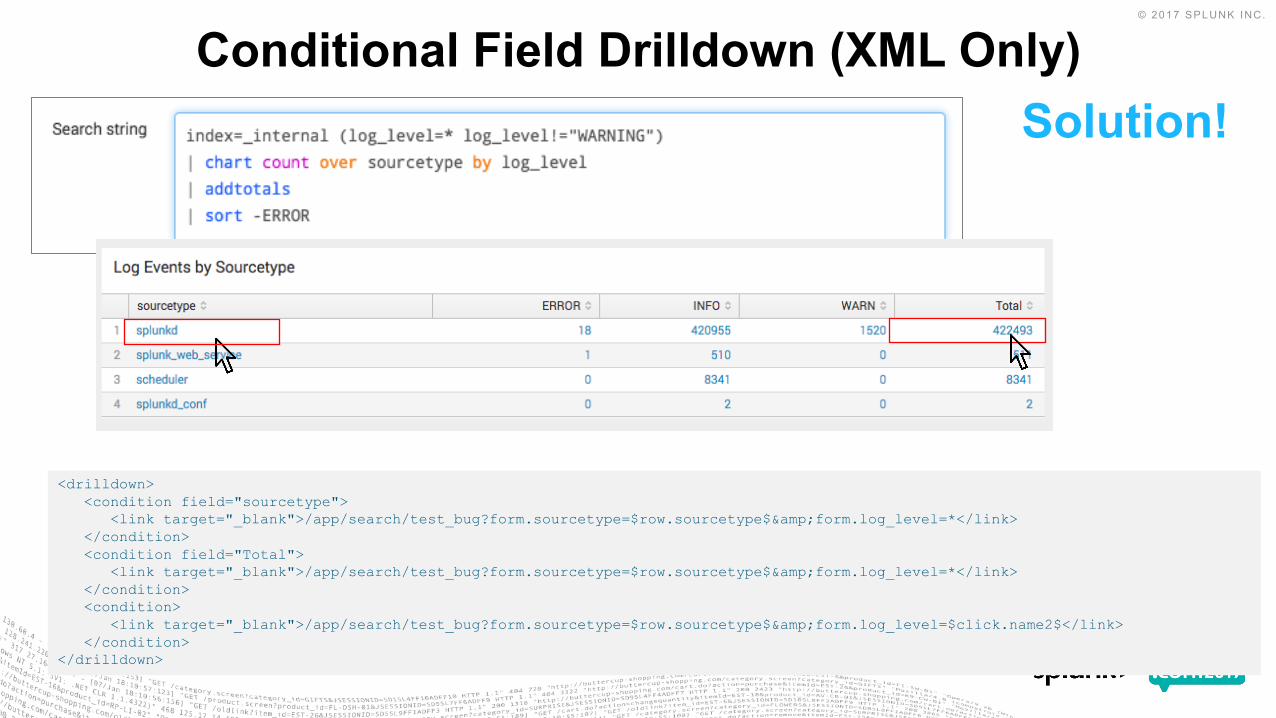
Conditional Field Drilldown (XML Only)Solution!
<drilldown> <condition field="sourcetype">
<link target="_blank">/app/search/test_bug?form.sourcetype=$row.sourcetype$&form.log_level=*</link> </condition> <condition field="Total">
<link target="_blank">/app/search/test_bug?form.sourcetype=$row.sourcetype$&form.log_level=*</link> </condition> <condition>
<link target="_blank">/app/search/test_bug?form.sourcetype=$row.sourcetype$&form.log_level=$click.name2$</link> </condition>
</drilldown>
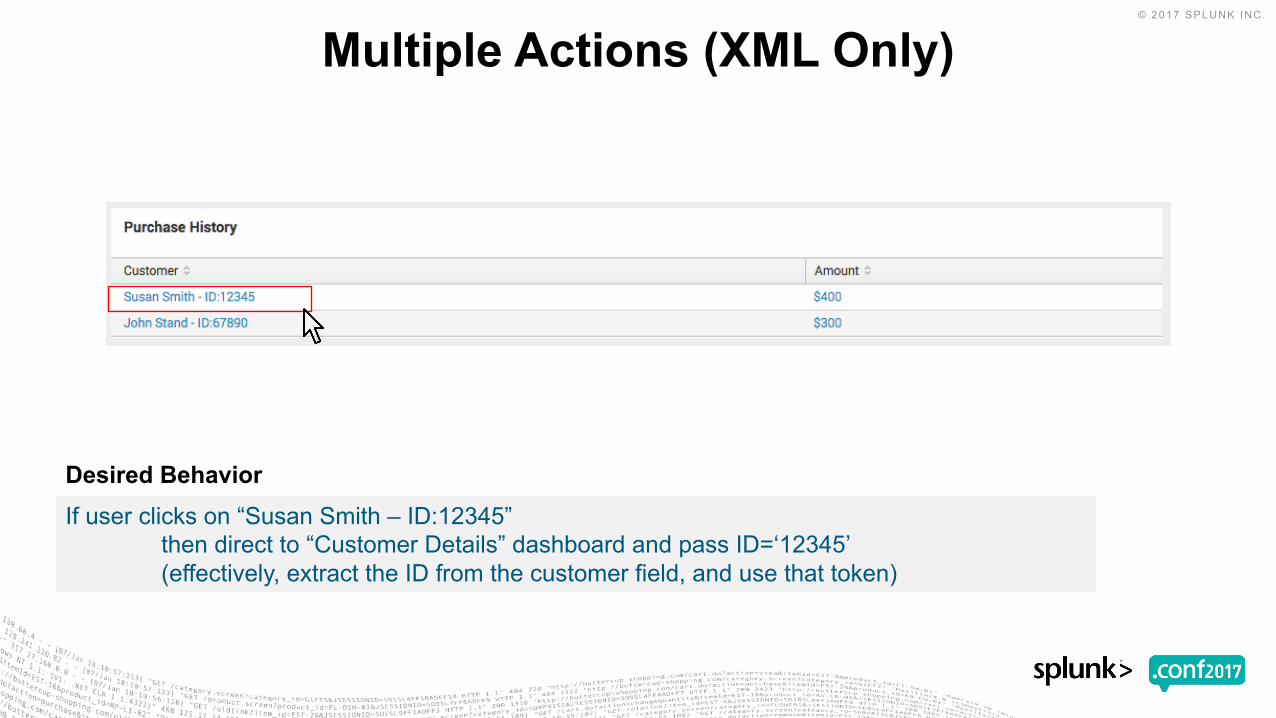
Multiple Actions (XML Only)
If user clicks on “Susan Smith – ID:12345”then direct to “Customer Details” dashboard and pass ID=‘12345’(effectively, extract the ID from the customer field, and use that token)
Desired Behavior

Multiple Actions (XML Only)
<drilldown><eval token="customer_id">substr($row.Customer$, -5)</eval><link target="_blank">customer_details?form.customer_id=$customer_id$</link>
</drilldown>
Appendix B: Event Annotations
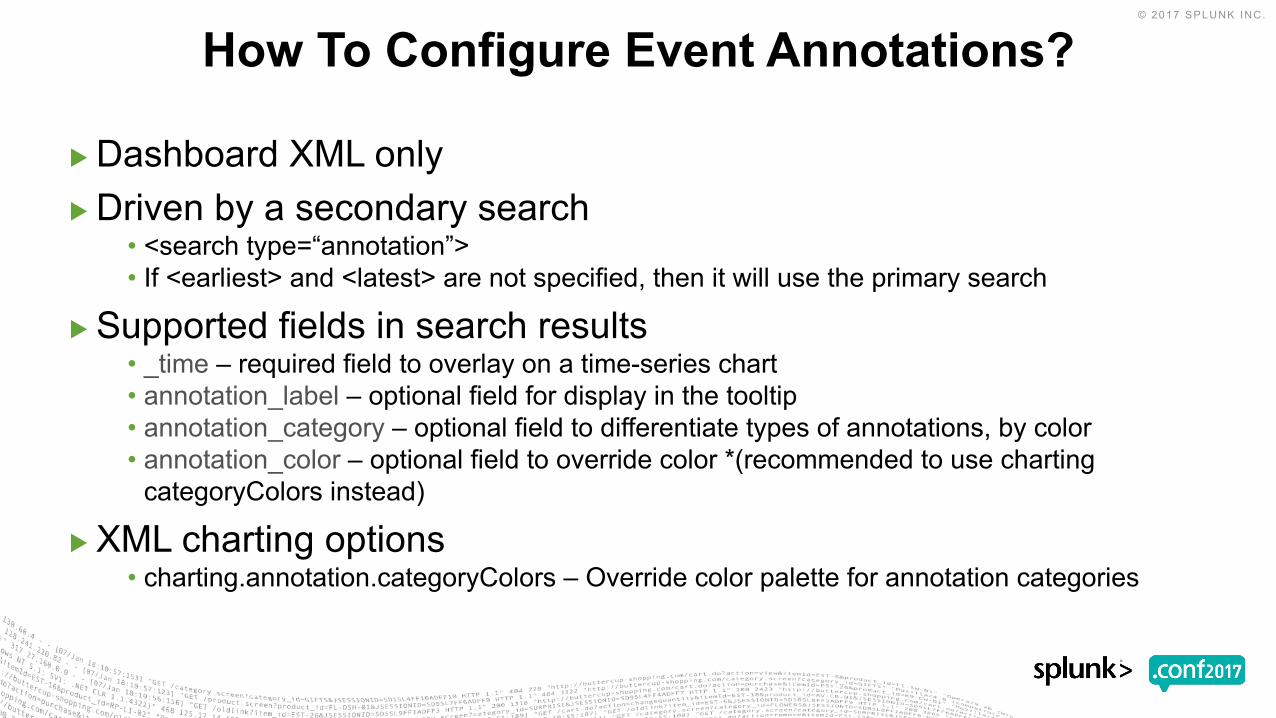
How To Configure Event Annotations?
▶︎ Dashboard XML only▶︎ Driven by a secondary search
• <search type=“annotation”>• If <earliest> and <latest> are not specified, then it will use the primary search
▶︎ Supported fields in search results• _time – required field to overlay on a time-series chart• annotation_label – optional field for display in the tooltip• annotation_category – optional field to differentiate types of annotations, by color• annotation_color – optional field to override color *(recommended to use charting
categoryColors instead)
▶︎ XML charting options• charting.annotation.categoryColors – Override color palette for annotation categories

Scenario #1: Basic Overlay w/ Event Annotations
<chart> <title>Correlate Search Workload with User Logins</title>
<!-- Base search that drives the visualization --><search>
<query>index=_audit action=search result_count="*" | timechart count</query> <earliest>-24h@h</earliest> <latest>now</latest>
</search>
<!-- Secondary search that drives the annotations --><search type="annotation">
<query>index=_audit action="login attempt" | eval annotation_label = "login by " . user</query>
<earliest>-24h@h</earliest> <latest>now</latest>
</search>
<option name="charting.chart">line</option> <option name="charting.drilldown">none</option> <option name="charting.legend.placement">none</option> <option name="charting.lineWidth">1</option>
</chart>
Example: Correlate search workload with user activity. Set label to include the login username.

Scenario #2: Multiple Categories of Event Annotations
<chart> <title>Average Search Run Time with WARN/ERROR event annotations</title>
<!-- Base search that drives the visualization --><search>
<query>index=_audit action=search result_count="*" | timechart avg(total_run_time) as avgRunTime</query>
<earliest>-24h@h</earliest> <latest>now</latest>
</search>
<!-- Secondary search that drives the annotations --><search type="annotation">
<query>index=_internal (log_level="WARN" OR log_level="ERROR") | eval annotation_label = message| evalannotation_category = log_level</query>
<earliest>-24h@h</earliest> <latest>now</latest>
</search>
<!-- Customize the event annotation colors based on category name --><option name="charting.annotation.categoryColors">{"ERROR":"0xff3300","WARN":"0xffcc00"}</option>
<option name="charting.chart">line</option> <option name="charting.drilldown">none</option> <option name="charting.legend.placement">none</option> <option name="charting.lineWidth">1</option> <option name="charting.seriesColors">[0x339933]</option>
</chart>
Example: Correlate search run time with various warning and error log events. Use category to differentiate log level, and label to display the log message.

▶︎ Currently, integrated with dashboard XML only▶︎ Does not yet support “user” annotations
• Search-driven annotations only
▶︎ Supports discreet events• Does not support “duration” event (ex. maintenance windows, etc)
▶︎ Performance• Does run an additional search on dashboard load time
▶︎ Result limit of 1000
Important Details

End End

© 2017 SPLUNK INC.
Don't forget to rate this session in the .conf2017 mobile app
Thank You


