Data Analysis on Fiscal Year 2019 EB-5 Visa Number Usage & Estimated Visa Waiting Lines Highlights from the Guest of Honor Presentation by the U.S. Department of State at the 9 th Annual IIUSA EB-5 Industry Forum By Lee Y. Li, Policy Analyst, IIUSA November 11, 2019 IIUSA was honored to welcome Mr. Charlie Oppenheim, Chief of Immigrant Visa Control & Reporting Division at U.S. Department of State, as our Guest of Honor speaker for last month’s EB-5 Industry Forum in Seattle, WA. This was the 5 th year in a row Mr. Oppenheim shared his insights at IIUSA’s annual event. Not only did Mr. Oppenheim provided the latest statistics on EB-5 visa number use in fiscal year (FY) 2019, but more importantly he also shared critical updates on EB-5 visa waiting lines, comments on the current EB-5 visa backlog, and his predictions on future EB-5 final action date movement. The below report includes a detailed recap and additional analysis of Mr. Oppenheim’s presentation during the event. Additionally, we also dive into the extra statistics that Mr. Oppenheim shared with IIUSA in follow-up dialogue after the conference. IIUSA would like to extend a special thank you to Mr. Oppenheim for providing this firsthand EB-5 visa data and for sharing his informative insights on EB-5 waiting lines. You can download Mr. Oppenheim’s full presentation slides from IIUSA’s website at here. It’s important to note that all the statistics at this report should be considered as preliminary until the Department of State publishes its annual Report of the Visa Office 2019.
Transcript
Data Analysis on Fiscal Year 2019 EB-5 Visa Number Usage & Estimated Visa Waiting Lines
Highlights from the Guest of Honor Presentation by the U.S. Department of State at the 9th Annual IIUSA EB-5 Industry Forum
By Lee Y. Li, Policy Analyst, IIUSA
November 11, 2019
IIUSA was honored to welcome Mr. Charlie Oppenheim, Chief of Immigrant Visa Control & Reporting
Division at U.S. Department of State, as our Guest of Honor speaker for last month’s EB-5 Industry
Forum in Seattle, WA. This was the 5th year in a row Mr. Oppenheim shared his insights at IIUSA’s annual
event. Not only did Mr. Oppenheim provided the latest statistics on EB-5 visa number use in fiscal year
(FY) 2019, but more importantly he also shared critical updates on EB-5 visa waiting lines, comments on
the current EB-5 visa backlog, and his predictions on future EB-5 final action date movement.
The below report includes a detailed recap and additional analysis of Mr. Oppenheim’s presentation
during the event. Additionally, we also dive into the extra statistics that Mr. Oppenheim shared with
IIUSA in follow-up dialogue after the conference.
IIUSA would like to extend a special thank you to Mr. Oppenheim for providing this firsthand EB-5 visa
data and for sharing his informative insights on EB-5 waiting lines.
You can download Mr. Oppenheim’s full presentation slides from IIUSA’s website at here.
It’s important to note that all the statistics at this report should be considered as preliminary until the
Department of State publishes its annual Report of the Visa Office 2019.
The chart above was prepared by IIUSA based on the FY2019 EB-5 visa statistics provided by Mr.
Oppenheim. A total of 9,468 EB-5 visa numbers were used in FY2019, down slightly by 1.4% from
FY2018. The data also indicated that the EB-5 number use in FY2018 and FY2019 did not reach its annual
numerical limit, which is approximately 9,940 visas per fiscal year.1 During follow-up dialogue with
IIUSA, Mr. Oppenheim explained that the determination of final action dates on the August and
September Visa Bulletin, which has a direct impact on the annual total visa number use, depend on 1)
how many visa numbers were still available, which requires considerations of several of reasonable
estimates regarding visa number use in past month(s), visa number use in the current and future
months, unused and return visa numbers; and 2) estimates of additional visa demand from USCIS based
on the final action date movements.
In reality, it’s practically impossible for the actual visa number use to be the same as its annual
numerical limit, not only because the final action dates that control monthly visa allocations have to be
determined based on the best available historical data while the actual number use can be different
from the data patterns in previous month(s), but also the visa number which have been provided for use
during a particular month can be returned because applicants either failed to appear for their scheduled
1 According to the Immigration and Nationality Act (INA), EB-5 is entitled to up to 7.1%, or approximately 9,940 visas, of the annual 140,000 employment-based immigrant visas. 8 U.S.C. 1153 (b)(5)(A).
3
interviews, or were found ineligible for some reason and may then overcome that ineligibility in a later
month, according to Mr. Oppenheim. Despite the complexity of the visa allocation process, the gap
between the actual EB-5 number used and its annual numerical limit has been less than 5% in the last
five fiscal years.2
EB-5 Visa Use: China vs. Rest of World.
EB-5 applicants from China accounted for 46%, or 4,326, EB-5 visa numbers used in FY2019, essentially
unchanged from the previous fiscal year. Because of the per-country caps, only the otherwise unused
EB-5 visas in a fiscal year were allocated to the applicants from mainland China,3 although these Chinese
visa applicants have an earlier priority date and have been waiting for their visa availability for up to five
(5) years.4 With the surge of EB-5 visa demands from other countries outside China in recent fiscal
2 The margins between the number of actual EB-5 visa use and its annual limit (9,940) for the last five fiscal years were: FY2015: -1.77%; FY2016: +0.07%; FY2017: +1.51%; FY2018: -3.40%; and FY2019: -4.76%. 3 The per-country caps on the INA Section 203 requires that no signal foreign state can receive more than 7% of the total immigrant visas (green cards) issued in a given fiscal year, unless these green cards would otherwise go unused. 4 According to the November Visa Bulletin, the Final Action Date for Chinese EB-5 visa applicants is November 1, 2014.
4
years,5 the number of otherwise unused EB-5 visas has become increasingly smaller, hence less EB-5 visa
numbers in FY2018 and FY2019 were available to the Chinese applicants waiting at NVC.
EB-5 Visa Use: Top Countries of Current Interest.
The total number of EB-5 visa used by applicants from the top countries of current interest in FY2019
include:
• Brazil: 493 visas (increase of 27% from FY2018);
• India: 759 visas (increase of 30% from FY2018);
• South Korea: 695 visas (increase of 31% from FY2018);
• Taiwan: 427 visas (decrease of 6% from FY2018);
• Vietnam: 716 visas (increase of 3% from FY2018);
5 More details can be found on IIUSA data report: Analyzing Form I-526 Statistics by Investor’s Country of Chargeability for Fiscal Year 2017: What is New and What it Tells Us. https://iiusa.org/blog/wp-content/uploads/2018/11/Analyzing-I-526-Data-for-FY2017-Lee-Li-IIUSA-FINAL.pdf
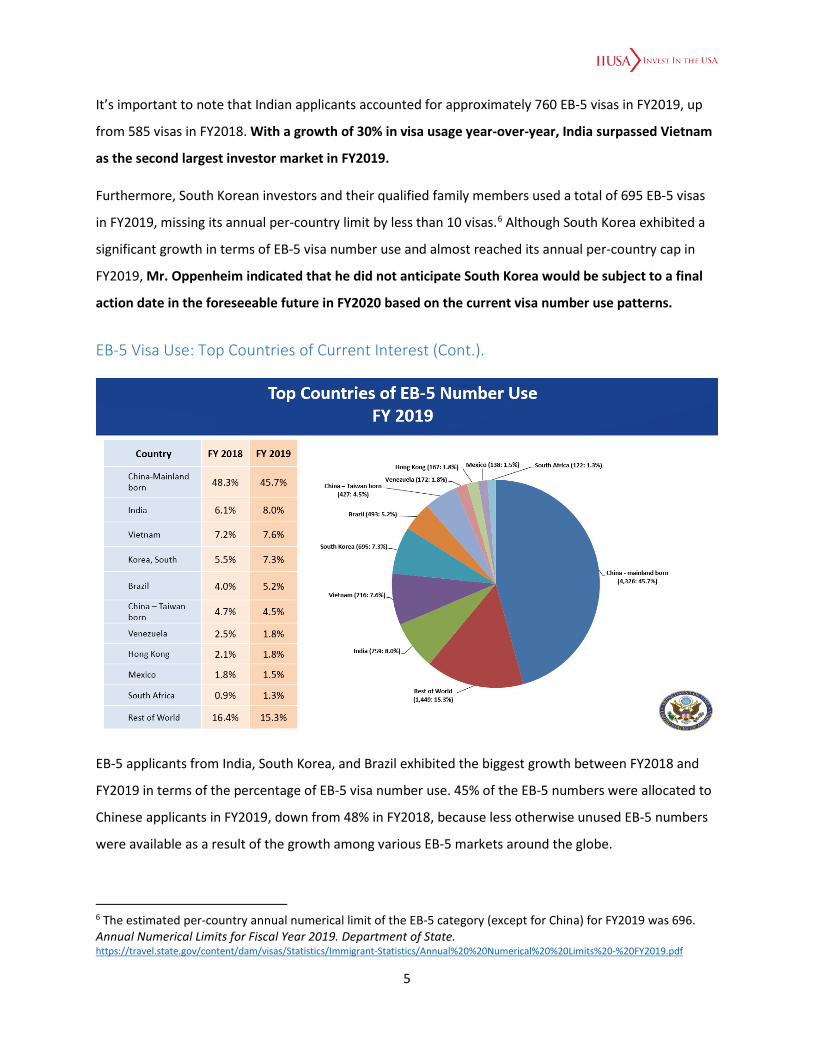
It’s important to note that Indian applicants accounted for approximately 760 EB-5 visas in FY2019, up
from 585 visas in FY2018. With a growth of 30% in visa usage year-over-year, India surpassed Vietnam
as the second largest investor market in FY2019.
Furthermore, South Korean investors and their qualified family members used a total of 695 EB-5 visas
in FY2019, missing its annual per-country limit by less than 10 visas.6 Although South Korea exhibited a
significant growth in terms of EB-5 visa number use and almost reached its annual per-country cap in
FY2019, Mr. Oppenheim indicated that he did not anticipate South Korea would be subject to a final
action date in the foreseeable future in FY2020 based on the current visa number use patterns.
EB-5 Visa Use: Top Countries of Current Interest (Cont.).
EB-5 applicants from India, South Korea, and Brazil exhibited the biggest growth between FY2018 and
FY2019 in terms of the percentage of EB-5 visa number use. 45% of the EB-5 numbers were allocated to
Chinese applicants in FY2019, down from 48% in FY2018, because less otherwise unused EB-5 numbers
were available as a result of the growth among various EB-5 markets around the globe.
6 The estimated per-country annual numerical limit of the EB-5 category (except for China) for FY2019 was 696. Annual Numerical Limits for Fiscal Year 2019. Department of State. https://travel.state.gov/content/dam/visas/Statistics/Immigrant-Statistics/Annual%20%20Numerical%20%20Limits%20-%20FY2019.pdf
EB-5 Visa Use: Consular Processing vs. Adjustment of Status.
The above are additional statistics which Mr. Oppenheim provided to IIUSA after the conference
regarding the EB-5 visa number use by consular processing (“CP”) through the Department of State
versus adjustment of status (“AOS”) thought USCIS in FY2019.
In particular, 43% of the Brazilian EB-5 applicants obtained their lawful permanent residency in FY2019
through AOS, meaning these investors and their family members were already legally present in the U.S.
when they applied for their green cards. Additionally, AOS accounted for 34% of the EB-5 numbers that
were used by Indian applicants in FY2019, considerably higher than the worldwide average of 17%.
EB-5 Visa Use: Principal Investors vs. Family Derivatives.
7
As a follow-up with IIUSA, Mr. Oppenheim shared that, although the average percentage of EB-5
principal investors in the FY2019 EB-5 number use has “slight variations” from the previous year’s data
(see the chart on page 6), the variations are not statistically significant.
Based on the FY2018 statistics, each EB-5 investor from India would account for 2.4 visas, the lowest
percentage of principal investor in visa number use among the biggest EB-5 markets; while 3.8 EB-5
visas were expected to be used by each Vietnamese EB-5 investor. On average, each I-526 petitioner
would result in the use of three (3) EB-5 visa numbers.
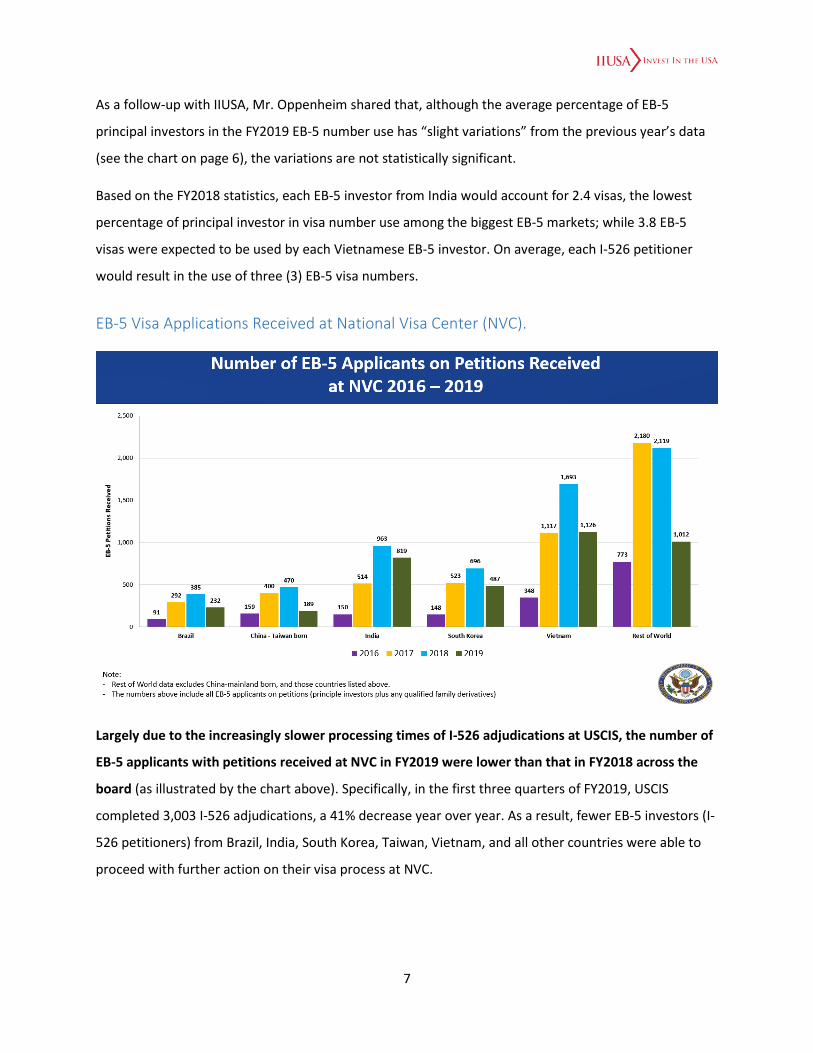
EB-5 Visa Applications Received at National Visa Center (NVC).
Largely due to the increasingly slower processing times of I-526 adjudications at USCIS, the number of
EB-5 applicants with petitions received at NVC in FY2019 were lower than that in FY2018 across the
board (as illustrated by the chart above). Specifically, in the first three quarters of FY2019, USCIS
completed 3,003 I-526 adjudications, a 41% decrease year over year. As a result, fewer EB-5 investors (I-
526 petitioners) from Brazil, India, South Korea, Taiwan, Vietnam, and all other countries were able to
proceed with further action on their visa process at NVC.
8
EB-5 Visa Waiting Lines at NVC and USCIS (DOS Estimated).
According to Mr. Oppenheim, the estimated EB-5 visa queue (as of October 1st 2019) consists of
70,198 applicants with petitions on file (including principal investors and qualified family members). In
particular, a total of 35,264 visa applicants from China were waiting at NVC for their visa availability;
while Mr. Oppenheim estimated that the pending I-526 cases at USCIS could generate 13,325 visa
applicants from China when their I-526 petitions are approved by IPO.
Comparing to the data one year ago, IIUSA’s analysis found that the actual number of EB-5 visa
applicants at NVC increased by 6% (from 36,839 in October 2018 to 39,187 in 2019), while the estimated
number EB-5 applicants with petitions on file at USCIS declined by 4% (from 32,221 to 31,011) as of
October 2019.7 The increase in the visa applicants pending at NVC could be due to the fact that an
increasingly larger number of EB-5 visa applicants from China, India, and Vietnam (the three countries
that are currently facing the visa backlog issue) are awaiting their visa number availability at NVC. The
data indicated that more and more investors and families are affected by the current visa backlog issue.
7 The 2018 statistics is based on Mr. Oppenheim’s presentation at the 2018 AILA/IIUSA EB-5 Industry Forum.
9
Regarding the 4% year-over-year decline in Mr. Oppenheim’s estimates on the number of EB-5
applicants that could be generated by the I-526 petitions that were pending at USCIS, the author
suspects that the decline could be attributed to a combination of different factors, including:
• The decline in I-526 petition filing in FY2019. During the first three quarters in FY2019, the
number of new I-526 petitions filed to USCIS was down by 41% year-over-year.8 Despite the
fact that USCIS only completed 4,127 I-526 adjudications between October and June 2019 (a
drop of 62% year-over-year), the number of I-526 petitions pending at USCIS as of June 2019
was reduced by 9.2% from October 2018.9 With fewer number of I-526 petitions pending at
USCIS, the estimated number of future EB-5 visa applicants with an I-526 petition on file at
USCIS would be smaller.
• Lower I-526 approval rates. The average I-526 approval rate in Q3 FY2019 was only 58%, the
lowest level in the last 14 years.10 Hypothetically, with a lower I-526 approval rate, there will be
a fewer approved EB-5 petitions from USCIS that would require a visa number, hence the
estimates of EB-5 applicants with petitions on file at USCIS could be lower.
• Higher percentage of principal investors in EB-5 visa number use? Hypothetically, if family
derivatives no longer account for 2 additional visas per EB-5 investment, the visa waiting lines
could be lower. Although the FY2019 data is not available yet to confirm or invalidate this
hypothesis, it’s unlikely that the higher percentage of principal investors in visa number use
could generate any significant impact on the visa waiting line calculation because, as Mr.
Oppenheim shared at the follow-up dialogue with IIUSA, “statistically speaking, slight variations
in the percentage being used would not amount to much.”
8 For more information, read IIUSA’s quarterly data report on Form I-526 statistics: https://iiusa.org/blog/iiusa-data-report-form-526-quarterly-data-review-analysis/ 9 Ibid. 10 Ibid.
DOS Estimates on Potential EB-5 Visa Wait Times on I-526 Petitions that were filed on October 29, 2019.
Based on the estimates on the number of visa applicants with petitions on file (the chart on page 8), the
potential “wait times” of visa availability for an applicant filing a I-526 petition on October 29, 2019
would be:
• Brazil: approximately 1.4 years;
• China: approximately 16.2 years;
• India: approximately 6.7 years;
• South Korea: approximately 3 years;
• Taiwan: approximately 1.9 years; and
• Vietnam: approximately 7.1 years.
It’s important to note that all estimates on the potential wait times above are based on the
assumption that all of the applicants with petitions on file had been approved as of October 28. In
addition, the wait times for Brazil, India, South Korea, Taiwan, and Vietnam were calculated based on
700 EB-5 visas per year; while the wait time for China was calculated based on 3,000 EB-5 visas per year.
11
In addition, the wait time estimate is the number of year(s) between the time when an I-526 petition
was filed and the time when an EB-5 visa is available, which includes the processing time of
adjudicating an I-526 petition at IPO. That is, for example, the estimated wait time of an Indian investor
who filed his/her I-526 petition on October 29, 2019 is 6.7 years. Hypothetically, if it takes USCIS 3 years
to adjudicate this petitioner’s I-526 case, 11 the additional wait of visa availability for this Indian applicant
and his/her family member(s) would be approximately 3.7 years.
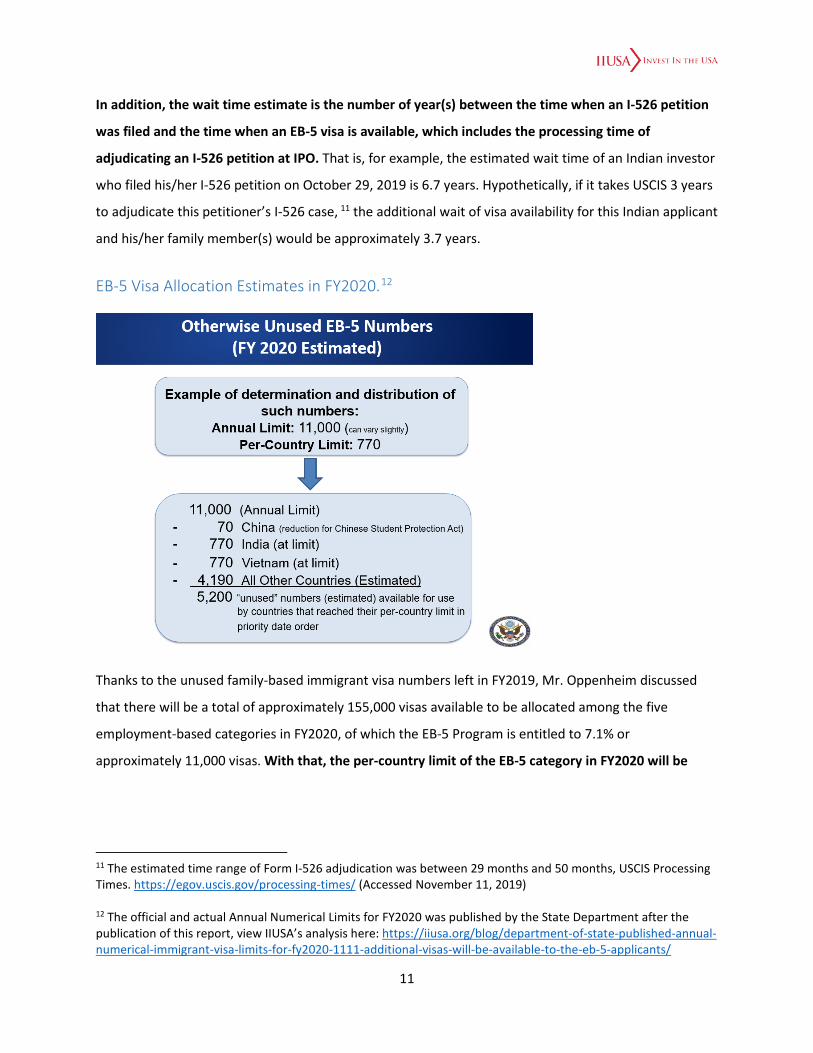
EB-5 Visa Allocation Estimates in FY2020.12
Thanks to the unused family-based immigrant visa numbers left in FY2019, Mr. Oppenheim discussed
that there will be a total of approximately 155,000 visas available to be allocated among the five
employment-based categories in FY2020, of which the EB-5 Program is entitled to 7.1% or
approximately 11,000 visas. With that, the per-country limit of the EB-5 category in FY2020 will be
11 The estimated time range of Form I-526 adjudication was between 29 months and 50 months, USCIS Processing Times. https://egov.uscis.gov/processing-times/ (Accessed November 11, 2019) 12 The official and actual Annual Numerical Limits for FY2020 was published by the State Department after the publication of this report, view IIUSA’s analysis here: https://iiusa.org/blog/department-of-state-published-annual-numerical-immigrant-visa-limits-for-fy2020-1111-additional-visas-will-be-available-to-the-eb-5-applicants/