IIUSA.ORG | 68 VOL. 5, ISSUE #3, OCTOBER 2017 Navigating EB-5 Visa Usage Statistics: A Historical and Current Perspective LEE LI POLICY ANALYST, IIUSA T hanks to the Visa Control and Report- ing Division at the U.S. Department of State, IIUSA received preliminary re- sults of the latest statistics on EB-5 visa usage in fiscal year (FY) 2017 through July. Although the data is subject to change, the statistics have empowered our analysis to shed some light on the visa capacity issue that is increasing- ly challenging for the entire EB-5 industry. EB-5 VISA USAGE OVERVIEW As of July 2017, more than 8,650 EB-5 visas were used [via Consulate Processing overseas and Adjustment of Status in U.S. Citizen- ship and Immigration Services (USCIS)] in FY2017. Although the EB-5 Program gener- ates billions of dollars in capital investment and supports hundreds of thousands of U.S. jobs, it only accounts for a small portion of the entire visa issuances every year. Accord- ing to the Department of State, the annual numerical limits for EB-5 visas in FY2017 is 9,940 1 , accounting for less than 3% of the annual allocations of all immigrant visa cat- 1 Annual Numerical Limits for Fiscal Year 2017, U.S. Depart- ment of State: https://travel.state.gov/content/dam/visas/Statis- tics/Immigrant-Statistics/Web_Annual_Numerical_Limits.pdf (Accessed September 17, 2017). egories. In addition, since FY2008, a total of 66,270 EB-5 visas were used in exchange for more than $20 billion 2 in capital investment that have stimulated a variety of economic development projects across the country and created hundreds of thousands jobs in local communities. Despite the fact that over 33,000 EB-5 visas remained unused in the last decade, the EB-5 Immigrant Investor Pro- gram has proven to be an economic develop- ment policy that utilizes global connections to generate significant impact on local econo- mies in U.S. In particular, the EB-5 Regional Center Program (the “Program”) is the major driving force to attract foreign investment since FY2008. As illustrated by Figure 1, in the last five years, over 90% of the EB-5 visas were used by applicants (including principle investors and their eligible family members) who invested in EB-5 Regional Center projects. Moreover, the preliminary statistics shows that approximately 97% of the EB-5 visa were issued to applicants invested in an EB-5 project located in a Targeted Employment Area (“TEA”), among which Regional Center projects in TEAs account for the vast majority of EB-5 visa usage in the last 10 years. 2 Estimated by $500,000 per I-526 approval. IIUSA Data Report: Form I-526 (Immigrant Petitions by Alien Entrepreneurs): Quarterly Statistics and Analy- sis (2nd Qtr. Fiscal Year 2013-2017). INTERNATIONAL PERSPECTIVES Category FY2008 FY2009 FY2010 FY2011 FY2012 FY2013 FY2014 FY2015 FY2016 FY2017* 10‐Year Total $1M Direct (C5) 149 282 324 230 159 243 161 64 273 249 2,134 $500K Direct ‐ TEA (T5) 239 410 239 152 164 227 155 92 573 377 2,628 $1M Regional Center (R5) 0 7 1 5 6 7 1 11 13 11 62 $500K Regional Center ‐ TEA (I5) 1,055 3,519 1,321 3,076 7,312 8,087 10,375 9,597 9,088 8,017 61,447 Grand Total 1,443 4,218 1,885 3,463 7,641 8,564 10,692 9,764 9,947 8,654 66,271 * Through July 2017. Preliminary results provided by U.S. Department of States. Final statistics are subject to change. Data Source: U.S. Department of State Prepared by: Lee Li, Policy Analyst, IIUSA Yearly EB‐5 Visas Usage (Issued and Adjustments of Status) ‐ FY2008‐FY2017* (Table 1) * Through July 2017. Preliminary results provided by U.S. Department of States. Final statistics are subject to change. Data Source: U.S. Department of State Prepared by: Lee Li, Policy Analyst, IIUSA (Figure 1) 83.4% 70.1% 88.8% 95.7% 94.4% 97.0% 98.3% 91.4% 92.6% 0.0% 10.0% 20.0% 30.0% 40.0% 50.0% 60.0% 70.0% 80.0% 90.0% 100.0% FY2008 FY2009 FY2010 FY2011 FY2012 FY2013 FY2014 FY2015 FY2016 FY2017* EB‐5 Visa Usage (Percentage) by Investment Category (FY2008 ‐ July, FY2017) $500K Regional Center ‐ TEA (I5) $500K Direct ‐ TEA (T5) $1M Direct (C5) $1M Regional Center (R5) Regional Center Projects in TEA Account for over 92% of EB‐5 Visa Usage in FY2017 (as of July)
Transcript
IIUSA.ORG | 68 VOL. 5, ISSUE #3, OCTOBER 2017
Navigating EB-5 Visa Usage Statistics:A Historical and Current Perspective
LEE LI POLICY ANALYST, IIUSA
Thanks to the Visa Control and Report-ing Division at the U.S. Department of State, IIUSA received preliminary re-
sults of the latest statistics on EB-5 visa usage in fiscal year (FY) 2017 through July. Although the data is subject to change, the statistics have empowered our analysis to shed some light on the visa capacity issue that is increasing-ly challenging for the entire EB-5 industry.
EB-5 VISA USAGE OVERVIEW
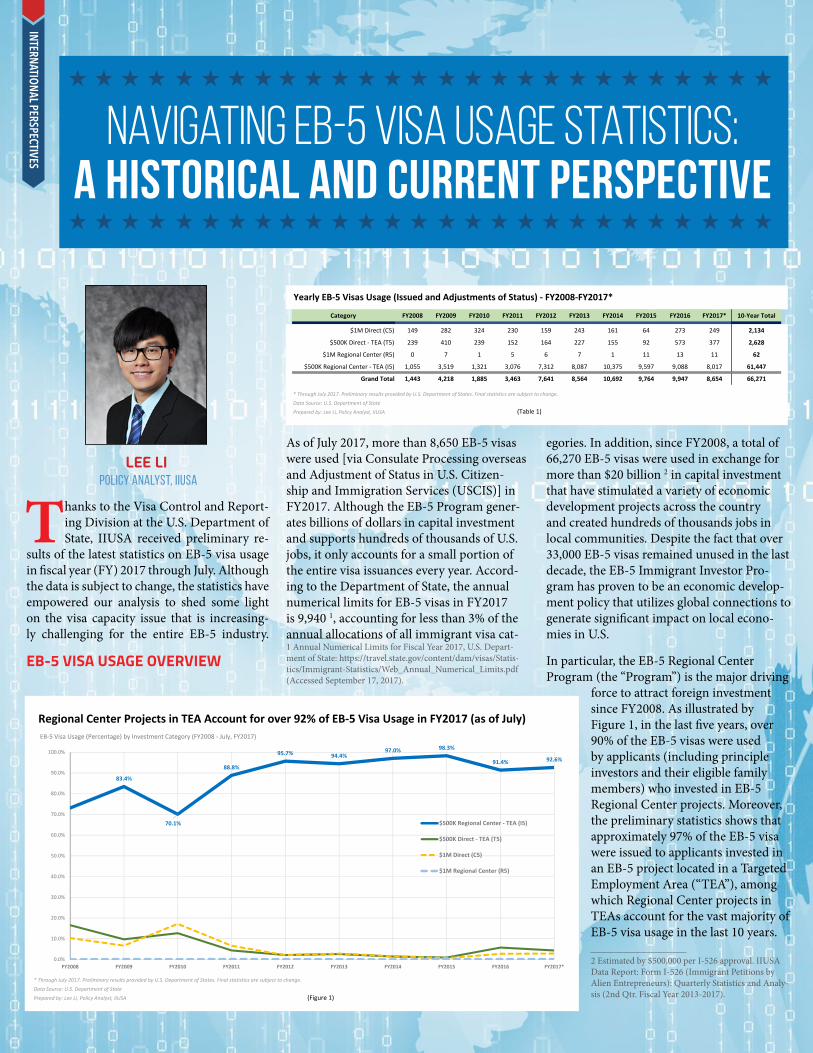
As of July 2017, more than 8,650 EB-5 visas were used [via Consulate Processing overseas and Adjustment of Status in U.S. Citizen-ship and Immigration Services (USCIS)] in FY2017. Although the EB-5 Program gener-ates billions of dollars in capital investment and supports hundreds of thousands of U.S. jobs, it only accounts for a small portion of the entire visa issuances every year. Accord-ing to the Department of State, the annual numerical limits for EB-5 visas in FY2017 is 9,940 1, accounting for less than 3% of the annual allocations of all immigrant visa cat-1 Annual Numerical Limits for Fiscal Year 2017, U.S. Depart-ment of State: https://travel.state.gov/content/dam/visas/Statis-tics/Immigrant-Statistics/Web_Annual_Numerical_Limits.pdf (Accessed September 17, 2017).
egories. In addition, since FY2008, a total of 66,270 EB-5 visas were used in exchange for more than $20 billion 2 in capital investment that have stimulated a variety of economic development projects across the country and created hundreds of thousands jobs in local communities. Despite the fact that over 33,000 EB-5 visas remained unused in the last decade, the EB-5 Immigrant Investor Pro-gram has proven to be an economic develop-ment policy that utilizes global connections to generate significant impact on local econo-mies in U.S.
In particular, the EB-5 Regional Center Program (the “Program”) is the major driving
force to attract foreign investment since FY2008. As illustrated by Figure 1, in the last five years, over 90% of the EB-5 visas were used by applicants (including principle investors and their eligible family members) who invested in EB-5 Regional Center projects. Moreover, the preliminary statistics shows that approximately 97% of the EB-5 visa were issued to applicants invested in an EB-5 project located in a Targeted Employment Area (“TEA”), among which Regional Center projects in TEAs account for the vast majority of EB-5 visa usage in the last 10 years.
2 Estimated by $500,000 per I-526 approval. IIUSA Data Report: Form I-526 (Immigrant Petitions by Alien Entrepreneurs): Quarterly Statistics and Analy-sis (2nd Qtr. Fiscal Year 2013-2017).
EB‐5 Visa Usage (Percentage) by Investment Category (FY2008 ‐ July, FY2017)
$500K Regional Center ‐ TEA (I5)
$500K Direct ‐ TEA (T5)
$1M Direct (C5)
$1M Regional Center (R5)
Regional Center Projects in TEA Account for over 92% of EB‐5 Visa Usage in FY2017 (as of July)
IIUSA.ORG | 69 VOL. 5, ISSUE #3, OCTOBER 2017
Additionally, our analysis found that 17% of the EB-5 visas were issued via Adjustment of Status (“AOS”) with USCIS, a minor increase from last fiscal year. In fact, on average, only 6% of the Chinese investors obtained their EB-5 visas via AOS, while this percentage among applicants from other countries is much larger (approximately 36%). With the growth of visa usage by investors from the regions other than mainland China in the last three years, we anticipate that the percentage
of EB-5 visa issued by AOS could continue to increase.
TOP FIVE COUNTRIES FOR EB-5 VISA USAGE IN FY2017
Overall, applicants from mainland China continue to dominate the EB-5 visa usage in FY2017, accounting for over 6,700 (or 78% of all) EB-5 visas as of July. Based on the prelimi-nary visa usage data, Vietnam, Brazil, South
Korea, and India are also included in the top 5 countries. Respectively they used 353 (or 4%), 220 (3%), 157 (2%) and 142 (2%) EB-5 visas in FY2017 (as of July). Particularly, Brazil moved up one spot from FY2016 and replaced South Korea to rank as the third biggest coun-try in terms of EB-5 visa usage in FY2017.
As shown by Figure 4, the percentage of EB-5 visas issued to applicants from mainland Chi-na has incrementally declined from 85% in FY2014 to about 75% in FY2016. However, we saw a small increase of 3% in EB-5 visa usage by Chinese applicants in FY2017 (as of July).
MOVEMENTS OF FINAL ACTION DATE ON EB-5 VISA BULLETIN
The Visa Bulletin, published by the Depart-ment of State, determines whether the visa number is available for the applicants to pro-ceed in their immigration processes. In May 2015, the Visa Bulletin officially showed EB-5 visa retrogression for applicants from main-land China for the first time, listing the “Final Action Date” (the “FAD”) as May 1, 2013.
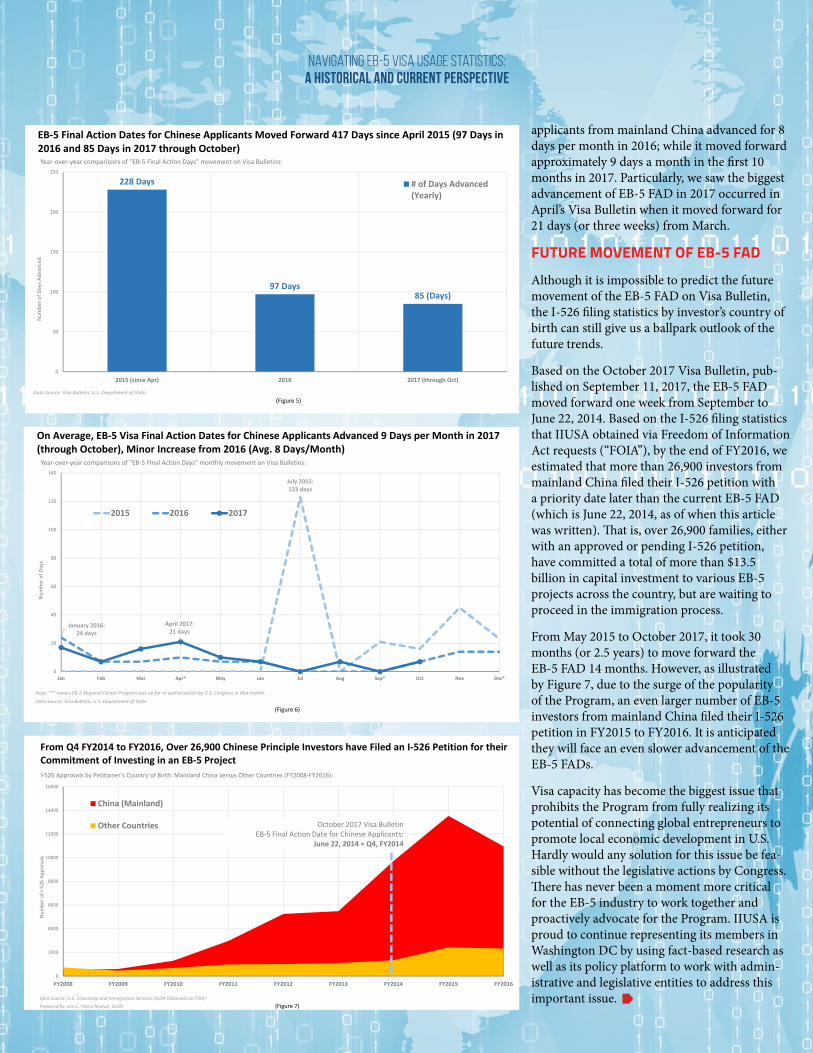
As of October 2017, the EB-5 FAD for Chi-nese investors on the Visa Bulletin has moved forward to June 22, 2014. That is, the FAD has advanced 417 days (or approximately 14 months) in the last 30 months. In particular, as illustrated by Figure 5, the EB-5 FAD for Chinese applicants moved forward 228 days (or 7.6 months) from May to December in 2015; while it only advanced for 97 days (or 3 months) in 2016 and 85 days from January to October in 2017.
Furthermore, Figure 6 compares the year-over-year monthly movement of the EB-5 FAD on the Visa Bulletin from May 2015 to October 2017. On average, EB-5 FAD for
* Through July 2017. Preliminary results provided by U.S. Department of States. Final statistics are subject to change.
Data Source: U.S. Department of State
Prepared by: Lee Li, Policy Analyst, IIUSA (Figure 2)
EB‐5 Visa Usage: Consular Processing (State Dept.) versus Adjustment of Status (USCIS) ‐ FY2008‐FY2017 (July):
State Dept. USCIS
As of July 2017, 17% of EB‐5 Investors Obtained EB‐5 Visas via Adjustment of Status in FY2017
* Through July 2017. Preliminary results provided by U.S. Department of States. Final statistics are subject to change.
Data Source: U.S. Department of State
Prepared by: Lee Li, Policy Analyst, IIUSA
(Figure 3)
China ‐ Mainland born, 6,717 Visas (78%)
Vietnam, 353 (4%)
Brazil, 220 (3%)
South Korea, 157 (2%)
India, 142 (2%)
Other Countries, 1,065 (12%)
All EB‐5 investor markets (other than mainland China) used 1.937, or 22% of total, EB‐5 visas in FY2017 as of
July 2017.
As of July 2017, 78% of EB‐5 Visas are Used by Applicants from Mainland China Here is the amounts and the market shares of EB‐5 visa usage by applicant's country of birth (FY2017*)
* Through July 2017. Preliminary results provided by U.S. Department of States. Final statistics are subject to change.
Percentage of EB‐5 Visa Usage Year‐over‐Year Trends: Mainland China & Other CountriesEB‐5 Visa Usage by Applicant's Country of Birth: Mainland China versus Other Regions by fiscal year:
Navigating EB-5 Visa Usage Statistics:A Historical and Current Perspective
IIUSA.ORG | 70 VOL. 5, ISSUE #3, OCTOBER 2017
Note: "*" means EB‐5 Regional Center Program was up for re‐authorization by U.S. Congress in that month.
Data Source: Visa Bulletin, U.S. Department of State
(Figure 6)
July 2015:123 days
April 2017:21 days
January 2016: 24 days
0
20
40
60
80
100
120
140
Jan Feb Mar Apr* May Jun Jul Aug Sep* Oct Nov Dec*
Num
ber o
f Days
Year‐over‐year comparisons of "EB‐5 Final Action Days" monthly movement on Visa Bulletins:
2015 2016 2017
On Average, EB‐5 Visa Final Action Dates for Chinese Applicants Advanced 9 Days per Month in 2017 (through October), Minor Increase from 2016 (Avg. 8 Days/Month)
Data Source: U.S. Citizenship and Immigration Services (IIUSA Obtained via FOIA)
Prepared by: Lee Li, Policy Analyst, IIUSA (Figure 7)
I‐526 Approvals by Petitioner's Country of Birth: Mainland China versus Other Countries (FY2008‐FY2016):
China (Mainland)
Other Countries October 2017 Visa BulletinEB‐5 Final Action Date for Chinese Applicants:
June 22, 2014 ≈ Q4, FY2014
From Q4 FY2014 to FY2016, Over 26,900 Chinese Principle Investors have Filed an I‐526 Petition for their Commitment of Investing in an EB‐5 Project
Data Source: Visa Bulletin, U.S. Department of State
(Figure 5)
228 Days
97 Days85 (Days)
0
50
100
150
200
250
2015 (since Apr) 2016 2017 (through Oct)
Num
ber o
f Days A
dvan
ced
Year‐over‐year comparisons of "EB‐5 Final Action Days" movement on Visa Bulletins:
# of Days Advanced(Yearly)
EB‐5 Final Action Dates for Chinese Applicants Moved Forward 417 Days since April 2015 (97 Days in 2016 and 85 Days in 2017 through October)
applicants from mainland China advanced for 8 days per month in 2016; while it moved forward approximately 9 days a month in the first 10 months in 2017. Particularly, we saw the biggest advancement of EB-5 FAD in 2017 occurred in April’s Visa Bulletin when it moved forward for 21 days (or three weeks) from March.
FUTURE MOVEMENT OF EB-5 FAD
Although it is impossible to predict the future movement of the EB-5 FAD on Visa Bulletin, the I-526 filing statistics by investor’s country of birth can still give us a ballpark outlook of the future trends.
Based on the October 2017 Visa Bulletin, pub-lished on September 11, 2017, the EB-5 FAD moved forward one week from September to June 22, 2014. Based on the I-526 filing statistics that IIUSA obtained via Freedom of Information Act requests (“FOIA”), by the end of FY2016, we estimated that more than 26,900 investors from mainland China filed their I-526 petition with a priority date later than the current EB-5 FAD (which is June 22, 2014, as of when this article was written). That is, over 26,900 families, either with an approved or pending I-526 petition, have committed a total of more than $13.5 billion in capital investment to various EB-5 projects across the country, but are waiting to proceed in the immigration process.
From May 2015 to October 2017, it took 30 months (or 2.5 years) to move forward the EB-5 FAD 14 months. However, as illustrated by Figure 7, due to the surge of the popularity of the Program, an even larger number of EB-5 investors from mainland China filed their I-526 petition in FY2015 to FY2016. It is anticipated they will face an even slower advancement of the EB-5 FADs.
Visa capacity has become the biggest issue that prohibits the Program from fully realizing its potential of connecting global entrepreneurs to promote local economic development in U.S. Hardly would any solution for this issue be fea-sible without the legislative actions by Congress. There has never been a moment more critical for the EB-5 industry to work together and proactively advocate for the Program. IIUSA is proud to continue representing its members in Washington DC by using fact-based research as well as its policy platform to work with admin-istrative and legislative entities to address this important issue.
Navigating EB-5 Visa Usage Statistics:A Historical and Current Perspective