Page 1
WHITE PAPER #50
DATA CENTER EFFICIENCY AND
IT EQUIPMENT RELIABILITY AT
WIDER OPERATING
TEMPERATURE AND HUMIDITY
RANGES
EDITOR:
Steve Strutt, IBM
CONTRIBUTORS:
Chris Kelley, Cisco
Harkeeret Singh, Thomson Reuters
Vic Smith, Colt Technology Services
The Green Grid Technical Committee
Page 2
PAGE 2
Executive Summary
Extending the environmental operating parameters of a data center is one of the industry-accepted
procedures for reducing overall energy consumption. Relaxing traditionally tight control over temperature
and humidity should result in less power required to cool the data center. However, until recently, the
impact of increased data center operating temperature on the information technology (IT) equipment
installed in the data center has not been well understood. Historically, it has been widely presumed to be
detrimental to the equipment’s reliability and service availability.
Interest in the use of economization methods to cool data centers is helping to drive increased focus on
extending the data center operating range to maximize the potential benefits of air-side and water-side
economizers in general. With economizers, the greater the number of hours and days a year that they can
be used, the less the mechanical chiller based cooling component of the infrastructure needs to operate.
More importantly in some cases were economizers can be used, the benefits could be significant enough
to reduce the mechanical cooling capacity or even eliminate it altogether. Yet what effect does increasing
the operating envelope within the data center have on the reliability and energy consumption of the IT
equipment itself? What if realizing savings in one area compromises reliability and increases energy usage
in others?
The Green Grid works to improve the resource efficiency of IT and data centers throughout the world. The
Green Grid developed this white paper to look at how the environmental parameters of temperature and
humidity affect IT equipment, examining reliability and energy usage as the data center operating range is
extended. Using recently published ASHRAE data, the paper seeks to address misconceptions related to
the application of higher operating temperatures. In addition, it explores the hypothesis that data center
efficiency can be further improved by employing a wider operational range without substantive impacts on
reliability or service availability.
The paper concludes that many data centers can realize overall operational cost savings by leveraging
looser environmental controls within the wider range of supported temperature and humidity limits as
established by equipment manufacturers. Given current historical data available, data centers can achieve
these reductions without substantively affecting IT reliability or service availability by adopting a suitable
environmental control regime that mitigates the effects of short-duration operation at higher temperatures.
Further, given recent industry improvements in IT equipment efficiency, operating at higher supported
temperatures may have little or no overall impact on system reliability. Additionally, some of the emerging
IT solutions are designed to operate at these higher temperatures with little or no increase in server fan
energy consumption. How organizations deploy wider operating ranges may be influenced by procurement
lifecycles and equipment selection decisions.
Page 3
PAGE 3
Table of Contents
I. Introduction ......................................................................................................................................................... 4
II. History of IT Operating Ranges .......................................................................................................................... 4
III. Industry Change .................................................................................................................................................. 8
IV. Concerns over Higher Operating Temperatures ............................................................................................. 10
IT reliability and temperature ........................................................................................................... 11
Power consumption increase with temperature rise ...................................................................... 15
V. Exploiting Air-Side Economizer Cooling ........................................................................................................... 18
The effect of broadening operating regimes ................................................................................... 21
Calculating the effect of operation in the Allowable range ............................................................ 25
The effect on data center energy consumption .............................................................................. 28
Extreme temperature events ........................................................................................................... 29
VI. Equipment Supporting Higher Operating Ranges ........................................................................................... 30
VII. Implications for the Design and Operation of Data Centers .......................................................................... 31
Health and safety.............................................................................................................................. 31
Higher temperatures affect all items in the data center ................................................................ 32
Airflow optimization .......................................................................................................................... 32
Temperature events ......................................................................................................................... 32
Humidity considerations ................................................................................................................... 33
Data floor design .............................................................................................................................. 33
Measurement and control ................................................................................................................ 33
Published environmental ranges ..................................................................................................... 33
VIII. Conclusion ......................................................................................................................................................... 34
IX. About The Green Grid ....................................................................................................................................... 35
X. References ........................................................................................................................................................ 35
Page 4
PAGE 4
I. Introduction
Data centers have historically used precision cooling to tightly control the environment inside the data
center within strict limits. However, rising energy costs and impending carbon taxation are causing many
organisations to re-examine data center energy efficiency and the assumptions driving their existing data
center practices. The Green Grid Association works to improve the resource efficiency of information
technology (IT) and data centers throughout the world. Measuring data center efficiency using The Green
Grid’s power usage efficiency (PUE™) metric reveals that the infrastructure overhead of precision cooling in
a data center facility greatly affects overall efficiency. Therefore, solutions that can result in improved
efficiency deserve increased focus and analysis.
Initial drivers for the implementation of precision cooling platforms within data centers have included the
perceived tight thermal and humidity tolerances required by the IT network, server, and storage equipment
vendors to guarantee the reliability of installed equipment. Historically, many of these perceived tight
thermal and humidity tolerances were based on data center practices dating back to the 1950s. Over time,
the IT industry has worked to widen acceptable thermal and humidity ranges. However, most data center
operators have been reluctant to extend operating parameters due to concerns over hardware reliability
affecting the availability of business services, higher temperatures reducing the leeway and response time
to manage cooling failures, and other historical or contextual perceptions.
It is widely assumed that operating at temperatures higher than typical working conditions can have a
negative impact on the reliability of electronics and electrical systems. However, the effect of operating
environment conditions on the reliability and lifespan of IT systems has been poorly understood by
operators and IT users. Moreover, until recently, any possible affects have rarely been quantified and
analyzed.
Recent IT reliability studies show that, with an appropriate operating regime, a case can be made for the
operation of data centers using a wider temperature range and relaxed humidity controls. Using a looser
environmental envelope opens the door to a potential reduction in some of the capital costs associated
with a data center’s cooling subsystems. In particular, data centers that do not require a mechanical chiller
based cooling plant and rely on economizers can prove significantly less expensive both to construct and
operate.
II. History of IT Operating Ranges
For many years, a thermal range of between 20OC and 22OC has been generally considered the optimal
operational temperature for IT equipment in most data centers. Yet the underlying motivation for this on-
going close control of temperature and associated humidity is unclear. For instance, there is evidence that
Page 5
PAGE 5
the operating range was initially selected on the suggestion that this choice would help avoid punch cards
from becoming unusable. What is clear now, in hindsight, is that this type of tight thermal range was
adopted based on:
The perceived needs and usage patterns of IT technologies when they were first introduced
The environment within which vendors and operators were willing to warrant operation and
guarantee reliability of those technologies
The gravity of any existing assumptions about the use of tight control ranges in an environment
This ad-hoc approach led to wide variability between vendors’ supported thermal and humidity ranges
across technologies, and it presented a significant challenge for users when operating multiple vendors’
products within a single data center. Even when data center operators installed newer equipment that
could support wider acceptable ranges, many of them did not modify the ambient operating conditions to
better align with these widening tolerances.
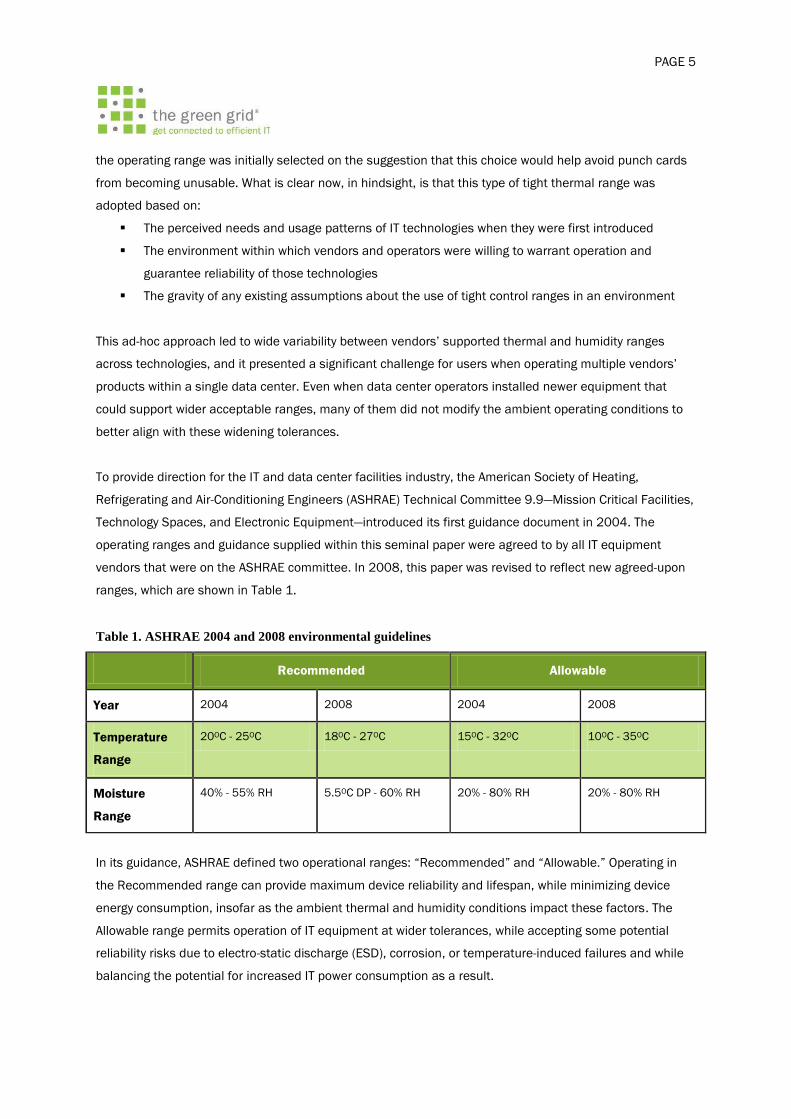
To provide direction for the IT and data center facilities industry, the American Society of Heating,
Refrigerating and Air-Conditioning Engineers (ASHRAE) Technical Committee 9.9—Mission Critical Facilities,
Technology Spaces, and Electronic Equipment—introduced its first guidance document in 2004. The
operating ranges and guidance supplied within this seminal paper were agreed to by all IT equipment
vendors that were on the ASHRAE committee. In 2008, this paper was revised to reflect new agreed-upon
ranges, which are shown in Table 1.
Table 1. ASHRAE 2004 and 2008 environmental guidelines
Recommended Allowable
Year 2004 2008 2004 2008
Temperature
Range
20OC - 25OC 18OC - 27OC 15OC - 32OC 10OC - 35OC
Moisture
Range
40% - 55% RH 5.5OC DP - 60% RH 20% - 80% RH 20% - 80% RH
In its guidance, ASHRAE defined two operational ranges: “Recommended” and “Allowable.” Operating in
the Recommended range can provide maximum device reliability and lifespan, while minimizing device
energy consumption, insofar as the ambient thermal and humidity conditions impact these factors. The
Allowable range permits operation of IT equipment at wider tolerances, while accepting some potential
reliability risks due to electro-static discharge (ESD), corrosion, or temperature-induced failures and while
balancing the potential for increased IT power consumption as a result.
Page 6
PAGE 6
Many vendors support temperature and humidity ranges that are wider than the ASHRAE 2008 Allowable
range. It is important to note that the ASHRAE 2008 guidance represents only the agreed-upon intersection
between vendors, which enables multiple vendors’ equipment to effectively run in the same data center
under a single operating regime. ASHRAE updated its 2008 guidance1 in 2011 to define two additional
classes of operation, providing vendors and users with operating definitions that have higher Allowable
temperature boundaries for operation, up to 40OC and 45OC respectively. At the time this white paper was
written, there existed only a small number of devices available that supports the new ASHRAE 2011 class
definitions, which are shown in Table 2.
Table 2. ASHRAE 2011 environmental classes
ASHRAE 2011 Equipment Environmental Specifications
Classes
Product Operation
Dry-bulb
temperature (OC) Humidity range non-condensing
Maximum
dew point
(OC)
Maximum
elevation
(m)
Maximum
rate of
change
(OC/hr)
Recommended
A1 to A4 18 to 27 5.5OC DP to 60% RH and 15OC DP
Allowable
A1 15 to 32 20 to 80% RH 17 3040 5/20
A2 10 to 35 20 to 80% RH 21 3040 5/20
A3 5 to 40 8 to 85% RH 24 3040 5/20
A4 5 to 45 8 to 90% RH 24 3040 5/20
B 5 to 35 8 to 85% RH 28 3040 NA
C 5 to 40 8 to 85% RH 28 3040 NA
ASHRAE now defines four environmental classes that are appropriate for data centers: A1 through A4.
Classes B and C remain the same as in the previous 2008 ASHRAE guidance and relate to office or home
IT equipment. A1 and A2 correspond to the original ASHRAE class 1 and class 2 definitions. A3 and A4 are
new and provide operating definitions with higher Allowable operating temperatures, up to 40OC and 45OC
respectively.
Although the 2011 guidance defines the new A3 and A4 classes that support higher and lower Allowable
operating temperatures and humidity, vendor support alone for these ranges will not facilitate their
adoption or enable exploitation of the Allowable ranges in the existing A1 and A2 classes. Adoption is
dependent on the equipment’s ability to maintain business service levels for overall reliability and
availability. Typical concerns cited by data center operators regarding the wider, Allowable operational
ranges include uncertainty over vendor warranties and support and lack of knowledge about the reliability
and availability effects of such operation. These are issues that must be addressed by the industry.
Page 7
PAGE 7
In its guidance, ASHRAE has sought to provide assurance about reliability when applying the
Recommended and Allowable ranges. It should be noted, however, that few users were in a position to
quantify the risks or impact associated with operating within the 2004 or 2008 ASHRAE Allowable or even
Recommended ranges. As a consequence, most data center operators have been wary of using the full
scope of the ranges. Some may tend to use the upper boundaries to provide a degree of leeway in the
event of cooling failures or to tolerate hot spots within the data center environment. A recent survey by The
Green Grid on the implementation of the ASHRAE 2008 environmental guidelines in Japan2 showed that
over 90% of data centers have non-uniform air inlet temperatures and that the 2008 Allowable
temperature range is being used to address the issues of poor airflow management.
The conservative approach to interpreting the ASHRAE guidelines on operating temperature and humidity
has presented a hurdle to the application of energy efficiency measures in the data center in some areas.
This hurdle has not necessarily stifled innovation, as operators have been addressing overall data center
efficiency in multiple ways, but the available avenues for savings realization may have been narrowed as a
result. The Green Grid White Paper #41, Survey Results: Data Center Economizer Use,3 noted:
The efficiency of data center cooling is being increased through better airflow
management to reduce leakage of chilled air and increase return temperatures.
Contained aisle solutions have been introduced to eliminate air mixing, recirculation, and
bypass of cold air. These approaches, even within the restraints of tight environmental
control, have eliminated hot spots and brought more uniform inlet temperatures. As a
consequence, they have allowed higher ambient cold aisle supply temperatures without
overall change in IT availability and reliability.
Many operators are implementing direct air cooled, indirect air cooled, and indirect water
economizers to reduce the number of hours that an energy-hungry chiller plant needs to
be operated. The Green Grid survey of data center operators showed that use of
economizers will result in saving an average of 20% of the money, energy, and carbon for
cooling when compared to data center designs without economizers.
The increase in efficiency highlighted in White Paper #41 has largely occurred without any significant
changes in the way IT equipment is operated and the data center’s environmental characteristics are
configured. Where uniform air distribution is implemented through the use of contained aisles or similar
approaches, loose control within the boundaries of the ASHRAE Recommended range can potentially allow
for increases in the number of hours of economizer operation available to the facility and drive further
reductions in overall data center energy consumption and costs. Raising the supply temperature also
provides the opportunity for greater exploitation of economizers in hotter climates, where previously the
Page 8
PAGE 8
economic benefit was comparatively small due to the limited number of available operating hours. The
Green Grid’s free cooling maps4 and web tools5 published in 2009 illustrate that when operation at up to
27OC in the Recommended range is allowed, air-side economization can be exploited more than 50% of
the time in most worldwide geographies. In higher latitudes, this opportunity increases to at least 80% of
the time.
The Green Grid’s 2012 free cooling maps6 illustrate operation up to the limits of the ASHRAE A2 Allowable
range of 35OC and demonstrate the potential for a greater impact of the use of economizers on energy
efficiency. The maps show that 75% of North American locations could operate economizers for up to
8,500+ hours per year. In Europe, adoption of the A2 Allowable range would result in up to 99% of
locations being able to use air-side economization all year.
Greater use of economizers also can drive down the potential capital cost of data centers by reducing the
size of the chiller plant needed to support the building or by possibly eliminating the chiller plant entirely in
locations where peak outside temperatures will not exceed economizers’ supported environmental ranges.
Irrespective of the known benefits of raising supply temperatures, anecdotal evidence suggests that the
average supply temperature of data centers has hardly changed in recent years. This conclusion is
supported by the survey of Japanese implementation of ASHRAE 2008 environmental guidelines.2 The
principal reasons given for maintaining average supply temperatures around 20OC to 22OC are concerns
about the effect of temperature and humidity on IT hardware reliability and about the corresponding
impact on business service levels as the operating temperature is increased. Independently, operators also
cite as a barrier the lack of clarity provided by vendors on product support and warranty factors when
operating outside the Recommended range. The lack of reliable information on these topics has deterred
many organizations from pursuing higher operating temperatures as a route to reduced energy costs.
III. Industry Change
The rise of cloud computing as a new IT service delivery model has been the catalyst for innovation across
the whole spectrum of IT activities. This new model represents a conjunction of many existing and new
technologies, strategies, and processes. For instance, cloud computing has brought together virtualization,
automation, and provisioning technologies, as well as driven the standardization of applications, delivery
processes, and support approaches. Combined, these technologies, services, and capabilities have
triggered radical change in the way IT services are being delivered, and they have changed underlying cost
structures and cost-benefit approaches in IT service delivery.
Early cloud innovators identified data center facilities as a major, if not prevailing, element of their service
delivery costs. After all, when looking at cloud services and increasingly at big data and analytics
operations, any opportunity to reduce overhead and facility costs can reduce net unit operating costs and
Page 9
PAGE 9
potentially enable the data center to operate more economically. These savings can be used to increase
the scale of the IT environment.
Inspired by their need for greater cost efficiencies related to supplying power and cooling for IT equipment,
organizations operating at a cloud scale drove critical, innovative thought leadership. They were able to
quickly demonstrate that air-side economizers and higher temperature data center operations did not have
meaningful impacts on reliability and availability when measured against their service delivery targets. This
latter point is important—the service levels offered in most cases were not necessarily the same as might
be expected from an enterprise with a traditional IT model that assumes high infrastructure reliability and
multiple component redundancy to deliver IT services.
The IT hardware used by some of these cloud services operators was typically custom built to their own
specifications. Further, these cloud services operators were able to effectively decouple the services they
offered from potential failures of individual compute or storage nodes and whole racks of IT equipment.
They were even able to decouple the services from a complete failure of one (of several) data center
facility. This type of abstraction from facility and IT hardware failure requires a very robust level of IT service
maturity—a level that only recently is becoming a realistic target for most mainstream enterprise IT
organizations. Nonetheless, the success of the cloud service organizations and their IT and business
models has shown that there is room for innovation in more traditional data center operations and that
previous assumptions about data center operation can be challenged.
Most organizations do not have the luxury of being able to specify and order custom-designed, custom-built
IT equipment. Thus, any challenge to existing assumptions about data center operations has to occur
within the confines of the available industry standard server (ISS) platforms across the industry. To help
determine the viability of operating ISS platforms in a completely air-side-economized data center with a
wider operating range than specified under ASHRAE 2008, Intel ran a proof of concept in a dry, temperate
climate over a 10-month period, using 900 commercially available blade servers. Servers in the air-side-
economized environment were subjected to considerable variation in temperature and humidity as well as
relatively poor air quality. Even then, Intel observed no significant increase in server failures during their
test period. “We observed no consistent increase in server failure rates as a result of the greater variation
in temperature and humidity, and the decrease in air quality,” noted Intel in its August 2008 report.7 While
this was not a strictly scientific study, it did confirm that industry standard servers could be used in this
fashion and that further study and use was appropriate.
The Green Grid has observed a slow but steady increase in the adoption of wider operating envelopes. For
example, Deutsche Bank recently announced its construction of a production data center in New York City
that is capable of handling nearly 100% of the cooling load by using year-round air-side economization. The
bank is able to cool its data center with no mechanical cooling necessary for at least 99% of the time
Page 10
PAGE 10
through a combination of facilities innovations and the willingness to operate IT equipment at an expanded
environmental range.8
IV. Concerns over Higher Operating Temperatures
Even given the data from the Intel study and the general trend toward leveraging wider operating
envelopes, concerns about reliability and possible service-level impacts are not without merit. The
relationship between increased temperatures and failure rates of electronics is well known and widely
used to reduce the time required to perform reliability testing. What is not as well understood is the effect
of temperature on the long-term reliability of IT equipment, apart from anecdotal evidence that servers in
hot spots fail more frequently. There also remains disagreement on the importance and definition of “long-
term” for most organizations. Effects such as ESD, particulate contamination, and corrosion at higher
humidity levels also need to be considered.
Even if the theoretical potential for meaningful increases in failure rates was discounted, there remain
more practical and immediate considerations to address when looking at wider operating ranges,
especially at the higher end of the thermal range. There is a relationship between temperatures above a
certain point and an increase in server power utilization. This relationship is largely due to the increased
server fan power required to cool components and, to a lesser extent, to an increase in silicon electrical
leakage current when operating at higher ambient temperatures.9
Additional observations show that some traditional, mechanical chiller cooled data centers have a “sweet
spot” where operators can minimize overall energy consumption. This point exists at the intersection
between the mechanical cooling energy consumption (which decreases as the operating temperature
increases) and the IT equipment energy consumption (which increases as ambient air temperature rises
past a point). Whereas chiller efficiency improves with increasing inlet supply temperature and reduces
energy consumption, the power consumption of the IT equipment increases with inlet temperature past a
point, which can be expected to vary between device types.10, 11
Data center operators frequently cite the perceived potential impact of higher temperature operation on
support and maintenance costs as a significant deterrent to adopting wider operating ranges. Most IT
equipment vendors warrant recent equipment for operation in both the 2008 and 2011 Recommended
and Allowable ranges of the ASHRAE classes. However, there is often some ambiguity as to any operating
restrictions, and vendors do not necessarily clearly articulate the duration of supported operation at the
limits of the ranges. In recognition of the lack of clarity on warranties, the European Union, in its 2012
update of the Code of Conduct for Data Centre Energy Efficiency,12 added a requirement for vendors to
clearly publish information that specifies any such limitations in the operation of IT equipment.
Page 11
PAGE 11
IT RELIABILITY AND TEMPERATURE
The lack of historical authoritative data on any change in reliability that may occur when operating IT
equipment at wider thermal and humidity bands has been a stumbling block to change. This historical
murkiness has stopped some users and operators from building models and business cases to
demonstrate that an economized data center using higher temperatures is viable and will not meaningfully
and negatively affect the level of business service offered.
The Intel study in 2008 was the first study made public that used industry standard servers to demonstrate
that reliability is not significantly or materially affected by temperature and humidity. At the time the Intel
study was released, this conclusion was met with surprise, although perhaps it should not have been
unexpected. For many years, IT systems design specifications have required that high-power components
be adequately cooled and kept within vendors’ specifications across the equipment’s supported operating
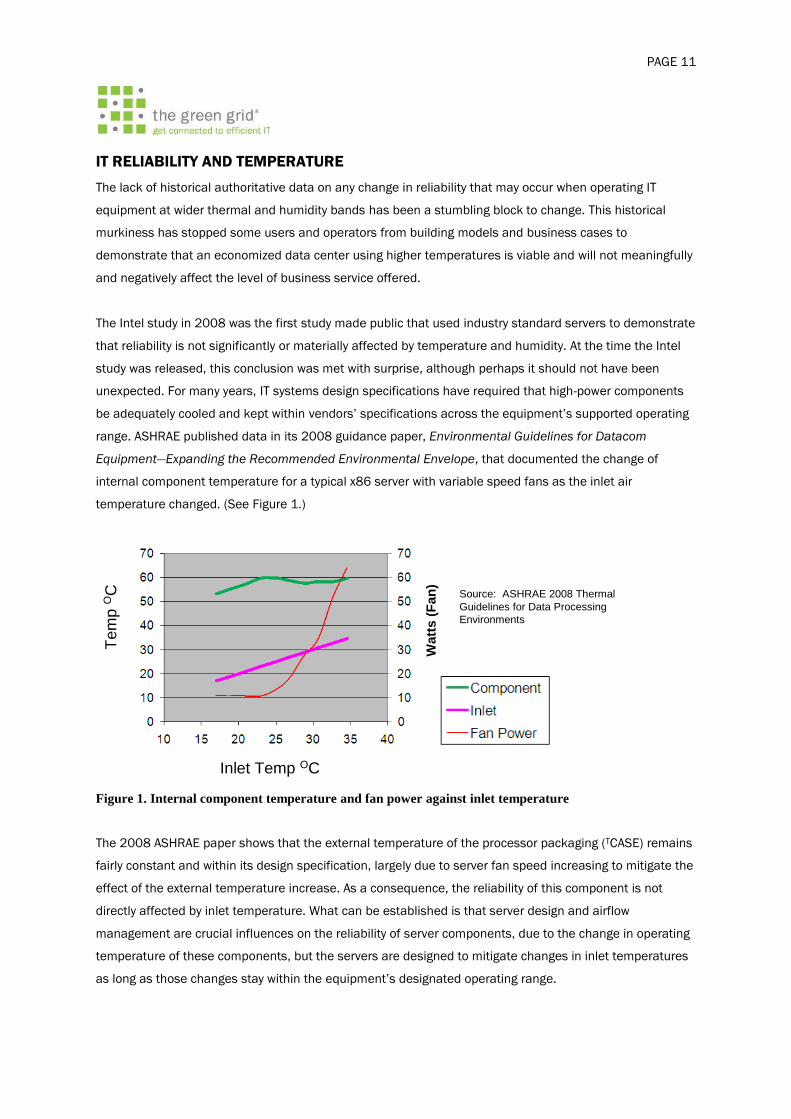
range. ASHRAE published data in its 2008 guidance paper, Environmental Guidelines for Datacom
Equipment—Expanding the Recommended Environmental Envelope, that documented the change of
internal component temperature for a typical x86 server with variable speed fans as the inlet air
temperature changed. (See Figure 1.)
Source: ASHRAE 2008 Thermal
Guidelines for Data Processing
Environments
Inlet Temp OC
Tem
p O
C
Watt
s (
Fan
)
Figure 1. Internal component temperature and fan power against inlet temperature
The 2008 ASHRAE paper shows that the external temperature of the processor packaging (TCASE) remains
fairly constant and within its design specification, largely due to server fan speed increasing to mitigate the
effect of the external temperature increase. As a consequence, the reliability of this component is not
directly affected by inlet temperature. What can be established is that server design and airflow
management are crucial influences on the reliability of server components, due to the change in operating
temperature of these components, but the servers are designed to mitigate changes in inlet temperatures
as long as those changes stay within the equipment’s designated operating range.
Page 12
PAGE 12
What can also be seen from this data is that server fan power consumption rises rapidly to provide the
necessary volume of air flowing through the processor heat sinks to maintain the component temperature
within the allowed tolerance. Also note that the increase in fan power consumption only becomes
meaningful past roughly 25oC, toward the limit of the Recommended range. Specifically, the increase in
data center operating temperature had no impact on server power consumption until the inlet temperature
reached this range. (Newer equipment and equipment designed to class A3 exhibits slightly different
characteristics and will be discussed later.)
The industry’s understandable focus on life cycle energy consumption for devices has driven a number of
changes and innovations in more recent systems. Advancements in the design of these systems continue
to reduce power consumption at many temperature levels, and the industry has continued to innovate in
an attempt to drive down the required energy consumption as operating temperatures rise. However, the
increased power and airflow associated with extended environmental ranges continue to be factors that
need careful consideration. Additional implications of the increase in airflow will be discussed later.
In 2011, ASHRAE introduced its paper, 2011 Thermal Guidelines for Data Processing Environments –
Expanded Data Center Classes and Usage Guidance1 to provide further guidance and direction for the IT
and data center industries. One of the datasets presented in this ASHRAE paper was a normalized chart of
relative server failure rates when evaluated against temperature, based on reliability data from multiple
hardware vendors. Figure 2 is a plot of the change of the failure rate for multiple devices and vendors,
showing the spread of variability between devices and the mean value at specific temperatures. This
shows the change in the rate of server failures with temperature. Each data point is not the actual number
of failures, but the relative change in failure rate among a heterogeneous sample of devices from multiple
vendors.
Source: ASHRAE Whitepaper –
2011 Thermal Guidelines for Data
Processing Environments
0.00
0.50
1.00
1.50
2.00
2.50
15 17.5 20 22.5 25 27.5 30 32.5 35 37.5 40 42.5 45
Relative
failure rate
compared
to 20C
Continuous operational temperature in C
Relative server failure rate with temperature
Figure 2. ASHRAE 2011 Relative failure rate with temperature for volume servers
Source: ASHRAE, 2011 Thermal
Guidelines for Data Processing
Environments – Appendix C,
reformatted
Page 13
PAGE 13
The device failure rate shown above is normalized to 1 at 20OC. Thus, Figure 2 demonstrates that for
continuous operation at 35OC, the failure rate is close to 1.6 times higher than for continuous operation at
20OC.
Whether this increase is meaningful requires a bit of analysis. To illustrate the impact of this increase,
consider a hypothetical data center with 1,000 servers. Assume that this data center typically expects an
average of 10 servers to undergo some kind of failure within a given year when operating continuously at
20OC. Given this baseline, if the example data center were to be operated continuously at 35OC instead of
20OC, one would expect to see an average of 16 server failures. This represents an average net increase of
six server failures over the baseline rate, or simply six additional failures across a population of 1,000
installed servers.
In this example, continuous operation at 35OC would represent a measurable impact on the availability of
the population of servers when compared to continuous operation at 20OC. If a more conservative
approach is applied to the example data center, where it continuously operates at 27OC (as opposed to
35OC), an average increase of 2.5 failed servers could be expected across the 1,000-server population.
More specifically, in this population of 1,000 servers, it would make sense to see an increase of failed
servers from the baseline average of 10 per year at a continuous operation at 20OC to 12.5 per year at a
continuous operation at 27OC.
The Relationship between Operation Duration and Failure Rates
It is important to note that the ASHRAE failure rate guidance and the example above both explicitly
presume continuous operation at the given temperature. However, the application of the principles
discussed here would tend to result in operations that are discontinuous. Specifically, it can be expected
that most operations would result in a degree of floating ambient temperatures, where the actual ambient
temperatures are more closely aligned with the capabilities of the economizers on a given day. For
instance, operations at the upper portion of the selected thermal range would occur part of the year and
likely only part of the day even on those days. Thus, while a number of operating hours can be expected at
the upper temperature referred to in Figure 2, that operation would be discontinuous. The guidance
provided by ASHRAE is that the maximum rate of change of operating temperature should not exceed 5OC
per hour where tape devices are used or 20OC per hour where only disk devices are used. The actual rate
of change for most environments will be significantly lower than the maximum permitted, in which case the
effects of thermal stresses caused by changes in operating temperature may be discounted for the
expected working life of a device. In short, the number of hours that a device operates at a given
temperature within the allowable range is the prime determinant of its failure rate, and the effects caused
by changes in temperature are themselves not a driver of failures during the device’s useful life.
Page 14
PAGE 14
Consequently, the known data suggests that short-duration operations at or above 20OC may only increase
the failure rate for the particular duration, or they may have no measurable impact on failure rates for the
expected lifespan of the installed equipment. The second point is that operation below 20OC tends to
decrease the failure rate. A potential scenario is a data center operating regime that combines floating
operation both above and below 20OC, weighted to follow the mathematical distribution shown in Figure 2.
Short-duration operation at up to 27OC could be balanced by longer-term operation at just below 20OC to
theoretically maintain the normalized failure rate of 1. This approach is discussed later in this paper.
The actual number of equipment failures for a given data center will depend on the individual level of
reliability of the chosen hardware vendors and devices at corresponding points in the hardware’s
supported thermal operating range. In addition, the illustration above does not take into account the
effects of preventative maintenance actions triggered by hardware-generated predictive failure alerts.
Although these maintenance actions may be required more often, the likelihood of a server failing
(resulting in unplanned downtime) is arguably reduced. Even more important is the understanding of what
it means for a server to “fail.” Different organizations would apply different definitions for a server failure;
they may start the count from any unplanned component failure (fault) or, in contrast, start the count at a
predictive failure alert. The significance of one approach versus the other would be organizationally
specific.
Thus, each organization would need to look at the ASHRAE server failure rate model, understand its
general nature, and apply the model to work within its specific context. For organizations with highly
mature change and maintenance processes, the theoretical impact of any operating temperature increase
may be tempered by the processes’ ability to absorb the potential increase in failures. Moreover,
organizations that leverage IT architectures that are largely abstracted from underlying hardware, such as
in highly virtualized and cloud environments, may argue that there is no substantive impact to their IT
operations availability or level of risk, given the resiliency built into their IT architectural models. In other
words, the application of best practice IT platform design may, for some organizations, render any
perceived or actual increase in failure rates (as described here) wholly inconsequential.
Other organizations may approach the equipment failure question in alternative ways. For instance, for
some organizations, the cost savings derived from operating at higher ambient temperatures may easily
pay for any potential increase in maintenance costs (such as component failures). As long as the
equipment vendors support operation of their equipment at this higher temperature, and appropriate
maintenance and/or warrantee contracts are maintained as typical, then the actual realized maintenance
costs to an organization may be minimal. For these organizations, the cost impact may be as little as the
labor used to execute the repair work and conceivably some accounting of the cost of scheduled and
unscheduled downtime. Of course, this presumes that the IT organization is able to support its service level
obligations and targets with a slightly elevated equipment failure rate; thus, all analyses would necessarily
Page 15
PAGE 15
require some thought and planning to account for these and other organizationally specific needs and
constraints.
Additional points can be drawn from ASHRAE’s 2011 Thermal Guidelines for Data Processing
Environments – Expanded Data Center Classes and Usage Guidance. The normalized failure rate dataa the
paper presents is broken out by bin within Appendix C. (See Figure 2.) A “bin” is simply a five-degree range
of temperatures, along with the number of hours of occurrence during a year. The observation here is that
the anticipated rate of failure at a particular temperature is influenced by the number of operating hours at
that point. Specifically, a bin breakout of the expected operating temperatures in a given data center can
be used to establish a rough expected change in failure rates on the basis of the temperature distribution.
The overall consequence of these factors is that short-duration operation above 20OC only increases the
failure rate for that duration. In addition, operation below 20OC decreases the failure rate for that
corresponding duration. A potential scenario may involve a data center operating regime that combines
operation at both above and below 20OC, weighted to ensure no overall change in failure rate or even a
reduction in likely failures, depending on the temperature of the data center as it stands today.
POWER CONSUMPTION INCREASE WITH TEMPERATURE RISE
As temperature rises past a point, one can expect the power consumption of the IT equipment to rise as
well. There are two factors that primarily determine the increased demand for power in relation to a rise in
temperature. The first is the increase in fan power that is used to boost the volume of airflow, which
correspondingly provides adequate cooling of the processor and other components. The second factor is
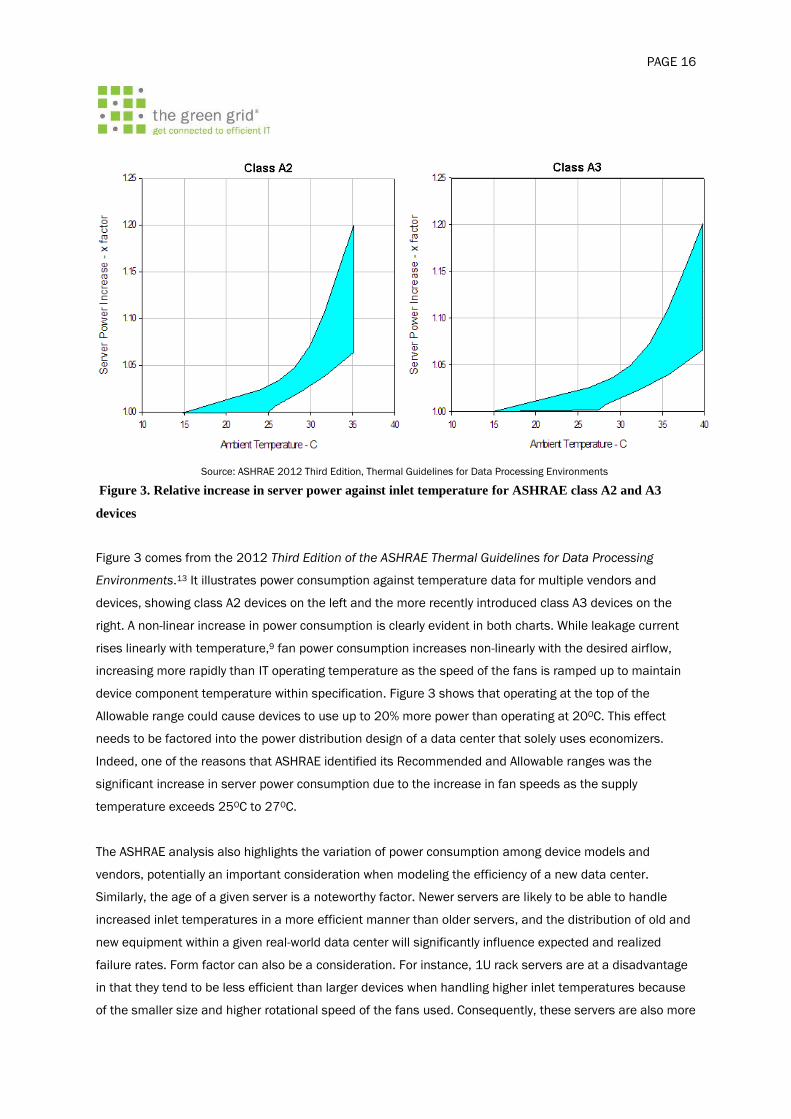
silicon leakage current in server components. Figure 3 illustrates the relationship between server power
consumption and temperature for a range of industry standard servers.
a It is important to note that ASHRAE describes this normalized failure rate as the “X-factor” in its
discussion.
Page 16
PAGE 16
Figure 3. Relative increase in server power against inlet temperature for ASHRAE class A2 and A3
devices
Figure 3 comes from the 2012 Third Edition of the ASHRAE Thermal Guidelines for Data Processing
Environments.13 It illustrates power consumption against temperature data for multiple vendors and
devices, showing class A2 devices on the left and the more recently introduced class A3 devices on the
right. A non-linear increase in power consumption is clearly evident in both charts. While leakage current
rises linearly with temperature,9 fan power consumption increases non-linearly with the desired airflow,
increasing more rapidly than IT operating temperature as the speed of the fans is ramped up to maintain
device component temperature within specification. Figure 3 shows that operating at the top of the
Allowable range could cause devices to use up to 20% more power than operating at 20OC. This effect
needs to be factored into the power distribution design of a data center that solely uses economizers.
Indeed, one of the reasons that ASHRAE identified its Recommended and Allowable ranges was the
significant increase in server power consumption due to the increase in fan speeds as the supply
temperature exceeds 25OC to 27OC.
The ASHRAE analysis also highlights the variation of power consumption among device models and
vendors, potentially an important consideration when modeling the efficiency of a new data center.
Similarly, the age of a given server is a noteworthy factor. Newer servers are likely to be able to handle
increased inlet temperatures in a more efficient manner than older servers, and the distribution of old and
new equipment within a given real-world data center will significantly influence expected and realized
failure rates. Form factor can also be a consideration. For instance, 1U rack servers are at a disadvantage
in that they tend to be less efficient than larger devices when handling higher inlet temperatures because
of the smaller size and higher rotational speed of the fans used. Consequently, these servers are also more
Source: ASHRAE 2012 Third Edition, Thermal Guidelines for Data Processing Environments
Page 17
PAGE 17
likely to exhibit higher increases in energy consumption due to the corresponding rises in inlet
temperature. Blade servers and newer, modular form factor servers typically use larger fans at lower
rotational speeds to achieve the same volume of airflow. Hence, they can be more efficient while
demonstrating lower increases in power consumption as inlet temperature rises.
The industry’s current innovation curve is steep; vendors are designing servers and other IT equipment to
handle increased inlet temperatures better with each generation. As a result, the charts in Figure 3 show
strong evidence of technology evolution since ASHRAE announced its A3 and A4 classes. The chart on the
right shows that vendors of newly released class A3 devices are able to support operation at up to 40OC
with the same power characteristics as the previous class A2 devices operating at up to 35OC, as shown on
the left. There is obviously wide variation among devices and vendors, although a general observation is
that, as the temperature rises, the increase in power consumption of a class A3 device is typically only 50%
of that of a class A2 device.
The increased server fan power demands at higher temperatures have a distorting effect on IT power
consumption at higher temperatures and therefore on overall data center PUE. For instance, the increased
server power demands under these conditions result in the perverse effect of reducing the effective PUE at
these higher temperatures—at the expense of increased absolute energy consumption. The PUE metric is
intended to help operators understand a data center’s overall efficiency and reduce energy consumption.
Using the increased server power consumption to manipulate the presented PUE figure is an approach that
is not advocated.
Along with the increase in fan power consumption, an even more important effect for data center designers
is the change in the required airflow volume with changes in temperature. This relationship is shown in
Figure 4.
Source: ASHRAE Whitepaper –
2011 Thermal Guidelines for Data
Processing Environments
Figure 4. Relative change in server airflow with inlet temperature
Page 18
PAGE 18
Figure 4 shows that, compared to operation at 20OC, operation at 35OC in 2011 with A2 class servers
could require more than twice the volume of airflow to maintain the correct internal component
temperature. For data centers, this is a very different design point; airflow volume now becomes as
important as temperature and humidity control. Similar to the increase in power consumption, it is
expected that A3 class servers will show reduced airflow requirements compared to A2 class servers at the
same temperature.
V. Exploiting Air-Side Economizer Cooling
To support the exploitation of economized cooling approaches, The Green Grid published two sets of free
cooling maps, first in 2009 and again in 2012. The 2009 free cooling maps4 and tools5 enable data center
operators in North America, Japan, and Europe to identify the level of benefit that air-side and water-side
economized cooling would bring while working in the ASHRAE Recommended range of up to 27OC. The
2009 map for Europe, Figure 5, uses light-to-dark blue shading to show that most European data centers
could expect at least 7,000 hours a year of air-side economizer operation when the external temperature
was less than 27OC. This represents up to 80% of operating time.
Figure 5. 2009 Europe free cooling map 27oC
Page 19
PAGE 19
Figure 6. 2009 North America free cooling map 27oC
Figure 6 shows the corresponding map for North America, where the 7,000-hour line is more restricted due
to the climate. That said, the 5,500-hour-and-above line (shaded in green to dark blue) represents 60% of
operational time and covers much of the United States and Canada. This offers data centers significant
potential for energy savings by operating up to the limits of the ASHRAE Recommended range of 27OC.
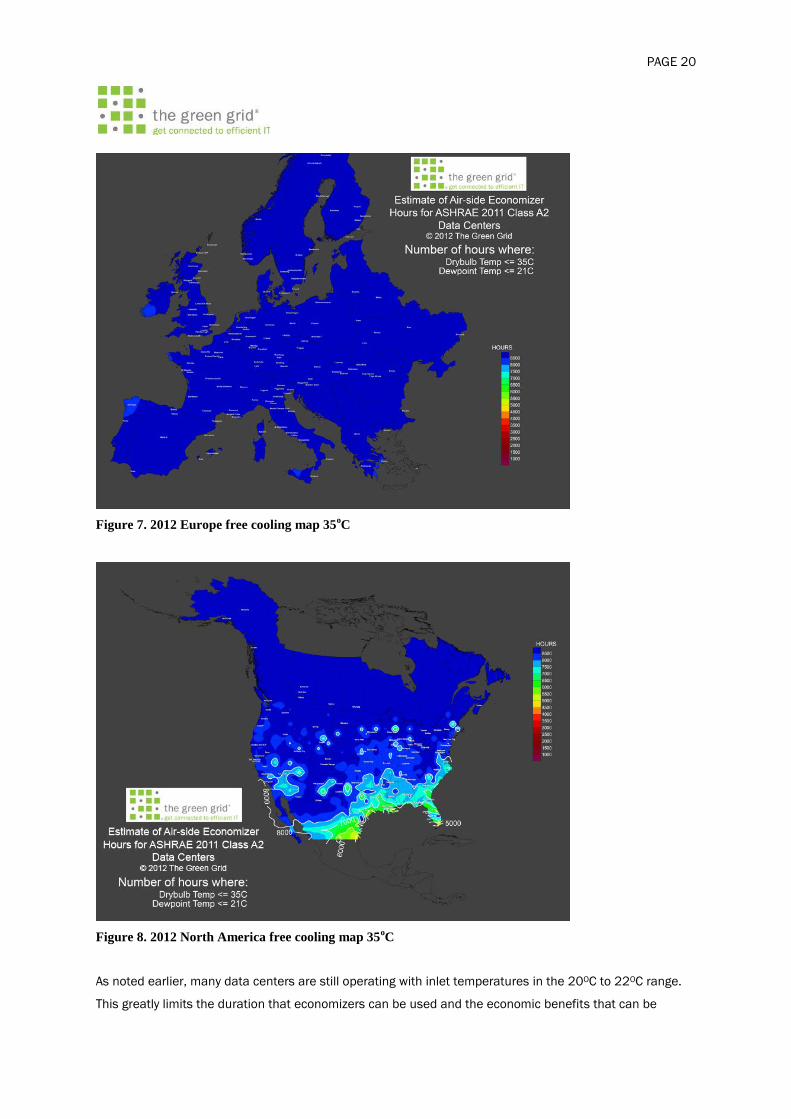
The Green Grid’s 2012 maps6 illustrate operation up to the limits of the ASHRAE A2 Allowable range of
35OC and show a potentially greater impact of the use of economizers. Figure 7 shows that 99% of
locations in Europe can use the A2 Allowable range and take advantage of economizer mode cooling all
year. Figure 8 illustrates that 75% of North American data centers can operate economizers up to 8,500+
hours per year.
Page 20
PAGE 20
Figure 7. 2012 Europe free cooling map 35oC
Figure 8. 2012 North America free cooling map 35oC
As noted earlier, many data centers are still operating with inlet temperatures in the 20OC to 22OC range.
This greatly limits the duration that economizers can be used and the economic benefits that can be
Page 21
PAGE 21
derived, although The Green Grid’s recent economizer survey suggested even that limited operating range
would result in 20% lower operating costs. Where good airflow practices are used—such as contained
aisles to provide consistent supply temperatures to all devices irrespective of placement—the energy
savings benefit from limited operation at up to 27OC (as illustrated in The Green Grid free cooling tool) is
significantly greater.
It is important to note that any increase in total server energy consumption resulting from a rise in inlet
temperature in an air-side economized data center is likely to prove inconsequential in comparison to the
data center build and running costs associated with a restricted operating range and the use of
mechanical chiller based cooling. In other words, the incremental costs from operating an air-side-cooled
data center, with occasional increased server energy consumption, are almost certainly lower than the
extra cost associated with using mechanical cooling to maintain a constant supply temperature when
external ambient temperatures are toward the top of the range. In most cases, where the supported
environmental range is not exceeded, installing mechanical cooling to reduce the inlet temperature to
achieve lower server energy consumption would not prove to be an overall cost- or energy-efficient
approach.
THE EFFECT OF BROADENING OPERATING REGIMES
To explain the effect on reliability of higher supply temperatures, ASHRAE published data in its 2011 paper
that shows the ambient temperature range for major international cities, as expressed in 5OC-bin
increments. This data illustrates the duration that devices would likely need to operate at above 20OC in a
data center with only air-side economization. The data includes a reasonable assumption of an increase in
data center supply air temperature of 1.5OC above the outdoor ambient temperature.
0%
20%
40%
60%
80%
100%
Osl
o
London
San
Fra
ncisc
o, CA
Frankf
urt
Syd
ney
Rom
e
Tokyo
Wash
ingto
n, DC
Perc
en
tag
e o
f year
30 - 35C
25 - 30C
20 - 25C
20C
Reformatted
from ASHRAE
2011
Page 22
PAGE 22
Figure 9. Percentage of the year during which major international cities’ temperatures fall within the
ASHRAE class A2 Allowable range
Figure 9 is an example of the ASHRAE 2011 data for cities across the world. The figure’s blue shaded
areas show the percentage of time that the data center can expect to operate with an external air supply
temperature below 20OC. The purple shaded area illustrates the percentage of operating time between
20OC and 25OC, and the figure continues to show the percentage of expected operating time, expressed in
yellow and green, up to 35OC. This data illustrates that, for some major international cities, the external
temperature is only above 20OC for less than 10% of the year. If the region up to 25OC is included, the
duration of time above 25OC ranges from less than 20% down to less than 2%. Thus, the higher the
allowable inlet temperature, the more geographic areas that can be considered for exclusively air-side
economized data center cooling.
If the temperature duration data for a particular data center location is combined with the reliability data
for each temperature increment (as presented earlier in Figure 2), the impact on overall reliability and
failure rates for different operating regimes can be determined. This operating approach assumes that the
supply temperature tracks the external temperature and that appropriate airflow management is
implemented to avoid hot spots. Low external temperatures are mitigated by the reintroduction of hotter
exhaust air (recirculation).
A number of different data center operating scenarios can be considered for economizer operation. The
ASHRAE 2011 paper uses an example of a data center located in Chicago, where the temperature is below
20OC for much of the year. Chicago reaches higher temperatures during the summer months, but only for
limited periods. The supply temperature tracks the external air temperature down to a minimum of 15OC
and up to a maximum of 35OC. From the prior discussion on the nature of the failure rate distribution,
recall that the effect of server operations with inlet temperatures below 20OC tends to reduce the failure
rate. Correspondingly, operating at above 20OC tends to increase the failure rate. The time the average
data center server operates at a given temperature determines the actual expected failure rate within that
data center. The aggregate failure rate for the example Chicago operating regime is calculated as 0.99,
compared to a failure rate of 1 for this white paper’s baseline: continuous operation at 20OC.
Using this same approach, Figure 10 illustrates the effect on overall server reliability at a given data center
for some select international cities. This figure uses the ASHRAE temperature data for those cities, along
with the corresponding reliability data.
Page 23
PAGE 23
0.6
0.8
1
1.2
1.4
Osl
o
London
San
Fra
ncisco
, CA
Frankf
urt
Mex
ico C
ity
Syd
ney
Rom
e
Tokyo
Wash
ingto
n, DC
Sao
Pao
lo
Hong K
ong
Ban
galore
Sin
gapore
Rela
tive F
ailu
re R
ate
30 - 35C
25 - 30C
20 - 25C
15 - 20C
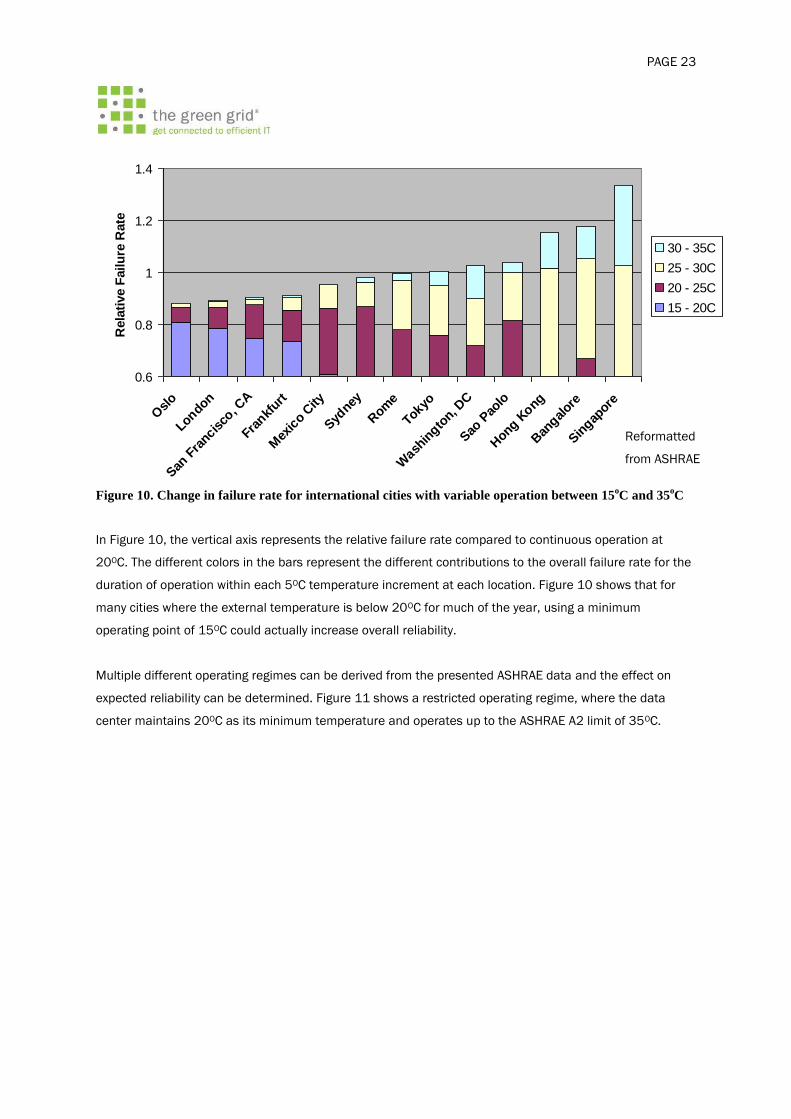
Figure 10. Change in failure rate for international cities with variable operation between 15oC and 35
oC
In Figure 10, the vertical axis represents the relative failure rate compared to continuous operation at
20OC. The different colors in the bars represent the different contributions to the overall failure rate for the
duration of operation within each 5OC temperature increment at each location. Figure 10 shows that for
many cities where the external temperature is below 20OC for much of the year, using a minimum
operating point of 15OC could actually increase overall reliability.
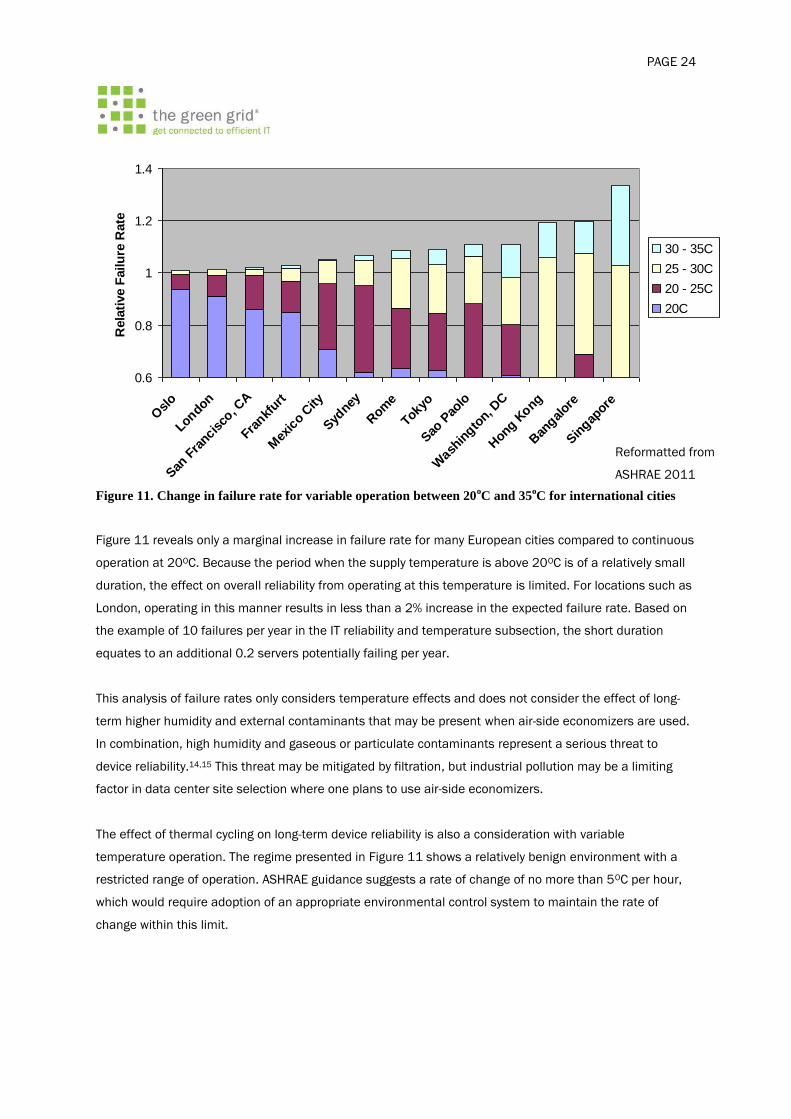
Multiple different operating regimes can be derived from the presented ASHRAE data and the effect on
expected reliability can be determined. Figure 11 shows a restricted operating regime, where the data
center maintains 20OC as its minimum temperature and operates up to the ASHRAE A2 limit of 35OC.
Reformatted
from ASHRAE
2011
Page 24
PAGE 24
0.6
0.8
1
1.2
1.4
Osl
o
London
San
Fra
ncisco
, CA
Frankf
urt
Mex
ico C
ity
Syd
ney
Rom
e
Tokyo
Sao
Pao
lo
Wash
ingto
n, DC
Hong K
ong
Ban
gal
ore
Sin
gap
ore
Rela
tive F
ailu
re R
ate
30 - 35C
25 - 30C
20 - 25C
20C
Figure 11. Change in failure rate for variable operation between 20oC and 35
oC for international cities
Figure 11 reveals only a marginal increase in failure rate for many European cities compared to continuous
operation at 20OC. Because the period when the supply temperature is above 20OC is of a relatively small
duration, the effect on overall reliability from operating at this temperature is limited. For locations such as
London, operating in this manner results in less than a 2% increase in the expected failure rate. Based on
the example of 10 failures per year in the IT reliability and temperature subsection, the short duration
equates to an additional 0.2 servers potentially failing per year.
This analysis of failure rates only considers temperature effects and does not consider the effect of long-
term higher humidity and external contaminants that may be present when air-side economizers are used.
In combination, high humidity and gaseous or particulate contaminants represent a serious threat to
device reliability.14,15 This threat may be mitigated by filtration, but industrial pollution may be a limiting
factor in data center site selection where one plans to use air-side economizers.
The effect of thermal cycling on long-term device reliability is also a consideration with variable
temperature operation. The regime presented in Figure 11 shows a relatively benign environment with a
restricted range of operation. ASHRAE guidance suggests a rate of change of no more than 5OC per hour,
which would require adoption of an appropriate environmental control system to maintain the rate of
change within this limit.
Reformatted from
ASHRAE 2011
Page 25
PAGE 25
CALCULATING THE EFFECT OF OPERATION IN THE ALLOWABLE RANGE
The reliability data provided by ASHRAE can be used to explore the effect of using the full ASHRAE
Allowable range to maximize the benefits from economizers for a specific data center location. It goes
without saying that a key pre-requisite is to implement appropriate airflow management best practices,
thereby providing complete control over the environmental conditions within the data center. The following
is a sample approach to calculating the net change in overall reliability for a specific location.
This calculation uses the relative change in equipment failure rate, or “X-factor,” at a specific temperature
to calculate the “Net X-factor” for a location. The Net X-factor for a location is a measure of the impact on IT
server reliability by allowing the operating temperature in the data center to track the external ambient
temperature closely. An X-factor value of 1 is the reliability of IT servers in a data center that operates at
20OC continuously. If the calculated Net X-factor is less than 1, then IT server reliability could increase
compared to running the data center at 20OC continuously. If the calculated Net X-factor is greater than 1,
then reliability of the IT servers will be reduced compared to continuous operation at 20OC. Rather than
exploiting the entire range, data center operators may decide to manage the temperature range with the
intent on realizing a Net X-factor below 1, while potentially achieving significant cooling-based energy
savings. Note that the figures provided by ASHRAE only relate to volume industry standard servers. Device
failure rates and temperature characteristics may well be different for other classes of devices deployed in
a data center. Operators are advised to work with their respective device vendors to understand the
temperature characteristics and potential failure rate distributions of all deployed devices at their sites.
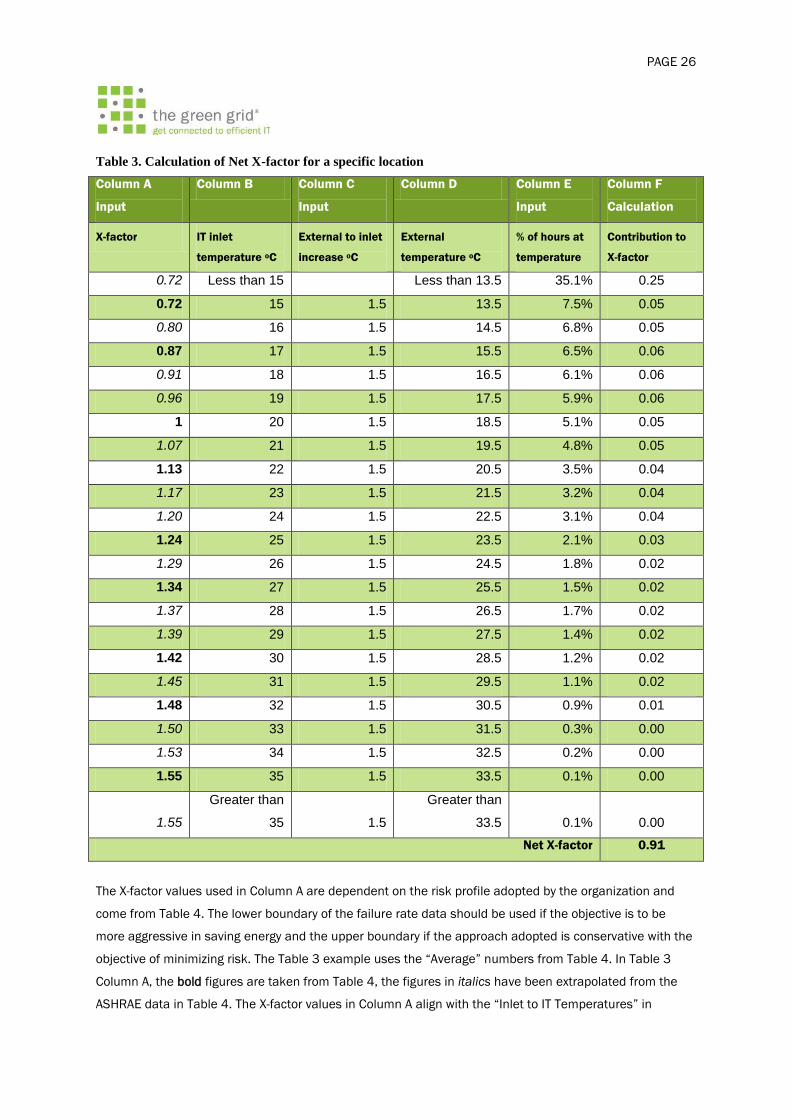
Table 3 is an illustration of how to calculate the Net X-factor for a specific location, with the final result
presented at the bottom of Column F.
Page 26
PAGE 26
Table 3. Calculation of Net X-factor for a specific location
Column A
Input
Column B Column C
Input
Column D Column E
Input
Column F
Calculation
X-factor IT inlet
temperature oC
External to inlet
increase oC
External
temperature oC
% of hours at
temperature
Contribution to
X-factor
0.72 Less than 15 Less than 13.5 35.1% 0.25
0.72 15 1.5 13.5 7.5% 0.05
0.80 16 1.5 14.5 6.8% 0.05
0.87 17 1.5 15.5 6.5% 0.06
0.91 18 1.5 16.5 6.1% 0.06
0.96 19 1.5 17.5 5.9% 0.06
1 20 1.5 18.5 5.1% 0.05
1.07 21 1.5 19.5 4.8% 0.05
1.13 22 1.5 20.5 3.5% 0.04
1.17 23 1.5 21.5 3.2% 0.04
1.20 24 1.5 22.5 3.1% 0.04
1.24 25 1.5 23.5 2.1% 0.03
1.29 26 1.5 24.5 1.8% 0.02
1.34 27 1.5 25.5 1.5% 0.02
1.37 28 1.5 26.5 1.7% 0.02
1.39 29 1.5 27.5 1.4% 0.02
1.42 30 1.5 28.5 1.2% 0.02
1.45 31 1.5 29.5 1.1% 0.02
1.48 32 1.5 30.5 0.9% 0.01
1.50 33 1.5 31.5 0.3% 0.00
1.53 34 1.5 32.5 0.2% 0.00
1.55 35 1.5 33.5 0.1% 0.00
1.55
Greater than
35 1.5
Greater than
33.5 0.1% 0.00
Net X-factor 0.91
The X-factor values used in Column A are dependent on the risk profile adopted by the organization and
come from Table 4. The lower boundary of the failure rate data should be used if the objective is to be
more aggressive in saving energy and the upper boundary if the approach adopted is conservative with the
objective of minimizing risk. The Table 3 example uses the “Average” numbers from Table 4. In Table 3
Column A, the bold figures are taken from Table 4, the figures in italics have been extrapolated from the
ASHRAE data in Table 4. The X-factor values in Column A align with the “Inlet to IT Temperatures” in
Page 27
PAGE 27
Column B. The lowest operating temperature is limited to 15OC, and the highest allowed operating
temperature is 35OC, aligning with ASHRAE class A2.
The temperature rise from external ambient air temperature to the IT inlet temperature is entered in
Column C of Table 3. For an air-side-economized site, +1.5OC is assumed due to mechanical air handling.
For any given data center location, the hourly temperature bin data must be obtained. This can be sourced
from the ASHRAE Weather Data Viewer16 or from the relevant national weather bureau. This temperature
bin data is used to populate Column E of the table. Column D specifies the (external) temperature “bin”,
the percentage of hours for the given location at the specified external air temperature as taken from the
bin data is populated in Column E. Column F calculates the contribution to the Net X-factor by multiplying
the X-factor from Column A with the percentage of hours in Column E. The Net X-factor is the summation of
the values in Column F and is presented at the bottom of the column. In this Table 3 example, the Net X-
factor is 0.91, which represents an overall reduction in the temperature-induced equipment failure rate.
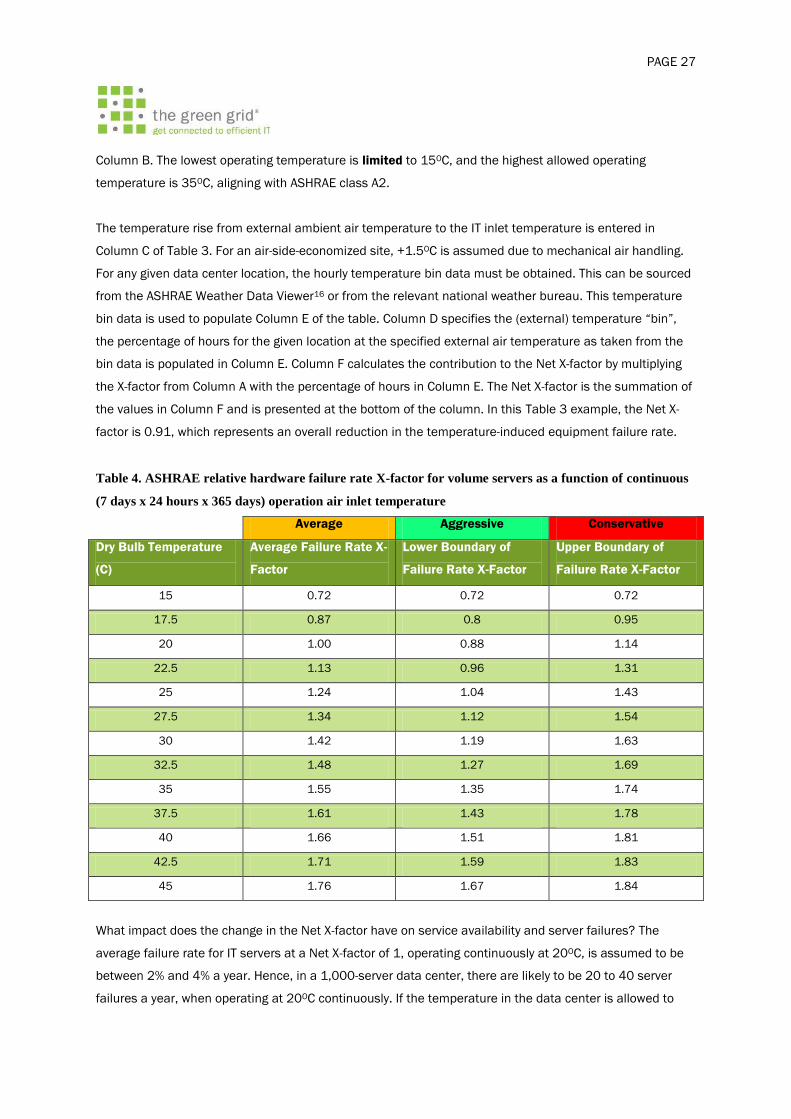
Table 4. ASHRAE relative hardware failure rate X-factor for volume servers as a function of continuous
(7 days x 24 hours x 365 days) operation air inlet temperature
Average Aggressive Conservative
Dry Bulb Temperature
(C)
Average Failure Rate X-
Factor
Lower Boundary of
Failure Rate X-Factor
Upper Boundary of
Failure Rate X-Factor
15 0.72 0.72 0.72
17.5 0.87 0.8 0.95
20 1.00 0.88 1.14
22.5 1.13 0.96 1.31
25 1.24 1.04 1.43
27.5 1.34 1.12 1.54
30 1.42 1.19 1.63
32.5 1.48 1.27 1.69
35 1.55 1.35 1.74
37.5 1.61 1.43 1.78
40 1.66 1.51 1.81
42.5 1.71 1.59 1.83
45 1.76 1.67 1.84
What impact does the change in the Net X-factor have on service availability and server failures? The
average failure rate for IT servers at a Net X-factor of 1, operating continuously at 20OC, is assumed to be
between 2% and 4% a year. Hence, in a 1,000-server data center, there are likely to be 20 to 40 server
failures a year, when operating at 20OC continuously. If the temperature in the data center is allowed to
Page 28
PAGE 28
track the external ambient temperature with the aim of achieving a Net X-factor of less than 1, then a
reduction in server failures should be realized. In Table 3, the Net X-factor is 0.91, which means that, by
allowing the data center to track the external temperature, the IT server failures should reduce by 9% for
this location in contrast to the baseline. For a 1,000-server data center, this corresponds to 18 to 36
server failures. This number of failures is less than when operating at 20OC continuously.
THE EFFECT ON DATA CENTER ENERGY CONSUMPTION
The choice of operating regime and exploitation of the Recommended or Allowable ranges, or even part of
these ranges, has a considerable impact on energy consumption and overall data center operating costs.
The data presented in The Green Grid free cooling maps in Figure 5, Figure 6, Figure 7, and Figure 8
illustrates the possible geographical exploitation of economizers and good airflow management, and it
represents a large potential reduction in energy consumption.
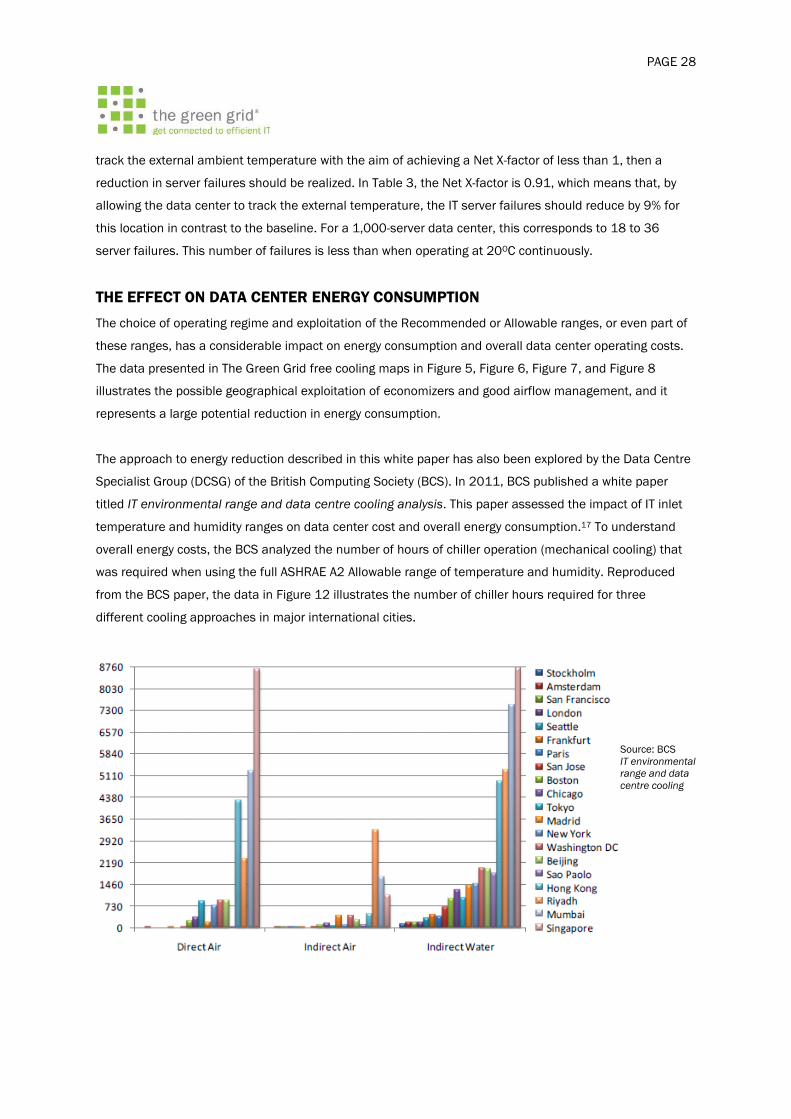
The approach to energy reduction described in this white paper has also been explored by the Data Centre
Specialist Group (DCSG) of the British Computing Society (BCS). In 2011, BCS published a white paper
titled IT environmental range and data centre cooling analysis. This paper assessed the impact of IT inlet
temperature and humidity ranges on data center cost and overall energy consumption.17 To understand
overall energy costs, the BCS analyzed the number of hours of chiller operation (mechanical cooling) that
was required when using the full ASHRAE A2 Allowable range of temperature and humidity. Reproduced
from the BCS paper, the data in Figure 12 illustrates the number of chiller hours required for three
different cooling approaches in major international cities.
Source: BCS
IT environmental
range and data
centre cooling
analysis
Page 29
PAGE 29
Figure 12. Annual worldwide chiller hours necessary when using ASHRAE class A2 range with different
cooling approaches
Figure 12 reveals that when a data center is designed and operated effectively, the hours per year during
which any mechanical chiller cooling is required are minimal. Three different types of cooling economizer
are represented here: direct air-side, indirect air-side, and indirect water-side. The analysis in the BCS
paper shows that, for many locations, only a limited number of chiller hours are required if data center
operators exploit the full ASHRAE A2 Allowable range up to 35OC. However, the paper also shows that very
high humidity levels in cities such as Mumbai and Singapore would seem to preclude the use of direct air
cooling in those locations. The BCS paper concludes that operating at up to 35OC is therefore effective in
reducing the energy consumption associated with mechanical chiller–based cooling. Furthermore, by
reducing that consumption to a small proportion of the data center’s overall energy consumption, the data
center reduces its PUE.
In addition, the BCS analysis shows that, where there is an available supply of water, adiabatic
(evaporative) cooling can be used as a replacement for chillers. Direct evaporative cooling (DEC) injects
water directly into the air supply and results in cooling of the intake air through vaporization of some of the
water. It is an approach to cooling that is rapidly becoming accepted. For example, Facebook recently
disclosed that it built a data center in Oregon18 using direct evaporative cooling.
The BCS paper further concludes that completely eliminating mechanical chillers delivers benefits such as
associated capital cost reduction and elimination of the chillers’ supporting electrical equipment capacity
in data center design. However, the elimination of chillers had no significant impact on operational costs,
energy consumption, or PUE in the BCS analysis due to limited chiller operation in the explored scenario.
The decision to eliminate chillers entirely in a design is not to be taken lightly because of the risk of
extreme climate events. The implementation of a closed-loop cooling design (with or without mechanical
cooling) may also be a requirement in areas where there is risk of significant industrial pollution or airborne
particulates.
EXTREME TEMPERATURE EVENTS
In addition to considering a location’s average annual temperature and humidity profile to determine the
appropriate operating regime, the occurrence of extreme temperature events must also be considered. The
ASHRAE 2011 paper highlights this necessity, pointing out that peak temperatures may deviate
significantly from a location’s average figures. The BCS paper also identifies extreme temperature events
as a consideration for whether chillers can be completely eliminated from data centers.
Page 30
PAGE 30
Temperatures as high as 50OC have been recorded in some U.S. states and in Seville, Spain. Temperatures
at this level will require data centers to use chillers or adiabatic/evaporative cooling in conjunction with
economizers, irrespective of the environmental range supported by the IT hardware.
VI. Equipment Supporting Higher Operating Ranges
Telecommunications equipment for many years has conformed to the European Telecommunications
Standards Institute (ETSI) EN 300 019 Class 3.1 standards or the equivalent Network Equipment Building
System (NEBS) Level 3 standard in terms of supported environmental ranges. These standards enable
deployment of ruggedized IT equipment in a wider range of physical environments than IT-orientated data
centers. Among characteristics specific to operation within telecommunications sites, such as seismic
mounting and optional 48V direct-current (DC) operation, telecommunications-rated IT equipment is
required to operate at up to 40OC and in exceptional conditions at up to 45OC. Data center operators who
want to exploit the ETSI or NEBS environmental characteristics to make greater use of economizers
therefore face a restricted choice of devices, with potentially limited performance and largely higher costs.
Telecommunications-rated equipment typically comes at a cost premium compared with commercially
available volume servers. To achieve the telecommunications design point at a reasonable cost, many
vendors use commercially available off-the-shelf (COTS) server components, typically designed to support
the ASHRAE A2 range. However, to enable standard heat sinks and fans to dissipate thermal energy at the
higher peak NEBS/ETSI operating temperature, the vendors limit their equipment’s heat production by
using lower-performance and lower-power processors. The available range of telecommunications-rated
equipment is also only a fraction of the complete commercial range, as a consequence of the narrower
market.
In recognition of operators’ desire for IT equipment that can improve efficiency and reduce data center
capital and operational costs while maintaining existing standards of reliability, ASHRAE introduced the
new A3 and A4 classes. Class A4 is largely equivalent to ETSI EN 300 019 Class 3.1 or NEBS Level 3.
Introduction of these classes represents a departure by ASHRAE from previous practice in 2004 and 2008,
where all vendors agreed to support class 1 or class 2. ASHRAE has moved to an approach that outlines a
number of environmental ranges, where vendors can choose to release products supporting specific
classes based on user requirements, demand, and feedback.
Product evolution is enabling this move; several vendors have released new product ranges that support
the A3 class. Over time, natural hardware obsolescence and equipment replacement cycles will refresh
entire data center inventories with A3 class or higher equipment.
Page 31
PAGE 31
However, to support data center operators in taking advantage of the wider Allowable range, IT vendors still
need to provide more clarity around the duration of operation supported and warranties for operation
within the Allowable range.
VII. Implications for the Design and Operation of Data Centers
Raising operational temperatures in a data center can affect more than its IT equipment. The following
section discusses key data center design factors to consider when planning for extended environmental
ranges. Higher-temperature operation, if only for limited durations, brings new operational challenges for
data centers. It is highly unlikely that simply taking an existing data center and increasing its operating
temperature will result in a successful transition. Several basic air-management and operational areas
need to be reviewed for applicability, including:
Health and safety concerns for operating personnel
Airflow optimization throughout the data center’s layout to avoid (very) hot spots
Increased temperature in the hot aisle, which may extend beyond limits of cabling
Increased temperature, humidity, and particulates effects
PUE anomalies due to server fan power consumption at high temperatures
HEALTH AND SAFETY
Increasing the airflow driven through a server also has an effect on fan noise, with the sound level
increasing at the 5th power of the rotational speed. European health and safety guidelines already dictate
the maximum noise level for IT equipment, and any future server cooling improvements will have to be
achieved within the same noise limits. An obvious solution to limit noise and increase airflow in servers is
the use of larger fans and server form factors. Systems with small form factors, such as 1U servers, need
to move similar volumes of air but with smaller fans, necessitating higher fan speeds to move the required
amount of air. In addition to the extra power drawn, the subsequent increase in speed also amplifies the
noise, resulting in increased background noise. Consideration should be given to working procedures
associated with the increased noise that may result from higher operating temperatures.
A second health and safety consideration is the exhaust air temperature, which again may inhibit higher
temperature operation. Exhaust temperature is dependent on inlet temperature, server power
consumption, and airflow—in extreme cases, exhaust temperature can be 20OC more than inlet
temperature. In a contained aisle configuration, this could result in hot aisle temperatures of over 50OC.
Raised exhaust air temperature has significant implications for operational working practices within data
centers with regard to maintenance and device installation.
Page 32
PAGE 32
Both of the above considerations can be addressed by using service windows where the temperature is
reduced through additional cooling; this occasional cooling necessitates the provision of plant and control
capabilities to deliver it.
HIGHER TEMPERATURES AFFECT ALL ITEMS IN THE DATA CENTER
Increased temperature has implications for the selection of cabling and power distribution components in
the hot aisle, where previously no temperature rating considerations were necessary. While limited
research is available on the effect of temperature on power and network cables, there is some evidence
that Category 6 cabling is affected by increased temperature. Category 5 and Category 6 cables have a
temperature range of -10 to +60OC, although beyond 40OC, the bandwidth and signal-to-noise ratio reduce
considerably.19 More research is required to identify the effects of increased temperatures on all of the
components of the data center. With increased inlet temperature, the hot aisle temperature needs to be
monitored to ensure that the data center’s overall temperature does not exceed the design parameters for
all its peripheral equipment, cables, and hardware.
Other rack-based equipment such as power distribution units (PDUs) and network switches have distinct
operating envelopes with an upper limit of around 45OC. This limit can easily be exceeded if the inlet
temperature rises above 35OC.
AIRFLOW OPTIMIZATION
All data centers will normally have some variance of temperature throughout the layout of a rack or row.
Enclosed aisles generally improve the distribution considerably, but care must still be taken during a data
center’s design and operation to ensure that hot spots are reduced. When increasing the overall server
inlet temperature in a data center, those areas prone to hot spots need close monitoring to ensure that
variations do not exceed the operational envelopes. Implementation of cooling best practices such as
those in The Green Grid Data Center Maturity Model20 and the EU Code of Conduct on Data Centre
Efficiency12 can ensure that any hot spots are mitigated. As discussed earlier in this paper, there is a
tendency to use equipment’s supported temperature envelope as a basis for mitigating the effect of
changes in airflow and cooling due to alterations in data center layout. Care should be taken when
implementing any changes in an existing data center to ensure that the supported temperature envelope
has not been used in this fashion in any previous decisions on layout.
TEMPERATURE EVENTS
A cooling plant failure affects most data centers, whether the cooling is achieved by conventional methods
or air handlers in a free-air environment. Temperature envelope monitoring is critical as the ambient
temperature increases, because without a large plenum of air, the temperature can exceed system and
infrastructure design envelopes in a short timeframe.
Page 33
PAGE 33
Data center operators should consider maintaining cooling plant operation via the uninterruptible power
supply (UPS) circuit or backup power in order to overcome the risk of over temperature or thermal runaway.
In this respect, air-economized data centers offer benefits over traditional closed-loop, mechanical chiller
cooled environments, because the lower power consumption of the cooling facilities can allow operation
from the UPS or backup power. Enclosed aisles can also help in this regard.
HUMIDITY CONSIDERATIONS
Relaxing humidity control can deliver substantial energy savings. Dew point maintenance is critical,
however, as is ensuring that all equipment in the data center is suitable for the extended humidity ranges.
This is similar to the due diligence required for those with extended temperature ranges.
DATA FLOOR DESIGN
The most effective method of harmonizing temperatures is normally to separate a data center’s hot and
cold aisles to prevent hot spots and hot air recycling. There are multiple arguments for hot or cold aisle
enclosures, but whatever the decision on design, it is key to ensure that exhaust air is not allowed to mix
with the supply air.
For equipment that has limited extended range operation, including tape devices or mission-critical
hardware, suitable zoning within a data center or the provision of additional spot cooling/control may be an
appropriate solution.
MEASUREMENT AND CONTROL
Data center infrastructure management (DCIM) is another factor requiring careful consideration when
expanding the environmental ranges. When extending the upper and lower environmental boundaries,
variations in airflow can significantly affect delivery of cool air. For example, cool air could be depleted
through an increased volume of air drawn in by equipment as the temperature rises.
To ensure data center equipment reliability, it is vital to monitor temperature and humidity throughout the
airflow. In addition to discrete probes, most systems and components now have temperature probes that
can be accessed through a DCIM tool. These multiple additional probes can be used to map the actual
temperatures of the systems and components throughout the data center. The Green Grid advises active
thermal mapping, combined with occasional thermography activities.
PUBLISHED ENVIRONMENTAL RANGES
Any extension to a data center’s operational range should be based on the published ranges for all of the
equipment in the data center. Those ranges may be difficult to ascertain in data centers with equipment
that is more than three to four years old. Historically, a device’s environmental range was not considered
Page 34
PAGE 34
important, due to the assumption that equipment would remain in a closely controlled environment. This
may mean that the effect of extended ranges was never considered or tested for some equipment, beyond
the closely controlled range. In addition, documentation may have been poorly maintained and the data
may simply no longer be available. Environmental data for more recent systems should normally be
available as a result of the increased importance placed on the energy savings associated with expanded
environmental operation. Equipment that does not conform to more current guidelines should be
segregated to ensure that, where needed, tight control can still be maintained.
VIII. Conclusion
Data centers can realize operational cost savings with minimal effect on IT equipment reliability and
availability. Where applicable, the use of economizers and looser environmental control with an extended
range of temperature and humidity can reduce the amount of energy required to keep IT equipment within
the ranges supported by IT vendors. Data centers can achieve these reductions without substantively
affecting IT reliability or service availability by adopting a suitable environmental control regime that
mitigates the effects of short-duration operation at higher temperatures.
Adopting an extended environmental operating range within a data center to reduce energy consumption is
not straightforward. This paper has highlighted several aspects relating to IT equipment operation as well
as data center and data floor design, all of which need to be considered to successfully deploy an
extended-range approach. Operating at higher temperatures within the ranges defined by ASHRAE prompts
new operational, health and safety, and component-selection considerations associated with the higher
exhaust temperatures that will be encountered in hot aisles.
This paper’s analysis of the reliability data published by ASHRAE shows that many geographic areas can
adopt economizer-based cooling and operate within the supported boundaries of the defined classes. They
can do so with minimal effect on overall reliability due to short-term operation at higher temperatures. In
addition, the introduction of the recently defined A3 and A4 classes, with higher supported peak operating
temperatures, helps many more locations exploit economizer mode cooling to reduce overall energy
consumption.
The data and analysis methodology outlined also enable operators to determine the appropriate control
regime for any data center location to ensure that it continues to meet the business expectations of IT
reliability and service availability. Exploiting an extended operational range may not be appropriate for all
classes of equipment or IT services. Alternative cooling approaches may be appropriate or operators can
segregate equipment and use zoning to ensure that tight environmental control can still be maintained
where necessary. Adopting the best practice of zoning avoids compromising the reliability of critical
equipment or services, while allowing the benefits of utilizing a wider operational range to be applied to the
majority of the data center.
Page 35
PAGE 35
Further supporting this recommendation, some emerging IT hardware platforms are designed to operate at
these higher temperatures with little or no increase in server fan energy consumption. Industry adoption of
the wider ASHRAE operating classes is increasing, and supported products are increasingly becoming
available. How organizations deploy wider operating ranges may be influenced by procurement lifecycles
and equipment selection decisions.
IX. About The Green Grid
The Green Grid Association is a non-profit, open industry consortium of end users, policy makers,
technology providers, facility architects, and utility companies collaborating to improve the resource
efficiency of information technology and data centers throughout the world. With more than 150 member
organizations around the world, The Green Grid seeks to unite global industry efforts, create a common set
of metrics, and develop technical resources and educational tools to further its goals. Additional
information is available at www.thegreengrid.org.
X. References
1 ASHRAE TC 9.9. 2011 Thermal Guidelines for Data Processing Environments – Expanded Data Center
Classes and Usage Guidance (2011) http://goo.gl/Y0H8H.
2 The Green Grid. Survey Results: Implementation of ASHRAE 2008 Environmental Guidelines in Japan
White Paper #43 (2011) http://www.thegreengrid.org/library-and-tools.aspx.
3 The Green Grid, Survey Results: Data Center Economizer Use White Paper #41 (2011)
http://www.thegreengrid.org/en/Global/Content/white-papers/WP41-SurveyResultsData
centerEconomizerUse.
4 The Green Grid, North American, European, and Japan Fresh Air and Water Side Cooling Maps (2009)
http://www.thegreengrid.org/library-and-tools.aspx.
5 The Green Grid, North American, European, and Japan free cooling calculator (2009)
http://cooling.thegreengrid.org/.
6 The Green Grid, Updated Air-side Free Cooling Maps: The Impact Of ASHRAE 2011 Allowable Ranges
White Paper #46 (2012)
Page 36
PAGE 36
http://www.thegreengrid.org/en/Global/Content/white-papers/WP46-UpdatedAirsideFreeCoolingMaps-
TheImpactofASHRAE2011AllowableRanges.
7 Intel, Reducing Data Center Cost with an Air Economizer (2008)
http://www.intel.com/content/www/us/en/data-center-efficiency/data-center-efficiency-xeon-reducing-
data-center-cost-with-air-economiser-brief.html.
8 Neudorfer, Julius, “Deutsche Bank’s New Cool Data Center,” CTOEdge.com (2011)
http://www.ctoedge.com/content/deutsche-banks-new-cool-data-center.
9 Patterson, M.K., The Effect of Data Center Temperature on Energy Efficiency
http://www.eco-info.org/IMG/pdf/Michael_K_Patterson_-
_The_effect_of_Data_Center_Temperature_on_Energy_Efficiency.pdf.
10 Dell, Data Center Operating Temperature: What Does Dell Recommend? (2009)
http://i.dell.com/sites/content/business/solutions/whitepapers/en/Documents/dci-Data-Center-
Operating-Temperature-Dell-Recommendation.pdf.
11 APC, Energy Impact of Increased Server Inlet Temperature (2009)
http://www.apcmedia.com/salestools/JBEN-7KTR88_R1_EN.pdf.
12 European Union, 2012 Best Practices for the EU Code of Conduct on Data Centres (2012)
http://re.jrc.ec.europa.eu/energyefficiency/pdf/CoC/Best Practices v3 0 8 _2_ final release Dec 2011.pdf.
13 ASHRAE TC 9.9. 2012, Third edition of the Thermal Guidelines for Data Processing Environments
http://tc99.ashraetcs.org/.
14 Lawrence Berkeley National Laboratory, Data Center Economiser Contamination and Humidity Study
(2007)
http://hightech.lbl.gov/documents/data_centers/economiserdemoreport-3-13.pdf.
15 ASHRAE, Particulate and Gaseous Contamination in Datacom Environments, American
Society of Heating Refrigeration and Air Conditioning Engineers (2009) 94 pp.
http://www.ashrae.org/resources--publications/bookstore/datacom-series#particulate.
16 ASHRAE, ASHRAE Weather Data Viewer (WDView) CD-ROM
http://www.ashrae.org.
Page 37
PAGE 37
17 BCS - The Chartered Institute for IT, IT environmental range and data centre cooling analysis (2011)
http://dcsg.bcs.org/data-center-cooling-analysis.
18 IEEE, “Under the Hood at Google and Facebook” (2011)
http://spectrum.ieee.org/telecom/internet/under-the-hood-at-google-and-facebook/0.
19 NORDX, The effect of temperature on the bandwidth of telecommunications cabling in commercial
buildings
http://www.belden.com/pdfs/Techpprs/Temperature.pdf.
20 The Green Grid, Data Center Maturity Model White Paper #36 (2011)
http://www.thegreengrid.org/en/Global/Content/white-papers/DataCenterMaturityModel.