Sensor Platform; System Architecture; NDT; Oil Sands; Mining
I. INTRODUCTION
Sprouts is a rugged, low power, cost effective, modular, open-source, and multi-standard WSN platform designed for large scale networks such as the Internet of Things (IoT) [1]. The physically small size (23x10mm) of the Sprouts platform, in combination with its metallic packaging, seen in Figure 1 C, allows the platform to be a great candidate for industrial environments such as the Oil Sands. In addition, Sprouts has four attachment ports available for plug-and-play (PnP) sensor-modules, seen in Figure 1 A. Sensor-modules can be generic, such as a temperature sensor, or a custom built sensor-module that is application dependent, such as our ultrasound thickness module described in this paper. Attached sensor-modules to the Sprouts platform are automatically detected and installed via a remote server, with options to configure, calibrate, or software update sensor-modules as needed. This seamless and user friendly method of detecting attached sensor modules allows Sprouts to be extremely easy to operate by nontechnical users.
A. B. C. D. Figure 1 Sprouts sensor platform: A. Four sensor bus ports. B. Stackable C.
small metallic packaging D. Mount-on-metal patch antenna
Monitoring industrial equipment is an important factor in an industrial facility, yet some equipment operate without electronic sensory feedback (i.e. sensor-less). Instead, an expected lifetime is provided for some sensor-less equipment. The absence of sensors can be due to many factors, such as lack of technical expertise to embed sensors, sensor placement difficulties, extremely hash operating environment, cost, etc. Thus, it becomes the responsibility of the operator to understand the normal operating conditions through experience and manual maintenance. When the operator does realize abnormalities or failures in the operation, irreversible damage might have already occurred that could have been prevented with embedded wireless sensors. In addition, some failures might lead to extreme profit loss, damage to the surrounding equipment or operators, product quality reduction, etc. Therefore, we have designed Sprouts to aid in monitoring sensor-less equipment by means of important features such as small dimensions, general purpose, customization, modularity, PnP interface, user friendly, low cost, ultra low power, and physically rugged to sustain harsh environments. Oil production facilities in the Oil Sands of northern Alberta, Canada, are a great example of extremely harsh operating environments for sensors as well as equipment. With winter temperatures that can reach -40oC and the constant flow of erosive sand throughout the mining operations, recurring failures of equipment increases and the need to monitor sensor-less equipment becomes necessary for constant oil production.
In this paper, we discuss the use of Sprouts WSN platform to monitor large sensor-less vibration screens, as depicted in Figure 2, which are used to filter large ores from entering the hydrotransport pipeline. The vibration screens are composed of a steel mesh coated with a 4 to 5mm tungsten layer to extend the operational lifetime to approximately 2000 hours. However, abnormalities such as the chipping of the tungsten layer can occur causing the formation of large apertures in the mesh screen; thus, allowing large ores to sift through. Accumulation of large ores can congest the hydrotransport pipeline leading to a disruption in the production chain. Manually checking the mesh screens halts production resulting in profit loss, and the introduction of human related errors in the assessment of the mesh screen lifetime, such as premature replacements. Therefore, Sprouts was used to monitor the thickness of the steel layer and the tungsten layer using three types of custom designed sensors in a custom designed module, while
leveraging the vibration motion of the screen to harvest energy and extend battery lifetime.
Figure 2 Sprouts Application in the Oil-Sands. Sprouts platform is located
underneath the intersection ligaments of the vibration screen.
The paper is organized as follows: Section II discusses related work. Section III describes the architecture of Sprouts WSN platform and its unique capabilities for monitoring industrial equipment. Section IV describes the two passive sensor solutions designed to monitor faults in the vibration screen by utilizing the vibration screen water jets and the erosion of sand flow. Section V describes the details of our ultrasound-based thickness measurement solution to monitor the steel and tungsten layer. Section VI describes our Sprouts PnP protocol in autonomously identifying and registering attached modules. Section VII draws a conclusion on the work done in this paper.
II. RELATED WORK Monitoring the reliability of industrial equipment using
WSN technology has many benefits including estimating the probability of failures, damage control, increases quality control, detection of fault sources, increased production efficiency, statistical knowledge, and more [2]. To the best of our knowledge, there are no references that address monitoring of vibration screens used within oil refineries in the Oil Sands using WSN technology. Therefore, we examined similar research efforts addressing the use of WSNs within industrial environments. In [3], the Anshan project deploys MICL2 nodes to monitor abnormal temperature changes of rollers’ bearings used in cold rolling mills and predict equipment faults. However, the MICL2 platform was specifically designed for this project, it is relatively large, and lacks the necessary features to make it adaptable for other applications, such as modularity, expansion ports, PnP operation, and a standard wireless network. Sprouts can replace the MICL2 node by using a temperature sensor module on one of its PnP ports to monitor the temperature of bearings. PIPENET [4], is a project that uses WSNs to monitor the structural integrity of bulk-water transmission pipelines by analyzing acquired data such as acoustic/vibration, flow, and pressure. PIPENET uses Intel Motes, which are high performance nodes designed with hardware and software features typically used in smart-phones rather than low power WSNs. The use of Intel Motes was necessary in order to carry out near real-time aggressive data acquisition and analysis. Sprouts platform is better suitable for low data rate applications due to its small coin battery. However, our PnP ports allow the use of an external power supply to increase duty cycles. Therefore, Sprouts can be utilized in the PIPENET project using one or more custom built PnP sensor modules. An elaborate comparison between Sprouts and other WSN platforms can be found in [1].
III. SPROUTS SYSTEM ARCHITCTURE
Sprouts platform has a versatile system architecture based on a modular PnP architecture throughout the hardware and software layers. The platform was uniquely designed and implemented for the Internet of Things (IoT) with emphasis on small physical dimensions, rugged packaging, ultra low power, modularity, PnP operation, energy harvesting, and remote triggering which are features conducive for industrial use. The hardware architecture is composed of modular layers as seen in Figure 3. Sprouts uses a neodymium 20x2mm disc magnet to easily attach the platform on metallic equipment. The sensor layer provides four standard communication ports for attachable modules. The CPU and RF layer hosts the local ARM Cortex M3 microcontroller (MCU) EFM32G230F128, as well as the Bluetooth Low Energy (BLE) transceiver (Tx/Rx) nRF8001. The energy harvesting layer is responsible for converting the vibration motion of the screen into usable energy through a piezoelectric transducer as discussed in our previous paper [5]. Excess harvested energy is stored into a rechargeable ML-2020 battery. The antenna is an important part of the platform, as Sprouts utilizes a flat patch antenna, seen in Figure 1 D, which also serves as a cover for the metallic package. The unique advantage of patch antennas is the bottom ground layer which allows the platform to be mounted on metal without effecting antenna performance. In addition, patch antennas are flat and do not exhibit any mechanical moving parts making them better suited for harsh industrial environments. Furthermore, Sprouts uses a cylindrical aluminum, copper, or steel packaging 23mm in diameter and only 10mm in height, allowing the package to be light and robust. Finally, an application dependent custom layer can be added as necessary; however, most customizations can be accomplished using attachable modules. Multiple energy harvesting sources can be utilized such as wireless power transfer (WPT), which is also used for remote wakeups, and vibration energy harvesting (VEH) [1].
Figure 3 Sprouts modular platform Architecture
Sprouts builds upon our Dynamically Reconfigurable Energy Aware Middleware Software (DREAMS) architecture as described in [6]. The DREAMS architecture is based on modular software components that can be remotely uploaded and configured based on the amount of energy available and the rate in which energy is harvested. The DREAMS architecture simplifies middleware architecture implementation complexity, decreases faults associated with low energy sources, and increases design flexibility associated with remote upgrades. In [6], we discuss how DREAMS is uniquely different than other middleware approaches for energy-harvesting WSNs. Furthermore, the module-based middleware architecture of DREAMS lends itself towards a graphical-based
Tx/Rx
Sta
nd
ard
Exp
an
sio
n B
us
WPT
ARM-C M3 MCU
Energy Harvesting Management VEH
Backup Battery
Power Supply La
yer
1
Laye
r N
Other Energy Sources
Remote Wakeup
89
programming similar to that of Labview, which is an intuitive method of programming for non computer science users. Therefore, users with little technical background can learn to reprogram Sprouts nodes. DREAMS architecture is currently being integrated with Labview’s C-code generation tool.
IV. PASSIVE-POWERED SENSORS
Energy can be harvested from the vibration screen by utilizing piezoelectric material from a modified low cost 20mm buzzer disc, which is normally used to produce sound. With the small physical confinement of the platform, the amount of power produced using the small buzzer-disc is approximately 6µW, or 2µA at 3.0V. This is an extremely small amount of power, yet very valuable. Source nodes in WSNs spend most of their time in deep sleep modes to conserve energy. While in deep sleep mode, current is constantly depleting at very small quantities over time, approximately 1.0 µA at 3.0V, in order to allow RAM retention and an ultra low power timer for periodic wakeup-interrupts. When we accumulate the amount of deep sleep energy spent, we can quickly notice how this energy can dominate the total energy expenditure during the lifetime of the source node. Therefore, a 6µW input is extremely valuable to cancel the deep sleep energy consumption. Although energy harvesting is available, as we described, it is not high enough to sustain energy demanding sensors. Therefore, in order to conserve precious energy, we have created two passive-powered sensors to monitor the thickness of the steel layer and the absence of the tungsten layer.
A. Water Sensor element The vibration screen uses warm jets of water to separate
large lumps of ores from the tar sand, which also assists in forcing the sand to sift through the mesh. The water transforms the dry tar sand into a slurry mixture allowing it to be transported through the hydrotransport pipelines. This same water source is also used to trigger the water sensor element (WSE) once the tungsten layer is completely etched away. The WSE is composed of two parallel copper traces on an FR4-PCB and only occupies the top layer, as seen in Figure 4. This detection method works by drilling a small 1.0 mm diameter probe though the steel layer until it reaches the tungsten layer. When the tungsten layer is completely etched away, water leaks into the probed hole, and creates an electrical bridge between the two parallel copper traces. Since only one of the parallel copper traces is attached to a voltage source, no power is consumed until water abridges the two copper traces triggering the WSE. The WSE is associated with the orange color in the graphical user interface (GUI) to signify a potentially critical warning.
Figure 4 Water Sensor Element (WSE)
B. Break Sensor Element
The break sensor element (BSE) works as the inverse logic of that of the WSE. That is, a connection between the two copper traces is always present until the sand etches away, or breaks, the connection triggering the BSE. Only a 25ηA current is consumed, which is related to the MCU input-port leakage current, and also applies to the WSE. In Figure 5 below, only one break level is shown, however, multiple levels can be created at different distances to monitor multiple thickness-levels of the steel layer. The BSE occupies the second layer, or bottom layer, of the FR4-PCB. Therefore, only one drilled hole is needed for the BSE and the WSE.
Figure 5 Break Sensor Element (BSE)
V. LOW POWER ULTRASOUND THICKNESS MODULE
When a piezoelectric transducer (PZT) is electrically excited at its resonant frequency, it produces a sound wave. If the resonant frequency is above the human hearing limit, which is approximately 20KHz, it is considered an ultrasound wave. One of the many useful ways of using ultrasound technology is structural material examination, which is generally referred to as non-destructive testing (NDT) or examination (NDE). For example, ultrasound technology can be utilized to examine the structural integrity of metal objects for internal cracks. This is accomplished by introducing an ultrasound wave into the material and monitoring the reflected signal. Ultrasound NDT equipment are physically too large for WSNs, and prices range from an average of $1,000(US) for a small handheld thickness measurement device (e.g. TG110) up to $100K(US) for a graphical-based flaw detection device. This is obviously problematic to deploy in a low cost WSN, where cost and energy consumption are among the very important characteristic of the technology. However, we have designed a unique ultrasound thickness module (UTM) to monitor the thickness of the vibration screen ligaments while maintaining low cost and low power operation within a physically small package. The custom designed solution is made into a PnP module compatible with the Sprouts platform. The UTM system design is illustrated in Figure 6.
Figure 6 Ultrasound-based thickness monitoring for WSNs
POT
Tungsten Steel
BPF BPF LNA PA DET LPF CMP
MCU POT
MX PZT PT
Rx
90
For the UTM system design, we used a small PZT (SMD10T04F5000S111), which has a 5MHz +5% resonant frequency and 10mmx0.4mm disc size. The PZT was attached to the steel layer using silver epoxy (8331-14G), as seen in Figure 7. The two band pass filters (BPFs) are Sallen-Key (SK) active-filters used to filter the PZT resonant frequency from any leaked interfering frequencies, such as the constant flow of sand on the screen, the 13Hz mechanical vibration of the screen, and digital noise from the microcontroller (MCU). The BPFs are centered at 5MHz and offer a combined -6dB bandwidth of 1MHz. The low noise amplifier (LNA) has a low input voltage noise density of 4.2ηV/√Hz and a fixed gain of 20dB. The power amplifier (PA) has a digitally controlled gain from 15dB to 30dB using a digital potentiometer (POT) MCP4012. Note that the two active SK-BPFs, LNA, and the PA are designed using one chip, the LTC6248, which contains four operational amplifiers. Each amplifier consumes approximately 1mA, such that the total power consumption of the UTM is approximately 6mA at 3.0V, and is only active for less than 0.2ms. The schottky diode envelope detector (DET) rectifies the ultrasound signal, which is then smoothed by a passive low pass filter (LPF) with a -3dB corner frequency of 3MHz. A comparator (CMP), TS3021, is used to transform the analog signal into a digital signal representing the digital presence of the ultrasound echo signals, as seen in Figure 9. The CMP reference voltage is also controlled by a digital POT (MCP4012). The MCU is a low cost and ultra low power MSP430F5308, which controls both digital POTs and a low resistance multiplexer (MX) ADG704. The MX is responsible for switching between the generated pulse trigger (PT) from the MCU and the receiver (Rx) path.
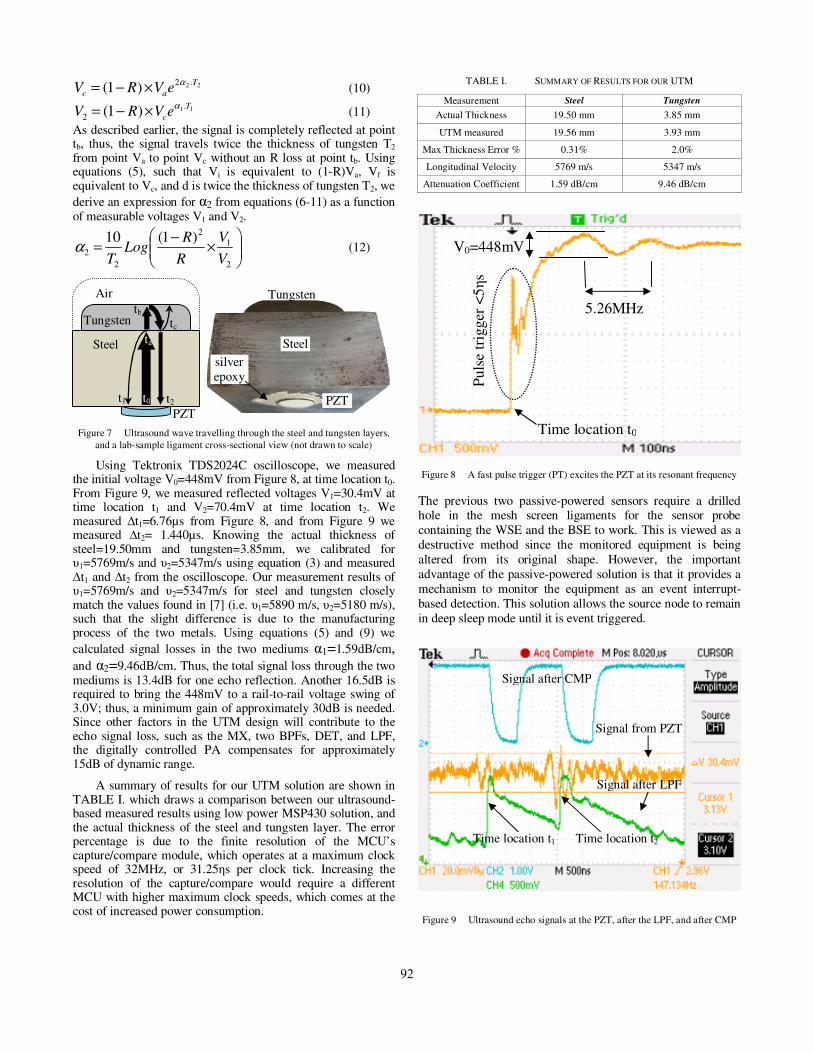
To measure the thickness of vibration screen ligaments, we use the MCU to apply a fast PT, which is achieved by toggling the logic of a digital port from low to a high. This fast transition in voltage, less than 5.0ηs rise time, creates a wideband frequency response. As a result, the PZT is excited at its resonant frequency, as seen in Figure 8. This resonant excitation produces an ultrasound wave of amplitude V0 that travels through the steel at time location t0. When the ultrasound wave reaches the end of the material boundary or a material of different density, such as the tungsten layer, at time location ta, a percentage of the ultrasound energy R is reflected back proportional to the difference in impedance mismatch, as shown in equation (1) [7]. This reflected energy travels from time location ta to arrive at time location t1 where it can be measured. The time difference of arrival (TDOA) ∆t1=t1-t0 is used to measure the steel thickness T1, as described in equation (3). We use the MCU’s timer TB0 in capture/compare mode to record the TDOA. Since the MCU runs at a 32MHz clock, the resolution of the captured TDOA is in multiples of 31.25ηs time intervals.
2
21
21
+
−=
ZZ
ZZR (1)
ρυ=Z (2)
υ2
tT
∆= (3)
The percentage of reflected ultrasound energy R is proportional to the difference between the two acoustic impedances Z1 and Z2, such that acoustic impedance, expressed in units of MRayls=106Kg/(s.m2), is a function of material density ρ and velocity of sound, υ, in the given material. Steel has an acoustic impedance Z1= 45.63MRayls, and tungsten has acoustic impedance Z2= 99.72MRayls, such that the percentage of reflected energy R at the interface, time location ta, is 0.1385 or 13.85%. The remaining 86.15% of the energy travels through the tungsten layer where it is completely reflected back, at time location tb, due to the very large difference in acoustic impedance between air (0.0004 MRayls) and tungsten. At time location tc, the same percentage of energy=13.85% is reflected back into the tungsten, and the remaining energy makes its way back to the transducer where it is measured as V2 at t2. All time locations are depicted in Figure 7, such that t0, t1, and t2 are measurable and occur at the interface between the PZT and steel, ta and tc occur at the interface between steel and tungsten, and tb occurs at the interface between tungsten and air. The TDOA ∆t2=t2-t1 is used in equation (3) to measure the thickness of the tungsten layer T2. Note that the signal at t2 will be reflected again into the steel, such that the whole cycle is repeated until the signals are attenuated, as described in equation (4).
deVV .
0
α= (4)
)(20
f
i
V
VLog
d=α (5)
where V is the exponential decrease in voltage amplitude of the sound signal at distance d, such that V0 is the initial voltage amplitude produced by the PZT. The attenuation coefficient α varies depending on the material composition and manufacturer process technology, expressed in dB/cm at a given resonant frequency. Thus, α is experimentally calculated for a given material by taking an initial voltage sample Vi and a final voltage sample Vf separated by distance d. Since voltage signals can only be measured at the transducer interface, we express the voltage magnitude Va at ta, right before entering the tungsten medium, from equation (4) as follows:
11 .
0
T
aeVV
α= (6)
11 .
1
T
aeVRV
α×= (7)
Dividing equation (6) by equation (7), we obtain equation (8), an expression for Va that is independent of T1 and α1.
R
VVVa
10= (8)
Using equation (5), such that Vi is equivalent to V0, Vf is equivalent to Va, and d is T1, we derive the steel’s attenuation
coefficient α1 using equation (8) as a function of measurable voltages V0 and V1.
=
1
0
1
1
20
V
RVLog
Tα (9)
In order to find the attenuation coefficient of tungsten α2, we represent Vc as the signal amplitude at point tc right before entering the steel medium, such that:
91
22 .2)1( T
aceVRV
α×−= (10)
11 .
2 )1( T
ceVRV
α×−= (11)
As described earlier, the signal is completely reflected at point tb, thus, the signal travels twice the thickness of tungsten T2 from point Va to point Vc without an R loss at point tb. Using equations (5), such that Vi is equivalent to (1-R)Va, Vf is equivalent to Vc, and d is twice the thickness of tungsten T2, we
derive an expression for α2 from equations (6-11) as a function of measurable voltages V1 and V2.
×
−=
2
1
2
2
2
)1(10
V
V
R
RLog
Tα (12)
Figure 7 Ultrasound wave travelling through the steel and tungsten layers,
and a lab-sample ligament cross-sectional view (not drawn to scale)
Using Tektronix TDS2024C oscilloscope, we measured the initial voltage V0=448mV from Figure 8, at time location t0. From Figure 9, we measured reflected voltages V1=30.4mV at time location t1 and V2=70.4mV at time location t2. We measured ∆t1=6.76µs from Figure 8, and from Figure 9 we measured ∆t2= 1.440µs. Knowing the actual thickness of steel=19.50mm and tungsten=3.85mm, we calibrated for υ1=5769m/s and υ2=5347m/s using equation (3) and measured ∆t1 and ∆t2 from the oscilloscope. Our measurement results of υ1=5769m/s and υ2=5347m/s for steel and tungsten closely match the values found in [7] (i.e. υ1=5890 m/s, υ2=5180 m/s), such that the slight difference is due to the manufacturing process of the two metals. Using equations (5) and (9) we
calculated signal losses in the two mediums α1=1.59dB/cm, and α2=9.46dB/cm. Thus, the total signal loss through the two mediums is 13.4dB for one echo reflection. Another 16.5dB is required to bring the 448mV to a rail-to-rail voltage swing of 3.0V; thus, a minimum gain of approximately 30dB is needed. Since other factors in the UTM design will contribute to the echo signal loss, such as the MX, two BPFs, DET, and LPF, the digitally controlled PA compensates for approximately 15dB of dynamic range.
A summary of results for our UTM solution are shown in TABLE I. which draws a comparison between our ultrasound-based measured results using low power MSP430 solution, and the actual thickness of the steel and tungsten layer. The error percentage is due to the finite resolution of the MCU’s capture/compare module, which operates at a maximum clock speed of 32MHz, or 31.25ηs per clock tick. Increasing the resolution of the capture/compare would require a different MCU with higher maximum clock speeds, which comes at the cost of increased power consumption.
TABLE I. SUMMARY OF RESULTS FOR OUR UTM
Measurement Steel Tungsten
Actual Thickness 19.50 mm 3.85 mm
UTM measured 19.56 mm 3.93 mm
Max Thickness Error % 0.31% 2.0%
Longitudinal Velocity 5769 m/s 5347 m/s
Attenuation Coefficient 1.59 dB/cm 9.46 dB/cm
Figure 8 A fast pulse trigger (PT) excites the PZT at its resonant frequency
The previous two passive-powered sensors require a drilled hole in the mesh screen ligaments for the sensor probe containing the WSE and the BSE to work. This is viewed as a destructive method since the monitored equipment is being altered from its original shape. However, the important advantage of the passive-powered solution is that it provides a mechanism to monitor the equipment as an event interrupt-based detection. This solution allows the source node to remain in deep sleep mode until it is event triggered.
Figure 9 Ultrasound echo signals at the PZT, after the LPF, and after CMP
Puls
e tr
igger
<5ηs
5.26MHz
V0=448mV
Signal after LPF
Signal from PZT
Signal after CMP
Time location t1
Time location t0
Time location t2
t0 t2 t1
ta
tb tc Tungsten
Steel
Air
Steel
Tungsten
PZT PZT
silver epoxy
92
VI. SPROUTS PLUG AND PLAY PROTOCOL
In order to make Sprouts a general purpose WSN
platform, we have designed four PnP module ports for general
and custom designed modules. Modules may have one or more
sensor element (SE) ports representing different sensor types,
as seen in Figure 10. Each PnP port has a standard 8-pin
configuration in order for Sprouts to serially communicate
with one of the four modules, as follows:
1-2) GND, VDD: signal power to common ground and 3.0V
3-5)MOSI, MISO, CLK: Standard SPI bus common to all ports
6) *PSx: Port Select pin to communicate via SPI
7) *ENx: external Enable signal to wakeup module from sleep
8) *RDx: Module is ready to send or receive data
* ‘x’ denotes the port number from 1 to 4
Figure 10 Four PnP modules with each having one or more sensor element
(SE) ports allowing easy customization per application
When a module is plugged into one of the four ports, the
module receives power via GND and VDD, and initiates a
registration event with Sprouts by activating the RDx pin
followed by a registration request via SPI. Sprouts wakes up,
configures the SPI protocol, sets ENx High causing RDx to go
Low, sets PSx High, and requests the module’s unique ID via
SPI when the RDx pin is set High again. The module replies
back with its unique 32-bit ID, such that every reply is
accompanied with the request command that triggered the
response. Sprouts then sends a request to the sink node
requesting the module’s configuration parameters. These
configuration parameters are set by the module’s designer and
are unique to each module. The configuration parameters
allow for further customization per application needs. For
example, for the UTM, we have configuration parameters
related to material type, calibration values, gain, acquisition
time, average number of samples, reporting intervals, duty
cycles, etc. When the configuration setup is complete, the
module relays the number of sensor ports available to Sprouts
with the corresponding duty cycle of each. At this point, it is
the responsibility of Sprouts to request a sensor reading update
from the specified port of the module at the appropriate
interval. Senor ports represent the various sensor elements that
may be present in a single module. For example, a module
may include a temperature sensor at port 1, light sensor at port
2, humidity at port 3, and a barometer at port 4. Sprouts
communicates with all active module ports and sensor ports,
formats the data in a standard packet structure, and sends one
report packet to the sink node in order to save power
consumed by the transceiver. In the case of a critical event
detection by a module, interrupts from identified modules are
permitted. These interrupts are served in high priority and
reported to the sink immediately. When a module is detached
from Sprouts, it times out after three unresponsive requests, or
when a new module is attached triggering a registration event.
Our ultrasound thickness module has three sensor ports, the
first port is the ultrasound thickness solution, the second port
is the BSE, and the third is the WSE. Packaging more sensors
into a single module is application dependent and may be
desirable in order to save module ports. Modules may be
recycled from one application to another, allowing for a
greater degree of customization per application.
VII. CONCLUSION
We have successfully utilized Sprouts WSN platform to
monitor the reliability of large vibration screens used in the oil
production process at the Oil Sands. We developed an
ultrasound-based monitoring solution to detect the thickness of
steel and tungsten in a compound structure. The ultrasound
solution was made into a module that was easily attachable to
Sprouts through one of its four PnP ports. The ultrasound
module also included two other sensors, WSE and BSE, which
monitored for the absence of the tungsten layer, and discrete
thickness levels of steel. The same module can be used in a
wide range of different applications involving nondestructive
testing applications. By utilizing our PnP protocol, users can
easily customize other PnP modules to monitor the reliability
or health conditions of industrial equipment. We hope to
promote Sprouts platform to universities working on WSN
research for the IoTs or in industrial environments.
ACKNOWLEDGMENT
We would like to acknowledge the Natural Sciences and Engineering Research Council of Canada (NSERC) for funding this project. We also acknowledge our colleagues: Louai Al-Awami, Abdulmonem Rashwan, Abdallah Almaaitah, and Kashif Ali for their technical support.
REFERENCES
[1] A. El Kouche, “Towards a Wireless Sensor Network Platform for the
Internet of Things,” IEEE ICC 2012, Ottawa, Canada, accepted
[2] U.S. Department of Energy, Office of Energy Efficiency and Renewable
Energy, “Industrial Wireless Technology for the 21st Century,”Dec 2002
[3] Yadong Wan, Lei Li, Jie He, Xiaotong Zhang, and Qin Wang, "Anshan:
wireless sensor networks for equipment fault diagnosis in process
industry," SECON 2008
[4] I. Stoianov, L. Nachman, S. Madden, and T.Tokmouline. “PIPENET: a
wireless sensor network for pipeline monitoring,” In IPSN'07
[5] A. El Kouche, L. Al-Awami, H. Hassanein, K. Obaia, “WSN application
in the harsh industrial environment of the oil sands,” IWCMC, July 2011
[6] A. El Kouche, L Al-Awami, H. Hassanein,“Dynamically Reconfigurable
Energy Aware Modular Software (DREAMS) Architecture for WSNs in
Industrial Environments,” Ambient Sys.Net.and Tech. (ANT), Aug 2011
[7] P.O. Moore, G.L. Workman, D. Kishoni, “Nondestructive Testing